Embed Size (px)
Citation preview
1 eere.energy.gov
Home Energy Score
Joan GlickmanU.S. Department of Energy
Senior Advisor
JOBS
2 eere.energy.gov
• Tens of millions of homes could benefit from cost effective energy improvements but…
– Home energy is a minor cost for middle and upper income households (3-5% of household income)
– Energy improvements lack cache and are largely invisible (exception: windows)
– Home improvements are generally perceived as a hassle
Convincing Homeowners to Invest in Energy Efficiency Isn’t Always Easy
3 eere.energy.gov
So, what can we do to encourage investments in energy efficiency?
• Make it easy• Make it reliable (workforce standards)• Encourage energy improvements as part of home
maintenance– Home maintenance needs to be as easy as car maintenance
• Seize the moment by integrating improvements with other work (e.g., home renovations; appliance purchases)
• Emphasize other benefits: comfort, improved value– Highlight these improvements at time of sale
• Advertise your investment– Similar to home renovations, improvements can “spread” if
visible to neighbors
4 eere.energy.gov
• ~20 million home renovations per year from 1994-2007; spending averaged
• ~$160 billion /year– As much as 26% of owner-occupied households renovated or replaced home
components each year during this period– 38% spent on do-it-yourself (DIY) projects– 62% spent on do-it-for-me (DIFM) projects (i.e., contractors)
• Home renovation spending is dominated by large projects in more expensive homes
– 1% of households accounted for 42% of all remodeling expenditures– ~70% to 75% of renovations implemented in homes worth more than $200,000
• Homeowners spent an average of ~$23 to 36 billion per year on potential energy-related renovations during 1994-2007 (depending on definition)
– Represents at least 14% of overall annual home renovation spending ($160 billion)
Source: LBNL Analysis; Harvard Joint Center for Housing Studies, Remodeling in Transition; U.S. Census Bureau, 2009 American Housing Survey
Existing Home Improvement / Renovation Market
5 eere.energy.gov
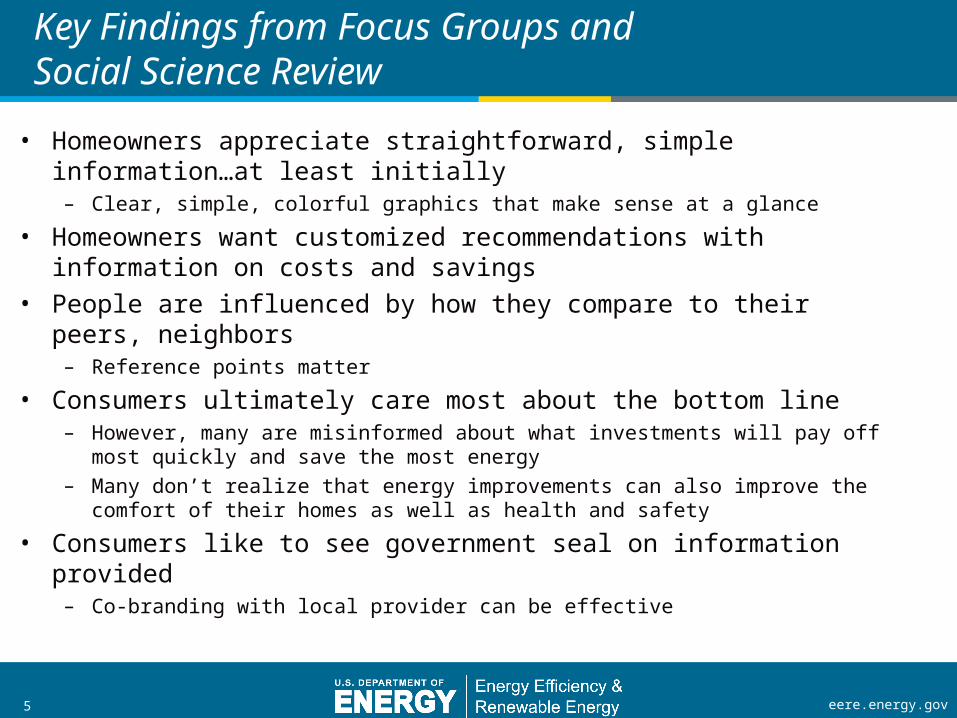
Key Findings from Focus Groups and Social Science Review
• Homeowners appreciate straightforward, simple information…at least initially
– Clear, simple, colorful graphics that make sense at a glance
• Homeowners want customized recommendations with information on costs and savings
• People are influenced by how they compare to their peers, neighbors
– Reference points matter
• Consumers ultimately care most about the bottom line– However, many are misinformed about what investments will pay off most
quickly and save the most energy– Many don’t realize that energy improvements can also improve the comfort
of their homes as well as health and safety
• Consumers like to see government seal on information provided– Co-branding with local provider can be effective
6 eere.energy.gov
Objectives of Recovery thru Retrofit
• Strengthen the home energy retrofit market • Provide an affordable and credible means for --
– Homeowners to understand their home’s energy performance, how their home compares to others in their area, and how to take action to improve its efficiency
• Build on and complement existing home energy improvement efforts
• Facilitate the ability of trained workers to enter the private sector retrofit market as Weatherization work funded by the Recovery Act ramps down
7 eere.energy.gov7
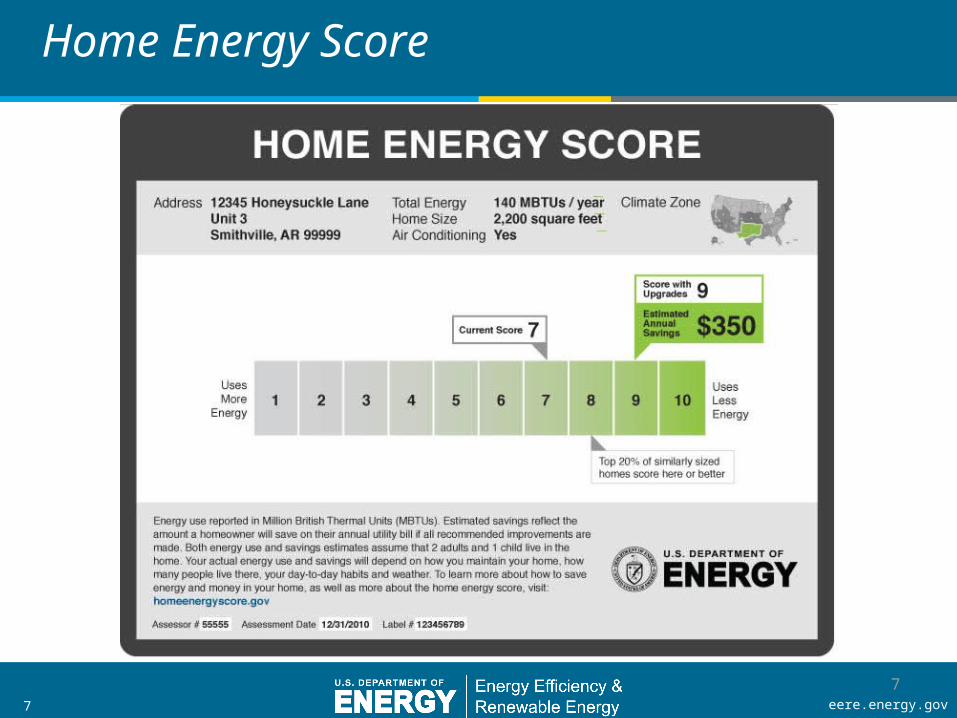
Home Energy Score
8 eere.energy.gov
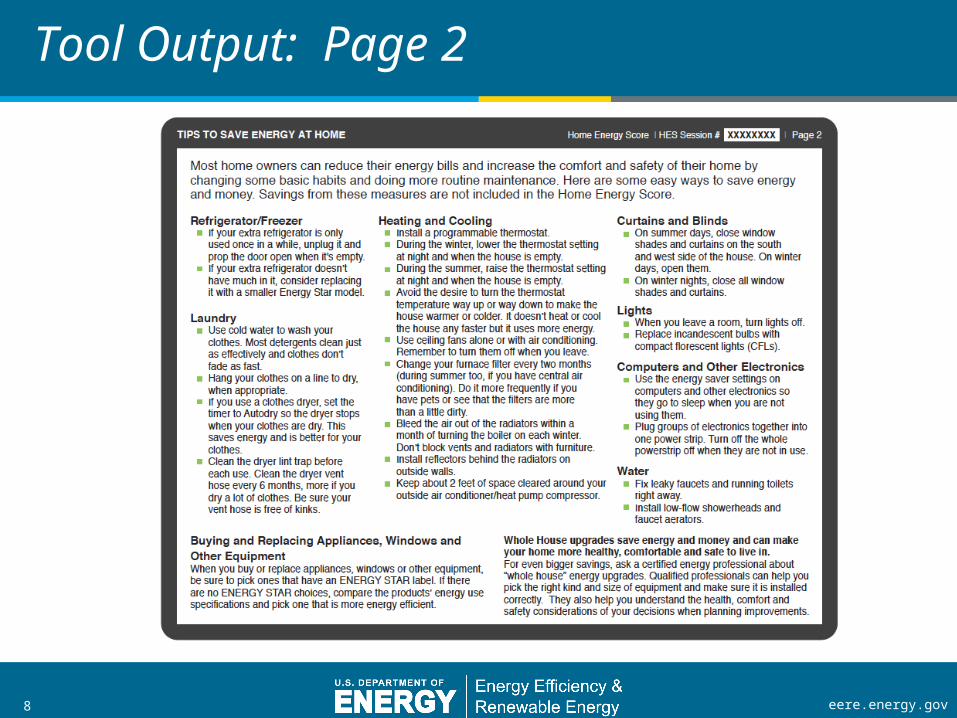
Tool Output: Page 2
9 eere.energy.gov
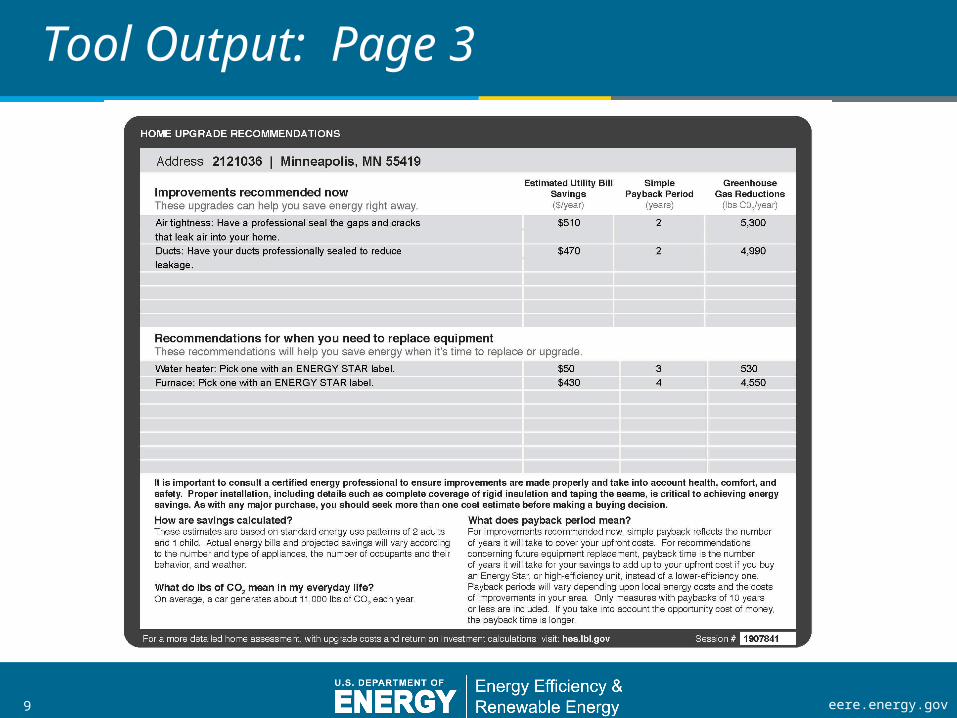
Tool Output: Page 3
10 eere.energy.gov
EERE Development Status Meeting on the Home Energy Scoring Tool
November 3, 2010
Richard Brown, LBNLNorman Bourassa, LBNL
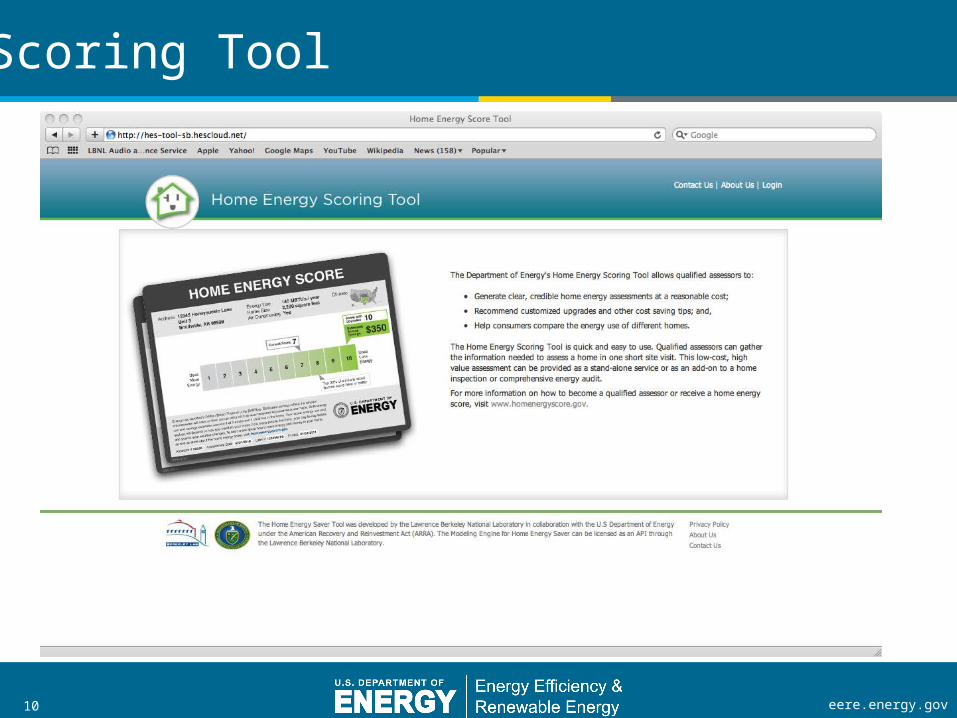
Scoring Tool
11 eere.energy.gov
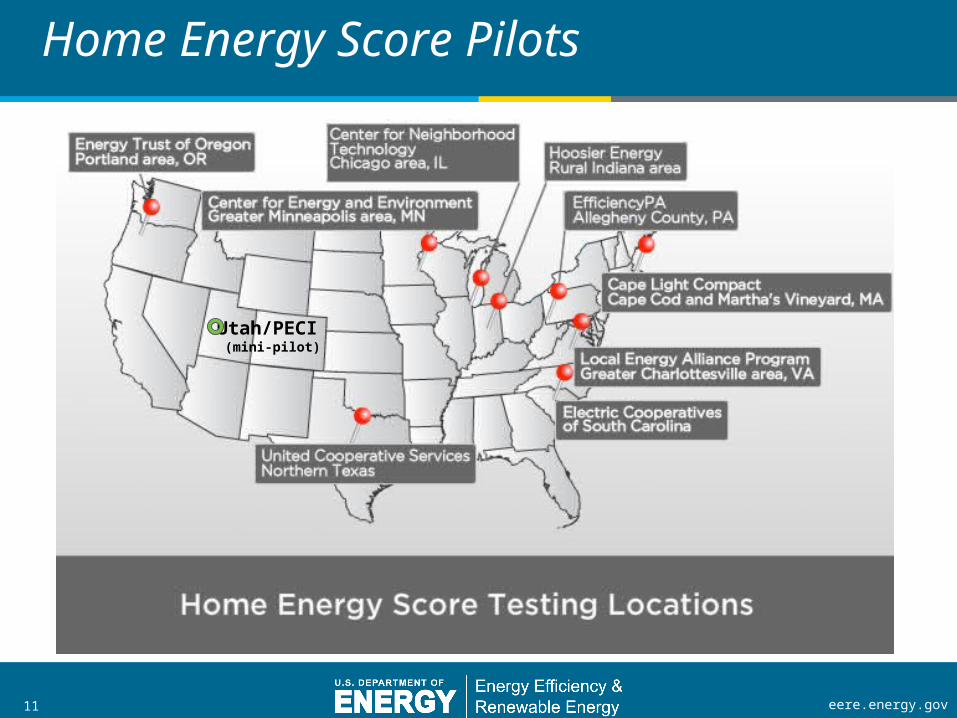
Home Energy Score Pilots
Utah/PECI (mini-pilot)
12 eere.energy.gov
Pilot Overview
• Nine pilots completed program Utah completed assessments using previously collected
data
• 1,000+ homes assessed in total• 31 assessors produced more than 1 score
24 responded to assessor questionnaires
• In most cases, the scores reflected relatively “normal” distributions Need to reconsider bin values in some climates
• DOE/LBNL ran home assessment data through multiple scoring methods for comparison purposes
13 eere.energy.gov
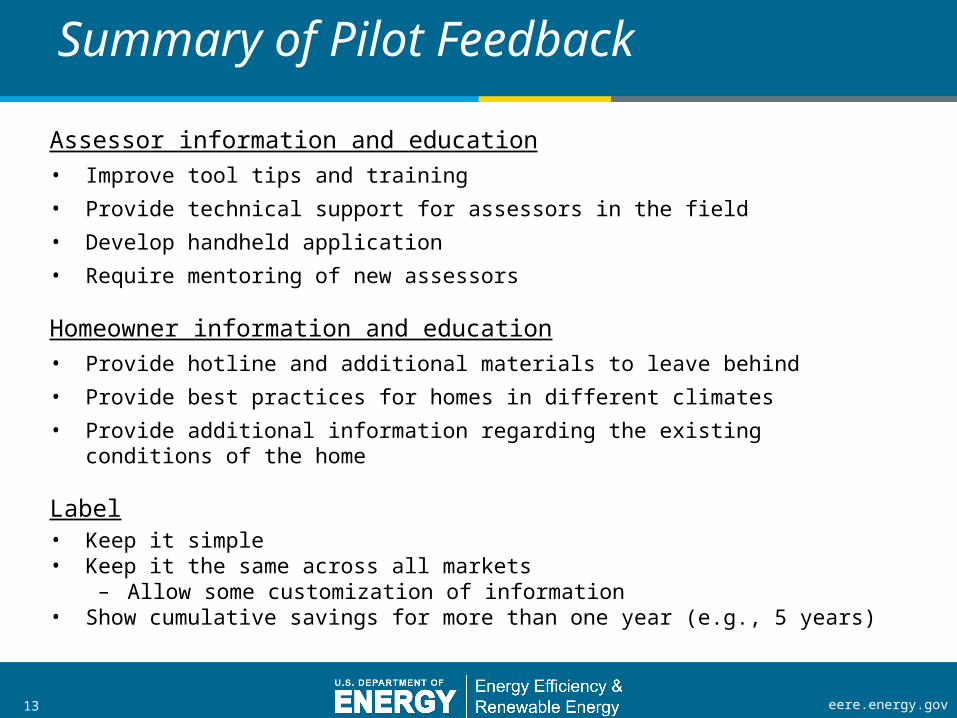
Summary of Pilot Feedback
Assessor information and education• Improve tool tips and training
• Provide technical support for assessors in the field
• Develop handheld application
• Require mentoring of new assessors
Homeowner information and education• Provide hotline and additional materials to leave behind
• Provide best practices for homes in different climates
• Provide additional information regarding the existing conditions of the home
Label• Keep it simple• Keep it the same across all markets
– Allow some customization of information • Show cumulative savings for more than one year (e.g., 5 years)
14 eere.energy.gov
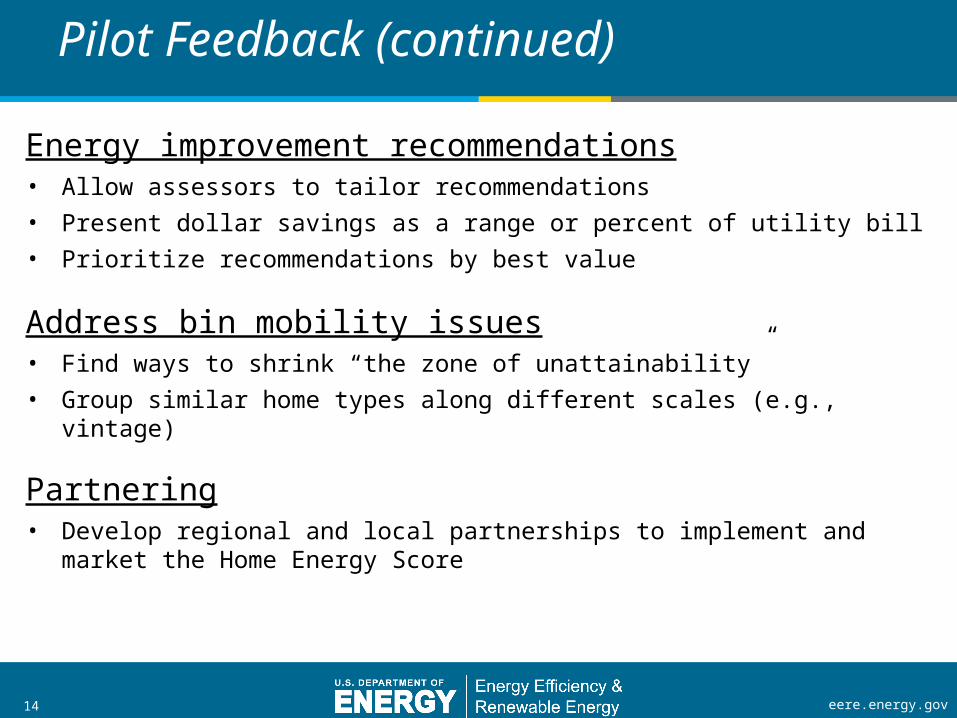
Pilot Feedback (continued)
Energy improvement recommendations• Allow assessors to tailor recommendations
• Present dollar savings as a range or percent of utility bill
• Prioritize recommendations by best value
Address bin mobility issues• Find ways to shrink “the zone of unattainability”
• Group similar home types along different scales (e.g., vintage)
Partnering• Develop regional and local partnerships to implement and market the
Home Energy Score
15 eere.energy.gov
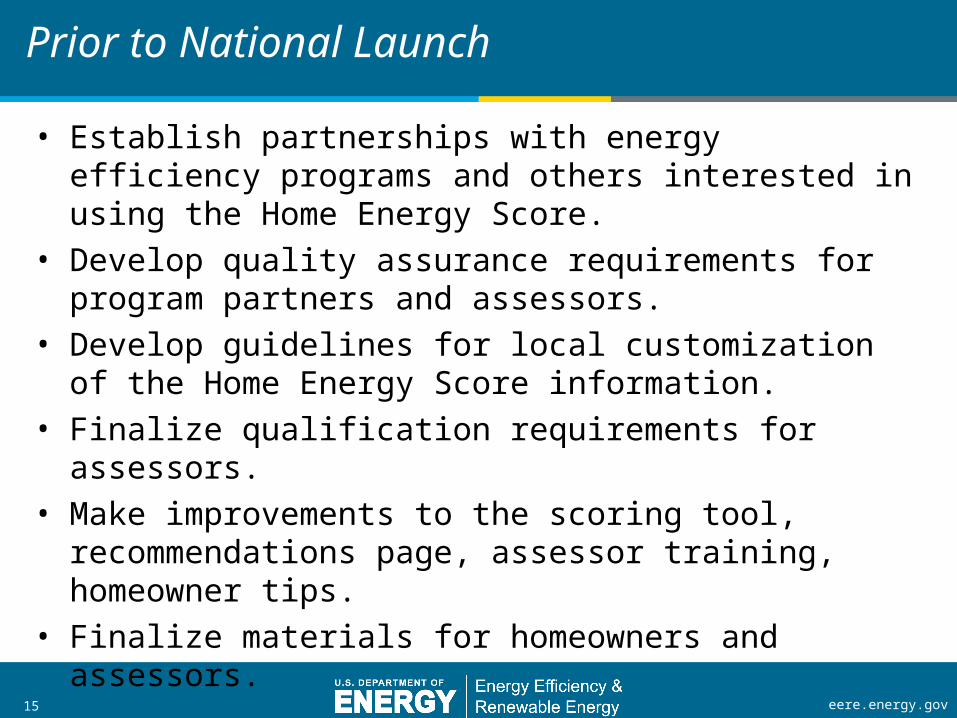
Prior to National Launch
• Establish partnerships with energy efficiency programs and others interested in using the Home Energy Score.
• Develop quality assurance requirements for program partners and assessors.
• Develop guidelines for local customization of the Home Energy Score information.
• Finalize qualification requirements for assessors.• Make improvements to the scoring tool,
recommendations page, assessor training, homeowner tips.
• Finalize materials for homeowners and assessors.
16 eere.energy.gov
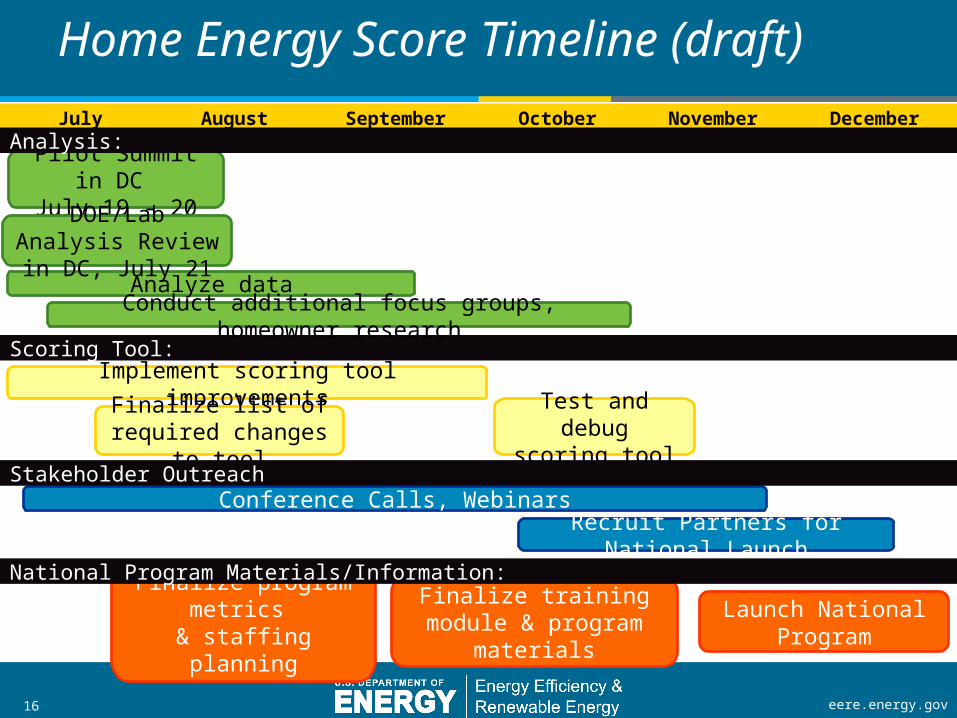
Analyze data
Home Energy Score Timeline (draft)
Launch National Program
Conference Calls, Webinars
July August September October NovemberDecember
Pilot Summit in DC
July 19 - 20
Implement scoring tool improvementsTest and
debug scoring tool
Recruit Partners for National Launch
Finalize list of required changes
to tool
Finalize program metrics
& staffing planning
Finalize training module & program
materials
Analysis:
Scoring Tool:
National Program Materials/Information:
Stakeholder Outreach
Conduct additional focus groups, homeowner research
DOE/Lab Analysis Review in DC,
July 21
17 eere.energy.gov
Home Energy Score Contact Information
• Visit homeenergyscore.gov for more information.
• If you have additional questions or comments, please contact us at [email protected].– Please type “Partner interest” in the
subject line if applicable.

EXTRA
19 eere.energy.gov
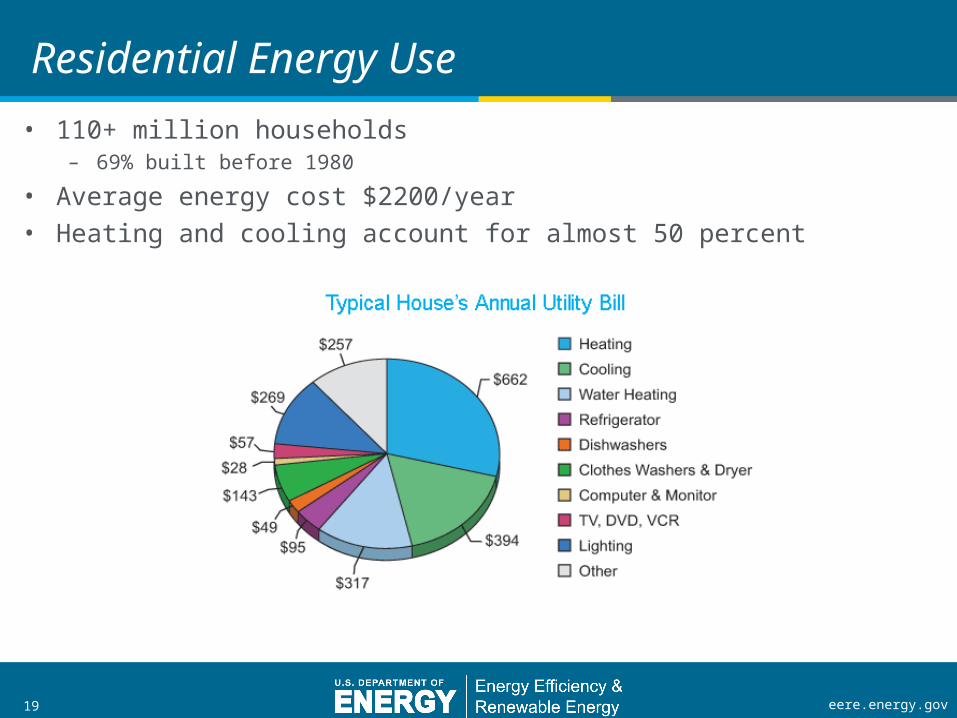
Residential Energy Use
• 110+ million households– 69% built before 1980
• Average energy cost $2200/year• Heating and cooling account for almost 50 percent
20 eere.energy.gov
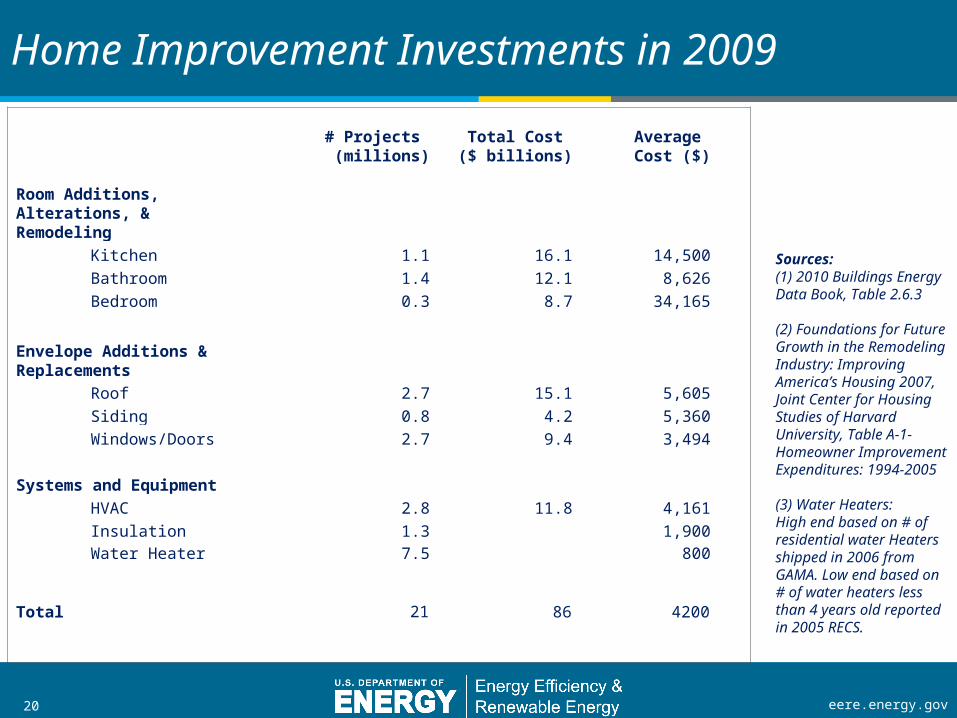
# Projects
(millions) Total Cost ($ billions)
Average Cost ($)
Room Additions, Alterations, & Remodeling
Kitchen 1.1 16.1 14,500
Bathroom 1.4 12.1 8,626
Bedroom 0.3 8.7 34,165
Envelope Additions & Replacements
Roof 2.7 15.1 5,605
Siding 0.8 4.2 5,360
Windows/Doors 2.7 9.4 3,494
Systems and Equipment
HVAC 2.8 11.8 4,161
Insulation 1.3 1,900
Water Heater 7.5 800
Total 21 86 4200
Home Improvement Investments in 2009
Sources: (1) 2010 Buildings Energy Data Book, Table 2.6.3
(2) Foundations for Future Growth in the Remodeling Industry: Improving America’s Housing 2007, Joint Center for Housing Studies of Harvard University, Table A-1- Homeowner Improvement Expenditures: 1994-2005
(3) Water Heaters:High end based on # of residential water Heaters shipped in 2006 from GAMA. Low end based on # of water heaters less than 4 years old reported in 2005 RECS.