Embed Size (px)
Citation preview
CBN Journal of Applied Statistics Vol. 5 No.1 (June, 2014) 145
1Destination Sectors and Originating Economies of Nigeria’s
Private Foreign Assets and Liabilities in 2012
2Sani I. Doguwa, Mohammed M. Tumala and Olufemi I. Ajibola
The 2013 survey of foreign assets and liabilities of enterprises in Nigeria was
conducted to determine destination sectors of foreign private capital flows and
economies where such investments originate. The survey covered 649 large
establishments in Nigeria with 87.4 per cent response rate. The cross border
transactions/investments of the respondents during 2011 and 2012 indicate total
foreign claims on the Nigerian economy as at end 2012 rising to N16, 790.78
billion from N13, 647.19 billion recorded in 2011. Of this total, 98.1per cent came in
the form of direct investments, while portfolio investments and other capital flows
accounted for 1.1 and 0.8 per cent, respectively. About 39 per cent of the total inflow
originated from Europe, while 16.7 per cent and 16.3 per cent originated from the
Middle East and North America, respectively. A breakdown in terms of destination
sectors revealed that extractive industries sector attracted 40.5 per cent and is
followed by manufacturing, which received 27.7 per cent. Total stock of outward
investment as at end 2012 was N235.94 billion as against N208.44 billion recorded
in 2011. In 2012, outward direct investment dominated with 76.5 per cent of the total,
while European countries were the preferred investment destination for Nigerian
enterprises receiving 57.4 per cent of the total outflow, followed by Africa (27.2 per
cent).
1.0 Background
The increasing wave of globalization, enabled by improved information
technology has led to rapid and substantial movement of capital across
economies. Such cross border capital flows are, amongst other factors,
motivated by investors’ desire to optimize their investments by seeking
destinations that offer higher returns at manageable levels of risk. According
to UNCTAD World Investment Report (2013), global foreign direct
investment (FDI) stood at $1.35 trillion in 2012, falling from its 2011 level by
about 18 per cent. This development was attributable to economic fragility
and policy uncertainty in a number of major economies, which gave rise to
caution among investors. Similarly, FDI flows to developing economies
declined slightly by 4 per cent to $703 billion in 2012 but accounted for 52
per cent of global FDI inflows, exceeding flows to developed economies for
the first time ever, by $142 billion.
1 This report was compiled by the Statistics Department of the Central Bank of Nigeria. The
contributions of all staff members and stakeholders are greatly acknowledged.
2The authors are of the Statistics Department of the Central Bank of Nigeria. All
correspondence should be directed to [email protected]
146 Destination Sectors and Originating Economies of Nigeria’s
Private Foreign Assets and Liabilities in 2012 Doguwa et al.
In 2012, growth in the global economy was sluggish as world output growth
rate declined to 3.9 per cent from 5.3 per cent in 2010 (IMF, 2013). This was
in the face of worsening Euro area debt crisis, the low growth of the US
economy, and political crisis in the Middle East and North Africa. The
international financial market was fragile due to the Euro area crisis. In Sub-
Saharan Africa, growth slowed to 5.2 per cent compared with 5.3 per cent in
the previous year.
In Nigeria, the real Gross Domestic Product (GDP), measured in 2010 basic
prices, grew by 6.7 per cent in 2012, compared with 5.09 per cent in 2011
(Kale, 2014). The non-oil sector which grew by 8.26 per cent in 2012
remained the driver of the economy and the major contributors to the growth
were trade (3.33 percentage points), services (2.46 percentage points),
industry (1.14 percentage points), manufacturing (1.13 percentage points),
agriculture (0.77 percentage points) and construction (0.56 percentage points).
The improvements recorded are largely attributable to the conducive
macroeconomic environment which included favourable credit conditions that
enhanced the financing of the private sector, sustained investment in power
and other infrastructure and enabling fiscal incentives.
Inflation rate rose to 12.0 per cent in December 2012 from 10.3 per cent in the
preceding year despite series of monetary policy tightening and
complementary measures undertaken during the year to rein in inflation. On
the external side, the country recorded an improved performance as the overall
balance stood at a surplus of N1,747.9 billion (or 2.5% of GDP) in 2012, as
against N47.1 billion (or 0.07 per cent of GDP) in 2011. The stock of external
reserves as at end-2012 was US$43.8 billion, which could finance 10.7
months of imports.
The developments that unfolded in the domestic and global economies have
been responsible for the movement in capital flows into and out of the
country. Since cross border capital flows constitute sources of economic
vulnerabilities, countries devote substantial efforts at collecting and analyzing
data on their foreign assets and liabilities to ascertain the extent vulnerabilities
to the rest of the world.
In order to collect reliable statistics on the stock and flows of inward and
outward investments in Nigeria, the Survey of Foreign Assets and Liabilities
(SOFAL) of enterprises is conducted annually. Capital flows collected are
CBN Journal of Applied Statistics Vol. 5 No.1 (June, 2014) 147
categorized into; Foreign Direct Investment (FDI), Foreign Portfolio
Investment (FPI) and Other Capital Flows (OCF). Amongst other uses, the
data collected from the survey are used for the compilation of the country’s
Balance of Payments (flows) and International Investment Position (stock)
statistics.
The 2013 SOFAL, which was conducted during July/August 2013 solicited
enterprises’ data on their cross border capital flows and stock during the
periods 2011 and 2012. The specific objectives of the survey are to measure
the size of FDI, FPI and OCF for Nigeria; quantify foreign investments
attributed to government investment promotion policies (such as the free trade
zone policy); identify the destination sectors of foreign investments in
Nigeria; and identify the originating economies of foreign liabilities in Nigeria
as well as the destination economies of the country’s foreign assets.
The results of the survey outcomes are presented in this report which for ease
of exposition is structured into four sections. Following this section, which
provides some background information, section two discusses the
institutional, methodological and analytical arrangements for the 2013 survey.
Section three presents results of the survey while section four concludes the
report.
2.0 Survey Methodology and Management
The 2013 SOFAL was conducted by the Central Bank of Nigeria (CBN) and it
encompassed the Coordinated Direct Investment Survey (CDIS), which was
inaugurated in 2009, as well as two other components of capital: portfolio
investment (stock and flows) and other foreign private capital flows. The
survey consolidated on the gains of the 2012 SOFAL, which covered 320
establishments.
Like in the previous years, the overall objective of the SOFAL remained to,
measure the size of private foreign assets and liabilities in Nigeria during the
periods 2011 and 2012. The sum of investments made by Nigerian resident
enterprises in direct investment abroad is regarded as the country’s “foreign
private assets”, while “foreign private liabilities” refer to the total investments
made by non-resident enterprises in the Nigerian economy. The 2013 SOFAL
collected data on three components of capital flows - FDI, FPI and OCF,
through the administration of structured questionnaire to enterprises with
foreign assets and liabilities.
148 Destination Sectors and Originating Economies of Nigeria’s
Private Foreign Assets and Liabilities in 2012 Doguwa et al.
2.1 Scope and Coverage
The register of enterprises used for the survey was revised with information
from various sources including; Corporate Affairs Commission (CAC),
Nigeria Investment Promotion Commission (NIPC), Nigeria Export
Promotion Zone Authority (NEPZA), Oil and Gas Free Zone Authority
(OGFZA), Federal Inland Revenue Service (IFRS) and Manufacturers
Association of Nigeria (MAN). These enterprises cut across manufacturing;
agriculture, hunting, forestry and fishing; construction; transport, storage and
communication; financing, real estate, insurance and business services;
wholesale and retail trade, catering and accommodation; and extractive (oil
and gas) sectors. However, manufacturing and extractive industries sectors
received particular attention. Overall, 649 enterprises were surveyed while
returns were received and processed for 567, implying a response rate of 87.4
per cent.
Preceding the 2013 survey, some members of the survey team visited the
Bank of Ghana on experience sharing, and received an International Monetary
Fund technical assistance mission on the compilation of the financial account
of the Balance of Payments (BOP) and International Investment Position (IIP)
statistics. Outcomes of these discussions resulted in the redesigned SOFAL
questionnaire and production of the handbook of terminologies to guide
respondents and make for easier completion of the questionnaire. The
redesigned questionnaire was structured into five parts to capture data on
enterprises’ foreign assets and liabilities. The first and the last parts relate to
enterprise’s characteristics and respondent’s feedback, respectively. Parts two
to four seek data on equity inward investments, non-equity inward
investments, equity outward investments and non-equity outward investments,
respectively.
The survey period was divided into three parts namely: lodgment during
which enumerators were expected to lodge the survey instruments with
responding enterprises; completion period during which the respondents were
expected to complete the forms and; and retrieval period in which the
enumerators returned to the enterprises to retrieve the completed forms.
Enterprises were also asked to submit their financial statements from which
necessary data were extracted to augment the completed questionnaire.
CBN Journal of Applied Statistics Vol. 5 No.1 (June, 2014) 149
2.2 Stakeholder Sensitization and Mobilization
In order to enlighten the respondents on the importance and gains of the
SOFAL as well as enhance their understanding of the survey instrument, a
stakeholders’ forum was held during the year. The forum also created a
platform for a feedback system which has been useful in the improvement of
the SOFAL questionnaire as well as the survey methodology. On the SOFAL
project are other relevant agencies such as NIPC, NEPZA, Federal Ministry of
Trade and Investment, MAN, National Association of Chambers of
Commerce, Industries and Agriculture, and OGFZA. These agencies played
different roles in galvanizing support for the SOFAL.
2.3 Field Staff Training
The 2013 SOFAL fieldwork was conducted with active collaboration of
NEPZA and OGFZA. In this regard, the Statistics Department of the CBN
held training sessions for field enumerators of each of the collaborating
agencies with a view to enhancing their understanding of the survey
instrument. The training sessions were held at Lagos (for MAN), Calabar (for
NEPZA) and Port Harcourt (for OGFZA). The enumerators were tutored on
survey etiquettes, objectives of SOFAL and ways of conducting consistency
checks on completed questionnaire.
3.0 Results and Discussions
The results presented in this section are based on returns retrieved from 567
respondent enterprises during the 2013 survey. These enterprises cut across
the different sectors of the economy and the respondents were required to
supply their assets/liabilities data (which could be in form of equity, debt or
other capital flows) for both 2011 and 2012.
3.1 Private Foreign Liabilities
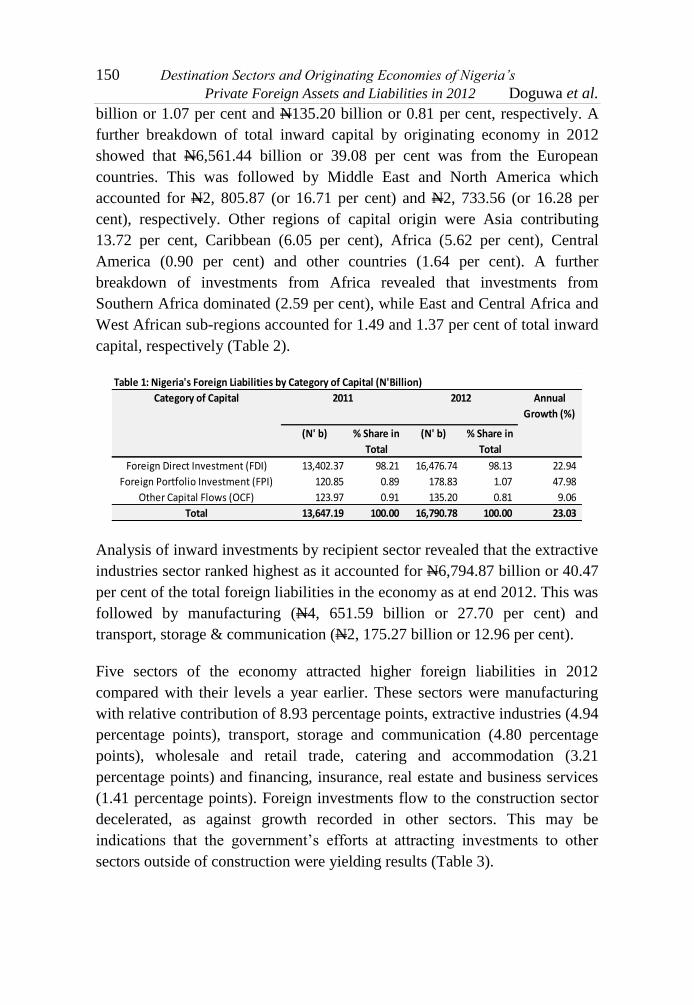
Survey returns revealed that total inward capital flow to Nigeria from the rest
of the world amounted to N16,790.78 billion as at end 2012, representing an
increase of 23.03 per cent above the level of N13,647.19 billion recorded in
2011 (Table 1).
A breakdown of the 2012 figure by category of capital showed that
N16,476.74 billion or 98.13 per cent came in the form of direct investments,
while portfolio investments and other capital flows accounted for N178.83
150 Destination Sectors and Originating Economies of Nigeria’s
Private Foreign Assets and Liabilities in 2012 Doguwa et al.
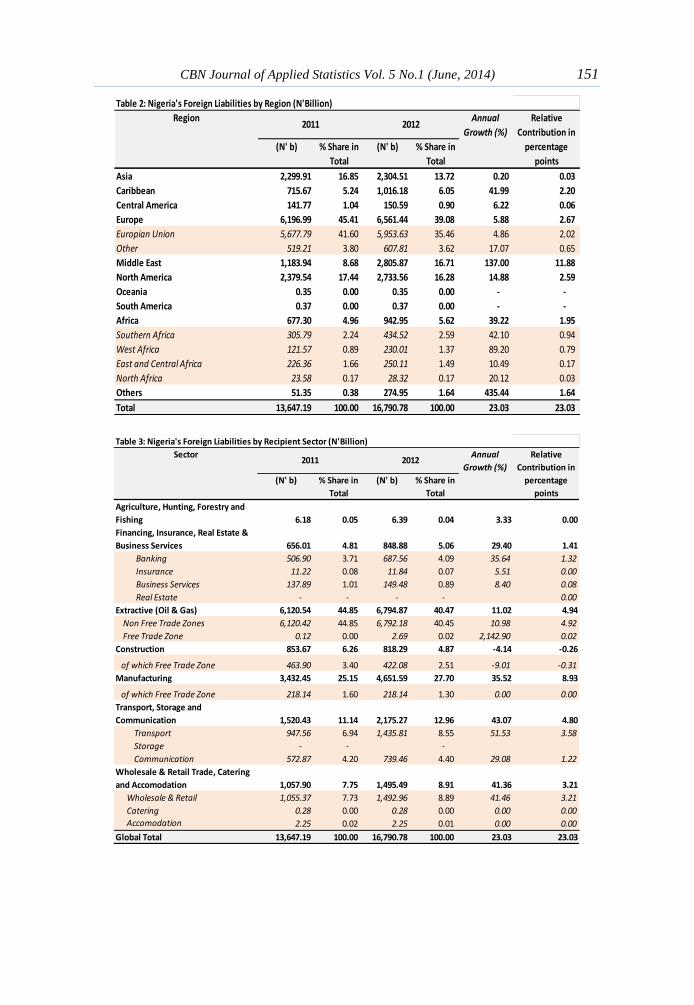
billion or 1.07 per cent and N135.20 billion or 0.81 per cent, respectively. A
further breakdown of total inward capital by originating economy in 2012
showed that N6,561.44 billion or 39.08 per cent was from the European
countries. This was followed by Middle East and North America which
accounted for N2, 805.87 (or 16.71 per cent) and N2, 733.56 (or 16.28 per
cent), respectively. Other regions of capital origin were Asia contributing
13.72 per cent, Caribbean (6.05 per cent), Africa (5.62 per cent), Central
America (0.90 per cent) and other countries (1.64 per cent). A further
breakdown of investments from Africa revealed that investments from
Southern Africa dominated (2.59 per cent), while East and Central Africa and
West African sub-regions accounted for 1.49 and 1.37 per cent of total inward
capital, respectively (Table 2).
Analysis of inward investments by recipient sector revealed that the extractive
industries sector ranked highest as it accounted for N6,794.87 billion or 40.47
per cent of the total foreign liabilities in the economy as at end 2012. This was
followed by manufacturing (N4, 651.59 billion or 27.70 per cent) and
transport, storage & communication (N2, 175.27 billion or 12.96 per cent).
Five sectors of the economy attracted higher foreign liabilities in 2012
compared with their levels a year earlier. These sectors were manufacturing
with relative contribution of 8.93 percentage points, extractive industries (4.94
percentage points), transport, storage and communication (4.80 percentage
points), wholesale and retail trade, catering and accommodation (3.21
percentage points) and financing, insurance, real estate and business services
(1.41 percentage points). Foreign investments flow to the construction sector
decelerated, as against growth recorded in other sectors. This may be
indications that the government’s efforts at attracting investments to other
sectors outside of construction were yielding results (Table 3).
Table 1: Nigeria's Foreign Liabilities by Category of Capital (N'Billion)
(N' b) % Share in
Total
(N' b) % Share in
Total
Foreign Direct Investment (FDI) 13,402.37 98.21 16,476.74 98.13 22.94
Foreign Portfolio Investment (FPI) 120.85 0.89 178.83 1.07 47.98
Other Capital Flows (OCF) 123.97 0.91 135.20 0.81 9.06
Total 13,647.19 100.00 16,790.78 100.00 23.03
Category of Capital 2011 2012 Annual
Growth (%)
CBN Journal of Applied Statistics Vol. 5 No.1 (June, 2014) 151
Table 2: Nigeria's Foreign Liabilities by Region (N'Billion)
Annual
Growth (%)
(N' b) % Share in
Total
(N' b) % Share in
Total
Asia 2,299.91 16.85 2,304.51 13.72 0.20 0.03
Caribbean 715.67 5.24 1,016.18 6.05 41.99 2.20
Central America 141.77 1.04 150.59 0.90 6.22 0.06
Europe 6,196.99 45.41 6,561.44 39.08 5.88 2.67
Europian Union 5,677.79 41.60 5,953.63 35.46 4.86 2.02
Other 519.21 3.80 607.81 3.62 17.07 0.65
Middle East 1,183.94 8.68 2,805.87 16.71 137.00 11.88
North America 2,379.54 17.44 2,733.56 16.28 14.88 2.59
Oceania 0.35 0.00 0.35 0.00 - -
South America 0.37 0.00 0.37 0.00 - -
Africa 677.30 4.96 942.95 5.62 39.22 1.95
Southern Africa 305.79 2.24 434.52 2.59 42.10 0.94
West Africa 121.57 0.89 230.01 1.37 89.20 0.79
East and Central Africa 226.36 1.66 250.11 1.49 10.49 0.17
North Africa 23.58 0.17 28.32 0.17 20.12 0.03
Others 51.35 0.38 274.95 1.64 435.44 1.64
Total 13,647.19 100.00 16,790.78 100.00 23.03 23.03
Relative
Contribution in
percentage
points
Region2011 2012
Table 3: Nigeria's Foreign Liabilities by Recipient Sector (N'Billion)
Annual
Growth (%)
(N' b) % Share in
Total
(N' b) % Share in
Total
Agriculture, Hunting, Forestry and
Fishing 6.18 0.05 6.39 0.04 3.33 0.00
Financing, Insurance, Real Estate &
Business Services 656.01 4.81 848.88 5.06 29.40 1.41
Banking 506.90 3.71 687.56 4.09 35.64 1.32
Insurance 11.22 0.08 11.84 0.07 5.51 0.00
Business Services 137.89 1.01 149.48 0.89 8.40 0.08
Real Estate - - - - 0.00
Extractive (Oil & Gas) 6,120.54 44.85 6,794.87 40.47 11.02 4.94
Non Free Trade Zones 6,120.42 44.85 6,792.18 40.45 10.98 4.92
Free Trade Zone 0.12 0.00 2.69 0.02 2,142.90 0.02
Construction 853.67 6.26 818.29 4.87 -4.14 -0.26
of which Free Trade Zone 463.90 3.40 422.08 2.51 -9.01 -0.31
Manufacturing 3,432.45 25.15 4,651.59 27.70 35.52 8.93
of which Free Trade Zone 218.14 1.60 218.14 1.30 0.00 0.00
Transport, Storage and
Communication 1,520.43 11.14 2,175.27 12.96 43.07 4.80
Transport 947.56 6.94 1,435.81 8.55 51.53 3.58
Storage - - -
Communication 572.87 4.20 739.46 4.40 29.08 1.22
Wholesale & Retail Trade, Catering
and Accomodation 1,057.90 7.75 1,495.49 8.91 41.36 3.21
Wholesale & Retail 1,055.37 7.73 1,492.96 8.89 41.46 3.21
Catering 0.28 0.00 0.28 0.00 0.00 0.00
Accomodation 2.25 0.02 2.25 0.01 0.00 0.00
Global Total 13,647.19 100.00 16,790.78 100.00 23.03 23.03
Relative
Contribution in
percentage
points
Sector2011 2012
152 Destination Sectors and Originating Economies of Nigeria’s
Private Foreign Assets and Liabilities in 2012 Doguwa et al.
3.2 Private Foreign Liabilities by Category of Capital
3.2.1 Foreign Direct Investment (FDI)
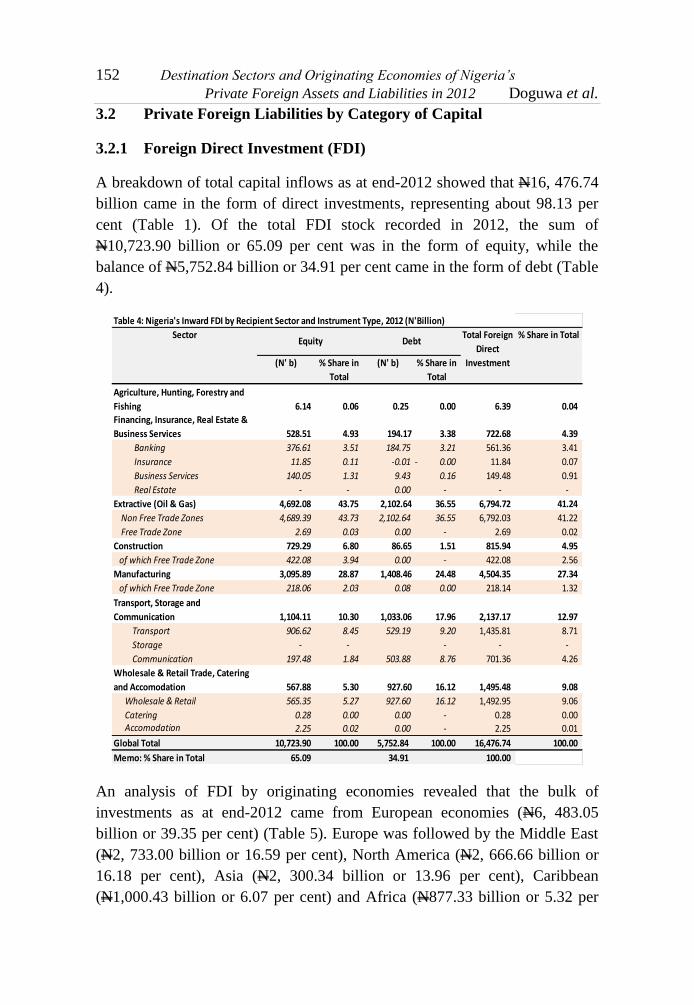
A breakdown of total capital inflows as at end-2012 showed that N16, 476.74
billion came in the form of direct investments, representing about 98.13 per
cent (Table 1). Of the total FDI stock recorded in 2012, the sum of
N10,723.90 billion or 65.09 per cent was in the form of equity, while the
balance of N5,752.84 billion or 34.91 per cent came in the form of debt (Table
4).
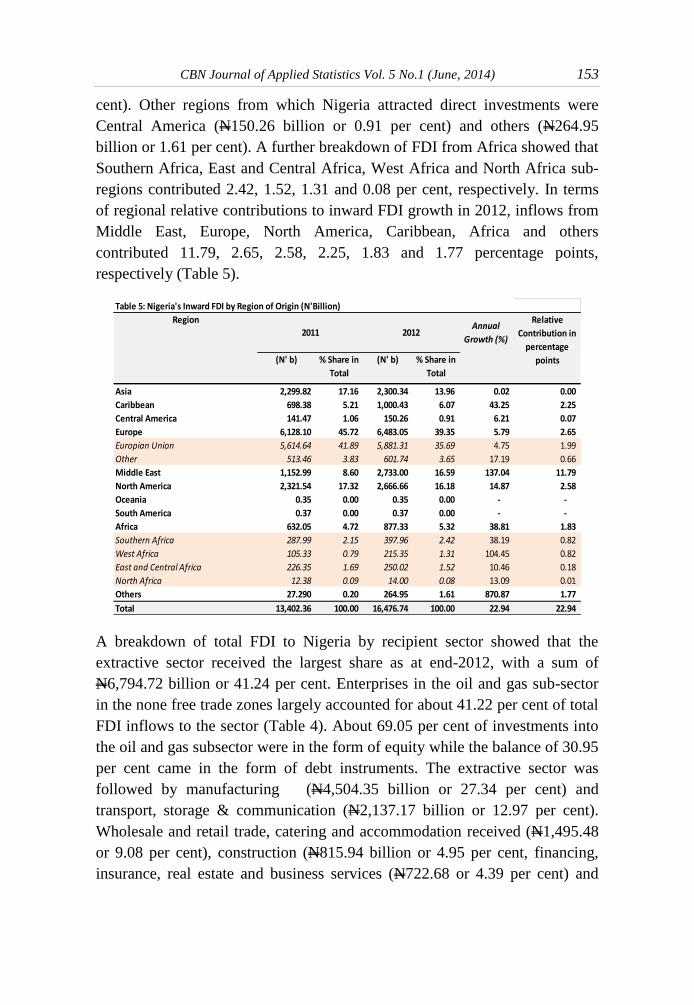
An analysis of FDI by originating economies revealed that the bulk of
investments as at end-2012 came from European economies (N6, 483.05
billion or 39.35 per cent) (Table 5). Europe was followed by the Middle East
(N2, 733.00 billion or 16.59 per cent), North America (N2, 666.66 billion or
16.18 per cent), Asia (N2, 300.34 billion or 13.96 per cent), Caribbean
(N1,000.43 billion or 6.07 per cent) and Africa (N877.33 billion or 5.32 per
Table 4: Nigeria's Inward FDI by Recipient Sector and Instrument Type, 2012 (N'Billion)
% Share in Total
(N' b) % Share in
Total
(N' b) % Share in
Total
Agriculture, Hunting, Forestry and
Fishing 6.14 0.06 0.25 0.00 6.39 0.04
Financing, Insurance, Real Estate &
Business Services 528.51 4.93 194.17 3.38 722.68 4.39
Banking 376.61 3.51 184.75 3.21 561.36 3.41
Insurance 11.85 0.11 -0.01 0.00- 11.84 0.07
Business Services 140.05 1.31 9.43 0.16 149.48 0.91
Real Estate - - 0.00 - - -
Extractive (Oil & Gas) 4,692.08 43.75 2,102.64 36.55 6,794.72 41.24
Non Free Trade Zones 4,689.39 43.73 2,102.64 36.55 6,792.03 41.22
Free Trade Zone 2.69 0.03 0.00 - 2.69 0.02
Construction 729.29 6.80 86.65 1.51 815.94 4.95
of which Free Trade Zone 422.08 3.94 0.00 - 422.08 2.56
Manufacturing 3,095.89 28.87 1,408.46 24.48 4,504.35 27.34
of which Free Trade Zone 218.06 2.03 0.08 0.00 218.14 1.32
Transport, Storage and
Communication 1,104.11 10.30 1,033.06 17.96 2,137.17 12.97
Transport 906.62 8.45 529.19 9.20 1,435.81 8.71
Storage - - - - -
Communication 197.48 1.84 503.88 8.76 701.36 4.26
Wholesale & Retail Trade, Catering
and Accomodation 567.88 5.30 927.60 16.12 1,495.48 9.08
Wholesale & Retail 565.35 5.27 927.60 16.12 1,492.95 9.06
Catering 0.28 0.00 0.00 - 0.28 0.00 Accomodation 2.25 0.02 0.00 - 2.25 0.01
Global Total 10,723.90 100.00 5,752.84 100.00 16,476.74 100.00
Memo: % Share in Total 65.09 34.91 100.00
SectorEquity Debt
Total Foreign
Direct
Investment
CBN Journal of Applied Statistics Vol. 5 No.1 (June, 2014) 153
cent). Other regions from which Nigeria attracted direct investments were
Central America (N150.26 billion or 0.91 per cent) and others (N264.95
billion or 1.61 per cent). A further breakdown of FDI from Africa showed that
Southern Africa, East and Central Africa, West Africa and North Africa sub-
regions contributed 2.42, 1.52, 1.31 and 0.08 per cent, respectively. In terms
of regional relative contributions to inward FDI growth in 2012, inflows from
Middle East, Europe, North America, Caribbean, Africa and others
contributed 11.79, 2.65, 2.58, 2.25, 1.83 and 1.77 percentage points,
respectively (Table 5).
A breakdown of total FDI to Nigeria by recipient sector showed that the
extractive sector received the largest share as at end-2012, with a sum of
N6,794.72 billion or 41.24 per cent. Enterprises in the oil and gas sub-sector
in the none free trade zones largely accounted for about 41.22 per cent of total
FDI inflows to the sector (Table 4). About 69.05 per cent of investments into
the oil and gas subsector were in the form of equity while the balance of 30.95
per cent came in the form of debt instruments. The extractive sector was
followed by manufacturing (N4,504.35 billion or 27.34 per cent) and
transport, storage & communication (N2,137.17 billion or 12.97 per cent).
Wholesale and retail trade, catering and accommodation received (N1,495.48
or 9.08 per cent), construction (N815.94 billion or 4.95 per cent, financing,
insurance, real estate and business services (N722.68 or 4.39 per cent) and
Table 5: Nigeria's Inward FDI by Region of Origin (N'Billion)
Annual
Growth (%)
(N' b) % Share in
Total
(N' b) % Share in
Total
Asia 2,299.82 17.16 2,300.34 13.96 0.02 0.00
Caribbean 698.38 5.21 1,000.43 6.07 43.25 2.25
Central America 141.47 1.06 150.26 0.91 6.21 0.07
Europe 6,128.10 45.72 6,483.05 39.35 5.79 2.65
Europian Union 5,614.64 41.89 5,881.31 35.69 4.75 1.99
Other 513.46 3.83 601.74 3.65 17.19 0.66
Middle East 1,152.99 8.60 2,733.00 16.59 137.04 11.79
North America 2,321.54 17.32 2,666.66 16.18 14.87 2.58
Oceania 0.35 0.00 0.35 0.00 - -
South America 0.37 0.00 0.37 0.00 - -
Africa 632.05 4.72 877.33 5.32 38.81 1.83
Southern Africa 287.99 2.15 397.96 2.42 38.19 0.82
West Africa 105.33 0.79 215.35 1.31 104.45 0.82
East and Central Africa 226.35 1.69 250.02 1.52 10.46 0.18
North Africa 12.38 0.09 14.00 0.08 13.09 0.01
Others 27.290 0.20 264.95 1.61 870.87 1.77
Total 13,402.36 100.00 16,476.74 100.00 22.94 22.94
Region
2011 2012
Relative
Contribution in
percentage
points
154 Destination Sectors and Originating Economies of Nigeria’s
Private Foreign Assets and Liabilities in 2012 Doguwa et al.
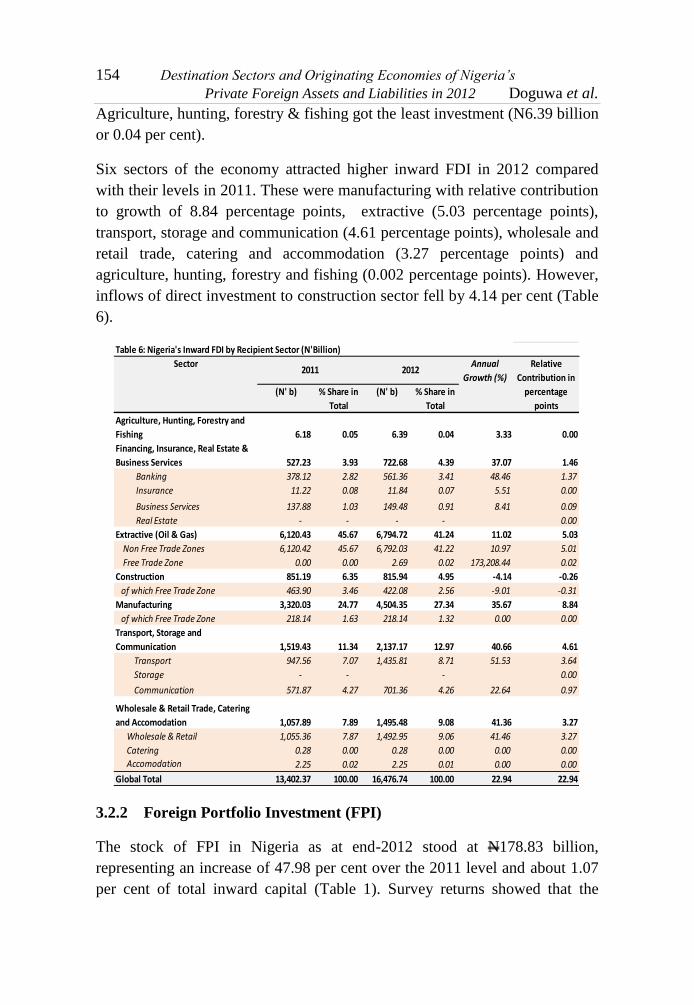
Agriculture, hunting, forestry & fishing got the least investment (N6.39 billion
or 0.04 per cent).
Six sectors of the economy attracted higher inward FDI in 2012 compared
with their levels in 2011. These were manufacturing with relative contribution
to growth of 8.84 percentage points, extractive (5.03 percentage points),
transport, storage and communication (4.61 percentage points), wholesale and
retail trade, catering and accommodation (3.27 percentage points) and
agriculture, hunting, forestry and fishing (0.002 percentage points). However,
inflows of direct investment to construction sector fell by 4.14 per cent (Table
6).
3.2.2 Foreign Portfolio Investment (FPI)
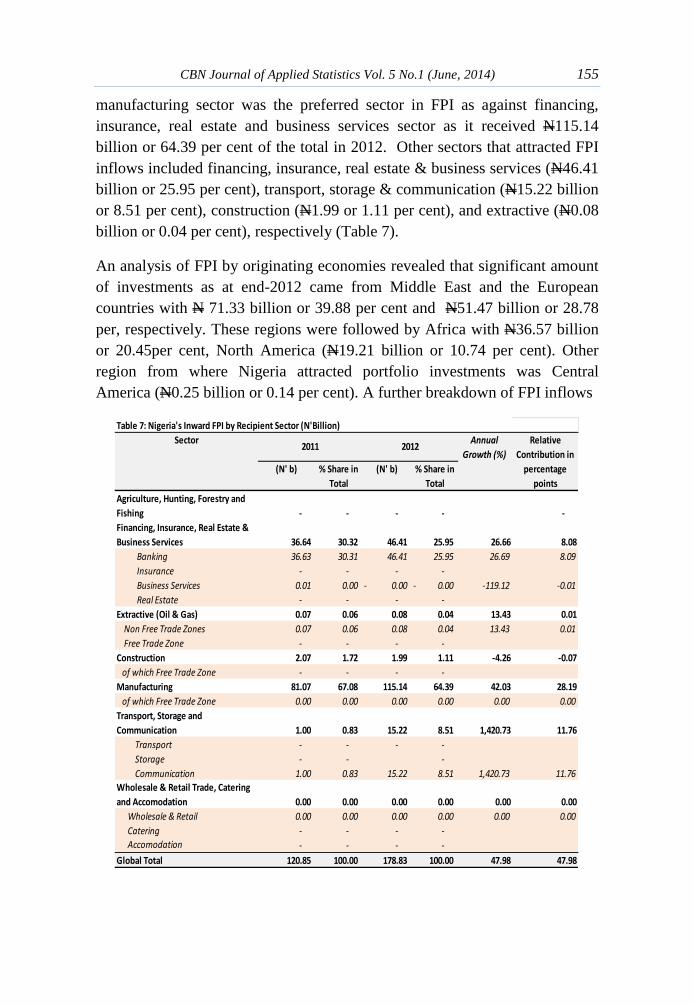
The stock of FPI in Nigeria as at end-2012 stood at N178.83 billion,
representing an increase of 47.98 per cent over the 2011 level and about 1.07
per cent of total inward capital (Table 1). Survey returns showed that the
Table 6: Nigeria's Inward FDI by Recipient Sector (N'Billion)
Annual
Growth (%)
(N' b) % Share in
Total
(N' b) % Share in
Total
Agriculture, Hunting, Forestry and
Fishing 6.18 0.05 6.39 0.04 3.33 0.00
Financing, Insurance, Real Estate &
Business Services 527.23 3.93 722.68 4.39 37.07 1.46
Banking 378.12 2.82 561.36 3.41 48.46 1.37
Insurance 11.22 0.08 11.84 0.07 5.51 0.00
Business Services 137.88 1.03 149.48 0.91 8.41 0.09
Real Estate - - - - 0.00
Extractive (Oil & Gas) 6,120.43 45.67 6,794.72 41.24 11.02 5.03
Non Free Trade Zones 6,120.42 45.67 6,792.03 41.22 10.97 5.01
Free Trade Zone 0.00 0.00 2.69 0.02 173,208.44 0.02
Construction 851.19 6.35 815.94 4.95 -4.14 -0.26
of which Free Trade Zone 463.90 3.46 422.08 2.56 -9.01 -0.31
Manufacturing 3,320.03 24.77 4,504.35 27.34 35.67 8.84
of which Free Trade Zone 218.14 1.63 218.14 1.32 0.00 0.00
Transport, Storage and
Communication 1,519.43 11.34 2,137.17 12.97 40.66 4.61
Transport 947.56 7.07 1,435.81 8.71 51.53 3.64
Storage - - - 0.00
Communication 571.87 4.27 701.36 4.26 22.64 0.97
Wholesale & Retail Trade, Catering
and Accomodation 1,057.89 7.89 1,495.48 9.08 41.36 3.27
Wholesale & Retail 1,055.36 7.87 1,492.95 9.06 41.46 3.27
Catering 0.28 0.00 0.28 0.00 0.00 0.00
Accomodation 2.25 0.02 2.25 0.01 0.00 0.00
Global Total 13,402.37 100.00 16,476.74 100.00 22.94 22.94
Sector2011 2012
Relative
Contribution in
percentage
points
CBN Journal of Applied Statistics Vol. 5 No.1 (June, 2014) 155
manufacturing sector was the preferred sector in FPI as against financing,
insurance, real estate and business services sector as it received N115.14
billion or 64.39 per cent of the total in 2012. Other sectors that attracted FPI
inflows included financing, insurance, real estate & business services (N46.41
billion or 25.95 per cent), transport, storage & communication (N15.22 billion
or 8.51 per cent), construction (N1.99 or 1.11 per cent), and extractive (N0.08
billion or 0.04 per cent), respectively (Table 7).
An analysis of FPI by originating economies revealed that significant amount
of investments as at end-2012 came from Middle East and the European
countries with N 71.33 billion or 39.88 per cent and N51.47 billion or 28.78
per, respectively. These regions were followed by Africa with N36.57 billion
or 20.45per cent, North America (N19.21 billion or 10.74 per cent). Other
region from where Nigeria attracted portfolio investments was Central
America (N0.25 billion or 0.14 per cent). A further breakdown of FPI inflows
Table 7: Nigeria's Inward FPI by Recipient Sector (N'Billion)
Annual
Growth (%)
(N' b) % Share in
Total
(N' b) % Share in
Total
Agriculture, Hunting, Forestry and
Fishing - - - - -
Financing, Insurance, Real Estate &
Business Services 36.64 30.32 46.41 25.95 26.66 8.08
Banking 36.63 30.31 46.41 25.95 26.69 8.09
Insurance - - - -
Business Services 0.01 0.00 0.00- 0.00- -119.12 -0.01
Real Estate - - - -
Extractive (Oil & Gas) 0.07 0.06 0.08 0.04 13.43 0.01
Non Free Trade Zones 0.07 0.06 0.08 0.04 13.43 0.01
Free Trade Zone - - - -
Construction 2.07 1.72 1.99 1.11 -4.26 -0.07
of which Free Trade Zone - - - -
Manufacturing 81.07 67.08 115.14 64.39 42.03 28.19
of which Free Trade Zone 0.00 0.00 0.00 0.00 0.00 0.00
Transport, Storage and
Communication 1.00 0.83 15.22 8.51 1,420.73 11.76
Transport - - - -
Storage - - -
Communication 1.00 0.83 15.22 8.51 1,420.73 11.76
Wholesale & Retail Trade, Catering
and Accomodation 0.00 0.00 0.00 0.00 0.00 0.00
Wholesale & Retail 0.00 0.00 0.00 0.00 0.00 0.00
Catering - - - -
Accomodation - - - -
Global Total 120.85 100.00 178.83 100.00 47.98 47.98
Sector2011 2012
Relative
Contribution in
percentage
points
156 Destination Sectors and Originating Economies of Nigeria’s
Private Foreign Assets and Liabilities in 2012 Doguwa et al.
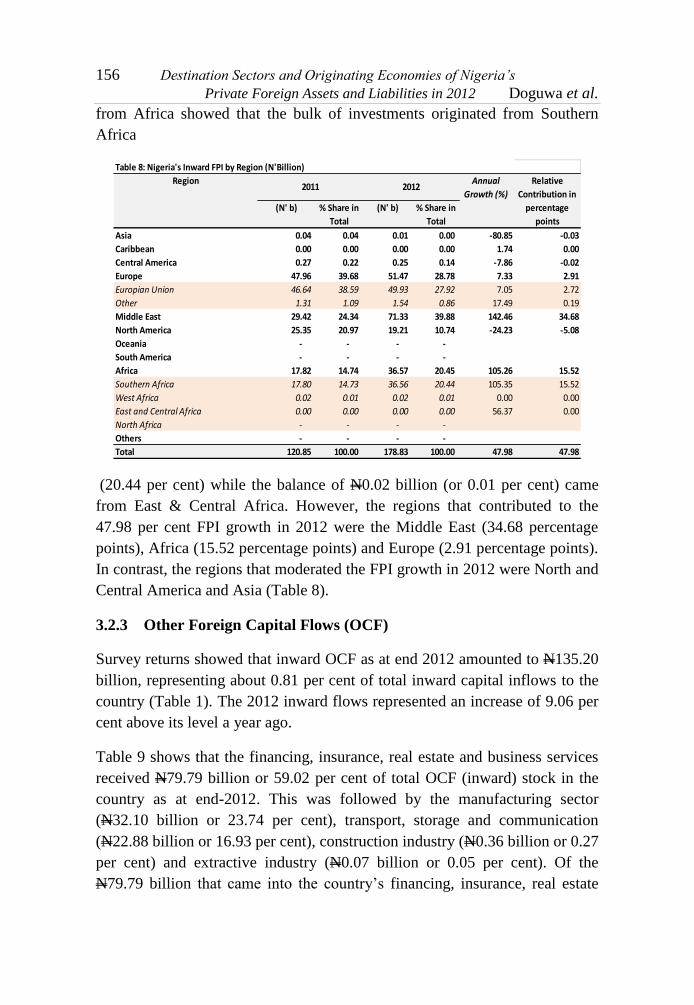
from Africa showed that the bulk of investments originated from Southern
Africa
(20.44 per cent) while the balance of N0.02 billion (or 0.01 per cent) came
from East & Central Africa. However, the regions that contributed to the
47.98 per cent FPI growth in 2012 were the Middle East (34.68 percentage
points), Africa (15.52 percentage points) and Europe (2.91 percentage points).
In contrast, the regions that moderated the FPI growth in 2012 were North and
Central America and Asia (Table 8).
3.2.3 Other Foreign Capital Flows (OCF)
Survey returns showed that inward OCF as at end 2012 amounted to N135.20
billion, representing about 0.81 per cent of total inward capital inflows to the
country (Table 1). The 2012 inward flows represented an increase of 9.06 per
cent above its level a year ago.
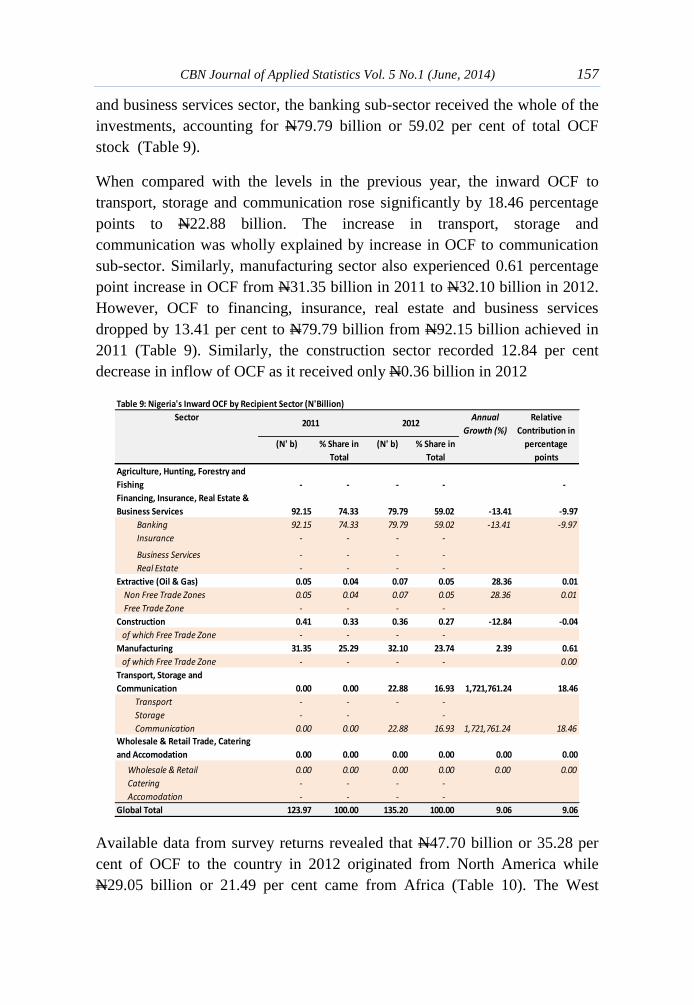
Table 9 shows that the financing, insurance, real estate and business services
received N79.79 billion or 59.02 per cent of total OCF (inward) stock in the
country as at end-2012. This was followed by the manufacturing sector
(N32.10 billion or 23.74 per cent), transport, storage and communication
(N22.88 billion or 16.93 per cent), construction industry (N0.36 billion or 0.27
per cent) and extractive industry (N0.07 billion or 0.05 per cent). Of the
N79.79 billion that came into the country’s financing, insurance, real estate
Table 8: Nigeria's Inward FPI by Region (N'Billion)
Annual
Growth (%)
(N' b) % Share in
Total
(N' b) % Share in
Total
Asia 0.04 0.04 0.01 0.00 -80.85 -0.03
Caribbean 0.00 0.00 0.00 0.00 1.74 0.00
Central America 0.27 0.22 0.25 0.14 -7.86 -0.02
Europe 47.96 39.68 51.47 28.78 7.33 2.91
Europian Union 46.64 38.59 49.93 27.92 7.05 2.72
Other 1.31 1.09 1.54 0.86 17.49 0.19
Middle East 29.42 24.34 71.33 39.88 142.46 34.68
North America 25.35 20.97 19.21 10.74 -24.23 -5.08
Oceania - - - -
South America - - - -
Africa 17.82 14.74 36.57 20.45 105.26 15.52
Southern Africa 17.80 14.73 36.56 20.44 105.35 15.52
West Africa 0.02 0.01 0.02 0.01 0.00 0.00
East and Central Africa 0.00 0.00 0.00 0.00 56.37 0.00
North Africa - - - -
Others - - - -
Total 120.85 100.00 178.83 100.00 47.98 47.98
2012Region
2011Relative
Contribution in
percentage
points
CBN Journal of Applied Statistics Vol. 5 No.1 (June, 2014) 157
and business services sector, the banking sub-sector received the whole of the
investments, accounting for N79.79 billion or 59.02 per cent of total OCF
stock (Table 9).
When compared with the levels in the previous year, the inward OCF to
transport, storage and communication rose significantly by 18.46 percentage
points to N22.88 billion. The increase in transport, storage and
communication was wholly explained by increase in OCF to communication
sub-sector. Similarly, manufacturing sector also experienced 0.61 percentage
point increase in OCF from N31.35 billion in 2011 to N32.10 billion in 2012.
However, OCF to financing, insurance, real estate and business services
dropped by 13.41 per cent to N79.79 billion from N92.15 billion achieved in
2011 (Table 9). Similarly, the construction sector recorded 12.84 per cent
decrease in inflow of OCF as it received only N0.36 billion in 2012
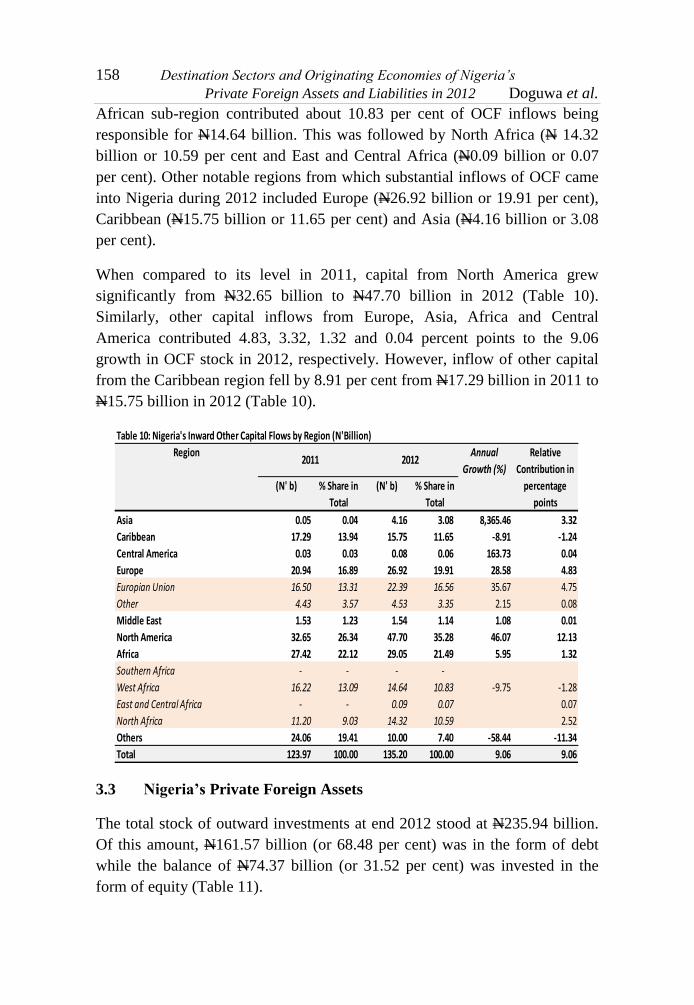
Available data from survey returns revealed that N47.70 billion or 35.28 per
cent of OCF to the country in 2012 originated from North America while
N29.05 billion or 21.49 per cent came from Africa (Table 10). The West
Table 9: Nigeria's Inward OCF by Recipient Sector (N'Billion)
Annual
Growth (%)
(N' b) % Share in
Total
(N' b) % Share in
Total
Agriculture, Hunting, Forestry and
Fishing - - - - -
Financing, Insurance, Real Estate &
Business Services 92.15 74.33 79.79 59.02 -13.41 -9.97
Banking 92.15 74.33 79.79 59.02 -13.41 -9.97
Insurance - - - -
Business Services - - - -
Real Estate - - - -
Extractive (Oil & Gas) 0.05 0.04 0.07 0.05 28.36 0.01
Non Free Trade Zones 0.05 0.04 0.07 0.05 28.36 0.01
Free Trade Zone - - - -
Construction 0.41 0.33 0.36 0.27 -12.84 -0.04
of which Free Trade Zone - - - -
Manufacturing 31.35 25.29 32.10 23.74 2.39 0.61
of which Free Trade Zone - - - - 0.00
Transport, Storage and
Communication 0.00 0.00 22.88 16.93 1,721,761.24 18.46
Transport - - - -
Storage - - -
Communication 0.00 0.00 22.88 16.93 1,721,761.24 18.46
Wholesale & Retail Trade, Catering
and Accomodation 0.00 0.00 0.00 0.00 0.00 0.00
Wholesale & Retail 0.00 0.00 0.00 0.00 0.00 0.00
Catering - - - -
Accomodation - - - -
Global Total 123.97 100.00 135.20 100.00 9.06 9.06
Sector2011 2012
Relative
Contribution in
percentage
points
158 Destination Sectors and Originating Economies of Nigeria’s
Private Foreign Assets and Liabilities in 2012 Doguwa et al.
African sub-region contributed about 10.83 per cent of OCF inflows being
responsible for N14.64 billion. This was followed by North Africa (N 14.32
billion or 10.59 per cent and East and Central Africa (N0.09 billion or 0.07
per cent). Other notable regions from which substantial inflows of OCF came
into Nigeria during 2012 included Europe (N26.92 billion or 19.91 per cent),
Caribbean (N15.75 billion or 11.65 per cent) and Asia (N4.16 billion or 3.08
per cent).
When compared to its level in 2011, capital from North America grew
significantly from N32.65 billion to N47.70 billion in 2012 (Table 10).
Similarly, other capital inflows from Europe, Asia, Africa and Central
America contributed 4.83, 3.32, 1.32 and 0.04 percent points to the 9.06
growth in OCF stock in 2012, respectively. However, inflow of other capital
from the Caribbean region fell by 8.91 per cent from N17.29 billion in 2011 to
N15.75 billion in 2012 (Table 10).
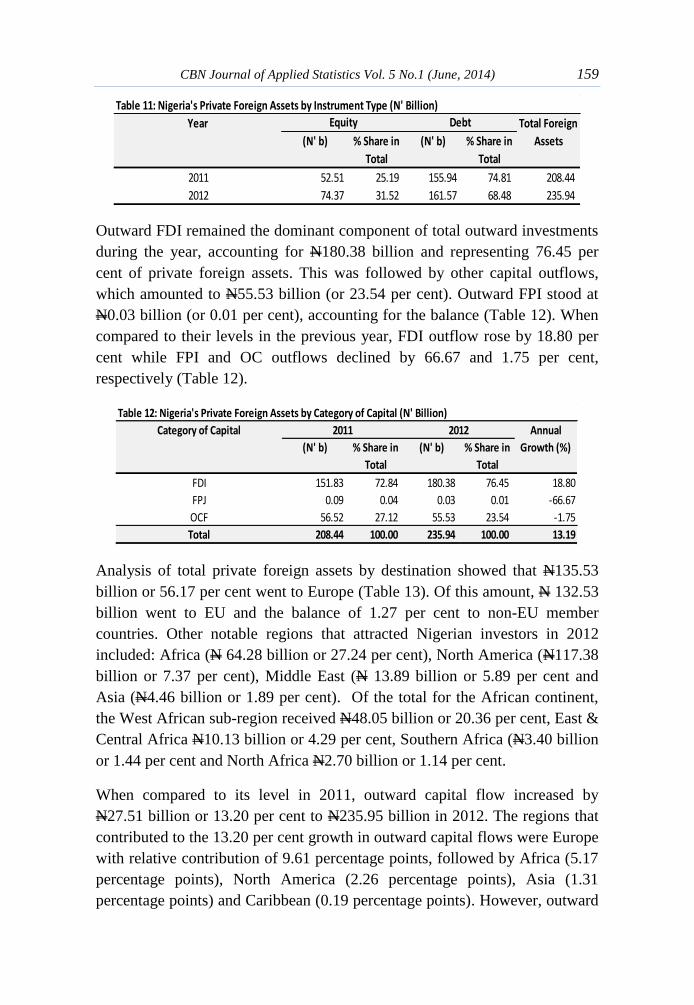
3.3 Nigeria’s Private Foreign Assets
The total stock of outward investments at end 2012 stood at N235.94 billion.
Of this amount, N161.57 billion (or 68.48 per cent) was in the form of debt
while the balance of N74.37 billion (or 31.52 per cent) was invested in the
form of equity (Table 11).
Table 10: Nigeria's Inward Other Capital Flows by Region (N'Billion)
Annual
Growth (%)
(N' b) % Share in
Total
(N' b) % Share in
Total
Asia 0.05 0.04 4.16 3.08 8,365.46 3.32
Caribbean 17.29 13.94 15.75 11.65 -8.91 -1.24
Central America 0.03 0.03 0.08 0.06 163.73 0.04
Europe 20.94 16.89 26.92 19.91 28.58 4.83
Europian Union 16.50 13.31 22.39 16.56 35.67 4.75
Other 4.43 3.57 4.53 3.35 2.15 0.08
Middle East 1.53 1.23 1.54 1.14 1.08 0.01
North America 32.65 26.34 47.70 35.28 46.07 12.13
Africa 27.42 22.12 29.05 21.49 5.95 1.32
Southern Africa - - - -
West Africa 16.22 13.09 14.64 10.83 -9.75 -1.28
East and Central Africa - - 0.09 0.07 0.07
North Africa 11.20 9.03 14.32 10.59 2.52
Others 24.06 19.41 10.00 7.40 -58.44 -11.34
Total 123.97 100.00 135.20 100.00 9.06 9.06
Region2011 2012
Relative
Contribution in
percentage
points
CBN Journal of Applied Statistics Vol. 5 No.1 (June, 2014) 159
Outward FDI remained the dominant component of total outward investments
during the year, accounting for N180.38 billion and representing 76.45 per
cent of private foreign assets. This was followed by other capital outflows,
which amounted to N55.53 billion (or 23.54 per cent). Outward FPI stood at
N0.03 billion (or 0.01 per cent), accounting for the balance (Table 12). When
compared to their levels in the previous year, FDI outflow rose by 18.80 per
cent while FPI and OC outflows declined by 66.67 and 1.75 per cent,
respectively (Table 12).
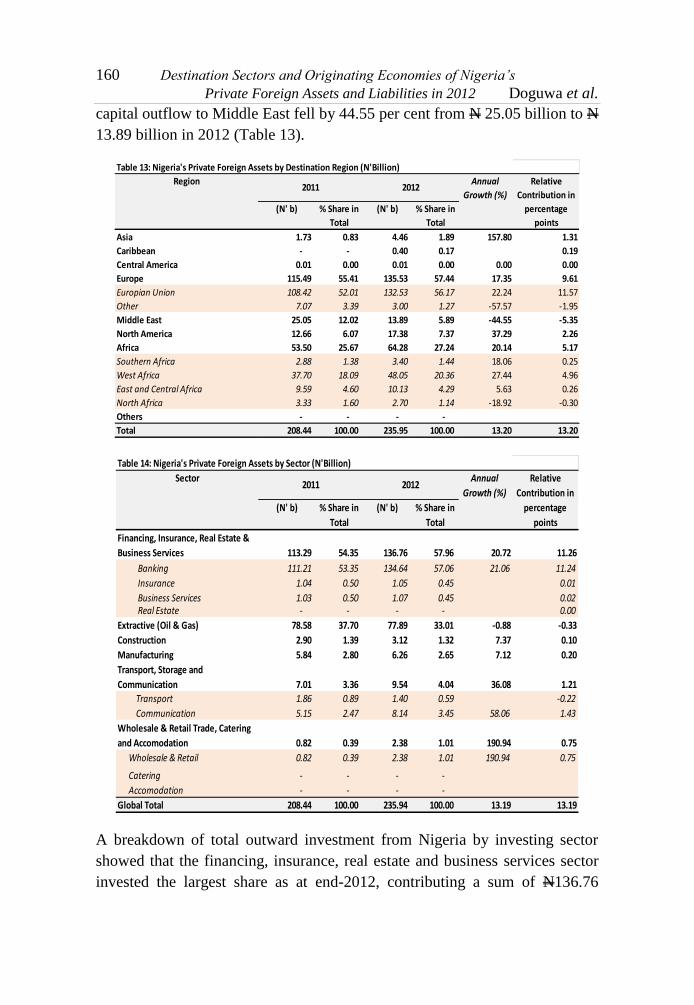
Analysis of total private foreign assets by destination showed that N135.53
billion or 56.17 per cent went to Europe (Table 13). Of this amount, N 132.53
billion went to EU and the balance of 1.27 per cent to non-EU member
countries. Other notable regions that attracted Nigerian investors in 2012
included: Africa (N 64.28 billion or 27.24 per cent), North America (N117.38
billion or 7.37 per cent), Middle East (N 13.89 billion or 5.89 per cent and
Asia (N4.46 billion or 1.89 per cent). Of the total for the African continent,
the West African sub-region received N48.05 billion or 20.36 per cent, East &
Central Africa N10.13 billion or 4.29 per cent, Southern Africa (N3.40 billion
or 1.44 per cent and North Africa N2.70 billion or 1.14 per cent.
When compared to its level in 2011, outward capital flow increased by
N27.51 billion or 13.20 per cent to N235.95 billion in 2012. The regions that
contributed to the 13.20 per cent growth in outward capital flows were Europe
with relative contribution of 9.61 percentage points, followed by Africa (5.17
percentage points), North America (2.26 percentage points), Asia (1.31
percentage points) and Caribbean (0.19 percentage points). However, outward
Table 11: Nigeria's Private Foreign Assets by Instrument Type (N' Billion)
(N' b) % Share in
Total
(N' b) % Share in
Total
2011 52.51 25.19 155.94 74.81 208.44
2012 74.37 31.52 161.57 68.48 235.94
Total Foreign
Assets
Year Equity Debt
Table 12: Nigeria's Private Foreign Assets by Category of Capital (N' Billion)
(N' b) % Share in
Total
(N' b) % Share in
Total
FDI 151.83 72.84 180.38 76.45 18.80
FPJ 0.09 0.04 0.03 0.01 -66.67
OCF 56.52 27.12 55.53 23.54 -1.75
Total 208.44 100.00 235.94 100.00 13.19
Category of Capital 2011 2012 Annual
Growth (%)
160 Destination Sectors and Originating Economies of Nigeria’s
Private Foreign Assets and Liabilities in 2012 Doguwa et al.
capital outflow to Middle East fell by 44.55 per cent from N 25.05 billion to N
13.89 billion in 2012 (Table 13).
A breakdown of total outward investment from Nigeria by investing sector
showed that the financing, insurance, real estate and business services sector
invested the largest share as at end-2012, contributing a sum of N136.76
Table 13: Nigeria's Private Foreign Assets by Destination Region (N'Billion)
Annual
Growth (%)
(N' b) % Share in
Total
(N' b) % Share in
Total
Asia 1.73 0.83 4.46 1.89 157.80 1.31
Caribbean - - 0.40 0.17 0.19
Central America 0.01 0.00 0.01 0.00 0.00 0.00
Europe 115.49 55.41 135.53 57.44 17.35 9.61
Europian Union 108.42 52.01 132.53 56.17 22.24 11.57
Other 7.07 3.39 3.00 1.27 -57.57 -1.95
Middle East 25.05 12.02 13.89 5.89 -44.55 -5.35
North America 12.66 6.07 17.38 7.37 37.29 2.26
Africa 53.50 25.67 64.28 27.24 20.14 5.17
Southern Africa 2.88 1.38 3.40 1.44 18.06 0.25
West Africa 37.70 18.09 48.05 20.36 27.44 4.96
East and Central Africa 9.59 4.60 10.13 4.29 5.63 0.26
North Africa 3.33 1.60 2.70 1.14 -18.92 -0.30
Others - - - -
Total 208.44 100.00 235.95 100.00 13.20 13.20
Region2011 2012
Relative
Contribution in
percentage
points
Table 14: Nigeria's Private Foreign Assets by Sector (N'Billion)
Annual
Growth (%)
(N' b) % Share in
Total
(N' b) % Share in
Total
Financing, Insurance, Real Estate &
Business Services 113.29 54.35 136.76 57.96 20.72 11.26
Banking 111.21 53.35 134.64 57.06 21.06 11.24
Insurance 1.04 0.50 1.05 0.45 0.01
Business Services 1.03 0.50 1.07 0.45 0.02 Real Estate - - - - 0.00
Extractive (Oil & Gas) 78.58 37.70 77.89 33.01 -0.88 -0.33
Construction 2.90 1.39 3.12 1.32 7.37 0.10
Manufacturing 5.84 2.80 6.26 2.65 7.12 0.20
Transport, Storage and
Communication 7.01 3.36 9.54 4.04 36.08 1.21
Transport 1.86 0.89 1.40 0.59 -0.22
Communication 5.15 2.47 8.14 3.45 58.06 1.43
Wholesale & Retail Trade, Catering
and Accomodation 0.82 0.39 2.38 1.01 190.94 0.75
Wholesale & Retail 0.82 0.39 2.38 1.01 190.94 0.75
Catering - - - -
Accomodation - - - -
Global Total 208.44 100.00 235.94 100.00 13.19 13.19
2011 2012Sector Relative
Contribution in
percentage
points
CBN Journal of Applied Statistics Vol. 5 No.1 (June, 2014) 161
billion or 57.96 per cent. The banking sub sector accounted for 57.06 per cent
of the total. The financing, insurance, real estate and business services sector
was followed by the extractive industry which invested a sum of N77.89
billion or 33.01 per cent of total foreign assets (Table 14).
Five sectors of the economy invested more outside the country in 2012
compared with 2011. The financing, insurance, real estate and business
services sector had the highest contribution of 11.26 percentage points,
followed by transport, storage and communication (1.21 percentage points),
wholesale and retail trade, catering and accommodation (0.75 percentage
points), manufacturing (0.20 percentage points) and construction (0.10
percentage points). However, outward capital flows from extractive sector fell
by 0.88 per cent, during the review period (Table 14).
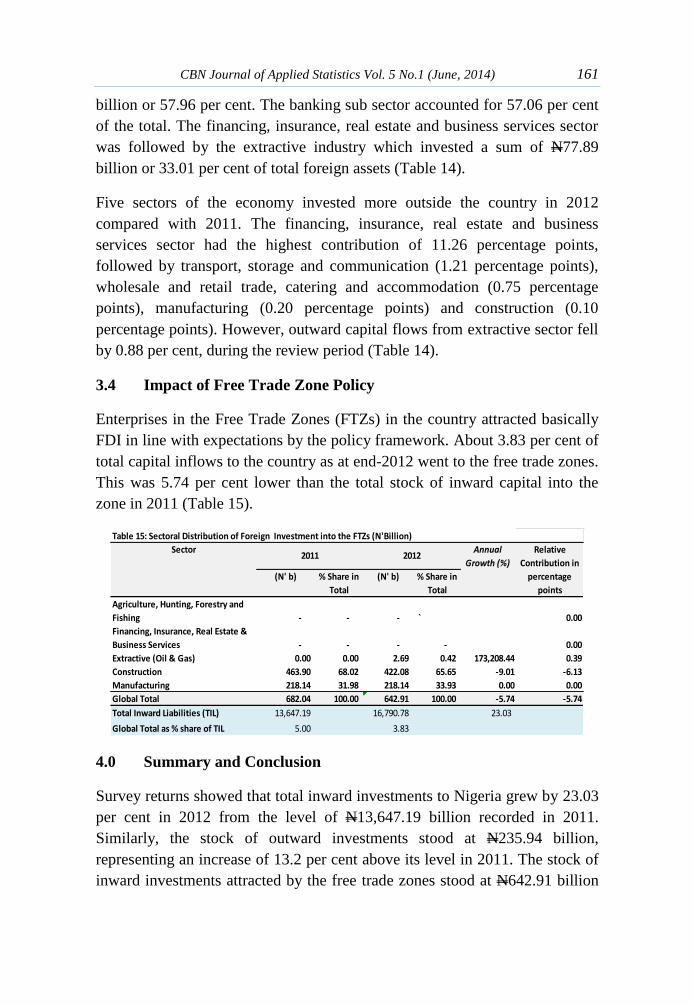
3.4 Impact of Free Trade Zone Policy
Enterprises in the Free Trade Zones (FTZs) in the country attracted basically
FDI in line with expectations by the policy framework. About 3.83 per cent of
total capital inflows to the country as at end-2012 went to the free trade zones.
This was 5.74 per cent lower than the total stock of inward capital into the
zone in 2011 (Table 15).
4.0 Summary and Conclusion
Survey returns showed that total inward investments to Nigeria grew by 23.03
per cent in 2012 from the level of N13,647.19 billion recorded in 2011.
Similarly, the stock of outward investments stood at N235.94 billion,
representing an increase of 13.2 per cent above its level in 2011. The stock of
inward investments attracted by the free trade zones stood at N642.91 billion
Table 15: Sectoral Distribution of Foreign Investment into the FTZs (N'Billion)
Annual
Growth (%)
(N' b) % Share in
Total
(N' b) % Share in
Total
Agriculture, Hunting, Forestry and
Fishing - - - ` 0.00
Financing, Insurance, Real Estate &
Business Services - - - - 0.00
Extractive (Oil & Gas) 0.00 0.00 2.69 0.42 173,208.44 0.39
Construction 463.90 68.02 422.08 65.65 -9.01 -6.13
Manufacturing 218.14 31.98 218.14 33.93 0.00 0.00
Global Total 682.04 100.00 642.91 100.00 -5.74 -5.74
Total Inward Liabilities (TIL) 13,647.19 16,790.78 23.03
Global Total as % share of TIL 5.00 3.83
Relative
Contribution in
percentage
points
Sector2011 2012
162 Destination Sectors and Originating Economies of Nigeria’s
Private Foreign Assets and Liabilities in 2012 Doguwa et al.
representing a decrease of 5.74 per cent when compared to N682.04 billion
recorded in 2011.
The 23.03 per cent growth in inward investment recorded in 2012 was largely
attributable to the 11.88 percentage points contribution in investments from
the Middle East countries. Also investments from Europe, North America,
Caribbean and Africa contributed 2.67, 2.59, 2.20 and 1.95 percentage points,
respectively. In terms of sectoral distribution of inward investment, the
extractive industry of the Nigerian economy remained the preferred sector of
foreign investors as it received about 40.5 per cent of the total. This was
followed by the manufacturing sector, which received 27.7 per cent.
It is hoped that the findings presented in this report will influence Nigeria’s
bilateral trade and investment policies with a view to further encouraging
foreign capital inflows for improved economic performance. Domestic
investment policies need to be backed up with solid infrastructural base in
order for the country to continue to sustain inward capital flows, especially to
the manufacturing sector.
References
IMF (2013), IMF World Economic Outlook: Downloadable at:
http://www.imf.org/external/pubs/ft/weo/2013/update/02/pdf/0712.pdf
Kale, Y.(2014). Measuring Better, Re-basing/Re-benchmarking of Nigeria’s
Gross Domestic Product. Being a presentation of the results of
Nigeria’s GDP Re-basing/Re-benchmarking Exercise at Transcorp
Hilton, Abuja on April 6, 2014
UNCTAD (2013), World Investment Report Published by United Nations
Conference on Trade and Development. Downloadable at
http://unctad.org/en/docs/wir2012_embargoed_en.pdf