Embed Size (px)
Citation preview
26 OCT 2011 1
Japan Energy Association Symposium
Challenges to Efficient and Clean Use of Coal in Asian Region
1.Current Status and Future Prospects of
Coal Use in Indonesia
2.Brief Report on Understanding CCS
Potential in Indonesia
Djoko Prasetijo
PT PLN (Persero), Indonesia
WEC Member Committee, Indonesia
Tokyo Keidanren Kaikan
26 October 2011
1
26 OCT 2011 2
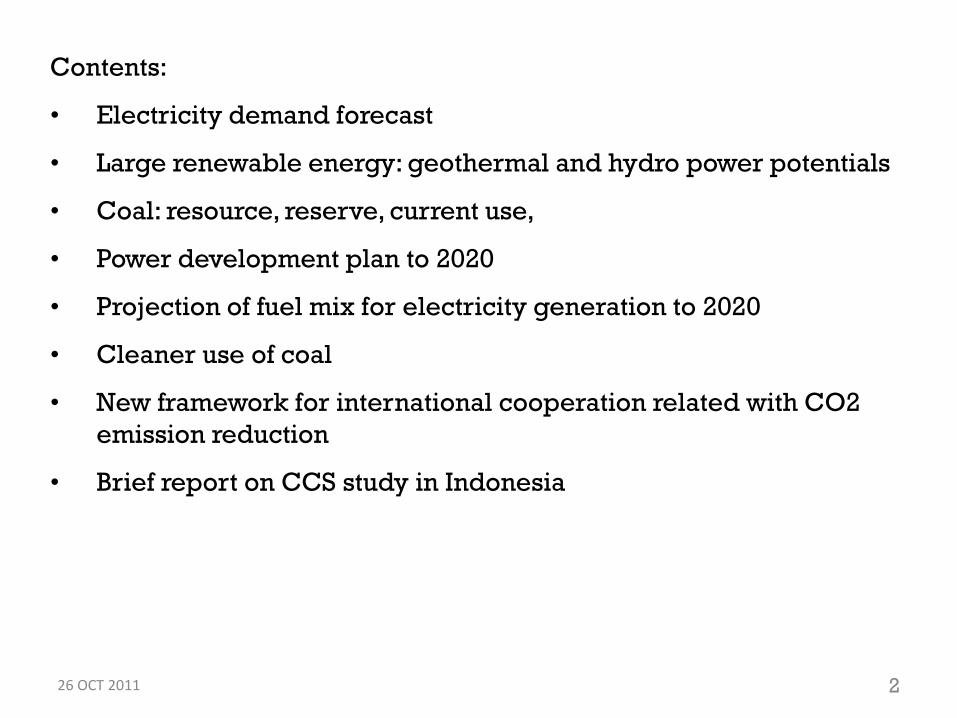
Contents:
• Electricity demand forecast
• Large renewable energy: geothermal and hydro power potentials
• Coal: resource, reserve, current use,
• Power development plan to 2020
• Projection of fuel mix for electricity generation to 2020
• Cleaner use of coal
• New framework for international cooperation related with CO2
emission reduction
• Brief report on CCS study in Indonesia
26 OCT 2011 3
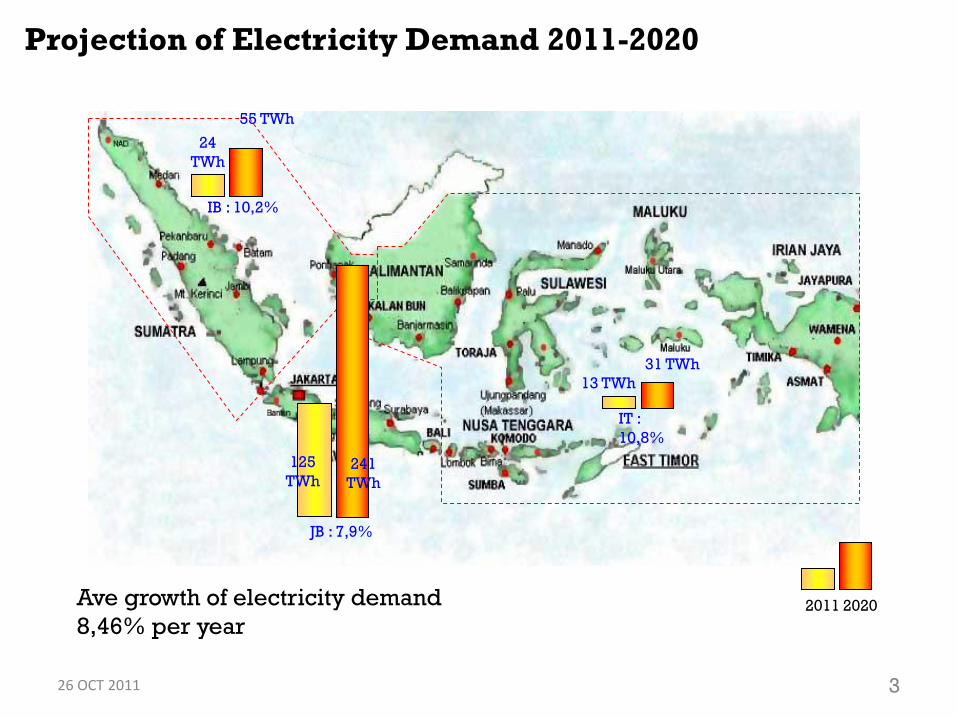
Projection of Electricity Demand 2011-2020
Ave growth of electricity demand
8,46% per year
IB : 10,2%
24
TWh
55 TWh
IT :
10,8%
13 TWh
31 TWh
JB : 7,9%
125
TWh241
TWh
2011 2020
26 OCT 2011 4
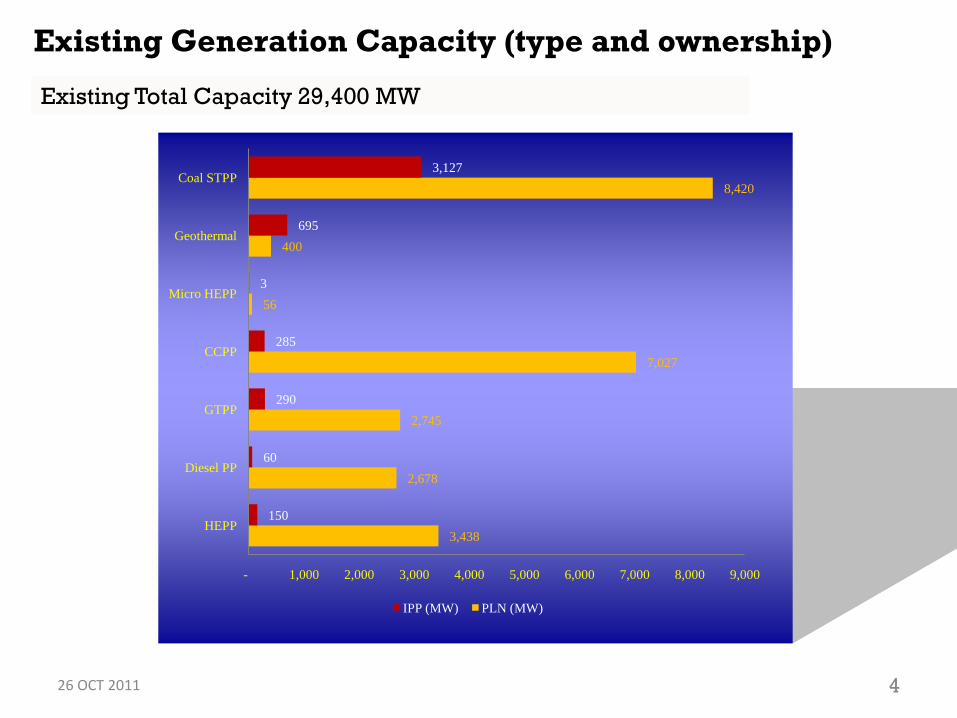
3,438
2,678
2,745
7,027
56
400
8,420
150
60
290
285
3
695
3,127
- 1,000 2,000 3,000 4,000 5,000 6,000 7,000 8,000 9,000
HEPP
Diesel PP
GTPP
CCPP
Micro HEPP
Geothermal
Coal STPP
IPP (MW) PLN (MW)
Existing Total Capacity 29,400 MW
Existing Generation Capacity (type and ownership)
26 OCT 2011 5
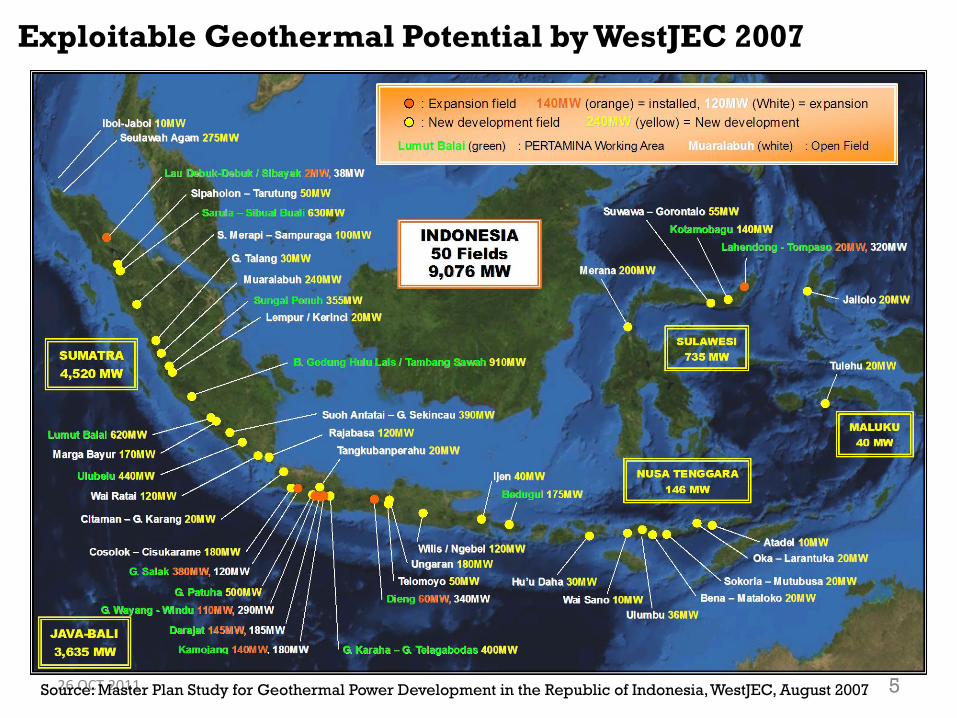
Exploitable Geothermal Potential by WestJEC 2007
Source: Master Plan Study for Geothermal Power Development in the Republic of Indonesia, WestJEC, August 2007
26 OCT 2011 6
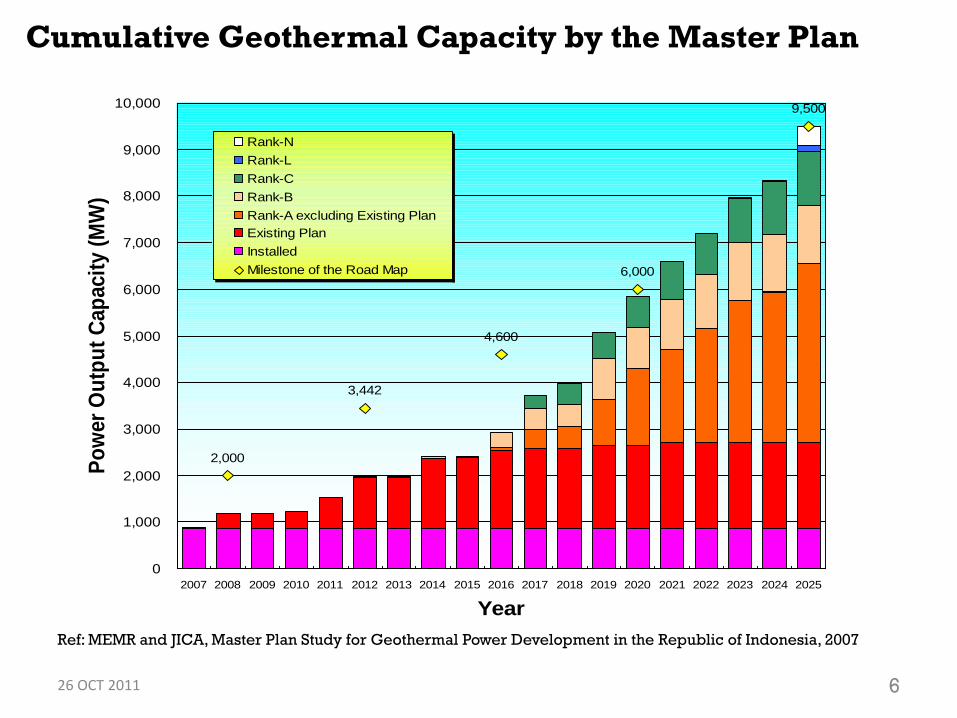
Cumulative Geothermal Capacity by the Master Plan
2,000
3,442
4,600
6,000
9,500
0
1,000
2,000
3,000
4,000
5,000
6,000
7,000
8,000
9,000
10,000
2007 2008 2009 2010 2011 2012 2013 2014 2015 2016 2017 2018 2019 2020 2021 2022 2023 2024 2025
Year
Po
wer
Ou
tpu
t C
ap
acit
y (
MW
)
Rank-N
Rank-L
Rank-C
Rank-B
Rank-A excluding Existing Plan
Existing Plan
Installed
Milestone of the Road Map
Ref: MEMR and JICA, Master Plan Study for Geothermal Power Development in the Republic of Indonesia, 2007

26 OCT 2011 7
• More recent study by castlerock in December 2010 *) sees
“inconsistencies” between the previous studies (by Pertamina
1999, Volcanological Survey of Indonesia 2007, WestJEC 2007
and WGC 2010), and “approaches lead to over-estimates”..
• Castlerock updates the geothermal resources based on 40
years of exploration and development data (from Pertamina,
Badan Geologi, field work by geoscientist) and new
probabilistic “volume“ approach
• The geothermal potential could be smaller than previously
claimed.
More Realistic Estimate of Geothermal Potential?
*) Geothermal Pricing & Incentive Policy Study, CastleRock December 2010

26 OCT 2011 88
ACEH:
5.000 MW
North Sum:
3.800 MW
South Sum, Jambi,
Bengkulu
& Lampung:
3.100 MW
West Java:
2.860 MW
Central Java
810 MW
West Sum & RIAU:
3.600 MW
East Java
525 MWBali + NTT/NTB
625 MW
West Kal:
4.737 MW
Central+South+East
Kalimantan:
17000 MWNorth Sul +
Gorontalo:
4000 MW
South+South East
Sulawesi:
6.300 MW
Maluku
430 MW
Papua:
22.000 MW
Map of Hydro Power Potential : 75 GW(Ref: Hydro Power Potential Study 1983, Hydro Power Inventory Study 1999)

26 OCT 2011 9
Hydro Power Potential Revisited
• The hydro power potential was reported to be 75 GW In
[1], [2], but after undergoing rigorous environmental and
social screenings in 2010, it is estimated only 26.3 GW [3].
• The 26.3 GW consist existing capacity (of 4.4 GW),
planning & on-going (6 GW), new potential (16 GW).
• The new potentials are classified according to the level of
difficulty in terms of forest type, resettlement, reservoir
area.
• Under realistic scenario, almost 8 GW is available having
almost 33 TWh of energy
Existing studies:
[1] Hydro Power Potential Study HPPS, 1983
[2] Hydro Inventory (HPPS 2) 1999
[3] Master Plan Study of Hydro Power Development in Indonesia, Nippon KOEI, May 2011
26 OCT 2011 10
Hydro Electric Power Plant Development Strategy
PLN to develop very large pump storage plants to meet peaking
demand in Java – Bali and Sumatera power systems : Upper
Cisokan 1000 MW (start construction soon), and Grindulu 1000
MW + Matenggeng 900 MW (study);
Run-off river HEPP (with daily pondage ) recommended due to
environmental consideration.
PLN to develop HEPP with reservoir as peaking generators if
socially & environmentally possible.
Encourage domestic IPP to develop small & medium scale
hydropower ( <10 MW ) making use of feed-in tariff (currently
approx 180 MW have been contracted, and many under
construction).
Hydropower development as a multi purpose project.
26 OCT 2011 11
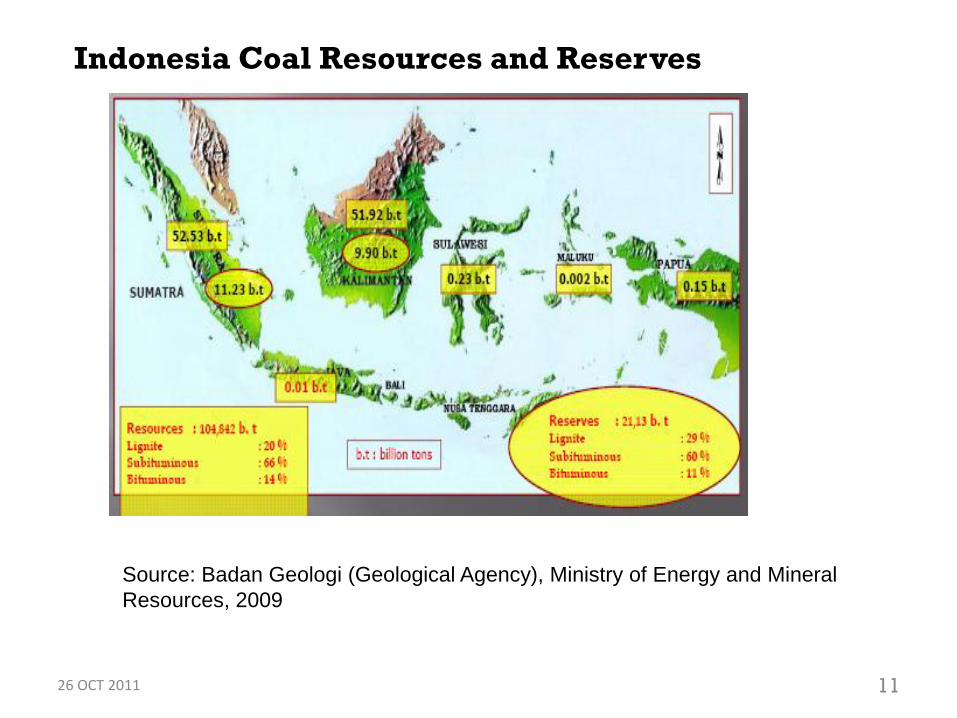
Indonesia Coal Resources and Reserves
Source: Badan Geologi (Geological Agency), Ministry of Energy and Mineral
Resources, 2009
26 OCT 2011 12
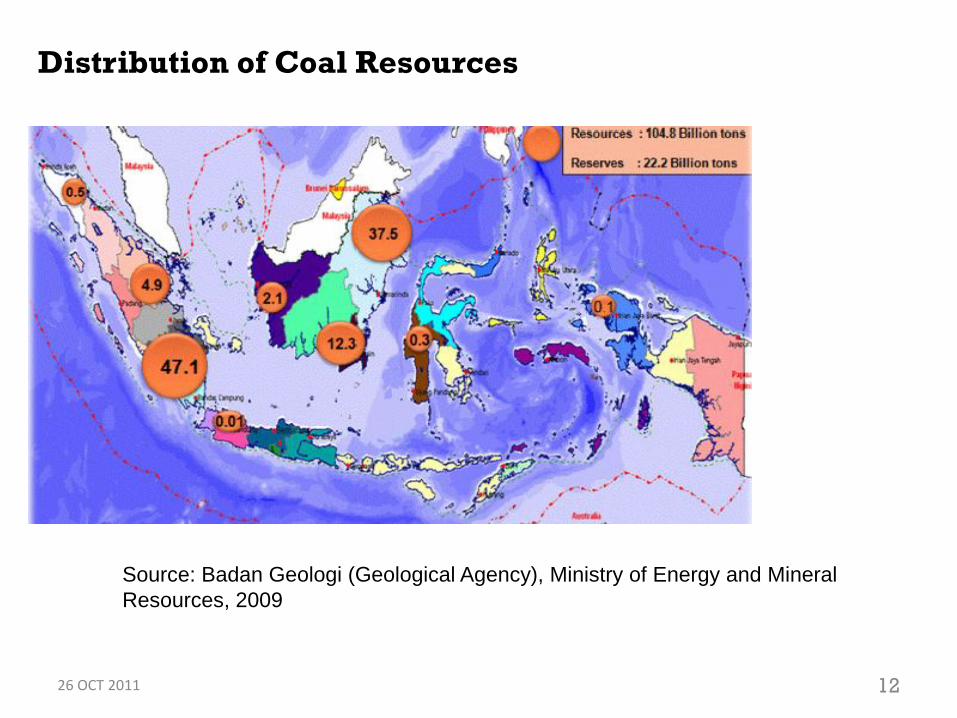
Distribution of Coal Resources
Source: Badan Geologi (Geological Agency), Ministry of Energy and Mineral
Resources, 2009

26 OCT 2011 13
Current Use of Coal for Electricity Generation in 2011
by Rank
Million tons
0
5
10
15
20
25
30
35
2011
Low Rank Medium High
low
medium
Low: < 5100, Medium: 5100-6100, High: >6100 kcal/kg
high
26 OCT 2011 14
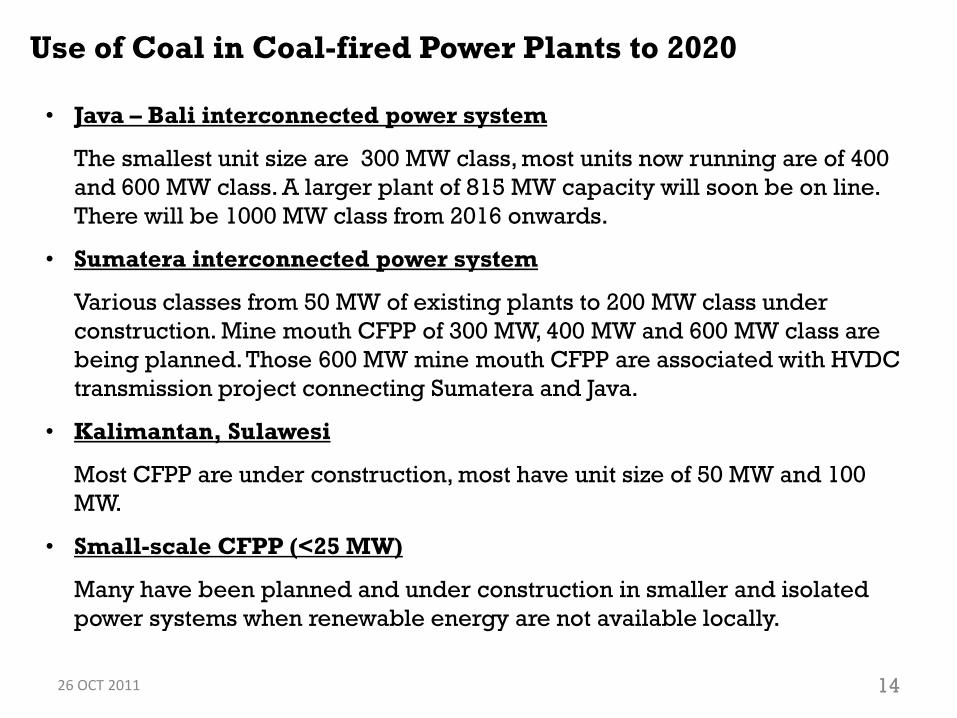
Use of Coal in Coal-fired Power Plants to 2020
• Java – Bali interconnected power system
The smallest unit size are 300 MW class, most units now running are of 400
and 600 MW class. A larger plant of 815 MW capacity will soon be on line.
There will be 1000 MW class from 2016 onwards.
• Sumatera interconnected power system
Various classes from 50 MW of existing plants to 200 MW class under
construction. Mine mouth CFPP of 300 MW, 400 MW and 600 MW class are
being planned. Those 600 MW mine mouth CFPP are associated with HVDC
transmission project connecting Sumatera and Java.
• Kalimantan, Sulawesi
Most CFPP are under construction, most have unit size of 50 MW and 100
MW.
• Small-scale CFPP (<25 MW)
Many have been planned and under construction in smaller and isolated
power systems when renewable energy are not available locally.
26 OCT 2011 15
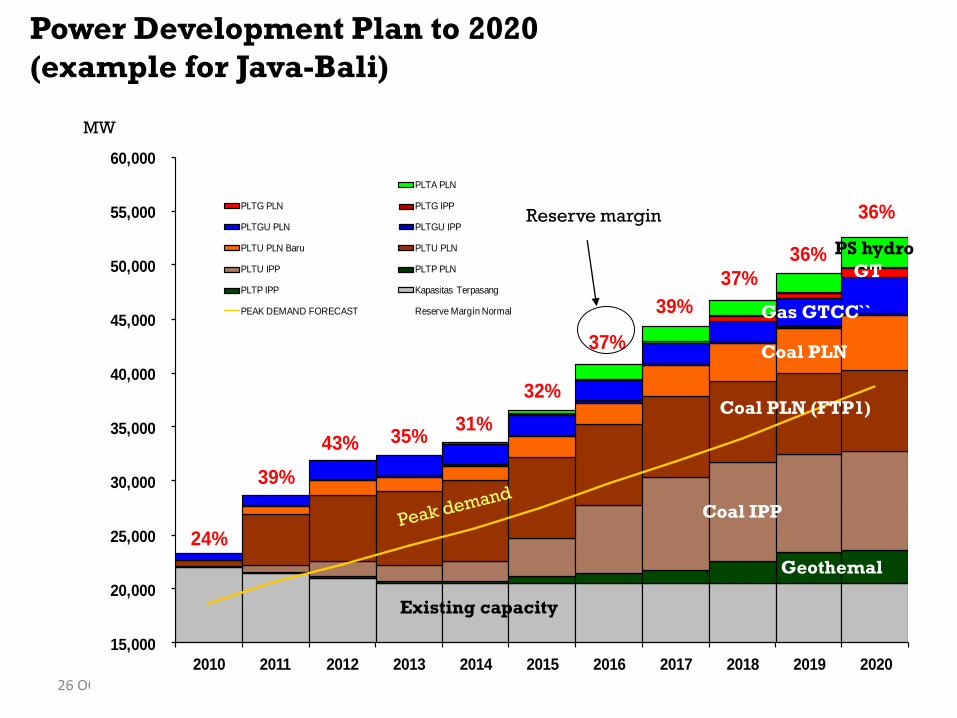
Power Development Plan to 2020
(example for Java-Bali)
24%
39%
43% 35%31%
32%
37%
39%
37%
36%
36%
15,000
20,000
25,000
30,000
35,000
40,000
45,000
50,000
55,000
60,000
2010 2011 2012 2013 2014 2015 2016 2017 2018 2019 2020
PLTA PLN
PLTG PLN PLTG IPP
PLTGU PLN PLTGU IPP
PLTU PLN Baru PLTU PLN
PLTU IPP PLTP PLN
PLTP IPP Kapasitas Terpasang
PEAK DEMAND FORECAST Reserve Margin Normal
Coal IPP
Geothemal
Existing capacity
PS hydro
GT
Coal PLN (FTP1)
Coal PLN
Gas GTCC``
MW
Reserve margin
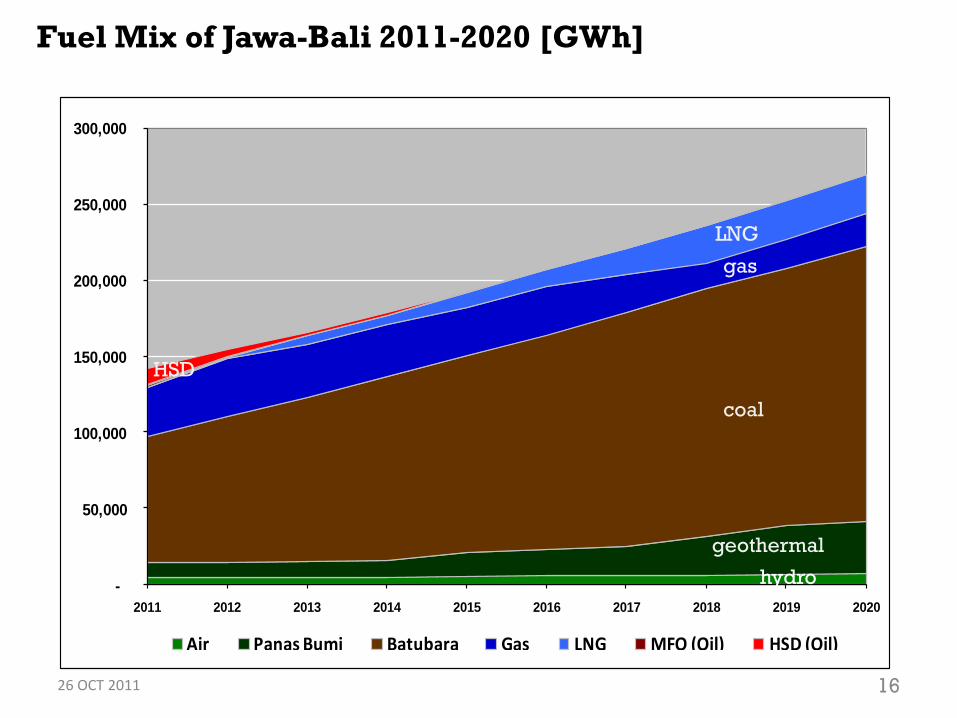
26 OCT 2011 16
Fuel Mix of Jawa-Bali 2011-2020 [GWh]
Geothermal
HSD MFO
-
50,000
100,000
150,000
200,000
250,000
300,000
2011 2012 2013 2014 2015 2016 2017 2018 2019 2020
Air Panas Bumi Batubara Gas LNG MFO (Oil) HSD (Oil)
coal
gas
geothermal
hydro
HSD
LNG
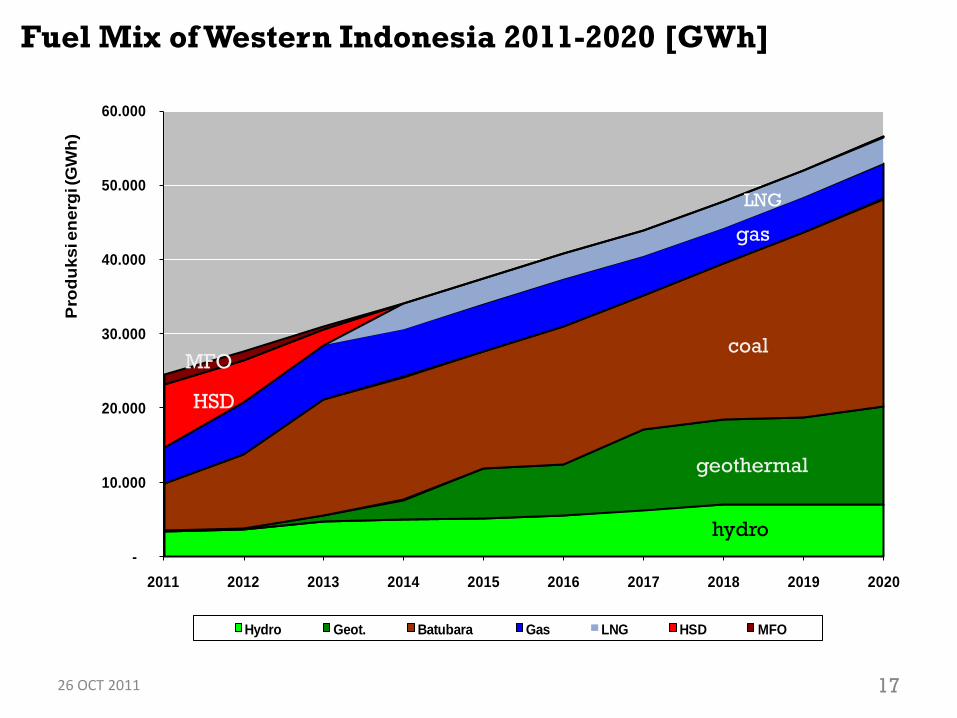
26 OCT 2011 17
Fuel Mix of Western Indonesia 2011-2020 [GWh]
HSD MFO
coal
gas
geothermal
HSD
MFO
-
10.000
20.000
30.000
40.000
50.000
60.000
2011 2012 2013 2014 2015 2016 2017 2018 2019 2020
Pro
du
ks
i en
erg
i (G
Wh
)
Hydro Geot. Batubara Gas LNG HSD MFO
LNG
coal
gas
geothermal
hydro
HSD
MFO
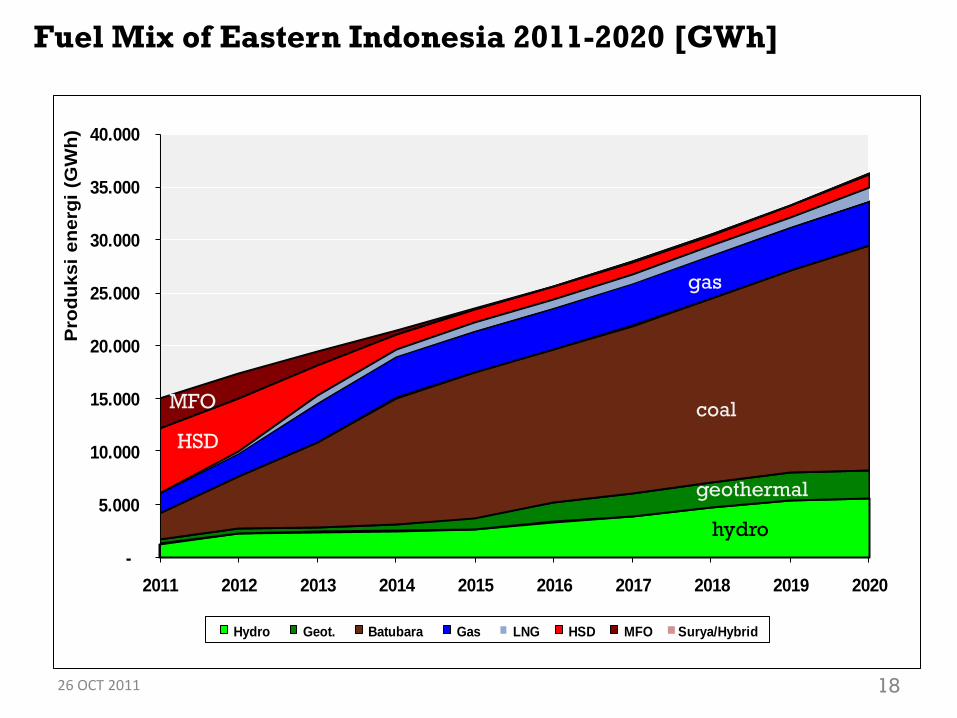
26 OCT 2011 18
Fuel Mix of Eastern Indonesia 2011-2020 [GWh]
Geothermal
Hydro
LNG
HSD MFO
-
5.000
10.000
15.000
20.000
25.000
30.000
35.000
40.000
2011 2012 2013 2014 2015 2016 2017 2018 2019 2020
Pro
du
ksi
en
erg
i (G
Wh
)
Hydro Geot. Batubara Gas LNG HSD MFO Surya/Hybrid
coal
gas
geothermal
hydro
HSD
MFO
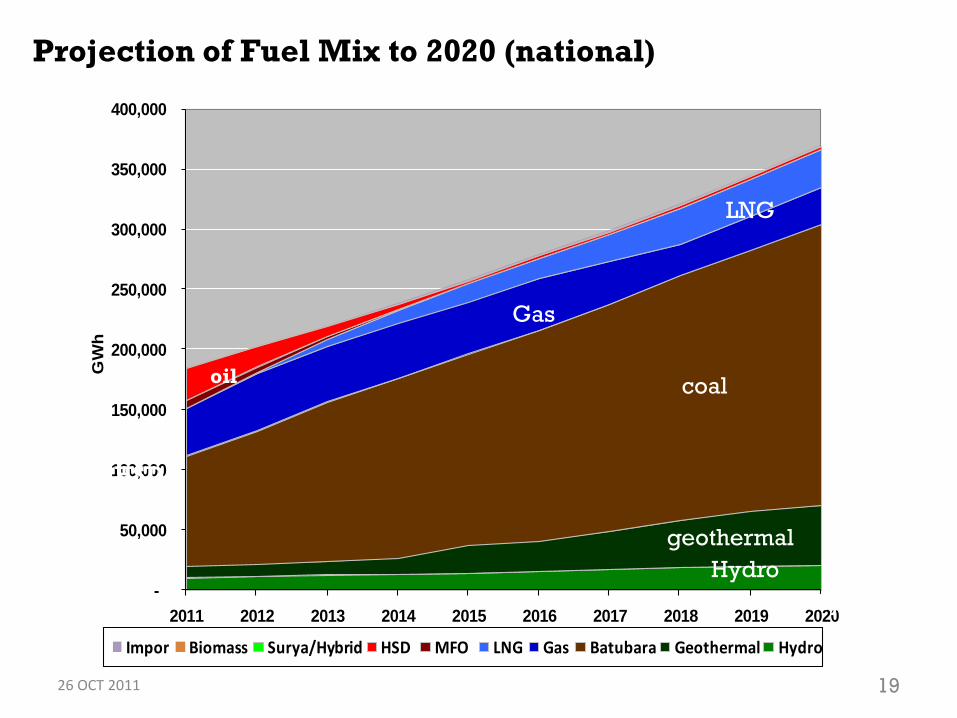
26 OCT 2011 19
-
50,000
100,000
150,000
200,000
250,000
300,000
350,000
400,000
2011 2012 2013 2014 2015 2016 2017 2018 2019 2020
GW
h
Impor Biomass Surya/Hybrid HSD MFO LNG Gas Batubara Geothermal Hydro
Hydro
HSD
Gas
LNG
coal
geothermal
Hydro
oil
Projection of Fuel Mix to 2020 (national)
26 OCT 2011 20
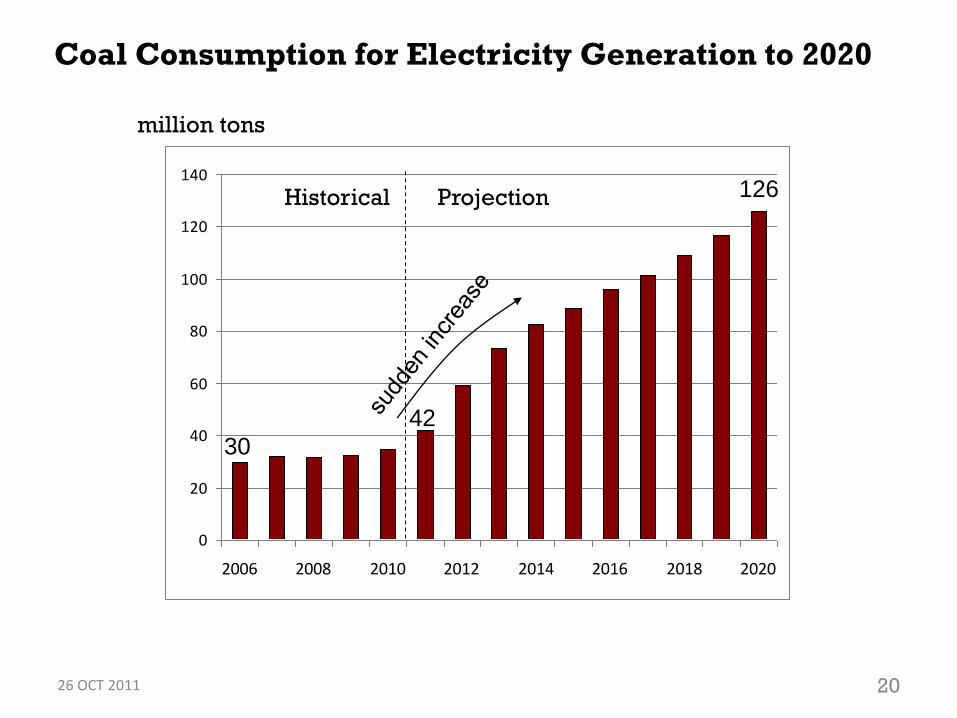
Coal Consumption for Electricity Generation to 2020
million tons
0
20
40
60
80
100
120
140
2006 2008 2010 2012 2014 2016 2018 2020
Historical Projection 126
42
30
26 OCT 2011 21
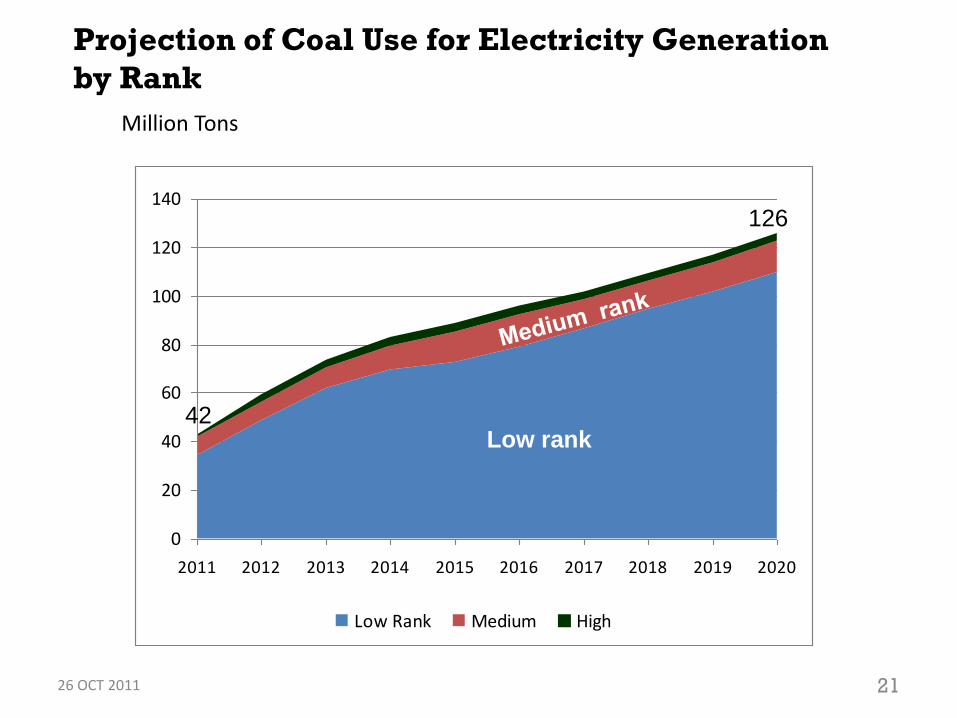
Projection of Coal Use for Electricity Generation
by Rank
Million Tons
0
20
40
60
80
100
120
140
2011 2012 2013 2014 2015 2016 2017 2018 2019 2020
Low Rank Medium High
Low rank
126
42
26 OCT 2011 22
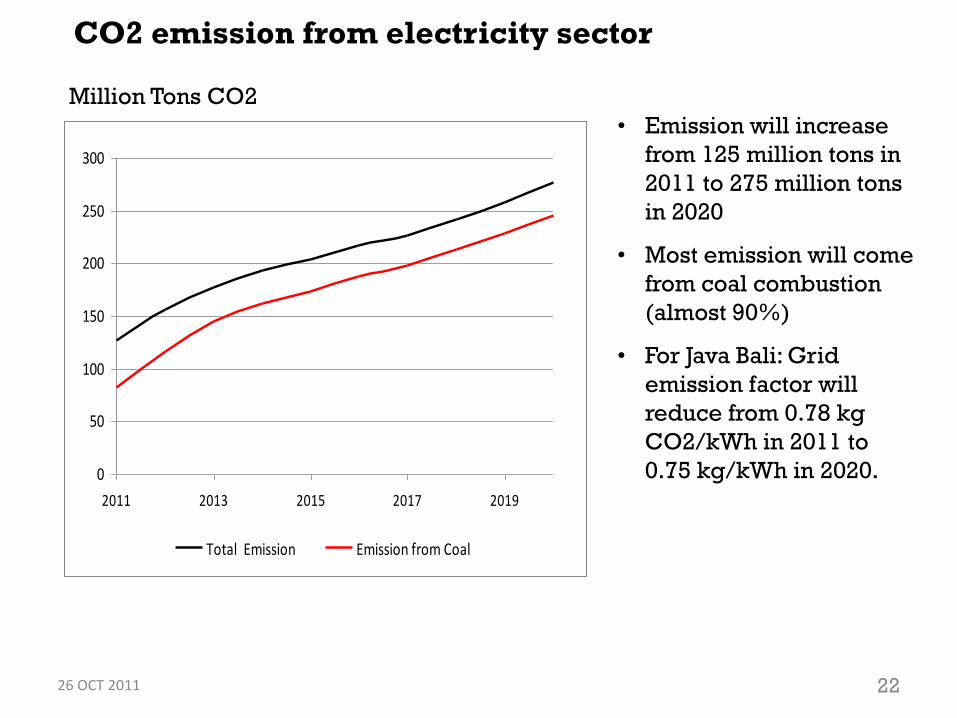
CO2 emission from electricity sector
0
50
100
150
200
250
300
2011 2013 2015 2017 2019
Total Emission Emission from Coal
Million Tons CO2
• Emission will increase
from 125 million tons in
2011 to 275 million tons
in 2020
• Most emission will come
from coal combustion
(almost 90%)
• For Java Bali: Grid
emission factor will
reduce from 0.78 kg
CO2/kWh in 2011 to
0.75 kg/kWh in 2020.
26 OCT 2011 23
Cleaner Use of Low Rank Coal
• Indonesia‟s power sector can be mistakenly regarded as more
concern about growth and use of indigenous coal than concern
about global climate challenge.
• However, Indonesia would actually do better than just „grow first –
cleanup later’ , it is seen from the fact that Indonesia have plan to
develop large scale geothermal and small-medium-large scale
hydro power, as well as clean coal technology.
• PLN in its 10-year power development plan to 2020 set a policy
that only SC/USC coal plants will be developed in Java for better
efficiency and lower CO2 emissions.
• Gov of Indonesia (MEMR) and gov of Japan (JICA) are carrying
out a project study “Promotion of Clean Coal Technology (CCT)
inn Indonesia” from April 2011 to be completed by May 2012. The
CCT study team consists of Chubu Electric, JPower and Jcoal, with
MEMR and PLN as counterpart team.
26 OCT 2011 24
Roadmap of CCT in Indonesia *)
• After assessing relevant factors (technical availability, low rank
coal availability, economic viability, technical challenges in
introducing CCT and contribution to GHG emission reduction),
the CCT study concludes that the CCT technology that can be
adopted by Indonesia are USC and IGCC.
• USC is commercially matured, already proven and well
performed in many countries, can use low rank coal having
above average ash melting point, has economic merit to SubC
and SC, produces lower CO2 emissions.
• IGCC is a promising technology, yet not commercially matured,
can use low rank coal with low ash melting point, its project cost
is expected to drop and make it economical compared to SC and
USC, lower CO2 emission than SC and USC.
*) Source: The Project for Promotion of Clean Coal Technology (CCT) in Indonesia, Interim
Report, October 2011, Jakarta, JICA Study Team.
26 OCT 2011 25
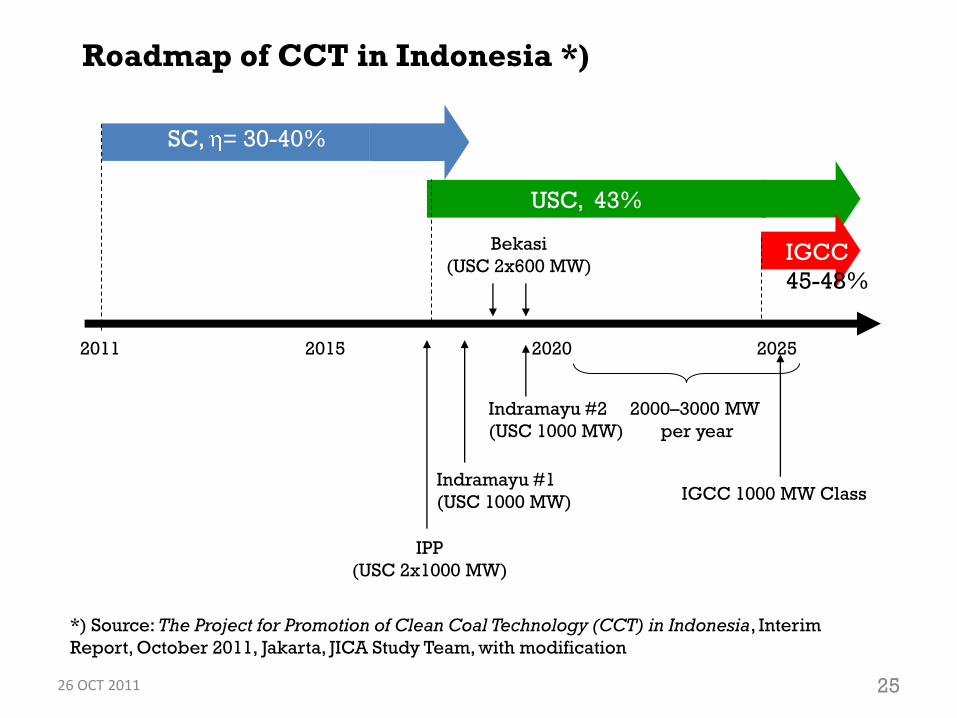
Roadmap of CCT in Indonesia *)
*) Source: The Project for Promotion of Clean Coal Technology (CCT) in Indonesia, Interim
Report, October 2011, Jakarta, JICA Study Team, with modification
2011 2015 2020 2025
SC, = 30-40%
USC, 43%
IGCC
45-48%
IPP
(USC 2x1000 MW)
Indramayu #1
(USC 1000 MW)
Indramayu #2
(USC 1000 MW)
Bekasi
(USC 2x600 MW)
2000–3000 MW
per year
IGCC 1000 MW Class
26 OCT 2011 26
New Framework for International Cooperation in
Emission Reduction
CDM:
• Well established, within the framework of the UN
• Lengthy process, limited target areas
Copenhagen Accord (COP15):
• Opens new approach by nations, independent of UN
• Emission reduction from high efficiency CCT is creditable
• Bilateral Offset Mechanism proposed by Japan is one of the new
crediting mechanisms, but to be well accepted by Indonesia, the
mechanism should be of balanced engagement between sellers and
buyers, including in pricing. In addition, the National Council for
Climate Change of Indonesia has not endorsed the mechanism until
there is an „umbrella‟ agreement between GOI and GOJ.
• Japanese private companies seem active to carry out feasibility studies
assessing the market in Indonesia, but no pricing indication is clarified.
• More dialogues are needed for better understanding of the mechanism.
26 OCT 2011 27
Hydro
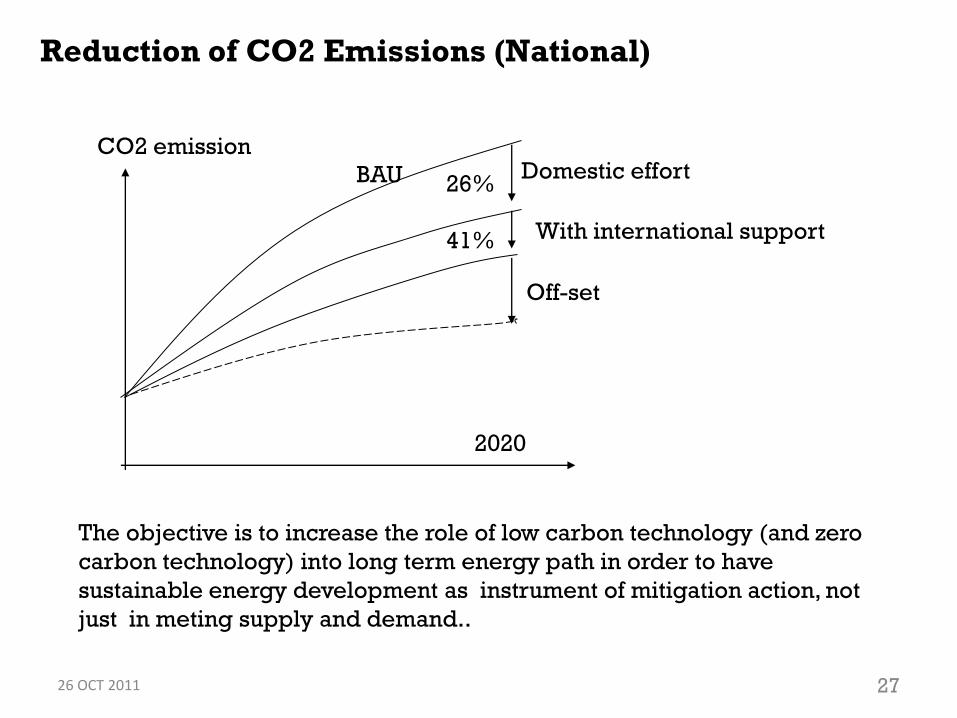
Reduction of CO2 Emissions (National)
The objective is to increase the role of low carbon technology (and zero
carbon technology) into long term energy path in order to have
sustainable energy development as instrument of mitigation action, not
just in meting supply and demand..
Domestic effort
HSD
Gas
LNG
coal
geothermal
Hydro
oil
BAU 26%
41% With international support
Off-set
CO2 emission
2020
26 OCT 2011 28
Hydro
Conclusions
• PLN welcomes all kinds of RE, but the RE that can contribute significantly to
the fuel mix for electricity generation are geothermal and hydro power;
• PLN would like to see those large scale geothermal and hydro power
developed a.s.a.p, however, their development apparently would need
longer lead time;
• Having sizable coal resources, it is natural if Indonesia plan to use more
coal in the fuel mix of electricity generation.
• The type of coal that would used more in electricity generation Indonesia
is low rank coal, due to plentiful availability in Kalimantan and Sumatera
and more economical, thus securing more stable supply, whilst most high
rank coal would be exported to global market.
• Yet Indonesia is committed to adopt cleaner coal technology. PLN plans
only USC CFPP in Java, and adopting IGCC as soon as it is commercially
matured, hopefully not in too distant future.
• Some Indonesians are not very familiar with Bilateral Offset Mechanism as
a crediting scheme, more dialogues are needed.
26 OCT 2011 29
1. Introduction.
2. CO2 Emission Sources in Indonesia: (i) Oil and Gas Industry, and (ii)
Power Sector.
3. Capture Technology.
4. Transportation Technology.
5. Methodology for Sites Selection: (i) Non-EOR, and (ii) NOR.
6. Geological Potential Storage .
7. CCS Regulatory Framework and Enabling Policies.
8. Conclusions and Recommendations.
Understanding CCS Potential in Indonesia
British Embassy
Jakarta
KOMITE NASIONAL
INDONESIA
PT PLN (PERSERO)
http://www.worldenergy.org/work_programme/technical_programme/technical_c
ommittees/cleaner_fossil_fuel_systems/default.asp
26 OCT 2011 30
A study into the potential for Indonesia to implement CCS has been
undertaken by the CCS Study Working Group. The Working Group comprises
the Agency for Oil and Gas Research Development (LEMIGAS) of the Ministry
of Energy and Mineral Resources of Indonesia, Indonesian National
Committee – World Energy Council (KNI-WEC), PT PLN (Persero) – Indonesia
State Electricity Corporation, Ministry of Enviroment of Indonesia, Royal Dutch
Shell and UK Embassy.
The purpose of this study is to develop an understanding of the requirements
associated with deploying Carbon Capture and Geological Storage in
Indonesia by addressing technical, commercial and regulatory aspects of
CCS deployment to further stimulate the on-going dialogue on potential
application of such technology in Indonesia.
This assessment of carbon capture and storage feasibility in Indonesia
focuses on a number of factors. These factors include both technical aspects
(e.g. geological storage potential, CO2 capture from industrial sources) and
non-technical issues (e.g. regulatory framework on CCS implementation,
business opportunity).
The Purpose of the Study
26 OCT 2011 31
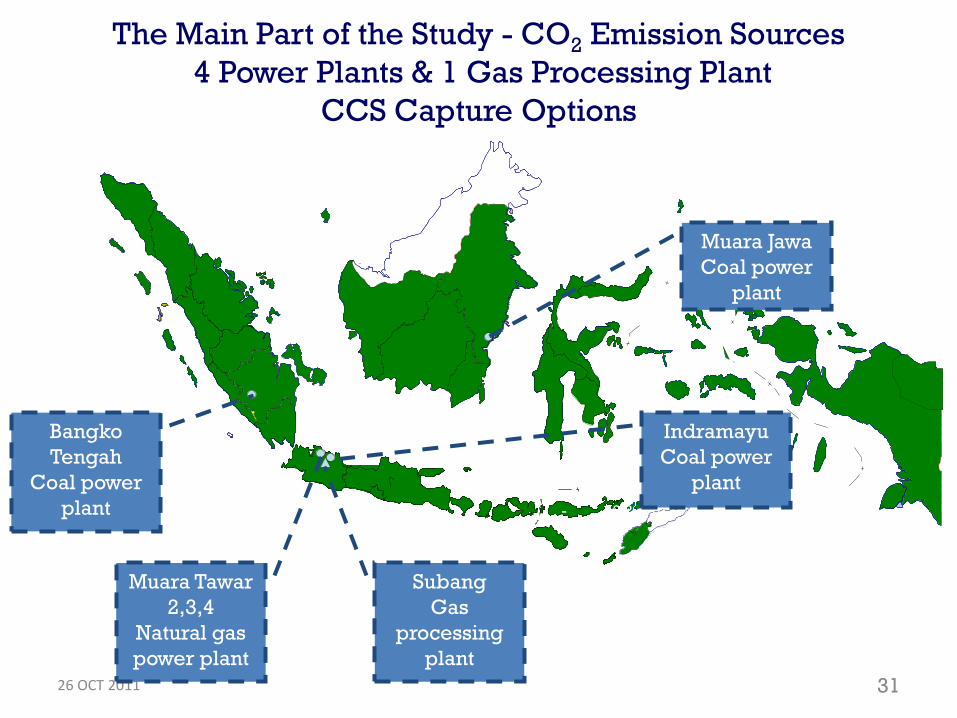
The Main Part of the Study - CO2 Emission Sources
4 Power Plants & 1 Gas Processing Plant
CCS Capture Options
GUU
U
Plant
2
(2008-2018): 6.2 x 1062
GUU
GUU
U
Plant
2
- : 6.2 x 10 2
Bangko
Tengah
Coal power
plant
Muara Jawa
Coal power
plant
Subang
Gas
processing
plant
Indramayu
Coal power
plant
Muara Tawar
2,3,4
Natural gas
power plant
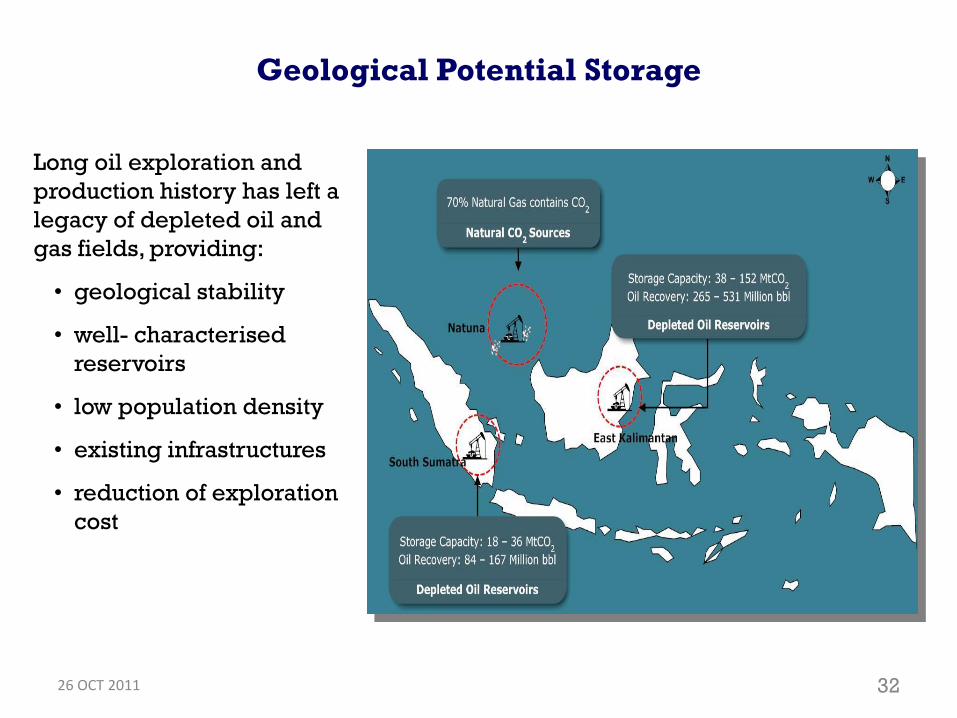
26 OCT 2011 32
Long oil exploration and
production history has left a
legacy of depleted oil and
gas fields, providing:
• geological stability
• well- characterised
reservoirs
• low population density
• existing infrastructures
• reduction of exploration
cost
Geological Potential Storage

26 OCT 2011 33
CO2
Sources
Geological Potential
Storage Location
Pipeline
Distance
(Km)
Estimated Avoided
Cost (US$/tCO2)
Indramayu
1000 MW
Steam Coal Power Plant
South Sumatra region
(onshore)655
62.1
(versus 1000 MW
plant without
capture)
Muara Tawar
750 MW
NGCC Power Plant
North Jawa sea
(offshore)15
71.4
(versus NGCC
without capture)
Bangko Tengah
600 MW
Steam Coal Power Plant
South Sumatra region
(onshore)60
56.2
(versus 600 MW plant
without capture)
Muara Jawa
100 MW
Steam Coal Power Plant
East Kalimantan
region
(onshore)
60
76.3
(versus 100 MW plant
without capture)
Subang Field
Natural Gas Processing Plant
North Jawa sea
(offshore)79.7
10.7
(cost of compressing)
CO2 Sources, Geological Potential Storage
Locations & Estimated Avoided Costs
26 OCT 2011 34
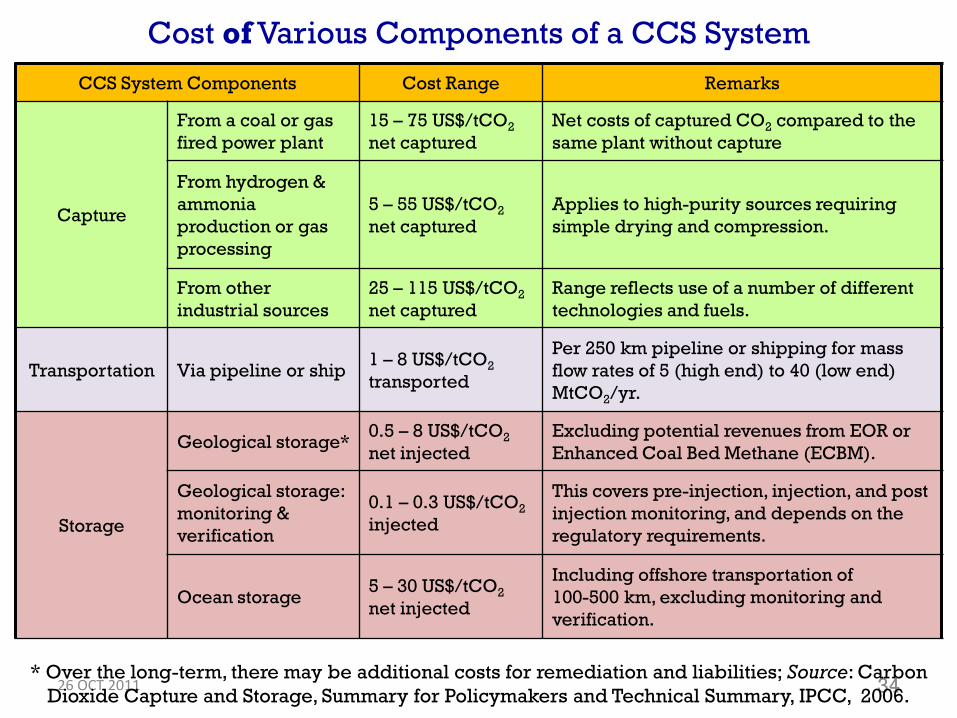
Cost of Various Components of a CCS System
CCS System Components Cost Range Remarks
Capture
From a coal or gas
fired power plant
15 – 75 US$/tCO2
net captured
Net costs of captured CO2 compared to the
same plant without capture
From hydrogen &
ammonia
production or gas
processing
5 – 55 US$/tCO2
net captured
Applies to high-purity sources requiring
simple drying and compression.
From other
industrial sources
25 – 115 US$/tCO2
net captured
Range reflects use of a number of different
technologies and fuels.
Transportation Via pipeline or ship1 – 8 US$/tCO2
transported
Per 250 km pipeline or shipping for mass
flow rates of 5 (high end) to 40 (low end)
MtCO2/yr.
Storage
Geological storage*0.5 – 8 US$/tCO2
net injected
Excluding potential revenues from EOR or
Enhanced Coal Bed Methane (ECBM).
Geological storage:
monitoring &
verification
0.1 – 0.3 US$/tCO2
injected
This covers pre-injection, injection, and post
injection monitoring, and depends on the
regulatory requirements.
Ocean storage5 – 30 US$/tCO2
net injected
Including offshore transportation of
100-500 km, excluding monitoring and
verification.
* Over the long-term, there may be additional costs for remediation and liabilities; Source: Carbon
Dioxide Capture and Storage, Summary for Policymakers and Technical Summary, IPCC, 2006.
26 OCT 2011 35
Indonesia has several promising options for CCS application considering
its variety of CO2 sources and availability of geological storage
International funding and support in collaborative approach will be
required to render at least fully integrated industrial-scale CCS
demonstration project in developing countries in providing financial
assistance together with the government with appropriate policies,
measures and/or instruments.
Concerns such as long-term liability and project boundaries, as well as
developing robust regulatory framework will need to be addressed
among others through proper demonstration projects
Assessment of potential sites and confirmation of the geological storage of
CO2
Assessment of reasonable routes to geological CO2 storage
An estimate of cost impacts of essential capture-ready measures, such as
modifications to plant design and changes in ongoing running costs*)
Environmental considerations, reviewing and highlighting any potential
impacts associated with capture-ready plants and retrofitting
Conclusions
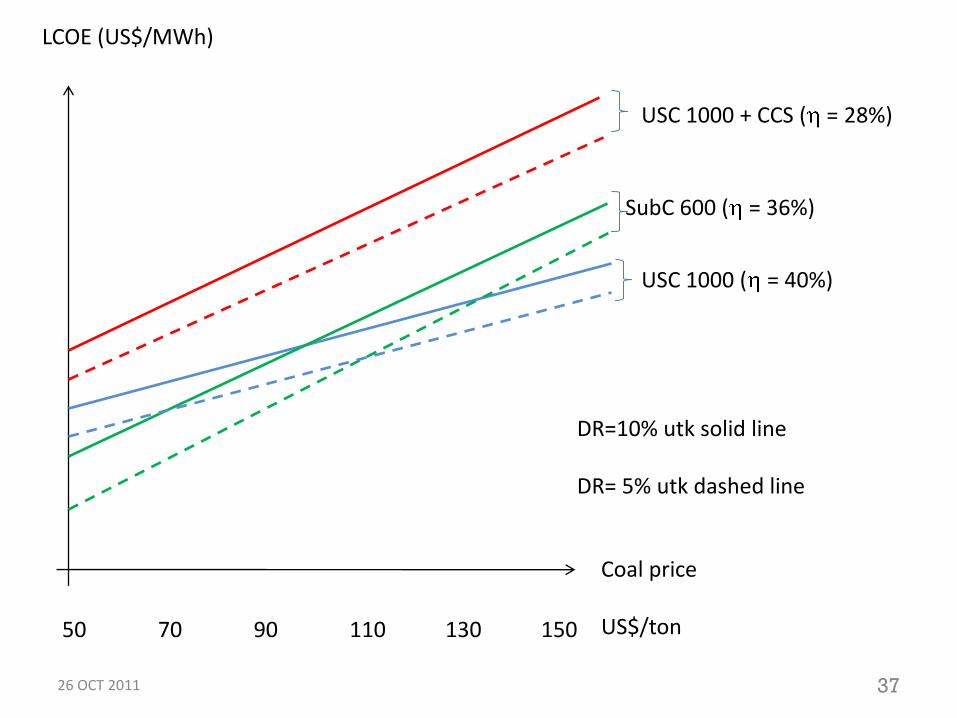
26 OCT 2011 37
Coal price
US$/ton50 70 90 110 130 150
LCOE (US$/MWh)
USC 1000 ( = 40%)
SubC 600 ( = 36%)
DR=10% utk solid line
DR= 5% utk dashed line
USC 1000 + CCS ( = 28%)

26 OCT 2011 38
Optimization Results:
Configuration of Power Generation (by Technology)
0
20000
40000
60000
80000
100000
120000
140000
160000B
ase
lin
e
Sce
na
rio
1
Sce
na
rio
2
Sce
na
rio
3
Ba
se
lin
e
Sce
na
rio
1
Sce
na
rio
2
Sce
na
rio
3
Ba
se
lin
e
Sce
na
rio
1
Sce
na
rio
2
Sce
na
rio
3
Ba
se
lin
e
Sce
na
rio
1
Sce
na
rio
2
Sce
na
rio
3
PLTP PLTN PLTU PLTU USC PLTU+CCS PLTU AUSC IGCC
IGCC+CCS PLTGU GAS PLTGU LNG PLTG PLTD PLTA PS
2020
2011
2030
2040
US
CA
US
CS
ub
C
NP
P
LN
G
USC+CCS
MW
IGCC+CCS
$0 $25 $50 $75 $0 $25 $50 $75 $0 $25 $50 $75 $0 $25 $50 $75