Embed Size (px)
Citation preview

Ecosystems
Learning Objectives https://www.learner.org/courses/envsci/unit/text.php?unit=4&secNum=1
http://www.windows2universe.org/earth/ecosystems.html
Distinguish a food chain from a food web. Be able to draw and interpret a food web. Summarize the roles of producers, herbivores, and carnivores in a food web.
How do the grasshopper and the grass interact?
Grasshoppers don't just hop on the grass. They also eat the grass. Other organisms also eat the grass, and some animals even eat the grasshopper. These interactions can be visualized by drawing a food web.
Food Webs Energy must constantly flow through an ecosystem for the system to remain
stable. What exactly does this mean? Essentially, it means that organisms must eat other organisms. Food chains (Figure below) show the eating patterns in an ecosystem. Food energy flows from one organism to another. Arrows are used to show the feeding relationship between the animals. The arrow points from the organism being eaten to the organism that eats it. For example, an arrow from a plant to a grasshopper shows that the grasshopper eats the leaves. Energy and nutrients are moving from the plant to the grasshopper. Next, a bird might prey on the grasshopper, a snake may eat the bird, and then an owl might eat the snake. The food chain would be:
plant → grasshopper → bird → snake → owl. A food chain cannot continue to go on and on. For example the food chain
could not be: plant → grasshopper → spider → frog → lizard → fox → hawk. Food chains only have 4 or 5 total levels. Therefore, a chain has only 3 or 4
levels for energy transfer.

This food chain includes producers and consumers. How could you add decomposers to the food chain?
In an ocean ecosystem, one possible food chain might look like this: phytoplankton → krill → fish → shark. The producers are always at the beginning of the food chain, bringing energy into the ecosystem. Through photosynthesis, the producers create their own food in the form of glucose, but also create the food for the other organisms in the ecosystem. The herbivores come next, then the carnivores. When these consumers eat other organisms, they use the glucose in those organisms for energy. In this example, phytoplankton are eaten by krill, which are tiny, shrimp-like animals. The krill are eaten by fish, which are then eaten by sharks. Could decomposers be added to a food chain?
Each organism can eat and be eaten by many different types of organisms, so simple food chains are rare in nature. There are also many different species of fish and sharks. So a food chain cannot end with a shark; it must end with a distinct species of shark.
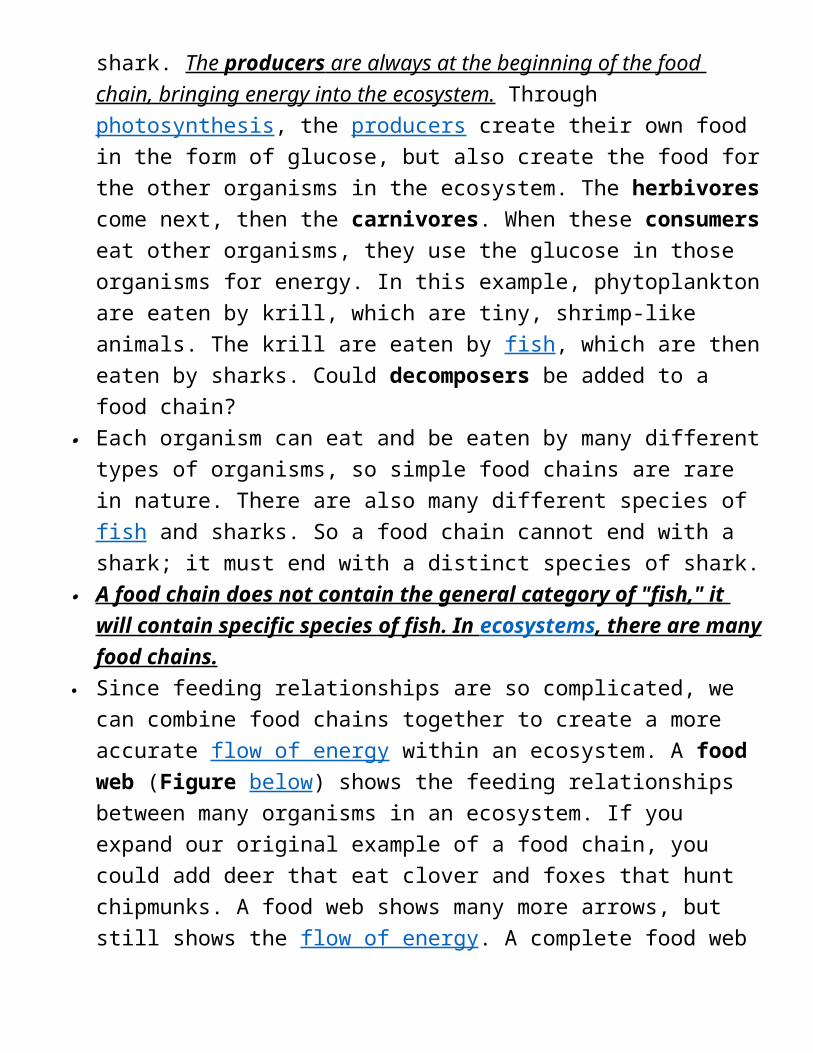
A food chain does not contain the general category of "fish," it will contain specific species of fish. In ecosystems , there are many food chains.
Since feeding relationships are so complicated, we can combine food chains together to create a more accurate flow of energy within an ecosystem. A food web (Figure below) shows the feeding relationships between many organisms in an ecosystem. If you expand our original example of a food chain, you could add deer that eat clover and foxes that hunt chipmunks. A food web shows many more arrows, but still shows the flow of energy. A complete food web may show hundreds of different feeding relationships.
For more information on food chains, see A Million Sharks at https://www.youtube.com/watch?v=QXMTzXaWJyk. Must see!
Food web in the Arctic Ocean.
http://www.ck12.org/life-science/Ecosystems-in-Life-Science/lecture/How-Ecosystems-Work/?referrer=concept_details
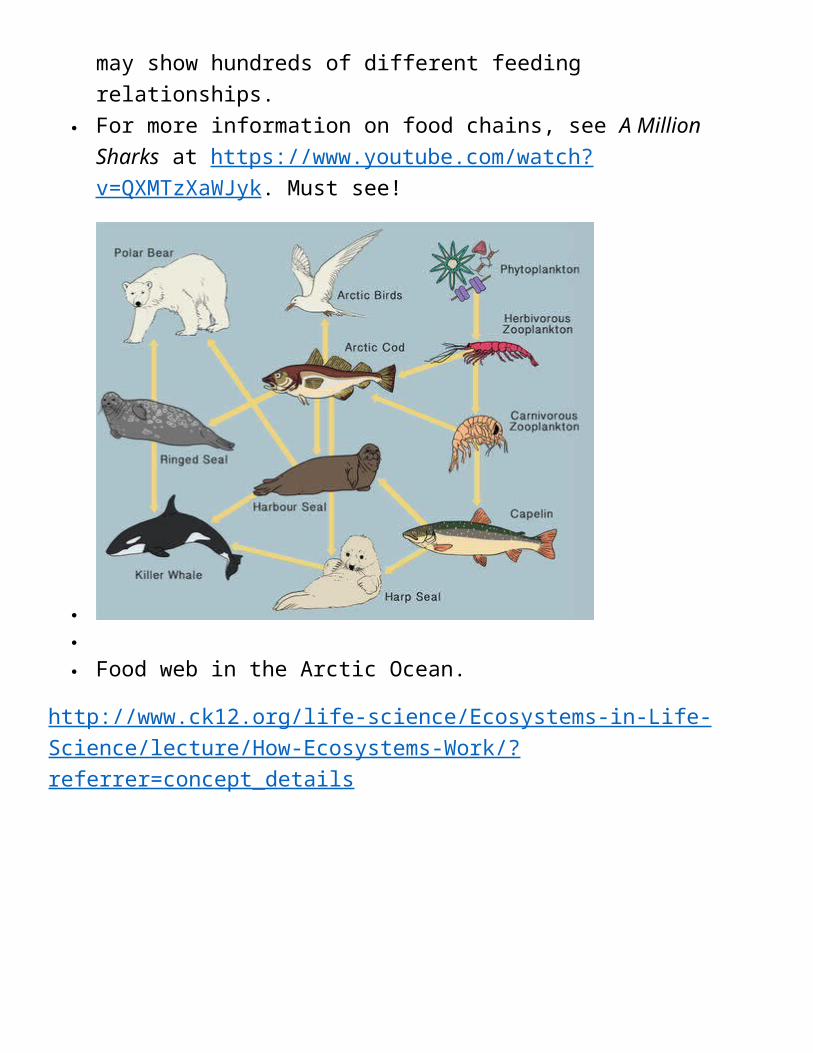
Energy and nutrient transfer through ecosystems
Nutrients (shown by light arrows) cycle through ecosystems in a closed loop, while energy (shown by dark arrows) is released at each stage.
Ecosystems maintain themselves by cycling energy and nutrients obtained from external sources. At the first trophic level, primary producers (plants, algae, and some bacteria) use solar energy to produce organic plant material through photosynthesis. Herbivores—animals that feed solely on plants—make up the second trophic level. Predators that eat herbivores comprise the third trophic level; if larger predators are present, they represent still higher trophic levels. Organisms that feed at several trophic levels (for example, grizzly bears that eat berries and salmon) are classified at the highest of the trophic levels at which they feed. Decomposers, which include bacteria, fungi, molds, worms, and insects, break down wastes and dead organisms and return nutrients to the soil.
On average about 10 percent of net energy production at one trophic level is passed on to the next level. Processes that reduce the energy transferred between trophic levels include respiration, growth and reproduction, defecation, and nonpredatory death (organisms that die but are not eaten by consumers).
The nutritional quality of material that is consumed also influences how efficiently energy is transferred, because consumers can convert high-quality food sources into new living tissue more efficiently than low-quality food sources.
The low rate of energy transfer between trophic levels makes decomposers generally more important than producers in terms of energy flow. Decomposers process large amounts of organic material and return nutrients to the ecosystem in inorganic form, which are then taken up again by primary producers. Energy is not recycled during decomposition, but rather is released, mostly as heat (this is what makes compost piles and fresh garden mulch warm). Figure 6 shows the flow of energy (dark arrows) and nutrients (light arrows) through ecosystems.
Figure 6. Energy and nutrient transfer through ecosystems

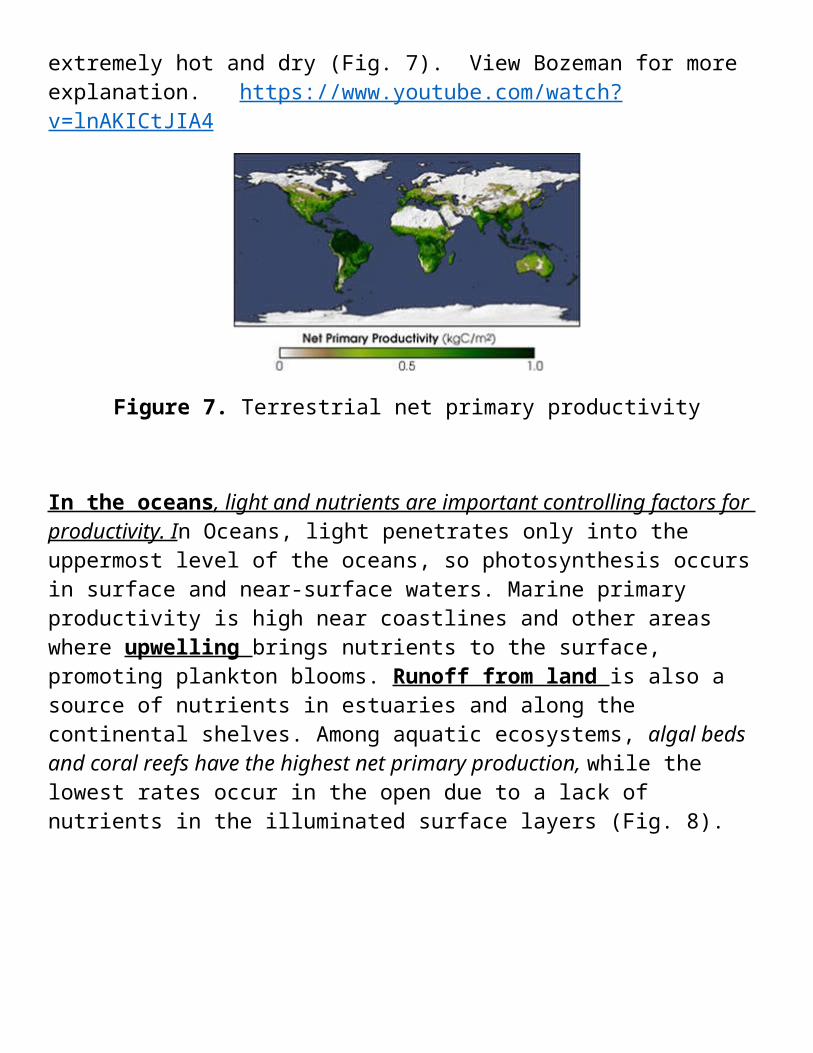
An ecosystem's gross primary productivity (GPP) is the total amount of organic matter that it produces through photosynthesis. Net primary productivity (NPP) describes the amount of energy that remains available for plant growth after subtracting the fraction that plants use for respiration. Productivity in land ecosystems generally rises with temperature up to about 30°C, after which it declines, and is positively correlated with moisture. On land primary productivity thus is highest in warm, wet zones in the tropics where tropical forest biomes are located. In contrast, desert scrub ecosystems have the lowest productivity because their climates are extremely hot and dry (Fig. 7). View Bozeman for more explanation. https://www.youtube.com/watch?v=lnAKICtJIA4
Figure 7. Terrestrial net primary productivity
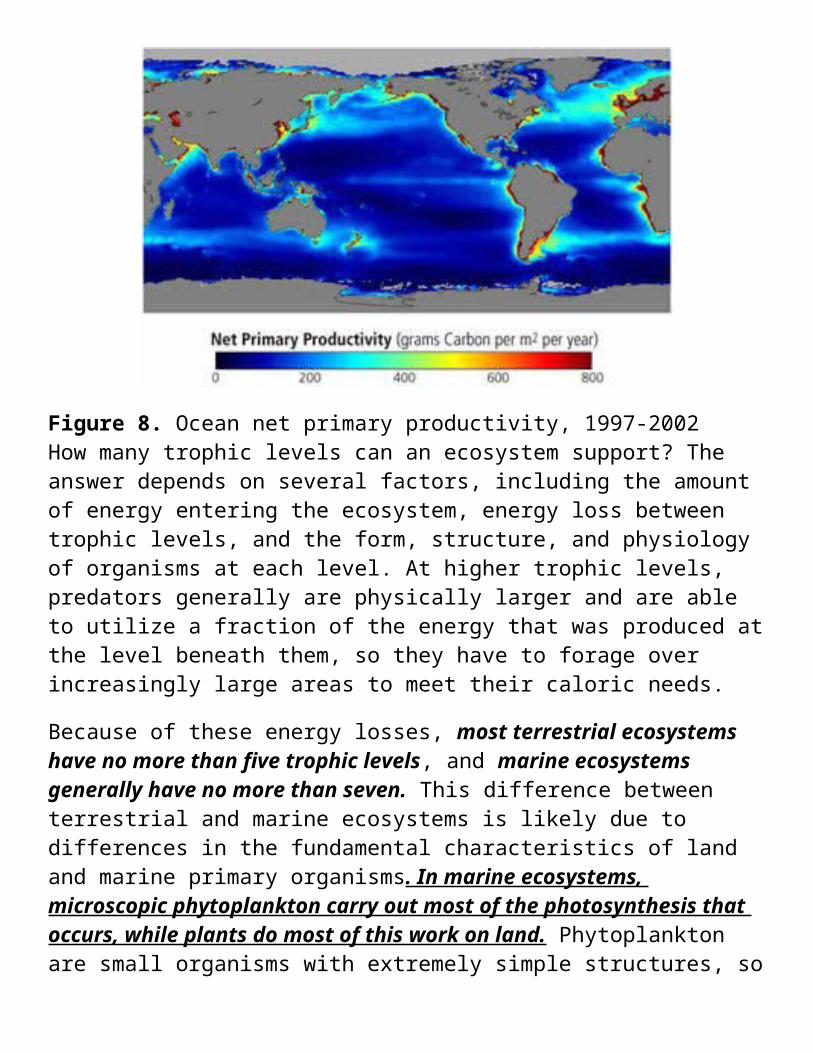
In the oceans , light and nutrients are important controlling factors for productivity. In Oceans, light penetrates only into the uppermost level of the oceans, so photosynthesis occurs in surface and near-surface waters. Marine primary productivity is high near coastlines and other areas where upwelling brings nutrients to the surface, promoting plankton blooms. Runoff from land is also a source of nutrients in estuaries and along the continental shelves. Among aquatic ecosystems, algal beds and coral reefs have the highest net primary production, while the lowest rates occur in the open due to a lack of nutrients in the illuminated surface layers (Fig. 8).

Figure 8. Ocean net primary productivity, 1997-2002How many trophic levels can an ecosystem support? The answer depends on several factors, including the amount of energy entering the ecosystem, energy loss between trophic levels, and the form, structure, and physiology of organisms at each level. At higher trophic levels, predators generally are physically larger and are able to utilize a fraction of the energy that was produced at the level beneath them, so they have to forage over increasingly large areas to meet their caloric needs.
Because of these energy losses, most terrestrial ecosystems have no more than five trophic levels, and marine ecosystems generally have no more than seven. This difference between terrestrial and marine ecosystems is likely due to differences in the fundamental characteristics of land and marine primary organisms. In marine ecosystems, microscopic phytoplankton carry out most of the photosynthesis that occurs, while plants do most of this work on land. Phytoplankton are small organisms with extremely simple structures, so most of their primary production is consumed and used for energy by grazing organisms that feed on them. In contrast, a large fraction of the biomass that land plants produce, such as roots, trunks, and branches, cannot be used by herbivores for food, so proportionately less of the energy fixed through primary production travels up the food chain.
Growth rates may also be a factor. Phytoplankton are extremely small but grow very rapidly, so they support large populations of herbivores even though there may be fewer algae than herbivores at any given moment. In contrast, land plants may take years to reach maturity, so an average carbon atom spends a longer residence time at the primary producer level on land than it does in a marine ecosystem. In addition, locomotion costs are generally higher for terrestrial organisms compared to those in aquatic environments.
The simplest way to describe the flux of energy through ecosystems is as a food chain in which energy passes from one trophic level to the next, without factoring in more complex relationships between individual species. Some very simple ecosystems may consist of a food chain with only a few trophic levels. For example, the ecosystem of the remote wind-swept Taylor Valley in Antarctica consists mainly of bacteria and. More commonly, however, producers and consumers are connected in intricate food webs with some consumers feeding at several trophic levels (Fig. 9).
Figure 9. Lake Michigan food web
An important consequence of the loss of energy between trophic levels is that contaminants collect in animal tissues—a process called bioaccumulation . As contaminants bioaccumulate up the food web, organisms at higher trophic levels can be threatened even if the pollutant is introduced to the environment in very small quantities.
The insecticide DDT, which was widely used in the United States from the 1940s through the 1960s, is a famous case of bioaccumulation. DDT built up in eagles and other raptors to levels high enough to affect their reproduction, causing the birds to lay thin-shelled eggs that broke in their nests. Fortunately, populations have rebounded over several decades since the pesticide was banned in the United States. However, problems persist in some developing countries where toxic bioaccumulating pesticides are still used.
Bioaccumulation can threaten humans as well as animals. For example, in the United States many federal and state agencies currently warn consumers to avoid or limit their consumption of large predatory fish that contain high levels of mercury, such as shark, swordfish, tilefish, and king mackerel, to avoid risking neurological damage and birth defects.
Biogeochemical Cycling in Ecosystems
Along with energy, water and several other chemical elements cycle through ecosystems and influence the rates at which organisms grow and reproduce. About 10 major nutrients and six trace nutrients are essential to all animals and plants, while others play important roles for selected species (footnote 3). The most important biogeochemical cycles affecting ecosystem health are the water, carbon, nitrogen, and phosphorus cycles.
As noted earlier, most of the Earth's area that is covered by water is ocean. In terms of volume, the oceans dominate further still: nearly all of Earth's water inventory is contained in the oceans (about 97 percent) or in ice caps and glaciers (about 2 percent), with the rest divided among groundwater, lakes, rivers, streams, soils, and the atmosphere. In addition, water moves very quickly through land ecosystems. These two factors mean that water's residence time in land ecosystems is generally short, on average one or two months as soil moisture, weeks or months in shallow groundwater, or up to six months as snow cover.
But land ecosystems process a lot of water: almost two-thirds of the water that falls on land as precipitation annually is transpired back into the atmosphere by plants, with the rest flowing into rivers and then to the oceans. Because cycling of water is central to the functioning of land ecosystems, changes that affect the hydrologic cycle are likely to have significant impacts on land ecosystems.

Both land and ocean ecosystems are important sinks for carbon, which is taken up by plants and algae during photosynthesis and fixed as plant tissue. Table 2 compares the quantities of carbon stored in Earth's major reservoirs.
Table 2. Global carbon storage. Source: NOAA, www.pmel.noaa.gov/co2/gif/globcar.png.
Location Amount (gigatons carbon)
Atmosphere 750
Land plants 610
Soil and detritus 1,500
Surface ocean 1,020
Intermediate and deep ocean 37,890
Sediments 78,000,000
Carbon cycles relatively quickly through land and surface-ocean ecosystems, but may remain locked up in the deep oceans or in sediments for thousands of years. The average residence time that a molecule of carbon spends in a terrestrial ecosystem is about 17.5 years, although this varies widely depending on the type of ecosystem: carbon can be held in old-growth forests for hundreds of years, but its residence time in heavily grazed ecosystems where plants and soils are repeatedly turned over may be as short as a few months.
Human activities, particularly fossil fuel combustion, emit significant amounts of carbon each year over and above the natural carbon cycle. Currently, human activities generate about 7 billion tons of carbon per year, of which 3 billion tons remain in the atmosphere. The balance is taken up in roughly equal proportions by oceans and land ecosystems. Identifying which ecosystems are absorbing this extra carbon and why this uptake is occurring are pressing questions for ecologists.
Currently, it is not clear what mechanisms are responsible for high absorption of carbon by land ecosystems. One hypothesis suggests that higher atmospheric CO2

concentrations have increased the rates at which plants carry out photosynthesis (so-called CO2 fertilization), but this idea is controversial. Controlled experiments have shown that elevated CO2 levels are only likely to produce short-term increases in plant growth, because plants soon exhaust available supplies of important nutrients such as nitrogen and phosphorus that also are essential for growth.
Nitrogen and phosphorus are two of the most essential mineral nutrients for all types of ecosystems and often limit growth if they are not available in sufficient quantities. (This is why the basic ingredients in plant fertilizer are nitrogen, phosphorus, and potassium, commonly abbreviated as NPK.) A slightly expanded version of the basic equation for photosynthesis shows how plants use energy from the sun to turn nutrients and carbon into organic compounds:
CO2 + PO4 (phosphate) + NO3 (nitrate) + H2O → CH2O, P, N (organic tissue) + O2
Because atmospheric nitrogen (N2) is inert and cannot be used directly by most organisms, microorganisms that convert it into usable forms of nitrogen play central roles in the nitrogen cycle. So-called nitrogen-fixing bacteria take inert nitrogen (N2) from the atmosphere and convert it to ammonia (NH4) nitrate (NO3) and another nitrogen compounds, which in turn are taken up by plants. Some of these bacteria live in mutualistic relationships on the roots of plants , mainly legumes (peas and beans), and provide nitrogen directly to the plants; farmers often plant these crops to restore nitrogen to depleted soils. At the back end of the cycle, decomposers break down dead organisms and wastes, converting organic materials to inorganic nutrients. Other bacteria carry out denitrification, breaking down nitrate to gain oxygen and returning gaseous nitrogen to the atmosphere (Fig. 9).

Figure 10. The nitrogen cycleSource: � U.S. Department of the Interior, National Park Service.
Human activities, including fossil fuel combustion, cultivation of nitrogen-fixing crops, and rising use of nitrogen fertilizer, are altering the natural nitrogen cycle. Together these activities add roughly as much nitrogen to terrestrial ecosystems each year as the amount fixed by natural processes; in other words, anthropogenic inputs are doubling annual nitrogen fixation in land ecosystems. The main effect of this extra nitrogen is over-fertilization of aquatic ecosystems. Excess nitrogen promotes algal blooms, which then deplete oxygen from the water when the algae die and decompose (for more details, see Unit 8, "Water Resources"). Additionally, airborne nitrogen emissions from fossil fuel combustion promote the formation of ground-level ozone, particulate emissions, and acid rain (for more details, see Unit 11, "Atmospheric Pollution").
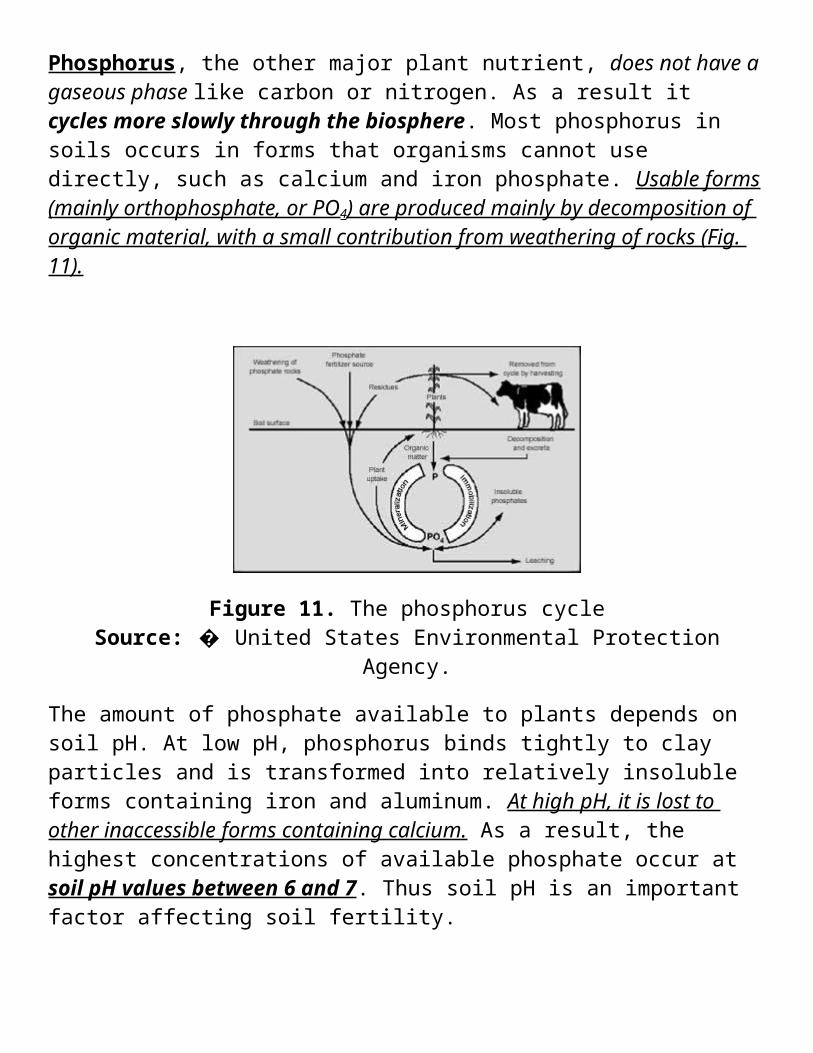
Phosphorus, the other major plant nutrient, does not have a gaseous phase like carbon or nitrogen. As a result it cycles more slowly through the biosphere. Most phosphorus in soils occurs in forms that organisms cannot use directly, such as calcium and iron phosphate. Usable forms (mainly orthophosphate, or PO4) are produced mainly by decomposition of organic material, with a small contribution from weathering of rocks (Fig. 11).
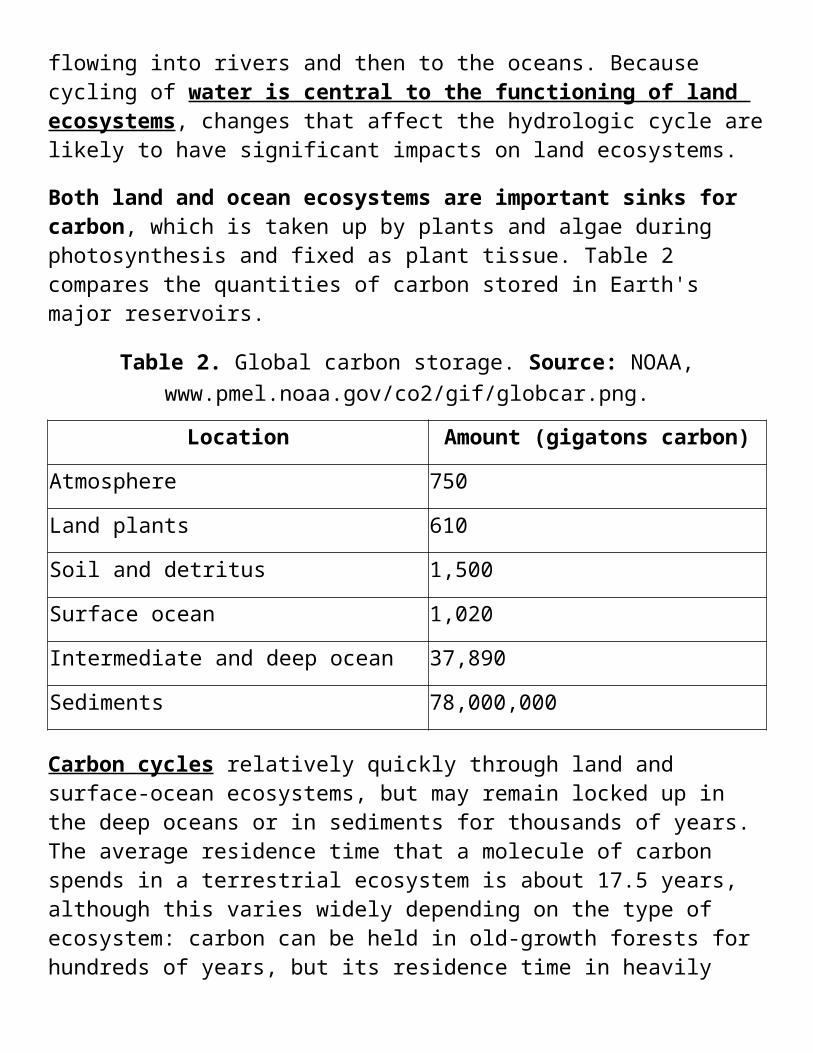
Figure 11. The phosphorus cycleSource: � United States Environmental Protection Agency.
The amount of phosphate available to plants depends on soil pH. At low pH, phosphorus binds tightly to clay particles and is transformed into relatively insoluble forms containing iron and aluminum. At high pH, it is lost to other inaccessible forms containing calcium. As a result, the highest concentrations of available phosphate occur at soil pH values between 6 and 7. Thus soil pH is an important factor affecting soil fertility.
Excessive phosphorus can also contribute to over-fertilization and eutrophication of rivers and lakes. Human activities that increase phosphorus concentrations in natural ecosystems include fertilizer use, discharges from wastewater treatment plants, and use of phosphate detergents
ECOLOGY
Ecology is the scientific study of relationships in the natural world. It includes relationships between organisms and their physical environments (physiological ecology); between organisms of the same species (population ecology); between organisms of different species (community ecology); and between organisms and the fluxes of matter and energy through biological systems (ecosystem ecology).
Ecologists study these interactions in order to understand the abundance and diversity of life within Earth's ecosystems—in other words, why there are so many plants and animals, and why there are so many different types of plants and animals (Fig. 1). To answer these questions they may use field measurements, such as counting and observing the behavior of species in their habitats; laboratory

experiments that analyze processes such as predation rates in controlled settings; or field experiments, such as testing how plants grow in their natural setting but with different levels of light, water, and other inputs. Applied ecology uses information about these relationships to address issues such as developing effective vaccination strategies, managing fisheries without over-harvesting, designing land and marine conservation reserves for threatened species, and modeling how natural ecosystems may respond to global climate change.
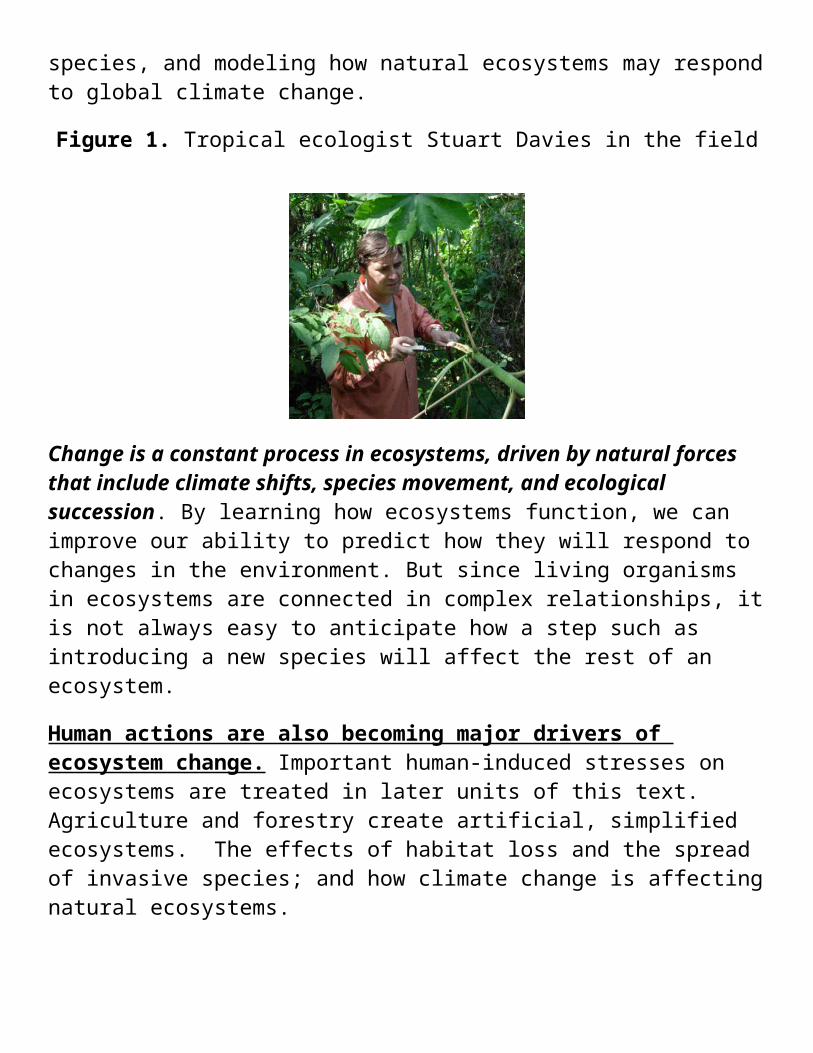
Figure 1. Tropical ecologist Stuart Davies in the field
Change is a constant process in ecosystems, driven by natural forces that include climate shifts, species movement, and ecological succession. By learning how ecosystems function, we can improve our ability to predict how they will respond to changes in the environment. But since living organisms in ecosystems are connected in complex relationships, it is not always easy to anticipate how a step such as introducing a new species will affect the rest of an ecosystem.
Human actions are also becoming major drivers of ecosystem change. Important human-induced stresses on ecosystems are treated in later units of this text. Agriculture and forestry create artificial, simplified ecosystems. The effects of habitat loss and the spread of invasive species; and how climate change is affecting natural ecosystems.
Geography has a profound impact on ecosystems because global circulation patterns and climate zones set basic physical conditions for the organisms that inhabit a given area. The most important factors are temperature ranges, moisture availability, light, and nutrient availability, which together determine what types of life are most likely to flourish in specific regions and what environmental challenges they will face.
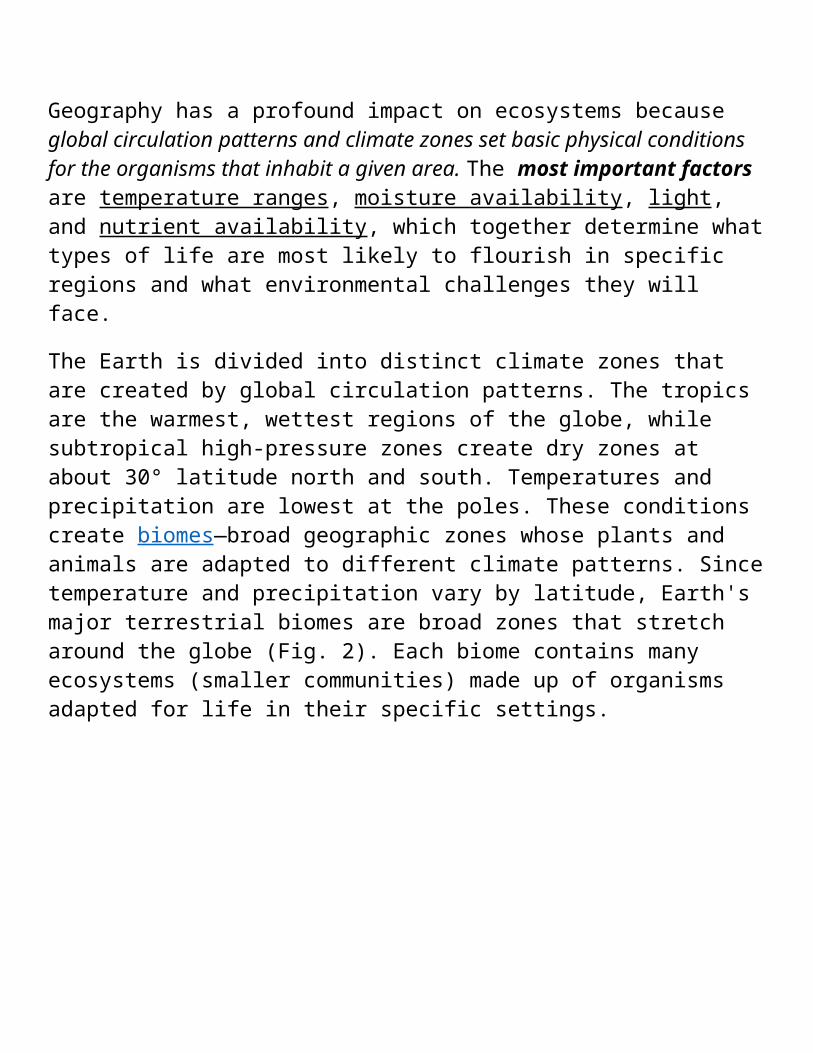
The Earth is divided into distinct climate zones that are created by global circulation patterns. The tropics are the warmest, wettest regions of the globe, while subtropical high-pressure zones create dry zones at about 30° latitude north and south. Temperatures and precipitation are lowest at the poles. These conditions create biomes—broad geographic zones whose plants and animals are adapted to different climate patterns. Since temperature and precipitation vary by latitude, Earth's major terrestrial biomes are broad zones that stretch around the globe (Fig. 2). Each biome contains many ecosystems (smaller communities) made up of organisms adapted for life in their specific settings.
Figure 2. Earth's major land biomesSource: � United States Department of Agriculture.
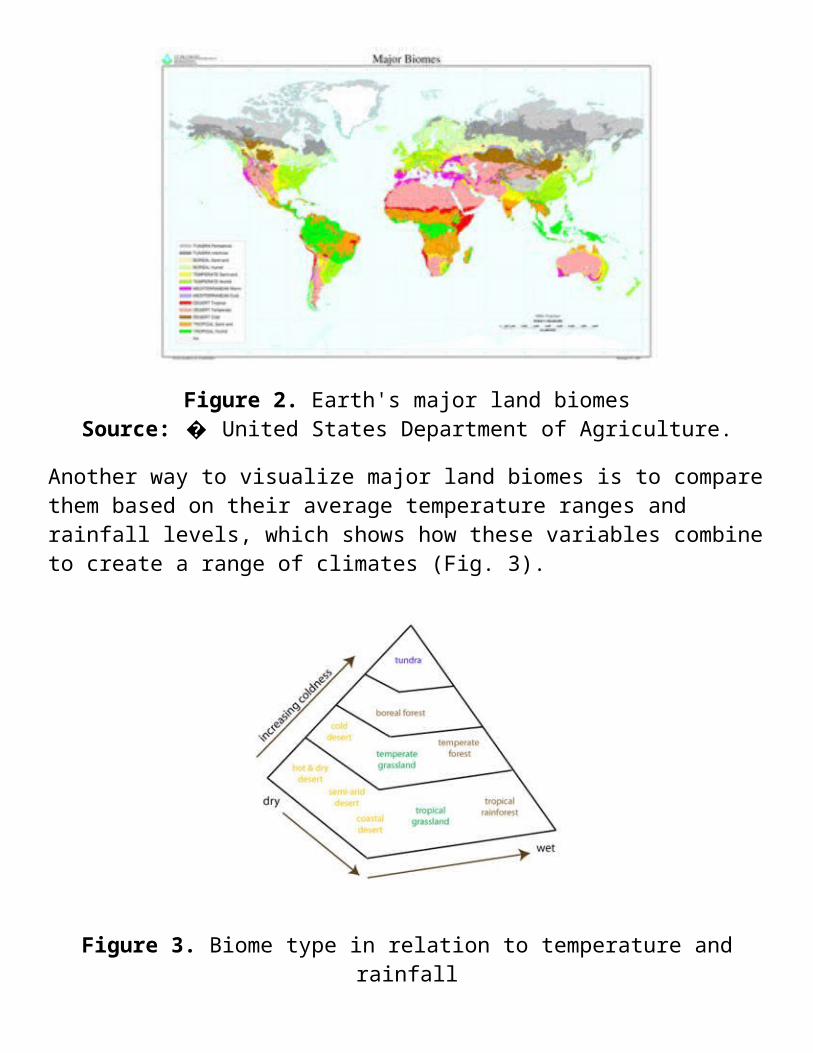
Another way to visualize major land biomes is to compare them based on their average temperature ranges and rainfall levels, which shows how these variables combine to create a range of climates (Fig. 3).
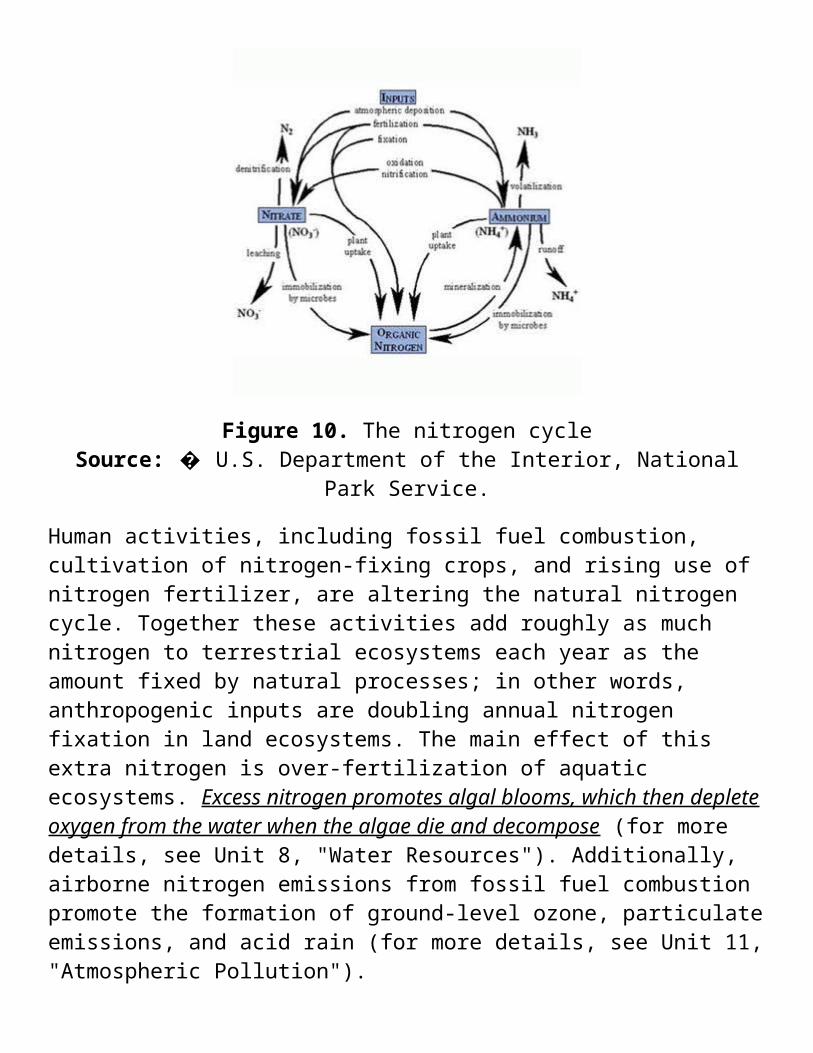
Figure 3. Biome type in relation to temperature and rainfall
Land biomes are typically named for their characteristic types of vegetation, which in turn influence what kinds of animals will live there. Soil characteristics also vary from one biome to another, depending on local climate and geology. Table 1 compares some key characteristics of three of the forest biomes.
Table 1. Forest biomes. Source: UC-Berkeley Museum of Paleontology, "The World's Biomes," http://www.ucmp.berkeley.edu/glossary/gloss5/biome/.
Forest type Temperature Precipitation Soil Flora
Tropical 20-25°C >200 cm/yrAcidic, low in nutrients
Diverse (up to 100 species/km2)
Temperate -30 to 30°C 75-150 cm/yrFertile, high in nutrients
3-4 tree species/km2
Boreal (taiga)
Very low40-100 cm/year, mostly snow
Thin, low in nutrients, acidic
Evergreens
Aquatic biomes (marine and freshwater) cover three-quarters of the Earth's surface and include rivers, lakes, coral reefs, estuaries, and open ocean (Fig. 4). Oceans account for almost all of this area. Large bodies of water (oceans and lakes) are stratified into layers: surface waters are warmest and contain most of the available light, but depend on mixing to bring up nutrients from deeper levels. The distribution of temperature, light, and nutrients set broad conditions for life in aquatic biomes in much the same way that climate and soils do for land biomes.
Marine and freshwater biomes change daily or seasonally. For example, in the intertidal zone where the oceans and land meet, areas are submerged and exposed as the tide moves in and out. During the winter months lakes and ponds can freeze over, and wetlands that are covered with water in late winter and spring can dry out during the summer months.
There are important differences between marine and freshwater biomes. The oceans occupy large continuous areas, while freshwater habitats vary in size from small ponds to lakes covering thousands of square kilometers. As a result, organisms that live in isolated and temporary freshwater environments must be adapted to a wide range of conditions and able to disperse between habitats when their conditions change or disappear.
Figure 4. Earth's marine and freshwater biomes
Since biomes represent consistent sets of conditions for life, they will support similar kinds of organisms wherever they exist, although the species in the communities in different places may not be taxonomically related. For example, large areas of Africa, Australia, South America, and India are covered by savannas (grasslands with scattered trees). The various grasses, shrubs, and trees that grow on savannas all are generally adapted to hot climates with distinct rainy and dry seasons and periodic fires, although they may also have characteristics that make them well-suited to specific conditions in the areas where they appear.
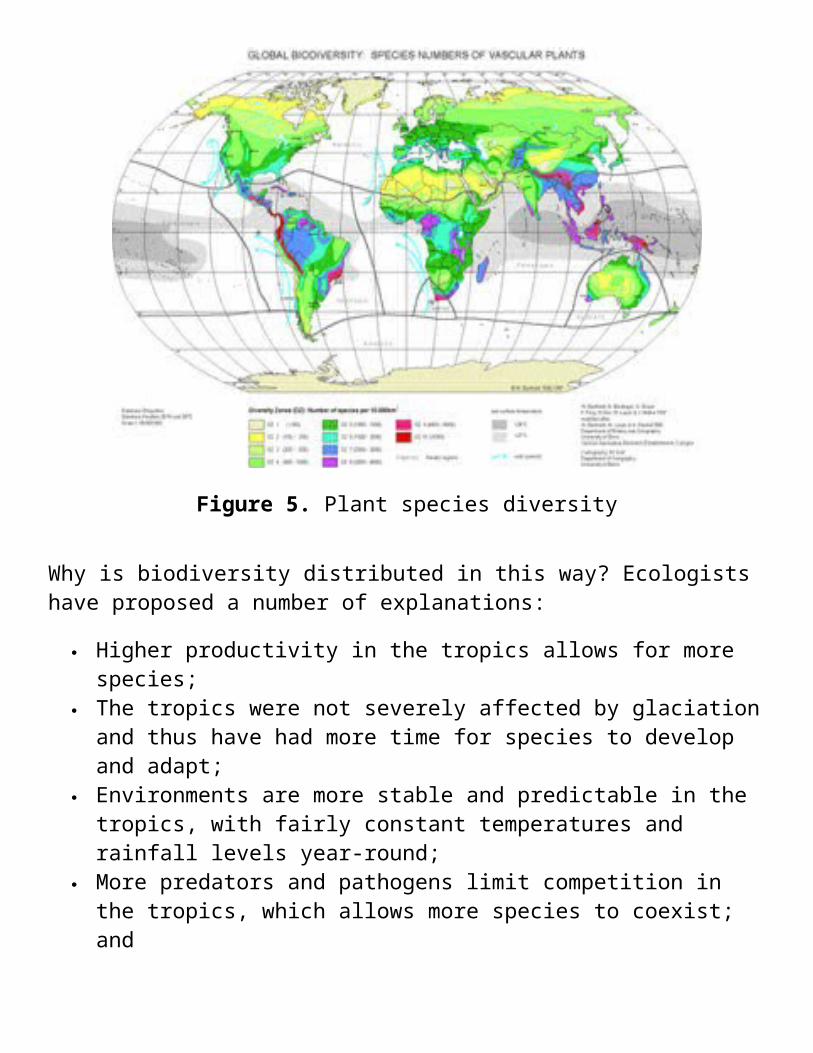
Species are not uniformly spread among Earth's biomes. Tropical areas generally have more plant and animal biodiversity than high latitudes, measured in species richness (the total number of species present). This pattern, known as the latitudinal biodiversity gradient, exists in marine, freshwater, and terrestrial ecosystems in both hemispheres. Figure 5 shows the gradient for plant species, but it also holds true for animals.
Figure 5. Plant species diversity
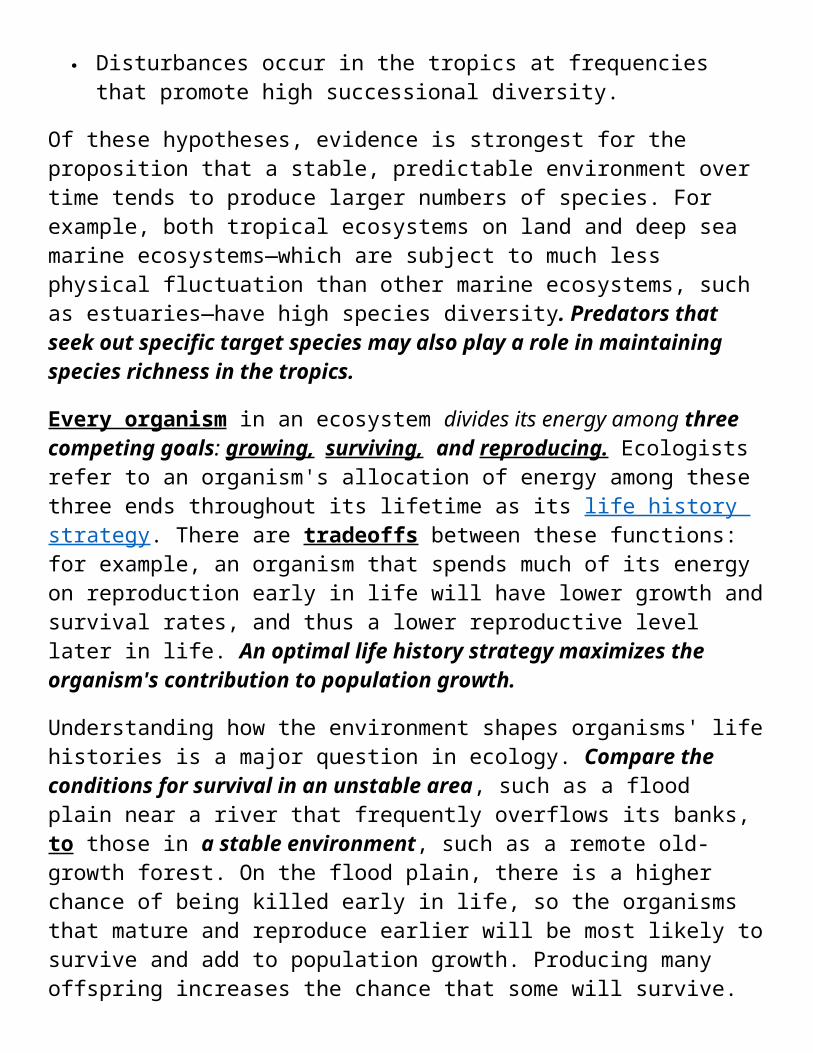
Why is biodiversity distributed in this way? Ecologists have proposed a number of explanations:
Higher productivity in the tropics allows for more species; The tropics were not severely affected by glaciation and thus have had more
time for species to develop and adapt; Environments are more stable and predictable in the tropics, with fairly
constant temperatures and rainfall levels year-round; More predators and pathogens limit competition in the tropics, which allows
more species to coexist; and Disturbances occur in the tropics at frequencies that promote high
successional diversity.
Of these hypotheses, evidence is strongest for the proposition that a stable, predictable environment over time tends to produce larger numbers of species. For example, both tropical ecosystems on land and deep sea marine ecosystems—which are subject to much less physical fluctuation than other marine ecosystems, such as estuaries—have high species diversity. Predators that seek out specific target species may also play a role in maintaining species richness in the tropics.
Every organism in an ecosystem divides its energy among three competing goals: growing, surviving, and reproducing. Ecologists refer to an organism's allocation of energy among these three ends throughout its lifetime as its life history strategy. There are tradeoffs between these functions: for example, an organism that spends much of its energy on reproduction early in life will have lower growth and survival rates, and thus a lower reproductive level later in life. An optimal life history strategy maximizes the organism's contribution to population growth.
Understanding how the environment shapes organisms' life histories is a major question in ecology. Compare the conditions for survival in an unstable area, such as a flood plain near a river that frequently overflows its banks, to those in a stable environment, such as a remote old-growth forest. On the flood plain, there is a higher chance of being killed early in life, so the organisms that mature and reproduce earlier will be most likely to survive and add to population growth. Producing many offspring increases the chance that some will survive. Conversely, organisms in the forest will mature later and have lower early reproductive rates. This allows them to put more energy into growth and competition for resources.
Ecologists refer to organisms at the first of these two extremes (those adapted to unstable environments) as r-selected. These organisms live in settings where
population levels are well below the maximum number that the environment can support—the carrying capacity—so their numbers are growing exponentially at the maximum rate at which that population can increase if resources are not limited (often abbreviated as r). The other extreme, organisms adapted to stable environments, are termed K-selected because they live in environments in which the number of individuals is at or near the environment's carrying capacity (often abbreviated as K).
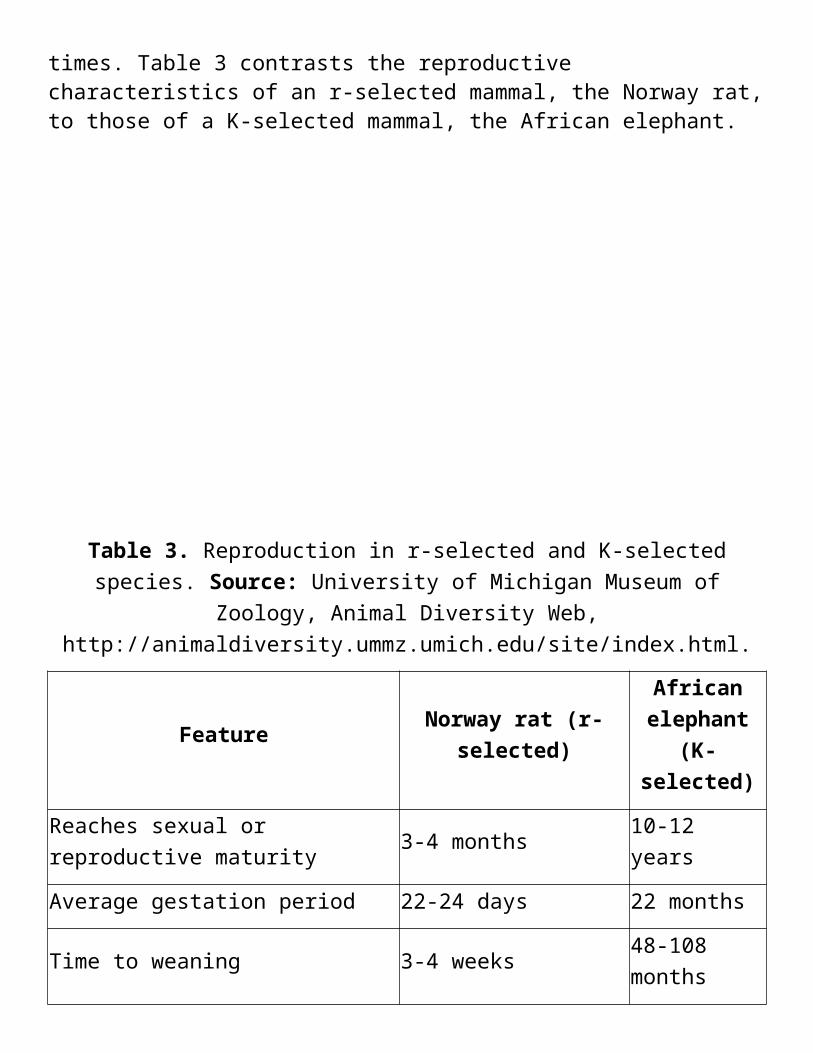
Organisms that are r-selected tend to be small, short-lived, and opportunistic, and to grow through irregular boom-and-bust population cycles. They include many insects, annual plants, bacteria, and larger species such as frogs and rats. Species considered pests typically are r-selected organisms that are capable of rapid growth when environmental conditions are favorable. In contrast, K-selected species are typically larger, grow more slowly, have fewer offspring and spend more time parenting them. Examples include large mammals, birds, and long-lived plants such as redwood trees. K-selected species are more prone to extinction than r-selected species because they mature later in life and have fewer offspring with longer gestation times. Table 3 contrasts the reproductive characteristics of an r-selected mammal, the Norway rat, to those of a K-selected mammal, the African elephant.
Table 3. Reproduction in r-selected and K-selected species. Source: University of Michigan Museum of Zoology, Animal Diversity Web,
http://animaldiversity.ummz.umich.edu/site/index.html.
Feature Norway rat (r-selected)African
elephant (K-selected)
Reaches sexual or reproductive maturity
3-4 months 10-12 years
Average gestation period 22-24 days 22 months
Time to weaning 3-4 weeks 48-108 months
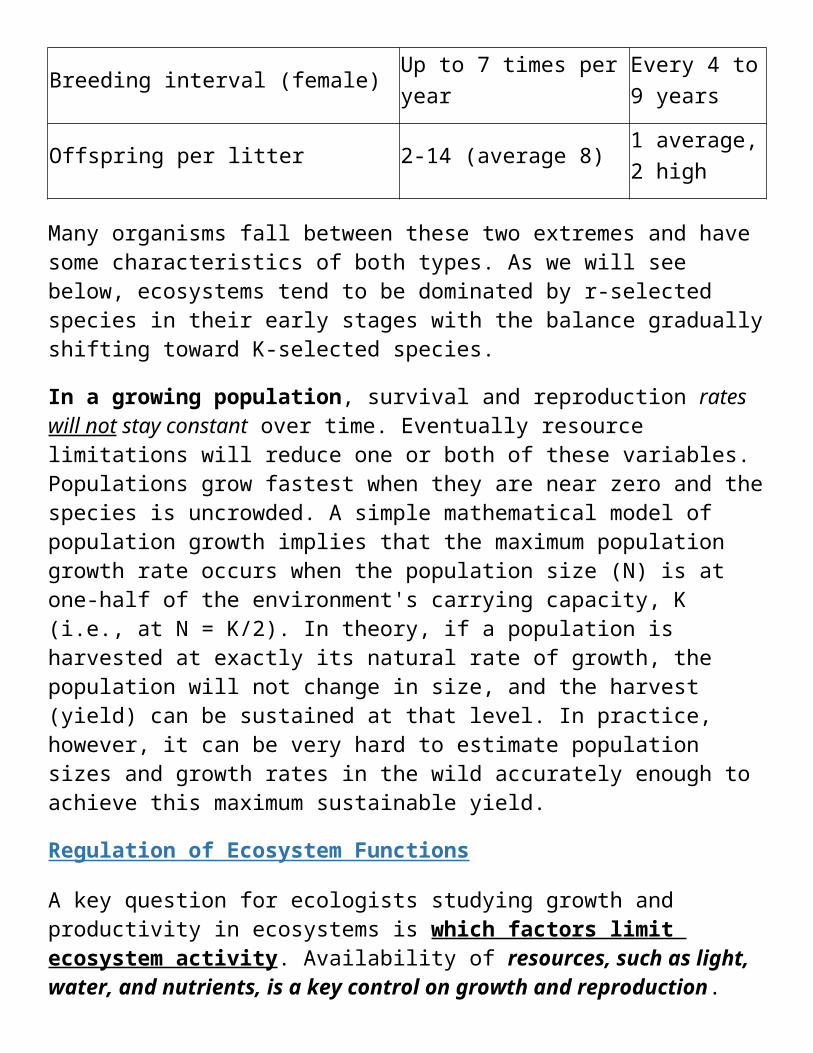
Breeding interval (female) Up to 7 times per yearEvery 4 to 9 years
Offspring per litter 2-14 (average 8)1 average, 2 high
Many organisms fall between these two extremes and have some characteristics of both types. As we will see below, ecosystems tend to be dominated by r-selected species in their early stages with the balance gradually shifting toward K-selected species.
In a growing population, survival and reproduction rates will not stay constant over time. Eventually resource limitations will reduce one or both of these variables. Populations grow fastest when they are near zero and the species is uncrowded. A simple mathematical model of population growth implies that the maximum population growth rate occurs when the population size (N) is at one-half of the environment's carrying capacity, K (i.e., at N = K/2). In theory, if a population is harvested at exactly its natural rate of growth, the population will not change in size, and the harvest (yield) can be sustained at that level. In practice, however, it can be very hard to estimate population sizes and growth rates in the wild accurately enough to achieve this maximum sustainable yield.
Regulation of Ecosystem Functions
A key question for ecologists studying growth and productivity in ecosystems is which factors limit ecosystem activity. Availability of resources, such as light,

water, and nutrients, is a key control on growth and reproduction. Some nutrients are used in specific ratios. For example, the ratio of nitrogen to phosphorus in the organic tissues of algae is about 16 to 1, so if the available nitrogen concentration is greater than 16 times the phosphorus concentration, then phosphorus will be the factor that limits growth; if it is less, then nitrogen will be limiting. To understand how a specific ecosystem functions, it thus is important to identify what factors limit ecosystem activity.
Resources influence ecosystem activity differently depending on whether they are essential, substitutable, or complementary. Essential resources limit growth independently of other levels: if the minimum quantity needed for growth is not available, then growth does not occur. In contrast, if two resources are substitutable, then population growth is limited by an appropriately weighted sum of the two resources in the environment. For example, glucose and fructose are substitutable food sources for many types of bacteria. Resources may also be complementary, which means that a small amount of one resource can substitute for a relatively large amount of another, or can be complementary over a specific range of conditions.
Resource availability serves as a so-called "bottom-up" control on an ecosystem: the supply of energy and nutrients influences ecosystem activities at higher trophic levels by affecting the amount of energy that moves up the food chain. In some cases, ecosystems may be more strongly influenced by so-called "top-down" controls—namely, the abundance of organisms at high trophic levels in the ecosystem (Fig. 12). Both types of effects can be at work in an ecosystem at the same time, but how far bottom-up effects extend in the food web, and the extent to which the effects of trophic interactions at the top of the food web are felt through lower levels, vary over space and time and with the structure of the ecosystem.
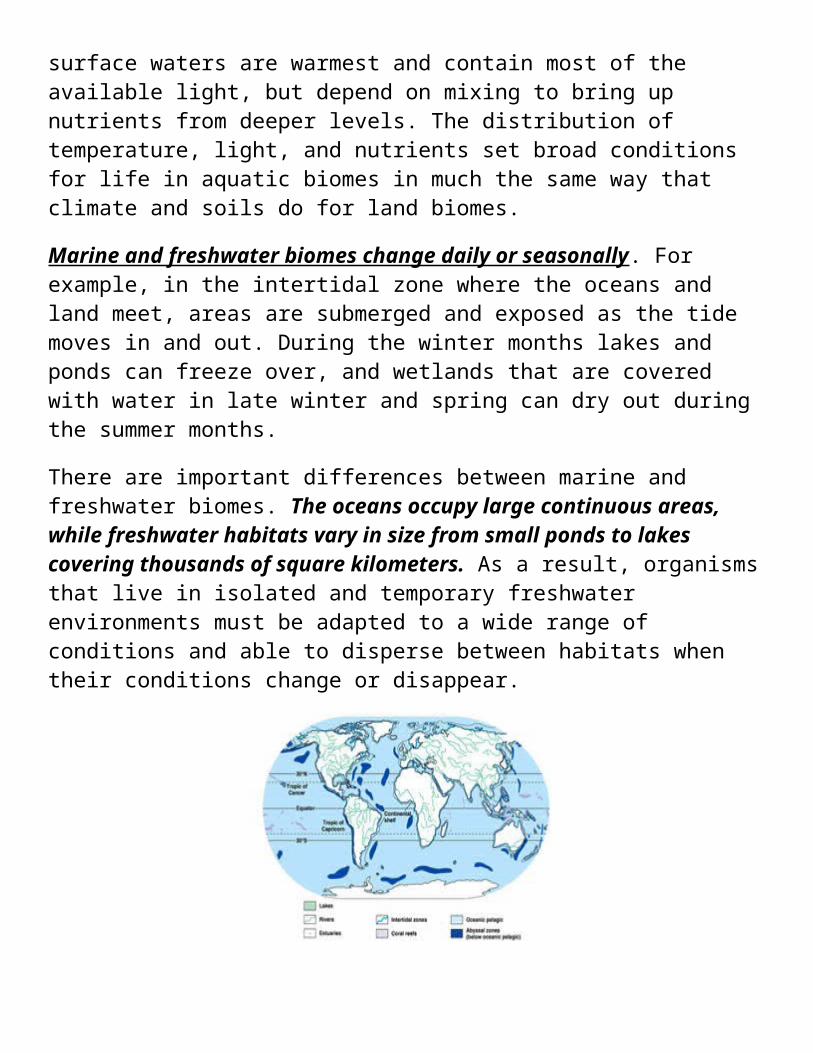
Figure 12. Predators impose top-down control on ecosystems
Many ecological studies seek to measure whether bottom-up or top-down controls are more important in specific ecosystems because the answers can influence conservation and environmental protection strategies. For example, a study by Benjamin S. Halpern and others of food web controls in kelp forest ecosystems off the coast of Southern California found that variations in predator abundance explained a significant proportion of variations in the abundance of algae and the organisms at higher trophic levels that fed on algae and plankton. In contrast, they found no significant relationship between primary production by algae and species abundance at higher trophic levels. The most influential predators included spiny lobster, Kellet's whelk, rockfish, and sea perch. Based on these findings, the authors concluded that "[e]fforts to control activities that affect higher trophic levels (such as fishing) will have far larger impacts on community dynamics than efforts to control, for example, nutrient input, except when these inputs are so great as to create anoxic (dead) zones".
Drastic changes at the top of the food web can trigger trophic cascades, or domino effects that are felt through many lower trophic levels. The likelihood of a trophic cascade depends on the number of trophic levels in the ecosystem and the extent to which predators reduce the abundance of a trophic level to below their resource-limited carrying capacity. Some species are so important to an entire ecosystem that they are referred to as keystone species , designating that they occupy an ecological niche that influences many other species. Removing or seriously impacting a keystone species produces major impacts throughout the ecosystem.
All species in an ecosystem, or habitat, rely on each other. The contributions of a keystone species are large compared to the species' prevalence in the habitat. A small number of keystone species can have a huge impact on the environment.
A keystone species is a plant or animal that plays a unique and crucial role in the way an ecosystem functions. Without keystone species, the ecosystem would be dramatically different or cease to exist altogether.
A keystone species is often, but not always, a predator. A few predators can
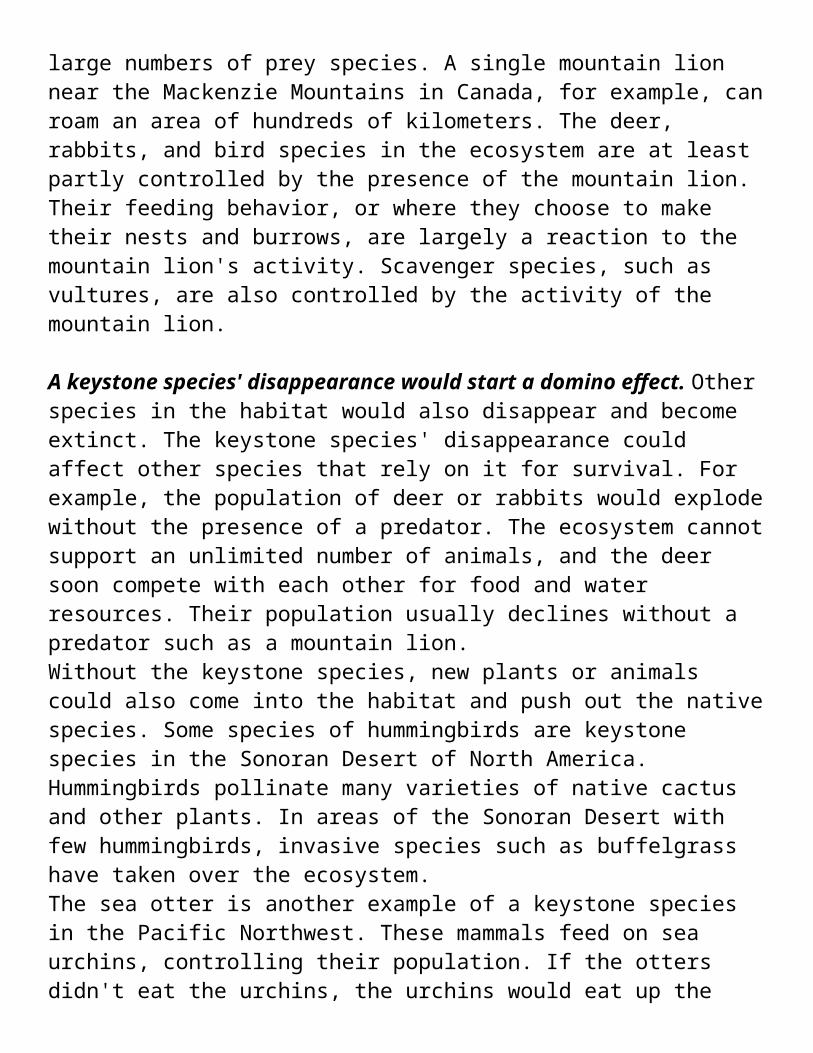
control the distribution and population of large numbers of prey species. A single mountain lion near the Mackenzie Mountains in Canada, for example, can roam an area of hundreds of kilometers. The deer, rabbits, and bird species in the ecosystem are at least partly controlled by the presence of the mountain lion. Their feeding behavior, or where they choose to make their nests and burrows, are largely a reaction to the mountain lion's activity. Scavenger species, such as vultures, are also controlled by the activity of the mountain lion.
A keystone species' disappearance would start a domino effect. Other species in the habitat would also disappear and become extinct. The keystone species' disappearance could affect other species that rely on it for survival. For example, the population of deer or rabbits would explode without the presence of a predator. The ecosystem cannot support an unlimited number of animals, and the deer soon compete with each other for food and water resources. Their population usually declines without a predator such as a mountain lion.Without the keystone species, new plants or animals could also come into the habitat and push out the native species. Some species of hummingbirds are keystone species in the Sonoran Desert of North America. Hummingbirds pollinate many varieties of native cactus and other plants. In areas of the Sonoran Desert with few hummingbirds, invasive species such as buffelgrass have taken over the ecosystem. The sea otter is another example of a keystone species in the Pacific Northwest. These mammals feed on sea urchins, controlling their population. If the otters didn't eat the urchins, the urchins would eat up the habitat's kelp. Kelp, or giant seaweed, is a major source of food and shelter for the ecosystem. Some species of crabs, snails, and geese depend on kelp for food. Many types of fish use the huge kelp forests to hide from predators. Without sea otters to control the urchin population, the entire ecosystem would collapse.
Herbivores can also be keystone species. In African savannas such as the Serengeti plains in Tanzania, elephants are a keystone species. Elephants eat small trees, such as acacia, that grow on the savanna. Even if an acacia tree grows to a height of several feet, elephants are able to knock over the tree and uproot it. This feeding behavior keeps the savanna a grassland and not a forest or woodland. With elephants to control the tree population, grasses thrive and sustain grazing animals such as antelopes, wildebeests, and zebras. Smaller animals such as mice
and shrews are able to burrow in the warm, dry soil of a savanna. Predators such as lions and hyenas depend on the savanna for prey. Elephants are the keystone species that maintain the entire savanna ecosystem.
Many scientists believe that the reintroduction of wolves into Yellowstone National Park in 1995, after they had been eradicated from the park for decades through hunting, has caused a trophic cascade with results that are generally positive for the ecosystem. Wolves have sharply reduced the population of elk, allowing willows to grow back in many riparian areas where the elk had grazed the willows heavily. Healthier willows are attracting birds and small mammals in large numbers.
"Species, like riparian songbirds, insects, and in particular, rodents, have come back into these preferred habitat types, and other species are starting to respond," says biologist Robert Crabtree of the Yellowstone Ecological Research Center. "For example, fox and coyotes are moving into these areas because there's more prey for them. There's been an erupting trophic cascade in some of these lush riparian habitat sites."
Ecological Niches Within ecosystems, different species interact in different ways. These interactions can have positive, negative, or neutral impacts on the species involved.
Table 4. Relationships between individuals of different species.
Type of interaction
Effect of interaction Examples
CompetitionBoth species are harmed (population growth rates are reduced).
Oak trees and maple trees competing for light in a forest, wading birds foraging for food in a marsh
Predation Parasitism
One species benefits, one is harmed.
Predation: wolf and rabbitParasitism: flea and wolf
MutualismBoth species benefit. Relationship may not be essential for either.
Humans and house pets, insect pollination of flowers
CommensalismOne species benefits, one is not affected.
Maggots decomposing a rotting carcass
Amensalism
One species harms another (typically by releasing a toxic substance), but is not affected itself.
Allelopathy (plants that produce substances harmful to other plants): rye and wheat suppress weeds when used as cover crops, broccoli residue suppresses growth of other vegetables in the same plant family
Each species in an ecosystem occupies a niche, which comprises the sum total of its relationships with the biotic and abiotic elements of its environment—more simply, what it needs to survive. This approach makes ecological niches easier to quantify and analyze because they can be described as specific ranges of variables like temperature, latitude, and altitude. For example, the African Fish Eagle occupies a very similar ecological niche to the American Bald Eagle (Fig. 13). In practice it is hard to measure all of the variables that a species needs to survive, so descriptions of an organism's niche tend to focus on the most important limiting factors.
Figure 13. African fish eagleThe full range of habitat types in which a species can exist and reproduce without any competition from other species is called its fundamental niche. The presence of other species means that few species live in such conditions. A species' realized
niche can be thought of as its niche in practice—the range of habitat types from which it is not excluded by competing species. Realized niches are usually smaller than fundamental niches, since competitive interactions exclude species from at least some conditions under which they would otherwise grow. Species may occupy different realized niches in various locations if some constraint, such as a certain predator, is present in one area but not in another.
In a classic set of laboratory experiments, Russian biologist G.F. Gause showed the difference between fundamental and realized niches. Gause compared how two strains of Paramecium grew when they were cultured separately in the same type of medium to their growth rates when cultured together. When cultured separately both strains reproduced rapidly, which indicated that they were adapted to living and reproducing under the same conditions. But when they were cultured together, one strain out-competed and eventually eliminated the other. From this work Gause developed a fundamental concept in community ecology: the competitive exclusion principle, which states that if two competitors try to occupy the same realized niche, one species will eliminate the other.
Many key questions about how species function in ecosystems can be answered by looking at their niches. Species with narrow niches tend to be specialists, relying on comparatively few food sources. As a result, they are highly sensitive to changes in key environmental conditions, such as water temperature in aquatic ecosystems. For example, pandas, which only eat bamboo, have a highly specialized diet. Many endangered species are threatened because they live or forage in particular habitats that have been lost or converted to other uses. One well-known case, the northern spotted owl lives in cavities of trees in old-growth forests (forests with trees that are more than 200 years old and have not been cut, pruned, or managed), but these forests have been heavily logged, reducing the owl's habitat.
In contrast, species with broad niches are generalists that can adapt to wider ranges of environmental conditions within their own lifetimes (i.e., not through evolution over generations, but rather through changes in their behavior or physiologic functioning) and survive on diverse types of prey. Coyotes once were found only on the Great Plains and in the western United States, but have spread through the eastern states in part because of their flexible lifestyle. They can kill and eat large, medium, or small prey, from deer to house cats, as well as other
foods such as invertebrates and fruit, and can live in a range of habitats, from forests to open landscapes, farmland, and suburban neighborhoods.
Overlap between the niches of two species (more precisely, overlap between their resource use curves) causes the species to compete if resources are limited. One might expect to see species constantly dying off as a result, but in many cases competing species can coexist without either being eliminated. This happens through niche partitioning (also referred to as resource partitioning), in which two species divide a limiting resource such as light, food supply, or habitat.
Evolution and Natural Selection in Ecosystems
As species interact, their relationships with competitors, predators, and prey contribute to natural selection and thus influence their evolution over many generations. To illustrate this concept, consider how evolution has influenced the factors that affect the foraging efficiency of predators. This includes the predator's search time (how long it takes to find prey), its handling time (how hard it has to work to catch and kill it), and its prey profitability (the ratio of energy gained to energy spent handling prey). Characteristics that help predators to find, catch, and kill prey will enhance their chances of surviving and reproducing. Similarly, prey will profit from attributes that help avoid detection and make organisms harder to handle or less biologically profitable to eat.
These common goals drive natural selection for a wide range of traits and behaviors, including:
Mimicry by either predators or prey. A predator such as a praying mantis that blends in with surrounding plants is better able to surprise its target. However, many prey species also engage in mimicry, developing markings similar to those of unpalatable species so that predators avoid them. For example, harmless viceroy butterflies have similar coloration to monarch butterflies, which store toxins in their tissues, so predators avoid viceroy butterflies.
Optimal foraging strategies enable predators to obtain a maximum amount of net energy per unit of time spent foraging. Predators are more likely to survive and reproduce if they restrict their diets to prey that provide the most energy per unit of handling time and focus on areas that are rich with prey or that are close together. The Ideal Free Distribution model suggests
that organisms that are able to move will distribute themselves according to the amount of food available, with higher concentrations of organisms located near higher concentrations of food. Many exceptions have been documented, but this theory is a good general predictor of animal behavior.
Avoidance/escape features help prey elude predators. These attributes may be behavioral patterns, such as animal herding or fish schooling to make individual organisms harder to pick out. Markings can confuse and disorient predators: for example, the automeris moth has false eye spots on its hind wings that misdirect predators (Fig. 14).
Features that increase handling time help to discourage predators. Spines serve this function for many plants and animals, and shells make crustaceans and mollusks harder to eat. Behaviors can also make prey harder to handle: squid and octopus emit clouds of ink that distract and confuse attackers, while hedgehogs and porcupines increase the effectiveness of their protective spines by rolling up in a ball to conceal their vulnerable underbellies.
Some plants and animals emit noxious chemical substances to make themselves less profitable as prey. These protective substances may be bad-tasting, antimicrobial, or toxic. Many species that use noxious substances as protection have evolved bright coloration that signals their identity to would-be predators—for example, the black and yellow coloration of bees, wasps, and yellowjackets. The substances may be generalist defenses that protect against a range of threats, or specialist compounds developed to ward off one major predator. Sometimes specialized predators are able overcome these noxious substances: for example, ragwort contains toxins that can poison horses and cattle grazing on it, but it is the exclusive food of cinnabar moth caterpillars. Ragwort toxin is stored in the caterpillars' bodies and eventually protects them as moths from being eaten by birds. Figure 14. Automeris moth
Natural selection based on features that make predators and prey more likely to survive can generate predator-prey "arms races," with improvements in prey defenses triggering counter-improvements in predator attack tools and vice versa over many generations. Many cases of predator-prey arms races have been
identified. One widely known case is bats' use of echolocation to find insects. Tiger moths respond by emitting high-frequency clicks to "jam" bats' signals, but some bat species have overcome these measures through new techniques such as flying erratically to confuse moths or sending echolocation chirps at frequencies that moths cannot detect. This type of pattern involving two species that interact in important ways and evolve in a series of reciprocal genetic steps is called coevolution and represents an important factor in adaptation and the evolution of new biological species.
Other types of relationship, such as competition, also affect evolution and the characteristics of individual species. For example, if a species has an opportunity to move into a vacant niche, the shift may facilitate evolutionary changes over succeeding generations because the species plays a different ecological role in the new niche. By the early 20th century, large predators such as wolves and puma had been largely eliminated from the eastern United States. This has allowed coyotes, who compete with wolves where they are found together, to spread throughout urban, suburban, and rural habitats in the eastern states, including surprising locations such as Cape Cod in Massachusetts and Central Park in New York City. Research suggests that northeastern coyotes are slightly larger than their counterparts in western states, although it is not yet clear whether this is because the northeastern animals are hybridizing with wolves and domestic dogs or because they have adapted genetically to preying on larger species such as white-tailed deer.
Natural Ecosystem Change
Just as relationships between individual species are dynamic, so too is the overall makeup of ecosystems. The process by which one natural community changes into another over a time scale of years to centuries is called succession . Common succession patterns include plant colonization of sand dunes and the regrowth of forests on abandoned farmland (Fig. 15). While the general process is widely recognized, ecologists have offered differing views of what drives succession and how to define its end point. By analyzing the natural succession process, scientists seek to measure how stable ecosystems are at different stages in their trajectory of development, and how they respond to disturbances in their physical environment or changes in the frequency at which they are disturbed.
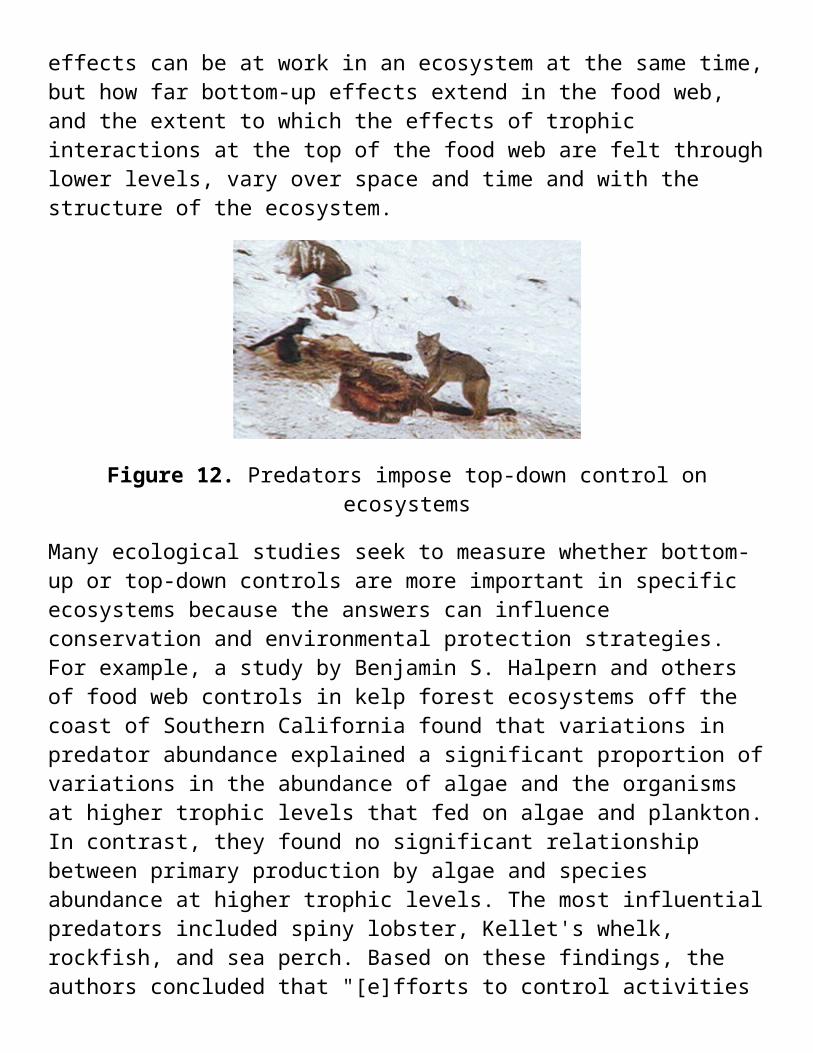
Figure 15. Typical forest succession pattern
In the early 20th century, plant biologist Frederic Clements described two types of succession: primary (referring to colonization of a newly exposed landform, such as sand dunes or lava flows after a volcanic eruption) and secondary (describing the return of an area to its natural vegetation following a disturbance such as fire, treefall, or forest harvesting). British ecologist Arthur Tansley distinguished between autogenic succession—change driven by the inhabitants of an ecosystem, such as forests regrowing on abandoned agricultural fields—and allogenic succession, or change driven by new external geophysical conditions such as rising average temperatures resulting from global climate change.
A common observation is that as ecosystems mature through successional stages, they tend to become more diverse and complex. The number of organisms and species increases and niches become narrower as competition for resources increases. Primary production rates and nutrient cycling may slow as energy moves through a longer sequence of trophic levels (Table 5).
Table 5. Characteristics of developing and mature ecosystems.
Ecosystem attributes Developmental stages Mature stages
Energetics:
Production/respiration More or less than 1 Approaching 1
Production/biomass High Low
Food chains Linear Web-like
Community structure:
Niches Broad Narrow
Species diversity Low High
Nutrient conservation Poor; detritus unimportant Good; detritus important
Nutrient exchange rates Rapid Slow
Stability Low High
Many natural disturbances have interrupted the process of ecosystem succession throughout Earth's history, including natural climate fluctuations, the expansion and retreat of glaciers, and local factors such as fires and storms.
Terms Definitionscarnivore Organism that feeds on other animals.consumer Organism that must consume other organisms to obtain food for energy.
decomposerOrganism that obtains nutrients and energy by breaking down dead organisms and animal wastes.
food chainDiagram that shows feeding interactions in an ecosystem through a single pathway.
food webDiagram that shows feeding interactions between many organisms in an ecosystem through multiple intersecting pathways.
herbivore Animal that eats producers to obtain energy.Producer First Trophic level. Organism that produces food for itself and other
organisms.
BioaccumulationThe process of contaminants collecting in animal tissues between trophic levels.
Biomass
The total mass of the organic matter at each trophic level. The potential energy – energy that is to be eaten and used.The transfer of energy from one level to another is very inefficient (10% Law).
Trophic Level
The number of steps an organism is from the start of the chain is a measure of its trophic level. Food chains start at trophic level 1 with primary producers such as plants, move to herbivores at level 2, predators at level 3 and typically finish with carnivores or apex predators at level 4 or 5.

Symbiosis A close and permanent association between organisms of different species.
Commensalism A relationship in which one organism benefits and the other is not affected. Example: Barnacles on a whale
Mutualism A relationship in which both organisms benefit from each other. Example: Birds eating pest off a rhino’s back
Parasitism A relationship in which one organism benefits and the other is harmed. Example: Ticks on a dog.
Biomes Broad geographic zones whose plants and animals are adapted to different climate patterns.
Carrying capacity
maximum number of organisms that the environment can support
Biodiversity The variety of life in the world or in a particular habitat or ecosystem.