Embed Size (px)
Citation preview
I
I
BARLEY SILAGE HARVESTED AT BOOT AND SOFT DOUGHSTAGES FOR LACTATING COWS
by
Yamandu M. Acosta
Thesis submitted to the Faculty of theVirginia Polytechnic Institute and State University
in partial fulfillment of the requirements for the degree of
Master of Science
in
Dairy Science
APPROVED:
.1C,‘Q j ”hfI{ß //Charles C. Stall ngs, Carl E. Polan
Chairman
Roanld E. Pearson Vivien G. Allen
Daniel E. Brann William E. VinsonI
IApril, 1969 I
I Blacksburg, Virginia I‘ I
I IIII II II_ _ _y ‘ I

BARLEY SILAGE HARVESTED AT BOOT AND SOFT DOUGH STAGES
FOR LACTATING COWS
byYamandu M. Acosta
Committee Chairman: Charles C. Stallings
Dairy Science
(ABSTRACT)
Barley (Hordeum vulgare, L.) harvested at boot (5/7/88) and
soft dough (6/6/88) stages of maturity was ensiled for
nutritive comparisons. Boot stage was wilted and soft dough
was direct cut at 15 (SD-Lo) and 25 cm (SD-Hi) above ground.
Yields (kg DM/ha) were 3690, 8750 and 6287 for boot, SD—Lo
and SD-Hi respectively. Digestibilities (%) of DM, CP andL
ADF were 74.7, 74.5 and 70.8 for boot; 61.9, 50.4 and 44.7
for SD—Lo; and 62.3, 47.2 and 49.7 for SD—Hi, respectively.
'Calculated TDN was 71.2, 62.0 and 62.8 for boot, SD—Lo andSD-Hi, respectively. Thirty—six lactating Holtein cows were
fed boot silage at 75 and 60% of diet DM, SD—Lo fed at 75
and 60 and SD-Hi fed at 75 and 60, respectively. Milk yields
(kg/d) were greatest for high concentrate diets and averaged
25.7, 28.3, 24.8, 26.3, 25.7 and 26.9, respectively. There
were no differences among diets for DM intake or 4% FCM.

Boot silage had a greater In Situ rumen degradability of DM, ;CP, ADF and NDF (68.6, 89.3, 44.2 and 45.1% respectively) Ethan SD-Lo (57.8, 76.9, 20.9 and 24.2%) and SD—Hi (62.5,80.0, 22.8 and 26.4%). Predictability of ruminal degradabil-ity of complete diets from weighted averages of singleingredients determined separately was low. In Situ incuba—tion of single ingredients resulted in underestimation of DMand overestimation of CP degradability compared with com-plete diet incubation.
E .„„„„„____„___1
iv

rolled in a graduate program.
F
E V F
1
1
TABLE OF CONTENTS
pageABSTRACT ............................................ iiACKNOWLEDGEMENTS .................................... ivLIST OF TABLES ......................................viiiINTRODUCTION ........................................ 1LITERATURE REVIEW ................................... 3
1. Introduction .................................... 32. Stage of Maturity and Total Dry Matter Yield .... 3
3. Stage of Maturity and Composition ............... 4
4. Effect of·Cutting Height ........................ 9
5. Effect od the Ensiling Process .................. 9
6. Effect of the Diet Characteristics andComposition on Milk Yield ....................... 14
6.a. Dry Matter Intake ............................. 146.b. Energy Intake ................................. 19
6.c. Protein Intake ................................ 227. Effect of the Diet on Milk Composition .......... 31
MATERIALS AND METHODS ............................... 36
1. Field Trial ..................................... 36
2. Silage Evaluation ............................... 40
3. Heifer Digestibility Trial ...................... 43
4. Lactating Cow Feeding Trial ..................... 47
5. Ruminal Degradability Study ..................... 50
RESULTS AND DISCUSSION .............................. 551. Field Trial ..................................... 55
vi
2. Silage Evaluation ............................... 58
3. Heifer Digestibility Trial ...................... 69
4. Lactating Cow Feeding Trial ..................... 73
5. Ruminal Degradability Trial ..................... 84
SUMMARY AND CONCLUSIONS ............................. 103
REFERENCES .......................................... 106
APPENDIX ............................................ 114
VITA ................................................ 120
vii
LIST OF TABLES
table page
1 Planting date, seeding rate (kg/ha) and
fertilization date and rate of the barley
fields used in the experiment .................. 37
2 Growth stage, cutting height (cm), theoretical
lenght of cut (cm) and date of harvest of the
treatments ..................................... 38
3 Experimental diet composition in terms of
barley silage source and forage/concentrate
ratios (dry matter basis) ...................... 48
4 Yield (kg/ha) and content of forages harvested
at two stages of growth and two cutting
heights ........................................ 56
5 Dry matter and fiber fractions of the three
silages ........................................ 59
6 Crude protein content (CP), N insoluble in buffer
(BUFFINSOL—N), buffer soluble N,neutral detergent
(NDIN) and acid detergent (ADIN), total water
iviii
I
soluble N (WSN) and water soluble true protein
(WSTP), of the three silages ................... 61
7 Lactic and major volatile fatty acids and pH of
the three barley silages ....................... 64
8 Calcium, phosphorus, magnesium, potassium,
sodium and sulfur content of the three silages
as % of the dry matter ......................... 66
9 Dry matter, crude protein, neutral detergent
fiber and acid detergent fiber recovered from
the silos as % of the original amounts stored
for each of the barley treatments .............. 68
10 Dry matter, proximate components and acid and1
neutral detergent fiber fractions of the
composite samples of the silage treatments
fed during the digestibility trial ............. 71
11 In Vivo apparent digestibility of silage
fractions and Total Digestible Nutrient
content of the three barley silage treatments .. 72
12 Dry matter (DM), crude protein (CP), total
ix
III
¥
digestible nutrients (TDN), net energy for
lactation (NEL) and acid detergent fiber
(ADF) contents of the experimental diets ....... 74
13 Dry matter intake (DMI), dry matter intake as
% of body weight (DMI/BW), milk yield (Milk)
4% fat corrected milk yield (4% FCM), milk
. components (Fat, Protein, Lactose, Solids Non
Fat and Total Solids), Gross Efficiency, Energy
Efficiency, body weight change (BWChange),
intake of total digestible nutrients (TDNI),
and acid fiber detergent intake (ADFI)
associated with experimental diets ............. 76
14 Dry matter intake (DMI) kg/d and as %BW
(DMI/BW), milk yield (Milk), 4% fat corrected
milk yield (4% FCM), milk components (Fat,
Protein, Lactose, Solids Non Fat, and Total
Solids), Gross Efficiency, Energy Efficiency,
body weight change (BWChange), intake of total
digestible nutrients (TDNI) and acid detergent
fiber intake (ADFI) of the experimental diets
grouped by forage source and forage/concentrate
ratio .......................................... 78
uX i
I1
15 Correlation matrix for dry matter % (DM),
totaldigestiblenutrients % (TDN), acid detergent
fiber % (ADF), milk yield kg/d (Milk), 4%
fatcorrectedmilk yield kg/d (FCM), milk fat (Fat),
dry matter intake kg/cow/d (DMI), TDN intake
kg/cow/d (TDNI), ADF intake kg/cow/d (ADFI) and
body weight change kg/cow/d (BWCH) associated
to experimental diets .......................... 81
16 Ruminal degradability parameters, A, B, C, D
and Kd for the dry matter of the experimentalsilages ........................................ 84
17 Ruminal degradability parameters (A, B, C, D,
and Kd) of nitrogen compounds of the
experimental silages ........................... 86
18 Ruminal degradability parameters (A, B, C, D,
and Kd) of the Acid Detergent Fiber (ADF)
fraction of barley silages ..................... 88
19 Ruminal degradability parameters (A, B, C, D,
and Kd) of the Neutral Detergent Fiber (NDF)
fraction of barley silages ..................... 89
hßxi{
20 Ruminal degradability parameters (A, B, C, D,
and Kd) of the dry matter and nitrogen of the
Soybean Meal (SBM) and Shelled Corn (SCorn)
used as concentrate ingredients of the
experimental diets ............................. 91
21 Ruminal degradability parameters (A, B, C, D,
and Kd) of the dry matter of the experimental
diets .......................................... 92
22 Ruminal degradability parameters (A, B, C, D,
and Kd) of the nitrogen ccmpounds of the
experimental diets ............................. 94
23 Ruminal degradability parameters (A, B, C, D,
and Kd) of Acid Detergent Fiber (ADF) of the
experimental diets .............,............... 95
24 Ruminal degradability parameters (A, B, C, D,
and Kd) of neutral detergent fracticn (NDF) of
the experimental diets ......................... 97
25 Composition of the experimental diets expressed
as percent of each ingredient in a dry matter1
basis .......................................... 98
26 Predicted parameters of ruminal degradability
(A, B, C, D, and Kd) of dry matter of the
experimental diets ............................. 100
27 Predicted parameters of ruminal degradability
(A, B, C, D, and Ka) of nitrogen compounds
of the experimental diet ....................... 102
TABLES IN APPENDIX
A1 Macro and micromineral contents of barley tissue
sampled from the three fields of the experiment
on 4/01/88 ..................................... 115
A2 Composition and nutrient content of the
pre—experimental diet used between 6/27/88
and 7/13/88 .................................... 115
A3 Nutritive composition of the concentrate
ingredients used in the formulation of the
experimental diets ............................. 116
A4 Composition of the mineral mix (VPI Dairy
Mineral) supplemented in the feeding trial
and In Vivo digestibility trial ................ 116
xiii
1
A5 Nutritive composition of the barley silage
used during the pre—experimental period of
the In Vivo digestibility trial ................ 117
A6 Typical analysis of variance table for
yields and composition of the harvested
material of the field trial .................... 117
A7 Typical analysis of variance table for
silage composition ............................. 117
A8 Typical analysis of variance table for
digestibility coefficients of proximate
components and TDN content of the silages ...... 118
A9 Analysis of variance table for milk
production, milk components, dry matter
intake and body weight change .................. 118
A10 Analysis of variance table to test milkproduction, milk components, dry matter
intake and body weight change according
to forage source and concentrate level
of the experimental diets ...................... 118
1 xiv '
1
ä•
A11 Average monthly temperature (QC) and total
precipitation mm (rainfall and snowfall) of
the growing period of barley crop and feeding
experiment ..................................... 119
>
'XVEil
11
INTRODUCTION
Small grains are the most commonly used spring crops
for silage making in Virginia. They are reliable and well
adapted to the Virginia climate producing most of their
yield in spring when soil moisture is most likely to be
available. When incorporated in a crop rotation they help
to control weeds and improve soil tilth. They help to
increase the total production per unit of land when used
in a double cropping sequence with summer crops.
Among small grains, barley (Hordeum vulgare, L.) and
wheat (Triticum aestivum, L.) have the highest yield at
soft dough stage of maturity. However, barley is ready for
harvest earlier than wheat. Nevertheless, compared to corn
(gsa maas, L.) , barley silage has a lower nutritive value
due to lower energy and higher fiber contents. These are
the main limiting factors for use in dairy rations.
The most common measures to improve the nutritive
value of the crop are to harvest in an earlier growth
stage or to raise the height of the cutting bar at harvest
to increase the grain to forage ratio.
Objectives of this study were to compare barley har-
vested at two contrastating stages of growth, boot and
soft dough, and the soft dough harvested with two cuttingheights for silage. Silages were compared in terms of:
1

2 I
1. Dry matter yield and chemical composition.
2. Ensiling characteristics of the harvested materials.
3. Silage composition.
4. Silage In Vivo digestibilities.
5. Silage suitability for milk production.
6. Ruminal degradability characteristics of the silages.
I
LITERATURE REVIEW
1. Introduction.
Small grains are the most common spring crops for
silage making in Virginia (Polan et al., 1968). They are
reliable and well adapted to the Virginia climate,
producing most of their yield during the spring when
adequate moisture is most likely to be available (Virginia
Cooperative Extension Service, 1983).
When small grains are incorporated into a crop
rotation, they help to improve tilth of the soil. Also they
control weeds and increase the total production per unit of
land when used in a double cropping sequence with summer
crops such as corn, sorghum (Sorghum bicolor, P.), soybeans
(Glycine ggg, L.), or other summer annuals. (Virginia
Cooperative Extension Service, 1983; Camper et al., 1972).
Edmisten (1985) reported barley and wheat tended to
yield higher than rye (Secale cereale, L.) and oats (Ayggg
sativa, L.) from boot to hard dough, and the percentage of
total dry matter in leaves was higher for barley at all
stages of maturity considered. Also barley was ready for
harvest 8 and 14 days before wheat for boot and soft dough
stages respectively.
2. Stage of Maturity and Total Dry Matter Yield. (Total dry matter yield of small grains increases as
l3 $
Ä
maturity increases (Polan et al., 1968; Boman, 1980). There
is a dramatic increase from vegetative to milk stage and
then a tendency to stabilize or to increase slightly
(Edmisten, 1985). The shattering of seeds and loss of
older leaves have been reported causes of a decline in dry
matter yield during late dough (Smith, 1960).
Polan et al. (1968) reported that the dry matter yield
of barley harvested at bloom and milk was 75.2 and 95.4%,
respectively, of that of barley harvested at dough stages
of maturity. Edmisten (1985), found the two year average
' dry matter yield of barley harvested at boot to be 52% of
barley harvested at soft dough.
3. Stage of Maturity and Composition.
Because total yield and nutritive value follow oppositetrends as maturity advances (Raymond, 1969; McCullough,
1978), it is necessary to compromise both to optimize the
yield of nutrients per unit of land. Nevertheless, contrary
to what happens with perennial grasses and legumes where
nutritive value declines rapidly with maturity, most annual
grain producing plants can maintain or even improve
nutritive value at later stages of maturity. This is due to
the increase in grain content relative to the total dry
matter accumulated (Polan, 1976).
The dry matter concentration of the material to beensiled is important because it influences the kind of
lW
‘
1
fermentation during ensiling and as a result animal
performance (McCullough and Sisk, 1967). A dry matter
content of 30-40% is regarded as optimum for most grass
silages (Gardener and Wiggans, 1961), and dry matter
contents of 28% or higher are recommended to inhibit
undesirable clostridial fermentation (McDonald et al.,
1973).
Dry matter content of barley tends to increase with
increasing maturity, with little change prior to milk but a
rapid increase after this stage (Polan et al., 1968; Fisher
et al., 1972; Edmisten, 1985). The initial low dry matter
concentration and hence the need of wilting along with
lower dry matter yield per unit of land have been reportedas major disadvantages of harvesting barley at vegetative
stages (Polan et al., 1968; Edmisten, 1985). On the other
hand, Edmisten (1985), reported that in one of the two
years of his experiment, barley harvested at soft dough had
a dry matter content of 42.7-45.1%, considered slightly
high for optimum ensiling. DiRienzo (1987) considered the
rapid change in dry matter concentration at later stages of
maturity as a disadvantage due to the lack of flexibility
during the harvesting process.
Edmisten (1985) reported a continuous decline in "In
Vitro" dry matter digestibility (IVDMD) of barley fromvegetative to hard dough. The decline was slowest from
l
11
vegetative to heading (77.9 to 71.8%) and a faster decline
from heading to hard dough (71.8 to 61.3%). Other
researchers reported IVDMD decreases until grain formation
begins and then stabilization (Cherney and Marten, 1982) or
even a slight increase (Belyea et al., 1978; Edwards et
al., 1968). Belyea et al. (1978) attributed the decline
recorded from vegetative to milk stages to the increase in
acid detergent fiber and the increase, thereafter, to the
increase in seed carbohydrates relative to total dry matter
accumulated.
The Van Soest detergent fiber fractionation system
(Goering and Van Soest, 1970) gives a better isolation and
a more reliable and repeatable measure of the fibrous
fraction of feedstuffs than the proximate analysis system
(Van Soest and Moore, 1965). The neutral detergent fiber
(NDF) fraction or total cell wall constituents (CWC) is
closely related to forage dry matter intake potential
(Barnes and Marten, 1979; Mertens, 1985a). Acid detergent
fiber (ADF) as well as the acid detergent lignin (ADL) have
been reported as strongly related to forage dry matter
digestibility (Van Soest and Moore , 1965), and the ADF
fraction has been frequently used to predict forage
digestibility (Van Soest and Robertson, 1980).
Edmisten (1985) and Cherney and Marten (1982) reported
that the general trend of the detergent fiber fractions in
11
7
Ibarley was to increase with increased maturity. There is a I
sharp increase from vegetative to milk stage and a tendency ä
to stabilize or increase slightly from milk to ripe seed.
The exception is lignin which increases continuously during
the entire growth cycle. Cherney and Marten (1982) reported
values of 40.0, 29.5, and 2.4% and 53.0, 37.0 and 5.4% for
NDF, ADF and lignin at boot and heading stages of maturity,
respectively. They speculate the increase in lignin content
in stems was the major factor that accounted for the
reduction in IVDMD with increased maturity. Edmisten (1985)
reported values of 47.2, 27.9, 3.9, and 22.8% and 58.9,
34.0, 7.2, and 25.7% for NDF, ADF, lignin and cellulose at
boot and soft dough stages of growth respectively.
The data reported by Edmisten (1985) and Cherney and
Marten (1982) show at milk stage the NDF content of barley
approaches 55% and at this level voluntary intake of forage
may be negatively affected (Van Soest, 1965). On the other
hand Belyea et al. (1978) reported an increase in detergent
fiber components from vegetative to milk stage in wheat and
then a decrease at ripe seed stage of maturity due to the
diluting effect of the grain contents relative to the total
dry matter accumulated.
Polan et al. (1968) reported the crude protein
concentration of winter barley grown for forage in Virginia
declined with maturation. A similar trend was reported by
I
8 ICherney and Marten (1982) for all small grain species.Theyalso
reported that the crude protein content of leaf blades
and stems declined sharply with maturity, and the crude
protein concentration of both components was reduced by onehalf from vegetative to hard dough stages of maturity.
Edmisten (1985) reported crude protein concentration
generally decreased from vegetative through milk stages.
However, from milk to hard dough it decreased slightly or
remained the same. Crude protein of 24.0, 13.4, 7.9 and
6.9% of the dry matter were reported on the pre—ensiled
barley forage at vegetative, boot, milk and soft dough
stages of maturity respectively.
As a general trend, the mineral content, particularly P
and S, tend to decrease with advancing maturity, but a wide
range within each forage species has been reported. It is
not always easy to logically relate mineral content with
stage of maturity and the average content of a certain
mineral may be of limited usefulness (Raymond, 1969).
Cherney and Marten (1982) reported that all four
species of small grains showed a decrease in macromineral
concentration with increased maturity, and only P concen-
tration dropped below 0.3% in later stages. The Ca
concentration of barley was about twice that of the other
small grains.
III .__

Q 9 Q1
14. Effect of Cutting Height.
The cutting height at harvest affects both the amount
of dry matter harvested as well as the composition of the
harvested material. The main effect of a higher cut is to
increase the proportion of heads and greener leaves and
stems in the harvested portion. Since the cell wall and, especially the lignin content is a function of age, the
harvested material would tend to have a lower content with
a higher cutting height (Sullivan, J.T., 1973).
Laissus (1968), working with timothy harvested at three
different stages of maturity and three cutting heights,
reported that the nitrogen content of the harvested part
was higher for the younger stage of growth and the highest
cut (10 cm). However, the reverse was true for the last two
more mature cuts of his experiment. This is a result of the
higher proportion of heads in the mature harvested material
and lower nitrogen content of this fraction relative to
leaves and stems (Cherney and Marten, 1982).
5. Effect of the Ensiling Process.
The word silage refers to the "material produced by the
controlled fermentation of a crop of high moisture content"
(McDonald and Whittenbury, 1973). Silage is a way to store
feedstuffs through anaerobic preservation of moist forage.
This encourages formation of sufficient concentration of
acids, especially lactic acid, to inhibit further microbial
11
10{
activity. As a result the material is preserved until
needed. The goal is for a minimal loss of nutritive value
compared to the original material (McCullough, 1978).
The ensiling process uses as a main substrate the water
soluble carbohydrates of the plant. As a result, ensiling
is a destructive process. The energy and dry matter
recovered from the silo are always less than the amount
originally stored (Edwards and McDonald, 1978).
Besides field and effluent losses chopped material has
two main losses, respiration and fermentation. The losses
caused by respiration are due to the activity of plant
enzymes and aerobic microorganisms. They usually cause
breakdown of nonstructural carbohydrate and proteins. One
of the most undesirable products of oxidation is production
of heat. Heat causes alteration of the protein fraction by
increasing unavailable protein content due to browning.
Occasionally the entire silage mass will burn (McCullough,
1978).
The amount and nature of the fermentation losses depend
on the pathway followed. Ideally the pure homolactic
fermentation pathway is the most desirable because it
causes less fermentative losses and also is the most
efficient in reducing pH because its end product is lactic
acid. McDonald et al. (1973) reported recoveries of 100.7and 92.3% for gross energy and dry matter respectively in

11 N
l
well preserved silages of ryegrass, showing that the amount
of losses of well managed silages is low. Also this is the
reason many times the energy content per unit of dry matter
in well preserved silages is higher than in the original
material, although, total energy recovery is lower.
The free reducing sugars are among the most extensively
affected by the fermentation process because they are used· as substrates in the fermentation process (McDonald et al.,
1973). As a rough guide, it has been suggested that 2.5%
water soluble carbohydrates in the fresh weight of the crop
are needed to obtain a well preserved silage without
additives (Wilkins, 1981). The structural carbohydrates are
of little importance in fermentation and only hemicellulose
makes a minor contribution (McDonald et al., 1973).
McDonald and Whittenbury (1973) reported that even in
well preserved silages 50% of net protein breakdown may
take place as a result of both plant enzyme and microbial
activity but the formation of ammonia from amino acids is
caused by microbial activity. Nevertheless serine and
arginine are significantly degraded by the lactic acid
bacteria. However, the major changes in amino acids are
caused by clostridia. To prevent marked amino acid
degradation, the authors suggest a rapid pH reduction.
Reports indicate that silage in well sealed silos hasdry and organic matter digestibilities very similar to that
E
121
in the crop before ensiling. This is true mainly because
the increase in concentration of structural carbohydrates
is compensated by a small increase in the digestibility of
the crude fiber of the silages (Wilkins, 1981).
The fermentation losses caused by the action of hetero
fermentative lactic acid bacteria will depend on the
relative proportions of glucose and fructose present in the
ensiled plant material. According to McDonald and Whitten-
bury (1973) losses of dry matter ranging 1-40% were
reported in this type of fermentation.
The most undesirable fermentation is clostridialbecause one of the end products is butyric acid. Butyric
acid is produced using lactic acid as the substrate, and
causes a reduction in silage acidity because butyric is a
much weaker acid than lactic. This allows further microbialand fungal activity usually leading to the putrefacation of
the silage, and consequently, reducing its acceptability by
the animal. The other consequence of clostridial activity
is formation of amines and the deamination of amino acids.
The increased content of ammonia not only reduces the
protein quality of the silage but also increases the buffer
capacity causing an additional reduction in acidity, and
increasing the risk of putrefacation of the ensiled
material (Edwards and McDonald, 1978).
According to McCu1lough (1978) the recommended measures
13
to obtain a desirable fermentation are rapid silo filling,
a good seal to prevent air leaks, and a high density silage
well packed to assure air exclusion. The aerobic phase
should be as short as possible. Also clostridia are much
more sensitive to the dry matter content than to the pH of
the silage. It is best to have a dry matter content of 28%
or higher to prevent clostridial fermentation.
Many methods have been proposed as indexes of silage
quality. One of the oldest is the Fleig System, cited by
McCullough (1978). This system was proposed in 1938 and
based on the amounts of lactic, acetic and butyric as
percentage of total acids, assigning points according to
the proportion found in each silage. Breirem and Ulvesli,
also cited by McCullough (1978), proposed the following
values as an index of a good fermentation: pH 4.2 maximum,
lactic acid 1.5-2.5%, acetic acid 0.5-0.8%, butyric acid
less than 0.1% and ammonia—N as % of total N not exceeding
5-8%. The real importance of these indicators of silage
quality rest in the close relationship among these values
and some parameters of animal performance such as dry
matter intake. Gordon et al. (1964) reported that only
silage dry matter and lactic acid were positively corre-
lated with dry matter intake of lactating dairy cows,
whereas, butyric, propionic and acetic acid content and pH
were negatively correlated. They also reported that when a
11

14
multiple regression analysis was applied the complete model
explained 66% of the total Variation and the reduced modelwith the variables % dry matter, % butyric and % lactic
acid in the silage explained 64% of the total Variation
found in silage dry matter intake.
6. Effect of the Diet Characteristics and Composition on
Milk Yield.
6.a.Dry Matter Intake.
There are no specific requirements for dry matter
intake (DMI), nevertheless, it is one of the most
important single factors to be considered in ration
formulation. It is recognized as the main limiting factor
in meeting the energy requirements of high producing
lactating cows (NRC, 1988). The mechanism controlling dry
matter intake in ruminants is biphasic (Forbes, 1977).
With diets of low to medium digestibility, the available
energy content and the dry matter intake are positively
correlated, but with diets high in energy the opposite is
true (Conrad et al., 1964).
Under most commercial situations, with diets of medium
or medium to low digestibility the fill capacity of the
rumen is the upper limit to intake. On the other hand with
diets with high proportion of concentrates the energy
requirement of the animal is what sets the upper limit to
dry matter intake (Conrad et al., 1964). The point at
III

15 111
Zwhich feed intake changes from physical to physiological
‘
control is not constant and has two main controlling 1
points. The digestibility of the diet is one and the I
energetic requirement of the animal is the other (Conrad,
1966). Within the limits of physical regulation the
indigestible dry matter is the major constraint on feed
intake. According to Conrad (1966) for a certain animal
the dry matter intake of diets of different digestibility
can be predicted using the following formula: DMI= 5.4 x
W/500 x F, where DMI is dry matter intake in Kg/day, W is
the animal live weight in Kg and F is the percent of
indigestible dry matter in the diet.
There is a strong interaction between digestibility
and the level of intake. Tyrrell and Moe (1975) reported
that the rate of depression in digestibility caused by the
increase of each unit of energy intake ranges from 3.4 to
6.2% with a weighted average of 4.05%. The units of intake
are expressed as multiples of energy intake required to
support maintenance. Also, the digestibility of allI
fractions of the diet are not equally depressed. Tyrrell
and Moe (1974) reported that the depression in digestiveI
efficiency of diets containing 60% grain and 40% corn 1
silage fed to lactating and dry dairy cows was 8% for 1
cellulose and hemicellulose compared to 3% for the soluble Iresidue. I
16I
Another factor affecting dry matter intake is the
amount of concentrates or forage/concentrate ratio of the
diet. Under physical regulation of intake the addition of
concentrates increases dry matter intake, but there is an
interaction between the forage and concentrate fractions
of the diet. The increase in intake is not the simple sum
of forage plus the concentrate, there is always a partial
substitution of forage by concentrate. The average
substitution rate is O.43 to 0.45 units of forage per unit
of concentrate added on a dry matter basis (Ward and
Kelly, 1969). However, the substitution rate is not
constant and depends on the quality of the forage. A
forage with a digestibility similar to that of the added
concentrate can result in the substitution rate being 1 to
1. In this particular case the increase in dry matter
intake due to the addition of concentrates would be null
(Broster et al., 1981).
Another component that affects dry matter intake is
the fiber content of the diet. The general tendency is
that as fiber content increases the voluntary intake
decreases. With diets with extremely low fiber contents
intake is also depressed due to metabolic and digestive
disorders (Van Soest and Mertens, 1984).
The soluble matter in feeds occupies very little space
in the rumen and is also rapidly removed by digestion and
I
i17 1
1
passage. On the other hand the cell wall component
represents the bulky part of the diet and is the best
estimator of the requirements of volume or rumen space
(Mertens, 1980). In crude fiber (CF) and ADF extractions
only part of the fibrous components are recovered,
therefore, NDF is considered the best estimate of the
"bulkyness" of the diet. NDF is also the component of the
diet best correlated with intake (Mertens, 1980), and ADF
is better correlated to digestibility because its
lignified matrix is the most unavailable feed fraction
(Van Soest and Mertens, 1984).
Another factor of the diet affecting the potential
voluntary dry matter intake is the forage source. Sullivan
(1973) mentioned that the dry intake of silage is always
lower than the intake of hay made of the same forage. The
average reduction in intake reported by Wilkins (1981) was
33% with a range of 1 to 64%. Many products of silage
fermentation have been reported to be negatively corre-
lated with intake. Some of these are total volatile fatty
acids, acetic acid and ammonia (McCullough, 1978 and
Wilkins, 1981).
Moisture content of the diet has been mentioned as a
factor responsible for reduced dry matter intakes 1
(National Research Council, 1988). According to Chase 1
(1979) there is a relationship between the dry matter ;1
l8
content of the diet and dry matter intake. As dry matter
content decreases voluntary dry matter intake increases.
This relationship was less precise for forages containing
more than 50% dry matter and it is not clear if this
relationship is linear or curvilinear. Also most of the
articles reviewed by Chase (1979) compare diets containing
variable amounts of hays and silages and, therefore, part
of the recorded differences in intake may be accounting
for differences in intake between hays and silages rather
than in moisture content. Also dryer diets may stimulate a
greater saliva production increasing the buffering
capacity of the rumen and indirectly increasing the dry
matter intake of the diet by promoting a better and faster
digestion of the fiber fraction (Nocek, 1988).
The environment, especially the temperature and
moisture content of the air, affects the potential dry
matter intake. Ruminants are homeothermic animals that
balance the heat gained from metabolism with the heat lost
or gained from the environment. Under most normal
conditions there is a continual loss of heat from the body
of the animal to the environment and the net heat loss
depends on the heat gradient. Also the higher the air
vapor pressure the lower the vapor pressure gradient from
the skin and the respiratory tract to the air. Hence the
lower the evaporation rate and the cooling effect of
19
sweating which is the most important mechanism of heat
balance in ruminants (National Research Council, 1981).
Milk production promotes a very intensive metabolic
activity and consequently heat production. The lower
critical temperatures of -14 and -40 QC for a dry pregnant
and lactating dairy cow producing 31.1 kg of milk a day
respectively has been estimated (National Research
Council, 1981). Under heat stress conditions the
lactating cow tends to reduce feed intake to reduce the
"heat load" and the decline in intake becomes apparent at
25-27 QC with a marked decline above 30 QC. At 40 QC it is
usually no more than 60% of the intake recorded at 18-20
QC (National Research Council, 1981).
6.b.Energy Intake
There are no specific signs of energy deficiency, but
4 in lactating dairy cattle it is primarily manifested by a
decline in milk yield, loss of live weight and a depressed
reproductive performance (National Research Council,
1988). There are many expressions of energy. These are
digestible energy (DE), metabolizable enrgy (ME), net
energy for maintenance (NEM), net energy for body weight
gain (NEG), net enrgy for lactation (NEL) and total
digestible nutrients (TDN) (National Research Council,
1981). These are used to express both animal requirements
and feed value. Digestible energy only takes into account
I

1 20 1
the loss due to the energy content of the ·feces and in
many cases DE is estimated from TDN using a value of 4.409
Mcal of DE per 1 Kg of TDN (National Research Council,
1981). The major criticism to the use of TDN is that this
index is estimated at maintenance or close to maintenance
level of intake so it has to be corrected to be used with
producing animals. Secondly level of depression of
digestibility with increasing intake is not equal for all
feed components (National Research Council, 1988; Tyrrell
and Moe, 1974). Also TDN content of roughages and
concentrates is used for production purposes with
different efficiency. Therefore for milk production, 1 Kg
of TDN from a forage source is not equivalent to 1 Kg of
TDN from a concentrate source. This is due to the
differences in energy losses in heat and gases during the
ruminal fermentative phase of the digestive process (Moore
et al., 1953).
Metabolic energy takes into account energy losses in
feces and in urine. The ME requirements of lactating cows
were obtained experimentally but there is little informa-tion about the ME value of feeds. Therefore they usually
are estimated from DE. Moe and Tyrrell (1976) proposed the
following equation to estiamte ME from DE: ME = -0.45 +
1.10*DE, where ME and DE are expressed as Mcal/Kg of drymatter in the feed.
21 .
«
As a way to minimize the bias introduced by the use of
TDN, DE or ME, net energy has been proposed as a system ?which takes into account digestive losses as well as
differences in nutritive value due to differences in level
of intake. The efficiency of utilization of NE of a feed
depends on whether it is used for maintenanace, growth,
milk production or fattening (Lofgreen and Garrett, 1968,
Moe et al., 1972) and for this reason each feed usually
has more than one NE value. These are NEM for net energy
of the feed for maintenance, NEG for weight gain, and NEL
for milk production. Lactating animals use feed NE with
the same efficiency for maintenance as for milk produc-
tion. Therefore a single NE value is required to estimate
energy requirements (Moe et al., 1972).
The requirements for milk production varies with
amount produced and fat content. The National Research
Council (1988) estimates this value as 0.74 Mcal NE/Kg for _
milk containing 4 % milk fat, but the equation is:
NEL (Mcal/Kg Milk)= 0.3512 + (0.0962*(% Fat))
Maintenance requirements depends on cow size and
activity of the cow. Moe et al. (1972) estimated the
maintenance requirements of lactating dairy cows as 73
Kcal of NE/Kg°·’5 of live weight and the National Research
Council (1988) estimates it as 80 Kcal/Kg°·’5 of live
weight allowing a 10% increase in maintenance to compen-
l

22sate
for activity. Also the NE requirements for pregnancy
increase exponentially with a marked increase during the
last 4 to 8 weeks of gestation (dry period). It has being
estimated as 30% of the maintenance requirements (Moe and
Tyrrell, 1972). According to Moe et al. (1972) an
additional 3 to 6 Mcal NE per day would be required to
meet these requirements.
In general DE, TDN and ME content of feeds was
obtained at maintenance levels of intake, but most of the
values of NE were obtained at higher levels (National
Research Council, 1988). Other values were estimated
according to the equation of Moe and Tyrrell (1976) which
uses the TDN value of the feed corrected by intake level.
The equation is as follows: NEL= 0.0245*TDN - 0.12, where
NEL is expressed in Mcal NE/Kg of dry matter and TDN as %
I of the dry matter.C
Another source of energy especially important during
the early lactation period is body weight loss. This is
estimated as 6 Mcal NEL/Kg body tissue and used with an
estimated efficiency of 82% for milk production (Moe et
al., 1971).
6.c.Protein Intake.
Protein is a vital nutrient required for maintenance,
reproduction, growth and lactation of dairy cattle and the
requirements for protein by ruminant animals are second in

123 l
quantity only to energy (Agricultural Reaserch Council,
1980). Ruminants can use many different sources of
nitrogen to meet protein requirements, but the tissue
requirements of ruminants as well as other animals are for
amino acids absorbed from the small intestine. Neverthe—less, their major ecological advantage is that true
protein can be synthesized from nonprotein nitrogen and
carbon skeletons by the ruminal microflora (Van Soest,
1982). Virtanen (1966) reported productions of 4000 kg of
milk per lactation using protein free diets, but the level
of production depends on the microbial flow from the rumen
(National Research Council, 1985). Under highly demanding
situations like fast growing animals or high yielding
lactating cows the microbial protein flow to the small
intestine may not be enough to satisfy the requirements of
the animal. Therefore, dietary protein escaping rumen
degradation is needed (Huber and Kung, 1981).
There are many nitrogen sources available in ruminant
diets. Some of these are proteins and peptides, free
amino acids and nonprotein compounds. Nonprotein compounds
include free ammonia, nucleic acids, urea, nitrates,Maillard products and some other nitrogen containing
compounds (Van Soest and Sniffen, 1984).
Feed nitrogen can be classified into three groups with
different biological significance: soluble nonprotein
( 24
nitrogen (NPN), true protein and unavailable protein.
Another classification is fraction A (soluble), BJ(available) and C (bound), respectively (Pichard and VanJ
Soest, 1978). From the point of view of ruminal avail- J
ability, the A fraction contains mostly NPN and rapidly
degradable protein, the B fraction is mainly true protein
that is degraded in the rumen at a measurable rate, and
the C fraction is unavailable. The C fraction is mainly
composed of Maillard products, lignified nitrogen and
tannin—protein condensates, which are very slowly or not
degraded at all in the rumen (Satter, 1986).
Rumen available feed nitrogen can be changed in the
rumen through proteolysis, deamination and microbial
protein synthesis (Tamminga, 1979). The extent to which
dietary protein can be altered in the rumen and used for
microbial protein synthesis is variable and a range from' 40 to 80% has been mentioned (Satter and Rofler, 1975).
The primary determinant of the amount of protein
synthesized in the rumen is the amount of energy available
for microbial growth. Chalupa and Ferguson (1988) reported
that the bacterial and protozoal crude protein flow can be
predicted with an accuracy of 77% if the daily NEL intakeis known. The other potentially limiting factor is the
availability of nitrogen. Dietary crude protein contentslower than 9% have been reported as limiting for fiber
J
25 1
digestion due to impaired microbial growth (Van Soest,
1982).
The potential degradability of a protein in the rumen
depends on microbial proteolytic activity, microbial
access to the protein, protein structure, rumen retention
time, rumen turnover and chemical and physical treatment
of feeds (National Research Council, 1985). Therefore,
protein degradability of a certain feedstuff will vary
with circumstances unique to its use.
The National Research Council (1988) uses two systems
to express protein content of feeds and requirements of
the animal. These are crude protein system and the rumen
degradable and undegradable systems. Crude protein (CP) is
the oldest method of expressing protein requirements, and
assumes all feed nitrogen is protein and this protein has
a nitrogen content of 16%. The main disadvantage is it
does not differenciate between nonprotein and true protein
nitrogen. Also it does not differenciate between ruminally
degradable and undegradable protein, but the analysis is
easy to perform, highly repeatable and most of the
experimental data uses CP as the unit to express the
protein requirements of ruminants. Also there is a strong
relationship between the protein content of the diet and
animal response (Van Horn, 1982). The new National
Research Council (1988) system establishes requirements

1 261 1
for rumen undegraded intake protein (UIP) and degraded
intake protein (DIP). This system takes into accountsimultaneously the crude protein requirements of the
ruminal microbes and the host animal. Measuring the
undegraded protein content of a feedstuff requires the
measurment of the total protein flow to the intestine and
the separation of the protein of dietary origin from the
proteins of bacterial, protozoal and endogenous origin. In
vivo estimates (sampling of abomasum or duodenum content),
in situ (ruminal incubation of feeds in dacron bags) and
in vitro techniques (laboratory procedures) have been used
to evaluate feed proteins, but the experimental data is
still limited and based on very few observations of each
feedstuff (National Research Council, 1988).
The in vivo method to estimate ruminal degradability
of proteins is expensive and labor—intensive, and requires
the use of surgically prepared animals with cannula in the
abomasum or proximal duodenum. The method is not perfect
and the main sources of error are the measurment of rumen 2turnover and the difficulty in estimating protein from
protozoal and endogenous origin. Nevertheless, it remains
the reference method (Stern and Satter, 1982).‘
The main advantge of in vitro methods is they are
cheaper than in vivo methods and they do not require
cannulated animals or sophisticated laboratory equipment.
27
Results are obtained in a relatively short period and they
allow the testing of large numbers of samples. Also the
use of enzymes eliminates the problem of microbial
nitrogen contamination due to microbial attachment to
fiber particles when analyzing forage proteins (Poos—Floyd
et al., 1985).
Enzymes of different origin (bacterial, plant and
fungal proteases) have been used to estimate rumen escape
nitrogen. Poos-Floyd et al. (1985) found the enzyme assay
more closely related to in vivo protein escape than any of
the five solubility techniques evaluated. Nocek et al.
(1983) conclude that the protease from Streptomyces
griseus could be used to determine the amount of protein
escaping degradation in the rumen.
Other in vitro methods involve separation of true
proteins soluble in neutral and acid detergent solutions
(Pichard and Van Soest, 1978). The main advantage is the
method can be easily adapted by most analytical laborator-
ies. One N fraction is buffer insoluble but soluble in Äneutral detergent solution. This fraction is a constitu-
ent of the cell solubles and would have a fast rate of
digestion (subfraction B1). The protein insoluble in
neutral but soluble in acid detergent is considered as
completely available but digested at a slower rate (B2)
than the previous fraction. The nitrogen insoluble in acid I
L
28 ;
detergent is considered unavailable and represents the C
fraction (Pichard and Van Soest, 1978).
Another in vitro method used to estimate protein
degradability is protein soluble in certain solutions.
Many solvents including water, autoclaved rumen fluid,
mineral buffers simulating saliva or rumen fluid and salt
solutions have been used, but at present there is no bestmethod for this determination (Krishnamoorthy et al.,
1982). The in vitro solubility of a protein is affected by
many factors such as agitation, lenght of extraction time,
temperature, pH, ionic strenght,etc. (Waldo and Goering,
1979). Also protein structure affects solubility. Albumins
and globulins are more soluble than prolamines and
glutelins and the former include NPN and the latter bound
nitrogen in their estimations respectively (Who1t et al.,, 1973). Another shortcoming of this method is soluble
protein tends to be rapidly degraded but insoluble protein
is not synonomus with undegradability. On the other hand,
Satter et al. (1977) reported that the regression of g
solubility and degradability is 0.54 indicating that
solubility can explain approximately one half of the
variation found in ruminal degradability.
Estimation of protein degradability in the rumen using
the in situ method is an alternative technique thatprovides rapid and reliable estimates for a relatively
l

29
large number of samples and a wide Variety of feedstuffs. 1An advantage of this technique compared to laboratory 1
methods is the feedstuffs are subject to the digestion 1
processes that occur in the rumen (Orskov et al., 1981).
The method is based in the suspension of dacron bags
containing the feedstuffs to be tested in the rumen for
different periods of time. After the incubation the
residues are analyzed for chemical components and thedissapearance from the bag are regressed on time of
incubation and the dissapearance rate per unit of time is
determined (Broderick, 1982).
There are a number of factors in this technique that
may affect the results, leading to erroneus interpretation
of the data. Among these factors are the bag pore size,
sample weight to bag surface area ratio, sample particle
size, presoaking, bag introduction sequence into the
rumen, cow and time Variation, cow diet and bacterial
nitrogen contamination are the most relevant (Nocek,
1985). ;1
Nocek (1985) concluded based on in situ soybean meal
incubation that:
1. The ruminal introduction of bags in reversal order
(72 h first, 1 h last) decreased Variation of in 1
situ digestion profiles. 12. Use of standard ingredients detected time related 1
30 I
I
variation.
3. Bacterial N contamination did not affect N
digestion rate constant.
4. The dissapearance of soluble dry matter and N
during presoaking is affected by sample particle
size and sample weight to bag surface area ratio
and bag pore size.
5. Sample particle size of 1, 2, or 5 mm or unground
had no influence on DM or N digestion.
6. Sample weight to bag surface area ratio of 12.6
mg/cmz compared most favorably with literature in
vivo estimates for ruminal N digestion.
7. Bag pore sizes from 40 to 102 microns were similar
and higher in estimated ruminal protein availabil-
ity than smaller pore sizes, and compared favorably· with in vivo literature estimates.
In both methods in vitro and in situ, the degradation
of protein has been described as a function of time of
incubation and only fraction B is considered to be ;
affected by relative rates of passage and degradation.
This potentially degradable fraction has been described by
first order (linear model) kinetic rate constants, and a Yprimary assumption of the first-order kinetic model is the „
pool is homogeneous and degraded as a linear function of I
time in the rumen. These assumptions are violated when theÄ
31
soluble (A) and the nondegradable (C) fractions are not
determined and substracted from the fermentation sequenceor when an heterogeneous mixture of potentially degradable
fractions is present and is degraded simultaneously at
different rates (Nocek and English, 1986).
A monoexponential rate of decay describes the
degradation of fraction B and estimates its value at 0
time. The degradation constant K6 is obtained by
regressing the natural logarithm (Ln) of the percent of
sample remaining in the bag minus the C fraction over
time. In this way the intercept and the slope of the
resulting stright line represent the content of the B
fraction in the original sample (B at time 0) and the
degradation constant (K6) respectively (Zerbini, 1984).
7. Effect of the diet on milk composition.
In general the fatty acids in milk are 50% derived
from synthesis within the mammary gland and 50% from
dietary origin. The short chain fatty acids resulting from
the rumen fermentation (C1 - C12) are almost entirely
synthesized in the mammary gland from acetate and
beta-hydroxybutyrate , whereas long chain fatty acids (C16
or greater) are almost exclusively of dietary origin.
Intermediate length fatty acids (C12 - C16) are from both
sources (Linn and Otterby, 1988).
The amount and physical and chemical characteristic ofLLL _ _ _.

32 L1
dietary carbohydrates affect both fat and protein content
of milk. Carbohydrates account for 60 — 80% of the dry
matter of the diet of a dairy cow. Carbohydrates are
present as structural material (cellulose, hemicellusose,
etc.), plant reserve products (starch, fructosans, etc.)
and as simple sugars. Carbohydrates are the primary source
of energy of the rumen microbes and the variation in their
composition or quantity affects the composition of the
microbial population and as a result the end products of
rumen fermentation (Rook, 1976).
Milk fat percentage is positively related to rumen
molar percentages of acetic and butyric acids and
negatively to propionic acid. The typical composition
(molar percentages) of short chain fatty acids in rumen
liquor of cattle in a high fiber diet is 60 — 70% acetic,
17 - 20% propionic and 7 — 12% butyric acid. A progressive
substitution of roughages by starchy concentrates is
followed by a fall in acetate and an increase in propionic
concentration. This change is a result of a switch in
microbial population (Rook, 1976).
Feeding readily fermentable carbohydrates depresses
fiber digestion, rumen pH, and production of acetic and
butyric but promotes production of propionic acid in the
rumen. Increased propionic acid promotes an increased
glucose formation in the liver and consequently an
33 1I
increase in insulin production. This increased insulin
level reduces the availability of body fatty acids for
milk fat synthesis which along with a reduced supply of
acetic and butyric acids from the rumen may cause a
depression in milk fat content (Linn and Otterby, 1988).
It has been reported that a rumen molar percentage
higher than 25% of total volatile fatty acids from
propionate is needed before there is a significant
negative relationship with milk fat. Also a linear
increase in milk fat percentage occurs as the ace-
tate/propionate ratio increases up to 2.2, above this
level little change in milk fat has been found (Linn and
Otterby, 1988).
The critical forage/concentrate ratio appears to be
40/60 in a dry matter basis, beyond which additional
concentrate drastically lowers milk fat content. Also at
high levels of intake more forage is needed in the diet
than at lower levels of intake to maintain normal milk fat
percentages. Finely ground forages result in higher levels
of propionate during the fermentation in the rumen,
lowering milk fat content. Woodford et al. (1986) reported
that a mean particle size of 0.64 cm or greater is
required to keep the molar percentage of propionate below
25% and a milk fat content of 3.6% or above.
Mertens (1985a) recommended a minimum of 28% NDF or a
34
daily amount equivalent to 1.2% of body weight. This
relates to about 18% ADF in diets of lactating cows in
order to maximize milk and fat yield. Stage of maturity is
important because it effects fiber content of the forage.
Also carbohydrate source can influence rumen fermentation
and as a result milk fat content. Sutton (1985) reported
the lower ruminal degradability of corn compared to barley
would result in production of milk with a higher fat test.
The effect of dietary crude protein is to affect milk
yield and as a result milk protein yield, but only a small
effect on milk protein percentage (Linn and Otterby,
1988). Insufficient amounts of dietary protein will
reduce milk protein concentration. This effect in
minimized when protein of low ruminal degradability is
fed, but an increase of dietary crude protein supply has
, little effect on milk protein percentage (Linn and
Otterby, 1988).
The total amount of energy consumed, the energy
density of the diet and the source of dietary energy all
have been reported to affect the protein content of milk.
Cragle et al. (1986) in a review of 36 experiments
reported that cows consuming diets with 59% concentrates
produced more milk, milk protein, fat and lactose than
cows on diets containing 49% concentrates. The increase in
milk protein was 85% attributable to an increased milk
L
35 )
yield and only 15% to increased milk protein percentage.
The increased production of propionic acid in the rumen
induced by the feeding of higer proportions of concen-
trates or reducing forage particle size increases milk
protein content, but the exact mechanisms are unknown
(Rook, 1976).
It is very difficult to change the lactose content of
milk because it is the main osmotically active constituent
and is the main determinant of milk yield. Lactose
percentage is not increased by high concentrate feeding.
Severe malnutrition or underfeeding of energy in early or
late lactation or protein in early lactation can decrease
lactose percentage (Linn and Otterby, 1988).
MATERIALS AND METHODS
1. Field Trial.
At the Virginia Tech Dairy Center, three fields of 5.6
(PT), 3.8 (HB) and 7.6 (Wt) hectares and having soils of
the groups Duffield-Ernest Complex, Guernsey silt loam and
Groseclose and Poplimento Soils, respectively, were planted
with Maury barley. They were seeded using a planter (3.20 m
width) with a distance between rows of 17.8 cm.
Fertilization was according to soil analysis (Table 1).
The second nitrogen fertilization in spring consisted of 58
kg/ha of N to each field on April 24.
On April the lst, at Zadocks' Growing Stage 30 (1974),
plant tissue samples were collected from each of the three
fields and analyzed for macro and micro mineral content (A
& L Agricultural Laboratory). Results are presented in
Table Al of the Appendix.
Rainfall and average daily temperature recorded during
the growing season of the crop is presented in Table All of
the Appendix.
According to slope, each field was divided into two
blocks of approximately the same area, after which areas
corresponding to each treatment were randomly assigned.
Field treatments were whole barley plant harvested at (
364
X
X
“ 37
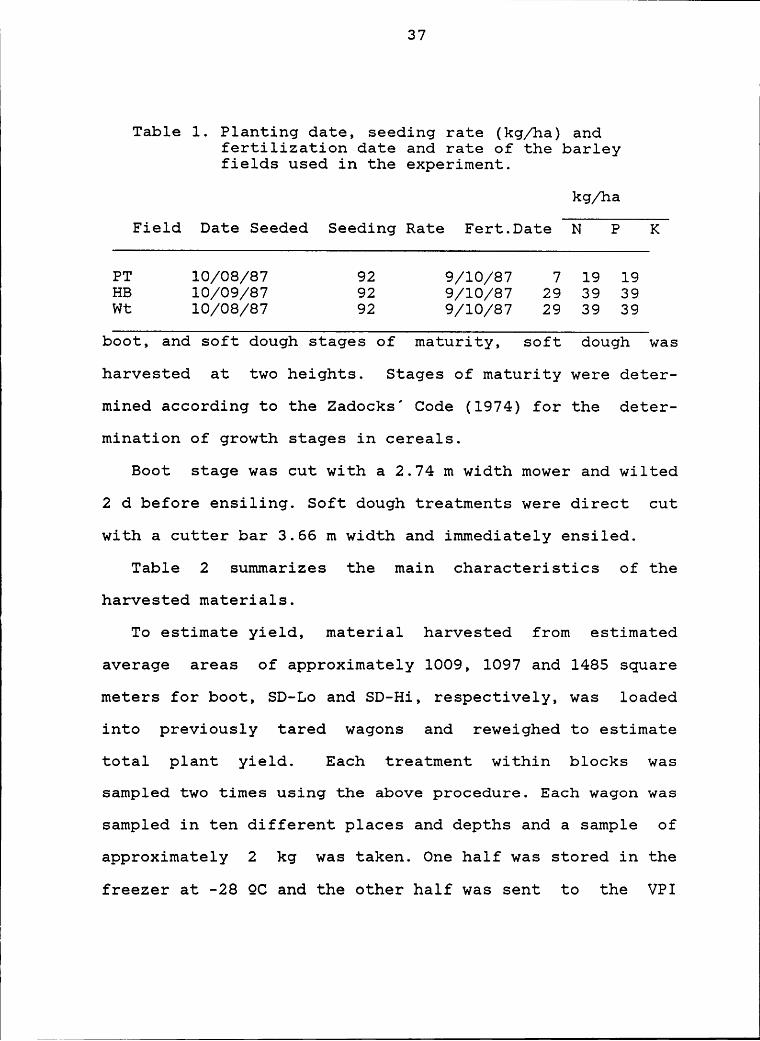
ITable 1. Planting date, seeding rate (kg/ha) and
fertilization date and rate of the barleyfields used in the experiment.
kg/ha
Field Date Seeded Seeding Rate Fert.Date”ü””—E——”E—
PT 10/08/87 92 9/10/87 7 19 19HB 10/09/87 92 9/10/87 29 39 39Wt 10/08/87 92 9/10/87 29 39 39
bwaSharvested at two heights. Stages of maturity were deter-
mined according to the Zadocks’ Code (1974) for the deter-
mination of growth stages in cereals.
Boot stage was cut with a 2.74 m width mower and wilted
2 d before ensiling. Soft dough treatments were direct cut
with a cutter bar 3.66 m width and immediately ensiled.
Table 2 summarizes the main characteristics of the
harvested materials.
To estimate yield, material harvested from estimated
average areas of approximately 1009, 1097 and 1485 square
meters for boot, SD-Lo and SD—Hi, respectively, was loaded
into previously tared wagons and reweighed to estimate
total plant yield. Each treatment within blocks was
sampled two times using the above procedure. Each wagon was
sampled in ten different places and depths and a sample of
approximately 2 kg was taken. One half was stored in the
freezer at -28 QC and the other half was sent to the VPI
I
38I
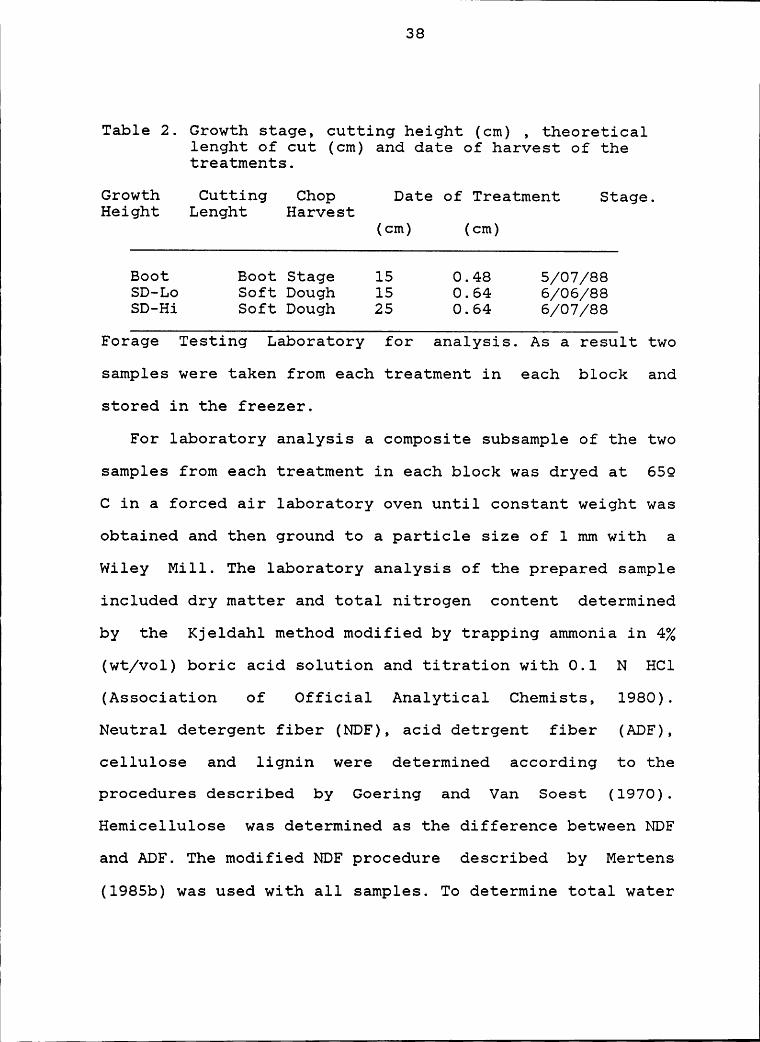
Table 2. Growth stage, cutting height (cm) , theoreticallenght of cut (cm) and date of harvest of thetreatments.
Growth Cutting Chop Date of Treatment Stage.Height Lenght Harvest
(Cm) (Cm)
Boot Boot Stage 15 0.48 5/07/88SD—Lo Soft Dough 15 0.64 6/06/88SD-Hi Soft Dough 25 0.64 6/07/88
twosamples were taken from each treatment in each block and
stored in the freezer.
For laboratory analysis a composite subsample of the two
samples from each treatment in each block was dryed at 659
C in a forced air laboratory oven until constant weight was
obtained and then ground to a particle size of 1 mm with a
Wiley Mill. The laboratory analysis of the prepared sample
included dry matter and total nitrogen content determined
by the Kjeldahl method modified by trapping ammonia in 4%
(wt/vol) boric acid solution and titration with 0.1 N HC1
(Association of Official Analytical Chemists, 1980).
Neutral detergent fiber (NDF), acid detrgent fiber (ADF),
cellulose and lignin were determined according to the
procedures described by Goering and Van Soest (1970).
Hemicellulose was determined as the difference between NDF
and ADF. The modified NDF procedure described by Mertens
(1985b) was used with all samples. To determine total water
II
1 39 I
I
soluble nitrogen 20 g of fresh sample were thawed and
homogenized with 100 ml of distilled water for 2 min in a
commercial blender, then filtered through 4 layers of
cheese cloth and the filtrate centrifugated at 27,000 g for
20 min. Total nitrogen was determined on the supernatant by
Kjeldahl as described above. True protein in the superna-
tant was precipitated using a solution of 50% (wt/vol)
tricholoacetic acid (TCA), until a concentration of 10% of
TCA in the sample was obtained. Then the sample was centri-
fugated again at 27,000 g for 20 minutes and total nitrogen
determined in the supernatant. Water soluble true protein
was estimated by difference. Soluble sugars were estimated
by the procedure described by Davis (1976).
Analytical procedures were conducted in duplicate and
repeated when disagreement between duplicates were greater
than 5%. A completely randomized block statistical design
was applied for the analysis of the data, with 3 treatments
and 6 blocks. The Duncan’s Multiple Range Test was the
means separation test used.
To analyze the yield and composition of the harvested
material the following statistical model was applied:
Y15=}J.+<!1 +ß5 +815
where:
Y:;0bserved Value of Treatment i in Block j for
yield and composition of the harvested mate-
40
Nrial.
u Population Mean
al Treatment Effect (i= 1-3)
B; Block Effect (j= 1-6)
s1;Random Error associated to the observed value
of treatment i in the block j.
Table A6 of the Appendix presents a typical analysis of
variance table for this trial.
2. Silage Evaluation.
Harvested material was ensiled in three stave silos of 3
m diameter and 12 m height. Because field yields were much
greater than silo capacities only part of the harvested
material was ensiled. Silo 1 contained material harvested
at boot stage (boot) and was composed 39% of wet material
from HB and 61% from PT fields. Silo 2 contained material
harvested at soft dough at 15 cm above ground (SD—Lo) and
was 90% filled with material from the PT field and 10% from
WT. Silo 3 contained material from the treatment SD—Hi, and
89% of the material came from PT and 11% from WT fields
respectively.
Each silo was filled in the same day of the harvest and
a partial wagon load was blown into the silos the next
morning after material settled. Then silos were sealed with
a layer of ultra violet nylon until opened on July 11th,
1988. After opening spoiled top material of each silo was

41 I
unloaded, weighed and sampled to determine composition.
During the feeding period, silages were sampled once a
week and stored in the freezer at -289 C for chemical
analysis. For analytical purposes silage samples were
composited by two week periods, except the first period
that was composed of 3 weeks.
Silages were dried in a forced air laboratory oven at
659 C and then ground with a Wiley Mill fitted with a 1-mm
screen. Laboratory analysis of the silages included DM
determination as described above, total nitrogen by the
Kjeldahl method as previously described and expressed as
crude protein (CP = N x 6.25), total water soluble nitrogen
and total water soluble true protein as described, and
insoluble nitrogen in a borate phosphate buffer (BUFFIN-4
SOL-N) as described by Krishnamoorthy et al. (1982).
Neutral (NDIN) and acid (ADIN) detergent insoluble nitrogen
were determined using filter paper (Whatman 541, 12.5 cm)
instead of crucibles to collect the residue. NDIN and ADIN
were determined by Kjeldahl on both filter paper and
residue and then corrected by nitrogen content of the
filter paper. Neutral detergent fiber (NDF), acid detergent
fiber (ADF), cellulose and lignin were determined according
to the procedures of Goering and Van Soest (1970), and
hemicellulose was determined by difference between NDF and
ADF. Phosphorus, potassium, calcium, magnesium, sodium and

4211
sulphur (P, K, Ca, Mg, Na and S) were determined following
nitric and perchloric acid wet digestion (Association of
Official Analytical Chemists, 1980), and reading the
mineral concentration in an Inductively Coupled Plasma(ICP) Spectrometer (Soil Testing and Plant Analysis Labora-
tory of VPI). Silage pH was determined according to the
extraction and analytical procedure described by Barker and
Summerson (1941). Lactic acid content was determined by
colorimetry according to the procedure described by Barker
and Summerson (1941) and modified by Pennington and Suther-
land (1956). Acetic, propionic and butyric acids were
determined using a Vista 6000 (Varian Associates, Inc.) gas
chromatograph fitted with a hydrogen flame ionization
detector, and maintained at 1759 C. Approximately 2 ul of
silage extract were injected into the column (the glass
column, 1.8 m x 2 mm internal diameter, packed with 10% SP
1200, 1% H¤PO4 on 80/100 Chromabsorb W.AW.), held at 1259
C. Temperature of the injection site was held at 1809 C,
and nitrogen was used as carrier gas (4 ml/min).
All the analytical procedures were run in duplicates and
repeated when disagreement between replicates was greater
than 5%. To analyze silage data a completely randomized
statistical design was applied. The Duncan's Multiple Range
Test was used to compare means.
To analyze silage composition the following statistical
1
43
Lmodel was applied: ’
Yi;=u+a:+si;
where:
Yi; Observed value of treatment i, period j
u Population mean
ai Effect of treatment i (i=l—3)
si; Random error associated to the observation of
treatment i in period j
Table A7 of the Appendix presents a typical analysis of
variance table for this data.
3. Heifer Digestibility Trial.
An In Vivo digestibility trail was conducted between
August 8 and 20, 1988. For this trial 12 Holstein heifers
weighting 291 +/— 17 kg and with an average age of 11.1
+/-0.4 months were blocked according to body weight and
randomly assigned to one of the 3 silages. Heifers were
housed in individual stalls with concrete floor. Between
8/03/88 and 8/08/88 heifers were introduced to a general
pre-experimental diet of barley silage harvested at soft
dough stage plus 57 g/heifer/d of mineral supplement top
dressed on the silage. Composition of this silage is
described in Appendix Table A5 and the composition of the
mineral supplement is described in Table A4. During the
pre-experimental, adaptation and collection periods heifers
44N
I
were individually fed using wooden boxes fitted to the
stalls. They were fed once daily at 1130. Feed refusalswere swept, weighed and the weight recorded daily at 1100.
The adaptation period lasted 6 d (from 8/O9/88 to 8/15/88).
During this period heifers were fed in excess of their
appetite and voluntary intake of each heifer was recorded.
The collection period lasted from 8/16/88 to 8/20/88 and
from 8/13/88 the amount of feed offered was 90% of the
voluntary intake recorded during the adaptation period.
During the collection period all the feces were manually
collected and to avoid urine contamination the concrete
floor was washed with water using a high pressure hose
after urination. This required 24 h/d monitoring for the 5
d collection period.
Approximately 0.5 kg of each of the silages fed were
sampled each day of the collection period from the carts
before feeding and stored in the freezer for later analy-
sis. Feces from each heifer were collected in previously
tared containers. The weight of the feces was recorded
daily at 1200 and an aliquot equivalent to 2% of the
recorded weight was taken and stored at 4Q C until the end
of the collection period. At the end of the collection
period the 5 feed samples/heifer were composited by silo
and the 5 fecal samples were composited by heifer.
Silages and fecal samples were analyzed for total
I
45
J
nitrogen by the Kjeldahl method modified by trapping
ammonia in a 4% (wt/vol) boric acid solution and titration
with 0.lN HC1. To minimize loss of volatile nitrogenous
compounds the total nitrogen determination was done on the
fresh materials. The frozen silages were ground in a Wiley
Mill fitted with a 5 mm screen using dry ice, then mixed,
subsampled, thawed and analyzed. Feces were digested along
with filter paper (Whatman 541, 12.5 cm diameter) and the
nitrogen content of the feces determined by substracting
the nitrogen content of the filter paper.
For the remaining analytical procedures, silages and
fecal samples were dried at 659 C in a laboratory forced
air drying oven and ground in a Wiley Mill fitted with a 1
mm screen. Dry matter was determined as described. Ether
extract (EE) was meassured using petroleum ether as the
extraction solvent. The sample was washed 1 h and rinsed 2
h in a Soxtec System HT apparatus (Tecator). The EE content
was determined by weight difference before and after
extraction in previously tared extraction cups. Acid
detergent fiber (ADF) and neutral detergent fiber (NDF)
were determined according to the method described by
Goering and Van Soest (1970). The inorganic content was
determined by ashing samples of silages and feces in a
laboratory muffle furnace at 6029 C for 3 hr. Organic
matter was calculated as the difference between dry matter
46
and ash content of each sample. The content of nitrogen
free extract was calculated as the difference between dry
matter and the remainder of the proximate components. The
procedures described by Schneider and Flatt (1975) were
used to calculate the digestibility of the different
fractions.
The acid detergent fiber content was used to estimate
crude fiber, according to the following equation:
ADF%= (Crude Fiber / 0.75) - 3.56 by Martin (1980).
The calculation procedure to estimate total digestible
nutrients (TDN) was the one described by Schneider and
Flatt (1975).
The statistical procedure to analyze the digestibility
data was a completely randomized block design with 3
treatments and 4 blocks. To analize the digestibility
coeficients of the proximate fractions and the TDN content
of the treatments the following statistical model was used:
Ylj =}.1+<!1+ßj +815
where:
Yij Observed value of treatment i in block j
u Population mean
dx Effect of tretment i (i=l-3, silages)
Bj Effect of block j (j=l—4, heifers)
sjj Random error effect on the ijth observation
A typical analysis of variance table for the evaluation
47
of the digestibility data is presented in Table A8 in the
Appendix.
4. Lactating Cow Feeding Trial.
Thirty six lactating Holstein cows, 18 primiparous, and
18 with an average lactation number of 3.4 +/— 1.9, an
average milk production of 32 +/— 5 kg/d, 72 +/- 40 days in
milk and a body weight (BW) of 567 +/- 62 kg, were blocked
according to milk production, days in milk and lactation
number and assigned to one of six experimental diets. A
pre—experimental diet containing barley silage harvested at
soft dough and 15 cm cutting height was fed to all cows for
17 d (from 6/27/88 to 7/13/88). Composition of this diet is
described in Table A2 in the Appendix. The feeding trial
lasted 60 d (from 7/13/88 to 9/11/88). Experimental diets
were formulated to be isonitrogenous with a CP content of
16% on DM basis. Each diet was the combination of one of
the three treatments of barley silage and two forage /
concentrate ratios on a DM basis (75/25 or 60/40) (Table
3).
The concentrate ingredients were soybean meal, dry
shelled corn and a commercial mineral supplement. The
composition of the concentrates and the mineral mix is
presented in Appendix Table A3.
Silages were removed from silos two times daily, at 1100
and 1400 and the diets mixed twice daily (1200 and 0500).
48 11
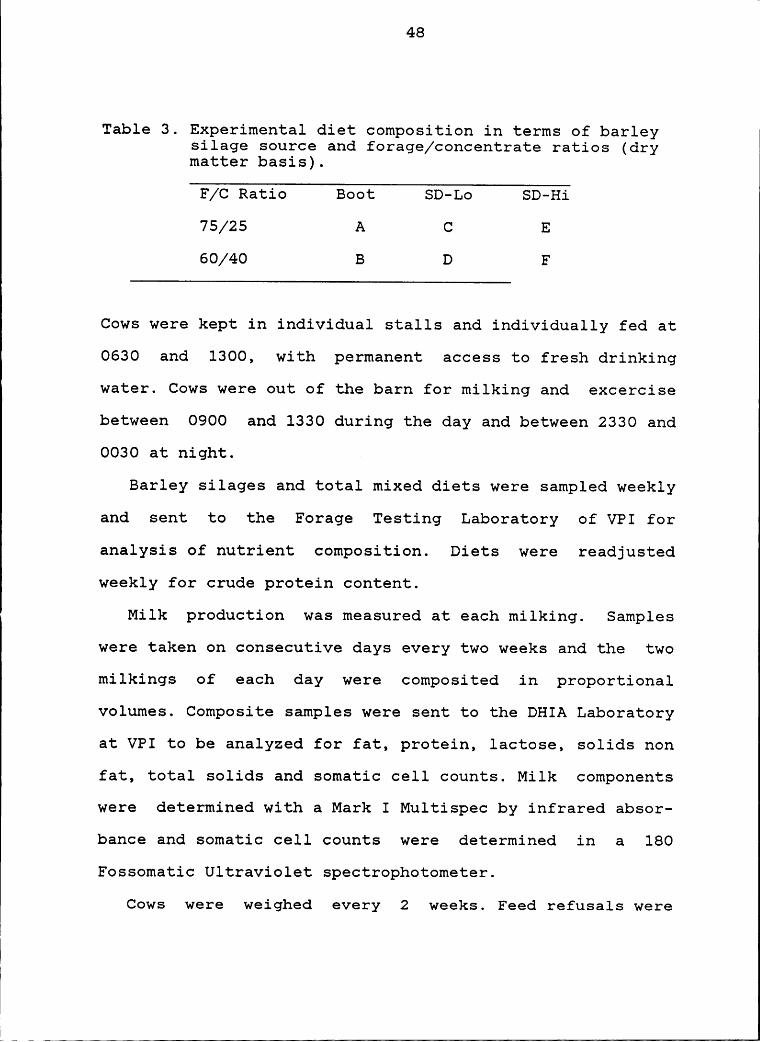
Table 3. Experimental diet composition in terms of barleysilage source and forage/concentrate ratios (drymatter basis).
75/25 A C E
60/40 B D F
Cows were kept in individual stalls and individually fed at
0630 and 1300, with permanent access to fresh drinking
water. Cows were out of the barn for milking and excercise
between 0900 and 1330 during the day and between 2330 and
0030 at night.
Barley silages and total mixed diets were sampled weekly
and sent to the Forage Testing Laboratory of VPI for
analysis of nutrient composition. Diets were readjusted
weekly for crude protein content.
Milk production was measured at each milking. Samples
were taken on consecutive days every two weeks and the two
milkings of each day were composited in proportional
Volumes. Composite samples were sent to the DHIA Laboratory
at VPI to be analyzed for fat, protein, lactose, solids non
fat, total solids and somatic cell counts. Milk components
were determined with a Mark I Multispec by infrared absor-
bance and somatic cell counts were determined in a 180
Fossomatic Ultraviolet spectrophotometer.
Cows were weighed every 2 weeks. Feed refusals were
11
49 ‘
WW
weighed four times a week (Tuestday to Friday) at 0900
after the cows were taken out of the barn. Intake was
calculated as the difference between amount offered daily
and amount rejected.
In this experiment there were 6 treatments (diets) and 6
blocks. The statistical model to analyze milk production,
milk components, dry matter intake and body weight change
was the following:
Ys.5=}J.+¤1+ß5+£15
where:
Yi; = Observed value of treatment i and block j
ai = Effect of treatment i (i=A to F)
B; = Effect of block j (j=1-6)
si; = Effect of random error on ijth observation
A typical analysis of variance table used for milk
production, milk components, dry matter intake and body
weight change is presented in Table A9 in the Appendix.
Average daily milk production and milk components of the
pre—experimental period were used as covariates for analy-
sis. To test the interaction, silage source x forage /concentrate ratio a model containing 3 silage treatments, 6
blocks and 2 concentrate levels was used, an example of
this analysis of variance table is presented in Table A10
in the Appendix.

50
In all cases the mean separation procedure used was the
Duncan’s Multiple Range Test.
To estimate the relationship among the variables DM,
TDN, ADF, milk yield, 4% fat corrected milk yield, milk
fat, dry matter intake, intake of TDN, intake of ADF, and
body weight change associated with the experimental diets,
the correlation coefficients between these variables were
calculated based on one observation per cow (n=36).
5. Ruminal Deqradability Study.
The In Situ bag technique was used to determine the
ruminal degradability of dry matter, nitrogen compounds and
acid detergent and neutral detergent fiber fractions of the
three silages. Also concentrate ingredients and the six
total mixed rations used in the feeding trial were analyzed
and degradabilities determined.
Two ruminally fistulated cows producing an average of 34
kg of milk per day were used to incubate the feedstuffs.
Cows were fed a barley silage based diet for 10 days before
incubations were started. Composition of the diets of these
two cows is described in the Appendix Table A2 and is the
same as that fed in the lactating cow feeding trial.
The bags (10 x 20 cm) for incubation were made of spun
polyester, with a pore size of 59 microns. Between 5 and
10.5 g of feedstuff were placed in each bag giving a sample
weight to bag surface area ratio of 12.5 to 26.3 mg/cmz
51
(Nocek, 1985). Due to the large number of feedstuffs to
test, samples were grouped and incubated in two separate
runs. On 9/21/88 at 1900 the silages (boot, SD—Lo and
SD-Hi) and the concentrates (soybean meal and shelled
corn), were tested. On the second run on 9/28/88 at 1900
the experimental diets A to F were incubated.
Bags were removed at 0, 2, 12, 24 and 72 h respectively.
Two bags were used for 0 and 2 h, three for 12 and 24 h and
four bags for 72 h, for a total of 14 bags per feedstuff
tested and a maximum of 72 simultaneous bags per cow. Bags
were tied to a chain attached to the fistula lid according
to incubation time. Before placement in the rumen, bags
were soaked in warm (309 C) tap water for 15 min to remove
water soluble material and to reduce lag time for wetting
in the rumen. Bags were physically pushed into the rumen
and placed into the ventral sac in reverse order, beginning
with the 72 h group at 1900 h. All were removed at once at
the end of the 72 h period (Nocek, 1985). Immediately after
removal bags were placed in an ice bath to stop or minimize
bacterial activity and then rinsed overnight until rinse
water was clear. Bags were then individually rinsed by
hand, opened and placed in a forced air oven at 659 C until
constant weight was reached. Bags with the dried residue
were weighed to estimate DM disappearance. Bag residues
were composited according to feedstuff and incubation time
52
and ground to a particle size of 1 mm in a Cyclone mill.
Laboratory analysis of the incubated residues includednitrogen content by the Kjeldahl method as previously
described, and acid detergent and neutral detergent fiber
by the Goering and Van Soest (1970) method.
Nitrogen, ADF and NDF were corrected by DM disapperance
in each incubation time to estimate the ruminal degradation
of the fractions. The ADF and NDF content of the 72 h
incubation time of soybean meal and shelled corn was not
estimated because of the small amount of residue.
The degradability of the dry matter, nitrogen compounds,
ADF and NDF fractions of the feedstuffs was calculated
according to the procedures described by Zerbini (1984).
Only fraction B was considered to be affected by relative
rates of passage and degradation at any time. To describe
the degradation of fraction B and to estimate its value at
time 0 a monoexponential rate of decay was used. The
degradation constants kd were calculated regressing the
natural logarithm (Ln) of the per cent of residue remaining
minus the residue in the C fraction (residue at 72 hours)
over time. Intercept and slope of this regression line
represented the value of the B fraction in the original non
incubated sample and its degradation constant rate (kd)
respectively.
The B fraction is calculated by the following equation:
53 '1
B = E-intercept
where: e = 2.71828 'Knowing the amount (dry matter, nitrogen, ADF or NDF) in
fraction C and fraction B at 0 time, the content in frac-tion A can be calculated as follows:
A = 100 - (B + C)
The feedstuff fraction remaining in the bag at any time
can be calculated as follows:Fraction remaining = B x
e‘“° + C for any t>0
so (Fraction remaining - C) = B xe‘“°
or Ln(Fraction remaining - C) = Ln B - kt
where:
Ln B = intercept (regression line)
k = slope (regression analysis)
t = any point in time (hours)
C = residual at 72 hours,(or 24 for NDF and
.ADF of soybean meal and corn)
After determinig the fraction content (per cent of dry
matter, nitrogen, ADF or NDF) in fractions A, B and C the
fraction degradability (D) in per cent can be calculated
using the equation of Orskov and McDonald (1979) as fol-
lows:
D = A + (B x ka)/(ka + k„)
where:
D = Fraction (DM, N, ADF or NDF) degradability (%)
l 54
1A = Fraction readily degraded (Z)
B = Fraction degraded at a measurable rate (Z)
kd= Degradation constant rate of fraction Bk„= Rumen turnover rate (assumed to be 0.05/Hour)
To analyze the data a general linear model procedure was
used.
To test predictability, estimated and observed parame-
ters were tested by means of a "t" test.
RESULTS AND DISCUSSION
1. Field Trial.
Information about yield and content of unensiled forages
are in Table 4. Early harvest resulted in a 58% reduction
in dry matter yield of the Boot treatment compared to
SD-Lo. Also the increase in height of the cutting bar
caused a 28% decrease in yield. These results indicate that
approximately half of the yield harvested at soft dough is
produced in the last month of growth. Edmisten (1985) and
Polan et al. (1968) also reported reductions of the dry
matter yield of approximately half when barley was har-
vested at boot compared to soft dough.
The dry matter percentage of the harvested material is
lower for the Boot treatment (31.5%), even after 2 days of
wilting. The soft dough treatments were similar in dry
matter content (34.2 vs. 35.3%) and within the recommended
range for direct cut (Gardener and Wiggans, 1961).
The crude protein percentage is 97% higher for the
earliest material and not different between soft dough
treatments. This is in agreement with the findings of Polan
et al. (1968) and Cherney and Marten (1982).
Water soluble nitrogen and true protein were not
different among treatments. This data is in close agree-
ment with the reports by Raymond (1969) because in most
55
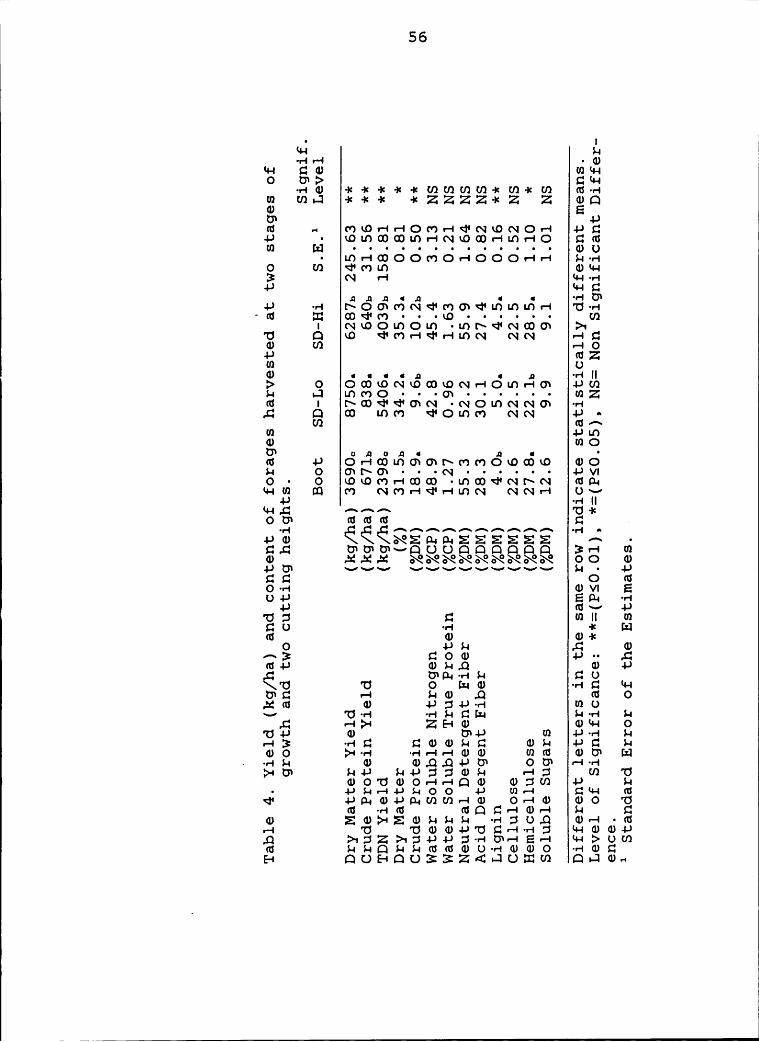
I56
I
• I$#-4 $-4•HH •®
*4-I GID 07*4-4O
Z gQC7 -I-*cu -4 muc-4-4Om-4<I4Nx¤NO-4 4-*Q
I I I I I I I I I I I I I$-4--4
O U) <l"(*7L!7 4)*4-I3 N 4-4 44-4--4
4-* 4+-4Q¤.¤.¤«.¤ • • ·¤··IU‘
-I-* -4-II I I I I I III
NROOLDOLI7 ·u’7l*<l'NCDO7 >1*0 Q LO <4•m-4<1•-4mN NN -4::0 U) ¤·-IO-I-* w’ZU} UI G) ••••,¤ • ,¤ -4-III:> O
I I I I I I IIcu
4 •NOI-DNNO7 --4S cn mm <I•Omm NN 4; ·U1 4-*Ll7(D (HOU* o..¤¤n• .¤ • •w 4-* Or—I(I7Lf70707I*(*7(*70kDCOkO (DO
I I IN I I I I IIO
· O kO•„O0'74-4(I)(D •Lf7®<I'N!*N wß-4$4-IB CO (*7'U-kOUI www •¤
4-*0 \ NEC!-4¤-42EIE22EZE2 ^ •QS 0*0*0*-*QUUQQQQQQ 3•-4 U!0 #.::.:4:: NNNNNNNNN oo 0.[J¤\ ~•¢~¢s¢ xaxaxaeasasasasaxa $4 • 4,)QQ O 00--4 0v4 E04-* E9-4 --4
4-* wv 4-*'UD C! Ulll U}::0 --4 —4= Idw GJ (D-I=
O 4-*$-4 S (D**3 GOG) 4-*·· •-Cw-IJ @$-4..0 (D 4JQ0
'0 *0 0 I:40 --4::: 44-401:: -4 $-40 .0 0 0Äw 0 4-*5-I-*·•-I U10-* "Ö·rI ·r·I$·I¤[-T-I $-4--4 $-4„¤ -—•:>• ZE40 044-4 0*04-* 0 014-* U1 4-*--4 $-44-43 ·r-IC C°•(D<1)$-4Q d)$-4 -I-*C4' $-4(DO >-4--4 -4-4-I-IQIID Iüw IDUI Ix]— ·-4$-4 (D 0),9,04-*U‘ OUI ··-I--4{>-4*5* $44-I $-4-I-*7-*IJG)$-4 -45 U! 'U00*000•—4«—4Q0 0.'3U1 4-* I-4
· -I-*$-4-44-*$-400 4-* U’1•—4 QI4-4 45<I' 4-*¤-40-I-*¤-4U)U7«—I<D O-Id) (DO "Ö
w -4-Iw wC]C4-IQ)-4 $-4 CQ) E®>··4Ed)$-4$-4$-4 -4-45U.Q Q)-·I·w-4 *0 *0004-**0Q-4--4:5 44-4004-*,0w $-4$-4D$-4$-4ww<DU·•·4(D¢DO -r-IQIC[-4 QOE4QO33Z•<C•JIO¤3U1 Q4-70.4
1 57 1
I1
grasses (Graminae family) approximately half of the total
nitrogen is in the soluble form and most is non protein
nitrogen.
According to Cherney and Merten (1982) and Edmisten
(1985) boot stage is usually lower in NDF and ADF than soft
dough stage but this study showed no differences before
ensiling but did after. This lack of difference may be
explained by the closeness of the averages and the highA
variation of estimates. Cellulose content is the same for
the three treatments and hemicellulose is lower for the
SD-Lo treatment mainly due to both a lower NDF and a higher
lignin content.
Lignin is an important component because of its high
negative relationship with forage quality (Van Soest and
Moore, 1965). Also lignification of the fiber fraction has
been reported as a function of age of the plant (Cherney
and Merten, 1982). This explains the lower lignin content
of the younger material (Boot), as well as the tendency of
SD—Hi to be lower because the fraction left in the field
with the higher cut is composed of older leaves and stem
internodes.
Usually ensiled barley has enough substrate to promote a
good fermentation. The data shows no differences among the
treatments in soluble sugar content and all the treatments
are above 2.5% of water soluble sugars in the fresh weight,
1
ss T
suggested by Wilkins (1981) as the lower limit required to
assure a good fermentation.
2. Silaqe Evaluation.
Dry matter and fiber fractions of the silages are
presented in Table 5. The three treatments differ in dry
matter content and Boot stage has the highest moisture.
Differences between the soft dough stages may be due to the
lower content of grain of the lower cut (SD-Lo). All three
treatments had a dry matter content greater than 28% which
was recommended to prevent undesirable clostridial fermen-
tation (McCullough, 1978).
The cell wall content (NDF) is higher for the more
mature stages of growth (SD-Lo and SD—Hi). This demon-
strates the amount of plant cell wall in the plant tissue
is a function of age (Van Soest, 1965), and is true even
though more starch (seeds) is present in soft dough barley.
ADF content has also been reported as a function of plant
tissue age (Van Soest, 1965). Increasing the cutting bar’ height also decreases ADF content by reducing the amount of
older material and also by increasing the proportion of
grain to forage of the harvested portion of the crop.
Lignin content is a function of the plant tissue age and
has frquently been mentioned as increasing without pla-
tauing at any stage of maturity (Cherney and Merten, 1982).
Nevertheless, leaving the older material in the
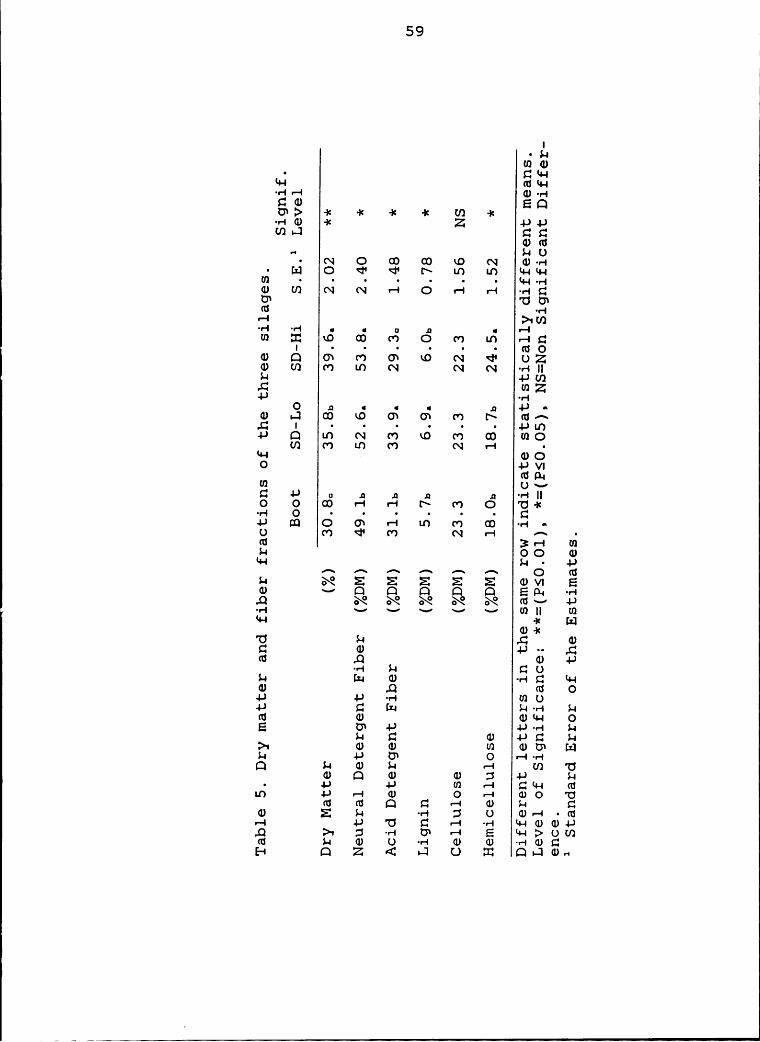
59 W
1
I•J-4U)GJO*4-I$$4-4
GJE"' 28¤=:> —4= ~x 4= ·4= U1 4=-4-4aß —4< Z 4-*4-*t!)4-J CCGJ<t$· N O Q Q RD N GJ·•-I• Ex] O <!‘ <l" l\ LO LD J1-1‘1-I• • • • • • • Q.|.,-4aß U} N N 4-4 0 4-4 4-4 -4-4:2U) 'OU)
G5 -4-I4-1 ät!)-4-1 -4-1 • • ¤ .¤ • 4-1um m LD cn m 0 m LO 4;:2| • • • • • • OGJ Q CJ) F') O) LO N Ü' UZGJ U) O") LO N N N -4-1II$-4 4-*t!)4-C'4 WZ4-* -4-4O 3 • • • 3 4-* •GJ 4-] Q 40 O) OW C') t= (U-'C | • • • • •
•-4-*Q an N m to m aß 4410U) C") 4-Ü (O O] 4-I •$4-I GJOO 4-*VI
(U9-4U) Ox-¤C 4-* o .¤ II .¤ .¤ ·•·1II0 0 cxß 4-4 4-4 1- m O 15-4:•r¤{ O • • • • • •
¤4J Q O O) 4-1 LD (*7 Q -4-I •~U G') -44 U') Ö] 4·—| ¤* -tt! 3Y-* U)$-4 OO GJ$4-1 $-4 • 4-*
e xx zs za »~ as Q (Q$-4 N EI E E E'. EZ aßvu Eaß ~·- Q Q Q Q Q ED-4 -4-44Q 4-*.,4 xa xa x.a xa xa U}$1-1 -I< [:1GJ-I:'U $-4 4C! GJCI GJ -I-*·· J3C5 .-Q GJ 4-*-4-4 $-4 :30$-4 L:-4 aß -4-4:: L4-4
GJ J] GS O4-* -4-* ·4-4 mo-4-* C Lu $-4·4-4 $-4G! GJ GJ*4-4 OE 4:55 -4J 4-*-4-4 $4$-4 CI GJ 4-*£.' $-4ä GJ GJ U1 GJUJ I:]$-4 -4-* UI O 4-4·4-4Q $-4 aJ $-4 4-4 cn 'C5GJ Q GJ GJ I3 4-* $-4• 4-* 4-* U) 4-1 C24-1 atLD -4-* 4-4 aß O 4-4 aß0 'C5ru as Q $:2 4-4 aß $-4 C4'aß 2 $-4 -4-4 :5 0 GJ•·—1 -44:4-4 4-* 'CJ C! ·-1 -4-1 $4-IGJGJ-IJ,¤ :>4 ::5 -4-4 ¤= -4 E ¤4-4:><ßmax $-4 aß Lß -4-4 aß aß -4-1GJCE-1 Q Z { IJ O T-E QL-]GJ4-4
60
1
field (SD-Hi) resulted in a decreased lignin content not
different than harvesting the crop at an early stage
(Boot). Cellulose content is the same for all treatments
irrespective of stage of growth or harvesting method. The
hemicellulose content is not different between growth
stages (Boot vs SD—Lo), but the higher cut is grater due to
a higher NDF and lower ADF and lignin content.
Data concerning nitrogen fractions of the silages is
presented in Table 6. Crude protein content is higher for
the Boot treatment compared with the more mature stage and
not different between soft dough treatments. This is in
close agreement with many reports in which crude protein
content declines with increased maturity (Raymond, 1969;
Cherney and Merten, 1982; Edmisten, 1985).P
The nitrogen insoluble in buffer solution (BUFFINSOL—N)
is lower for the material harvested at boot stage with the
higher CP content. All three silages had a nitrogen content
in the soluble fraction higher than 50%, which was reported
as typical of grass silages by McDonald and Whittenbury
(1973). This indicates extensive proteolysis during
ensiling.
The nitrogen insoluble in neutral detergent (NDIN) and
acid detergent solution (ADIN) are higher for the SD-Hi
than the Boot treatment. The nitrogen insoluble in acid
detergent but soluble in neutral detergent solution (NDIN

61 I
I
I
IZ •· I!-4¢~ |
'*¤¤-I •$·!^·<C£—4 mm IZ-«m cu-! «! 3 mu-! IäIi" 223mmcZ!-+·«-1 +->+->•—•mm ccma!EumO $+0D'¤!-• • m--!Q {L M-I-! #+-1*++v"C3 ·•—!m H-!·•-!·•-am c!> ~!<-:-1:-!=-!=m+< -•-ec$+03 UMD -x-!= Z 'OU*mms-4 ··-ni! --1Q-! -!-> U1 Z>1UJ$•—!'¤ -1•-1 PIC
,.Q(Ur—| • (UO.Q BJ mmmmmcm UZc^3I I I I I I I
wzmgl!) ·«-!Y-l 4J G
3 m tc mm!~!~c¤OO +-unIocmQ m!~<~1n.n1~mm ·uuml; m mm„—« xD moSU! -!->v!·«-!$-•"C5 <¤¤-•
(DCI .¤.¤ UvZ-PG! O ,¤•,¤•• • ·HIIil •—!!~<=1•—!¤JmO *2-!=^ Z Q m!~<~1<!•x¤<~1!~ --1 ·~$1+--lm U1 <*JxO«—! xO »·~ ·U<¤3 BH U!v$—!v OO m4-) $-4 ·
4-,PÖZ • •.¤•.¤n .¤ O GSCm U! -L-> xO<!*~QmO!.nO\ <DVl E
O nd+-> •—+m 0 xomno«—+mON mv +->c ·,Q<¤ Q •—!~!~•-1 !~ Ulll wOZ3•-! -!< Li!0 ·—!·•—• m-!=mom .c m
zszszs/xz-szszs .}J•n 'Q··—!.Q m EIZZZZZZ m 4->C20OO·!-HC} v tt! O$-ama!-!-> U10Q-• B Z $+-•-! $-+$-+ m m$•-! Omm•—!,c m -!->-•-! $—•'¤¤-!<¤+-> c -—! +->c s-«— 3M-++J -•-+ ,Q mm I:-1$-+30*+-! ¢DZ3 •—!-«—!O,Q·!-*0, +->!•—! U} 'UO•JIO -!->
$—•• $-4OU] CN-I (U
no mm mo 'Uz$+ $+ cm m+—•m m-! ·aS-« ·¤L¤~•-Izz cu ¤+ma>+».Q _ 3!:+'~•—!•—•+—4ZH $+—!¥>0U)at $—•ZD3C3QUlm --1mcH U£¤!Z¤Z•<133 Q--lm„
62-
ADIN) is very similar for the three treatments (8.3, 7.3,
and 7.9% for Boot, SD—Lo and SD-Hi respectively) and is
considered as a completely available fraction for the
animal, but degradable in the rumen at a slower rate than
the completely soluble nitrogen (Krishnamoothy et al.,
1982). However the ADIN content is considered completely
unvailable for the animal or the rumen microbes and isregarded as a good indicator of protein damage in conserved
forages. Higher levels than ll to 15% of the total nitrogen
in this fraction are evidence of protein damage caused by
heating (Van Soest, 1982). In this particular case the
total available nitrogen (100-ADIN) ranges between 95 and
92.2% which indicates the ensiling process did not result
in extensive heat damage.
Total water soluble nitrogen was not different among the
three treatments mainly because of a high variation in the
estimates (CV= 22.0%). This estimate represents the
nitrogen fraction readily available for rumen utilization
and is very similar to the buffer soluble fraction. Water
soluble true protein (WSTP) content is lower for the Boot
treatment in respect to soft dough stages, nevertheless the
ensiling process seems to have increased this fraction
(2.28, 7.29 and 5.52 times for Boot, SD-Lo and SD-Hi
respectively) compared to the non ensiled material (Table
4). There is a tendency to increase water soluble protein
63
3per kg of dry matter (0.48, 0.64 and 0.80 for Boot, SD—Lo 1and SD-Hi respectively) and to reduce nonprotein nitrogen
with advancing maturity. Also WSTP tends to increase with a
higher cutter bar at harvest. However it is still a minor
component of the water soluble nitrogen.
Lactic acid, volatile fatty acids and pH of the silages
is summarized in Table 7. Lactic acid content was higher
for Boot than the soft dough treatments and tended to be
lower for the SD-Hi silage. This indicates an inverse
relationship with the dry matter content of the ensiled
materials as observed by McDonald and Whittenbury (1973).
According to McCul1ough (1978), lactic acid is positively
related to silage intake and except for Boot, silages were
below the lower limit of lactic acid content range for a
well fermented silage (1.5 to 2.5%). Acetic acid content1 was higher for Boot than the soft dough treatments and not
different between cutting heights. Soft dough treatments
had an acetic acid content within the range reported as not
detrimental to silage intake (0.5 — 0.8%). However, acetic
acid content of Boot silage may negatively affect dry
matter intake (McCullough, 1978).The propionic acid content was higher for Boot silage
and the content is in the recommended range only for SD—Lo
and SD-Hi silages (McCullough, 1978). As was the case with
acetic acid, the high propionic acid content of Boot111
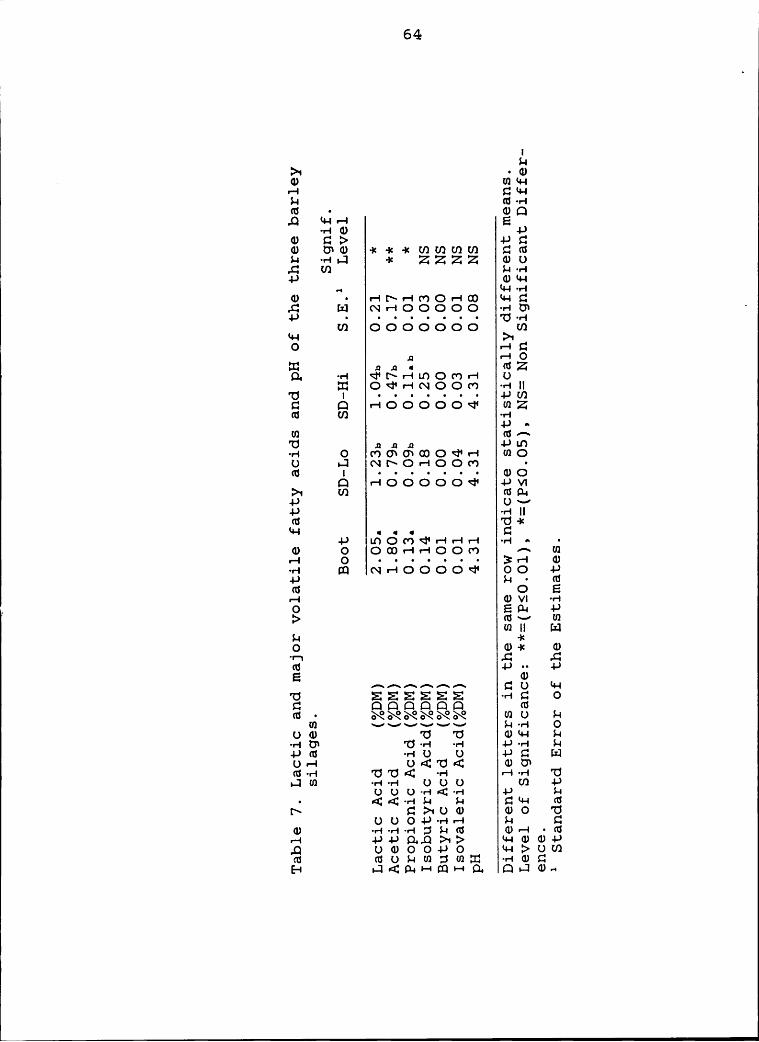
64
IM
>1 •d)GJH
CHI-IM al--I(5 • (DC}.Q ‘·•-IH E·•-IID 4-*GJ C•‘I> 4-*G<v UND ae-I:-xmmrnm ¤<¤M ·•-Is-Ö] -I= ZZZZ <1>0„I-'2 U1 M--I4-*FI
{HW"
ab · v-Il\•-IMO-III) <•-Is:J1 ld N-IOOOOO -•—IU¤ ·4-, • • • • • • • • 'UT-.U) OOOOOOO U)*4-I >«0 -4::,q r—·lÖZ .¤.¤ • (UZQ. ·•-I <r•r~«—•¤.nOm-I 0
Z O<I•v—INOO<'> ·«-I||'UQ Q r·|OOOOO¢ UQZI6 U1 ·•-I
4-, O
U1 I¤^"Ö .¤.¤.¤ 4-*LO·«-I O U200
I I I I I I
IC3•-IOOOOO<l* 4-*vIZ>·1 U'} IUD-I
4-* 0~¤-I-* ·«-IIIas *0-I:*4-I • • • C:
4-* II7C)("')<l‘r—·|r-In-1 ·¤-I ••·(D O O<I>«-I-IOO<*> ^ U1
I I I I I I I
LD N:-IOOOO<}‘ OO 4-*4-* M · IdI5 O E«—I (DVI ·«—I
, O EQ-I 4-*I> (Uv U)
(VIII BJM ·I=0 ev-I: ID
·¤·¤ „C‘• .¤(5 4-*•· 4-*E <v
QL) (4-]'U EIEJEIEEZS -·—I¤ O$3 QQQDQO (U¤· NNNNNN mo M
(Q O00.* 'U "O 0*+-I M·r·iU‘ 'U--I -•-1 4-*·•-·I Mum -«-I0 0 4-*:: Lzl0-I o·<¤'¤·<¤ mmax--I 'U'C5·<I ·•-I -—•·-I 'UIJIUJ ·-I--I 000 U1 4-*000--+4}--1 4-* M• (•(·r·l$-4 $-4 CU-I (5x~ ¤>•0<v mo 'U0004-*·«-I-4 M Cev ·«-I--1--I:;$M<I$ I1)-4 ·<¤-4 4-*4-*Q„,QZ>1> *4-IG.)(1)-|·-*.Q 00004-*0 *4-II>UU}cu

1
65silagemay constitute a negative factor affecting intake.
Isobutyric, butyric and isovaleric acids were not
different among silages and are considered as acceptable
for a good quality silage. Butyric acid alone is considered
as highly correlated with poor quality silage and low
intake (Gordon et al., 1964), and the best indicator of
clostridial fermentation. All three silages had butyric
acid contents well below the level (0.10%) at which it is
considered detrimental to silage intake.
The pH of the silages were not different among treat-
ments. Breirem and Ulvesli cited by McCullough (1978)
recommend a pH not higher than 4.2 for a good silage, but
other reports consider pH levels of 4.4 as an index of good
quality and stability in silages (Van Soest,1982). Best
results depend on interaction with moisture content of the
material.
Macromineral content of silages is presented in Table 8.
As a general trend the mineral content was higher for the
Boot treatment due to a dilution effect of the higher dry
matter yields as the plant matures (Cherney and Merten,
1982 and Raymond, 1969). Also for Calcium and Potassium
higher cutter bar height resulted in lower mineral concen-
tration likely due to greater grain to forage content.
However, Phosphorus did not increase with the higher cut
and higer grain content. Grains in general contain low
\

66 F
4-*S4-* mS OQ) ·•-1• $-4 *4-4*4-4 Q) ·•-4
·-4-4 (4-4 ::2Sw 4=4=-ae-x-x—x *4-4 UU!> ·x 4=4= --4 --1·•-um U ulM S•-4 OmEw-4 L:} «·-10«—1m00 0 IISO • OOOOOO ·«-4 U)•'¤|U)UN 000000 cn
O ·r'| •{DU) 4-* »·~
m m LD•* ¤.¤.¤ou.¤ 4* OEm ·«-• <l•Q<!•«-4m<!• ul -SG) FI! NNr-l<l'O¤-4 O
OOUlm
Q OOO•-IOO 4-* D4Ul•-I U) m ~¤m--• 0 II4-*Ul ·•-1 4=O .¤.¤.¤.¤.¤.¤ 'U¤„<v 0 Cmw-100-4 --4 »-an • • • • • • [-{ •
E-S Q OOO•-IOO 3 O Ul34-* U) O · 0--4 $4 O 4-*U10 VI m<D„S G) D4 EC4-* ••n••• E ‘-* ·r·'IU 4-* NOOQLDM cu 4-*usw-4 0 <r•<r•<~1<~a«-461 cn II vz
•~ LD OOOQOO G) ~kU14-* ,-S 0SS 4-* ·• SS-ad.) Q) 4-*O4-* · S U¤•¤$4 --1 S *4-IU)O¢D m O„¤ 4-* SSESEZE. $4 --4 $4¤•$-am QQQQCJQ 0 M4 0SE NNNNNN 4-* --4 $4
.|J Q $4E•—4:>-« av U BJSSS-4 ul -4 -•-•··«-10)*0 SEE U)<D'O
0 4-•SS 4-* 044·—4U® EO--4-«-• C *4-•£.‘<¤¢¤s::.¤ S.¤mm&>4 aa 0aJU(.)m4-* ·¤-•Q4¢DUlSS $-4 • $-4S
Q m,SmOOS *4-4m!>*4-IU)OC!-•E¤4UJu) ·•-1<D<D·•-1(D•-1„QmH
67N
i
amounts of macrominerals.
Except for calcium, potassium and sodium there was no
effect of the cutting height on the mineral content of the
silages. These three minerals are in higher concentrations
where active growth and cell division is taking place.
Therefore, they are in a relative lower concentration in
the plant heads (Raymond, 1969).
VThe NRC (1982) does not cover the mineral composition of
all the stages of maturity of barley but comparing the
composition of SD-Lo it is very similar to that of the
tables except for potassium and sodium. Potassium is higher
and sodium lower than the referenced tables. Sulfur content
is also very similar to that reported in the National
Research Council (1982) tables. Calculation of the nitrogen
/ sulfur ratio resulted in 11.6, 10.4 and 10.1 for Boot,
SD—Lo and SD-Hi respectively. They are very close to the
reported N/S average protein ratio of 10/1 (Nationa
Research Council, 1988).
Table 9 contains the average recovery of dry matter,
crude protein and neutral and acid detergent fiber from
each silo.
The data has no statistical evaluation because there
were no repetitions of silos. This data accounts mostly for
fermentation and effluent losses, but also includes
losses during the silo unloading.

68
N
Table 9. Dry matter, crude protein, neutral detergentfiber and acid detergent fiber recovered from thesilos as % of the original amounts stored foreach of the barley treatments.
Boot SD—Lo SD-Hi
Dry Matter (%) 88.6 90.2 100.3
Crude Protein (%DM) 77.8 85.5 87.6
NDF (%DM) 78.6 91.2 96.5ADF (%DM) 97.3 101.5 107.3
69 ' Ä
As a general trend and for all the fractions considered
recovery shows an association with dry matter content of
the ensiled materials (Table 5). Crude protein tends to be
the individual fraction most affected by ensiling, which is
in accordance with the report by McDonald et al. (1973).Since most of the protein is in the soluble portion of the
silage this may cause a greater loss due to seepage. The
tendency for the fiber fractions was to be less affected,
especially ADF. According to McDonald and Whittenbury
(1973) only hemicellulose may be partially affected by the
ensiling process and may be the explanation for NDF tending
to be more affected than the ADF fraction.
3. Heifer Digestibility Trial.
Table 10 contains the average composition of silages fed
growing Holstein heifers during the digestibility trial.
Since this data is the result of the analysis of one
composite sample per treatment there is no statistical
analysis.
Dry matter, crude protein and ash contents follow the
tendency already described for these treatments (Tables 5
and 6). Ether extract tends to be higher in younger
material (Boot) and may be a result of higher pigment
content (Boot).
Nitrogen free extract is higher for the treatment with
Ihigher organic matter and lower crude protein, ether
i

7Ol
extract and crude fiber (SD-Hi). This is mainly due to
method of calculation, but it also coincides with theincreased grain content of the soft dough silages. The
detergent fiber fractions (NDF and ADF) follow the trend
previously described in Table 5.I
The coefficients of In Vivo apparent digestibility of
the different silage fractions are presented in Table ll.
Except for Ether Extract all fractions were more digestible
for Boot compared to the soft dough treatments. No differ-
ences were found between soft dough treatments except in
ether extract and N free extract.
Results agree with those reported by Schneider and Flatt
(1975) in which younger material with less lignin tended be
more digestible than older material. This is particularly
true for crude fiber and consequently organic and total dry
matter. NDF and ADF are also more digestible for Boot than
for soft dough perhaps due to less lignin content.
The crude protein fraction of the soft dough stages
shows a very low apparent digestibility, which may be
explained by the low crude protein (Table 8) and high
indigestible dry matter of these treatments. According to
Schneider and Flatt (1975) the endogenous metabolic
nitrogen content of the feces increases as the intake of
indigestible material increases. Also when crude protein
level of feeds is low, endogenous nitrogen is a relatively
>

71Table10. Dry matter, proximate components and acid andneutral detergent fiber fractions of the compos-ite samples of the silage treatments fed duringthe digestibility trial.
Boot SD—Lo SD—Hi
Dry Matter (%) ——ä2??—__—i§;E?—_—Z3T0—
Organic Matter (%DM) 89.5 92.5 95.6
Crude Protein (%DM) 19.0 8.1 7.9
Ether Extract (%DM) 2.9 2.1 2.0
Estimated Crude Fiber (ZDM) 25.8 27.6 24.6
N Free Extract (%DM) 41.8 54.6 61.0
Ash (%DM) 10„5 7.5 4.4
ADF (%DM) 30.9 33.2 29.3
NDF (%DM) 46.5 50.0 46.7
1

72 1
1
U! OJJ OC ·GO (DOE • SH•—IJ-**4-I (UOCUCU-«-I•-I q)Q-4
JJOCO EN-IOS-IU‘> -I<·k·I<-k·k-I<·I<-k-I=·k -•-IE-I-I->·«-I0 -x-x-1=-x-x -x-1:-I:-x -I->QU):-] C!'UO OJJCO „-• HC(UG! • NLDLDLO<}‘O•—ION•-I OIL!•—*{il:02
U2 •-In-·Iv—IOr-In-I<\1v—I•·—Ir-I ·«-1*1-I0 '¤·•-1·-•>« SJJO >·¤U‘Uv-! ,¤.¤.¤.¤.¤ ¤.¤.¤.¤.¤ •·*·•·IIBMMQ
O O I O I I O I I I
I UCO LOLO<l"l\IDl\<*)<!'<'LO ·«-IOOO U) JJZ¤~0 01ms-1 ·•-III·**•-C .¤.¤.¤ •.¤.¤.¤.¤.¤.¤ PU!SZ
0 1 «-1·<IIOL0LoLn¤=Ln<i•N 02 •II-1.SQOJJU) OLDJJO>1‘<|—| (U •JJO UO·r·I • • •,¤• • • n • • ·•·'|VI•·—I-Iä -8 l‘<}‘<"<\INCDC*2l\<.DN EQ-••p•* • • • • • • • • • • \/
DO O <I°kOLDO'\«—IOWOO\O•-I ·¤-III-«-1-IJ II} -x ·+>: 3 U1020 O ••OOU S-I»·~-IJU\
4-* 0 O E'U Q sax-as-asaxzxasvxvsaxa E ••'—|
O CUOJJ-I-*·•-1 01 02vImCLI -I-J IJ-IC!}OJJ C OV$-I5 S-I O SIIOmz 0 ·•-I J·J·I<«¤0, $4-IJ ,0 S-I ·x4->Q„0 00 ·•··|$-IJ-* S<Ur—·I ,Q¢U [-1-IOS ·r··|••‘J-I
,0 -•-15-I ,0z r—IO0--1 £u+> IJ--1 020>+> >< s::L¤0 s-•:>s-I
·«-102 0LzJ 0 -1 000_>O 5-I 'U U‘JJ.Q JJ•-JS-IUI OCIJJSO $—I£!·«—I JJ LIG-:-I JJ·•-IOS-IO OOJJ OOCIJv-IQ JJOIUOLI J-*U2U1 •—IUum-1-rs-I lu 0:-I0 :*0• OEIOJJTS QOUY J-*¢t$$-I
u-I JJ 1-•>c0s:: JJ·r·1 GOG!-1 4-*U¤-•r:J-I-*0 -10Q O·r·'|”Öm·•—1 mtr mCJ $4*+-ISO EGOS-IEEO $-4 «—I O-:-Im-1 m'U0-•-IS-I -I-*'Um II-I:-I-I.Q >«U¤Z3,SJJ4J„SZ3·rI+J *6-IUWU2GS 5-IS-IS-I-I-*U2·«-IUIOUO ·•-I~«—IE-I QOO£=II£rJZ·<L‘Z•<I2E—I Qu)-.
1

73importantcomponent of total fecal nitrogen, thus, reducing
the coefficient of apparent digestibility. Therefore, true
digestibility may be greater than estimated for both SD-Lo
and SD-Hi.
Total digestible nutrients was estimated according to
the method of Weende (Schneider and Flatt, 1975). This done
by adding the product of the proximate fractions (crude
protein, crude fiber, nitrogen free extract and ether
extract) discounted by their respective coefficient of
digestibility. Ether extract is multiplied by 2.25 to
compensate for its higher caloric content. Total digestible
nutrients content is higher for the Boot treatment as a
result of higher digestibility coeficients for most of the
proximate fractions and is an index of the available energy
of the feedstuffs.
4. Lactating Cow Feeding Trial.
The average compositions of the six experimental diets
fed to lactating dairy cows are summarized in Table 12. The
main differences in dry matter content were among diets
made with the same silage treatment but with different
concentrate content. The general tendency was for diets
with more concentrate to be drier due to addition of arelatively dry feed. On the other hand diets with high
silage content will be wetter.
There were no differences in crude protein content
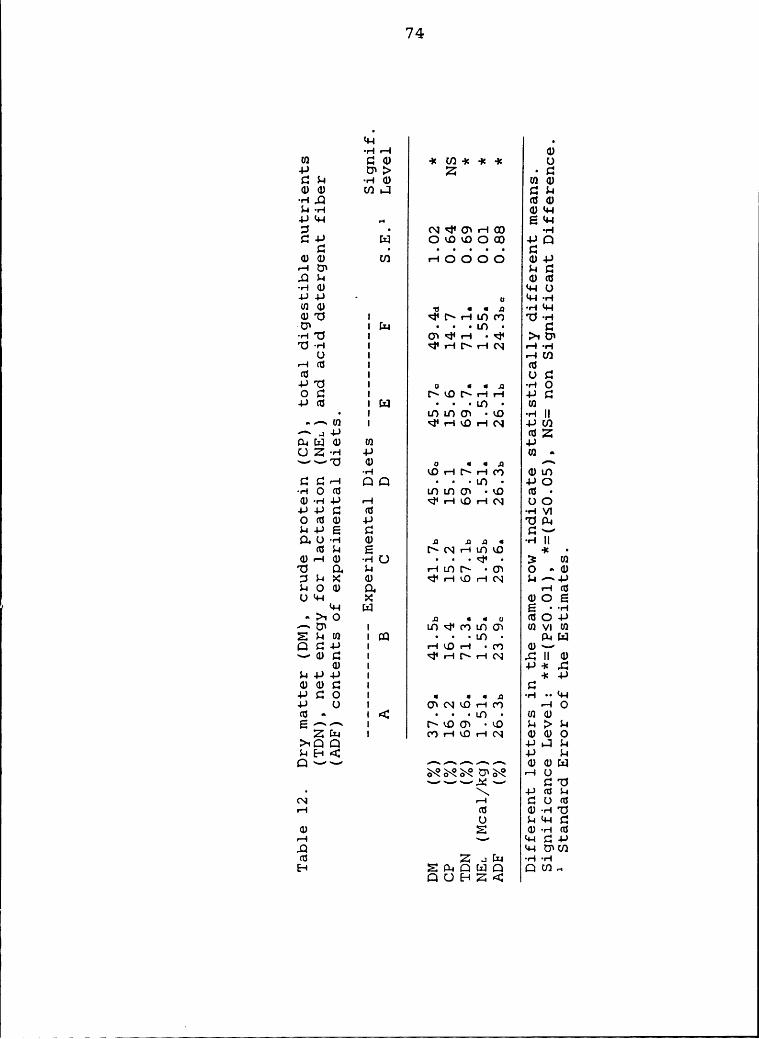
74
1
(H I
-:-1•-I Q)111 Sal -1:1/1-1:-1:-1: 04-* U‘> Z ·SS1-1 -1-111) mwGJGJ U)1J SI-1-.-1..Q 100$4·r·1 1111+-14-**-1-1 „. E14-4I3 · N<}‘O)v-ICD -1-1S-I; Ii! OLQQOG) 4é*O011) U) :-IOOOO 04-*·-IG) $-1S.QI-1 CDG!·«-111) *+-104-*4-* *uWG)
5 11.¤111131 -=1•1~.-1m:-1 U-.-11U* IC!-1 ·
• •LD • C·r-1”Ö 11 -<1•«—11\1-1N v-I-:-I
U I e-·-IU).-110 1 10IU 1 oc:-1-*°Ö I 0 1 IA -1-IOos: 1 [\kOl\:—·|:-1 4-*::
I I Im I
I LÜI-DO) ·LO ·r-1II•~-·~U) 1 <I':-1xO:-IN 4-JU)***..14-* (UZ¤1LrJ<1* U) 4-*(.)Z·v-I 4-* U}
0 1IA-1-ILOr-1[\r-IF) (UIDCGA QQ · ·
•L0 · 4-*0-1-1OfU LOL-OO') •kO I5 •G)-:-14-* .-1 <r*«—1no«—1N UO-I-J4-*C IU ·•-IVIO<¤<D 4-* "UI3-1S-14-*E S SvQ.U·•-I 0.* 1¤ ,¤.¤ 1 ·-1II101-1 E 1~N1-11.1110 -1:•¢ U}'U Q. S-1 ·O) O •<DSI-4>< 4} <I*:-1•.01—1N I-1^4J1-10111 Q- r•'I¢‘UUN-1 ><: 1DOE@+-1 Id E --1-1•·>1O .¤ 1 1 0 (UO-IJ^U) 1 IDVIU)EMU] ILD · ·
•I-0· Ile!-I]QS4-* 1 r—1kOr-1 -1*1 <vv
-111:: 1 <t•.-11~1—1N .SII1D111 1 4-*-1:,1::
$-14-*4-* 1 -1:-1-*¢D<DC 1 S-I-*CO I 1 1 IQ -:-1••I+-«I4-* U I C)NxO•—11*1 •-10(5 .. 14 . . .1;) . mq}E-»-1ZB-11>1CJQ 4-*1-15-1S45-141 4-* I-1
XNNUN AU• \ 4-*101-1N .-1 SU10.-1 10 111--1'U
U S-1*-1-1S11: E CD-r-IGS--1 v *4-ICS-I-*,Q M-1U‘U)10 Z.1£¤ --1-1-1E- E111¤1:J¤ @111,.QUE—1Z·<*’-I
75 f
among diets because the diets were formulated to be
isonitrogenous. However there was some Variation in diet
protein due to changes during the feeding trial. Diets C,
D, and F tended to be lower than target amount.
The least TDN (determined by VPI Forage Testing Lab) was
in diet C (SD-Lo with a forage concentrate ratio of 75/25).
However the tendency was for higher TDN to be associated
with level of concentrate of each diet rather than with the
forage component. Because net energy of the diets was
estimated from TDN content, NEL follows the same pattern.
The ADF content of diets reflects the forage component.
Diets containing SD—Lo silage had the higher fiber content
for both, the more concentrated (60/40) and the less
concentrated (75/25) formulations. For diets containing
either Boot or SD—Hi silages the main difference in fiber( content was due to the concentrate level of each diet
rather than differences in forages. This is in agreement
with results about silage composition reported in Table 5.
Table l3 summarizes results about dry matter intake,
milk production and milk composition obtained when the
experimental diets were fed. There were no differences in
average dry matter intake among the diets. However, except
for diet C, there was a slight tendency towards a higher
intake with the more concentrated diets (diets B, D and F),
which may be due to lower fiber (ADF) content. Dry matter
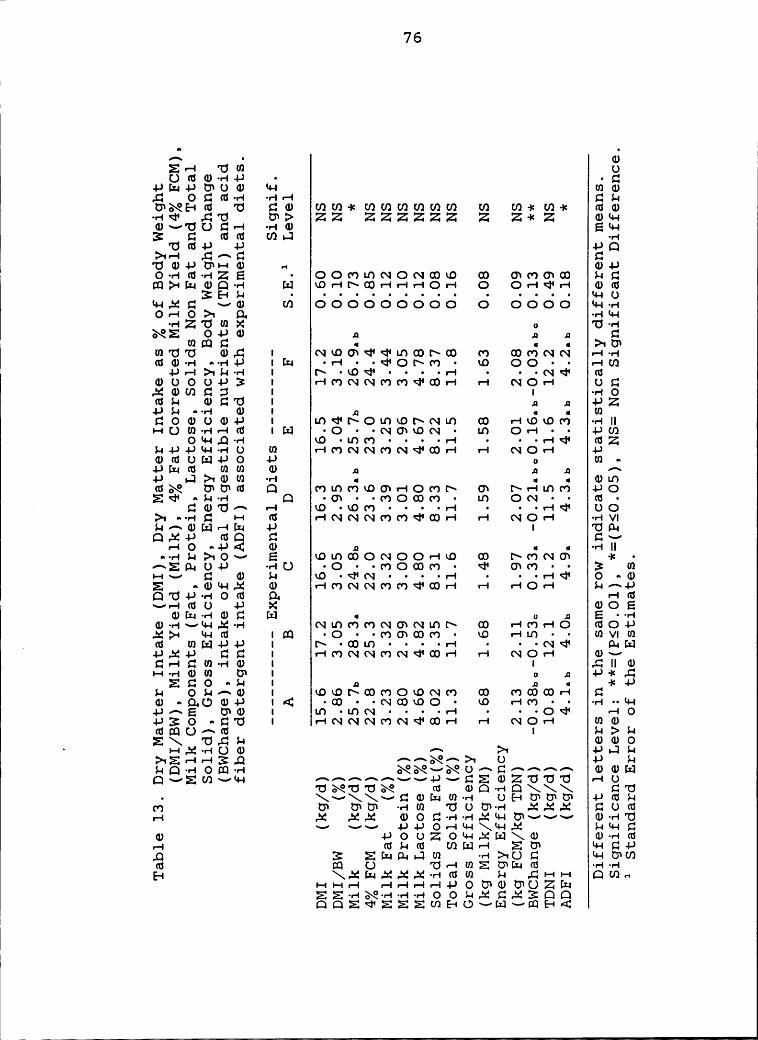
76I
I
I
fä • Q,EH 'Uw 0()¢U¢D·•·*|-IJ • •C
9IZr-190*00) IH UIGS OCGH HH GMcnxüm *0 c:G mm-xmmmmmm m m-I=m+= mwMw A0 m> ZZ ZZZZZZ Z 2*2 Gm¢1I-·"0(.)CIH Hd) EII-I3 G mm mq HUM9 9 9QMH £^C CUG9¤HG „ G90-I-II¤·v-IZE • OOQIDNONQQ Q OWQGIQ HGL:] MDI-··It\QHI·-II-IO:-·IO'~HxC•‘vd) U'} OOOOOOOOO O OOOO II-I·•-·I0-—I0>« Q ·-I<-I-I
'•'Iz'ÖWX 0 'Uw-INZ 090 A A A CI UIU-IC: • • • >*IU‘U!'U"d 0),.CI I <\I%.OO'\<'<I'I-0QI\Q Q QQNN I-IH<Ud)·r·I ••·I···|9 IF!-I •v"I • ·'<I‘Ol\<') • RO OO • • •—IU)
I000093 I HQNNQ¢')<*QI··I H NOH UCxGm¤¤ I I ·•··IOI5}-I Q)£Z"0 I A A 9Z-Ö-,$·-I
•··rI G} I ,¤ • • U]{300009 I ID<I'I.\OL0xOI\NlD Q HQQQ ·¤-IIII—•L)UJ·•-I--III! Ill:] •O • ·NO\xON · LD O•···I
·• 9U)
O9-I,.Q·•·I KO •|-DF) • • • •I···| • • •¤·'I¢' (UZ$-I·I·J-·IJ‘·I-·|·I—IO U) I—·I<")¢\l€\l¢")(\]¢‘CDr··| I····| (WO:-I 4-,¢DId0£=J90 9 ¤ In -—9IZr-IG! Ulf!) Q) A A A ^-I-I I-J>1¢DU) ·r·I • • • (DLGmx mmm Q ox I~HInm 90
· Qq)•‘¤»-« ,-I gg .gQ(v) . . . .,-4 . . .,-4qI QOM•··I-IC! I-I IIS I—INNNQ<‘O<I'QI-—I I-I NO«—I ·•-IVIM^GI:JHL¤ 4-> I 'O¤-IQ-M9 IISQ C! Sv•··-IO ••·I-’•<€ GI A • n ·r··III•··«-II-IMO~¤ E kOI-DQONOOHQ Q l\C'>NOW -I= ·¢'~SIl-IU9 ·•·IU •O
· ·t"')C)Q€') ·'<I‘ OWQ · · 3 (0
I—I-¤ S: (D $4 LO O •¢D2 ·Gwx G HmNNmm¢mH H HQH M^9QU9H0m Q HM-¤I·-IIUU ·I-I X (DCEUCI-I·I·I®¤ BJ • 0 A E •·I-IID--I~«I+-Ix-:-I NQQQNQNQB Q I-IMHO IUO9,x>-I II-Ia! IQ ·O • •QO\Q<'> • LO Hm · · Ulvlm_ (U UIIEIJ99 I (M •CDLD · · ·
·r—I· · ·N¢° D-IB]9.-X9 ¤¤ I Hm<~1<~zm<~1<I·c¤H H <¤1oH GV
¤H¤mHG I I SHGI-IHGU1 UI I ¤ A 9-I<,C,‘
ECO •$-I I A A • ·I<-IJM OS-I»·~d) I LOk.Ot\Q<'*'>Ox0NC') Q QQQH C•m • • RO • • •'—| ••L|.|9^E 0*6) I ID ·l-001 · ·
• ·v·I •· ·O'<I‘ I-IO
930•·£‘•'0 I HNNNQNQIQH H NOH U10)§€°’-EE-.
' $$3· I-Ix·I-IUGJ ^ M 9I-IM
MEHHZÜ ^^x^M 0 9 MMQHOQH xx~xU^¤^^^^ GGHQvämvw ^^^^^v~9~CEGZUUU HU
IIS GQ--IQ\\\ $1*0· \~«\\~«£‘.G£¤m--I UEIUIUIUI -I-JIUM
m U OU Hm UOGH xxx ComH x xx G0¤~I-I·•—Ix*+-IU=~«~«~ GH'¤-« vv 99OH‘4-I\‘·I-I.! $4*+-ICG 90020*+-Ixßr-I\<D GHIU--I IUMIU QL:-IH EIUI II-IC29,.Q 3 EE!-IQ-IIJIU) HMOCI LI-IUIUIm m U UHWEUQG HHH \¥bx¥xHwW H SHH OW«I-II—«H HHHHI->0UIG¤‘0ZL¤
QC32<I•2EIECf1E—I(.9-·I-rII~«QE—+•<!l
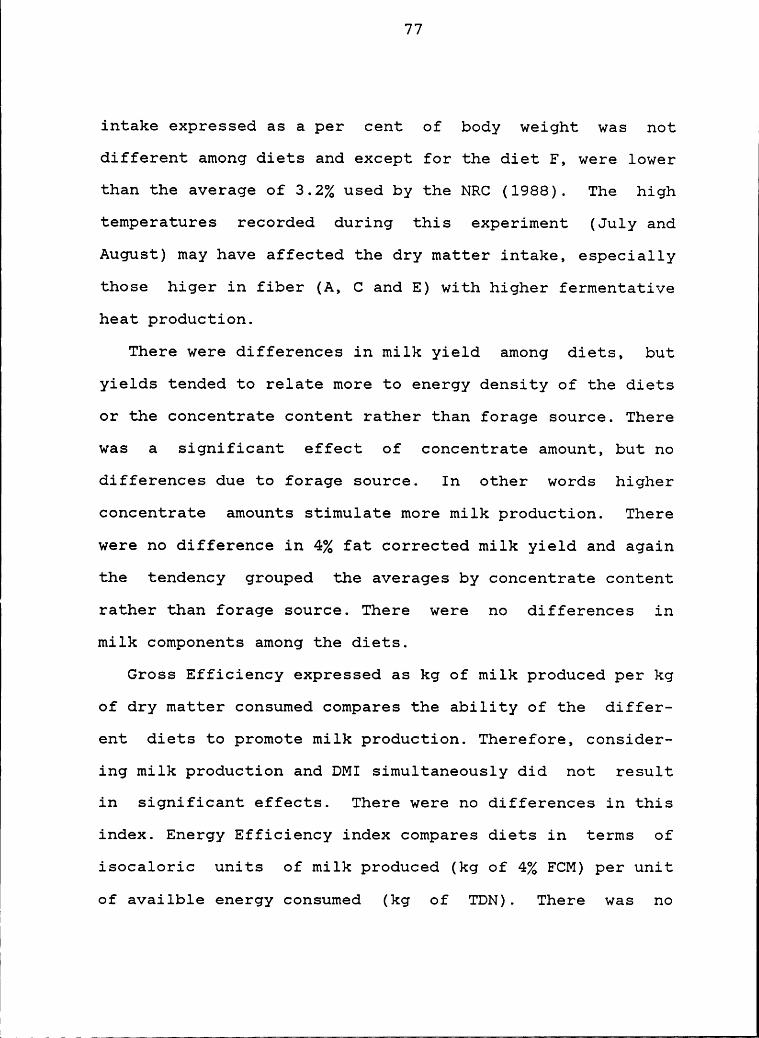
77
I
intake expressed as a per cent of body weight was not
different among diets and except for the diet E, were lower
than the average of 3.2% used by the NRC (1988). The high
temperatures recorded during this experiment (July and
August) may have affected the dry matter intake, especially
those higer in fiber (A, C and E) with higher fermentative
heat production.
There were differences in milk yield among diets, but
yields tended to relate more to energy density of the diets
or the concentrate content rather than forage source. There
was a significant effect of concentrate amount, but no
differences due to forage source. In other words higher
concentrate amounts stimulate more milk production. There
were no difference in 4% fat corrected milk yield and again
the tendency grouped the averages by concentrate content
rather than forage source. There were no differences in
milk components among the diets.
Gross Efficiency expressed as kg of milk produced per kg
of dry matter consumed compares the ability of the differ-
ent diets to promote milk production. Therefore, consider-
ing milk production and DMI simultaneously did not result
in significant effects. There were no differences in this
index. Energy Efficiency index compares diets in terms of
isocaloric units of milk produced (kg of 4% ECM) per unit
of availble energy consumed (kg of TDN). There was no
III
I78 I
4.)% }'§ •pä •I¤U•—|•—I SGI U}-I:-I<U)U)U)·I¢-I= U') U)·I=U}U) GIIASIIILA U*> Z·I<-I<ZZZ Z Z ZZ U-·GI4-*2 ·•-IGI •S
-«-Io mq mm(DU-IJ‘-' •-• CH'UI-I--I · <I•mno:~mmmo= ID <I•OO<~1 aso:
I-IS'4-III-IGI [:1 <*‘I<"<I‘OOOOO O O1-IC'):-I 0)*+-II I I I I I I I I I I I I
I·•-ISE!I5 U) OOOOOOOO O OOOO ·•·-IWO GI4-* 4-*"0QIUIACS S,!~tEU1¢U-r-I"0 ILD N<I'I.OI\N¤—Iv-III) CD <I"¢'>NlI'I GI4-*r-IOO4-* S IN •
· ·NO*l\N<}' ID OO •· 5-IS
·•-IOS-ISS-IGS 4-*\ kOLDN ·• •
·• • • ·r—‘|<I‘ GIIUE: O--I0 um •—+<~1<~1mc~1<I•¤o•-I •—• NO:-·I Mu•~ ,QGI GI!\ PI U4-:-I '•~•—|¢‘~•·r·1U *6-I ·r-1*4-I
»·~·•-I0)»·~¢H$-I *4-I '0·«-I32150 S IAO cw•-Im<x>•-IO<~1m co owmowm I:III ·v-I0*4-*0 •<I‘ • • •<’0OCD<')l‘ \O ON • • >10*\•·•—ISSIü C.)\ kOl\<I‘ • • • • • • • ·e-IQI •—I·•-I•—•»'~O<¤@ IO r—INN€'7¢'><I*<'II•—·I e-I NO•—·I I-IUIZE:/1,I::.'¤I<v uno «—I I cuDU Oi-I0* US~ma30m M wo
mmuh wa uzZX4-JVGIO S@ UIUIUIUIUIUJUIU) U) ·I=U)-I: U}¤1<i*O 'UM U¤I> ZZZZZZZZ Z U}·I=Z ·•-IIINsaßld) •r'IÜ Z ·I-,U]
0*'U>~I U}:-J IUZU1"O'UC•°••"I•¤ ·-• ·*·*‘I5--ISIUU · <"><")IDt'Dl\<I'l\N LO MOIDM U1 •
GIIU.-SGI'0 Er] OI I I I I I I I I I I I IIS>·•-IJ
'UQI U) OOOOOOOO O OOOO 4-*Oas m+>¤:S <¤ ·MI-¤.SI¤O .¤ UO'U•—-I U* H I • • ·r·IVI\·•-IS··-I»~0* I-:-I O'\<IIl\<I'ONOLD ¤—I LOLOOWGO "UD-I'UEOGII-4 4-*II} ·
• •<"7OI\<")kO kO OO · · Sv• • • • • • • n•f-|¢"O
D4-*0 GID e-4NN<"It")<"mv-I ¤-·I NO•—I —I<··*GI"0I>«[··I@·«-I '+-IU) I-I 3 UI
I—I·I-*·r'I°°Ö‘-*·r'·|-IJ *4-I O •·GIZU:-IO 'UIU[1]DGIOCDU1
S-I O \D<I°d)Lf‘IOONkO I") NkO<'7kO r—I¢‘5-¤$·-IU} 4-*v-I GII-] „· · •<")O(II€"7\O LD OO ·• GIOE• • • • • • • nrw E
••|-{
GIO •~>·•GI4-*4-* IUD r-INN<"'I<')<I°<'Dv—I I-I NOr—I IUO4-*•!¢!(.)GIU·r-ISG! I-IU) •-I UIVIUIcu IHC}-IGII-I ·•-I ¤-II-A4-*4-*OGI4-*E4-* U14-* .¤ .¤ @-¤QIU4-*-«—I;$·•-IS IO Ne-IOCDO\<i‘ml\ <x> <~uo<I•«-1 .¤II0HIAOOSS-•@ IO · ·
·<~1¤01~•—I<I• xO «—I<I•· · 4-*·I<,„C}
GS-:-I GIU Im xOI.~<}•••-•• • . .,-qqe .g.pI-•NI.‘IMa>Q„¤ «—I<~1<¤1<··'>N<I•c¤«—I I-I NO:-I GGI¢‘ I4-4•-IXO I-! I ·r·I·•‘4-I
4-* •·[:],.QGIU •-IO4.) « Q U) Q
H ^\\\ @@0•——I4-*$-I@4-*I‘¤ 0*0*0* E 20*0*0* 4-*•-15-I>1·¤-IOGI0* S-I MMX D 4-* S-ID-*9-«IZrJ"OO¤-I 4-* 0*• •-IU
I5 • •„Z'¢‘HU* GU. Lu•—I<I-I\*•-I.! 4-JIUS-•
<I‘ O‘·I-I„!=CI:J\GI SOIUI-I SGISU)IrJ¤··I EIO* @·¤-I"C5
E •¤-IUIO ·«-I>«US S-IMS0 U <IIOz•—ImEU*LA<¤ 0·•-Ia:
«—I ,§¢I’-u 4-*4-* ·<I$UI LI ,£',I-I•—• II-IS4-*.Q •-•«—I -I->00•—I-I->0¤~<1>¤=OZIA MO:/1aß[-I DE<}*Lr-IQIQMHUVEAVCQH DUI-

79 I[I
Istatistical difference among the experimental diets, but
there was a tendency that suggests the diets containing the
more digestible Boot silage (A and B), were slightly more
efficient in using this energy for milk production.
The main effect of experimental diets was on body weight
change. The low concentrate diets containing soft dough
silages were able to promote body weight gain, but diets
with higher concentrates promoted a certain degree of body
weight loss. Cows fed both diets containing Boot silage had
body weight loss. Polan et al. (1968) reported observed
body weight gains in their experiment were related to
different intakes, but in the present study there was no
clear relationship between dry matter intake and body
weight change. Also intake of TDN or NEL cannot fully
explain the body weight changes recorded. According to the
National Research Council (1988) 1 kg of body weight lost
or gained is equivalent to 6.8 kg of 4% ECM. Correcting
treatments for this figure, assuming 0 body weight change,
the 4% ECM productions would be 20.2, 21.7, 24.3, 22.2,
24.1 and 24.2 for diets A, B, C, D, E and E respectively.
This indicates less production for Boot silage when body
weight changes are taken into account.
Average daily intake of total digestible nutrients was
not different among the experimental diets, but appeared
[related to higher milk production and body weight loss.
801
Acid detergent fiber intake showed differences only between
the extremes. Table 14 presents the same information as
Table 13 but grouped according to forage and concentrate
effects. The tendency was for dry matter intake to be
associated with the dry matter content of the forages. The
milk yield and 4% fat corrected milk, however, tended to be
associated with the energy content of the silages. Gross
efficiency and energy efficiency tended to be higher for
the Boot and lower for SD-Lo silage and were associated
with the higher and lower energy density respectively.
Body weight change showed different patterns for the
treatments. Soft dough silages maintained body weight while
the Boot treatment recorded a body weight loss. Cows fed
Boot silage had body weight loss associated mainly with
higher milk yield and lower dry matter intake.
Intake of total digestible nutrients is not different
among the treatments, and intake of acid detergent fiber is
different only between Boot and SD—Lo. This difference is
the result of lower fiber content and dry matter intake of
the diets containing Boot silage.
Table 15 contains correlation coefficients for the
variables measured in this study. These variables are dry
matter, total digestible nutrients, acid detergent fiber
percentage, milk yield, fat corrected milk yield, milk fat
content, dry matter intake, TDN intake, ADF intake and
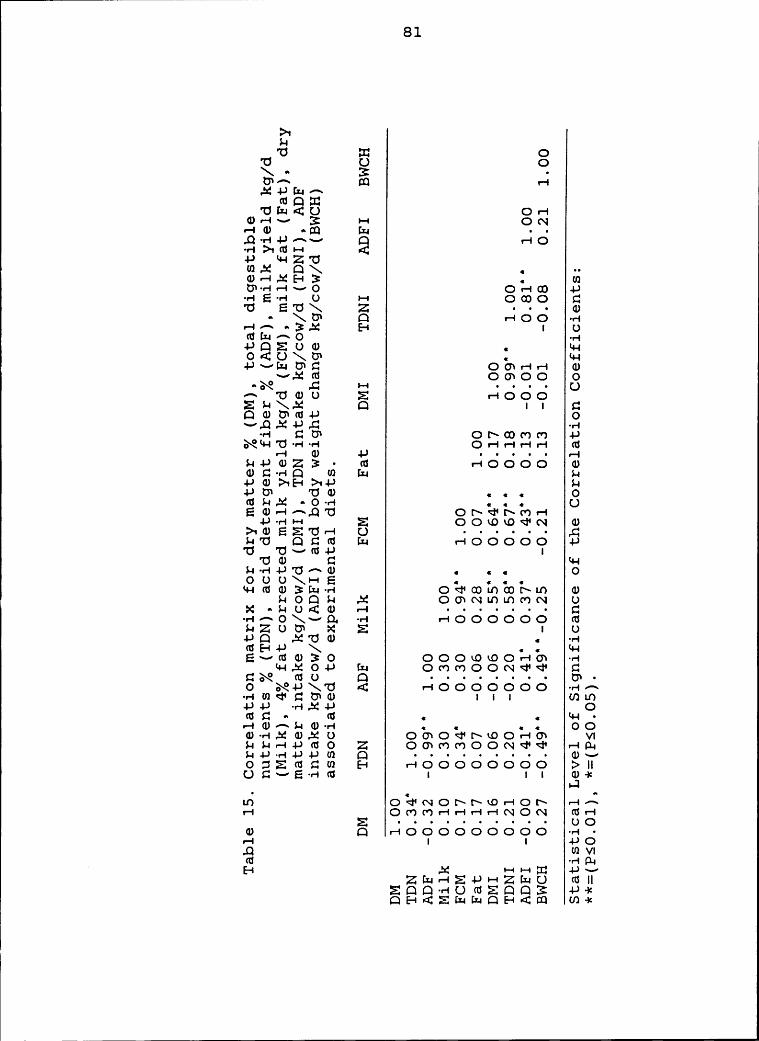
81
>~IIE OQ E °U*^ IB 1-1
01-1Iv-1- E I-1 om[1-I •ö
*1-IZTJW1! C]\ • •·<1)·-1.¤<E—I3 „ InU~·«-I«—1~«o Q1-Im 4-)··-IE--I 0 •—• oooo ct'Ö E”Ö\ Z ·
• • ID··
\U‘ C3 I-IOO -1-1H^•3„¤¢ E-·I I O<Ulx4^O ·•-14-JQEUQ) • *1-1O U\U* „ *1-1Q)-Jzffü OONOO O
I-{I-IOOOE5-1\„¤d Q II QQQ)U1<¤·I-> O
0I~cx>mm -I->NM-1"¤·«-1-1-1 O-11-1-11-1 at
1-| Q) 4.) • • „ I „ ,.45-14->Q)Z3 · CQ I-IOOOO Q)Q)¤·-IQ U1 Lu 1-I+JQ)>I[—4C>·I—I-> I-1
G G G OÖHÄÜ •Ü'•"" c ¢ • OEQ)-1^.Q'U oI~<I<I~m«-IJ-*·r·|H EZ ooIo«o<I•¤1 ev
I I I I IIHU
QCZIU Lu I-—1OOOOO 4-J"U 'U-<¤«I-ä I'OQ) C *1-1
Üo00\•-E . . „ „*1-11IIQ)3lZ¤·I-1 O<I‘<°DIn<I)L~I.¤ Q)
Ö-IÖQLI Ad omwmmmm 0X -I-1 HOOOOOO IISI-Iz0¤~ >< E I 0-I->Q #130) • -I-I
G G Q4E-¢¤Q)3O OOOLOKOOY-‘m -I-1Eu Oc*1<*1OON<I*<i• C2
I I I I I I IIO•<C I-IOOOOOOOIII wm-1-J-I-> ·•-1;::-IJ Owc * TU
c VIS-II-I·—-1-1-JQSO ZQ ......... QjgaOZZEIIUCIIJ E1 HOOOOOOOO >|lL1::.‘~«E·«-Ia: I II 016:
LJLD O<I'NOI\I~ao«—1OI~ -1--1-1
QQQ) Q HOOOOOOOOO ·»-1 ·•—1 I I -1-JO.Q (DVIrd
HHII! «I-*-ZB-I:-IE.'4->HZ£=-IO <¤||
ZOO-:-IOIUEDDK 4-*-1:QE—••<ZEI£¤Lz-IQE-I·<CC¤ U16:
82 Wl
body weight change.
According to relationships among variables of Table 15
TDN and DM content of diets were positively related. This
was because diet DM Variation was partially due to concen-
trate content which in turn was an important determinant of
energy. Since TDN is estimated from the ADF content of the
diets these two components were strongly associated.
Milk yield (Milk) showed no association with diet
components, but as expected the most important parameters
in determining milk yield were total dry matter intake
(DMI) and intake of total digestible nutrients (TDNI). The
positive relationship between milk yield and intake of ADF
is probably a result of dry matter intakes reported already
(Table 13), indicating that cows were still able to
increase comsumption because ruminal capacity was not
reached (Forbes, 1970). The main reason for low intake was
high temperatures recorded during most of the experimental
period. Fat corrected milk yield (FCM) was related to the
TDN content or energy density of the diets and strongly
associated with the total intake of dry matter, TDN and
ADF. Milk fat Z showed no relationship with diet or intake.
Intake of TDN had no relationship with the TDN content
of diets, but was highly related to the total dry matter
intake (DMI). On the other hand intake of ADF had no
relationship with total dry matter intake (DMI) but was
l
83 4
correlated to the ADF content of the diets.
Body weight change was best explained by silage source,
and TDN and ADF contents of the diets. Diets containing
SD—Lo silage had greater body weight gain and ADF content.
Also SD—Lo was lower in TDN content. Diets containig Boot
silage were higher in TDN and lower in ADF and recorded the
greater body weight loss. With the recorded intakes,
affected by the ambient temperature, it is very difficult
to explain the body weight changes obtained.
5. Ruminal Degradability Trial.
An analysis of variance using ruminally cannulated cows
as blocks was used to analyze data for ruminal degradabil-
ity. To describe ruminal degradability of the silages, the
experimental diets and the predicted experimental diets the
following parameters were used:
A = Readily available fraction
B = Degradable fraction (at a measurable rate)
C = Undegraded residue after 72 hours of incubation
D = Overall degradability calculated according to the
Orskov equation, using a rumen turnover rate of
.05%/hour.
Kd= Degradation rate constant (%/hour)
Parameters A, B, C and D are expressed on a dry matter
basis, and are presented in Table 16.
Increase in maturity increases the highly soluble DM

84
Table 16. Ruminal degradability parameters, A, B, C, D andK. for the dry matter of the experimentalsilages.
Signif.Parametersz Boot SD—Lo SD-Hi S.E.‘ Level
A (ZDM) 43.4. 46.0. 52.0. 0.264 *B (ZDM) 46.2. 30.6. 26.6. 0.268 **C (ZDM) 10.4. 23.4. 21.4. 0.045 **D (ZDM) 68.6. 57.8. 62.5. 0.270 **K. (ZDM/hr) 0.060. 0.032. 0.033. 0.001 **
Different letters in the same row indicate statisticallydifferent means.
Significance Level: **=(P$0.01), *=(P$0.05), NS= Nonsignificant difference.‘
Standard Error of the Estimates.’A=Readily available fraction (Z).B=Degradable fraction at a measurable rate (Z).C=Undegraded residue after 72 h incubation (Z).D=0veral1 degradability (0rskov equation), (Z).K.=Degradation rate constant (Z/h).
V

85fraction (A) and the unavailable fraction (C) at the
expense of the B fraction. The higher cut (SD-Hi) did not
reduce the undegraded residue (C), but the higher grain
content increased the highly soluble fraction (A) compared
to SD-Lo. As a consequence of a higher B fraction and a
much higher degradation rate (Kd) Boot silage had a higher
overall DM degradability than soft dough. The higher cut
silage dry matter (SD-Hi) was more degradable than normal
cut, due to a greater content of the highly degradable
fraction. Most likely this is a result of a greater grain
to forage ratio. Table 17 contains the nitrogen compound
degradabilities of the silage treatments. There were no
differences in highly soluble (A), degradable (B) or
unavailble (C) nitrogen fractions. All silages had roughly
75% of the nitrogen in a very degradable form which is
coincident with the observations by McDonald and Whitten-
bury (1973). The overall degradability of nitrogen was
extensive for all silages but the younger material (Boot)
had the greatest. Boot silage contained less fiber (ADF)
and lignin (Table 5) and less unavailable nitrogen bound to
the fiber. The extent of degradation is similar to to those
reported in alfalfa and corn silages (Janicki and Stal-
lings, 1988).
The relatively high proportion of nitrogen in the
undegradable fraction (C) compared to nitrogen bound to ADF
l
K
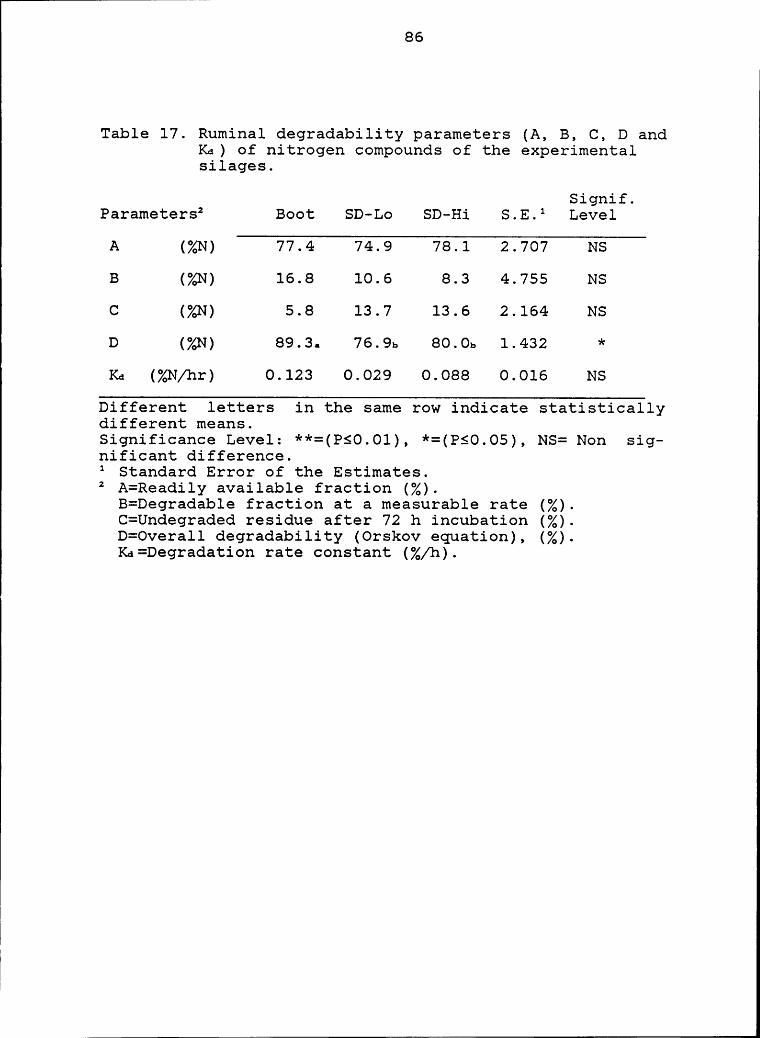
86
Table 17. Ruminal degradability parameters (A, B, C, D andKd) of nitrogen compounds of the experimentalsilages.
Signif.ParametersZ Boot SD—Lo SD-Hi S.E.Z Level
A (%N) 77.4 74.9 78.1 2.707 NS
B (%N) 16.8 10.6 8.3 4.755 NS
C (%N) 5.8 13.7 13.6 2.164 NS
D (%N) 89.3. 76.9. 80.0. 1.432 *Kd (%N/hr) 0.123 0.029 0.088 0.016 NS
Different letters in the same row indicate statisticallydifferent means.Significance Level: **=(P$0.01), *=(P$0.05), NS= Non sig-nificant difference.Z Standard Error of the Estimates.Z A=Readily available fraction (%).
B=Degradable fraction at a measurable rate (%).C=Undegraded residue after 72 h incubation (%).D=0verall degradability (0rskov equation), (%).Kd=Degradation rate constant (%/h).
87
(ADIN) in Table 6 may be due to microbial contamination.
Also the larger the undegraded fiber fraction the more
likely the microbial contamination because of the ability Äof microbes to adhere to the fiber.
The degradation rate constants were not different among
treatments mainly due to the high variation of this
estimate. Boot did have the numerically largest but non
significant degradation rate, however.
Table 18 presents the results of the degradation of the
ADF fraction of the silages. As expected there are no
relevant amounts of rapidly degradable fiber in the
silages, but the degradable pool is different. Degradation
of ADF is highest for younger and less lignified material
(Boot) and not different between soft dough silages. Also
the residue after 72 hours of incubation (C) was different
but only between stages of maturity. The overall degrada-
tion of the ADF fiber is different and approximately double
for the Boot silage mainly due to a larger B pool and a
faster degradation rate of this pool.
Table 19 containes results of the ruminal degradability
of the NDF fraction of the experimental silages.
The degradability parameters for NDF are very similar to
those of ADF (Table 18) indicating the main determinant of
NDF degradability is the composition and amount of ADF.
Boot NDF fiber is characterized by a relatively large
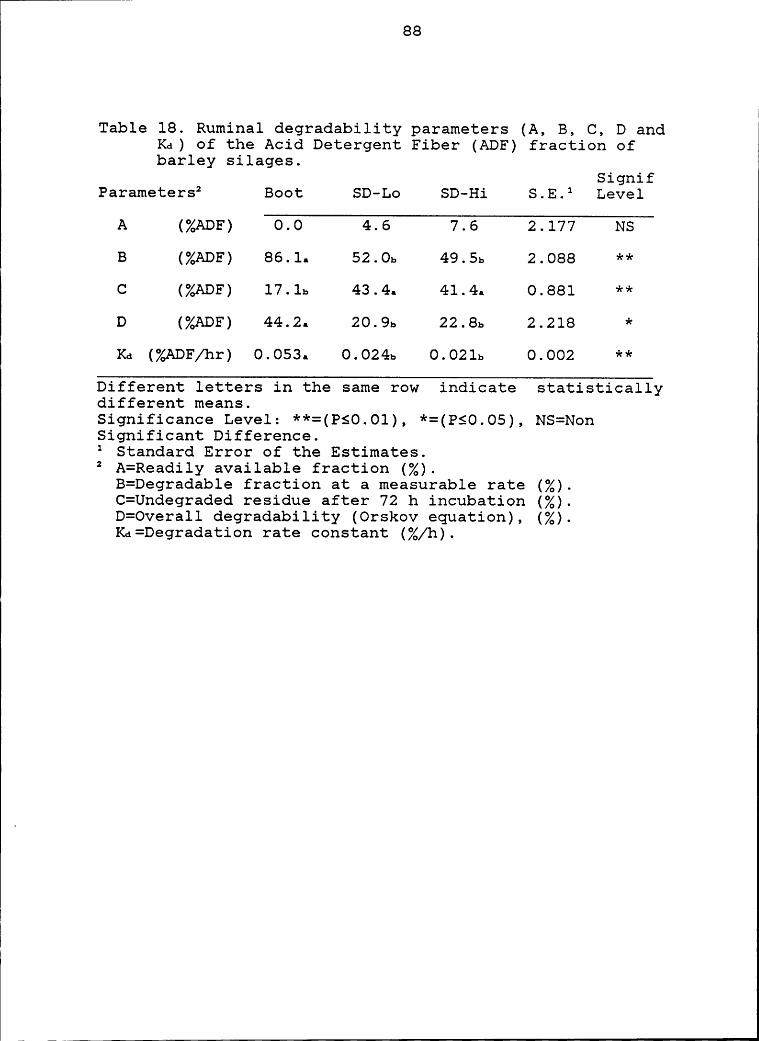
es “
Table 18. Ruminal degradability parameters (A, B, C, D andKd) of the Acid Detergent Fiber (ADF) fraction ofbarley silages.
SignifParameters1 Boot SD-Lo SD-Hi S.E.1 Level
A (ZADF) 0.0 4.6 7.6 2.177 NS
B (ZADF) 86.1. 52.0. 49.5. 2.088 **C (ZADF) 17.1. 43.4. 41.4. 0.881 **D (ZADF) 44.2. 20.9. 22.8. 2.218 *K. (ZADF/hr) 0.053. 0.024. 0.021. 0.002 **
Different letters in the same row indicate statisticallydifferent means.Significance Level: **=(PS0.01), *=(P$0.05), NS=NonSignificant Difference.1 Standard Error of the Estimates.1 A=Readily available fraction (Z).
B=Degradable fraction at a measurable rate (Z).C=Undegraded residue after 72 h incubation (Z).D=0verall degradability (0rskov equation), (Z).Kd=Degradation rate constant (Z/h).
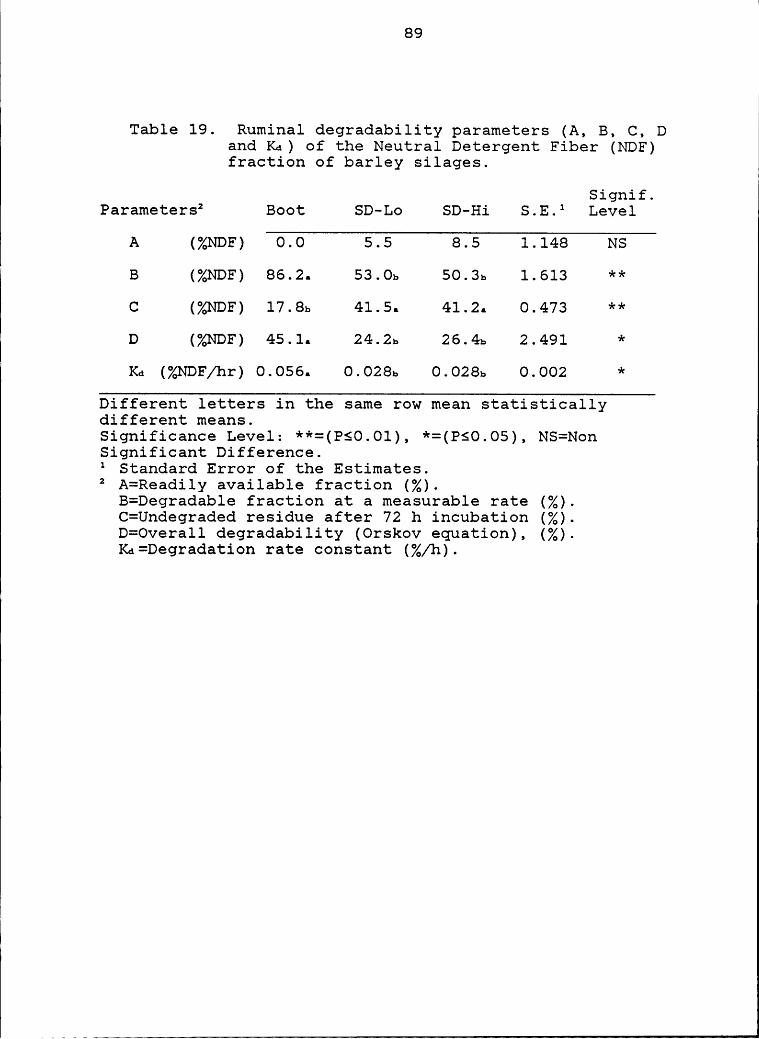
89 „
Table 19. Ruminal degradability parameters (A, B, C, Dand Kd) of the Neutral Detergent Fiber (NDF)fraction of barley silages.
Signif.Parametersz Boot SD—Lo SD-Hi S.E.1 Level
A (ZNDF) 0.0 5.5 8.5 1.148 NS
B (%NDF) 86.2. 53.0b 50.3b 1.613 **C (%NDF) 17.8b 41.5. 41.2. 0.473 **D (ZNDF) 45.1. 24.2s 26.4b 2.491 *Kd (%NDF/hr) 0.056. 0.028b 0.028b 0.002 *
Different letters in the same row mean statisticallydifferent means.Significance Level: **=(P$0.01), *=(P$0.05), NS=NonSignificant Difference.1 Standard Error of the Estimates.2 A=Readily available fraction (%).
B=Degradab1e fraction at a measurable rate (%).C=Undegraded residue after 72 h incubation (%).D=0vera1l degradability (0rskov equation), (%).Kd=Degradation rate constant (Z/h).
90 )
degradable pool (B) compared to soft dough silages. This is
a result of a relatively low undegradable residue (C) and a
degradation rate constant twice as fast. Consequently the
overall degradability of NDF of Boot silage is almost
double that of the later harvested treatments.
According to the biphasal model to explain intake
proposed by Forbes (1977), Boot silage would be the silage
with the highest theoretical intake because it has the
smallest undegradable pool. Also it has the largest B pool
of dry matter and fiber but the fastest rate of degrada-
tion, which should promote higher intake.
Rumen degradabilities for dry matter and nitrogen of the
concentrate ingredients (Soybean Meal and Shelled Corn) fed
to lactating cows is presented in Table 20. The nitrogen
and the dry matter degradability data of shelled corn and
soybean meal of this experiment are very similar to that
reported by Zerbini (1984), except Soybean Meal in this
study has an A fraction 40% larger and a B fraction 27%
smaller. Therefore, Soybean Meal used in this study would
be expected to be more rapidly utilized.
Table 21 presents data of dry matter degradability of
the experimental diets. The degradability of dry matter was
greatest for diets A and B (Boot silage), intermediate for
diets E and F (SD-Hi silage) and least for diets C and D
(SD-Lo silage). This demonstrates the strong influence of
l
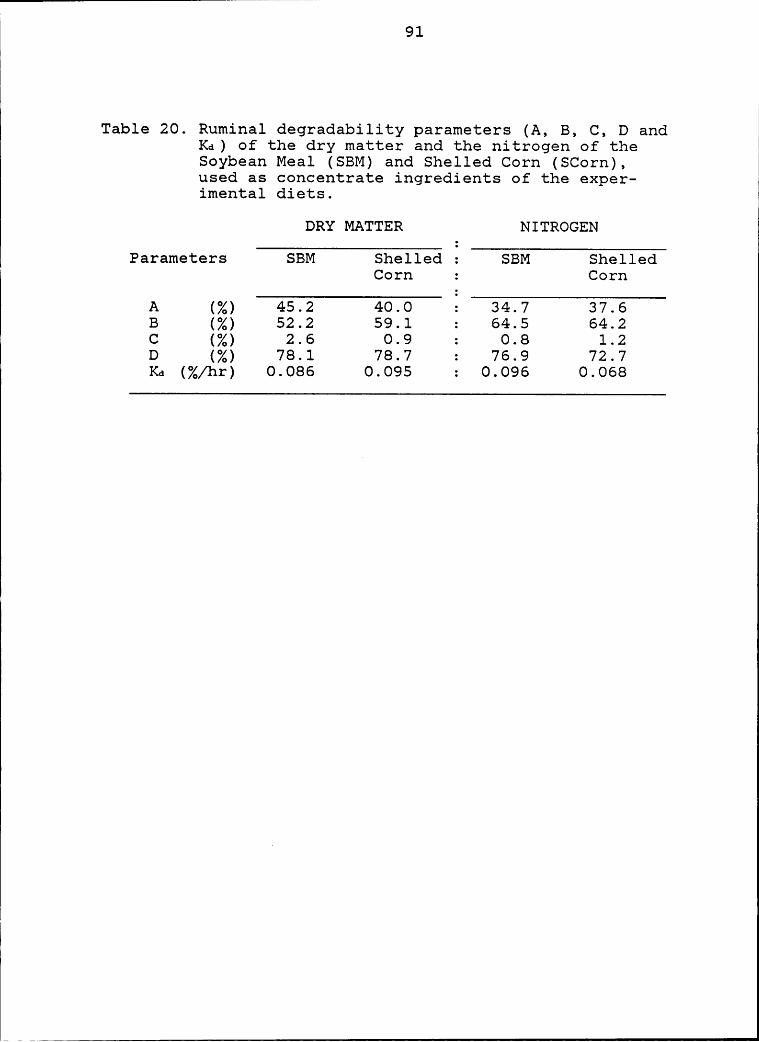
I91 I
I
Table 20. Ruminal degradability parameters (A, B, C, D andKd) of the dry matter and the nitrogen of theSoybean Meal (SBM) and Shelled Corn (SCorn),used as concentrate ingredients of the exper-imental diets.
DRY MATTER NITROGEN
Parameters SBM Shelled ; SBM ShelledCorn : Cern
A (Z) 45.2 40.0 ; 34.7 37.6B (Z) 52.2 59.1 : 64.5 64.2C (Z) 2.6 0.9 : 0.8 1.2D (Z) 78.1 78.7 : 76.9 72.7Ka (Z/hr) 0.086 0.095 : 0.096 0.068
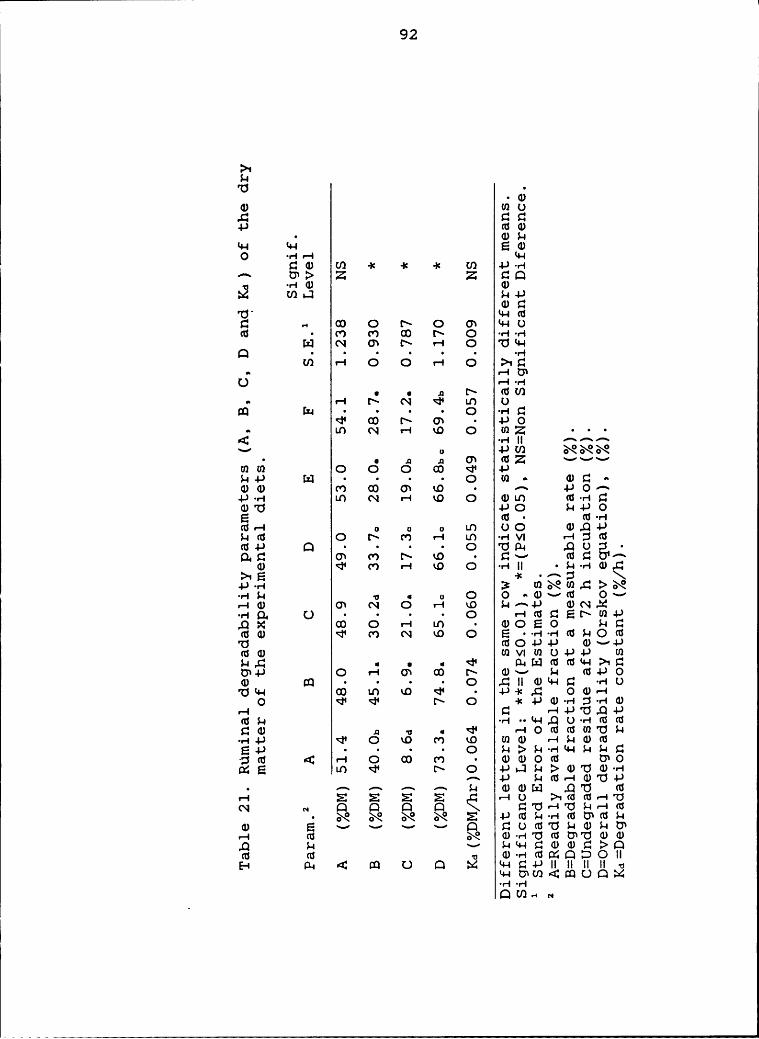
- Q!
92 Q
>·•$-1
l·0
0 1.00:-G GC}4-* 00• 0$-1*1-1 $4-I EQ)O --1:-1 11-1
Ca! U1 ·1= -1= -1: cn -1-*-:-1A U1{> Z Z CQ•1-10 0:2 ua:.1 uu0G
"CV $1-10ct „ co 0 1- o ow $1-IU0 · C') Q Q l\ O -:-1-:-1Q BJ N cw 1- :-1 o 'U<1-1
• • • • • • udU1 :-1 O O :-1 0 >1¤
nU :-1-:-1• • ,¤ l\ (UU]• v-! l\ N 0* LD ULu • • • • O q-Qc'<!‘ Q !\ OW • -I-*0
Q Ü H © O O O
0·• :1 JI O1 (UZ VVVU1U1 O O O Q <!‘ 4-*$-14-* Ix] • • • • O Ui •~ 0C: •~00 M Q ON Q • A 4-*0A-1-*-:-1 mn N :-1 xo O mm cu--11220"O 4-*O $-14-*0E (U • (Uv-!(UF! 0 0 o LÜ UO 0,Q-P$-10 O l\ C') :-1 1.0 -:-1VI :-15004-* Q··•·O "OQ1 .QUg‘·Q.:CZ OW <"> II\ Q · CSV 0G Aev <1• co :-1 ao O-:-1IIäE
*•/'\¤
-1-*-:-1 3 U1NU1„¤¥>N-1-I!-1 5 • 0 O O •0V(U OV:-10 OW N O :-1 Q $-1-4-* 0N:b¢-:-10: O··-•O :·-10CEl\U14J„O¤¢ Q O :-1 Ln · 0OEO $-1C00 <!‘ F1 N Q O E •·:-1-:-105-100"0 004-*4-* 0V4-*00 U1VIU1U-1-*4J U1H:-Q • • • Ü Ü-1['I]('U(U!4—I>1¤014-* O :-1 OW Q l\ 0V $-1 04-*00 Q •
· · · O ,-CIIl0‘1-IC! -1-1UU11-1 Q LO Q <!* · 4-*-1=,C.‘ 00:-10 <1• -11 1~ O -1:-1-*1v-:-1:$·:-111):-1 c :-14-*"O:Q-1-*
0$-1 ·:-1--*1-1,.00-:-100C:'0 .¤ ·¤ • <!* -I000U1"0$-1-:-14-* <!‘ O Q 00 Q U10 -1$-100E-U • • •
· O $-1>$·1·:-1*1-1$-1$·1SII*50 4 :-1 O Q Q • 0000 010ME LO 0* l\ O 4-*1-J$-1l>0"00·:-1A 4-* $-10:-10'U4-*• A A A A $-1 00I:J ,Q"O (U:-1 E EI E E ,5 :-10 >1c6c¤:-—1'¤N N Q Q Q Q $3*0:-1"OS-1:-10
· N N N N EZ 1-1:6:-1--ecucswcus-:0 E V V V V Q QUO"0$-105-10*
:-1 0 0-:-1'0001"O00,0 $-1 V $-1‘1-1CI00£‘:Z>Q0 0 -:1 0·:—10MQ:°DOII
E-1 Q1 4 Q O Q M *1-1£‘:4-*|Il||ll|·¤*1-1U1U'14QUQ>Z:·:-!·:-!OU}:-•¤
93 E
the forage component of the diets. There were no differ-
ences among diets in soluble fraction (A) or degradation
rate constant (Kd) but there were differences in undegrad-
able residue (C) and fraction B (Table 16).
Table 22 presents the information about nitrogen
compound degradability of the experimental diets. The
nitrogen degradability (D) of all experimental diets was
very high and not different among treatments, neither was
the degradation rate constant (Kt). According to the NRC
(1988) and the dry matter intake recorded in this exper-
iment Undegraded Intake Protein of the experimental diets
was below the requirements (498, 510,371, 277, 382 and 414
g UIP/ cow /d for diets A to F respectively) for the levels
of production recorded. The residual undegraded nitrogen
was lower for diets A and B due to the higher degradability
of the nitrogen and fiber components of Boot silage (Tables
17 and 19). There were also differences in the size of the
degradable pool (B) but these differences were more
associated with the concentrate content of the diet rather
than forage source. The differences in soluble fraction (A)
were also more related to concentrate content than forage
content of the diets.
Table 23 presents data of ruminal degradability of ADF
of the experimental diets. There were no differences in
readily degradable pool (A) or in degradation rate constant
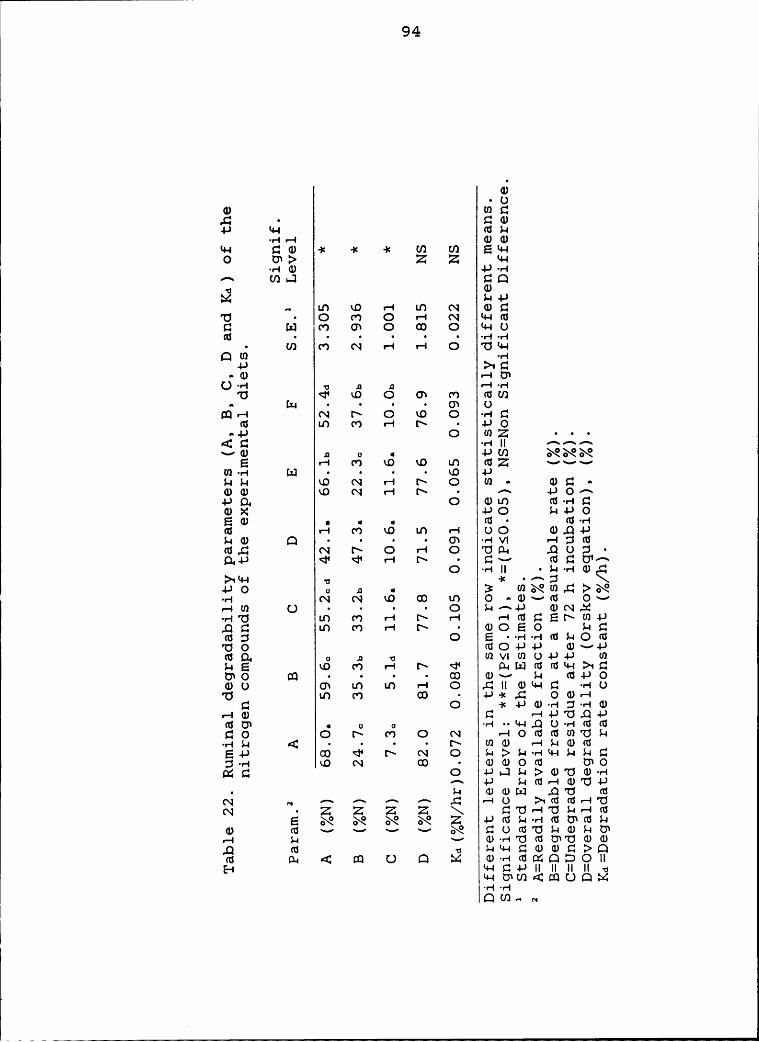
94 ,II
0.*·U4* MCS · S304-* M-! td}-!·«-!«—! ma)M-! S30 -!= -!< ·!= U) U) EM-I0 ¤~:> Z z u-•
--10 4-,·r-I^ U)!-1 CQQ):2 s.•+>.. uw Lo «—! LD N wc:'U · 0 0 0 «-• N M-amct BJ 0 ow 0 0 0 M40‘¤
cn 0 N •—! «—! 0 'OM-!QM -«-1’ 4-* >·•£!-0) •—|U\
C)•v"| ·¤ .¤ .¤ ·'*·r‘|'U <r• RO 0 0: 0 mm
N B 0 0 0 ·-ectGS LD C") v—*| l\ • 4-,0
4C}Il ¤ « 4-,UJ XXXE «-« 0 LO Lo mn mz --~«m•H kl• • • • [O 4,)
HH KO N H B O M•· MG-00) KO N «—-! B · ^ 4-*O»·~4-*Q. O wm m-•-IC<D>< 4-*0 $4-I-*0EÜ • • • ¢U• ¢'G·Hm «—! 0 LO LD •-! 00 <D,Q4-*HG) Q · ·
• • ON ·HV| HZSCU¢¤.£‘• N B O H O 'OQ-• ..QUZ3·:1.+* <t• <1• •—! B · s:~« mc'.U*^O
11 ‘¥ "‘Ü4-,0 u .¤
N N LO Q LD O•—<D~¤G$ Ov•—!M O•···O $·-•»~4-* <1IN,¤¤f·r··|”0 LD M «—·! B «-! -—!m£2EBM4-*.Q¤ an m •-! B · <v0E0 S-ac!MZ! O E•·H·r·IfU$··IC)L'U'UO IUO4-*4-* <D~¤4JFGO; o .¤ ·¤ UIVIUIO4-*4-* U)HE LO m H B <l* ¤-!L:Jr¤mM·-!Z>·•£‘„UO C!] • • •
· Q QJB-¤ $-4 (U4-*000 ow nn LD r-! 0 „¤Ila>M—!¤ -•-10*0 LD 0 0 · 4->«.¤ oo.-!
C! 0 ~x4->aJ·«-!:!·«-!<vHQJ C H4-*'O.Q4—*GU • u o ·H-•‘·H,.¤U·H('5¢UGO O B M O N -!0mmm·0s-•
·«-!$—! 4••··B Md) -45-aajmE4-* Q <i‘ B N O $—!>$-!·r-IM-|$··I$-!¤:5--! Lo N 0 · <1)<DO<¤ 00MC. O 4-,•J$-!>GJ°”0G)·H
^ 4-* $-!!¤·-4<1*"O4-*• s-« mmm .Q*0 mN „ ¤·~ ^ »·~ ^ ,C, HU >«<¤¤5··—!"UN · Z Z Z Z \ cI'¤-—!'Us—«-—!m
E N N N N z 4->ms.«-HmuwmuG) 03 ~¤ -# ~¤ -¤ X CU<U'OL!<D$-!U*-4 S-•
-· <D-«-1"O¢¤U*'U<D<D,0 m U s-•<•-!¤<va>¤:>Q0 Q-4 4 Q U D bd <D··-!a$CdQ°•DOll{-4
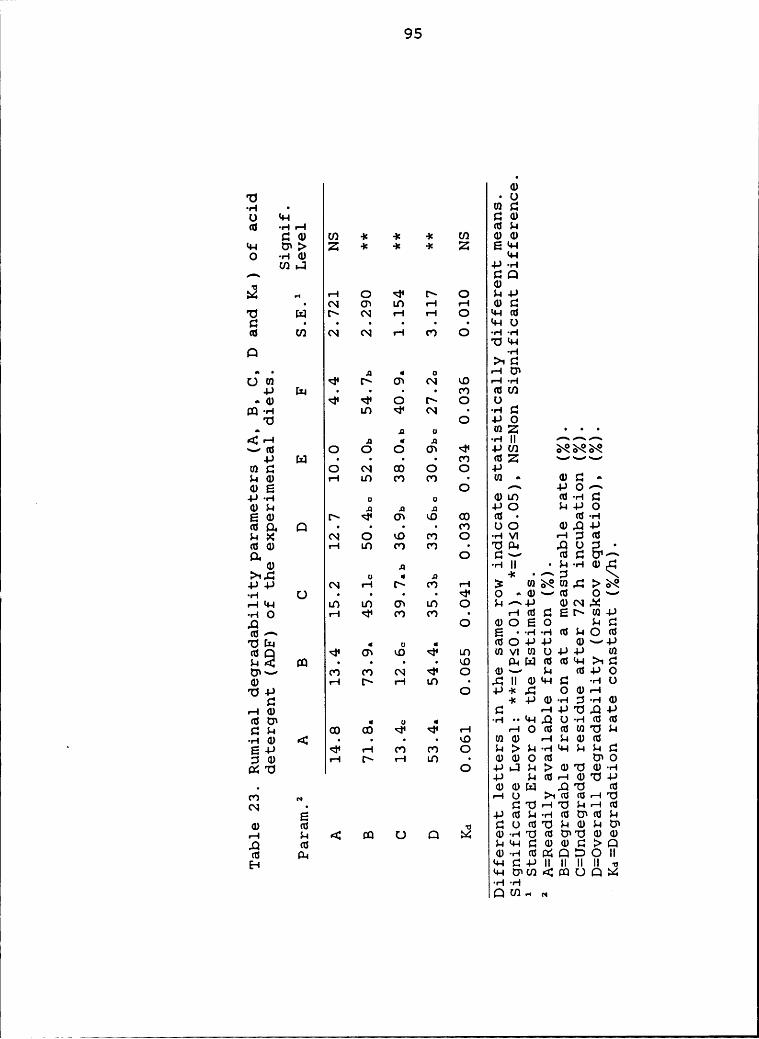
95 ,
I
0'U •O·r·| • (HC',U Q-C $30CU ·«-!•-! CU;-4
C20 Cr) -1C -!= -1= C1') 00Q-! ¤):> Z ·)= —!= -!= Z EQ-!O ·•-10 Q-!
C/)•.J -!J-•-C^ GQ
-0 CDYU 9+*• N ow LO «-• -1 0::U Lzl !~ N «-! «-! 0 Q-um
I I I I IICUU) N N •—! C') O -«-!·«-!UQ-!
Q --1>«£‘•*• .0 1 0 •·*'|U‘
Um <i• t= O) N CD -!-•-!-I-* Cu · ·
• • C') C50')•0) U" O B O UQ--! LD <!• N · ·•-et:U O 4-*0•· .0 0 WZ • · ·•¤3·-I .¤ « 0 ·¤-lll ^^^-as 0 0 0 cw <r• um NNN4-* Ilz] ·
• • • C') CUZ ~¤-¢~«mc 0 N Q 0 0 +>$-40 ¤—·l CI) C') C') · U1 • CDC •~CDE O ^ 4-*O»~
. 4->·«-1 0 ¤ 0m CU--CQ09 .0 .0 .¤ 4-*O S-C4-*0E0 C\ <l* O) xD Q CU · CU--!
I I I
IS-CXN O QO C") O ·«-IVI r-ISG!CU0 «-• LD C') C') ·UmQ„O Sv GSC! ^0 ¤ --!!! ·s-•--!0.¤>·•,C°• 0 1 .0 ·!< ·^U \4->+> N «—! C~ C') ·—« 3
-r-I U • • •·
<}‘ O •0)-'CU O-¢•-CQ-C LO U) O) LC) O S-!^4J CDN.!·•-iO r-I d" C') C')
· «-1Ct$CEl\U)·|-*.¤ 0 0050 s-C:C¤^ E ·-•-1-•-CCUL-OCUÜkl 1 u 1 (UO-Ö-*4-·* 0)*-*+*CS2 <}‘ O) *-0 ü" L!) U’1VIU)U«|·*-G-* U19 II] · · ·
• kO Cl-•Ix]C¤CU‘+-I>1¤U)-· C') C') N <1‘ O <D-¤ S-! CU-PO0 «—+ !~ •—! an · „¤IIOQ—!c: --10U4-> O +>-1<.¤ 00-1
C -x!->0··-!:$·«-!0•-C0 C: ·—++>'U.¤+->GU) 10QS-•Q Q <i* <!• «—! •·—!OCUCUU)U$-C
_ ·r·|0) 4: ·• • • QO WG) r-IS-CCDCU
E-!-P <t• «—1 C') C') O S-«>$-C·«-!Q—!$-C5-CC!:30 -1 C~ «-! Ct) · 0000 U)0MU O 4-J!-'JS-C>0U0·•-!-!-> L-•CU•—!0U4-J
· 00I:J .QU CUV)NN
· GUFIUS-C«—!CUE -!->CU$-C-«-!CUU¤CU$-•
0 Cu 0 ¤L><¤'U¤0s-etz!)«—! S-! 42 Q U Q bd 0-•-!'UCU¤¤U00,Q CU $—!Q-!C‘•00C•‘I>Qas Ile 0--!<0¤dQIDC>I!E—4

96
(Kd) among treatments. Consistent with differences among
forage components (Table 18), the size of degradable pool
(B) and undegraded residue (C) were different. This
resulted in differences in the overall degradability (D) of
ADF. Since the main sources of ADF are the silages,
differences in degradablity tended to group treatments by
forage source.
Results about ruminal degradability of the NDF of the
experimental diets is presented in Table 24. Again as for
ADF there were no differences in readily degradable
fraction (A) or degradation constant rate (Kd) and due to
the high variation of the estimates the overall degradabil-
ity (D) was not different among diets.
As for ADF the main differences in NDF degradability
were in the sizes of degradable (B) and undegradable (C)i
pools. Differences tended to group the diet treatments
according to forage source, showing that Boot NDF had a
greater degradable portion and smaller undegradable residue
than the later stages.
Table 25 presents the proportion of different ingre-
dients of the experimental diets on a dry matter basis.
These proportions were used with ruminal degradability of
single ingredients to predict the degradability of DM and N
compounds of complete experimental diets.
[ Table 26 contains the estimated parameters of ruminal
I
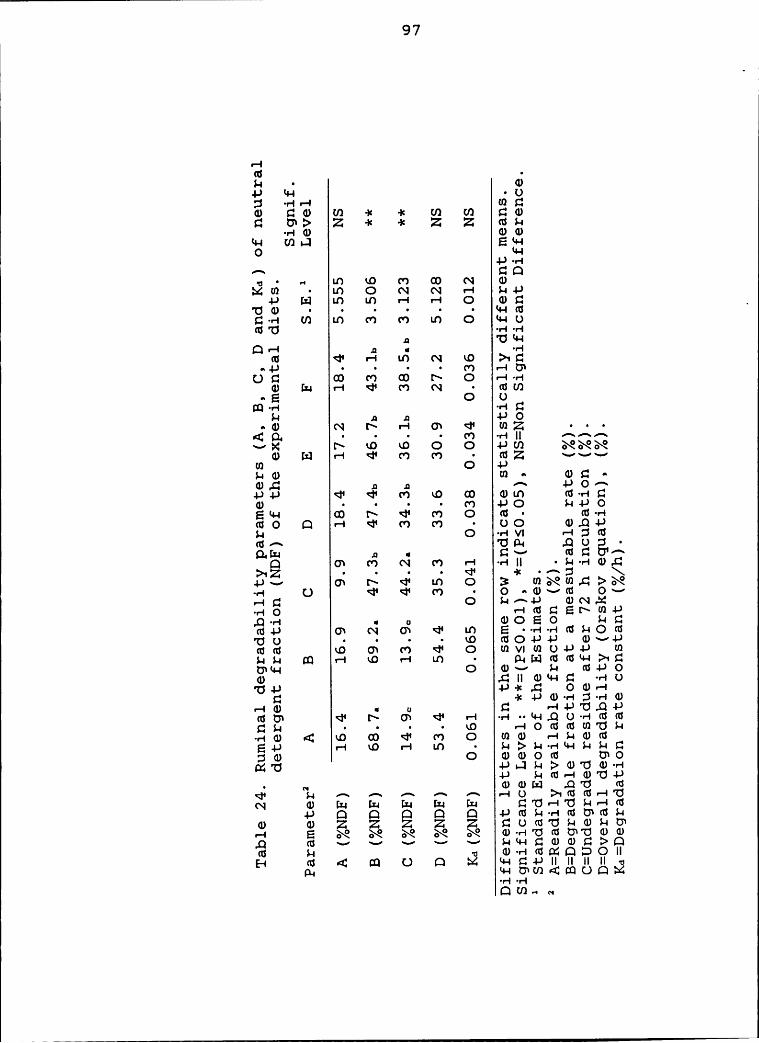
97 1
I
:-4I
$-4 • 04-* '~4·-4 •U5 -:-4:-4 CDC414 Gd) U) -4= 4= U) U) GoG ¤I> Z -4= 4= Z Z <¤$-4
-:-40 00$4-4 Q4-] EH-40 $4-4
4-*-:-4-5 ° :-4 LD LO G:)
::4442 · 4n O N N :-4 $:4-44-4 4:3 an LO :-4 :-4 OGJGG·-40*1 44: m m nn O *4-IO
46'U ·:·4·r·l.¤ "C$‘4-4Q"' .¤ • -4-I46 <14 :-4 4nNOG
Q 4*) Q 4- O :-4-:-40 [:4 :-4 <}‘ 4*) N • 464/)••E O UQ-:-4 ·:-4G$-4 .44 .¤ 4-*0
*0 N [\ I"' (Y)4- 40 4o o 0 4-4411 NNN
0 B] 4**4 <l" 4*) 4*) - 46Z -«-¤-«44) O 4-*$-40 U] •~ 0C:° •414:-G 4: 4: ^ 4JO^4-*4-* <!" Q" 4*) KO Q 040 46-4-4C':0 ·
•·
• 4*) 4-*O $-44-*0EI4-4 Q 4* <)‘ 4*) O 46 • 46-:-4460 Q :-4 *6* 4*) 4*) · UO 0.Q-4-*$4 0 ·:-4v4 r-454646** "U0-4 .OU,’1$ •Q.:l¤ ,¤ •
C-- 46C0‘^Q ow m N m :-4 --4IIQ44-4--
ow 4- <4• 44: o 3 444Nm,c:!>N-:-4 O <l' <i‘ 4*) - 0 -0--46 0--:-4C:' O $-4/--4-* 0N:!=¢-:-40 :-4<¤GE4-4414-4,Q·-4 • ¤ 0OEO $-4Cas-4-4 0) N GN <l• LD E --:-4·:-4c¤$-40<44"ÖO ••··KD 4604-*-4-* 0--4-*4646 xO O) 4*) <!‘ O 4I1VI6)O-4-*-IJ U)$-44-4 Q :-4 LO 4-4 L4) · ¤4£rJ4646*4-4>4C0)*4-4 O 0- $-4 46-4-*0ab „GII<1><•-4G -:-40'U4-4 4-*-44,C 041):-4
G -4<4-4414-:-4:3-:-44144-40 • u C': •··'-4-*”Ö:-Q-4-*GU) Ö' l\ O) I"! -:-4 ••$4-4,QU·:-44646C':$-4 • •
·• RO •—404646U)’U$-4
-:-40 41 RO Q <l‘ 4*) O U10 :-I$-4046E-4-* 4-4 LO :-4 L!) · $-4>$-4·:·4$4·-I$-4$-4¤Z50 O 00046 U)0Q"0 4-*4JI$-4>0"00·:-44-4 $4<¤:-4<v'O-4-4
° N F6
<4* $-4 ^ ^ »·~ ¤·- ^ 4-40 >44646:-4'UN 0 I!-4 [:4 I:-4 l'-4-4 B4 C:"0·-4'U$—4·-446
4-* Q Q D C] D 4-*46$-4-:-446U)46$-4414 414 Z Z Z Z Z ¤0<¤·¤$44v$:¤~•-·| E X X X X X 0-:-4'U46U)"000,Q (5 xa xa xa xaxa46
$-4 ·¤ 0-:-446£Y:Q:°DOIIE-I 46 •¤Z Q O Q IJ: $4-IG4-*||||II||·¤
414
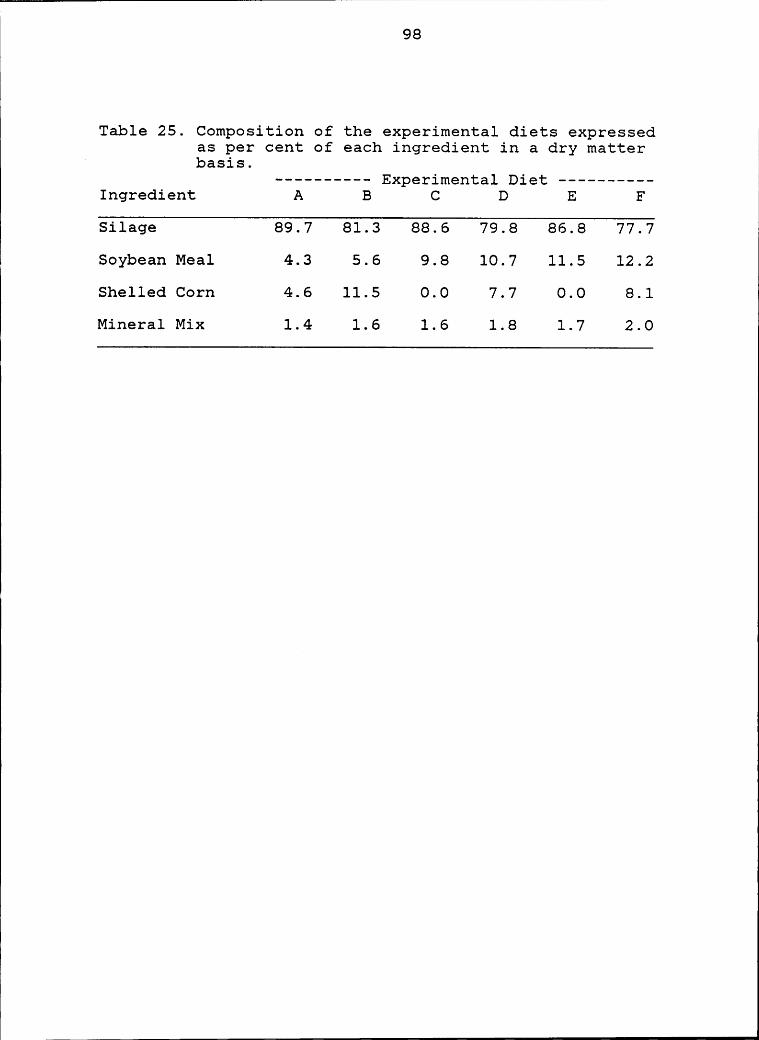
98 1
Table 25. Composition of the experimental diets expressedas per cent of each ingredient in a dry matter‘ basis. ——--—--—-- Experimental Diet —--————-—-
Ingredient A B C D E F
Silage 89.7 81.3 88.6 79.8 86.8 77.7
Soybean Meal 4.3 5.6 9.8 10.7 11.5 12.2Shelled Corn 4.6 11.5 0.0 7.7 0.0 8.1Mineral Mix 1.4 1.6 1.6 1.8 1.7 2.0
99degradabilityof dry matter of the experimental diets.
Predicted paramenters of Table 26 were statistically
compared to those observed (Table 20) using a t test.
Predictability of DM degradability of complete diets waspoor. Only undegraded residue (C) and degradation rateconstant (Kd) tended to be more predictable compared to
other parametes. The low predictabilities obtained may be
due to low number of repetitions per estimate and high
variability of some parameters. However, almost all the
estimated parameters were lower than the observed values
probably due to a slower degradability of the ingredients
incubated individually than in complete diets. It may be
when feed sources containing protein, energy, or minerals
are combined there is a stimulation of DM utilization in
the rumen compared to estimates based on single ingredient
incubation.
Predicted parameters of degradability of nitrogen of the
experimental diets is presented in Table 27. Predictability
of the different N parameters was relatively low. There was
a tendency to predict the readily degradable nitrogen
fraction (A) better than others.
In this case except for the undegraded residue (C) the
predicted were always higher than the observed parameters
in Table 2l. Apparently the nitrogen of the single ingre-
dients had a smaller readily degraded fraction (A) and

100
Table 26. Predicted parameters of ruminal degradability(A, B, C, D and Kd) of dry matter of theexperimental diets.
Param.1 A B C D E F
A 43.3 43.1 46.0 43.1* 51.2 50.2
B 47.0 48.0 32.7 31.6 21.6 32.4
C 9.8* 8.9* 21.3 19.3* 19.2* 17.4*
D 69.5 70.3 59.8 56.9* 64.4 65.8*
Kd 0.064* 0.066* 0.037* 0.037 0.040 0.045*
Observed and predicted parameter are not statisticallydifferent with the following probability:a=(P20.75), b=(P20.80), c=(P20.95) and d=(P20.0l).1 A=Readily available fraction (%).
B=Degradable fraction at a measurable rate (%).C=Undegraded residue after 72 h incubation (%).D=0verall degradability (0rskov equation), (%).Kd=Degradation rate constant (%/h).
I
101 IV
was degraded at a slower rate (Kd) when individually
incubated compared to incubation in complete diets. The
greatest differences between actual versus predicted
overall degradabilities was in diets C, D, E, and F. These
diets contain the greatest amount of soybean meal. Diets A
and B contain less. It may be the forage nitrogen in
complete diets is slowing breakdown of soybean meal
nitrogen , thus, reducing total breakdown resulting in more
protein or N being undegraded in the rumen.
Data indicate that using analysis of single ingredients
to predict total breakdown in complete diets is question-
able.
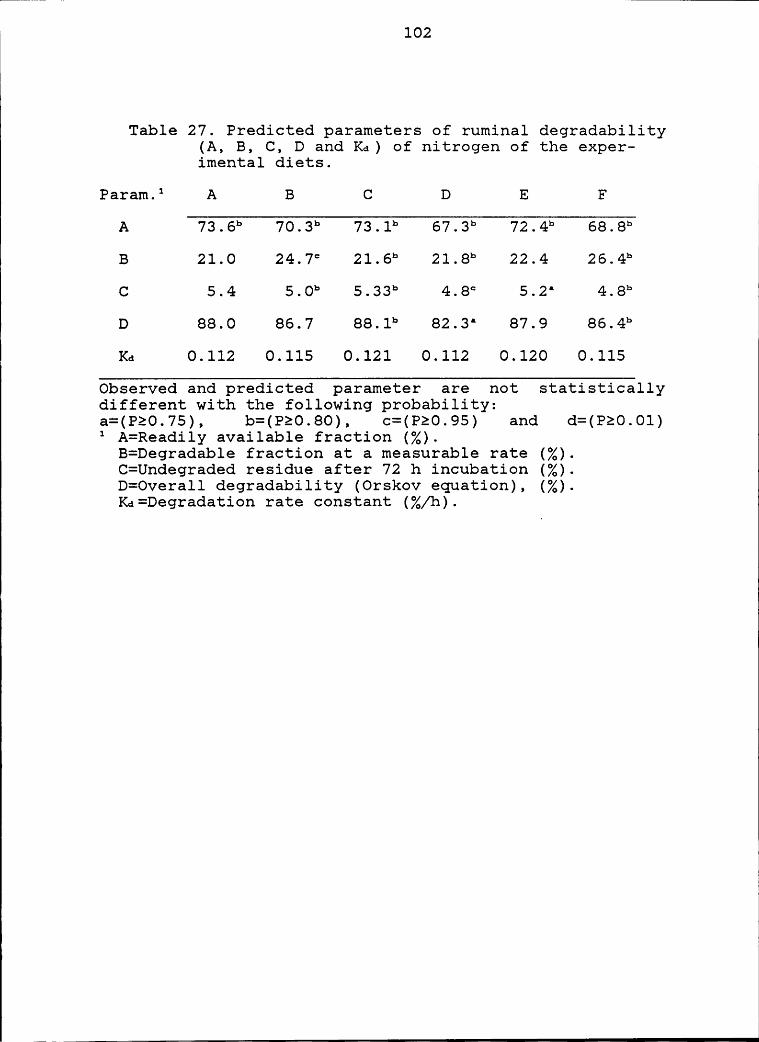
1 102N
Table 27. Predicted parameters of ruminal degradability(A, B, C, D and Kd) of nitrogen of the exper-imental diets.
Param.* A B C D E F
A 73.6* 70.3* 73.1* 67.3* 72.4* 68.8*
B 21.0 24.7* 21.6* 21.8* 22.4 26.4*
C 5.4 5.0* 5.33* 4.8* 5.2* 4.8*
D 88.0 86.7 88.1* 82.3* 87.9 86.4*
Ka 0.112 0.115 0.121 0.112 0.120 0.115
Observed and predicted parameter are not statisticallydifferent with the following probability:a=(P20.75), b=(P20.80), c=(P20.95) and d=(P20.01)‘
A=Readily available fraction (Z).B=Degradable fraction at a measurable rate (Z).C=Undegraded residue after 72 h incubation (Z).D=0verall degradability (0rskov equation), (Z).Kd=Degradation rate constant (Z/h).
1
i 1SUMMARY AND CONCLUSIONS
Boot and soft dough raised cut reduced dry matter yield
per hectare and reduced fiber (ADF) content. Boot harvest
increased crude protein. However, crude protein and total
digestible nutrient yield per hectare was higher for soft
dough low cut.
In general silage composition was in accordance with
the composition of the fresh material. The fermentative
characteristics pH, lactic acid, volatile fatty acids,
butyric acid content and nitrogen bound to acid detergent
fiber were considered acceptable for the three treatments.
Except for ether extract all the In Vivo digestibility
coefficients were higher for the boot harvest and no dif-
ferences were found between soft dough stages. As a result
boot silage had a higher TDN content.
There were no differences in total dry matter intake,
milk fat, 4% fat corrected milk or TDN intake among silage
treatments. Differences in milk yield tended to group
treatments according to concentrate content rather than
silage components. Soft dough treatments maintained while
boot silage promoted body weight loss. The low and not dif-
ferent intakes obtained in this study suggest a strong
influence of the hot weather depressing the voluntary
103
1104 I
intake of the experimental diets.
The ruminal degradability of dry matter, acid detergent
and neutral detergent fiber of Boot silage was higher than
that of the soft dough silages. Dry matter degradability of
soft dough raised cut was highe than soft dough low cut.
The undegraded residue after 72 hours of incubation was
also higher for the soft dough silages.
The readily degradable nitrogen fraction of all silages
was high and not different among silages. Boot had a lower
undegradable residue, a higher degradation rate and
consequently a higher overall degradability of nitrogen
compounds than soft dough silages.
Dry matter and nitrogen commpound degradability of the
experimental diets were highly influenced by forage ingre-
dient characteristics. All experimental diets were high in
readily degradable nitrogen making the undegraded intake
protein lower than the tabulated requirements.
Prediction of dry matter and nitrogen degradability of
the complete diets based on degradability of single ingre-
dients was poor and restricted to some parameters such as
undegradable residue and rate constant for dry matter and
readily degradable nitrogen. Dry matter degradability was
greater when complete diets were incubated versus individ-
ual ingredients indicating more extensive rumen digestion.
Nitrogen compound degradability was less when complete
l105 1
11
diets were incubated versus individual ingredients and may
be a result of sparing of soybean meal breakdown by the
highly degradable silage nitrogen. Incubation of single
ingredients did not give good estimates of rumen degrada-
tion compared to incubation of complete diets.
REFERENCES
Association of Official Analytical Chemists. 1980. OfficialMethods of Analysis.
13‘“ed. Assoc. Offic. Anal.
Chem., Washington, DC.
Agricultural Research Council. 1980. The Nutrient Require-ment of Ruminant Livestock. C.A.B. Farnham Royal,England.
Barker, S.B. and W.H. Summerson. 1941. The colorimetricdetermination of lactic acid in biological material. J.Biol. Chem. 138:535.
Barnes, R.F. and G.C. Marten. 1979. Recent developments inpredicting forage quality. J. Anim. Sci. 48:1554.
Belyea R.L., F.A. Martz, R.E. Ricketts, R.R. Ruehlow andR.C. Bennett. 1978. In Vitro dry matter digestibility,detergent fiber, protein and mineral content of wheatforage as dairy cattle feed. J. Anim. Sci. 46:873.
Boman, R.L. 1980. Small grains for silage. Proc. SouthernPiedmont Forage conf., Chatham, VA. January 31.
Broderick, G.A. 1982. Estimation of protein degradationusing the in situ and in vitro methods. In: Proteinrequirements for cattle: Symposium. F.N. Owens (Ed.).Misc. Publ. 109. Oklahoma St. Univ., Stillwater.
Broster, W.H., J.D. Sutton and J.A. Bines. 1981. Concen-trate:Forage ratios for high—yielding dairy cows.Pages 325-352. in Recent development in ruminanatnutrition. Haresing, W. and A. Cole Eds. Butterworths,London.
Camper, Jr., H.M., C.F.Genter and K.E. Loope. 1972. Doublecropping following winter barley harvest in easternVirginia. Agron. J. 64:1-3.
Chalupa, W. and J.D. Ferguson. 1988. Recent concepts inprotein use for ruminants examined. Feedstuffs June 131988.
Chase, L.E. 1979. Effect of high moisture feeds on feedintake and milk production in dairy cattle. Proc. Cor-nell Nutrition Conf. p. 52.
106
107
Cherney, J.H. and G.C. Marten. 1982. Small grain cropforage potential: I. Biological and chemical determi-nants of quality and yield. Crop Sci. 22:227.
Cherney, J.H. and G.C. Marten. 1982. Small grain cropforage potential: II. Interrelationships among biologi-cal, chemical, morphological and anatomiacal determi-nants of quality. Crop Sci. 22:240.
Conrad, H.R., A.D. Pratt and J.W. Hibbs. 1964. Regulationof feed intake in dairy cows.I. Change in importance ofphysical and physiological factors with increasingdigestibility. J. Dairy Sci. 47:54.
Conrad, H.R. 1966. Symposium on factors influencing thevoluntary intake of herbage by ruminants: Physiologicaland physical factors limiting feed intake. J Anim. Sci.25:227.
Cragle, R.G., M.R. Murphy, S.W. Williams, and J.H. Clark.1986. Effects of altering milk production and composi-tion by feeding on multiple component milk pricing sys-tem. J. Dairy Sci. 69:282.
Crampton, E.W. and L.A. Maynard. 1938. The relation of cel-lulose and lignin content to the nutritive value ofanimal feeds. J. Nutr. 15:383.
Danley, M.M. and R.L. Vetter.1973. Changes in carbohydrateand nitrogen fractions and digestibility of forages:Maturity and ensiling. J. An. Sci. 37:994.
Davis, R.E. 1976. A combined automated procedure for thedetermination of reducing sugars and nicotine alcaloidsin tobacco products using a new reducing sugar method.Tobacco Science 20:139.
Di Rienzo, D.B. 1987. Intensive spring nitrogen managementof winter barley: Silage and grain yield and composi-tion. M.S. Thesis. Virginia Polytechnic Institute andState University, Blacksburg.
Edmisten, L.K. 1985. Agronomic, morphological and nutritivecharacteristics of four winter small grains at sixgrowth stages. M.S. Thesis, North Carolina StateUniversity, Raleigh.
Edwards, R.A., E. Donaldson, and A.W. McGregor. 1968.Ensilig of whole crop barley. I. Effects of variety and

108
I1
stage of growth. J. Sci. Fd. Agric. 19:656.
Edwards, R.A. and P. McDonald. 1978. The chemistry ofsilage fermentation. Pages 27-70. Fermentation ofSilage: A Review. M.E. McCullough Ed. National FeedIngredients Association. West des Moines, Iowa.
Fisher, L.J., J.R. Lessard, and G.A. Lodge. 1972. Wholecrop barley as conserved forage for lactating cows.Can. J. Anim. Sci. 52:497.
Flatt, W.P. and P.W. Moe. 1969. Energy requirements. Page269. in Animal Growth and Nutrition. Hafez, E.S.E. andI.A. Dyer, eds. Lea & Febiger. Philadelphia.
Forbes, J.M. 1977. Development of a model of voluntary foodintake and energy balance in lactating cows. Anim.Prod. 24:203.
Gardener, F.P. and 0.C. Wiggans. 1961. Yield, moisture andcrude protein composition of spring oats cut for silageat different stages of maturity. Agron. J. 53:251.
Goering, H.K. and J.P. Van Soest. 1970. Forage fiber analy-sis. Agric. Handbook No. 379. Agric. Res. Serv.,US Dep.Agric., Washington, DC.
Gordon, C.H., J.C. Derbyshire, H.G. Weiseman and W.C.Jacobson. 1964. Variations in initial compositions oforchardgrass as related to silage composition and feed-ing value. J. Dairy Sci. 46:987.
Huber, J.T. and L. Kung, Jr. 1981. Protein and non proteinnitrogen utilization in dairy cattle. J. Dairy Sci.64:1170.
Janicki, F.J. and C.C. Stallings. 1988. Degradation ofcrude protein in forages determined by In Vitro and InSitu procedures. J. Dairy Sci. 71:2440.
Krishnamoorthy, U., T.V. Muscato, C.J. Sniffen, and P.J VanSoest. 1982. Nitrogen fractions in selected feed-stuffs. J. Dairy Sci. 65:217.
Laissus, R. 1968. Importance of cutting height on yield andcomposition of a timothy crop. Fourrages 35:27.
Linn, J.G. and D.E. Otterby. 1988. Nutritional factorsaffecting milk composition. Page 164. in International
I
109 I
I
I
IStockmen’s School Handbooks. Pope, L.S., ed. DairyScience Handbook Vol. 18. Bryan, Texas.
Lofgreen, G.P. and W.N. Garrett. 1968. A system forexpressing net energy requirements and feed values forgrowing and finishing beef cattle. J. Anim. Sci.27:793.
Martin, N.P. 1980. Managing forage crops for qualitysilage. Pages 34 - 45. in Profitable preservation andfeeding of quality silage. Special Report 81. Agric.Extension Serv. Univ. of Minnesota.
McCullough, M.E. and L.R. Sisk. 1967. Influence of stage ofmaturity at harvest and level of grain feeding onintake of wheat silage. J. Dairy Sci. 50:705.
McCullough, M.E. 1978. Silagez Some General Considerations.Pages 1-26. in Fermentation of silage: A Review. M. E.McCullough ed. National Feed Ingredients Association.West des Moines, Iowa.
McDonald, P., A.R. Henderson and I. Ralton. 1973. Energychanges during ensilage. J. Sci. Fd. Agric. 24:827
McDonald, P. and R. Whittenbury. 1973. The Ensilage Pro-cess. Chapter 28. Pages 33-60. in Chemistry and Bioch-emistry of Herbage. Butler, G.W. and R.W. Bailey eds.Academic Press. London.
Mertens, D.R. 1980a. Fiber content and nutrient density indairy rations. Proc. Dist. Feed Conf. 35:35.
Mertens D.R. 1985b. Effect of fiber on feed quality fordairy cows. Proc. 46th Minnesota Nutr. Conf.
Mertens, D.R. 1985. Modifications of neutral detergentfiber analysis for feeds. Procedures. July, 1985.
Moe, P.W., H.F. Tyrrell, and W.P. Flatt. 1971. Energeticsof body tissue mobilization. J. Dairy Sci. 54:548.
Moe, P.W., W.P. Flatt and H.F. Tyrrell. 1972. The netenergy value of feeds for lactation. J. Dairy Sci.55:945 .
Moe, P.W. and H. F. Tyrrell. 1972. Metabolizable energyrequirements of pregnant dairy cows. J. Dairy sci.55:480 .
110 II
Moe, P.W. and H.F. Tyrrell. 1976. Estimating metabolizableand net energy of feeds. Pages 232-237. in Proc. lst.Internat. Symposium on Feed Composition, AnimalNutrient Requirement, and Computerization of Diets.Fonnesbeck, P.V., L.E. Harris and L.C. Kearl, eds.Logan, Utah State University.
Moore, L.A., H.M. Irvin and J.C. Shaw. 1953. Relationshipbetween TDN and energy values of feeds. J. Dairy Sci.36:93 .
National Research Council. 1981. Effect of Environment onNutrient Requirements of Domestic Animals. NationalAcademy Press. Washington, D.C.
National Research Council. 1982. United States-CanadianTables of Feed Composition. Third Revision. NationalAcademy Press. Washington, D.C.
National Research Council. 1985. Ruminant Nitrogen Usage.Washington, D.C. National Academy Press.
National Research Council. 1987. Predicting Feed Intake ofFood—Producing Animals. Washington, D.C. NationalAcademy Press.
National Research Council. 1988. Nutrient Requirements ofDairy Cattle. Sixth Revised Edition. Washington, D.C.National Academy Press.
Nocek, J.E., J.H. Herbein, and C.E. Polan. 1983. Totalamino acid release rates of soluble and insoluble pro-tein fractions of concentrate feedstuffs by Strepto-myces griseus. J. Dairy Sci. 66:1663.
Nocek, J.E. and J.E. English. 1986. In situ degradationkinetics: Evaluation of rate determination procedure.J.Dairy Sci. 69:77.
Nocek, J.E. 1988. Nutritional considerations to achievehigh milk production. Feed and Nutritional ManagementCow College. Virginia Tech. Blacksburg, VA.
Orskov, E.R. and I. McDonald. 1979. The estimation of pro-tein degradability in the rumen from incubationmeasurements weighted according to rate of passage. J.Agric. Sci., Camb. 92:499.
N 111 ÄOrskov, E.R., M. Hughes-Jones, and I. McDonald. 1981.
Degradability of protein supplements and utilization ofundegraded protein by high producing dairy cows. inRecent developments in ruminant nutrition. Haresing, W.and C.J.A. Cole, eds. Butterworths, London.
Pennington, R.J. and T.M. Sutherland. 1956. Ketone—bodyproduction from various substrates by sheep-rumenepithelium. Biochem. J. 63:353.
Pichard, G. and P.J. Van Soest. 1978. Protein solubility ofÄ ruminant feeds. Proc. Cornell Nutr. Conf. p. 91.
Polan, C.E., T.M. Starling, J.T. Huber, C.N. Miller, and« R.A. Sandy. 1968. Yields, compositions, and nutritive
evaluation of barley silages at three stages of matu-rity for lactating cows. J. Dairy Sci. 51:1801.
Polan, C.E. 1976. Stage of maturity for harvesting graincrops for silage. Proc. Southern Piedmont Forage Conf.,Blackstone, VA. March 4.
Poos-Floyd, M., T. Klopfenstein, and R.A. Britton. 1985.Evaluation of laboratory techniques for predicting rum-inal protein degradation. J. Dairy Sci. 68:829.
Raymond, W.F. 1969. The nutritive value of forage crops.Advances in Agronomy. 21:2-108.
Rook, J.A.F. 1976. Nutritional influences on milk quality.Page 221. in Principles of cattle production. Swan, H.and W.H. Broster, eds. Butterworths, London.
Satter, L.D. and R.E. Roffler. 1975. Nitrogen requirementsand utilization in dairy cattle. J. Dairy Sci. 58:1219.
Satter, L.D., I.W. Whitlow, and G.L. Beardsley. 1977.Resistance of protein to rumen degradation and its sig-nificance to the dairy cow. Proc. Distill. Feed ResCounc. 32:63.
Satter, L.D. 1986. Protein supply from undegraded dietaryprotein. in Symposium: Protein and fiber digestion,passage and utilization in lactating cows. J. DairySci. 69:2734.
Schneider, B.H. and W. P Flatt. 1975. The evaluation offeeds through digestibility experiments. The Universityof Georgia Press, Athens.

112Smith,
D. 1960. Yield and chemical composition of oats forforage with advance in maturity. Agron. J. 52:637.
Stern, M.D. and L.D. Satter, 1982. In vivo estimation ofprotein degradability in the rumen. in Proteinrequirements for cattle: Symposium. F.N. Owens, ed.Misc. Publ. 109. Oklahoma St. Univ., Stillwater.
Satter, L.D., I.W. Whitlow and G.L. Beardsley. 1977. Resis-tance of protein to rumen degradation and its signifi-cance to the dairy cow. Proc. Distil. Feed Res. Counc.32:63 .
Sullivan, J.T. 1973. Drying and storing herbage as hay.Chapter 27. Pages 1-31. in Chemistry and biochemistryof herbage. Butler, G.W and R.W. Bailey, eds.Academic Press. London.
Sutton, J.D. 1985. Digestion and absorption of energysubstrates in the lactating cow. J. Dairy Sci. 68:3376.
Tamminga, S. 1979. Protein degradation in the forestomachsof ruminanats. J. Anim. Sci. 49: 1615.
Tyrrell, H.F. and P.W. Moe. 1974. Net energy value of acorn and barley ration for lactation. j. Dairy Sci.57:451.
Tyrrell, H.F. and P.W. Moe. 1975. Symposium-Productionefficiency on the high producing cow. Effect of intakeon digestive efficiency. J. Dairy Sci. 58:1151.
Van Horn, H.H. 1982. Empirical value of crude protein sys-tem for dairy rations. in Protein Requirements ForCattle: Symposium. F.N. Owens, ed. Oklahoma StateUniversity. Stillwater, Oklahoma.
Van Soest, P.J. 1965. Symposium on factors influencing thevoluntary intake of herbage by ruminants: Voluntaryintake in relation to chemical composition and digesti-bility. J. Anim. Sci. 24:834.
Van Soest, P.J. and L.A. Moore. 1965. New chemical methodsfor analysis of forages for the purpose of predicting
· nutritive value. Pages 783-789. in Proc.9°”
Int.Grassld. Congr.

113 {
Van Soest, P.J. 1982. Nutritional Ecology of the Ruminant.Ithaca, New York. Cornell University Press.
Van Soest, P.J. and D.R Mertens. 1984. The use of neutraldetergent fiber versus acid detergent fiber in balan-cing dairy rations. Pages 75-93. in Monsanto TechnicalSymposium. Monsanto Co., St. Louis, MO.
Van Soest, P.J. and J. B. Robertson. 1980. In: Standardi-zation of analytical methodology for feeds. p 49. W.J.Pidgen, C. C. Balch and M. Graham, eds. IDRC-134e.Ottawa.
Virginia Cooperative Extension Service. Dairy Guidelines.(March 1983). Barley or wheat makes a good silage.Publication 404-155.
Virtanen, A.I. 1966. Milk production of cows on protein-free feed. Science 153:1603.
Waldo, D.R. and H.K. Goering. 1979. Insolubility of pro-teins in ruminant feeds by four methods. J. Anim. Sci.49:1560.
Ward, G.M. and P.L. Kelly. 1969. Influence of roughage toconcentrate ratios on ad libitum consumption by lactat-ing cows. J. Dairy Sci. 52:1017.
Wholt, J.E., C.J. Sniffen, and W.H. Hoover. 1973. Measure-"’”ment of protein solubility in common feedstuffs. J.
Dairy Sci. 56:1052.
Wilkins, R.J. 1981. The nutritive value of silages. Pages268-282. in Recent Developments in Ruminant Nutrition.Haresin, W. and C.J.A. Cole, eds. Butterworths, London.
Woodford, J.A., N.A. Jorgensen, and G.P. Barrington. 1986.Impact of dietary fiber and physical form on perfor-mance of lactating dairy cows. J. Dairy Sci. 69:1035.
Zadocks, J.C., T.T. Chang, and C.F. Konzak. 1974. A decimalcode for the growth stages of cereals. Weed Res.14:415.
Zerbini, E. 1984. Protein sources evaluated for ruminatingHolstein bull calves. M.S. Thesis. Virginia Polytech-nic Institute and State University, Blacksburg.

APPENDIX
114
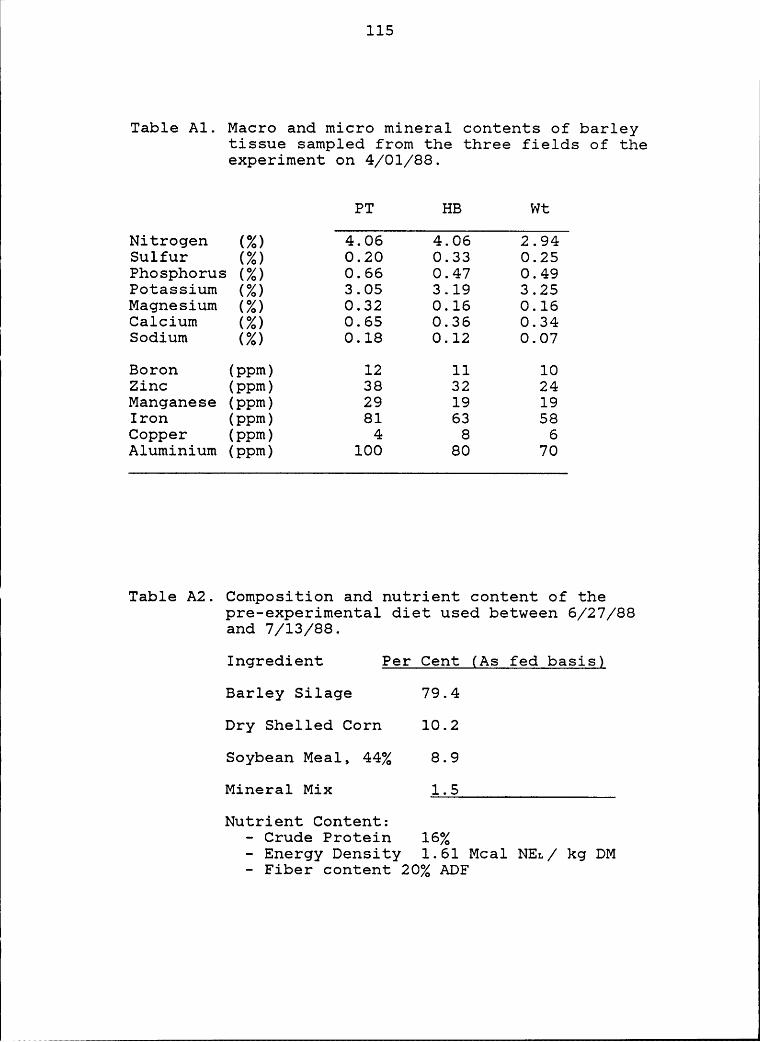
115 k
Table A1. Macro and micro mineral contents of barleytissue sampled from the three fields of theexperiment on 4/01/88.
PT HB Wt
Nitrogen (Z) 4.06 4.06 2.94Sulfur (Z) 0.20 0.33 0.25Phosphorus (Z) 0.66 0.47 0.49Potassium (Z) 3.05 3.19 3.25Magnesium (Z) 0.32 0.16 0.16Calcium (Z) 0.65 0.36 0.34
lSodium (Z) 0.18 0.12 0.07
Boron (ppm) 12 11 10Zinc (ppm) 38 32 24Manganese (ppm) 29 19 19Iron (ppm) 81 63 58Copper (ppm) 4 8 6Aluminium (ppm) 100 80 70
Table A2. Composition and nutrient content of thepre—experimental diet used between 6/27/88and 7/13/88.
Ingredient Per Cent (As fed basis)
Barley Silage 79.4
Dry Shelled Corn 10.2
Soybean Meal, 44Z 8.9
Mineral Mix 1.5
Nutrient Content:- Crude Protein 16Z- Energy Density 1.61 Mcal NEL/ kg DM— Fiber content 20Z ADF

116 Z
I
Table A3. Nutritive composition of the concentrateingredients used in the formulation of theexperimental diets.
Soyben Meal Shelled Corn
Dry Matter (%) 90.9 88.8Crude Protein (%) 45.6 9.7ADF (%) 13.4 6.0TDN (Estimated) (%) 80 85NEL (Mcal/kg DM) 1.74 1.87
Table A4. Composition of the mineral mix (VPI DairyMineral) supplemented in the feeding trialand In Vivo digestibility trial.
Phosphorus (P) Min. 6.50%Calcium (Ca) Min. 16.50%Calcium (Ca) Max. 19.80%Salt (NaCl) Min. 3.50%Salt (NaCl) Max. 5.50%Magnesium (Mg) Min. 2.50%Sulfur (S) Min. 3.60%Manganese (Mn) Min. 0.125%Zinc (Zn) Min. 0.15%Iron (Fe) Min. 0.03%Copper (Cu) Min. 0.015%Iodine (I) Min. 0.005%Cobalt (Co) Min. 0.003%Selenium (Se) Min. 0.0005%Vitamin A IU/Lb. Min. 50,000Vitamin D-3 IU/Lb. Min. 25,000Vitamin E IU/Lb. Min. 500Sodium Bicarbonate (by weight) 22%
-1„1_........................................................------J
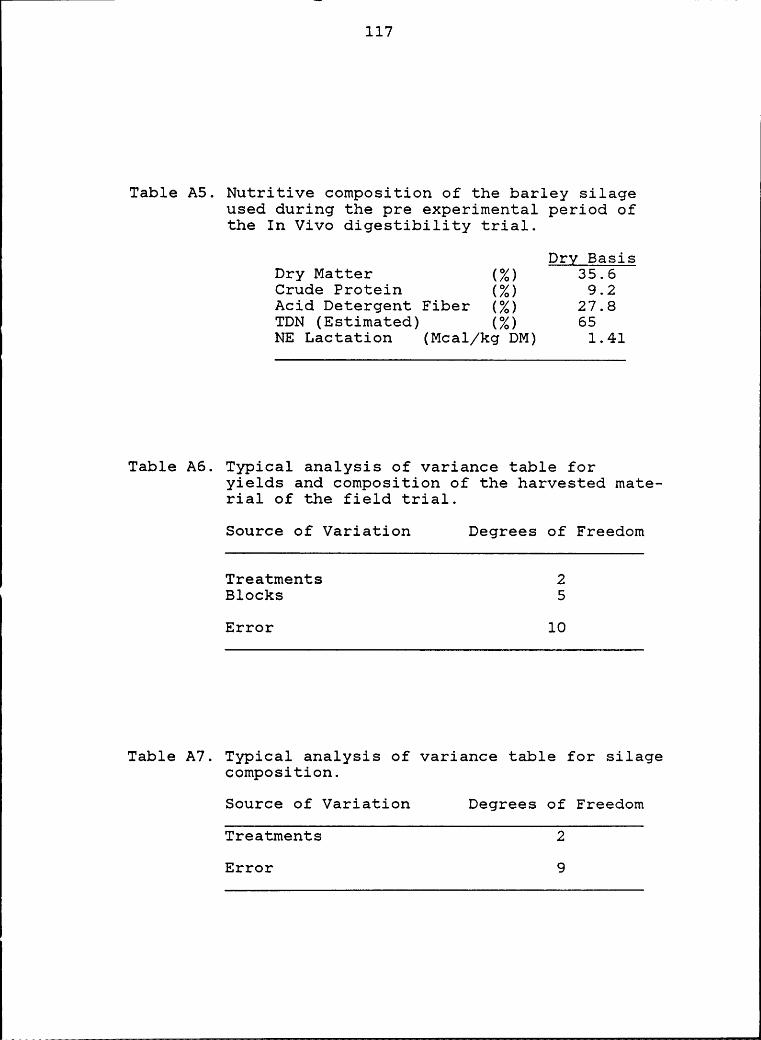
117
Table A5. Nutritive composition of the barley silageused during the pre experimental period ofthe In Vivo digestibility trial.
Dry BasisDry Matter (Z) 35.6Crude Protein (Z) 9.2Acid Detergent Fiber (Z) 27.8TDN (Estimated) (Z) 65NE Lactation (Mcal/kg DM) 1.41
Table A6. Typical analysis of variance table foryields and composition of the harvested mate-rial of the field trial.
Source of Variation Degrees of Freedom
Treatments 2Blocks 5
Error 10
Table A7. Typical analysis of variance table for silagecomposition.
Source of Variation Degrees of Freedom
Treatments 2
Error 9
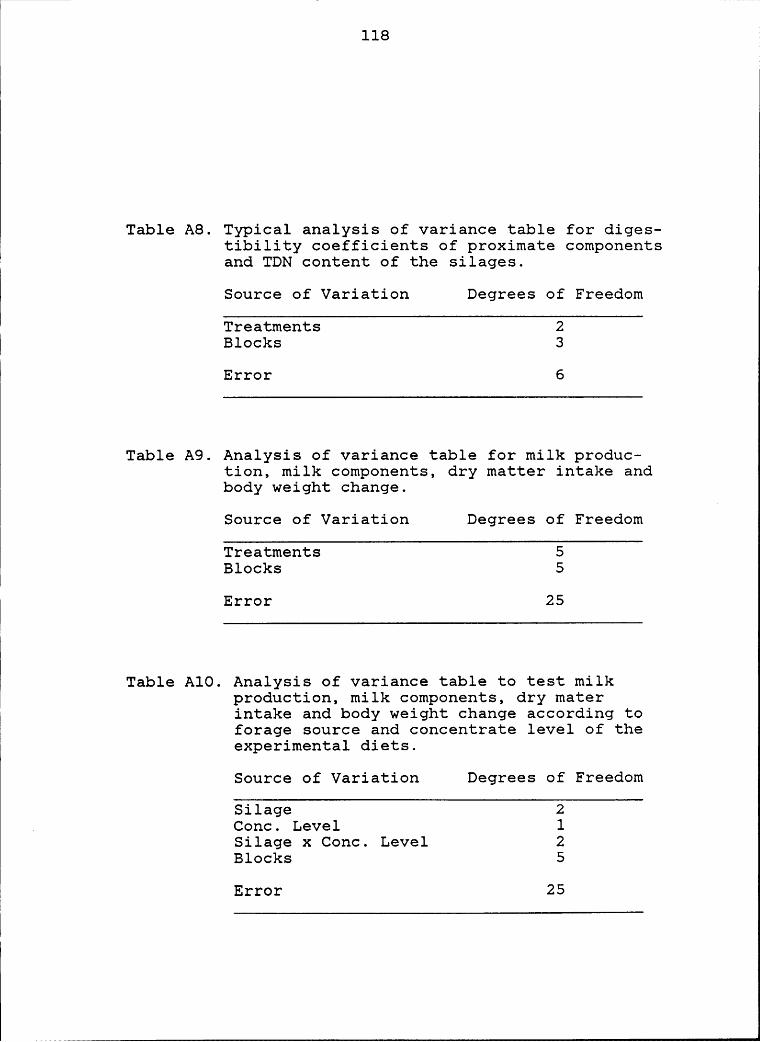
118TableA8. Typical analysis of variance table for diges-I tibility coefficients of proximate components· and TDN content of the silages.
ISource of Variation Degrees of Freedom
Treatments 2I Blocks 3
Error 6
Table A9. Analysis of variance table for milk produc-tion, milk components, dry matter intake andbody weight change.
Source of Variation Degrees of Freedom
Treatments 5Blocks 5
I Error 25
Table A10. Analysis of variance table to test milkproduction, milk components, dry materintake and body weight change according toforage source and concentrate level of theexperimental diets.
Source of Variation Degrees of Freedom
Silage 2„ Conc. Level 1
Silage x Conc. Level 2Blocks 5
I Error 25
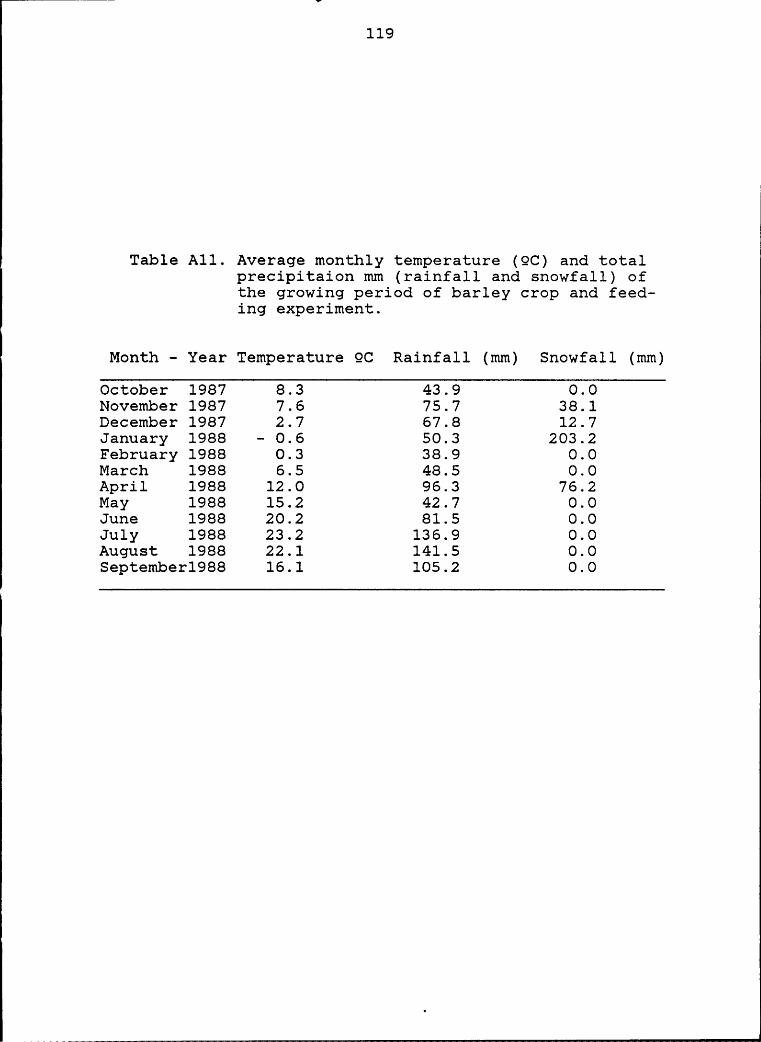
119
Table A11. Average monthly temperature (QC) and totalprecipitaion mm (rainfall and snowfall) ofthe growing period of barley crop and feed-ing experiment.
Month - Year Temperature QC Rainfall (mm) Snowfall (mm)
October 1987 8.3 43.9 0.0November 1987 7.6 75.7 38.1December 1987 2.7 67.8 12.7January 1988 - 0.6 50.3 203.2February 1988 0.3 38.9 0.0March 1988 6.5 48.5 0.0April 1988 12.0 96.3 76.2May 1988 15.2 42.7 0.0June 1988 20.2 81.5 0.0July 1988 23.2 136.9 0.0August 1988 22.1 141.5 0.0September1988 16.1 105.2 0.0