Embed Size (px)
Citation preview
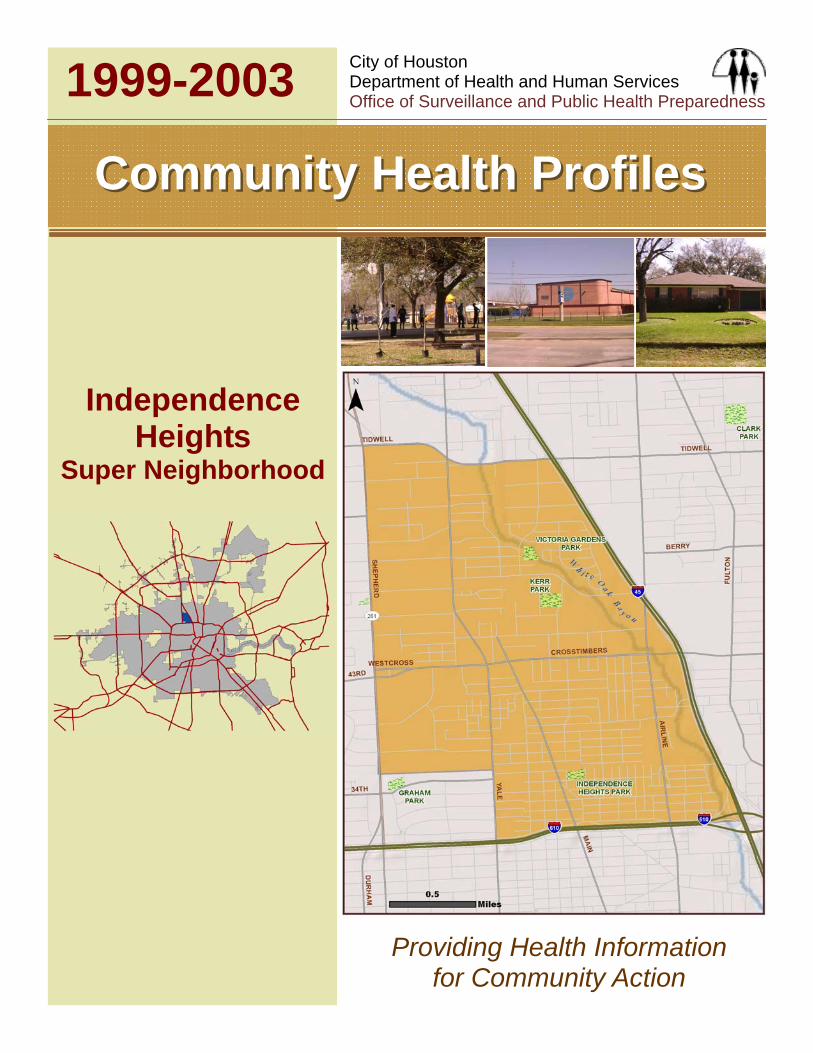
Community Health ProfilesCommunity Health Profiles
City of Houston Department of Health and Human Services Office of Surveillance and Public Health Preparedness 1999-2003
Providing Health Information for Community Action
Independence Heights
Super Neighborhood
Community Health Profiles 1999-2003
2 The Health of Independence Heights Super Neighborhood
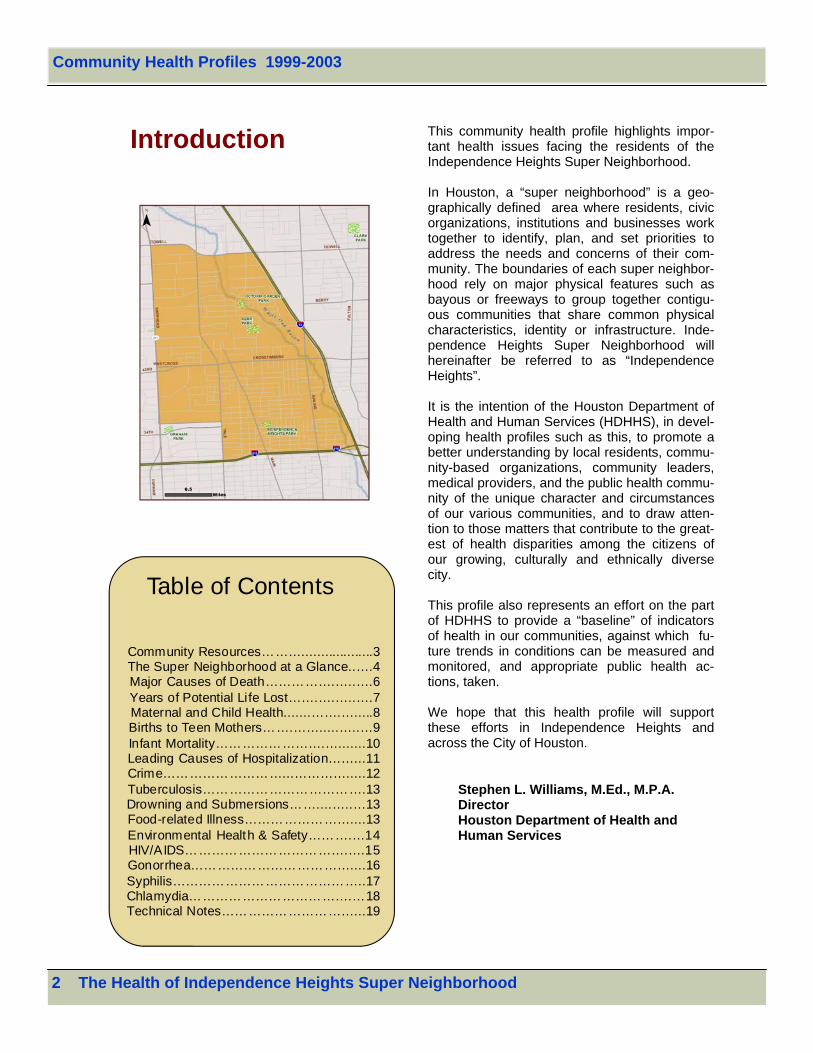
Introduction This community health profile highlights impor-tant health issues facing the residents of the Independence Heights Super Neighborhood. In Houston, a “super neighborhood” is a geo-graphically defined area where residents, civic organizations, institutions and businesses work together to identify, plan, and set priorities to address the needs and concerns of their com-munity. The boundaries of each super neighbor-hood rely on major physical features such as bayous or freeways to group together contigu-ous communities that share common physical characteristics, identity or infrastructure. Inde-pendence Heights Super Neighborhood will hereinafter be referred to as “Independence Heights”. It is the intention of the Houston Department of Health and Human Services (HDHHS), in devel-oping health profiles such as this, to promote a better understanding by local residents, commu-nity-based organizations, community leaders, medical providers, and the public health commu-nity of the unique character and circumstances of our various communities, and to draw atten-tion to those matters that contribute to the great-est of health disparities among the citizens of our growing, culturally and ethnically diverse city. This profile also represents an effort on the part of HDHHS to provide a “baseline” of indicators of health in our communities, against which fu-ture trends in conditions can be measured and monitored, and appropriate public health ac-tions, taken. We hope that this health profile will support these efforts in Independence Heights and across the City of Houston.
Stephen L. Williams, M.Ed., M.P.A. Director Houston Department of Health and Human Services
Table of Contents
Community Resources………...................3The Super Neighborhood at a Glance..….4Major Causes of Death…………….…..….6 Years of Potential Life Lost…….….…..….7Maternal and Child Health.......…….….....8Births to Teen Mothers…….…….....…..…9Infant Mortality…………………….….......10Leading Causes of Hospitalization……...11Crime………………………...………….....12Tuberculosis……………………………….13Drowning and Submersions……....…..…13Food-related Illness……………………....13Environmental Health & Safety……….…14HIV/AIDS……………………………….….15Gonorrhea………………………………....16Syphilis……………………………………..17Chlamydia……………………………….…18Technical Notes…………………………...19
Community Health Profiles 1999-2003
The Health of Independence Heights Super Neighborhood 3
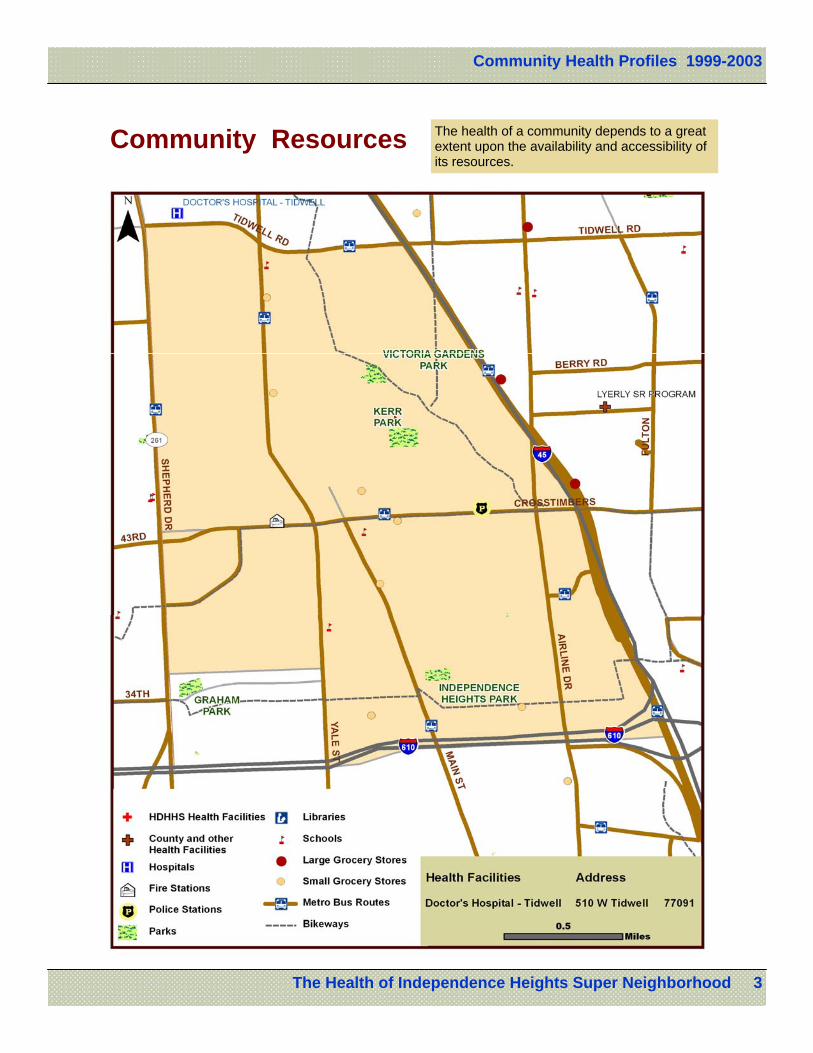
Community Resources The health of a community depends to a great extent upon the availability and accessibility of its resources.
Community Health Profiles 1999-2003
4 The Health of Independence Heights Super Neighborhood
* Data Source: U.S. Census 2000. Total population was calculated from census block-level data using Summary File 1. For pur-poses of describing demographics using Summary File 3, the super neighborhood is defined by the following census geographies: Tracts 5303 through 5306.
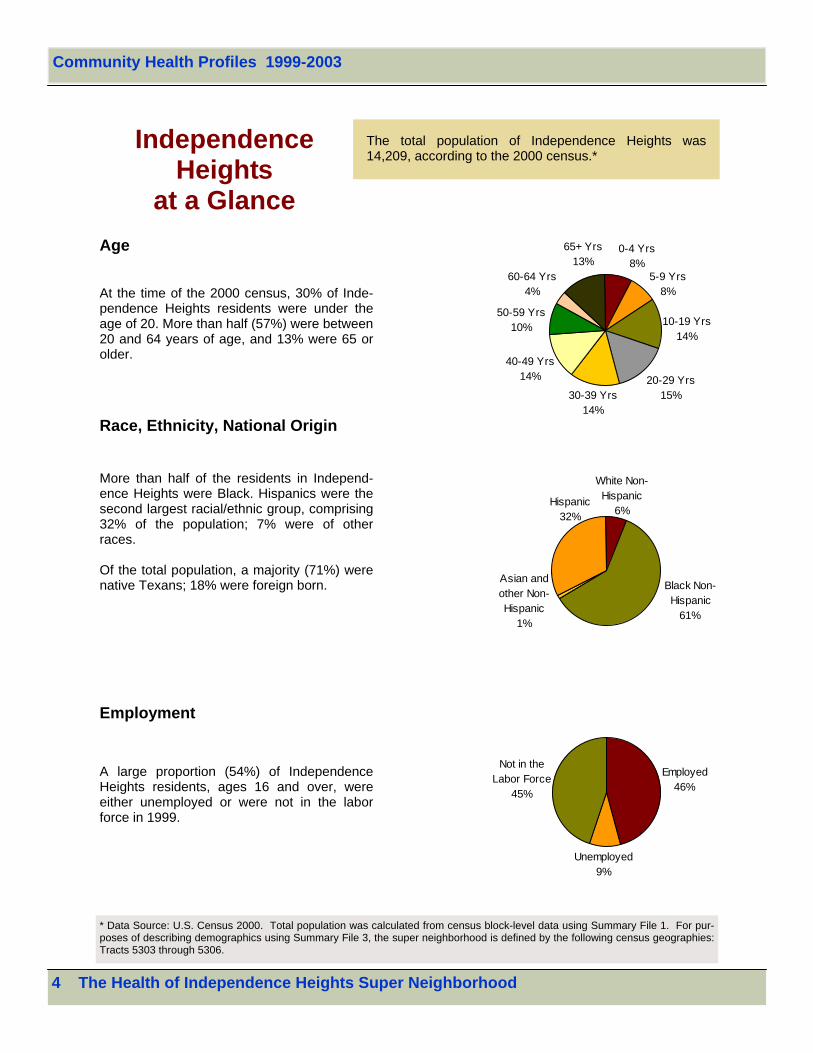
The total population of Independence Heights was 14,209, according to the 2000 census.*
Age
Employment
At the time of the 2000 census, 30% of Inde-pendence Heights residents were under the age of 20. More than half (57%) were between 20 and 64 years of age, and 13% were 65 or older.
A large proportion (54%) of Independence Heights residents, ages 16 and over, were either unemployed or were not in the labor force in 1999.
Race, Ethnicity, National Origin
More than half of the residents in Independ-ence Heights were Black. Hispanics were the second largest racial/ethnic group, comprising 32% of the population; 7% were of other races. Of the total population, a majority (71%) were native Texans; 18% were foreign born.
Independence Heights
at a Glance
Employed46%
Unemployed9%
Not in the Labor Force
45%
White Non-Hispanic
6%
Black Non-Hispanic
61%
Hispanic32%
Asian and other Non-Hispanic
1%
20-29 Yrs15%
40-49 Yrs14%
60-64 Yrs4%
10-19 Yrs14%
50-59 Yrs10%
30-39 Yrs14%
65+ Yrs13%
5-9 Yrs8%
0-4 Yrs8%
Community Health Profiles 1999-2003
The Health of Independence Heights Super Neighborhood 5
Data Source: U.S. Census 2000, Summary File 3
Poverty
Population Stability
Education
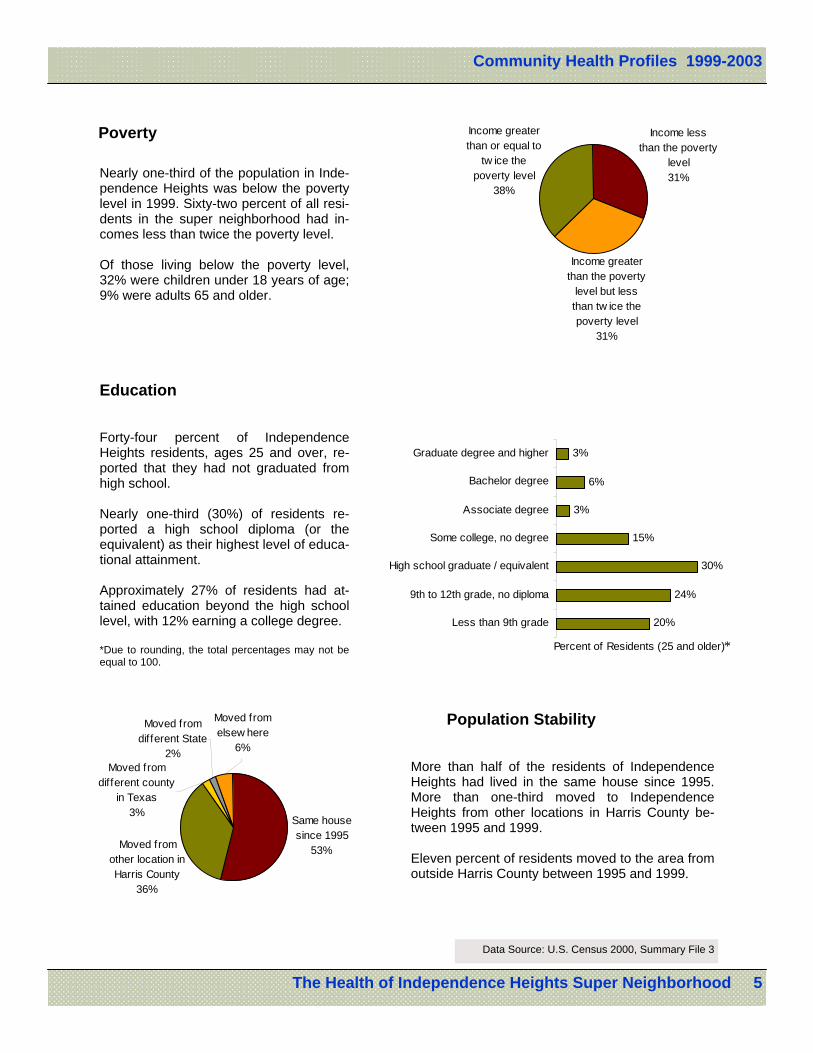
Nearly one-third of the population in Inde-pendence Heights was below the poverty level in 1999. Sixty-two percent of all resi-dents in the super neighborhood had in-comes less than twice the poverty level. Of those living below the poverty level, 32% were children under 18 years of age; 9% were adults 65 and older.
Forty-four percent of Independence Heights residents, ages 25 and over, re-ported that they had not graduated from high school. Nearly one-third (30%) of residents re-ported a high school diploma (or the equivalent) as their highest level of educa-tional attainment. Approximately 27% of residents had at-tained education beyond the high school level, with 12% earning a college degree. *Due to rounding, the total percentages may not be equal to 100.
More than half of the residents of Independence Heights had lived in the same house since 1995. More than one-third moved to Independence Heights from other locations in Harris County be-tween 1995 and 1999. Eleven percent of residents moved to the area from outside Harris County between 1995 and 1999.
Income greater than or equal to
tw ice the poverty level
38%
Income less than the poverty
level31%
Income greater than the poverty
level but less than tw ice the poverty level
31%
Same house since 1995
53%Moved from other location in Harris County
36%
Moved from different county
in Texas3%
Moved from elsew here
6%
Moved from different State
2%
20%
24%
30%
15%
3%
6%
3%
Less than 9th grade
9th to 12th grade, no diploma
High school graduate / equivalent
Some college, no degree
Associate degree
Bachelor degree
Graduate degree and higher
Percent of Residents (25 and older)*
Community Health Profiles 1999-2003
6 The Health of Independence Heights Super Neighborhood
Data Sources: Texas Department of State Health Services, Vital Statistics; US Census, 2000
*Age-adjusted mortality rates: annual average deaths per 100,000 population; census 2000 populations as the denominators; age-adjusted to the 2000 US Standard Million; deaths with known age and disease information. - - Numbers of deaths were too small for rate calculation.
Major Causes of Death
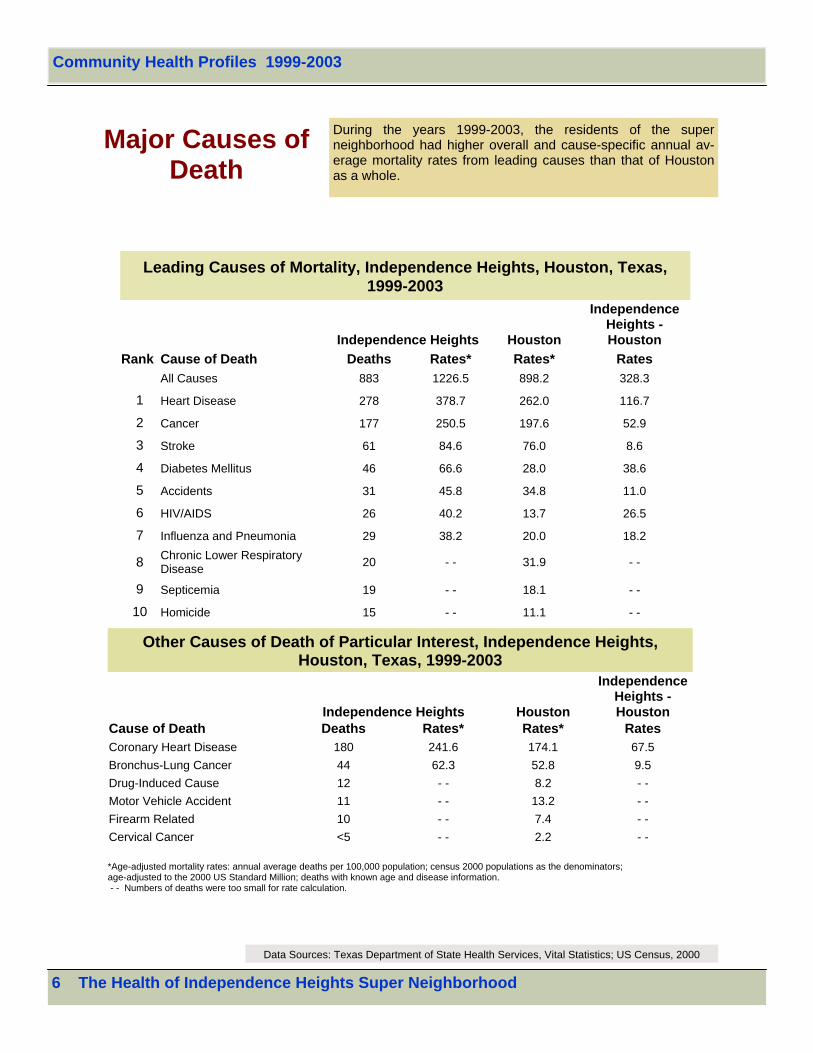
During the years 1999-2003, the residents of the super neighborhood had higher overall and cause-specific annual av-erage mortality rates from leading causes than that of Houston as a whole.
Leading Causes of Mortality, Independence Heights, Houston, Texas, 1999-2003
Independence Heights Houston
Independence Heights - Houston
Rank Cause of Death Deaths Rates* Rates* Rates All Causes 883 1226.5 898.2 328.3
1 Heart Disease 278 378.7 262.0 116.7
2 Cancer 177 250.5 197.6 52.9
3 Stroke 61 84.6 76.0 8.6
4 Diabetes Mellitus 46 66.6 28.0 38.6
5 Accidents 31 45.8 34.8 11.0
6 HIV/AIDS 26 40.2 13.7 26.5
7 Influenza and Pneumonia 29 38.2 20.0 18.2
8 Chronic Lower Respiratory Disease 20 - - 31.9 - -
9 Septicemia 19 - - 18.1 - -
10 Homicide 15 - - 11.1 - -
Other Causes of Death of Particular Interest, Independence Heights, Houston, Texas, 1999-2003
Independence Heights Houston
Independence Heights - Houston
Coronary Heart Disease 180 241.6 174.1 67.5 Bronchus-Lung Cancer 44 62.3 52.8 9.5 Drug-Induced Cause 12 - - 8.2 - - Motor Vehicle Accident 11 - - 13.2 - - Firearm Related 10 - - 7.4 - - Cervical Cancer <5 - - 2.2 - -
Cause of Death Deaths Rates* Rates* Rates
Community Health Profiles 1999-2003
The Health of Independence Heights Super Neighborhood 7
§ Ranked by Male YPLL Rate Note: Annual average YPLL rates might be unstable due to small number of premature deaths.
Years of Potential Life Lost (YPLL)
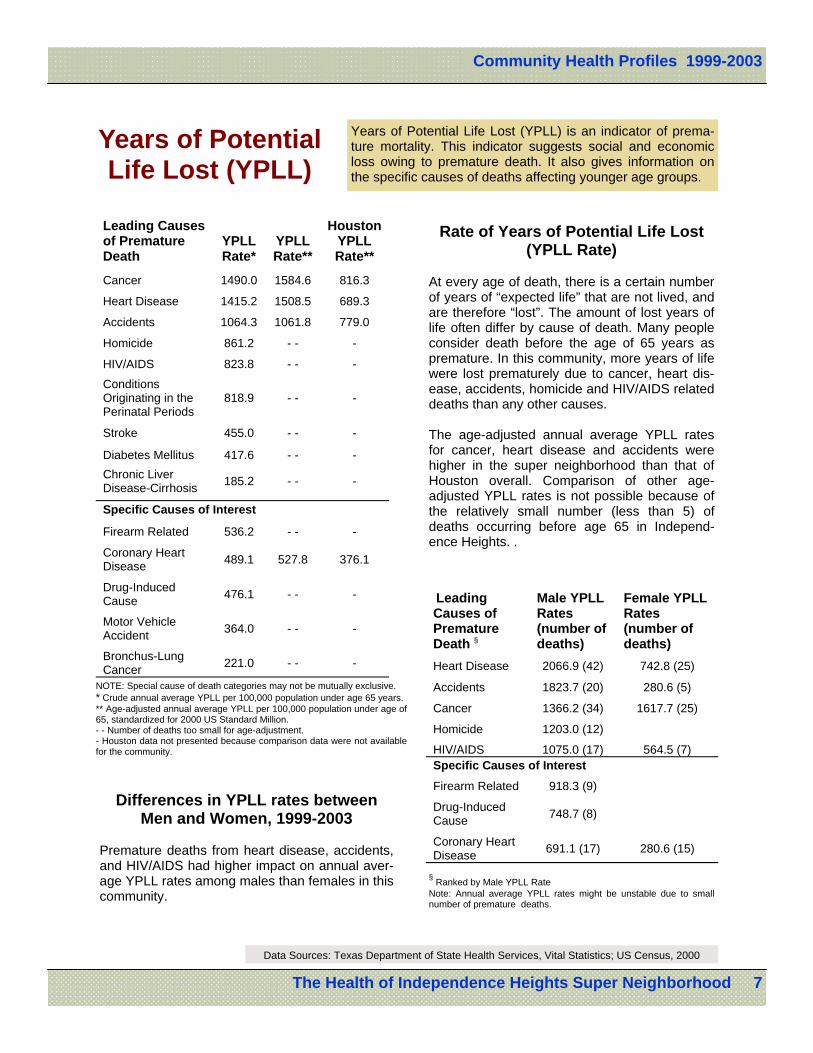
Years of Potential Life Lost (YPLL) is an indicator of prema-ture mortality. This indicator suggests social and economic loss owing to premature death. It also gives information on the specific causes of deaths affecting younger age groups.
Data Sources: Texas Department of State Health Services, Vital Statistics; US Census, 2000
NOTE: Special cause of death categories may not be mutually exclusive. * Crude annual average YPLL per 100,000 population under age 65 years. ** Age-adjusted annual average YPLL per 100,000 population under age of 65, standardized for 2000 US Standard Million. - - Number of deaths too small for age-adjustment. - Houston data not presented because comparison data were not available for the community.
Leading Causes of Premature Death §
Male YPLL Rates(number of deaths)
Female YPLL Rates(number of deaths)
Heart Disease 2066.9 (42) 742.8 (25)
Accidents 1823.7 (20) 280.6 (5)
Cancer 1366.2 (34) 1617.7 (25)
Homicide 1203.0 (12)
HIV/AIDS 1075.0 (17) 564.5 (7) Specific Causes of Interest
Firearm Related 918.3 (9)
Drug-Induced Cause 748.7 (8)
Coronary Heart Disease 691.1 (17) 280.6 (15)
Leading Causes of Premature Death
YPLL Rate*
YPLL Rate**
Houston YPLL Rate**
Cancer 1490.0 1584.6 816.3
Heart Disease 1415.2 1508.5 689.3
Accidents 1064.3 1061.8 779.0
Homicide 861.2 - - -
HIV/AIDS 823.8 - - -
Conditions Originating in the Perinatal Periods
818.9 - - -
Stroke 455.0 - - -
Diabetes Mellitus 417.6 - - - Chronic Liver Disease-Cirrhosis 185.2 - - -
Specific Causes of Interest
Firearm Related 536.2 - - -
Coronary Heart Disease 489.1 527.8 376.1
Drug-Induced Cause 476.1 - - -
Motor Vehicle Accident 364.0 - - -
Bronchus-Lung Cancer 221.0 - - -
Rate of Years of Potential Life Lost (YPLL Rate)
At every age of death, there is a certain number of years of “expected life” that are not lived, and are therefore “lost”. The amount of lost years of life often differ by cause of death. Many people consider death before the age of 65 years as premature. In this community, more years of life were lost prematurely due to cancer, heart dis-ease, accidents, homicide and HIV/AIDS related deaths than any other causes. The age-adjusted annual average YPLL rates for cancer, heart disease and accidents were higher in the super neighborhood than that of Houston overall. Comparison of other age-adjusted YPLL rates is not possible because of the relatively small number (less than 5) of deaths occurring before age 65 in Independ-ence Heights. .
Differences in YPLL rates between Men and Women, 1999-2003
Premature deaths from heart disease, accidents, and HIV/AIDS had higher impact on annual aver-age YPLL rates among males than females in this community.
Community Health Profiles 1999-2003
8 The Health of Independence Heights Super Neighborhood
Maternal and Child Health
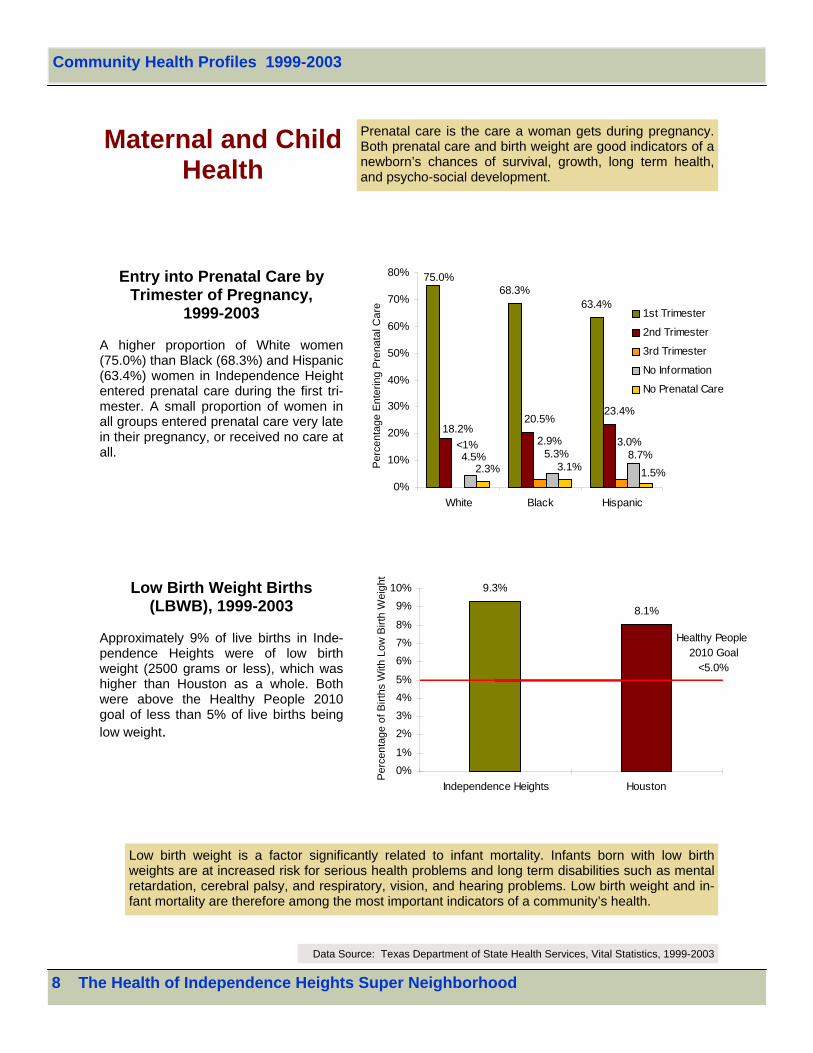
Prenatal care is the care a woman gets during pregnancy. Both prenatal care and birth weight are good indicators of a newborn’s chances of survival, growth, long term health, and psycho-social development.
Data Source: Texas Department of State Health Services, Vital Statistics, 1999-2003
Low birth weight is a factor significantly related to infant mortality. Infants born with low birth weights are at increased risk for serious health problems and long term disabilities such as mental retardation, cerebral palsy, and respiratory, vision, and hearing problems. Low birth weight and in-fant mortality are therefore among the most important indicators of a community’s health.
Entry into Prenatal Care by Trimester of Pregnancy,
1999-2003 A higher proportion of White women (75.0%) than Black (68.3%) and Hispanic (63.4%) women in Independence Height entered prenatal care during the first tri-mester. A small proportion of women in all groups entered prenatal care very late in their pregnancy, or received no care at all.
Low Birth Weight Births (LBWB), 1999-2003
Approximately 9% of live births in Inde-pendence Heights were of low birth weight (2500 grams or less), which was higher than Houston as a whole. Both were above the Healthy People 2010 goal of less than 5% of live births being low weight.
68.3%63.4%
75.0%
23.4%20.5%
18.2%3.0%<1% 2.9%
8.7%5.3%4.5%2.3% 3.1% 1.5%
0%
10%
20%
30%
40%
50%
60%
70%
80%
White Black Hispanic
1st Trimester
2nd Trimester
3rd Trimester
No Information
No Prenatal CareP
erce
ntag
e E
nter
ing
Pre
nata
l Car
e
9.3%
8.1%
0%1%
2%3%4%5%
6%7%8%
9%10%
Independence Heights Houston
Healthy People 2010 Goal
<5.0%
Per
cent
age
of B
irths
With
Low
Birt
h W
eigh
t
Community Health Profiles 1999-2003
The Health of Independence Heights Super Neighborhood 9
Births to Teen Mothers
Births to Teen Mothers
Data Sources: Texas Department of State Health Services, Vital Statistics; US Census 2000
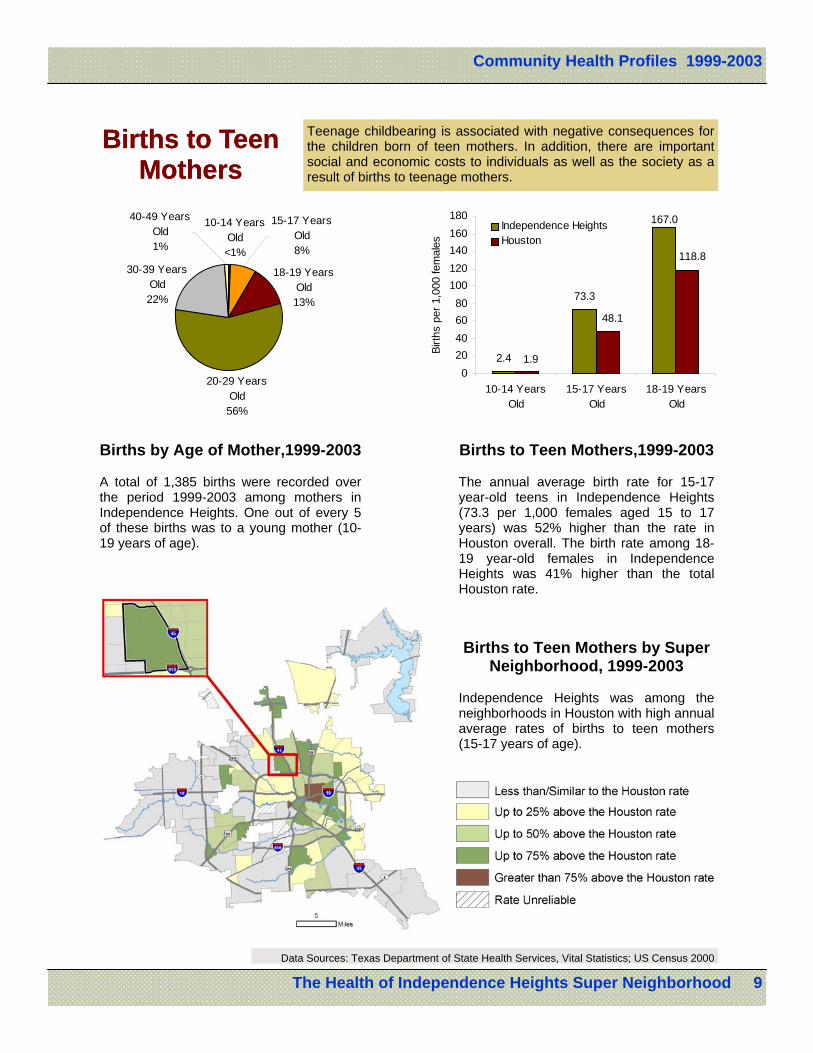
Teenage childbearing is associated with negative consequences for the children born of teen mothers. In addition, there are important social and economic costs to individuals as well as the society as a result of births to teenage mothers.
Births by Age of Mother,1999-2003
A total of 1,385 births were recorded over the period 1999-2003 among mothers in Independence Heights. One out of every 5 of these births was to a young mother (10-19 years of age).
Births to Teen Mothers,1999-2003 The annual average birth rate for 15-17 year-old teens in Independence Heights (73.3 per 1,000 females aged 15 to 17 years) was 52% higher than the rate in Houston overall. The birth rate among 18-19 year-old females in Independence Heights was 41% higher than the total Houston rate.
Births to Teen Mothers by Super Neighborhood, 1999-2003
Independence Heights was among the neighborhoods in Houston with high annual average rates of births to teen mothers (15-17 years of age).
2.4
73.3
167.0
1.9
48.1
118.8
020406080
100120140160180
10-14 YearsOld
15-17 YearsOld
18-19 YearsOld
Birth
s pe
r 1,0
00 fe
mal
es
Independence HeightsHouston
20-29 Years Old56%
40-49 Years Old1%
18-19 Years Old13%
30-39 Years Old22%
15-17 Years Old8%
10-14 Years Old<1%
Community Health Profiles 1999-2003
10 The Health of Independence Heights Super Neighborhood
Infant Mortality Infant Mortality Infant mortality is the death of infants in the first year of life. Infant mortality rate (IMR) is one of the most important indicators of the health of a community. The Healthy People 2010 goal is to eliminate disparities in infant mortality among racial and ethnic groups. The targeted groups are African American, American Indian, Alaskan Na-tive and Puerto Rican populations.
Infant Mortality Infant Mortality
Data Source: Texas Department of State Health Services, Vital Statistics
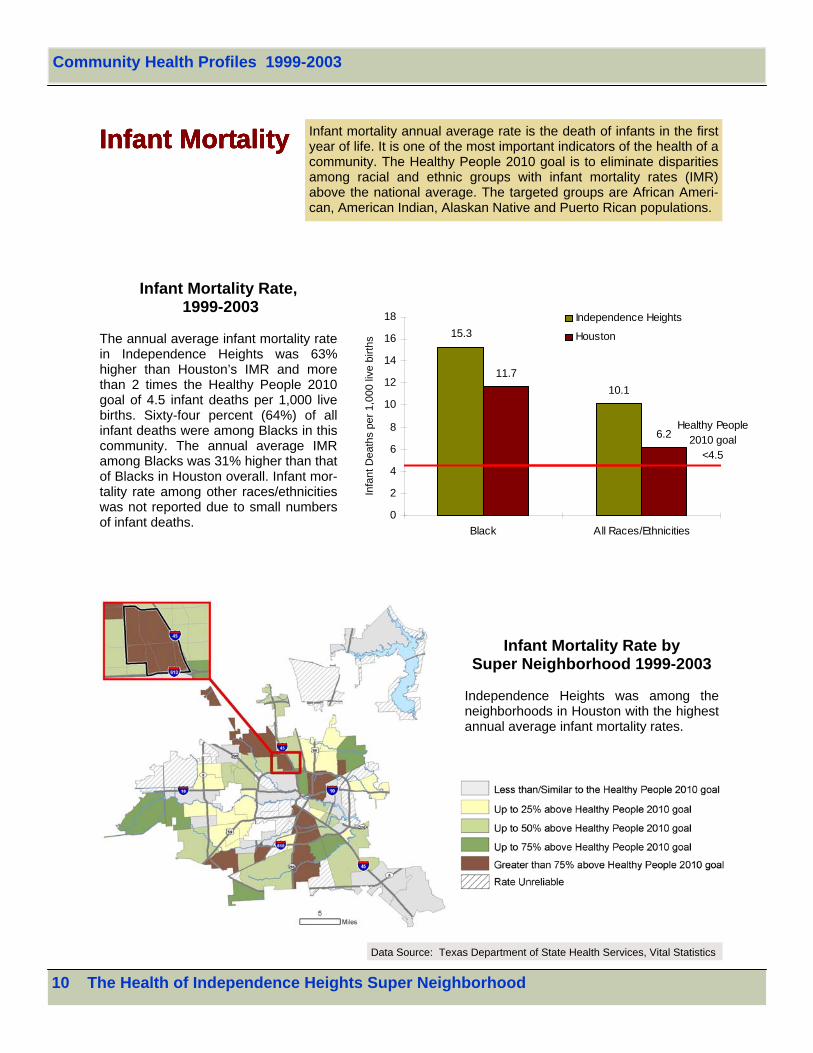
Infant mortality annual average rate is the death of infants in the first year of life. It is one of the most important indicators of the health of a community. The Healthy People 2010 goal is to eliminate disparities among racial and ethnic groups with infant mortality rates (IMR) above the national average. The targeted groups are African Ameri-can, American Indian, Alaskan Native and Puerto Rican populations.
Infant Mortality Rate, 1999-2003
The annual average infant mortality rate in Independence Heights was 63% higher than Houston’s IMR and more than 2 times the Healthy People 2010 goal of 4.5 infant deaths per 1,000 live births. Sixty-four percent (64%) of all infant deaths were among Blacks in this community. The annual average IMR among Blacks was 31% higher than that of Blacks in Houston overall. Infant mor-tality rate among other races/ethnicities was not reported due to small numbers of infant deaths.
Infant Mortality Rate by Super Neighborhood 1999-2003
Independence Heights was among the neighborhoods in Houston with the highest annual average infant mortality rates.
Healthy People 2010 goal
<4.5
15.3
10.111.7
6.2
0
2
4
6
8
10
12
14
16
18
Black All Races/Ethnicities
Independence Heights
Houston
Infa
nt D
eath
s pe
r 1,0
00 li
ve b
irths
Community Health Profiles 1999-2003
The Health of Independence Heights Super Neighborhood 11
Leading Causes of Hospitalization
Data Source: Texas Department of State Health Services, Texas Health Care Information Collection
Principal Diagnosis, Multiple Level Clinical Classification of ICD 9 Counts
Diseases of the circulatory system 1748 Diseases of the heart 1107 Cerebrovascular disease 301
Hypertension 188 Complications of pregnancy; childbirth; and the puerperium 1109 Complications mainly related to pregnancy 327
Indications for care in pregnancy; labor; and delivery 236
Complications during labor 212 Certain conditions originating in the perinatal period 1006 Liveborn 963
Other perinatal conditions 20
Short gestation; low birth weight; and fetal growth retardation 14
Diseases of the respiratory system 823 Respiratory infections 408
Chronic obstructive pulmonary disease and bronchiectasis 157
Asthma 98
Diseases of the digestive system 680 Lower gastrointestinal disorders 202
Upper gastrointestinal disorders 113
Biliary tract disease 89
Injury and poisoning 609 Complications 303
Fractures 152 Open wounds 39
Neoplasms 440 Benign neoplasms 114
Secondary malignancies 57
Colorectal cancer 43
1
2
3
4
5
6
7
8 Mental disorders 429
Schizophrenia and related disorders 175
Affective disorders 127
Other psychoses 46 9 Symptoms; signs; and ill-defined
conditions and factors influencing health status 391
Factors influencing health care 243
Symptoms; signs; and ill-defined conditions 148
10 Diseases of the genitourinary system 385
Diseases of the urinary system 260
Diseases of female genital organs 102
Diseases of male genital organs 23
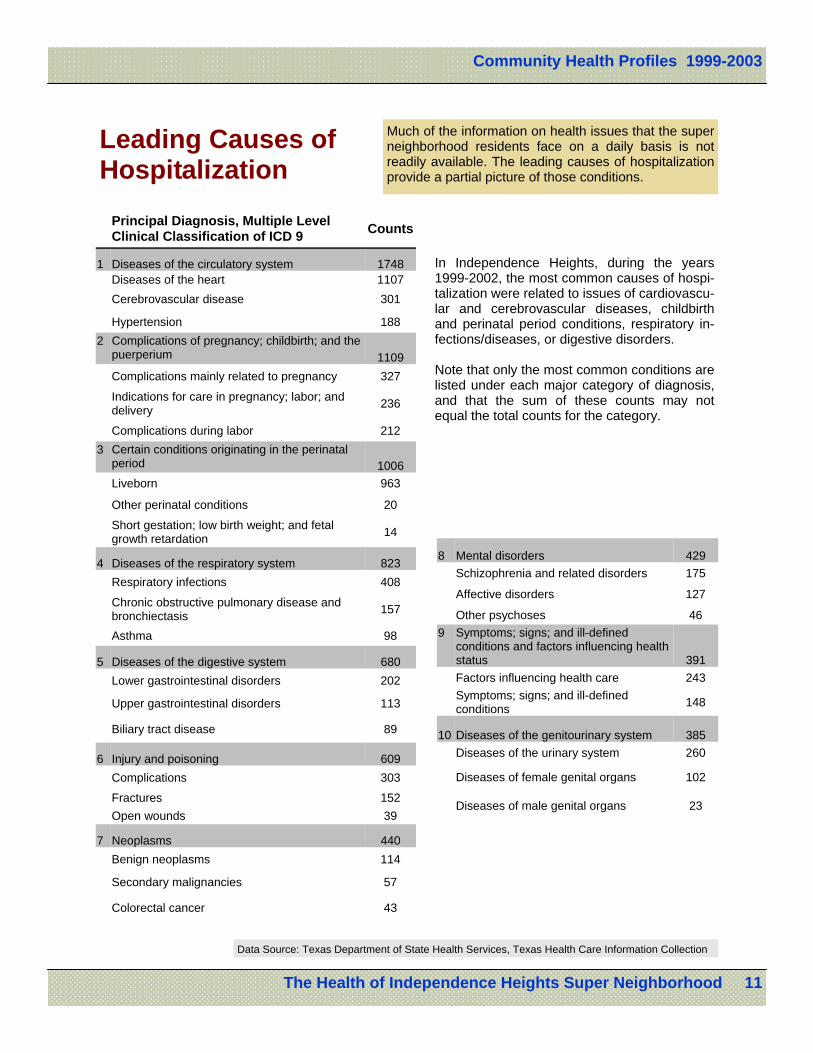
In Independence Heights, during the years 1999-2002, the most common causes of hospi-talization were related to issues of cardiovascu-lar and cerebrovascular diseases, childbirth and perinatal period conditions, respiratory in-fections/diseases, or digestive disorders. Note that only the most common conditions are listed under each major category of diagnosis, and that the sum of these counts may not equal the total counts for the category.
Much of the information on health issues that the super neighborhood residents face on a daily basis is not readily available. The leading causes of hospitalization provide a partial picture of those conditions.
Community Health Profiles 1999-2003
12 The Health of Independence Heights Super Neighborhood
Crime The crime rate in urban areas is of concern to the residents, law enforcement and the local government. Crimes place stress on the residents of neighbor-hoods and affect their well-being. Of particular concern are violent crimes that threaten residents’ lives, such as those involving firearms.
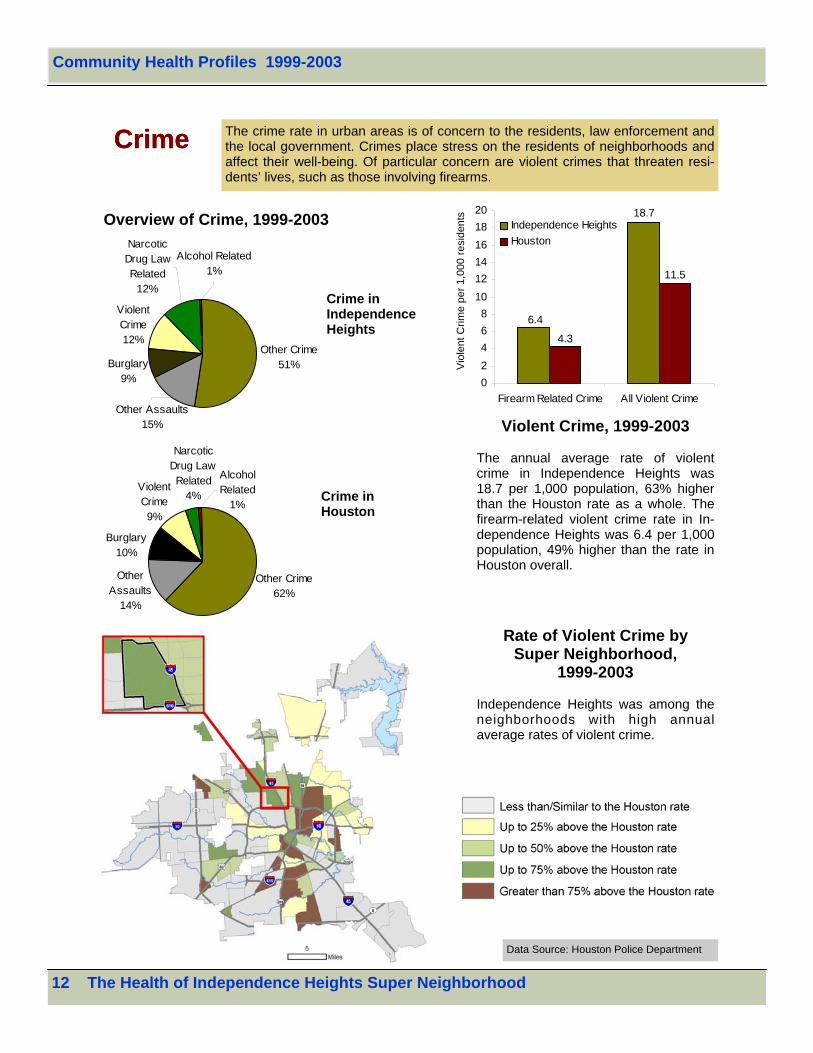
Crime The crime rate in urban areas is of concern to the residents, law enforcement and the local government. Crimes place stress on the residents of neighborhoods and affect their well-being. Of particular concern are violent crimes that threaten resi-dents’ lives, such as those involving firearms.
Data Source: Houston Police Department
Overview of Crime, 1999-2003
Rate of Violent Crime by Super Neighborhood,
1999-2003
Independence Heights was among the neighborhoods with high annual average rates of violent crime.
Crime in Houston
Violent Crime, 1999-2003
The annual average rate of violent crime in Independence Heights was 18.7 per 1,000 population, 63% higher than the Houston rate as a whole. The firearm-related violent crime rate in In-dependence Heights was 6.4 per 1,000 population, 49% higher than the rate in Houston overall.
Crime in Independence Heights
Other Crime62%
Other Assaults
14%
Burglary10%
Violent Crime9%
Alcohol Related
1%
Narcotic Drug Law Related
4%
Other Crime51%
Alcohol Related1%
Narcotic Drug Law
Related12%
ViolentCrime12%
Burglary9%
Other Assaults15%
6.4
18.7
4.3
11.5
02468
101214161820
Firearm Related Crime All Violent Crime
Independence HeightsHouston
Vio
lent
Crim
e pe
r 1,0
00 re
side
nts
Community Health Profiles 1999-2003
The Health of Independence Heights Super Neighborhood 13
Food-borne Diseases
Tuberculosis
Data Source: HDHHS, Bureau of TB Control
Data Source: HDHHS, Bureau of Epidemiology
Typically Reported Diseases
Number of Cases
Hepatitis A 7
Shigellosis 6
Salmonellosis 9
Campylobacteriosis <5
Data Source: HDHHS, Bureau of Epidemiology
Drowning and Submersion
From 1999 to 2003, 14 newly-acquired cases of tuberculosis were identified among residents of Inde-pendence Heights, representing 1% of all cases diagnosed in Houston in that period. The annual aver-age rate in Independence Heights was 19.7 per 100,000 population, compared to 13.6 per 100,000 population in Houston as a whole. Both rates appeared much higher than the national Healthy People 2010 target of 1 case per 100,000 population. The majority (57%) of these cases were among Black adults between 20 to 64 years of age.
Tuberculosis (TB) is caused by a specific type of bacteria that spreads from person to person through the air. TB typically affects the lungs but can also affect the brain and other organs. If this disease is left un-treated it can be fatal.
Drowning and submersion injuries are often unintentional and are preventable through increased awareness of precautions that can be taken in and around bodies of water.
Many food-related diseases are easily preventable. Eating well-cooked foods, keeping cooking areas free of contamination by thoroughly cleaning surfaces touched by raw meats and poultry, hand washing before handling food, and avoiding unpasteurized products are some of the measures that people can take to lower their risk of food-related disease.
Food-related diseases are typically under-reported. It is likely that many more cases occurred from 1999 to 2003 than were actually reported to health officials.
Fewer than 5 drowning or submersion cases were reported among Independence Heights residents from 1999-2003.
Community Health Profiles 1999-2003
14 The Health of Independence Heights Super Neighborhood
Data Sources: Environmental Protection Agency; Texas Commission on Environmental Quality
Environmental Health and Safety
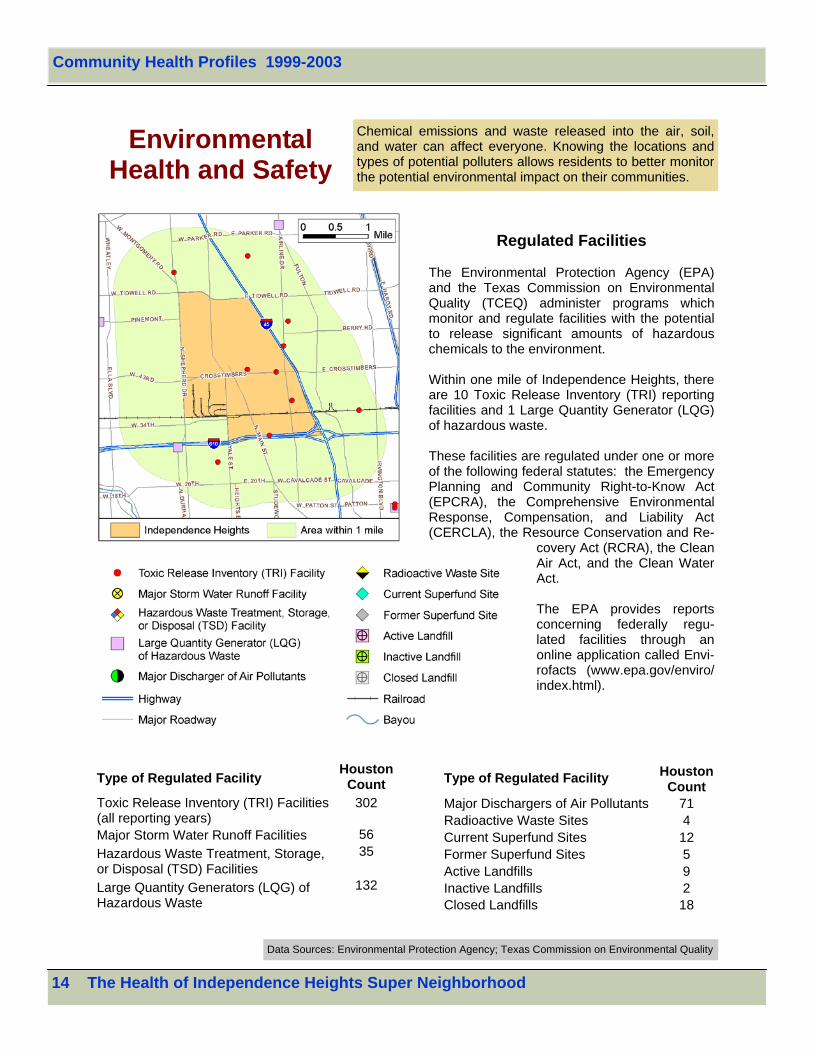
Chemical emissions and waste released into the air, soil, and water can affect everyone. Knowing the locations and types of potential polluters allows residents to better monitor the potential environmental impact on their communities.
Regulated Facilities The Environmental Protection Agency (EPA) and the Texas Commission on Environmental Quality (TCEQ) administer programs which monitor and regulate facilities with the potential to release significant amounts of hazardous chemicals to the environment. Within one mile of Independence Heights, there are 10 Toxic Release Inventory (TRI) reporting facilities and 1 Large Quantity Generator (LQG) of hazardous waste. These facilities are regulated under one or more of the following federal statutes: the Emergency Planning and Community Right-to-Know Act (EPCRA), the Comprehensive Environmental Response, Compensation, and Liability Act (CERCLA), the Resource Conservation and Re-
covery Act (RCRA), the Clean Air Act, and the Clean Water Act. The EPA provides reports concerning federally regu-lated facilities through an online application called Envi-rofacts (www.epa.gov/enviro/index.html).
Type of Regulated Facility Houston Count
Toxic Release Inventory (TRI) Facilities (all reporting years)
302
Major Storm Water Runoff Facilities 56 Hazardous Waste Treatment, Storage, or Disposal (TSD) Facilities
35
Large Quantity Generators (LQG) of Hazardous Waste
132
Type of Regulated Facility Houston Count
Radioactive Waste Sites 4 Current Superfund Sites 12 Former Superfund Sites 5 Active Landfills 9 Inactive Landfills 2 Closed Landfills 18
Major Dischargers of Air Pollutants 71
Community Health Profiles 1999-2003
The Health of Independence Heights Super Neighborhood 15
HIV/AIDS
Data Source: HDHHS, Bureau of Epidemiology * Annual average rates are calculated only for those zip codes that lie predominantly within the boundaries of the city of Houston.
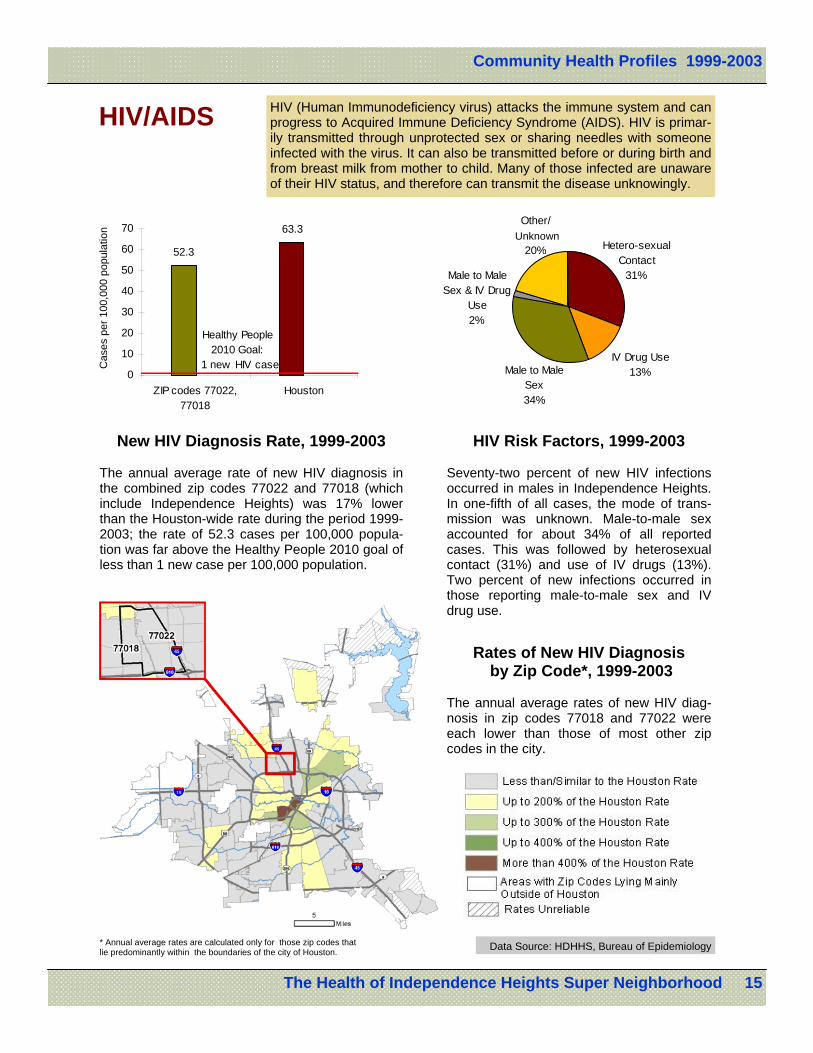
HIV (Human Immunodeficiency virus) attacks the immune system and can progress to Acquired Immune Deficiency Syndrome (AIDS). HIV is primar-ily transmitted through unprotected sex or sharing needles with someone infected with the virus. It can also be transmitted before or during birth and from breast milk from mother to child. Many of those infected are unaware of their HIV status, and therefore can transmit the disease unknowingly.
New HIV Diagnosis Rate, 1999-2003 The annual average rate of new HIV diagnosis in the combined zip codes 77022 and 77018 (which include Independence Heights) was 17% lower than the Houston-wide rate during the period 1999-2003; the rate of 52.3 cases per 100,000 popula-tion was far above the Healthy People 2010 goal of less than 1 new case per 100,000 population.
HIV Risk Factors, 1999-2003
Seventy-two percent of new HIV infections occurred in males in Independence Heights. In one-fifth of all cases, the mode of trans-mission was unknown. Male-to-male sex accounted for about 34% of all reported cases. This was followed by heterosexual contact (31%) and use of IV drugs (13%). Two percent of new infections occurred in those reporting male-to-male sex and IV drug use.
Rates of New HIV Diagnosis by Zip Code*, 1999-2003
The annual average rates of new HIV diag-nosis in zip codes 77018 and 77022 were each lower than those of most other zip codes in the city.
52.3
63.3
0
10
20
30
40
50
60
70
ZIP codes 77022,77018
Houston
Healthy People 2010 Goal:
1 new HIV caseCas
es p
er 1
00,0
00 p
opul
atio
n
IV Drug Use13%
Hetero-sexual Contact
31%Male to Male Sex & IV Drug
Use2%
Male to Male Sex34%
Other/ Unknow n
20% Unknown
Community Health Profiles 1999-2003
16 The Health of Independence Heights Super Neighborhood
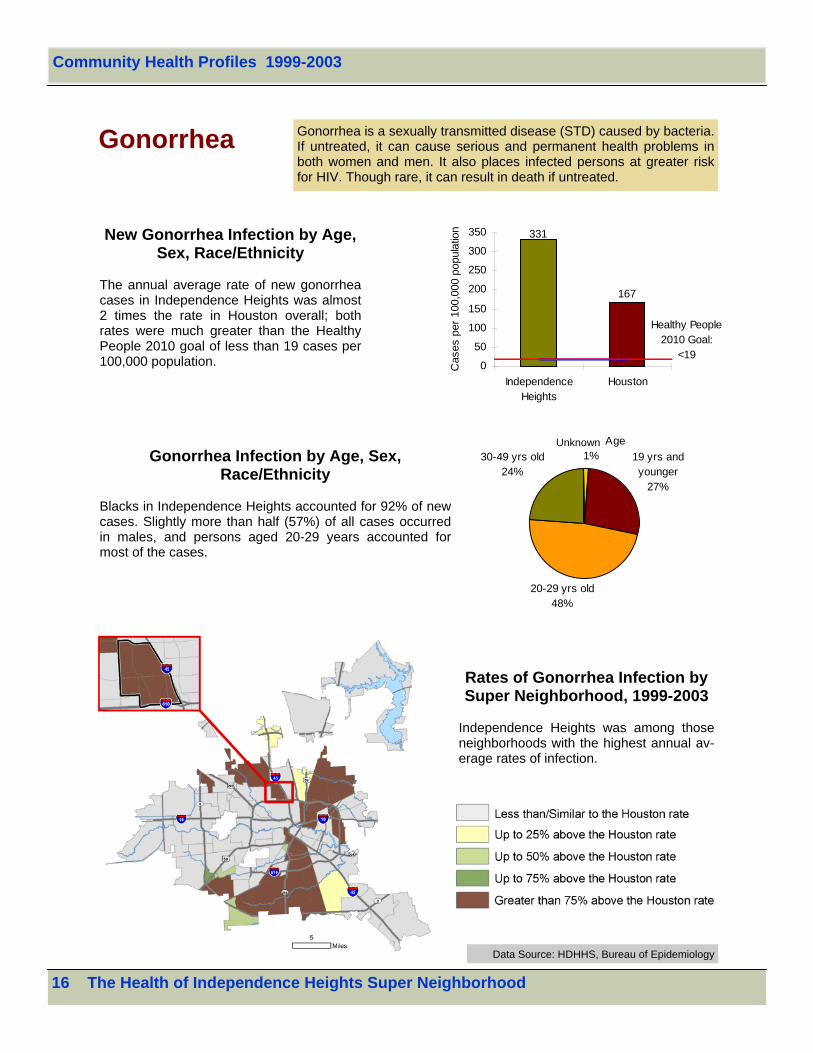
Gonorrhea Gonorrhea is a sexually transmitted disease (STD) caused by bacteria. If untreated, it can cause serious and permanent health problems in both women and men. It also places infected persons at greater risk for HIV. Though rare, it can result in death if untreated.
Data Source: HDHHS, Bureau of Epidemiology
New Gonorrhea Infection by Age, Sex, Race/Ethnicity
The annual average rate of new gonorrhea cases in Independence Heights was almost 2 times the rate in Houston overall; both rates were much greater than the Healthy People 2010 goal of less than 19 cases per 100,000 population.
Gonorrhea Infection by Age, Sex, Race/Ethnicity
Blacks in Independence Heights accounted for 92% of new cases. Slightly more than half (57%) of all cases occurred in males, and persons aged 20-29 years accounted for most of the cases.
Rates of Gonorrhea Infection by Super Neighborhood, 1999-2003
Independence Heights was among those neighborhoods with the highest annual av-erage rates of infection.
331
167
0
50
100
150
200
250
300
350
IndependenceHeights
Houston
Healthy People2010 Goal:
<19
Cas
es p
er 1
00,0
00 p
opul
atio
n19 yrs and younger
27%
20-29 yrs old48%
30-49 yrs old24%
Unknow n Age1%
Unknown
Community Health Profiles 1999-2003
The Health of Independence Heights Super Neighborhood 17
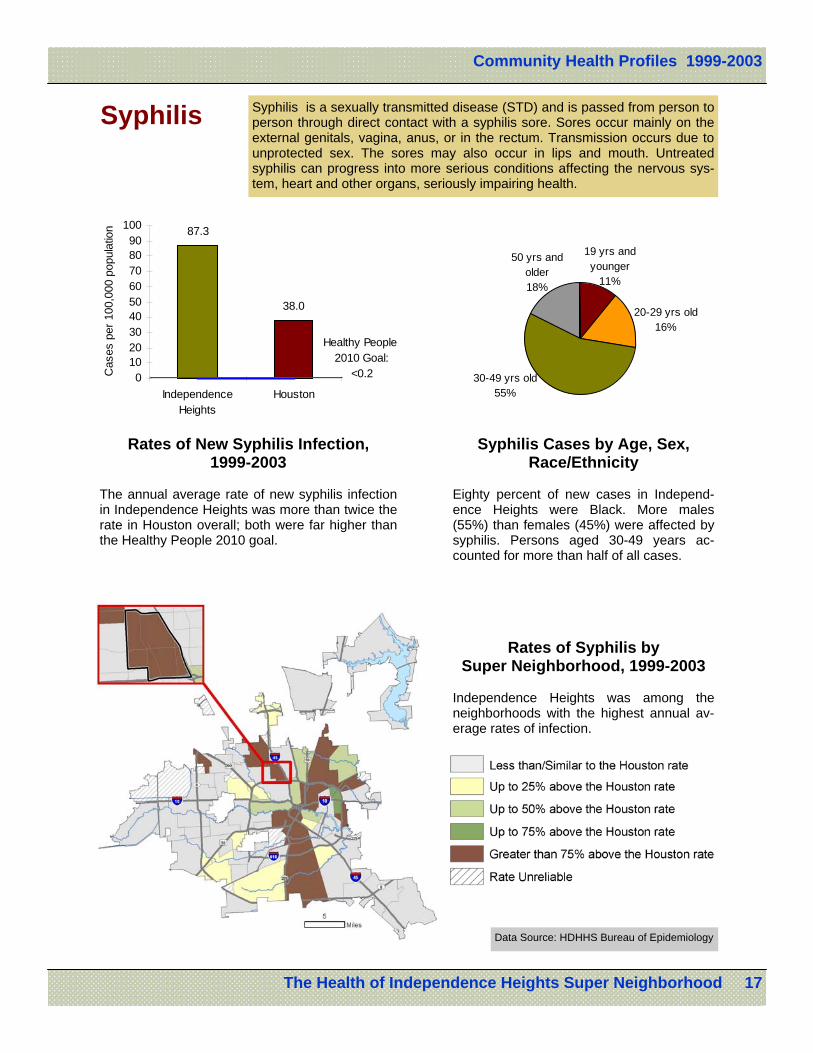
Syphilis Syphilis is a sexually transmitted disease (STD) and is passed from person to person through direct contact with a syphilis sore. Sores occur mainly on the external genitals, vagina, anus, or in the rectum. Transmission occurs due to unprotected sex. The sores may also occur in lips and mouth. Untreated syphilis can progress into more serious conditions affecting the nervous sys-tem, heart and other organs, seriously impairing health.
Data Source: HDHHS Bureau of Epidemiology
Rates of New Syphilis Infection, 1999-2003
The annual average rate of new syphilis infection in Independence Heights was more than twice the rate in Houston overall; both were far higher than the Healthy People 2010 goal.
Syphilis Cases by Age, Sex, Race/Ethnicity
Eighty percent of new cases in Independ-ence Heights were Black. More males (55%) than females (45%) were affected by syphilis. Persons aged 30-49 years ac-counted for more than half of all cases.
Rates of Syphilis by Super Neighborhood, 1999-2003
Independence Heights was among the neighborhoods with the highest annual av-erage rates of infection.
19 yrs and younger
11%
20-29 yrs old16%
30-49 yrs old55%
50 yrs and older18%
87.3
38.0
0102030405060708090
100
IndependenceHeights
Houston
Healthy People 2010 Goal:
<0.2Cas
es p
er 1
00,0
00 p
opul
atio
n
Community Health Profiles 1999-2003
18 The Health of Independence Heights Super Neighborhood
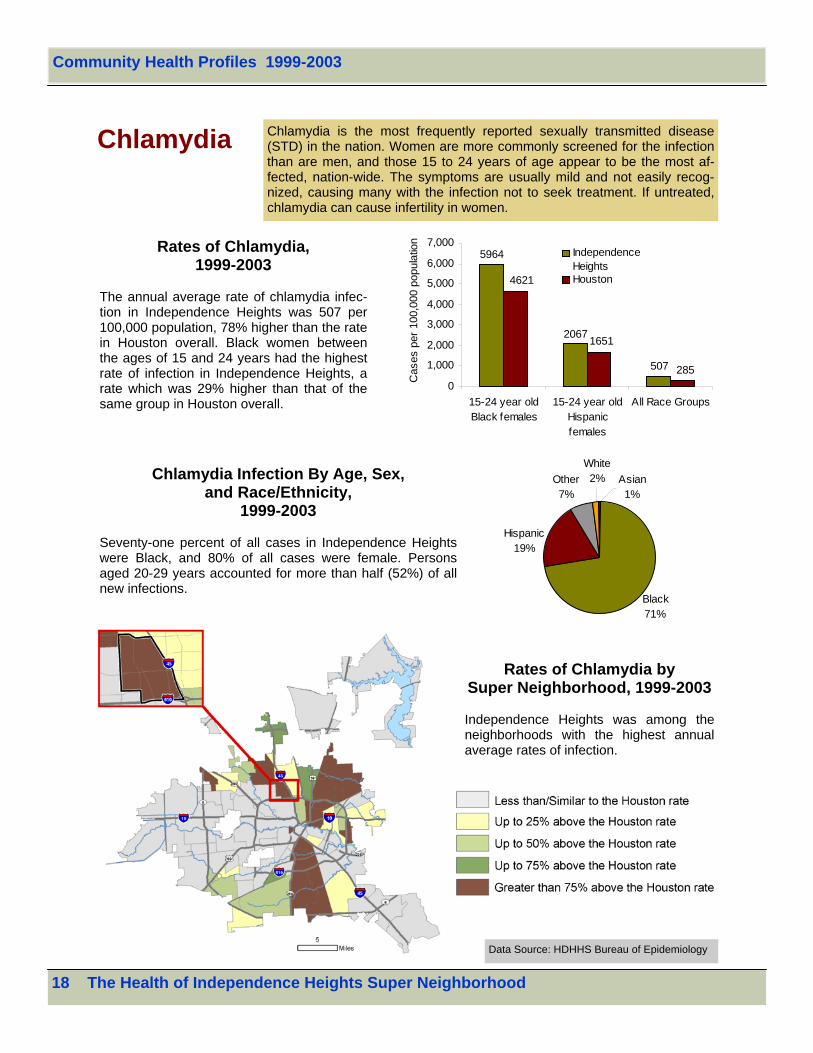
Chlamydia Chlamydia is the most frequently reported sexually transmitted disease (STD) in the nation. Women are more commonly screened for the infection than are men, and those 15 to 24 years of age appear to be the most af-fected, nation-wide. The symptoms are usually mild and not easily recog-nized, causing many with the infection not to seek treatment. If untreated, chlamydia can cause infertility in women.
Data Source: HDHHS Bureau of Epidemiology
Rates of Chlamydia, 1999-2003
The annual average rate of chlamydia infec-tion in Independence Heights was 507 per 100,000 population, 78% higher than the rate in Houston overall. Black women between the ages of 15 and 24 years had the highest rate of infection in Independence Heights, a rate which was 29% higher than that of the same group in Houston overall.
Chlamydia Infection By Age, Sex, and Race/Ethnicity,
1999-2003
Seventy-one percent of all cases in Independence Heights were Black, and 80% of all cases were female. Persons aged 20-29 years accounted for more than half (52%) of all new infections.
Rates of Chlamydia by Super Neighborhood, 1999-2003 Independence Heights was among the neighborhoods with the highest annual average rates of infection.
507
2067
5964
285
1651
4621
0
1,000
2,000
3,000
4,000
5,000
6,000
7,000
15-24 year oldBlack females
15-24 year oldHispanicfemales
All Race GroupsC
ases
per
100
,000
pop
ulat
ion
IndependenceHeightsHouston
Black71%
Hispanic19%
Asian1%
White2%Other
7%
Community Health Profiles 1999-2003
The Health of Independence Heights Super Neighborhood 19
Community Health Profiles Community-specific public health profiles on medically-underserved areas and the 88 super neighborhoods of Houston are available from the Houston Department of Health and Human Services at www.houstontx.gov/health. Re-ports can also be requested by e-mail at [email protected], or by writing to: Community Health Statistics Office of Surveillance & Public Health Preparedness Houston Department of Health and Human Services 8000 N. Stadium Dr., 4th floor Houston, Texas 77054
City of Houston Department of Health and Human Services
Stephen L. Williams, M.Ed., M.P.A. Director
Community Health Profiles
Produced by Community Health Statistics Office of Surveillance and Public Health Preparedness
Raouf Arafat, M.D., M.P.H. Assistant Director Mark Perry, M.P.H. Editor
Technical Notes The Community Health Profiles Project attempts to provide the most recent statistical information avail-able on the health of communities. The 1999-2003 series represents a “baseline” against which changes in the health indicators of communities can be evaluated over time. Data used to compile this profile are derived from a variety of sources — local, state, and national. These data sources may collect informa-tion on different cycles and therefore gaps in available years of data may be observed within a single profile. Except where noted otherwise, rates are calculated using 2000 census data for each community, includ-ing age, race, and sex distributions. Agreement between race/ethnicity classifications in the data used in this report and those derived from the census is imperfect; disease registries do not uniformly capture ethnicity along with race and categories of “Black”, “White,” “Asian,” and “Other” may overlap with “Hispanic” ethnicity. Despite potential overlap, in this profile, “Black” is meant as “non-Hispanic Black,” “White” as “non-Hispanic White,” and “Hispanic” as being persons of any race and of Hispanic/Latino culture and origin. The profiles group a range of years of data and present them, where most appropri-ate, as annual average incidence of the indicator. If the total number of events is less than five, the as-sociated rate is considered unreliable and is not reported; however for Leading Causes of Death, the minimum number of deaths for reporting age-adjusted rates is set at 25. Statistics presented in profiles of super neighborhoods, medically-underserved areas (MUAs), and other geographies are based upon successful geocoding of the residence of individual cases within the boundaries of those geographic entities. The denominator in all cases is the year 2000 census, as the estimated “average” population for each year of the analysis period. Background Houston rates and Healthy People 2010 goals have been used for most indicators as a standard for comparison. Mortality data: Mortality data have been obtained at the address level from the Texas Department of State Health Services for 1999-2003. The YPLL statistics are computed using 65 years of age as the end point. Crime data: Data for 1999-2003 have been acquired from the Houston Police Department at the address level of the site of the incident. HIV/AIDS data: As of this report, data were only available at the zip code level. Other notes Data for a number of additional indicators considered important for a community’s assessment of its health and health planning efforts were not available at the time of printing of this document. These indi-cators, including various injury indicators, and more community-specific behavioral data are being col-lected or researched for potential inclusion in the future published version of this report.
About Community Health Statistics (CHS)
Community Health Statistics (CHS) is a program within the divi-sion of the Office of Surveillance and Public Health Preparedness of the Houston Department of Health and Human Services (HDHHS). It is comprised of epidemiologists, statisticians, and GIS analysts who acquire data through collaboration with multi-ple partners within and outside the department for analysis, inter-pretation, and sharing of information on local health issues. Our mission is to serve the needs of HDHHS, and the needs of the scientific community, and general public as a resource for data and information on the indicators and the determinants of the health and well-being of geographically-defined communities, as well as of other distinct population groups within the city of Houston, Texas.