Embed Size (px)
Citation preview
1998 Beginning Teacher Survey: Final Report
Georgia Professional Standards Commission 1454 Twin Tower East
Atlanta, Georgia
Prepared By
Winifred C. Nweke
Coordinator for Research
July 13, 1998
2
Acknowledgements
We gratefully acknowledge the assistance and cooperation of Superintendents and/or
Personnel Officers of Georgia School Systems, and INSITE Inc. in this survey. We also
thank PSC staff members for their collaboration in the collection and processing of data and
in reviewing earlier drafts of this report.
Suggested Citation
Nweke, W. C., (1998). 1998 beginning teacher survey: Final report. Georgia Professional Standards
Commission, Educator Workforce Recruitment, Research and Development. Atlanta, GA. Retrieved
from the Georgia Professional Standards Commission website: [insert link]
3
Beginning Teachers’ Levels of Readiness for Georgia Classrooms
EXECUTIVE SUMMARY
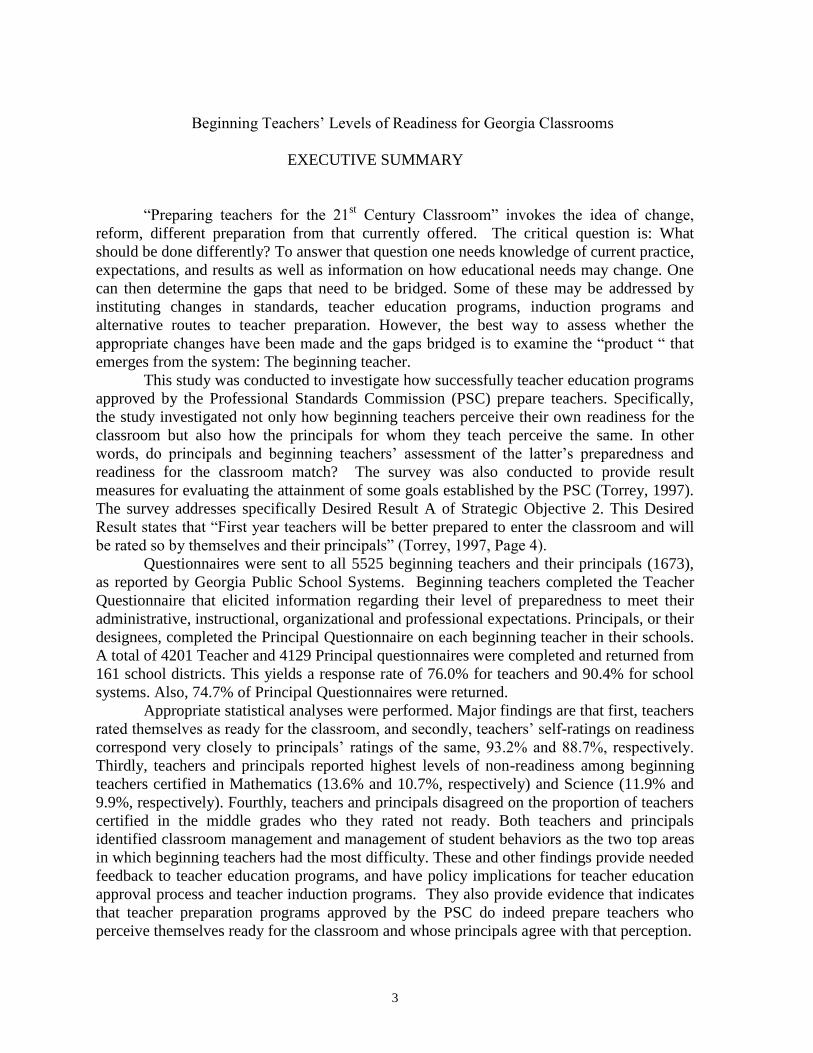
“Preparing teachers for the 21st Century Classroom” invokes the idea of change,
reform, different preparation from that currently offered. The critical question is: What
should be done differently? To answer that question one needs knowledge of current practice,
expectations, and results as well as information on how educational needs may change. One
can then determine the gaps that need to be bridged. Some of these may be addressed by
instituting changes in standards, teacher education programs, induction programs and
alternative routes to teacher preparation. However, the best way to assess whether the
appropriate changes have been made and the gaps bridged is to examine the “product “ that
emerges from the system: The beginning teacher.
This study was conducted to investigate how successfully teacher education programs
approved by the Professional Standards Commission (PSC) prepare teachers. Specifically,
the study investigated not only how beginning teachers perceive their own readiness for the
classroom but also how the principals for whom they teach perceive the same. In other
words, do principals and beginning teachers’ assessment of the latter’s preparedness and
readiness for the classroom match? The survey was also conducted to provide result
measures for evaluating the attainment of some goals established by the PSC (Torrey, 1997).
The survey addresses specifically Desired Result A of Strategic Objective 2. This Desired
Result states that “First year teachers will be better prepared to enter the classroom and will
be rated so by themselves and their principals” (Torrey, 1997, Page 4).
Questionnaires were sent to all 5525 beginning teachers and their principals (1673),
as reported by Georgia Public School Systems. Beginning teachers completed the Teacher
Questionnaire that elicited information regarding their level of preparedness to meet their
administrative, instructional, organizational and professional expectations. Principals, or their
designees, completed the Principal Questionnaire on each beginning teacher in their schools.
A total of 4201 Teacher and 4129 Principal questionnaires were completed and returned from
161 school districts. This yields a response rate of 76.0% for teachers and 90.4% for school
systems. Also, 74.7% of Principal Questionnaires were returned.
Appropriate statistical analyses were performed. Major findings are that first, teachers
rated themselves as ready for the classroom, and secondly, teachers’ self-ratings on readiness
correspond very closely to principals’ ratings of the same, 93.2% and 88.7%, respectively.
Thirdly, teachers and principals reported highest levels of non-readiness among beginning
teachers certified in Mathematics (13.6% and 10.7%, respectively) and Science (11.9% and
9.9%, respectively). Fourthly, teachers and principals disagreed on the proportion of teachers
certified in the middle grades who they rated not ready. Both teachers and principals
identified classroom management and management of student behaviors as the two top areas
in which beginning teachers had the most difficulty. These and other findings provide needed
feedback to teacher education programs, and have policy implications for teacher education
approval process and teacher induction programs. They also provide evidence that indicates
that teacher preparation programs approved by the PSC do indeed prepare teachers who
perceive themselves ready for the classroom and whose principals agree with that perception.
4
Beginning Teacher Survey – 1998: Levels of Readiness for Georgia Classrooms
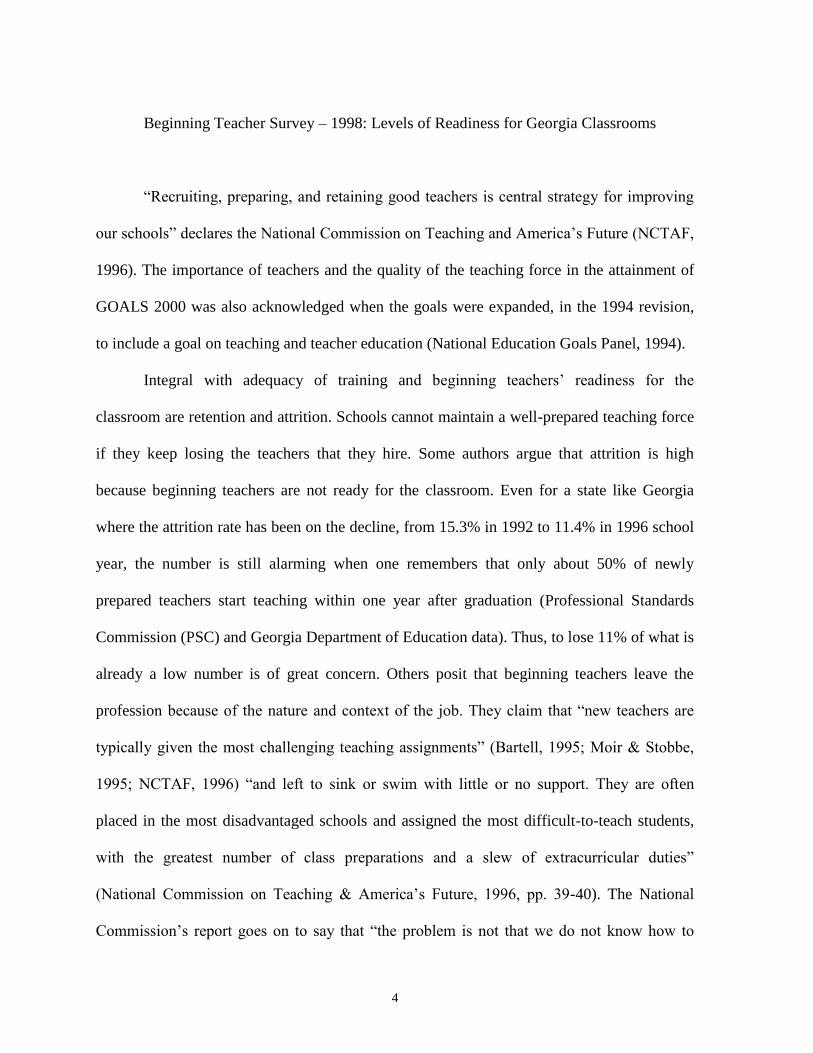
“Recruiting, preparing, and retaining good teachers is central strategy for improving
our schools” declares the National Commission on Teaching and America’s Future (NCTAF,
1996). The importance of teachers and the quality of the teaching force in the attainment of
GOALS 2000 was also acknowledged when the goals were expanded, in the 1994 revision,
to include a goal on teaching and teacher education (National Education Goals Panel, 1994).
Integral with adequacy of training and beginning teachers’ readiness for the
classroom are retention and attrition. Schools cannot maintain a well-prepared teaching force
if they keep losing the teachers that they hire. Some authors argue that attrition is high
because beginning teachers are not ready for the classroom. Even for a state like Georgia
where the attrition rate has been on the decline, from 15.3% in 1992 to 11.4% in 1996 school
year, the number is still alarming when one remembers that only about 50% of newly
prepared teachers start teaching within one year after graduation (Professional Standards
Commission (PSC) and Georgia Department of Education data). Thus, to lose 11% of what is
already a low number is of great concern. Others posit that beginning teachers leave the
profession because of the nature and context of the job. They claim that “new teachers are
typically given the most challenging teaching assignments” (Bartell, 1995; Moir & Stobbe,
1995; NCTAF, 1996) “and left to sink or swim with little or no support. They are often
placed in the most disadvantaged schools and assigned the most difficult-to-teach students,
with the greatest number of class preparations and a slew of extracurricular duties”
(National Commission on Teaching & America’s Future, 1996, pp. 39-40). The National
Commission’s report goes on to say that “the problem is not that we do not know how to
5
support beginning teachers; it is that we have not yet developed the commitment to do so
routinely.” The authors of the report, like many others in the field, see teaching as
developmental and holistic (California Standards for the Teaching Profession, (CSTP) 1997).
Proponents of this viewpoint believe that “teachers’ knowledge, skills, and practices develop
throughout their professional careers” (CSTP, 1997); that “teachers are never ‘finished’ as
professional learners” and that “support, mentoring and assessment during the early years of
teaching are essential to a beginning teacher’s development and success in the profession.”
These conceptualizations of the beginning teacher form the rationale for many state induction
programs around the nation (California, Kentucky, New Jersey, etc.). Such induction
programs are designed as a second phase in a comprehensive teacher preparation,
certification and retention program and, thus, are usually required for full certification.
Teaching has aptly been conceptualized as a highly complex and contextual activity
(Shulman, 1989). This implies that teaching effectiveness is a function of the interaction
between the teacher characteristics, on the one hand, and context variables, on the other.
Teacher characteristics include personal variables as well as skills and knowledge learned
through training. Contextual variables include student characteristics, colleagues, the school
and its location, and the school district. Thus, two teachers who passed through the same
preparation program and are teaching at different locations, personal variables held constant,
may perform at very different levels because of the characteristics of contextual variables.
This exacerbates the challenge for teacher preparation and argues for multiple placements
and varied field experiences throughout a program. It also justifies the need for and existence
of induction programs. Nevertheless, induction programs are based on the assumption that
the teacher brings an adequate amount of skills, knowledge and training to the context. They
6
can also be useful in other ways. Induction studies can provide new knowledge and best
practice that can be used as feedback to enrich pre-service programs. An example is the
developmental phases of a beginning teacher identified in the Santa Cruz County New
Teacher Project (SCCNTP) (Moir & Stobbe, 1995). The beginning teacher should learn the
developmental stages of a teacher during pre-service preparation just as she/he learns the
developmental stages of the children they are going to be teaching.
While induction may be very essential because of the complex and contextual nature
of teaching, the importance of excellent pre-service training cannot be minimized. In
Georgia, the new teacher is expected to bring some personal and demonstrated competencies,
as verified by teacher education programs, and certified by the PSC, to the context of the job.
Some critics argue that not enough beginning teachers do. According to What Matters Most
(1996), one of the sources of the problems that face the beginning teacher is inadequate
teacher preparation. Accrediting agencies or state agencies such as the Georgia Professional
Standards Commission, try to ensure high quality preparation by establishing and judging
teacher education programs against established standards. Even for programs that meet all
the standards for approval, one additional and direct method of program evaluation is the
examination of their product – the beginning teacher. In fact, one of the PSC standards
requires that the program or unit engages in regular and systematic evaluations, including
evaluations of recent graduates and uses information gathered to improve programs. It is
expected that beginning teachers would be able, more than anyone else, to articulate some of
the skills, knowledge or experiences that have helped them make the transition from being
the student to being the teacher. It is also expected that they should be able to identify skills
and knowledge the lack of which hampered their transition into the classroom. The purpose
7
of this study, therefore, is to find out from the beginning teachers how well prepared for the
classroom they feel and how ready they found themselves in the first few months in a
classroom. Even though all approved teacher education programs in Georgia are judged on
the same standards, each college decides the components of its program. This autonomy
generates differences among programs. Information provided by the graduates of these
programs will be very useful to teacher education colleges for program improvement. It
might also provide useful information for school systems that hire these new teachers,
especially those that assume that “once a teacher received a license to teach, he or she was
considered ready for practice, in need of no help” (NCTAF, 1996, p. 40).
In addition to providing information to teacher preparation programs for formative
and summative evaluation, this survey provides result measures for the PSC to assess the
attainment of one of its Strategic Objectives for the 1997-98 Fiscal Year. Desired Result A
under Strategic Objective 2 states that ´First year teachers will be better prepared to enter the
classroom and will be rated so by themselves and their principals.” (Torrey, 1997, p. 4).
This report presents a comprehensive and final summary of the findings from the
survey on how teachers and their principals rate the former’s level of preparedness on
specific knowledge, skills and abilities required to discharge their administrative,
instructional, organizational and professional responsibilities. It also presents information on
how well one PSC objective for 1997-98 Fiscal year has been met.
Method
Participants
Questionnaires were mailed to 178 school systems to be distributed to all beginning
teachers (5525) and the principals (1673) under whom they served. The numbers of teachers
8
and principals were obtained from the superintendents and personnel directors of school
systems. Four thousand two hundred and one (4201) teachers from 161 school systems
responded for a response rate of 76.0% for teachers and 90.4% for school systems. Also
principals completed and returned The Principal Questionnaire for 4129 teachers.
Questionnaires completed by veteran teachers who were new to Georgia, beginning, but non-
teaching personnel, for example, counselors and principal questionnaires that had no
matching teacher questionnaires were eliminated.
Materials
The Teacher Questionnaire and the Principal Questionnaire, developed by a
contractor, were administered to teachers and principals, respectively. Each questionnaire
was a 26-item four-point rating scale and three open-ended or constructed-response
questions. The rating scales elicited respondents’ level of agreement with the statements
pertaining to beginning teachers’ performance in and readiness for the classroom. The
constructed-response items elicited information on areas or skills in which respondents
believed the beginning teachers were best or least prepared, or could benefit from better
grounding.
Procedure
A focus group, comprised of beginning teachers, principals, teacher education faculty,
a director of an Induction Program, PSC staff and the contractor, was used to generate issues
to be addressed in the questionnaire. Beginning teachers were asked to reflect on their
preparation and their recent experience in the field and to identify areas to be addressed, the
time line for the survey and the format for the survey. These formed the basis for the
questionnaires and the survey procedures.
9
Many of the questionnaires were hand-delivered to personnel directors at the meeting
of the Georgia Association of School Personnel Administrators. The remaining
questionnaires were mailed to the Personnel Director in each school system. The directors
distributed the questionnaires to the principals who in turn distributed teacher questionnaires
to the teachers. The completed questionnaires were returned via the same routing. The
channel of distribution and collection of questionnaires, coupled with follow-up by telephone
and Fax, account for the considerably high response rates.
Result and Discussion
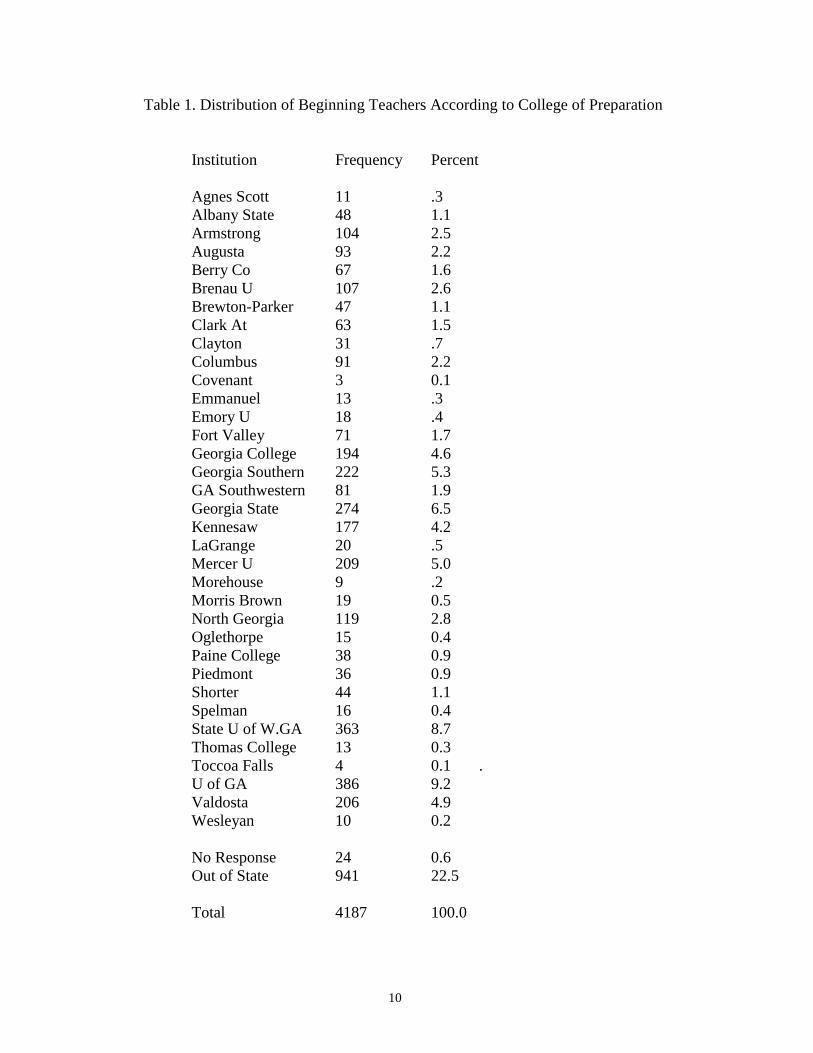
Data from 4187 Teacher and 4036 Principal questionnaires were analyzed. Table 1
shows the distribution of the beginning teachers according to colleges where they were
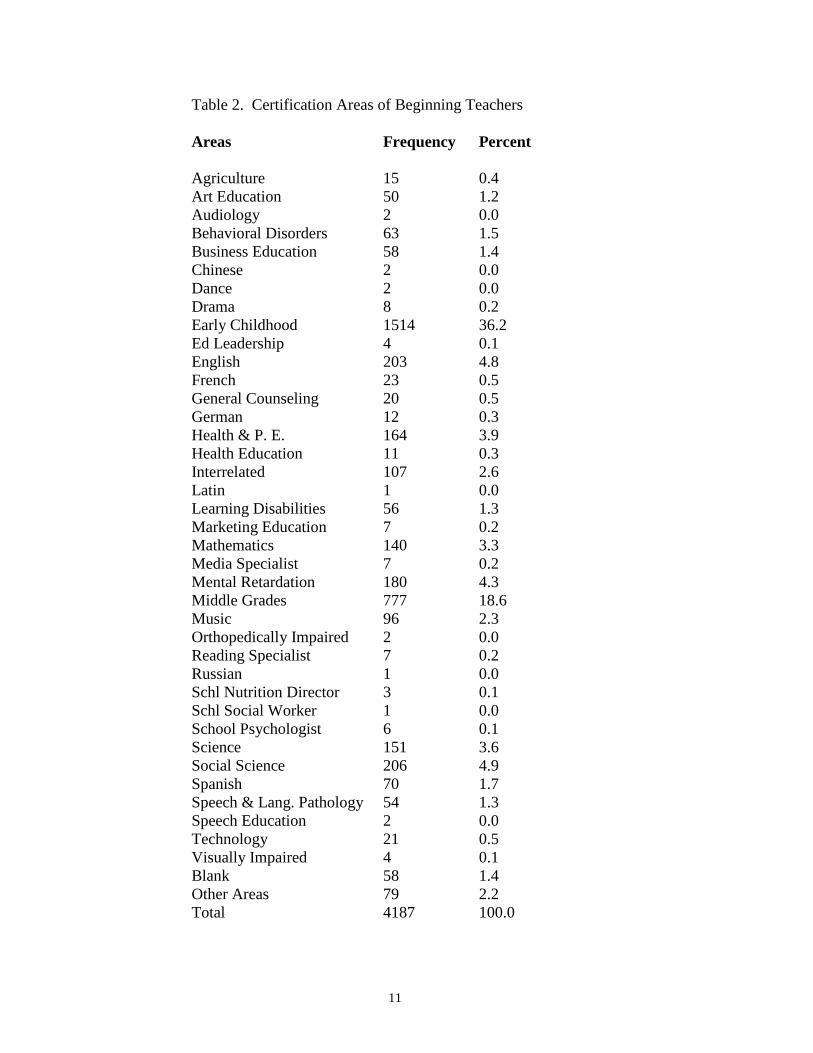
prepared. Approximately 23% of the teachers received their preparation out-of-state. Table 2
shows a distribution of the beginning teachers according to areas of certification. Early
Childhood Education has the highest representation in the population. Specifically, 36.2% of
the beginning teachers in the survey were certified in Early Childhood, 18.6% in the Middle
Grades and 4.9% in Social Studies, etc. Approximately 67% of the beginning teachers had
baccalaureate degrees in education, 21% had master’s degrees. The rest, 8.5%, underwent
various non-degree programs that culminate in Certification alone.
10
Table 1. Distribution of Beginning Teachers According to College of Preparation
Institution Frequency Percent
Agnes Scott 11 .3
Albany State 48 1.1
Armstrong 104 2.5
Augusta 93 2.2
Berry Co 67 1.6
Brenau U 107 2.6
Brewton-Parker 47 1.1
Clark At 63 1.5
Clayton 31 .7
Columbus 91 2.2
Covenant 3 0.1
Emmanuel 13 .3
Emory U 18 .4
Fort Valley 71 1.7
Georgia College 194 4.6
Georgia Southern 222 5.3
GA Southwestern 81 1.9
Georgia State 274 6.5
Kennesaw 177 4.2
LaGrange 20 .5
Mercer U 209 5.0
Morehouse 9 .2
Morris Brown 19 0.5
North Georgia 119 2.8
Oglethorpe 15 0.4
Paine College 38 0.9
Piedmont 36 0.9
Shorter 44 1.1
Spelman 16 0.4
State U of W.GA 363 8.7
Thomas College 13 0.3
Toccoa Falls 4 0.1 .
U of GA 386 9.2
Valdosta 206 4.9
Wesleyan 10 0.2
No Response 24 0.6
Out of State 941 22.5
Total 4187 100.0
11
Table 2. Certification Areas of Beginning Teachers
Areas Frequency Percent
Agriculture 15 0.4
Art Education 50 1.2
Audiology 2 0.0
Behavioral Disorders 63 1.5
Business Education 58 1.4
Chinese 2 0.0
Dance 2 0.0
Drama 8 0.2
Early Childhood 1514 36.2
Ed Leadership 4 0.1
English 203 4.8
French 23 0.5
General Counseling 20 0.5
German 12 0.3
Health & P. E. 164 3.9
Health Education 11 0.3
Interrelated 107 2.6
Latin 1 0.0
Learning Disabilities 56 1.3
Marketing Education 7 0.2
Mathematics 140 3.3
Media Specialist 7 0.2
Mental Retardation 180 4.3
Middle Grades 777 18.6
Music 96 2.3
Orthopedically Impaired 2 0.0
Reading Specialist 7 0.2
Russian 1 0.0
Schl Nutrition Director 3 0.1
Schl Social Worker 1 0.0
School Psychologist 6 0.1
Science 151 3.6
Social Science 206 4.9
Spanish 70 1.7
Speech & Lang. Pathology 54 1.3
Speech Education 2 0.0
Technology 21 0.5
Visually Impaired 4 0.1
Blank 58 1.4
Other Areas 79 2.2
Total 4187 100.0
12
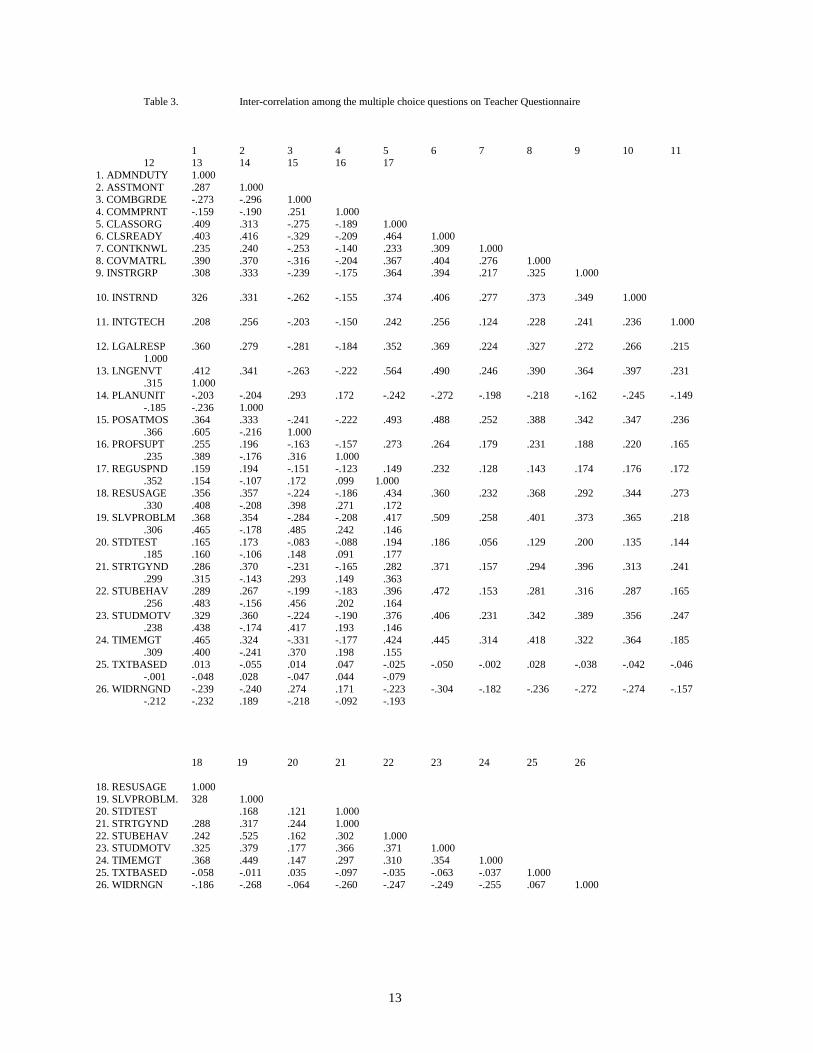
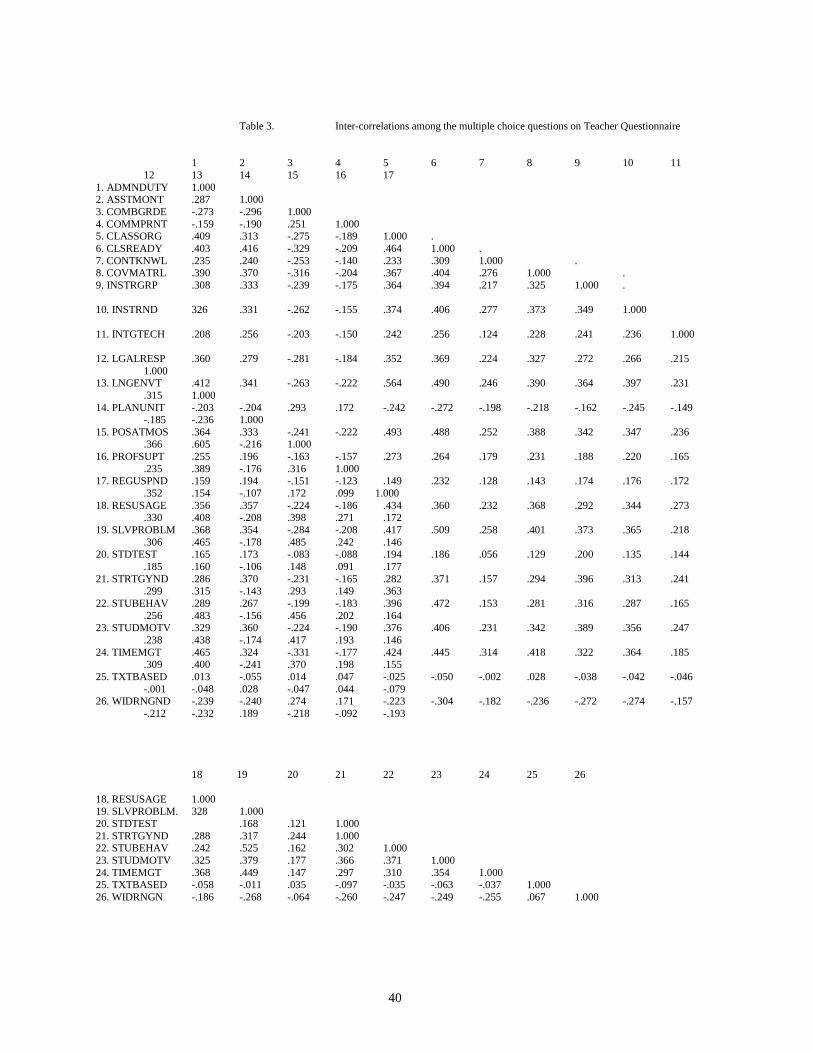
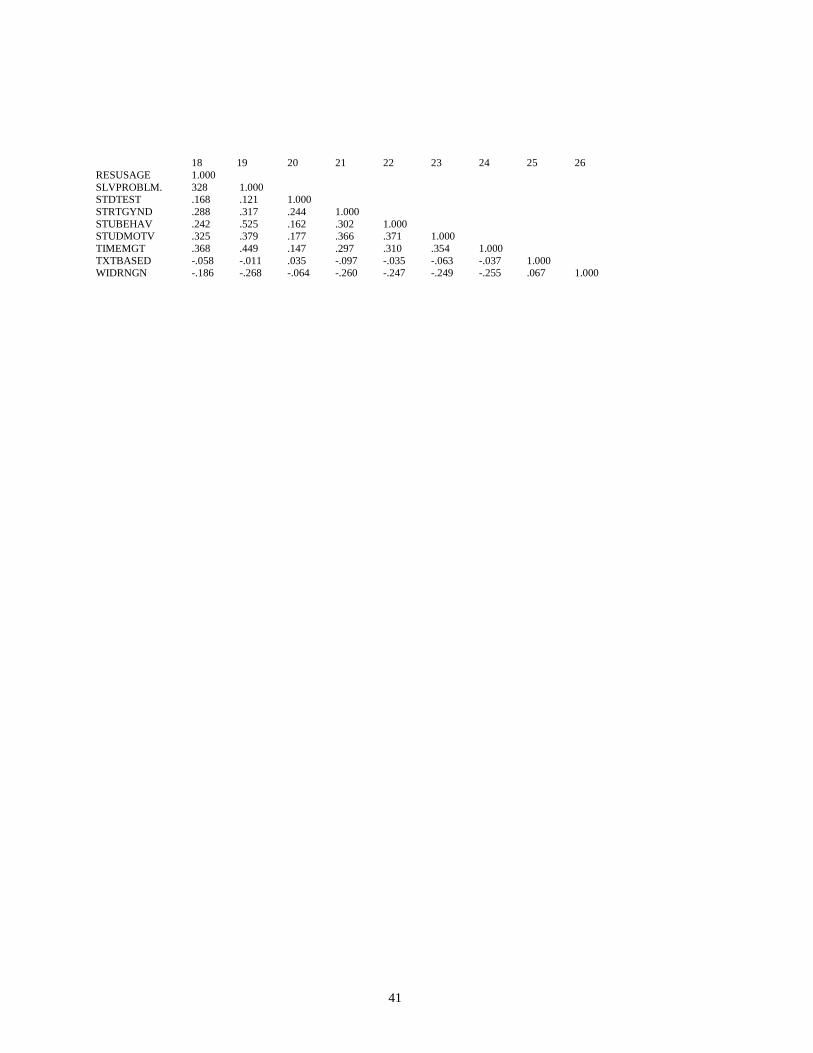
Table 3 shows an inter-item correlation table among the 26 items on Teacher
Questionnaire. The coefficients range from zero (.001) to medium (0.605) in magnitude. A
detailed evaluation of the survey instrument is presented in Appendix A of this Report. The
rest of the findings will be organized under the following headings: Teachers’ and Principals’
Responses on the rating scale; Results According to Selected areas of Certification; Open-
ended (constructed-response) Questions; In-State versus Out-of-state Preparation.
13
Table 3. Inter-correlation among the multiple choice questions on Teacher Questionnaire
1 2 3 4 5 6 7 8 9 10 11 12 13 14 15 16 17
1. ADMNDUTY 1.000
2. ASSTMONT .287 1.000 3. COMBGRDE -.273 -.296 1.000
4. COMMPRNT -.159 -.190 .251 1.000
5. CLASSORG .409 .313 -.275 -.189 1.000 6. CLSREADY .403 .416 -.329 -.209 .464 1.000
7. CONTKNWL .235 .240 -.253 -.140 .233 .309 1.000
8. COVMATRL .390 .370 -.316 -.204 .367 .404 .276 1.000 9. INSTRGRP .308 .333 -.239 -.175 .364 .394 .217 .325 1.000
10. INSTRND 326 .331 -.262 -.155 .374 .406 .277 .373 .349 1.000
11. INTGTECH .208 .256 -.203 -.150 .242 .256 .124 .228 .241 .236 1.000
12. LGALRESP .360 .279 -.281 -.184 .352 .369 .224 .327 .272 .266 .215
1.000
13. LNGENVT .412 .341 -.263 -.222 .564 .490 .246 .390 .364 .397 .231 .315 1.000
14. PLANUNIT -.203 -.204 .293 .172 -.242 -.272 -.198 -.218 -.162 -.245 -.149
-.185 -.236 1.000 15. POSATMOS .364 .333 -.241 -.222 .493 .488 .252 .388 .342 .347 .236
.366 .605 -.216 1.000 16. PROFSUPT .255 .196 -.163 -.157 .273 .264 .179 .231 .188 .220 .165
.235 .389 -.176 .316 1.000
17. REGUSPND .159 .194 -.151 -.123 .149 .232 .128 .143 .174 .176 .172 .352 .154 -.107 .172 .099 1.000
18. RESUSAGE .356 .357 -.224 -.186 .434 .360 .232 .368 .292 .344 .273
.330 .408 -.208 .398 .271 .172 19. SLVPROBLM .368 .354 -.284 -.208 .417 .509 .258 .401 .373 .365 .218
.306 .465 -.178 .485 .242 .146
20. STDTEST .165 .173 -.083 -.088 .194 .186 .056 .129 .200 .135 .144 .185 .160 -.106 .148 .091 .177
21. STRTGYND .286 .370 -.231 -.165 .282 .371 .157 .294 .396 .313 .241
.299 .315 -.143 .293 .149 .363 22. STUBEHAV .289 .267 -.199 -.183 .396 .472 .153 .281 .316 .287 .165
.256 .483 -.156 .456 .202 .164
23. STUDMOTV .329 .360 -.224 -.190 .376 .406 .231 .342 .389 .356 .247 .238 .438 -.174 .417 .193 .146
24. TIMEMGT .465 .324 -.331 -.177 .424 .445 .314 .418 .322 .364 .185
.309 .400 -.241 .370 .198 .155 25. TXTBASED .013 -.055 .014 .047 -.025 -.050 -.002 .028 -.038 -.042 -.046
-.001 -.048 .028 -.047 .044 -.079
26. WIDRNGND -.239 -.240 .274 .171 -.223 -.304 -.182 -.236 -.272 -.274 -.157 -.212 -.232 .189 -.218 -.092 -.193
18 19 20 21 22 23 24 25 26
18. RESUSAGE 1.000
19. SLVPROBLM. 328 1.000
20. STDTEST .168 .121 1.000
21. STRTGYND .288 .317 .244 1.000
22. STUBEHAV .242 .525 .162 .302 1.000 23. STUDMOTV .325 .379 .177 .366 .371 1.000
24. TIMEMGT .368 .449 .147 .297 .310 .354 1.000
25. TXTBASED -.058 -.011 .035 -.097 -.035 -.063 -.037 1.000 26. WIDRNGN -.186 -.268 -.064 -.260 -.247 -.249 -.255 .067 1.000
14
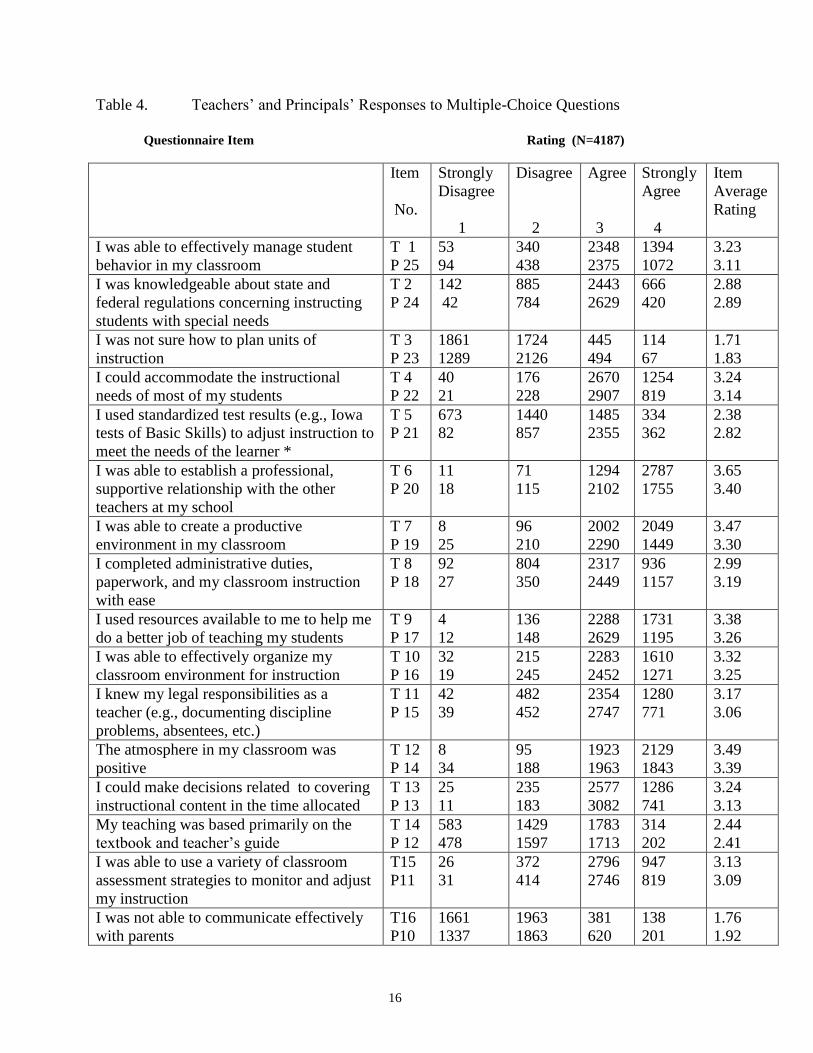
Teachers and Principals Responses on the Rating Scale
Teachers were asked to rate their level of readiness for the classroom on a scale of 1
to 4, by indicating to what extent they agreed (4) or disagreed (1) with 25 statements
regarding skills, knowledge and abilities that a classroom teacher should have. They also
rated themselves on the statement “Overall, I was ready for the classroom as a beginning
teacher.” Similarly, principals or their designees rated beginning teachers’ level of readiness
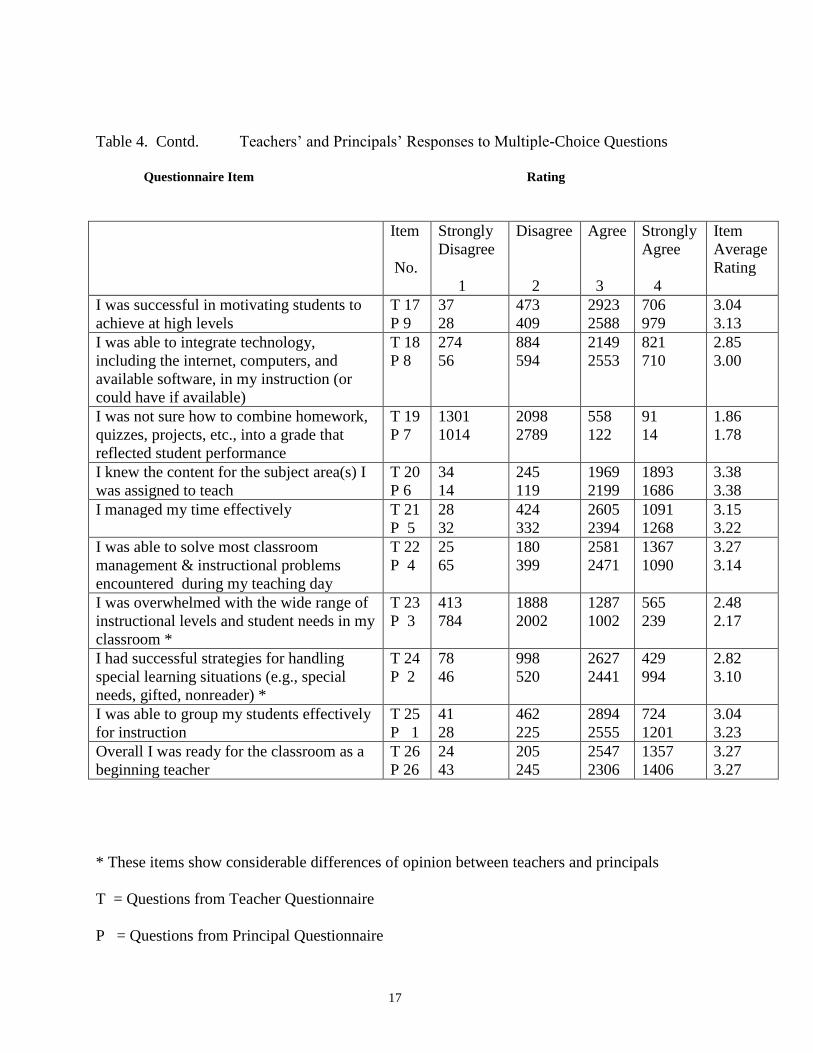
on items that corresponded to those on the teacher survey. Table 4 presents teachers’ and
principals’ patterns of responses on each item and also the average rating score for each item.
As can be seen, teachers and principals’ response patterns match very closely except on four
items. Thus, only responses to the overall readiness item as well as items on which teachers’
and principals’ responses do not agree will be discussed.
Principals’ and teachers’ patterns of rating as well as the mean ratings differed
significantly in items T5, T23 and T24. See Table 4. In T5, more principals than teachers
reported that teachers used results of standardized tests to adjust instruction to meet the needs
of students (t = 25.96, df = 3492, p = 0.0). This finding is curious and contrary to
expectation because teachers should have a more accurate knowledge of their own behaviors
in the classroom. In item T23, more teachers than principals felt that the teachers were
overwhelmed with the wide range of instructional levels and student needs in the classroom
(t = 18.27, df = 4009, p = 0.0). Finally, more principals than teachers felt that teachers had
successful strategies for handling special learning situations such as special needs, giftedness
and nonreaders (t = 20.65, df = 3962, p = 0.0) . These responses may suggest that the
15
teachers are doing a better job than they themselves perceive and/or perhaps that principals’
responses are based on broader view with more basis for comparison.
On item 26, the summary item, which elicited level of overall readiness, most of the
teachers indicated that they were ready by agreeing (61.6%) or strongly agreeing (32.8%).
This yields an overall agreement rate of 94.4%. Similarly, as shown in Table 4, principals
agreed (57.7%) or strongly agreed (35.2%), for a total of 92.7%, that the teachers were ready
for the classroom.
16
Table 4. Teachers’ and Principals’ Responses to Multiple-Choice Questions
Questionnaire Item Rating (N=4187)
Item
No.
Strongly
Disagree
1
Disagree
2
Agree
3
Strongly
Agree
4
Item
Average
Rating
I was able to effectively manage student
behavior in my classroom
T 1
P 25
53
94
340
438
2348
2375
1394
1072
3.23
3.11
I was knowledgeable about state and
federal regulations concerning instructing
students with special needs
T 2
P 24
142
42
885
784
2443
2629
666
420
2.88
2.89
I was not sure how to plan units of
instruction
T 3
P 23
1861
1289
1724
2126
445
494
114
67
1.71
1.83
I could accommodate the instructional
needs of most of my students
T 4
P 22
40
21
176
228
2670
2907
1254
819
3.24
3.14
I used standardized test results (e.g., Iowa
tests of Basic Skills) to adjust instruction to
meet the needs of the learner *
T 5
P 21
673
82
1440
857
1485
2355
334
362
2.38
2.82
I was able to establish a professional,
supportive relationship with the other
teachers at my school
T 6
P 20
11
18
71
115
1294
2102
2787
1755
3.65
3.40
I was able to create a productive
environment in my classroom
T 7
P 19
8
25
96
210
2002
2290
2049
1449
3.47
3.30
I completed administrative duties,
paperwork, and my classroom instruction
with ease
T 8
P 18
92
27
804
350
2317
2449
936
1157
2.99
3.19
I used resources available to me to help me
do a better job of teaching my students
T 9
P 17
4
12
136
148
2288
2629
1731
1195
3.38
3.26
I was able to effectively organize my
classroom environment for instruction
T 10
P 16
32
19
215
245
2283
2452
1610
1271
3.32
3.25
I knew my legal responsibilities as a
teacher (e.g., documenting discipline
problems, absentees, etc.)
T 11
P 15
42
39
482
452
2354
2747
1280
771
3.17
3.06
The atmosphere in my classroom was
positive
T 12
P 14
8
34
95
188
1923
1963
2129
1843
3.49
3.39
I could make decisions related to covering
instructional content in the time allocated
T 13
P 13
25
11
235
183
2577
3082
1286
741
3.24
3.13
My teaching was based primarily on the
textbook and teacher’s guide
T 14
P 12
583
478
1429
1597
1783
1713
314
202
2.44
2.41
I was able to use a variety of classroom
assessment strategies to monitor and adjust
my instruction
T15
P11
26
31
372
414
2796
2746
947
819
3.13
3.09
I was not able to communicate effectively
with parents
T16
P10
1661
1337
1963
1863
381
620
138
201
1.76
1.92
17
Table 4. Contd. Teachers’ and Principals’ Responses to Multiple-Choice Questions
Questionnaire Item Rating
Item
No.
Strongly
Disagree
1
Disagree
2
Agree
3
Strongly
Agree
4
Item
Average
Rating
I was successful in motivating students to
achieve at high levels
T 17
P 9
37
28
473
409
2923
2588
706
979
3.04
3.13
I was able to integrate technology,
including the internet, computers, and
available software, in my instruction (or
could have if available)
T 18
P 8
274
56
884
594
2149
2553
821
710
2.85
3.00
I was not sure how to combine homework,
quizzes, projects, etc., into a grade that
reflected student performance
T 19
P 7
1301
1014
2098
2789
558
122
91
14
1.86
1.78
I knew the content for the subject area(s) I
was assigned to teach
T 20
P 6
34
14
245
119
1969
2199
1893
1686
3.38
3.38
I managed my time effectively T 21
P 5
28
32
424
332
2605
2394
1091
1268
3.15
3.22
I was able to solve most classroom
management & instructional problems
encountered during my teaching day
T 22
P 4
25
65
180
399
2581
2471
1367
1090
3.27
3.14
I was overwhelmed with the wide range of
instructional levels and student needs in my
classroom *
T 23
P 3
413
784
1888
2002
1287
1002
565
239
2.48
2.17
I had successful strategies for handling
special learning situations (e.g., special
needs, gifted, nonreader) *
T 24
P 2
78
46
998
520
2627
2441
429
994
2.82
3.10
I was able to group my students effectively
for instruction
T 25
P 1
41
28
462
225
2894
2555
724
1201
3.04
3.23
Overall I was ready for the classroom as a
beginning teacher
T 26
P 26
24
43
205
245
2547
2306
1357
1406
3.27
3.27
* These items show considerable differences of opinion between teachers and principals
T = Questions from Teacher Questionnaire
P = Questions from Principal Questionnaire
18
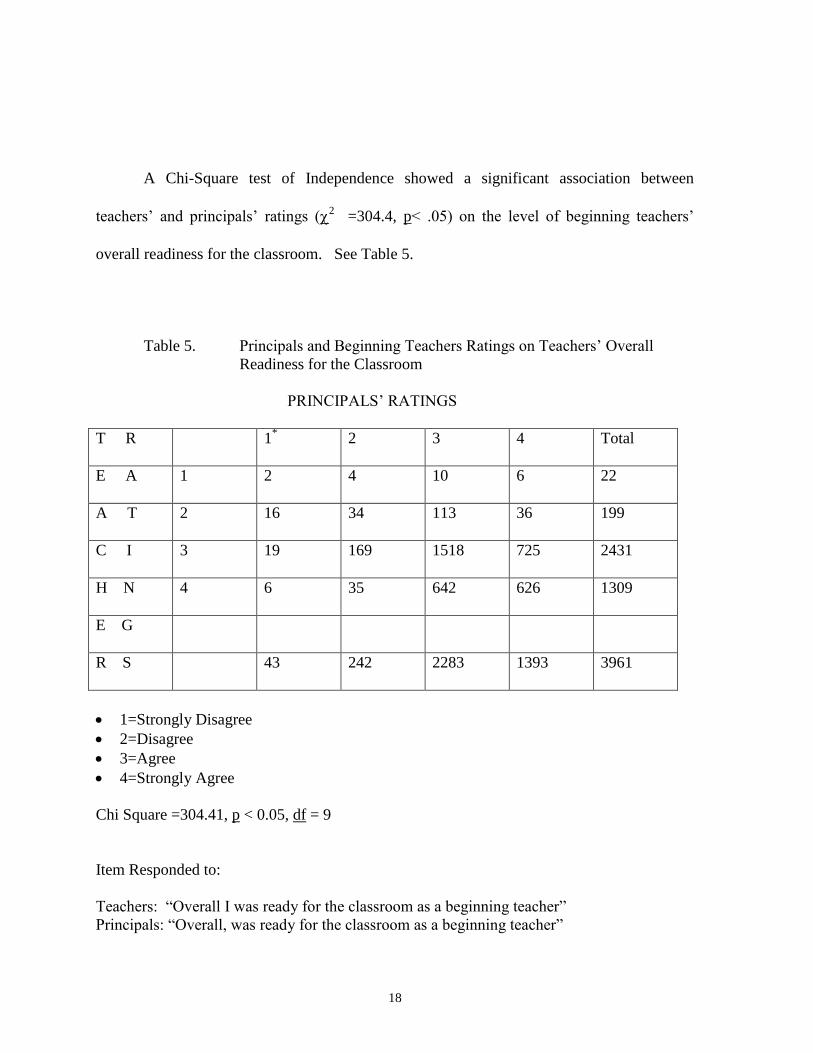
A Chi-Square test of Independence showed a significant association between
teachers’ and principals’ ratings (2 =304.4, p< .05) on the level of beginning teachers’
overall readiness for the classroom. See Table 5.
Table 5. Principals and Beginning Teachers Ratings on Teachers’ Overall
Readiness for the Classroom
PRINCIPALS’ RATINGS
T R
1*
2 3 4 Total
E A
1 2 4 10 6 22
A T
2 16 34 113 36 199
C I
3 19 169 1518 725 2431
H N
4 6 35 642 626 1309
E G
R S
43 242 2283 1393 3961
1=Strongly Disagree
2=Disagree
3=Agree
4=Strongly Agree
Chi Square =304.41, p < 0.05, df = 9
Item Responded to:
Teachers: “Overall I was ready for the classroom as a beginning teacher”
Principals: “Overall, was ready for the classroom as a beginning teacher”
19
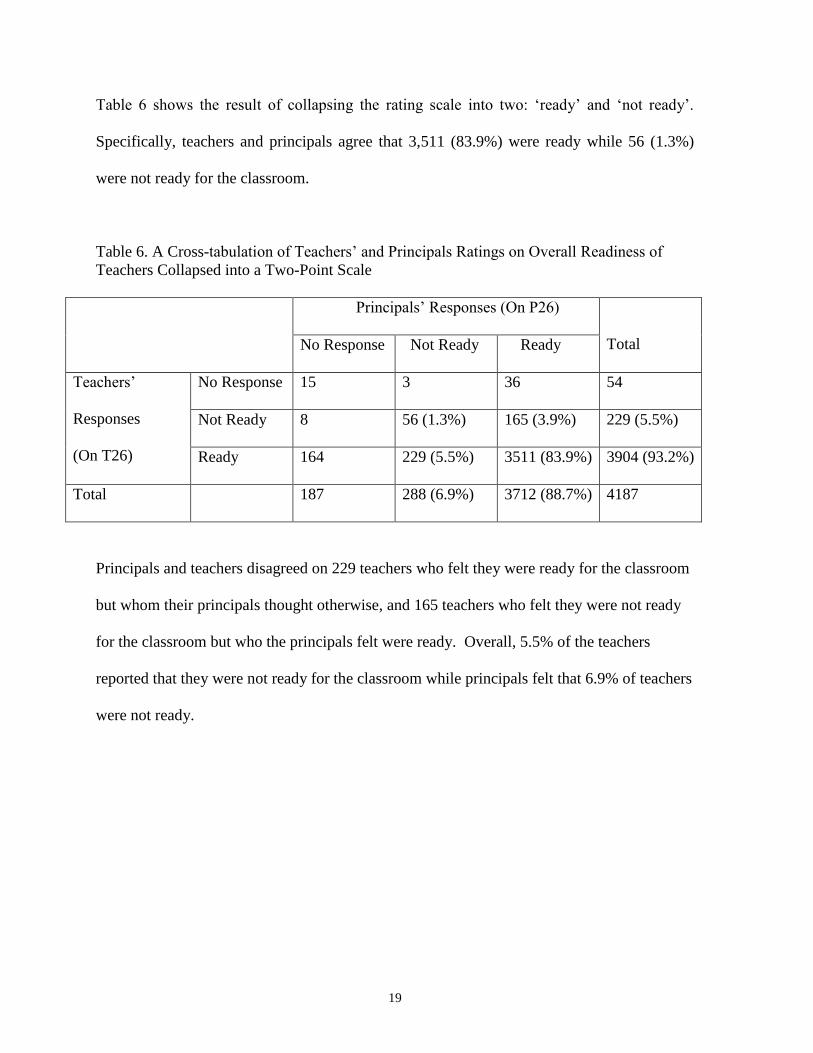
Table 6 shows the result of collapsing the rating scale into two: ‘ready’ and ‘not ready’.
Specifically, teachers and principals agree that 3,511 (83.9%) were ready while 56 (1.3%)
were not ready for the classroom.
Table 6. A Cross-tabulation of Teachers’ and Principals Ratings on Overall Readiness of
Teachers Collapsed into a Two-Point Scale
Principals’ Responses (On P26)
Total No Response Not Ready Ready
Teachers’
Responses
(On T26)
No Response 15 3 36 54
Not Ready 8 56 (1.3%) 165 (3.9%) 229 (5.5%)
Ready 164 229 (5.5%) 3511 (83.9%) 3904 (93.2%)
Total 187 288 (6.9%) 3712 (88.7%) 4187
Principals and teachers disagreed on 229 teachers who felt they were ready for the classroom
but whom their principals thought otherwise, and 165 teachers who felt they were not ready
for the classroom but who the principals felt were ready. Overall, 5.5% of the teachers
reported that they were not ready for the classroom while principals felt that 6.9% of teachers
were not ready.
20
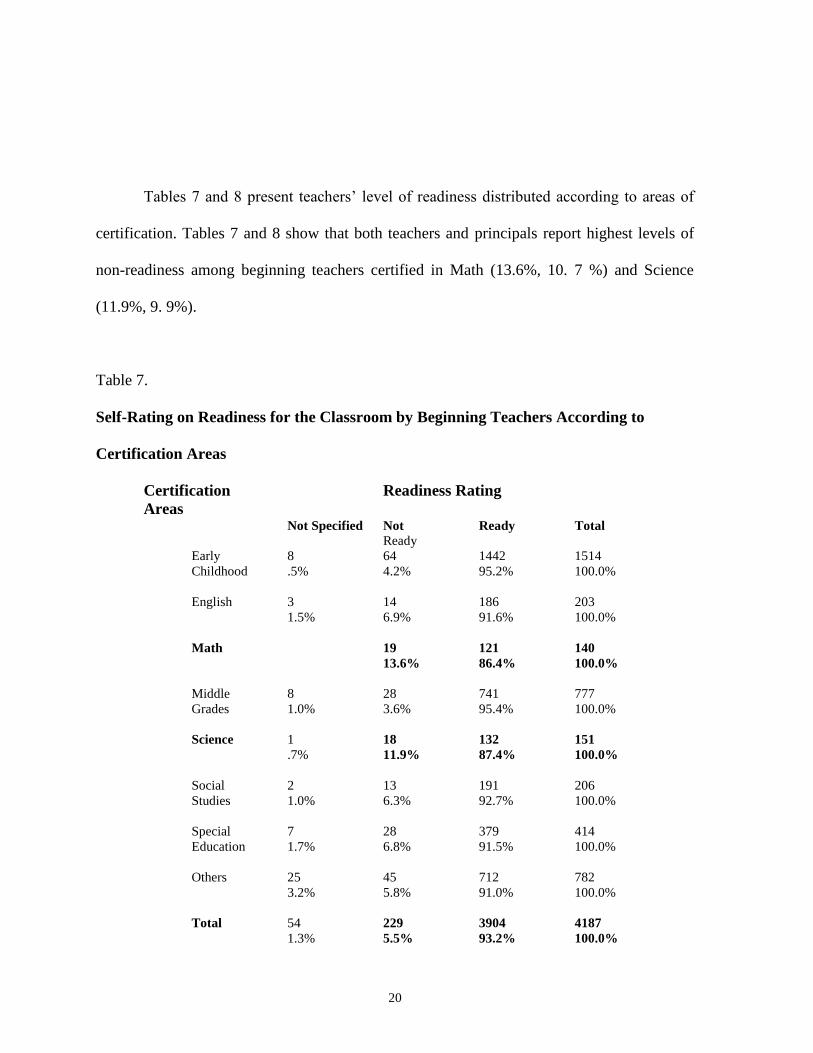
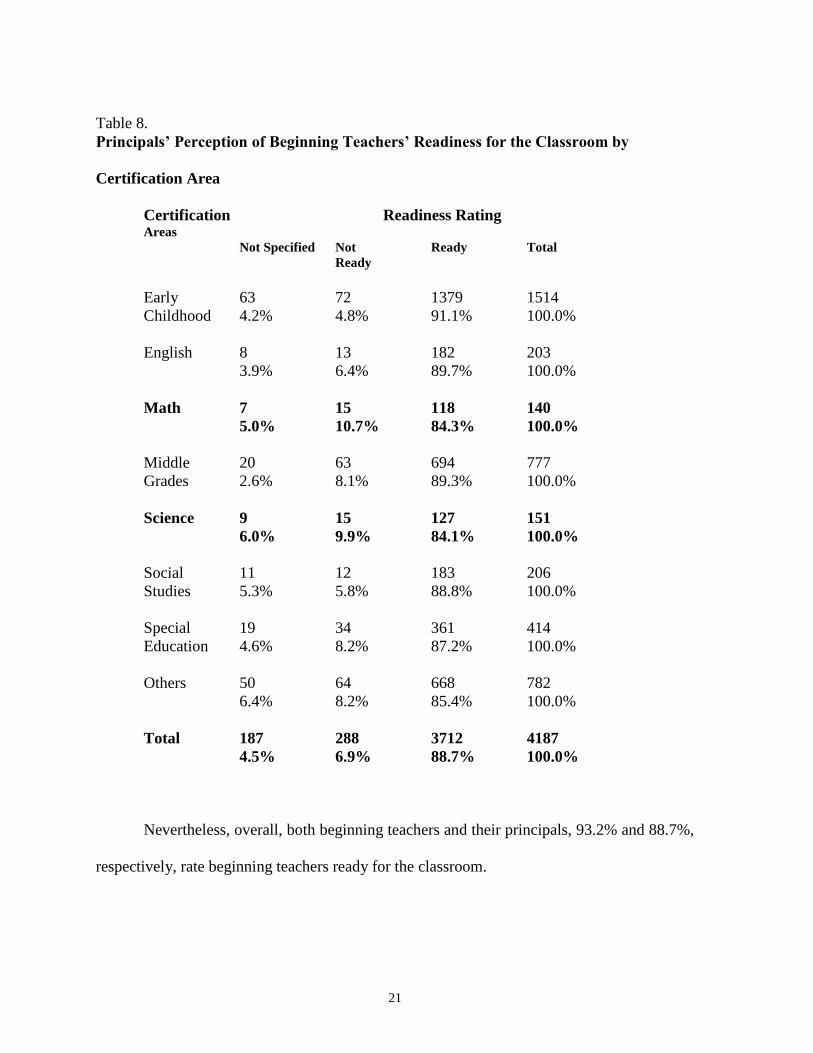
Tables 7 and 8 present teachers’ level of readiness distributed according to areas of
certification. Tables 7 and 8 show that both teachers and principals report highest levels of
non-readiness among beginning teachers certified in Math (13.6%, 10. 7 %) and Science
(11.9%, 9. 9%).
Table 7.
Self-Rating on Readiness for the Classroom by Beginning Teachers According to
Certification Areas
Certification Readiness Rating
Areas Not Specified Not Ready Total
Ready
Early 8 64 1442 1514
Childhood .5% 4.2% 95.2% 100.0%
English 3 14 186 203
1.5% 6.9% 91.6% 100.0%
Math 19 121 140
13.6% 86.4% 100.0%
Middle 8 28 741 777
Grades 1.0% 3.6% 95.4% 100.0%
Science 1 18 132 151
.7% 11.9% 87.4% 100.0%
Social 2 13 191 206
Studies 1.0% 6.3% 92.7% 100.0%
Special 7 28 379 414
Education 1.7% 6.8% 91.5% 100.0%
Others 25 45 712 782
3.2% 5.8% 91.0% 100.0%
Total 54 229 3904 4187
1.3% 5.5% 93.2% 100.0%
21
Table 8.
Principals’ Perception of Beginning Teachers’ Readiness for the Classroom by
Certification Area
Certification Readiness Rating Areas
Not Specified Not Ready Total
Ready
Early 63 72 1379 1514
Childhood 4.2% 4.8% 91.1% 100.0%
English 8 13 182 203
3.9% 6.4% 89.7% 100.0%
Math 7 15 118 140
5.0% 10.7% 84.3% 100.0%
Middle 20 63 694 777
Grades 2.6% 8.1% 89.3% 100.0%
Science 9 15 127 151
6.0% 9.9% 84.1% 100.0%
Social 11 12 183 206
Studies 5.3% 5.8% 88.8% 100.0%
Special 19 34 361 414
Education 4.6% 8.2% 87.2% 100.0%
Others 50 64 668 782
6.4% 8.2% 85.4% 100.0%
Total 187 288 3712 4187
4.5% 6.9% 88.7% 100.0%
Nevertheless, overall, both beginning teachers and their principals, 93.2% and 88.7%,
respectively, rate beginning teachers ready for the classroom.
22
Teachers’ and Principals’ Responses to the Constructed-Response Questions
Beginning teachers and their principals were also asked to respond to three open-
ended or constructed-response questions. The first one for teachers was: “What did you get
from your teacher preparation that you most needed, i.e., in which areas were you well
prepared?” Teachers responded to this item by either specifying a course or subject area by
name e.g. English, or they listed some skills, knowledge or ability e.g. accommodating
student needs. No subject area was listed by more than 1% of the teachers. 96.8% did not list
any areas. In terms of skills 1.7% listed Planning Units of Instruction, 1.5% listed Classroom
Management and Organization, 1.2% listed Field Experiences while 91.6% did not list any.
Question two asked: “Which areas of study, classes, projects, etc, did you complete in
your teacher preparation but did not need, i.e., which could have been left out?” No subject
area or skill was listed by as much as 1%. This could be interpreted to mean that most
beginning teachers found all their experiences in teacher preparation to be useful.
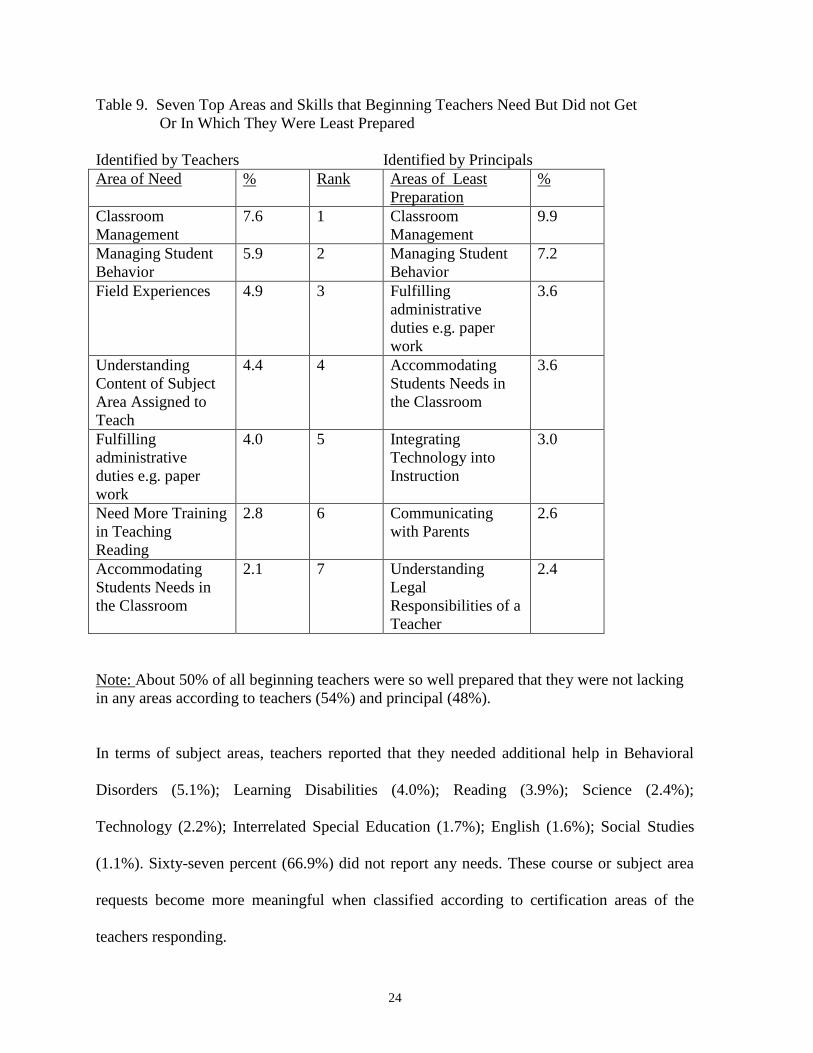
Question 3 reads: “What did you need in your teacher preparation that you did not
get, i.e., which area(s) need to be added?” Table 9 shows areas and/or skills that teachers
indicated they needed in their “teacher preparation but did not get.” To facilitate
comparisons, Table 9 also shows in which areas and skills the principals thought the
beginning teachers were least prepared. Teachers and principals show a high degree of
agreement on what teachers seem to need. Specifically, teachers and principals named
classroom management and managing student behavior in that order, as the two most
important skills that teachers lacked. Additionally, teachers felt they could use longer and
more varied field experiences (4.9%); more courses in the content areas they are teaching
23
(4.4%); better preparation in fulfilling administrative duties (4.0%); the teaching of reading
(2.8%); and strategies for accommodating student needs in the classroom (2.1%). On the
other hand, principals felt that the teachers were least prepared in these additional areas:
strategies for accommodating needs in the classroom (3.6%); fulfilling administrative duties
(3.6%); integrating technology into the classroom (3.0%); communicating with parents
(2.6%) and understanding legal responsibilities of a teacher (2.4%). It should be mentioned
that 54% of the teachers, according to teachers themselves, and 48%, according to their
principals, lacked nothing and did not list any areas of weaknesses in their preparation.
24
Table 9. Seven Top Areas and Skills that Beginning Teachers Need But Did not Get
Or In Which They Were Least Prepared
Identified by Teachers Identified by Principals
Area of Need % Rank Areas of Least
Preparation
%
Classroom
Management
7.6 1 Classroom
Management
9.9
Managing Student
Behavior
5.9 2 Managing Student
Behavior
7.2
Field Experiences 4.9 3 Fulfilling
administrative
duties e.g. paper
work
3.6
Understanding
Content of Subject
Area Assigned to
Teach
4.4 4 Accommodating
Students Needs in
the Classroom
3.6
Fulfilling
administrative
duties e.g. paper
work
4.0 5 Integrating
Technology into
Instruction
3.0
Need More Training
in Teaching
Reading
2.8 6 Communicating
with Parents
2.6
Accommodating
Students Needs in
the Classroom
2.1 7 Understanding
Legal
Responsibilities of a
Teacher
2.4
Note: About 50% of all beginning teachers were so well prepared that they were not lacking
in any areas according to teachers (54%) and principal (48%).
In terms of subject areas, teachers reported that they needed additional help in Behavioral
Disorders (5.1%); Learning Disabilities (4.0%); Reading (3.9%); Science (2.4%);
Technology (2.2%); Interrelated Special Education (1.7%); English (1.6%); Social Studies
(1.1%). Sixty-seven percent (66.9%) did not report any needs. These course or subject area
requests become more meaningful when classified according to certification areas of the
teachers responding.
25
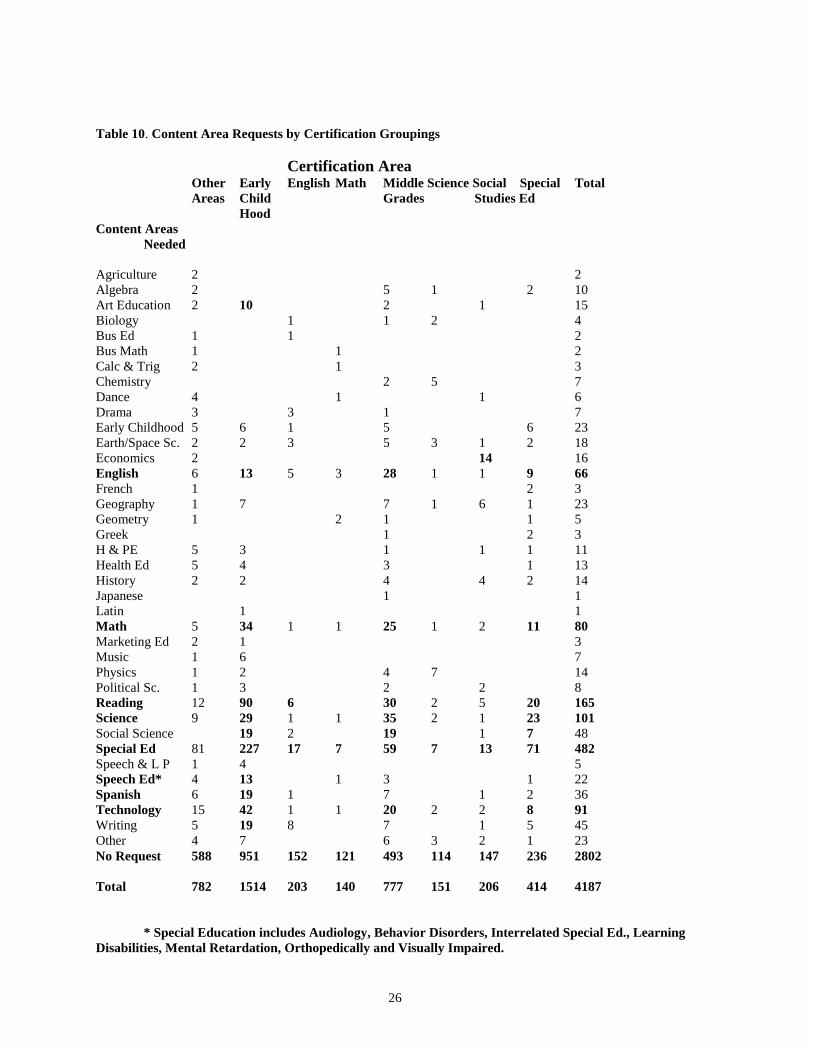
Table 10 presents information on the certification areas of beginning teachers and the
subject areas in which they would have liked more preparation. This information is important
because it can assist individual preparation programs see where their graduates think they
need additional help. For instance, 59% of the requests for more preparation in Reading were
made by teachers certified in Early Childhood. Similarly, 42.5% of request for Math, 47.1 in
Special Education, 46.2% for Technology, and 42.2% for Writing were made by beginning
teachers certified in Early Childhood. Requests from teachers certified in the Middle Grades
constitute the specified percentages for the following areas: English (42.4%), Mathematics
(31.3%), Technology (22%), and Special Education (12.2%). Also noteworthy is the finding
that for teachers certified in Social Studies, requests for better grounding in Economics
constitutes the highest area of concern followed by requests for Special Education. It should
be remembered that, as shown on Table 10, as many as 2802 or 66.9% of the beginning
teachers did not indicate that they needed any additional help.
For teacher preparation programs to benefit from feedback provided by beginning
teachers, each program needs to know the specifics areas of concern or weakness of its own
graduates. Tables 11 and 12 present a cross-tabulation of teachers not considered ready for
the classroom according to their college of preparation and areas of certification. An in-depth
and separate institutional report has been prepared for and made available to each college that
is represented in the survey.
26
Table 10. Content Area Requests by Certification Groupings
Certification Area Other Early English Math Middle Science Social Special Total
Areas Child Grades Studies Ed
Hood
Content Areas
Needed
Agriculture 2 2
Algebra 2 5 1 2 10
Art Education 2 10 2 1 15
Biology 1 1 2 4
Bus Ed 1 1 2
Bus Math 1 1 2
Calc & Trig 2 1 3
Chemistry 2 5 7
Dance 4 1 1 6
Drama 3 3 1 7
Early Childhood 5 6 1 5 6 23
Earth/Space Sc. 2 2 3 5 3 1 2 18
Economics 2 14 16
English 6 13 5 3 28 1 1 9 66
French 1 2 3
Geography 1 7 7 1 6 1 23
Geometry 1 2 1 1 5
Greek 1 2 3
H & PE 5 3 1 1 1 11
Health Ed 5 4 3 1 13
History 2 2 4 4 2 14
Japanese 1 1
Latin 1 1
Math 5 34 1 1 25 1 2 11 80
Marketing Ed 2 1 3
Music 1 6 7
Physics 1 2 4 7 14
Political Sc. 1 3 2 2 8
Reading 12 90 6 30 2 5 20 165
Science 9 29 1 1 35 2 1 23 101
Social Science 19 2 19 1 7 48
Special Ed 81 227 17 7 59 7 13 71 482
Speech & L P 1 4 5
Speech Ed* 4 13 1 3 1 22
Spanish 6 19 1 7 1 2 36
Technology 15 42 1 1 20 2 2 8 91
Writing 5 19 8 7 1 5 45
Other 4 7 6 3 2 1 23
No Request 588 951 152 121 493 114 147 236 2802
Total 782 1514 203 140 777 151 206 414 4187
* Special Education includes Audiology, Behavior Disorders, Interrelated Special Ed., Learning
Disabilities, Mental Retardation, Orthopedically and Visually Impaired.
27
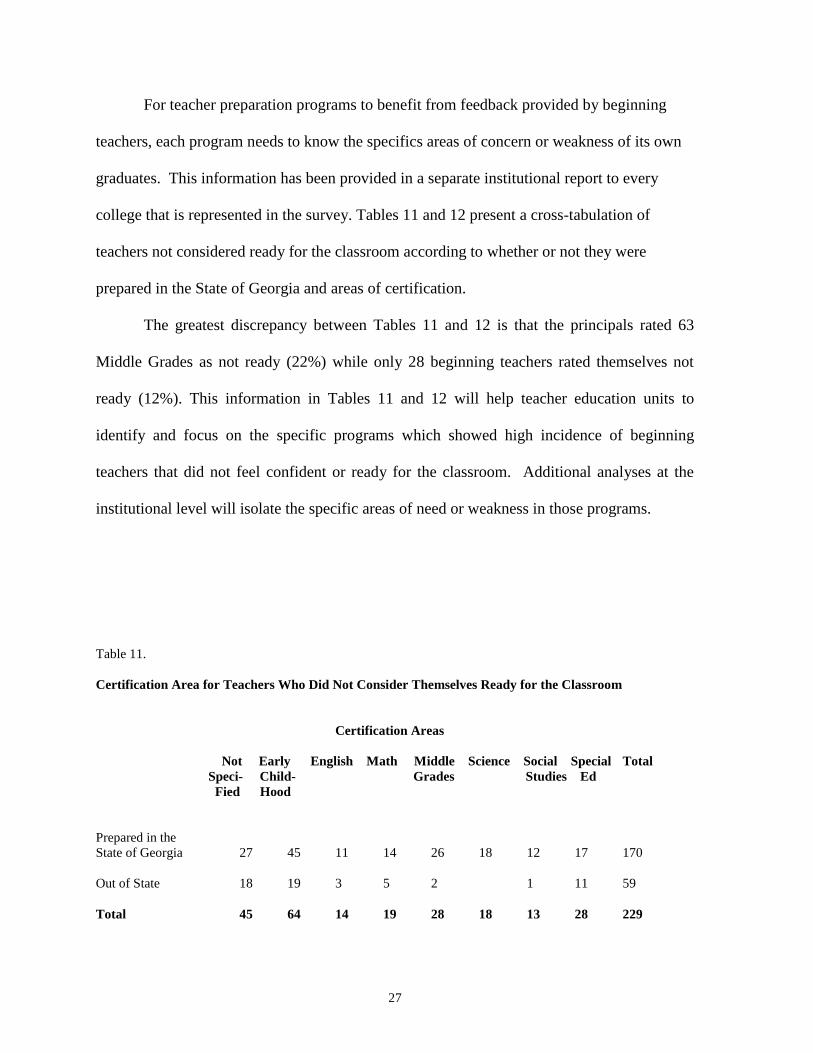
For teacher preparation programs to benefit from feedback provided by beginning
teachers, each program needs to know the specifics areas of concern or weakness of its own
graduates. This information has been provided in a separate institutional report to every
college that is represented in the survey. Tables 11 and 12 present a cross-tabulation of
teachers not considered ready for the classroom according to whether or not they were
prepared in the State of Georgia and areas of certification.
The greatest discrepancy between Tables 11 and 12 is that the principals rated 63
Middle Grades as not ready (22%) while only 28 beginning teachers rated themselves not
ready (12%). This information in Tables 11 and 12 will help teacher education units to
identify and focus on the specific programs which showed high incidence of beginning
teachers that did not feel confident or ready for the classroom. Additional analyses at the
institutional level will isolate the specific areas of need or weakness in those programs.
Table 11.
Certification Area for Teachers Who Did Not Consider Themselves Ready for the Classroom
Certification Areas
Not Early English Math Middle Science Social Special Total
Speci- Child- Grades Studies Ed
Fied Hood
Prepared in the
State of Georgia 27 45 11 14 26 18 12 17 170
Out of State 18 19 3 5 2 1 11 59
Total 45 64 14 19 28 18 13 28 229
28
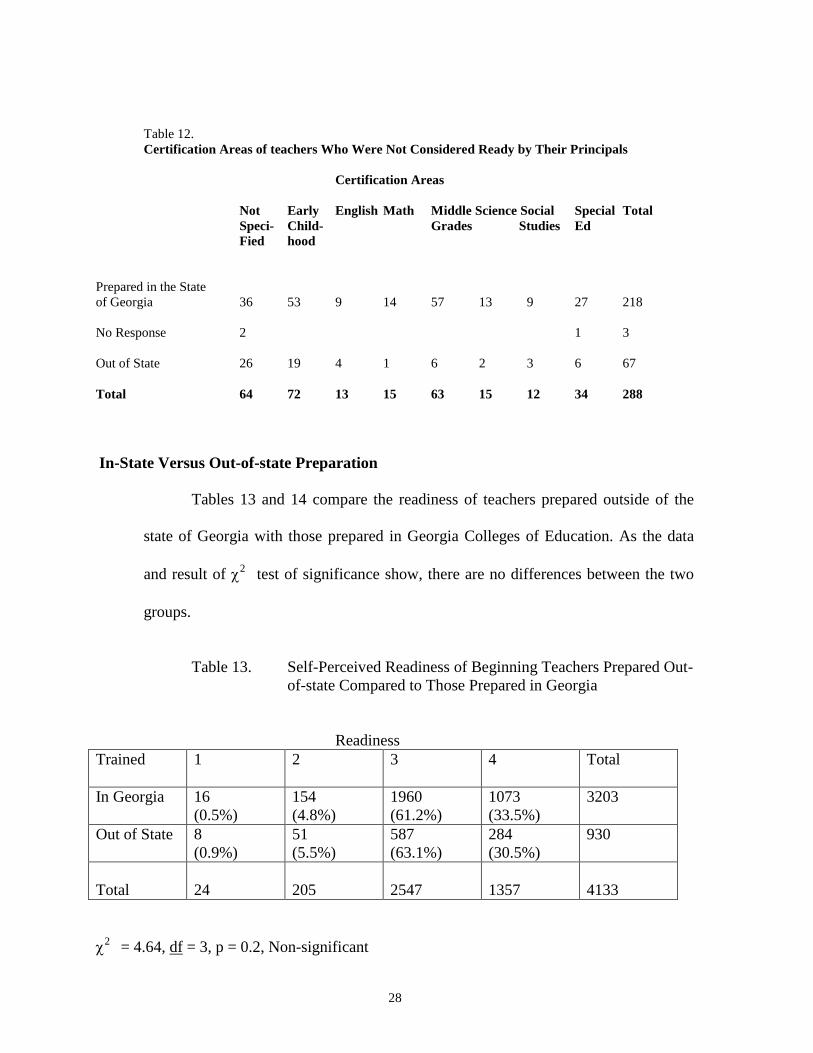
Table 12.
Certification Areas of teachers Who Were Not Considered Ready by Their Principals
Certification Areas
Not Early English Math Middle Science Social Special Total
Speci- Child- Grades Studies Ed
Fied hood
Prepared in the State
of Georgia 36 53 9 14 57 13 9 27 218
No Response 2 1 3
Out of State 26 19 4 1 6 2 3 6 67
Total 64 72 13 15 63 15 12 34 288
In-State Versus Out-of-state Preparation
Tables 13 and 14 compare the readiness of teachers prepared outside of the
state of Georgia with those prepared in Georgia Colleges of Education. As the data
and result of 2
test of significance show, there are no differences between the two
groups.
Table 13. Self-Perceived Readiness of Beginning Teachers Prepared Out-
of-state Compared to Those Prepared in Georgia
Readiness
Trained
1 2 3 4 Total
In Georgia 16
(0.5%)
154
(4.8%)
1960
(61.2%)
1073
(33.5%)
3203
Out of State 8
(0.9%)
51
(5.5%)
587
(63.1%)
284
(30.5%)
930
Total
24
205
2547
1357
4133
2
= 4.64, df = 3, p = 0.2, Non-significant
29
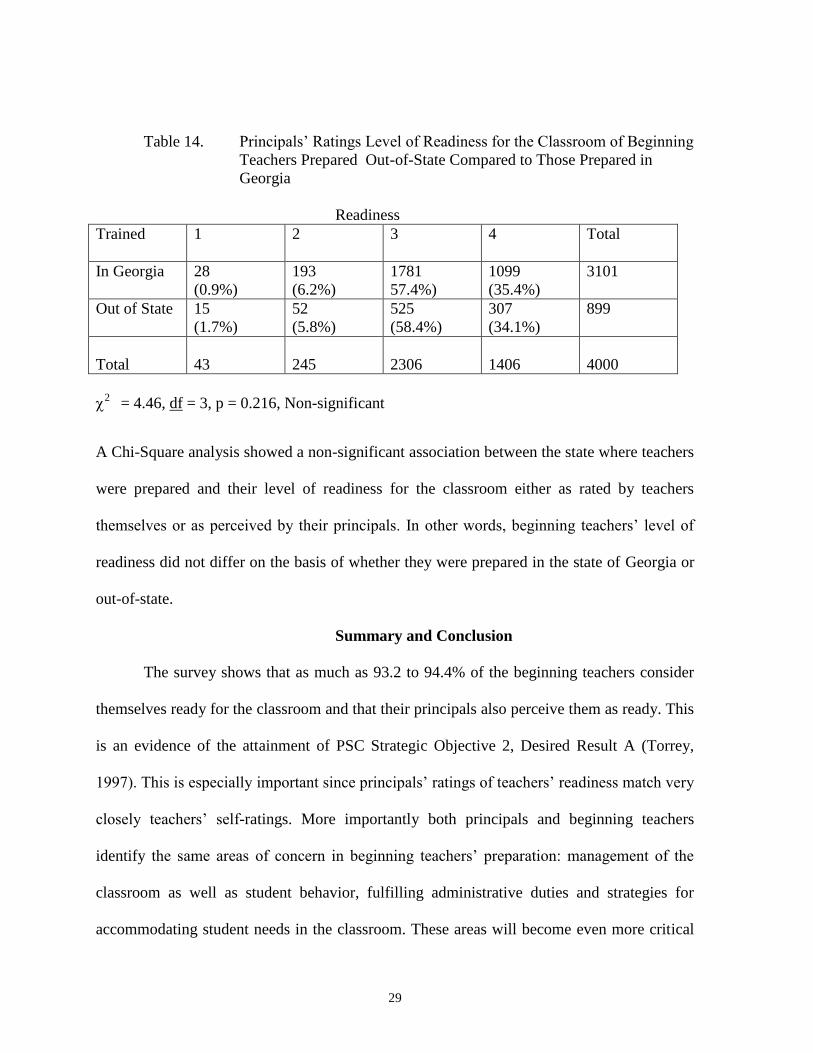
Table 14. Principals’ Ratings Level of Readiness for the Classroom of Beginning
Teachers Prepared Out-of-State Compared to Those Prepared in
Georgia
Readiness
Trained
1 2 3 4 Total
In Georgia
28
(0.9%)
193
(6.2%)
1781
57.4%)
1099
(35.4%)
3101
Out of State
15
(1.7%)
52
(5.8%)
525
(58.4%)
307
(34.1%)
899
Total
43
245
2306
1406
4000
2
= 4.46, df = 3, p = 0.216, Non-significant
A Chi-Square analysis showed a non-significant association between the state where teachers
were prepared and their level of readiness for the classroom either as rated by teachers
themselves or as perceived by their principals. In other words, beginning teachers’ level of
readiness did not differ on the basis of whether they were prepared in the state of Georgia or
out-of-state.
Summary and Conclusion
The survey shows that as much as 93.2 to 94.4% of the beginning teachers consider
themselves ready for the classroom and that their principals also perceive them as ready. This
is an evidence of the attainment of PSC Strategic Objective 2, Desired Result A (Torrey,
1997). This is especially important since principals’ ratings of teachers’ readiness match very
closely teachers’ self-ratings. More importantly both principals and beginning teachers
identify the same areas of concern in beginning teachers’ preparation: management of the
classroom as well as student behavior, fulfilling administrative duties and strategies for
accommodating student needs in the classroom. These areas will become even more critical

30
as classrooms become more inclusive and diverse. Beginning teachers also indicated their
concern about the nature and length of their field experiences. Many of their comments
confirm the need for multiple placements in diversified environments, experience working
with students that have diverse needs and starting field experiences as early in one’s program
as possible.
The survey also shows that beginning teachers’ greatest concern or weakness is not
inadequate skills for teaching reading. Only a small percentage of teachers (2.8 –3.9%) felt
they could use some help in that area. Most of the concerns (54.5%), on how to teach
reading, were expressed by 5.9% of Early Childhood majors. In fact, more Early Childhood
certificate holders asked for help in Special Education areas (15.1%) than in Reading (5.9%).
Finally, when beginning teachers are classified according to areas of certification, highest
proportions of non-readiness are found in Mathematics and Science areas.
31
References
Bartell, C. A. (1995, Fall). Shaping teacher induction policy in California. Teacher
Education Quarterly, 27-43.
Boothe, D. (1997). What Matters Most: Teaching for America’s Future. A Review.
Current Issues in Middle Level Education, 6 (1), 88-92.
California Standards for the Teaching Profession. California.
Georgia Department of Education. Certified Personnel Information (CPI). 1992-
1996).
Interstate New Teacher Assessment and Support Consortium. (1992). Model
standards of beginning teacher licensing and development: A resource for state dialogue.
Washington, DC.: Council of Chief State School Officers.
Little, J. W. (1989). District policy choices and teachers’ professional development
opportunities. Education Evaluation and Policy Analysis, 11(2), 165-179.
Moir, E. and Stobbe, C. (1995, Fall). Professional growth for new teachers: Support
and assessment through collegial partnerships. Teacher Education Quarterly, 83-91.
National Commission on Teaching and America’s Future (1996). What matters most:
Teaching for America’s future. Summary Report. New York, NY: Columbia University.
National Education Goals Panel (1994). Goals Report: Data Volume for the national
education. Vol. 1: National Data. Washington, D. C.: U. S. Government Printing Office.
Shulman, L. S. (1986). Those who understand: Knowledge growth in teaching.
Educational Researcher, 15(2), 4-14.
Shulman, L. S. (1989). The paradox of teacher assessment. New Directions for
Teacher Assessment: Forty-ninth ETS Invitational Conference Proceedings, pp. 13-27.
Princeton, NJ: Educational Testing Service.
Torrey, M. (1997). Georgia Professional Standards Commission Strategic Plan, July
1997, pp. 1- 12.

32
APPENDIX A
33
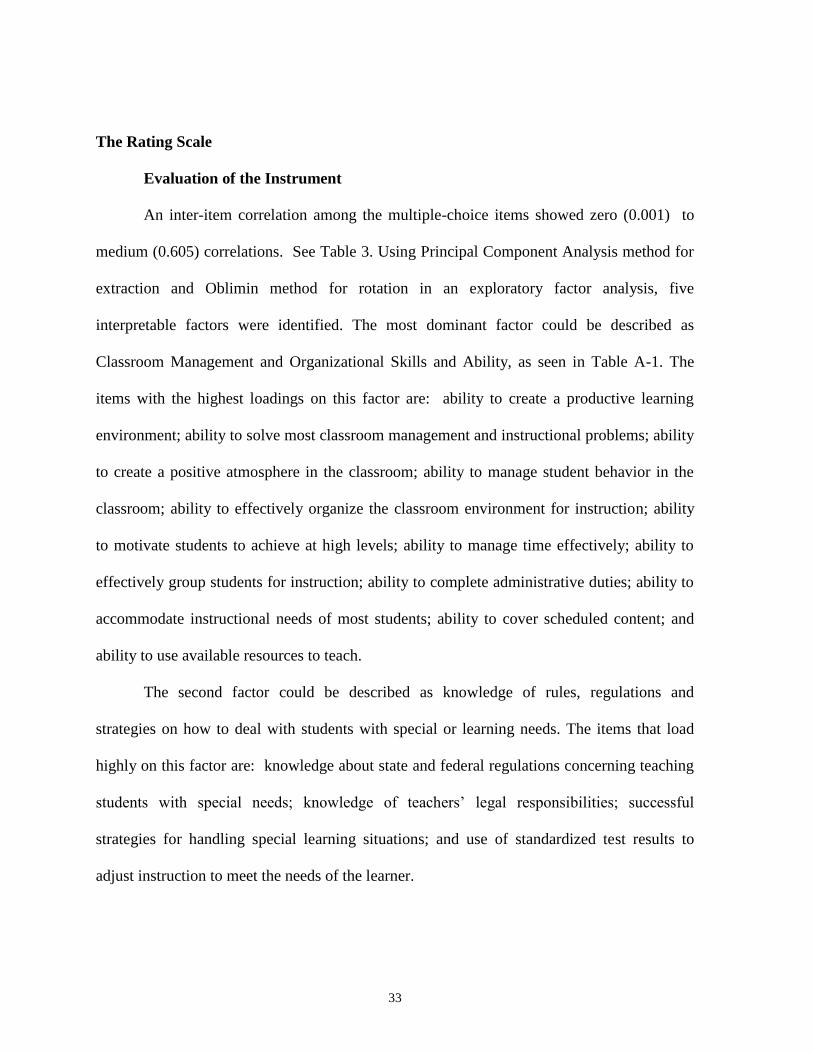
The Rating Scale
Evaluation of the Instrument
An inter-item correlation among the multiple-choice items showed zero (0.001) to
medium (0.605) correlations. See Table 3. Using Principal Component Analysis method for
extraction and Oblimin method for rotation in an exploratory factor analysis, five
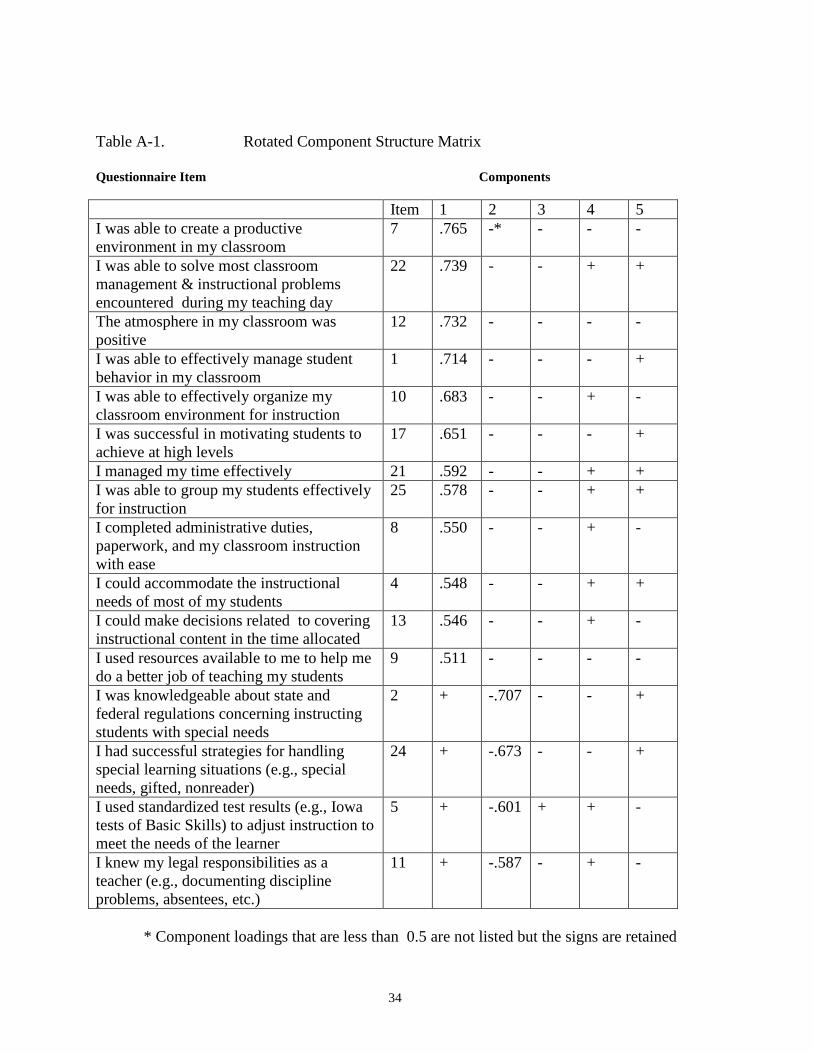
interpretable factors were identified. The most dominant factor could be described as
Classroom Management and Organizational Skills and Ability, as seen in Table A-1. The
items with the highest loadings on this factor are: ability to create a productive learning
environment; ability to solve most classroom management and instructional problems; ability
to create a positive atmosphere in the classroom; ability to manage student behavior in the
classroom; ability to effectively organize the classroom environment for instruction; ability
to motivate students to achieve at high levels; ability to manage time effectively; ability to
effectively group students for instruction; ability to complete administrative duties; ability to
accommodate instructional needs of most students; ability to cover scheduled content; and
ability to use available resources to teach.
The second factor could be described as knowledge of rules, regulations and
strategies on how to deal with students with special or learning needs. The items that load
highly on this factor are: knowledge about state and federal regulations concerning teaching
students with special needs; knowledge of teachers’ legal responsibilities; successful
strategies for handling special learning situations; and use of standardized test results to
adjust instruction to meet the needs of the learner.
34
Table A-1. Rotated Component Structure Matrix
Questionnaire Item Components
Item 1 2 3 4 5
I was able to create a productive
environment in my classroom
7 .765 -* - - -
I was able to solve most classroom
management & instructional problems
encountered during my teaching day
22 .739 - - + +
The atmosphere in my classroom was
positive
12 .732 - - - -
I was able to effectively manage student
behavior in my classroom
1 .714 - - - +
I was able to effectively organize my
classroom environment for instruction
10 .683 - - + -
I was successful in motivating students to
achieve at high levels
17 .651 - - - +
I managed my time effectively 21 .592 - - + +
I was able to group my students effectively
for instruction
25 .578 - - + +
I completed administrative duties,
paperwork, and my classroom instruction
with ease
8 .550 - - + -
I could accommodate the instructional
needs of most of my students
4 .548 - - + +
I could make decisions related to covering
instructional content in the time allocated
13 .546 - - + -
I used resources available to me to help me
do a better job of teaching my students
9 .511 - - - -
I was knowledgeable about state and
federal regulations concerning instructing
students with special needs
2 + -.707 - - +
I had successful strategies for handling
special learning situations (e.g., special
needs, gifted, nonreader)
24 + -.673 - - +
I used standardized test results (e.g., Iowa
tests of Basic Skills) to adjust instruction to
meet the needs of the learner
5 + -.601 + + -
I knew my legal responsibilities as a
teacher (e.g., documenting discipline
problems, absentees, etc.)
11 + -.587 - + -
* Component loadings that are less than 0.5 are not listed but the signs are retained
35
Table A-1. Contd. Rotated Component Structure Matrix
Questionnaire Item Components
Item 1 2 3 4 5
I was not sure how to combine homework,
quizzes, projects, etc., into a grade that
reflected student performance
19 - + .706 + +
I was not sure how to plan units of
instruction
3 - + .589 + +
I knew the content for the subject area(s) I
was assigned to teach
20 + - -.583 + -
I managed my time effectively 21 + - -.566 + +
I could make decisions related to covering
instructional content in the time allocated
13 + - -.552 + -
My teaching was based primarily on the
textbook and teacher’s guide
14 - + + .829 -
I was able to establish a professional,
supportive relationship with the other
teachers at my school
6 + - - + -.649
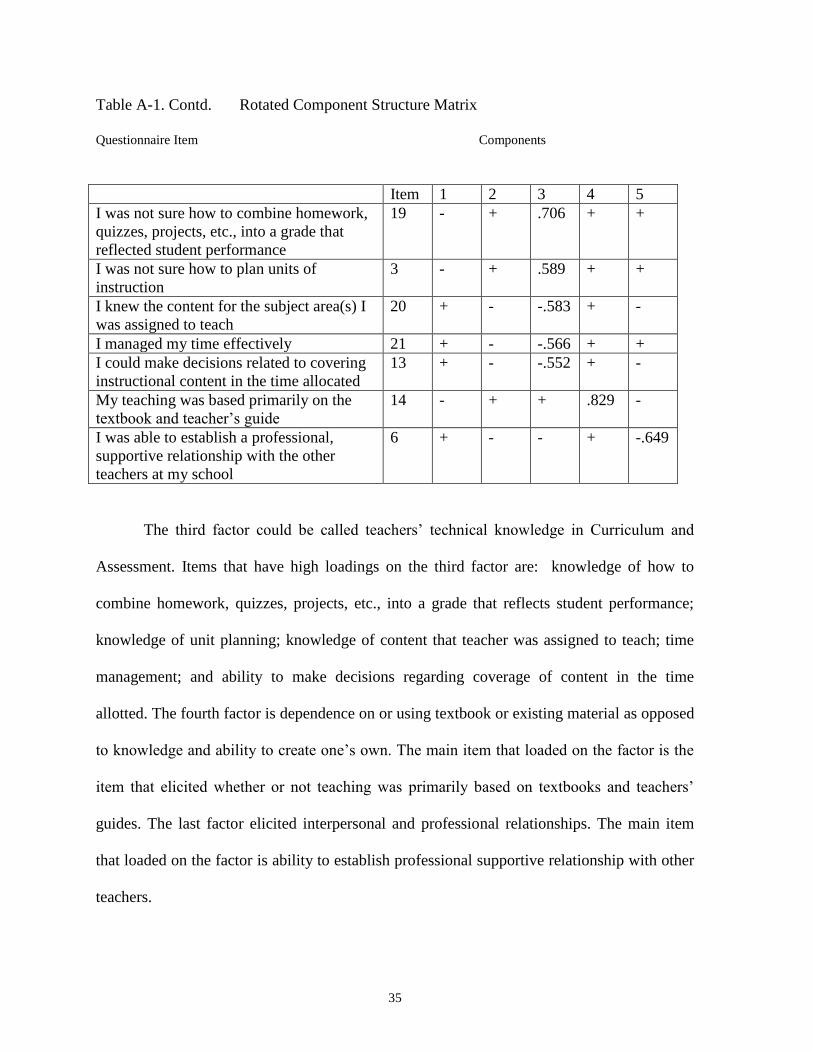
The third factor could be called teachers’ technical knowledge in Curriculum and
Assessment. Items that have high loadings on the third factor are: knowledge of how to
combine homework, quizzes, projects, etc., into a grade that reflects student performance;
knowledge of unit planning; knowledge of content that teacher was assigned to teach; time
management; and ability to make decisions regarding coverage of content in the time
allotted. The fourth factor is dependence on or using textbook or existing material as opposed
to knowledge and ability to create one’s own. The main item that loaded on the factor is the
item that elicited whether or not teaching was primarily based on textbooks and teachers’
guides. The last factor elicited interpersonal and professional relationships. The main item
that loaded on the factor is ability to establish professional supportive relationship with other
teachers.
36
All the factors conceptually appear to be important components of beginning
teachers’ repertoire. However, the critical question is: are the relative weights, as reflected by
the number of items on the questionnaire to measure each appropriate or defensible?
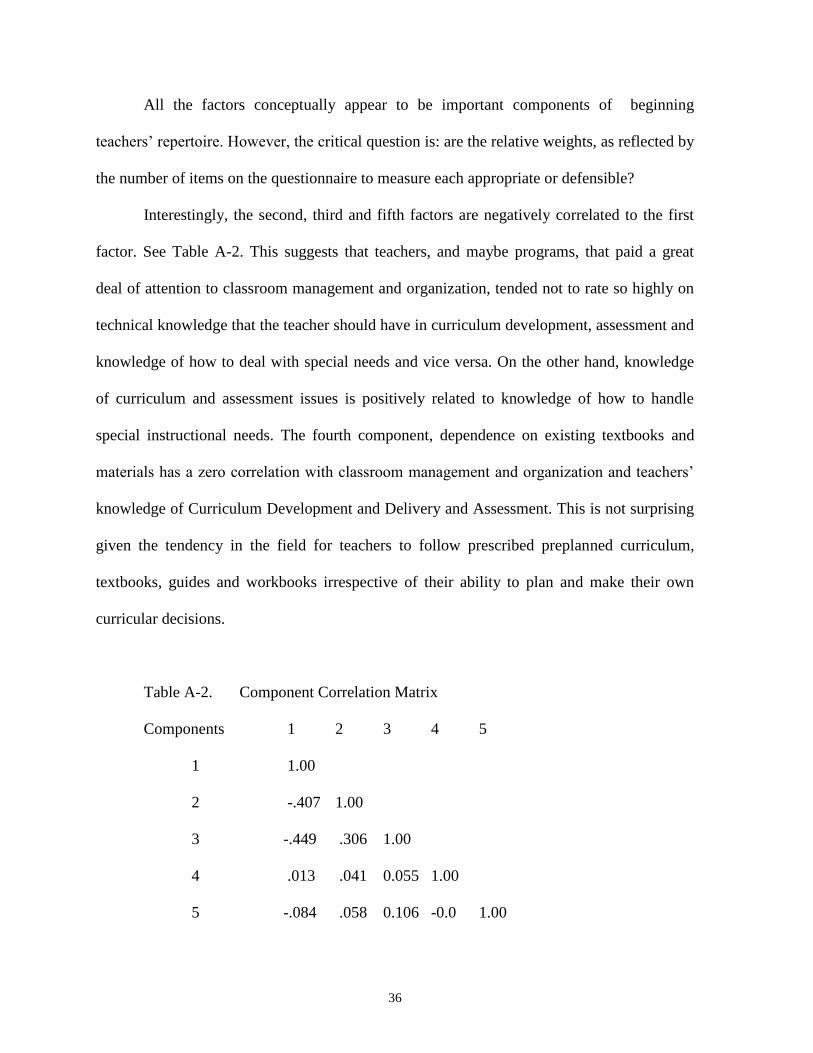
Interestingly, the second, third and fifth factors are negatively correlated to the first
factor. See Table A-2. This suggests that teachers, and maybe programs, that paid a great
deal of attention to classroom management and organization, tended not to rate so highly on
technical knowledge that the teacher should have in curriculum development, assessment and
knowledge of how to deal with special needs and vice versa. On the other hand, knowledge
of curriculum and assessment issues is positively related to knowledge of how to handle
special instructional needs. The fourth component, dependence on existing textbooks and
materials has a zero correlation with classroom management and organization and teachers’
knowledge of Curriculum Development and Delivery and Assessment. This is not surprising
given the tendency in the field for teachers to follow prescribed preplanned curriculum,
textbooks, guides and workbooks irrespective of their ability to plan and make their own
curricular decisions.
Table A-2. Component Correlation Matrix
Components 1 2 3 4 5
1 1.00
2 -.407 1.00
3 -.449 .306 1.00
4 .013 .041 0.055 1.00
5 -.084 .058 0.106 -0.0 1.00
37
Noteworthy too is the fact that the five main factors extracted account for less than
48% of the variance in the items. This suggests that many items are measuring many
disparate variables/concepts. This is not surprising given the zero to medium correlation
observed among the items.
A stepwise multiple regression analysis was performed to see which variables best
predicted overall classroom readiness. Seventeen of the 25 items were included in a final
regression model that accounted for 47.8% (R= 0.692) of the variance in overall readiness.
The following variables were excluded: ability to communicate with parent, covering
instructional content in the time allocated, ability to integrate technology into instruction,
ability to establish a professional and supportive relationship with other teachers, ability to
use resources available to teach better, ability to use results of standardized tests to adjust
instruction to meet students’ needs, motivating students to achieve high standards, and basing
teaching on textbook and teachers’ guides. Covering instructional content in time allocated
was excluded because it is related (r = .418) to ability to manage time which was included
already. Similarly, motivating students to achieve high standards was excluded because it is
related to ability to create a productive learning environment (r = .438) which was already
included in the regression model. In other words these two items did not contribute much
unique variance towards overall classroom readiness beyond that contributed by time
management and creating a productive environment.
The exclusion of the rest of the listed variables is bothersome because it raises
questions as to what beginning teachers define or understand as readiness for the classroom.
Given correlation of 0.05 to 0.329 between the excluded variables and overall readiness,
beginning teachers appear not to consider ability to integrate technology into one’s
38
instruction, ability to communicate with parents, good professional and supportive
relationships with other teachers or being able to use results of standardized tests to adjust
instructions very relevant to classroom readiness. Interestingly, inter-correlation coefficients
among the variables are higher when principals’ responses are used than when teachers
responses are used. For example, using teachers’ rating, correlation coefficients between
overall classroom readiness and the other 25 items on the rating scale range from –0.05
(teaching is based on textbook or teachers’ guides) to 0.509 (ability to solve classroom
problems). On the other hand, using principals’ ratings the coefficients go from -0.235
(teaching is based on textbook and teacher guides) to 0.705 between overall readiness and
ability to manage student behavior in the classroom and the ability to create a productive
learning environment in the classroom. Also a factor analysis on principals’ responses
extracted three factors which accounted for 54.7% of the variance in the rating items.

39
THIS IS THE END OF THIS DOCUMENT
40
Table 3. Inter-correlations among the multiple choice questions on Teacher Questionnaire
1 2 3 4 5 6 7 8 9 10 11
12 13 14 15 16 17
1. ADMNDUTY 1.000 2. ASSTMONT .287 1.000
3. COMBGRDE -.273 -.296 1.000
4. COMMPRNT -.159 -.190 .251 1.000 5. CLASSORG .409 .313 -.275 -.189 1.000 .
6. CLSREADY .403 .416 -.329 -.209 .464 1.000 .
7. CONTKNWL .235 .240 -.253 -.140 .233 .309 1.000 . 8. COVMATRL .390 .370 -.316 -.204 .367 .404 .276 1.000 .
9. INSTRGRP .308 .333 -.239 -.175 .364 .394 .217 .325 1.000 .
10. INSTRND 326 .331 -.262 -.155 .374 .406 .277 .373 .349 1.000
11. INTGTECH .208 .256 -.203 -.150 .242 .256 .124 .228 .241 .236 1.000
12. LGALRESP .360 .279 -.281 -.184 .352 .369 .224 .327 .272 .266 .215
1.000 13. LNGENVT .412 .341 -.263 -.222 .564 .490 .246 .390 .364 .397 .231
.315 1.000
14. PLANUNIT -.203 -.204 .293 .172 -.242 -.272 -.198 -.218 -.162 -.245 -.149 -.185 -.236 1.000
15. POSATMOS .364 .333 -.241 -.222 .493 .488 .252 .388 .342 .347 .236 .366 .605 -.216 1.000
16. PROFSUPT .255 .196 -.163 -.157 .273 .264 .179 .231 .188 .220 .165
.235 .389 -.176 .316 1.000 17. REGUSPND .159 .194 -.151 -.123 .149 .232 .128 .143 .174 .176 .172
.352 .154 -.107 .172 .099 1.000
18. RESUSAGE .356 .357 -.224 -.186 .434 .360 .232 .368 .292 .344 .273 .330 .408 -.208 .398 .271 .172
19. SLVPROBLM .368 .354 -.284 -.208 .417 .509 .258 .401 .373 .365 .218
.306 .465 -.178 .485 .242 .146 20. STDTEST .165 .173 -.083 -.088 .194 .186 .056 .129 .200 .135 .144
.185 .160 -.106 .148 .091 .177
21. STRTGYND .286 .370 -.231 -.165 .282 .371 .157 .294 .396 .313 .241 .299 .315 -.143 .293 .149 .363
22. STUBEHAV .289 .267 -.199 -.183 .396 .472 .153 .281 .316 .287 .165
.256 .483 -.156 .456 .202 .164 23. STUDMOTV .329 .360 -.224 -.190 .376 .406 .231 .342 .389 .356 .247
.238 .438 -.174 .417 .193 .146
24. TIMEMGT .465 .324 -.331 -.177 .424 .445 .314 .418 .322 .364 .185 .309 .400 -.241 .370 .198 .155
25. TXTBASED .013 -.055 .014 .047 -.025 -.050 -.002 .028 -.038 -.042 -.046
-.001 -.048 .028 -.047 .044 -.079 26. WIDRNGND -.239 -.240 .274 .171 -.223 -.304 -.182 -.236 -.272 -.274 -.157
-.212 -.232 .189 -.218 -.092 -.193
18 19 20 21 22 23 24 25 26
18. RESUSAGE 1.000
19. SLVPROBLM. 328 1.000
20. STDTEST .168 .121 1.000
21. STRTGYND .288 .317 .244 1.000 22. STUBEHAV .242 .525 .162 .302 1.000
23. STUDMOTV .325 .379 .177 .366 .371 1.000
24. TIMEMGT .368 .449 .147 .297 .310 .354 1.000 25. TXTBASED -.058 -.011 .035 -.097 -.035 -.063 -.037 1.000
26. WIDRNGN -.186 -.268 -.064 -.260 -.247 -.249 -.255 .067 1.000
41
18 19 20 21 22 23 24 25 26
RESUSAGE 1.000
SLVPROBLM. 328 1.000 STDTEST .168 .121 1.000
STRTGYND .288 .317 .244 1.000
STUBEHAV .242 .525 .162 .302 1.000 STUDMOTV .325 .379 .177 .366 .371 1.000
TIMEMGT .368 .449 .147 .297 .310 .354 1.000
TXTBASED -.058 -.011 .035 -.097 -.035 -.063 -.037 1.000 WIDRNGN -.186 -.268 -.064 -.260 -.247 -.249 -.255 .067 1.000
42
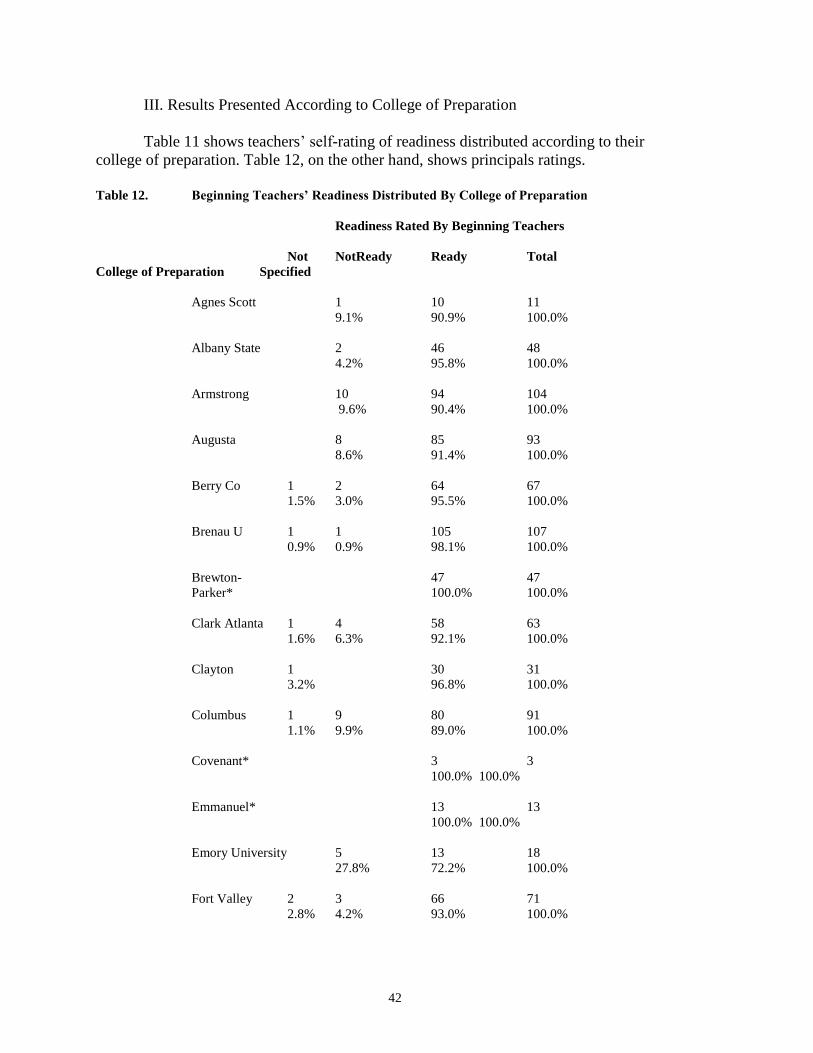
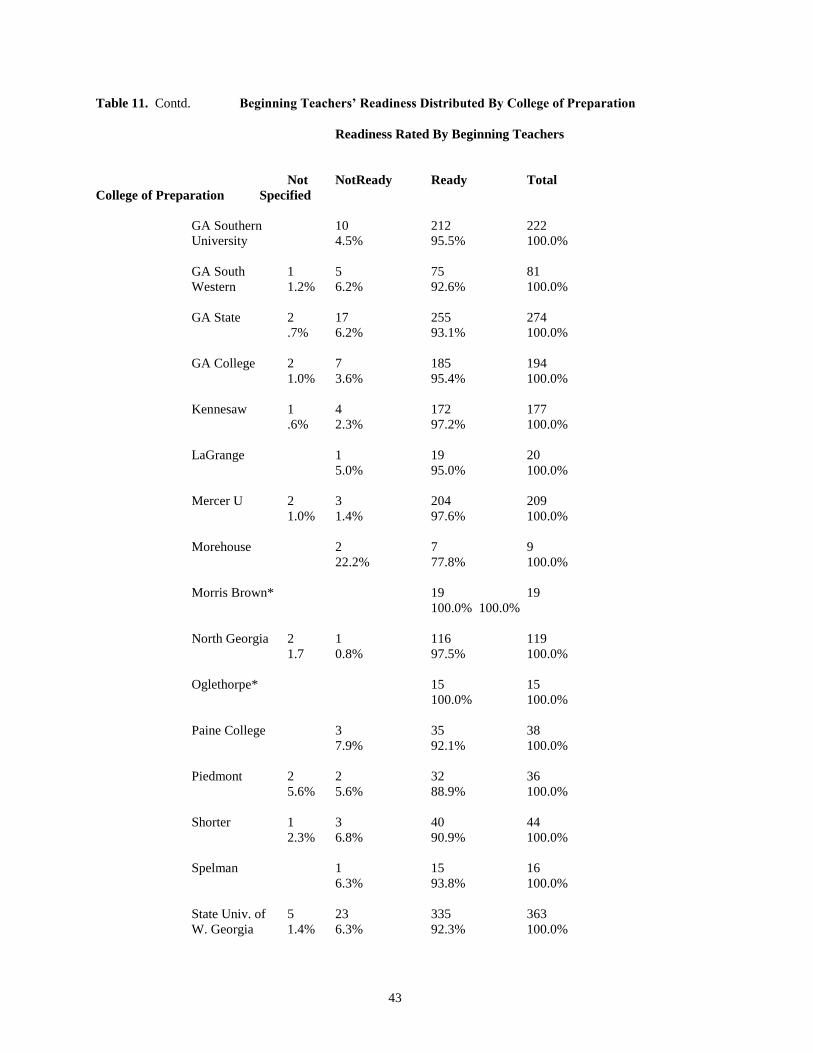
III. Results Presented According to College of Preparation
Table 11 shows teachers’ self-rating of readiness distributed according to their
college of preparation. Table 12, on the other hand, shows principals ratings.
Table 12. Beginning Teachers’ Readiness Distributed By College of Preparation
Readiness Rated By Beginning Teachers
Not NotReady Ready Total
College of Preparation Specified
Agnes Scott 1 10 11
9.1% 90.9% 100.0%
Albany State 2 46 48
4.2% 95.8% 100.0%
Armstrong 10 94 104
9.6% 90.4% 100.0%
Augusta 8 85 93
8.6% 91.4% 100.0%
Berry Co 1 2 64 67
1.5% 3.0% 95.5% 100.0%
Brenau U 1 1 105 107
0.9% 0.9% 98.1% 100.0%
Brewton- 47 47
Parker* 100.0% 100.0%
Clark Atlanta 1 4 58 63
1.6% 6.3% 92.1% 100.0%
Clayton 1 30 31
3.2% 96.8% 100.0%
Columbus 1 9 80 91
1.1% 9.9% 89.0% 100.0%
Covenant* 3 3
100.0% 100.0%
Emmanuel* 13 13
100.0% 100.0%
Emory University 5 13 18
27.8% 72.2% 100.0%
Fort Valley 2 3 66 71
2.8% 4.2% 93.0% 100.0%
43
Table 11. Contd. Beginning Teachers’ Readiness Distributed By College of Preparation
Readiness Rated By Beginning Teachers
Not NotReady Ready Total
College of Preparation Specified
GA Southern 10 212 222
University 4.5% 95.5% 100.0%
GA South 1 5 75 81
Western 1.2% 6.2% 92.6% 100.0%
GA State 2 17 255 274
.7% 6.2% 93.1% 100.0%
GA College 2 7 185 194
1.0% 3.6% 95.4% 100.0%
Kennesaw 1 4 172 177
.6% 2.3% 97.2% 100.0%
LaGrange 1 19 20
5.0% 95.0% 100.0%
Mercer U 2 3 204 209
1.0% 1.4% 97.6% 100.0%
Morehouse 2 7 9
22.2% 77.8% 100.0%
Morris Brown* 19 19
100.0% 100.0%
North Georgia 2 1 116 119
1.7 0.8% 97.5% 100.0%
Oglethorpe* 15 15
100.0% 100.0%
Paine College 3 35 38
7.9% 92.1% 100.0%
Piedmont 2 2 32 36
5.6% 5.6% 88.9% 100.0%
Shorter 1 3 40 44
2.3% 6.8% 90.9% 100.0%
Spelman 1 15 16
6.3% 93.8% 100.0%
State Univ. of 5 23 335 363
W. Georgia 1.4% 6.3% 92.3% 100.0%
44
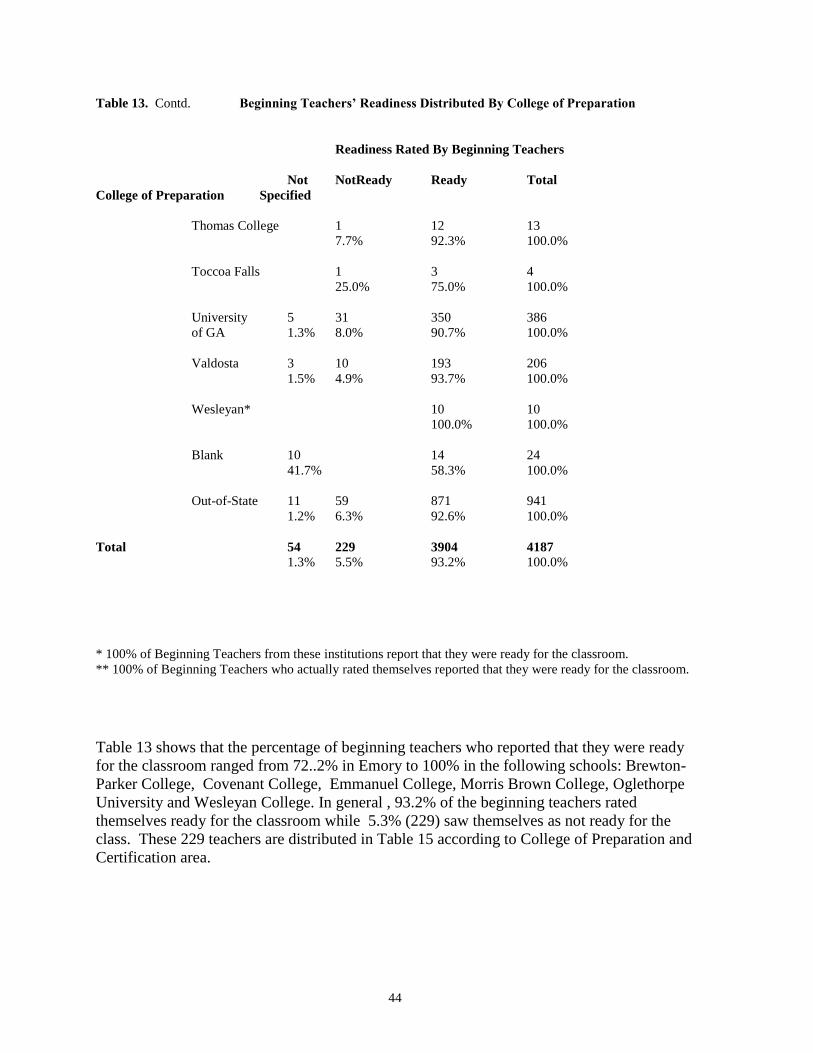
Table 13. Contd. Beginning Teachers’ Readiness Distributed By College of Preparation
Readiness Rated By Beginning Teachers
Not NotReady Ready Total
College of Preparation Specified
Thomas College 1 12 13
7.7% 92.3% 100.0%
Toccoa Falls 1 3 4
25.0% 75.0% 100.0%
University 5 31 350 386
of GA 1.3% 8.0% 90.7% 100.0%
Valdosta 3 10 193 206
1.5% 4.9% 93.7% 100.0%
Wesleyan* 10 10
100.0% 100.0%
Blank 10 14 24
41.7% 58.3% 100.0%
Out-of-State 11 59 871 941
1.2% 6.3% 92.6% 100.0%
Total 54 229 3904 4187 1.3% 5.5% 93.2% 100.0%
* 100% of Beginning Teachers from these institutions report that they were ready for the classroom.
** 100% of Beginning Teachers who actually rated themselves reported that they were ready for the classroom.
Table 13 shows that the percentage of beginning teachers who reported that they were ready
for the classroom ranged from 72..2% in Emory to 100% in the following schools: Brewton-
Parker College, Covenant College, Emmanuel College, Morris Brown College, Oglethorpe
University and Wesleyan College. In general , 93.2% of the beginning teachers rated
themselves ready for the classroom while 5.3% (229) saw themselves as not ready for the
class. These 229 teachers are distributed in Table 15 according to College of Preparation and
Certification area.
45
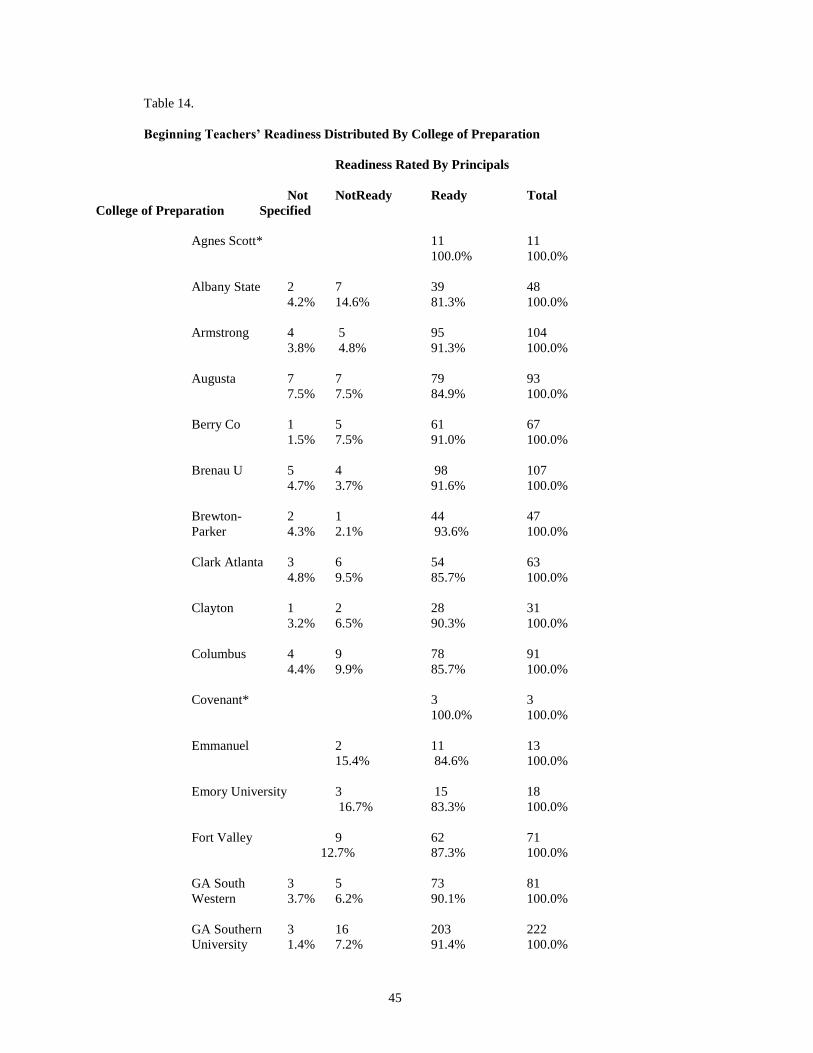
Table 14.
Beginning Teachers’ Readiness Distributed By College of Preparation
Readiness Rated By Principals
Not NotReady Ready Total
College of Preparation Specified
Agnes Scott* 11 11
100.0% 100.0%
Albany State 2 7 39 48
4.2% 14.6% 81.3% 100.0%
Armstrong 4 5 95 104
3.8% 4.8% 91.3% 100.0%
Augusta 7 7 79 93
7.5% 7.5% 84.9% 100.0%
Berry Co 1 5 61 67
1.5% 7.5% 91.0% 100.0%
Brenau U 5 4 98 107
4.7% 3.7% 91.6% 100.0%
Brewton- 2 1 44 47
Parker 4.3% 2.1% 93.6% 100.0%
Clark Atlanta 3 6 54 63
4.8% 9.5% 85.7% 100.0%
Clayton 1 2 28 31
3.2% 6.5% 90.3% 100.0%
Columbus 4 9 78 91
4.4% 9.9% 85.7% 100.0%
Covenant* 3 3
100.0% 100.0%
Emmanuel 2 11 13
15.4% 84.6% 100.0%
Emory University 3 15 18
16.7% 83.3% 100.0%
Fort Valley 9 62 71
12.7% 87.3% 100.0%
GA South 3 5 73 81
Western 3.7% 6.2% 90.1% 100.0%
GA Southern 3 16 203 222
University 1.4% 7.2% 91.4% 100.0%
46
Table 14. Contd.
Beginning Teachers’ Readiness Distributed By College of Preparation
Readiness Rated By Principals
Not NotReady Ready Total
College of Preparation Specified
GA State 20 23 231 274
7.3% 8.4% 84.3% 100.0%
GA College 6 5 183 194
3.1% 2.6% 94.3% 100.0%
Kennesaw 9 12 156 177
5.1% 6.8% 88.1% 100.0%
LaGrange** 1 19 20
5.0% 95.0% 100.0%
Mercer U 10 8 191 209
4.8% 3.8% 91.4% 100.0%
Morehouse 1 2 6 9
11.1% 22.2% 66.7% 100.0%
Morris Brown ** 2 17 19
10.5% 89.5% 100.0%
North Georgia 5 7 107 119
4.2 5.9% 89.9% 100.0%
Oglethorpe ** 2 13 15
13.3% 86.7% 100.0%
Paine College 1 7 30 38
2.6% 18.4% 78.9% 100.0%
Piedmont** 2 34 36
5.6% 94.4% 100.0%
Shorter 2 3 39 44
4.5% 6.8% 88.6% 100.0%
Spelman 3 1 12 16
18.8% 6.3% 75.0% 100.0%
State Univ. of 13 28 322 363
W. Georgia 3.6% 7.7% 88.7% 100.0%
Thomas College* 13 13
100.0% 100.0%
Toccoa Falls* 4 4
100.0% 100.0%
47
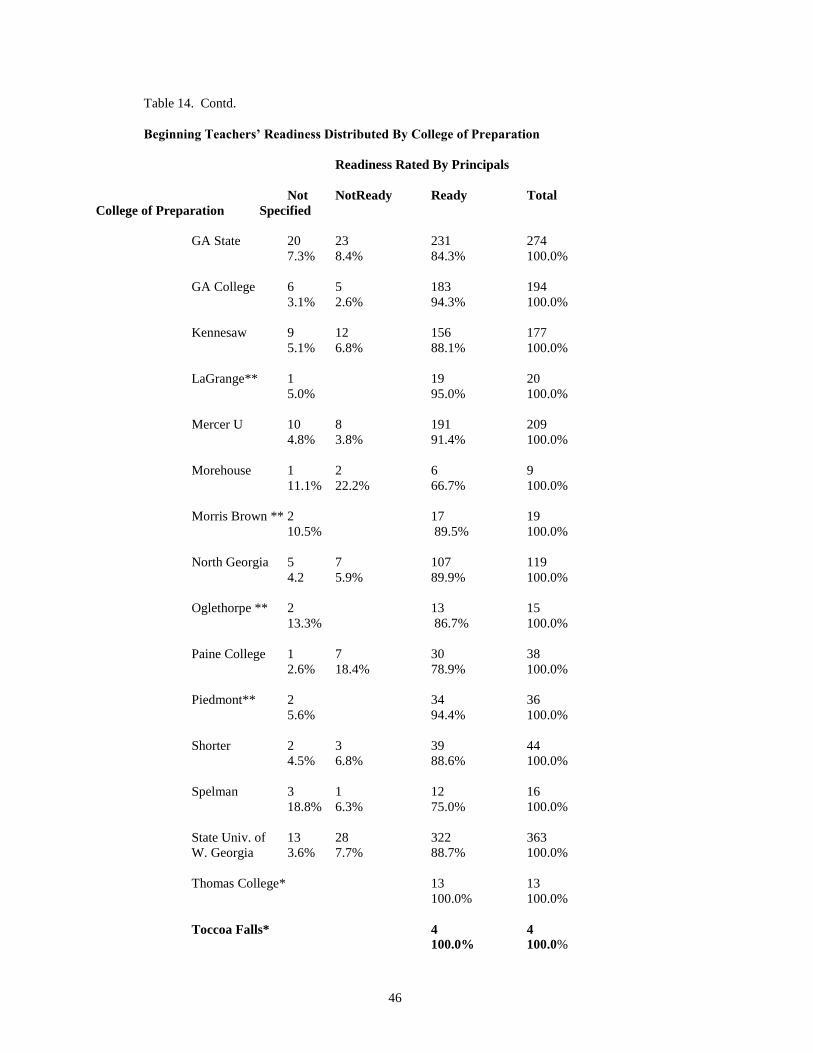
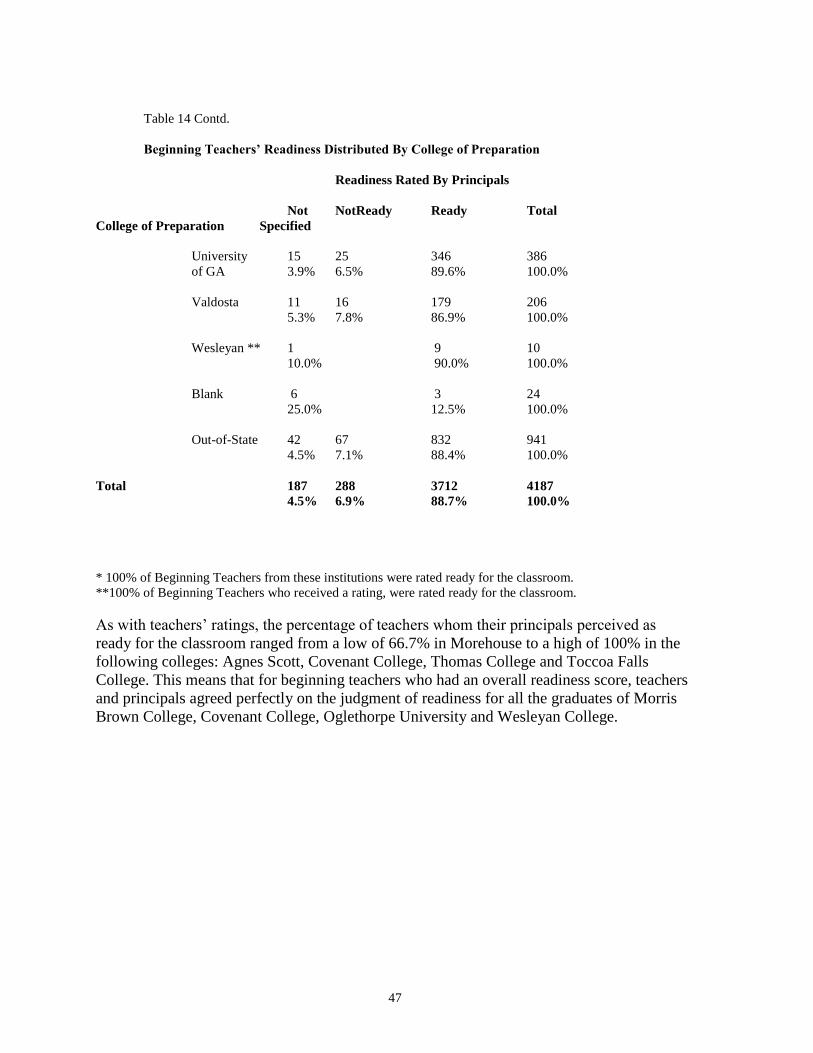
Table 14 Contd.
Beginning Teachers’ Readiness Distributed By College of Preparation
Readiness Rated By Principals
Not NotReady Ready Total
College of Preparation Specified
University 15 25 346 386
of GA 3.9% 6.5% 89.6% 100.0%
Valdosta 11 16 179 206
5.3% 7.8% 86.9% 100.0%
Wesleyan ** 1 9 10
10.0% 90.0% 100.0%
Blank 6 3 24
25.0% 12.5% 100.0%
Out-of-State 42 67 832 941
4.5% 7.1% 88.4% 100.0%
Total 187 288 3712 4187
4.5% 6.9% 88.7% 100.0%
* 100% of Beginning Teachers from these institutions were rated ready for the classroom.
**100% of Beginning Teachers who received a rating, were rated ready for the classroom.
As with teachers’ ratings, the percentage of teachers whom their principals perceived as
ready for the classroom ranged from a low of 66.7% in Morehouse to a high of 100% in the
following colleges: Agnes Scott, Covenant College, Thomas College and Toccoa Falls
College. This means that for beginning teachers who had an overall readiness score, teachers
and principals agreed perfectly on the judgment of readiness for all the graduates of Morris
Brown College, Covenant College, Oglethorpe University and Wesleyan College.
48
Recommendations
The recommendations in this section will facilitate future data collection endeavors
that involve the school systems by reducing the cost in time and money and by allowing
easier cross-referencing with existing databases and more analyses and use of data. It is, thus,
recommended that
1. questionnaires be printed in a format that can be easily scanned or alternatively
that data be collected electronically;
2. respondents’ demographics, e.g. Full Social Security Number, System Code, be
requested on the questionnaire;
3. the PSC considers including identifiers for different teacher preparation routes in
its certification database. This will permit comparisons among teachers who were
prepared in the traditional teacher education programs and others prepared in any
of the alternative routes to certification.