Embed Size (px)
Citation preview

1997 SOFTWARE BEST PRACTICE SURVEY:ANALYSIS OF RESULTS
by
S. DurrA*A. KAM**
M. LEE -and
L. VAN WASSENHOVE *
98/35/T M/RISE
* Associate Professor of Information Systems, at INSEAD, Boulevard de Constance, 77305 FontainebleauCedex, France.
** Research Associate of Research Initiative in Software Excellence (RISE), at INSEAD, Boulevard deConstance, 77305 Fontainebleau Cedex, France.
1 Program Manager of Research Initiative in Software Excellence (RISE), at INSEAD, Boulevard deConstance, 77305 Fontainebleau Cedex, France
The John H. Loudon Professor of International Management and Professor of Operations Managementand Operations Research.
A working paper in the INSEAD Working Paper Series is intended as a means whereby a faculty researcher'sthoughts and findings may be communicated to interested readers. The paper should be considered preliminaryin nature and may require revision.
Printed at INSEAD, Fontainebleau, France.

-1111111111111.111111NISTO •
Software Best Practice Questionnaire - Analysis of Results
1997 Software Best Practice Survey : Analysis of ResultsSoumitra Dutta, Abhijit Katti, Michael Lee and Luk Van Wassenhove'
Research Initiative in Software Excellence (RISE)INSEAD
Blvd De ConstanceFontainebleau, France 77305
Working Paper no.
1
1 Author names are listed in alphabetical order.Soumitra Dutta is Associate Professor at INSEAD. His email address is: [email protected] Katti is Research Associate of Research Initiative in Software Excellence (RISE). His email address is:[email protected] Lee is Program Manager of Research Initiative in Software Excellence (RISE). His email address is:[email protected] Van Wassenhove is Professor at INSEAD. His e-mail address is: [email protected]
Executive Summary
The following report presents an analysis of the responses to the Software Best PracticeQuestionnaire (SBPQ) which was filled by organizations submitting project proposals to theEuropean Commission during the ESSI call in 1997. In an effort to avoid overestimation of bestpractice adoption within organizations, the evaluation of the questionnaire responses was clearlymentioned as being distinct from and having no effect on the assessment of the project proposal. Atotal of 394 valid responses were obtained from 20 different countries and 37 different sectors.
The aim of the SBPQ was to collect data on widely recognized software management best practiceswithin European organizations. The SBPQ was designed such that each question addressed aparticular best practice. The questionnaire had 42 questions divided into five sections:Organizational Issues, Standards and Procedures, Metrics, Control of the Development Process, andTools and Technology. It should be noted that the structure of the questionnaire (only yes-noanswers) and the fact that it accompanied an EC Call for Proposals could have led respondents toportray optimistic results.
The data collected has been analyzed for overall adoption levels of best practices and their variationacross the sectors and countries surveyed. The analysis of the data has yielded many interestingresults. The overall adoption level, across all sections of the SBPQ, yielded a mean of 51% for allcompanies surveyed, with a standard deviation of 21%. This implies that 68% of the companiessurveyed have adoption levels between 30% and 72%. It also indicates that there is significantvariation among adoption rates of individual respondents. The mean adoption levels are much higherthough, on some sections of the SBPQ such as Organizational Issues and Control of theDevelopment Process. Hence, we can assume that some critical best practices receive more attentionand subsequent adoption than others do.
The levels of best practice adoption show significant variation across the countries surveyed. Forexample, the overall adoption levels vary from 65% for France to 32% for Sweden. The adoptiontrends, in terms of the sets of leading and lagging countries, are quite uniform across the sections ofthe SBPQ. France and UK have the highest adoption rates in all sections while Sweden and Belgiumhave the lowest. These wide variations and the generally low adoption levels on some sectionsindicate that there is significant room for improvement, especially in some countries. In general, allthe countries would stand to benefit from enhanced collaborative improvement i.e. sharingknowledge of adoption and transfer of best practices between countries.
Sector-wide variation in best practice adoption rates is also significant. The Aircraft and Spacecraftsector exhibits the best adoption rates among all sectors followed closely by Finance and Insuranceand Telecom Products. The Mechanical Engineering and Business and Management Consultingsectors exhibit the lowest adoption levels. This further implies that the adoption rate is sectordependent and governed by the practices prevalent in the sector under consideration.
16/04/1998 3

1997 Software Best Practice Survey : Analysis of Results
Abstract
In this report, we identify recent trends in software practices across European companies. Theresults are based on an analysis of responses to the 1997 Software Best Practice Questionnaireadministered by the European Commission. Data from these companies was collected inresponse to the ES SI call for proposals during 1997. The overall adoption levels of all bestpractices is just over 50% with a standard deviation of 21%. However, adoption levels ofpractices relating to organizational and process development control were much higher than theoverall mean. The analysis also shows significant variations in the adoption of best practicesacross country and sector. In particular, we observe that France and the UK have the highestoverall adoption rates while Sweden and Belgium report the lowest. By sector, the Aircraft andSpacecraft sector leads in the adoption rates of best practices with the Mechanical Engineeringand Business Management and Consulting sectors showing among the lowest adoption rates.
Introduction
This report presents an analysis of the data gathered through the Software Best PracticeQuestionnaire (SBPQ) enclosed with the project proposals submitted to the European Commissionin response to the ESSI Call for Proposals during 1997. The questionnaire is divided into two parts:
(A) General Information
(B) Section 1 - Organizational Issues (8 questions)Section 2 - Standards and Procedures (13 questions)Section 3 - Metrics (8 questions)Section 4 - Control of the Development Process (6 questions)Section 5 - Tools and Technology (7 questions)
II ..,:.,.. ... ....... . .. .rJ
v
I • rJrlig
t . ::::;:;i;::;:::.;:::.;I NW:- • F-;
-0r ..;::; .f.,:f.if:ff::;:;:,:::;*;::::.::::1.4. :O.,.
I • :ivy • g r• .-.,: •::- • ye:e.:::.:, 3". ,..
i :,...e .:::, ' . :.:iki:• 0 • :::. • =5'; I e::::::' 1.:-*:: g :g.:::.I ......: q V<5.5,3,..
:.....9,'3%,
.%,. ,,.9%,.:. .....
:+........f !..t:1::::. -.:* $'5..f;: ir ,.. ..?..
:#1 ..:gi.4... .V/eV... ,..:•.:
,:%:,..,7.,{,V..
0..
:X:"• ,f.,:.^:",i'47, .7,:::*
1 1:1:1 "Iv •• :, •
, 4/. •:,.. .:4, bY. eV .e.V..... 7.•*.. eV. :;.•:::1 il.%;:'. ;:. M•..", • .:," • v • .**M ,S"."5 E g■:•?.%S::EVE4S'
:FiX. .% :Per .V.• - ..:::. .,
..1 . M V .
Figure 1: Number of valid responses by country
LEGENDA - Austria E - Spain ISR - Israel S - SwedenB - Belgium F - France IRL - Ireland SF - FinlandD - Germany GR - Greece N - Norway UK - United KingdomDK - Denmark I - Italy NL - Netherlands
16/04/1998 4

The questions in part (B) require a response of the form "Yes" or "No". For example, one of thequestions in Section 1 is "Does each software project have a nominated software project manager?".Some questions also have a "Not Applicable" response category.
Responses were received from companies in 37 sectors and 20 European countries. Of the responsesreceived, 394 were found to be valid.
Among countries, the largest number of responses was received from Italy, Germany and UK.Figure 1 gives a distribution of responses by country. Countries from which less than 4 responseswere received, including Iceland, Luxemburg, Liechtenstein, Portugal and Switzerland, wereexcluded from the country analysis.
Among sectors, the largest number of responses was received from the Software Consultancy andSupply, Industrial Process Control Systems and Telecom Products sectors. Sectors with less than 8responses have been excluded from further analysis, the prominent among which are Health andSocial Work, Electrical Engineering and related Technical Consultancy, and Medical, Precisionand Optical Instruments.
Figure 2: Number of valid responses by sector
AS - Aircraft & Spacecraft
BC - Business, Legal & ManagementConsultancy
EQ - Machinery, Electrical & Electricalinstruments
Definitions and Methodology
LEGENDFI - Finance and Insurance
IE - Electronic Engineering &Technical Consultancy
p - Industrial Process ControlSystems
IS - Software Consultancy andSupply
IT - Telecom Products
ME - Mechanical Engineering &Technical Consultancy
We define a "best practice" as a management practice that is widely recognized as good and that isrecommended by most practitioners and experts in the field. The structure of the questionnaire issuch that each question addresses a specific best practice.
16/04/1998 5

We define the "practice level" for a responding company as the percentage of software bestpractices adopted by (i.e. existing within) that company. We define the "practice level" for a groupof companies - a group being defined with respect to some criterion such as country - as the averageof the practice levels of all companies in that group. We use the terms "practice level" and"adoption level' interchangeably in the rest of this paper.
Each section of the questionnaire is analyzed individually and the following analyses are presented:• An analysis that outlines the overall extent of adoption of the practices in the section• A country-wise analysis focusing on which countries have the highest and lowest practice levels• A sector-wise analysis focusing on which industry sectors have the highest and lowest practice
levels• An analysis of individual practice adoption levels by country and sector
Overall Adoption levels by country and sector
We studied the overall adoption levels, across all sections of the SBPQ for all the companiessurveyed. This yielded a mean adoption level of 51%. The overall adoption level was also studied forits variation by country and industrial sector and the results are shown in Figures 3 and 4.
Among countries France and UK were the top performers with overall adoption levels of 65% and60% respectively. Sweden and Belgium, on the other hand, were the lowest performers withadoption levels of 32% and 43% respectively.
Among sectors, Aerospace was the best performer with an overall adoption level of 60%, followedby Finance and Insurance and Telecom Products with 56%. The lower end of the adoptionspectrum was brought up by Mechanical Engineering at 36%, Industrial Process Control Systemsat 43%, and Business and Management Consulting at 44%. The sector with the largest number ofresponses, Software Consultancy and Supply exhibited median performance with a 53% adoptionlevel.
Figure 3: Overall adoption levels by country
16/04/1998 6

LEGENDA - Austria E - Spain ISR - Israel S - SwedenB - Belgium F - France IRL - Ireland SF - FinlandD - Germany GR - Greece N - Norway UK - United KingdomDK - Denmark I - Italy NL - Netherlands
Figure 4: Overall adoption levels by sector
AS - Aircraft & Spacecraft
BC Business, Legal & ManagementConsultancy
EQ Machinery, Electrical & Electricalinstruments
LEGENDFl - Finance and Insurance
IE - Electronic Engineering &Technical Consultancy
IP - Industrial Process ControlSystems
IS - Software Consultancy andSupply
IT - Telecom Products
ME - Mechanical Engineering &Technical Consultancy
16/04/1998 7

Section 1- Organizational Issues
The first section of the questionnaire deals with organizational issues in software management. Theresults are summarized in Table 1. This section exhibited a mean adoption level of 58% for allcompanies surveyed across all individual organizational issues. Of the companies surveyed, 92%nominated project managers for each project and 81% have the project manager report to a businessproject manager responsible for the overall benefit of the project to the business. However, only48% had a separate quality assurance function. Only 40% of the companies train their softwaremanagers to familiarize them with in-house project management practices. Adequate level ofcustomer and marketing input is ensured by 64% of the companies. Only 41% of the companiesmaintain awareness of the state of the art in CASE or software engineering technology.
Most companies About half of the companies Few companies
• Appoint a projectmanager for eachproject
• Have a separate qualityassurance function
• Have a change control functionfor each project
• Incorporate customer inputthroughout the project
• Ensure availability of non-software resources
•
•
Train all newly appointedmanagers
Maintain awareness of the latestsoftware engineering technology
Table 1: Summary of results for Organizational Issues
Organizational issues - Overall adoption of practice levels by country and sector
The variation in overall organizational best practice adoption levels between countries and sectorscan be seen in Figures 5 and 6.
By country, France leads the pack with an adoption level of 72%, followed by UK with 66% andAustria with 66%. All the other countries lie between 50% and 64%, except Sweden which has thelowest adoption level of 38%.
The differences in the overall adoption levels of sectors are less significant, with most sectorshovering around 60%. Telecom Products and Aircraft and Spacecraft are the highest with practicelevels of 69% and 65% respectively. Mechanical Engineering and Industrial Process ControlSystems cover the lower end of the scale with adoption levels of 44% and 53% respectively.
The smaller variation in adoption levels across sectors would imply that adoption of organizationalbest practices is largely dependent upon the country rather than the industrial sector.
16/04/1998 8

Figure 5: Organizational Issues - Best practice levels by countryLEGEND
A - Austria E - Spain ISR - Israel S - SwedenB - Belgium F - France IRL - Ireland SF - FinlandD - Germany GR - Greece N - Norway UK - United KingdomDK - Denmark I - Italy NL - Netherlands
Figure 6: Organizational Issues - Best practice levels by sector
AS - Aircraft & Spacecraft
BC - Business, Legal & ManagementConsultancy
EQ - Machinery, Electrical & Electricalinstruments
Fl
IE
IP
LEGEND- Finance and Insurance
- Electronic Engineering &Technical Consultancy
- Industrial Process ControlSystems
IS - Software Consultancy andSupply
IT - Telecom Products
ME - Mechanical Engineering &Technical Consultancy
Organizational Issues - Individual practice adoption by country and sector
16/04/1998 9

Table 2 outlines the countries and sectors with high and low adoption levels of variousorganizational practices. Countries and sectors are classified into those having high and lowadoption relative to the average adoption level for the practice under consideration.
While most of the acceptance rates for countries were in line with their overall acceptance rates,there were a few surprises. Ireland, for example, exhibits weakness in maintaining awareness of thestate of the art development tools with an acceptance rate of only 8%. Only 15% of organizations inSweden have an independent Software Quality Assurance function.
While having the best overall organizational best practice adoption levels, the Aircraft andSpacecraft sector nominates a software project manager for only 80% of its projects. MechanicalEngineering companies exhibit particular weakness in most of the best practices, the prominentamong them being: lack of a SQA function, lack of change control, and lack of awareness of thelatest software engineering technology. In spite of its relatively low overall acceptance, theMachinery, Electrical and Electrical Instruments sector performed well in establishing changecontrol functions for projects and in ensuring adequate levels of user/customer/marketing inputsthroughout the project.
Management practice Averageadoption
level
Countrieswith highadoptionMost countries
Countrieswith lowadoptionGR (83%)
Sectorswith highadoptionMost sectors
Sectorswith lowadoptionAS (80%)IE (80%)
Appointing project managers for eachproject
92%
Software quality assurance function 48% SF(75%) S (15%) IT (70%) ME (25%)with independent reporting line F (72%)Establishing a change control function 55% N (83%) Most others EQ (67%) Most others
UK (80%) especially IE (67%) especiallyB (20%) IT (63%) ME (3 8%)
BC (33%)Training new project managers 40% F (67%) S (15%) FI (60%) IE (20%)
A (63%) NL (17%) IP (23%)Maintaining awareness of new 41% DK (53%) IRL (8%) AS (70%) ME (13%)development technologies GR (50%) S (23%) EQ (17%)
SF (25%)Ensuring user input at all stages of 64% GR (83%) S (38%) EQ (75%) BC (44%)the project UK (79%) E (44%)
Table 2: Organizational Issues - Countries and sectors with high and low adoption levels
16/04/1998
10

Section 2 - Standards and Procedures
The second section of the SBPQ deals with software management issues pertaining to the existenceof standardized processes for estimation, coding, quality assurance, etc. The overall results aresummarized in Table 3. This section exhibited a mean adoption level of 51% for all companiessurveyed. The management of 73% of the organizations formally assesses the benefits, viability andrisk of each software project prior to making contractual commitments and about 80% of themconduct periodic reviews to check the status of the project. 46% conduct independent audits in theform of inspections or walkthroughs for each major stage in the development process. Application ofcommon coding standards for all projects is adopted by 75% of the firms. Less than 20% have anydocumented procedures for estimating software size and using productivity metrics. 47% have aformal handover of deliverables between groups, but only 29% formally review the functionality ofthe system which the software replaces. 57% begin test planning prior to programming, 56 %conduct independent testing by users and 60% have a procedure to check that the system passinguser acceptance is the same as that which is implemented for actual operation.
Most companies About half of the companies Few companies
• Assess viability, risks and • Ensure that subcontractors • Have formal methods ofbenefits before committingto a project
follow formal processes estimating software size
• Conduct inspection and • Formally review the• Conduct periodic reviews
of the status of projectswalkthroughs at each stage functionality of the system
the software replaces• Use formal methods to
• Have common codingstandards for projects
estimate schedule and cost
• Have a formal review orhandover of deliverables fromone project group to another
• Plan testing before coding
• Perform independent testing
Table 3: Summary of results for Standards and Procedures
Standards and Procedures - Overall adoption of practice levels by country and sector
The variation in overall adoption levels for standards and procedures between countries and sectorscan be seen in Figures 7 and 8.
France and UK again exhibit the best adoption levels of 62% and 63% respectively. Most of theother countries are within 43% and 60% except Sweden at 36% and Belgium at 41%.
The differences in the overall adoption levels of sectors are just as pronounced with highs of 60%and 59% for Finance and Insurance and Aircraft and Spacecraft respectively, and lows of 39% and32% for Industrial Process Control Systems and Mechanical Engineering.
16/04/1998 11

Figure 7: Standards and Procedures - Best practice levels by country
LEGENDA - Austria E - Spain ISR - Israel S - SwedenB - Belgium F - France MI, - Ireland SF - FinlandD - Germany GR - Greece N - Norway UK - United KingdomDK - Denmark I - Italy NL - Netherlands
Figure 8: Standards and Procedures - Best practice levels by sector
AS - Aircraft & Spacecraft
BC - Business, Legal & ManagementConsultancy
EQ Machinery, Electrical & Electricalinstruments
LEGENDFl - Finance and Insurance
IE Electronic Engineering &Technical Consultancy
IP Industrial Process ControlSystems
IS Software Consultancy andSupply
IT Telecom Products
ME - Mechanical Engineering &Technical Consultancy
16/04/1998 12

Standards and Procedures - Individual practice adoption by country and sector
Table 4 outlines the countries and sectors with high and low adoption levels of various best practiceswithin Standards and Procedures. Countries and sectors are classified into those having high and lowadoption relative to the average adoption level for the practice under consideration. For mostcountries and sectors, the performance on individual questions within a section is in accordance withthe overall score for that section. Some discrepancies are noted as follows.
Israel and Norway exhibit particular weakness in estimating software size and using productivitymeasures with a null adoption. Surprisingly, even the UK scores a low 13% on this aspect. WhileBelgium scores poorly on most other practices, 60% of its systems projects selected fordevelopment support the organization's business objectives.
Among sectors, while Machinery, Electrical and Electrical Instruments is good at formallyassessing risks and viability of projects and formally reviewing functionality of projects, it performspoorly on conducting quality assurance testing and performing independent audits. The MechanicalEngineering sector performs poorly on most counts.
Management practice Averageadoption
level
Countrieswith highadoption
Countries withlow adoption
Sectors withhighadoptionAll except ME,IP and AS
Sectorswith lowadoptionME (50%)IP (59%)AS (60%)
Assessment of risk andviability of projects
73% All exceptIRL and S
IRL (58%)S (46%)
Periodic review of status 80% F (94%) S (46%) IE (93%) EQ (42%)UK (94%) IRL (58%) FI (90%) BC ( 56%)
Walkthroughs and inspections 46% F (67%) S (31%) IT (63%) EQ (25%)of design and code UK (65%) B (40%) AS (60%) ME (25%)
NL (40%) IE (60%)Application of common coding 75% GR (94%) N (50%) FI (100%) ME (50%)standards UK (87%) B (53%) IT (83%)Formal procedure forestimation of size
20% F (39%) All the rest FI (60%)AS (50%)
BC (0%)IE (0%)ME (0%)
Formal procedure for 50% F (75%) N (33%) FI (80%) ME (0%)estimation of effort, scheduleand cost
UK ( 60%) S (38%)
Formal procedures for 47% SF (75%) S (23%) AS (80%) IP (23%)handover from one group toanother
UK (69%) E (32%)B (33%)
IE (73%)
Planning testing prior to coding 57% F (89%) ISR (0%) AS (80%) BC (44%)GR (78%) S (15%)
N (17%)Testing by an independent 56% GR (78%) E (26%) AS (70%) EQ (42%)quality assurance group UK (77%)
Table 4: Standards and procedures - Countries and sectors with high and low practice levels
16/04/1998
13

Section 3 - Metrics
This section of the questionnaire addresses best practices pertaining to software metrics. 'Metrics'exhibited a mean adoption level of 45% for all companies surveyed. We observe (see Table 5) thatamong the companies surveyed very few collect software size data. Although quite a few companiescollect project resourcing and scheduling data, very few of them use the data in the estimationprocess. In general, tracking and performance metrics are used more widely than quality andestimation metrics.
Of the companies surveyed, 78% log post-implementation problems and track their resolution. Theuse of size and error measures is low; only 21% of companies use software size in estimation. Rootcause analysis is performed by 33% of the companies and 12% gather statistics on errors found ateach stage.
Most companies About half of the companies Few companies
•
•
Log post-implementationproblems and track theirresolution
Have records which wouldallow quick and accuratereconstruction of allcurrent versions andvariants of softwaresystems and components
•
•
•
Maintain and analyzerecords of actual projectresourcing and timescales
Gather statistics on sourcesof errors and analyze themfor cause, detection andavoidance
Use "earned-value" projecttracking
•
•
Maintain software sizerecords and use them forestimation
Gather and analyzestatistics on test efficiencyfor all testing stages
Table 5: Summary of results for Metrics
Metrics - Overall Adoption levels by country and sector
Figures 9 and 10 give adoption levels of various countries and sectors for best practices pertainingto Metrics. The 'Metrics' section exhibits among the lowest overall adoption levels in all sections ofthe SBPQ at 45% mean adoption level.
Among countries, France is by far the highest performer with an adoption level of 61%, followed bythe UK at 52%, Finland and Italy at 50%, and Greece at 49%. Sweden and Spain bring up the rearwith 25% and 36% respectively.
Within sectors, Aircraft and Spacecraft and Telecom Products have a 51% adoption level whileFinance and Insurance has 50%. At the lower end, Mechanical Engineering has 30% and Businessand Management Consulting 35%.
16/04/1998 14

Metrics
100%
80%
60%
40%
20%
0%F
UK
1 SF
GR
DK
N D A
NL B ISR
IRL
E S
Country
Figure 9: Metrics - Best practice levels by country
A - AustriaB - BelgiumD - GermanyDK - Denmark
E - SpainF - FranceGR - GreeceI - Italy
LEGENDISR - IsraelIRL - IrelandN - NorwayNL - Netherlands
S - SwedenSF - FinlandUK - United Kingdom
Figure 10: Metrics - Best practice levels by sector
AS - Aircraft & Spacecraft
BC - Business, Legal & ManagementConsultancy
EQ - Machinery, Electrical & Electricalinstruments
LEGENDFl - Finance and Insurance
IE - Electronic Engineering &Technical Consultancy
IP - Industrial Process ControlSystems
IS - Software Consultancy andSupply
IT - Telecom Products
ME - Mechanical Engineering &Technical Consultancy
16/04/1998 15

Metrics - Individual practice adoption by country and sector
Table 6 outlines the countries and sectors with high and low adoption levels of various Metricspractices. Countries and sectors are classified into those having high and low adoption relative to theaverage adoption level for the practice under consideration.
While most countries perform poorly on collection and usage of metrics data, France stands out asthe best performer. All countries perform very poorly on recording and feedback of size into theestimation process, with France being the best at 39%. All countries score well on logging ofproblem reports while all perform poorly on gathering testing efficiency statistics.
Among sectors, Aircraft and Spacecraft and Finance and Insurance have the highest acceptancerates for record and feedback of effort data into the estimation process and analysis of errors.However, Finance and Insurance doesn't perform very well in logging of problem reports.Mechanical Engineering, while being the poorest performer overall, is relatively better in gatheringtesting efficiency statistics.
Management practice Averageadoption
level
Countrieswith highadoption
Countrieswith lowadoption
Sectorswith highadoptionAS (70%)FI (70%)
Sectorswith lowadoptionME (25%)EQ (42%)
Record and feedback of estimatedversus actual efforts intoestimation process
55% F (72%)A (63%)
S (23%)ISR (27%)
Record and feedback of size intoestimation process
21% F (39%)I (31%)N (33%)
All othercountries
AS (50%)FI (40%)
All othersectors
Analysis of sources of errors 39% UK (56%)F (55%)
E (18%)SF (25%)
FI (60%)AS (50%)
ME (13%)IP (18%)
Gathering statistics of testingefficiency
12% SF (25%)I (23%)
All othercountries
ME (25%) All othersectors
Comparison of estimated andactual performance levels
46% F (78%) S (23%)IRL (25%)
AS (60%)IP (59%)
ME (13%)
Logging of problem reports 78% All, especiallySF (100%)UK (98%)
IT (96%)EQ (92%)
BC (56%)
Table 6: Metrics - Countries and sectors with high and low adoption levels
16/04/1998
16

Section 4 - Control of the Development Process
This section of the questionnaire addresses best practices pertaining to procedures and mechanismsfor the control of the development process. Table 7 summarizes the results of the survey. Thissection exhibited a mean adoption level of 58% for all companies surveyed. About 76% ofcompanies entrust project managers with the task of producing estimates, schedules and controllingchanges. About 57% of European companies gain sign-off from all parties involved before revisingproject plans and 64% have established processes for controlling changes to software requirementsand designs while 66% have processes for controlling changes to code and specifications. Only 32%have a mechanism to ensure that regression testing is performed routinely. However, other qualityassurance processes are followed: 55% of the companies ensure that every function is tested.
Most companies About half of the companies Few companies
• Allow only project • Gain sign-off from all parties • Have a mechanism tomanagers to produce involved before revising ensure performance ofestimates and schedules andcontrol subsequent changes
project plans
• Have procedures forcontrolling changes to code,requirements, design etc.
regression testing duringand after initialimplementation
• Ensure that every function istested
Table 7: Summary of results for Control of the Development Process
Control of the development process - Overall adoption levels by country and sector
Figures 11 and 12 give adoption levels of countries and sectors for best practices pertaining to thecontrol of the development process. Again, there are no major variations in the set of leading andlagging countries/sectors.
France and UK lead among the countries with adoption levels of 76% and 67% respectively, whileSweden and Belgium bring up the rear with 33% and 46% respectively.
Among sectors, Aircraft and Spacecraft, Machinery, Electrical and Electrical Instruments andTelecom Products lead with 72%, 67%, and 65% respectively, with Mechanical Engineering andBusiness and Management Consulting lagging behind at 40% and 50%.
16/04/1998 17

Figure 11: Control of the development process - Best practice levels by country
LEGENDA - Austria E - Spain ISR - Israel S - SwedenB - Belgium F - France IRL - Ireland SF - FinlandD - Germany GR - Greece N - Norway UK - United KingdomDK - Denmark I - Italy NL - Netherlands
Figure 12: Control of the development process - Best practice levels by sector
AS - Aircraft & Spacecraft
BC - Business, Legal & ManagementConsultancy
EQ - Machinery, Electrical & Electricalinstruments
LEGENDFl - Finance and Insurance
IE - Electronic Engineering &Technical Consultancy
IP - Industrial Process ControlSystems
IS - Software Consultancy andSupply
IT - Telecom Products
ME - Mechanical Engineering &Technical Consultancy
16/04/1998
18

--...•••■•■•1■111■11111
Control of the Development Process - Individual practice adoption by country and sector
Table 8 outlines the countries and sectors with high and low adoption levels of various practiceswithin the section Control of the Development Process. Countries and sectors are classified intothose having high and low adoption relative to the average adoption level for the practice underconsideration.
The adoption trends for Control of the Development process are quite like most of the othersections of the SBPQ, with France and UK close to the higher end of the adoption scale and Swedenand Belgium at the lower. Spain, which normally exhibits low adoption levels, has high adoptionrates for allocating project managers to directly control project resources and obtaining sign-offfrom all parties concerned before revising project plans. Norway also has a high adoption rate forcontrolling changes to the code and specifications.
Among sectors, Aircraft and Spacecraft, Finance and Insurance and Telecom Products are again atthe top, and Business and Management Consulting and Mechanical Engineering at the bottom. Theonly surprise is Machinery, Electrical and Electrical Instruments, which has a high acceptance ratefor allocating project managers to directly control project resources and obtaining sign-off from allparties concerned before revising project plans in spite of the low adoption levels of other practices.
Management practice Averageadoption
level
Countrieswith highadoption
Countrieswith lowadoption
Sectorswith highadoptionEQ (92%)IT (75%)
Sectorswith lowadoptionME (25%)BC (44%)
Obtaining signoff from all partiesbefore changing plans
57% E (79%) S (0%)
Procedures for controlling changes 64% SF (100%) S (38%) IE (80%) IP (50%)to requirements, designs anddocumentation
F (94%) B (40%) ME (50%)
Procedures for controlling changes 66% N (83%) B (40%) IS (72%) BC (44%)to code UK (81%) S (53%) AS (70%)Regression testing following each 32% F (56%) All the rest AS (60%) All otherchange UK (50%) sectorsEnsuring testing of every function 55% F (89%) NL (30%) AS (80%) ME (25%)
GR (83%)
Table 8: Control of the development process - Countries and sectors with high and low adoptionlevels
16/04/1998
19

Section 5 - Tools and Technology
This section of the questionnaire addresses best practices pertaining to the utilization of tools andtechnology for management and development activities. Table 9 summarizes the results of thesurvey. This section exhibited a mean adoption level of 45% for all companies surveyed.
The usage of software tools is fairly high for planning and scheduling (71%), but very low (29%) inforward and backward tracing of requirements through to design and code. There is an average levelof adoption of the usage of design notations and prototyping methods. As in other sections, the useof automated tools in quality assurance related activities is low at 26%.
Most companies About half of the companies , Few companies
• Use software toolsin tracing code todesign torequirements
• Use automatedtesting tools
• Use software tools forproject planning,estimating andscheduling
•
•
•
•
Use design notations like SADT inproduct design
Use prototyping methods for ensuringthe requirements elements
Use a data dictionary for systemsdesign and development
Use software tools for tracking statusof subroutines in the developmentlibrary
Table 9: Summary of results for Tools and Technology
Tools and Technology - Overall adoption levels by country and sector
Figures 13 and 14 give overall adoption levels for best practices pertaining to the usage of tools andtechnology across various countries and sectors.
France, Finland, and the UK again lead the countries in their adoption levels of practices related totools and technology with levels of 58%, 53% and 50% respectively. Sweden and Spain are again atthe lower end with adoption levels of 26% and 35%.
The set of leading sectors includes Aircraft and Spacecraft and Finance and Insurance, both at56%. However, the Mechanical Engineering sector moves up considerably in its relative ranking fortools and technology practices. Industrial Process Control Systems and Business and ManagementConsulting are in the rear at 32% and 33%.
16/04/1998 20

Figure 13: Tools and technology - Best practice levels by country
LEGENDA - Austria E - Spain ISR - Israel S - SwedenB - Belgium F - France IRL - Ireland SF - FinlandD - Germany GR - Greece N - Norway UK - United KingdomDK - Denmark I - Italy NL - Netherlands
Figure 14: Tools and technology - Best practice levels by sector
AS - Aircraft & Spacecraft
BC - Business, Legal & ManagementConsultancy
EQ - Machinery, Electrical & Electricalinstruments
LEGENDFl - Finance and Insurance
IE - Electronic Engineering &Technical Consultancy
IP - Industrial Process ControlSystems
IS - Software Consultancy andSupply
IT - Telecom Products
ME - Mechanical Engineering &Technical Consultancy
16/04/1998 21

Tools and Technology - Individual practice adoption by country and sector
Table 10 outlines the countries and sectors with high and low adoption levels of various bestpractices within the section Tools and Technology. Countries and sectors are classified into thosehaving high and low adoption relative to the average adoption level for the practice underconsideration. While the overall adoption of Tools and Technology is among the lowest in allsections of the SBPQ, the acceptance trends for countries and sectors are similar.
Among countries, France shows a high adoption for using software tools in forward/backwardtracing of requirements and using design notations and testing tools. UK used the most softwaretools for tracking and reporting status of software, using prototyping methods in ensuringrequirements elements and using tools for planning, estimating and scheduling. Sweden and Spainfigure again at the lower end of the adoption level scale.
Aircraft and Spacecraft and Finance and Insurance top the sector lists with uniformly high adoptionlevels on all aspects of Tools and Technology. The Mechanical Engineering sector, which usuallyexhibits low adoption levels, turns out to be a high adopter of prototyping methods. Machinery,Electrical and Electrical Instruments and Business and Management Consulting are at the lowerend of the adoption scale.
Management practice Averageadoption
level
Countrieswith highadoption
Countrieswith lowadoption
Sectorswith highadoption
Sectorswith lowadoption
Usage of tools for tracingforwards and backwards throughrequirements, design and code
29% F (61%) All countries,especiallyS (7%)ISR (0%)
AS (50%)FI (40%)
EQ (0%)ME (0%)
Usage of design notation likeSADT
41% SF (75%)F (72%)
IRL (16%)ISR (18%)
AS (70%)FI (70%)
IE (20%)BC (22%)
Usage of automated testing tools 26% F (61%) S, N (0%) AS (60%) BC (0%)EQ (8%)
-Usage of prototyping methods 59% UK (75%)IRL (75%)
None - mostaround 50%
FI (80%)ME (75%)
IT (33%)
Usage of software tools for projectplanning, estimation andscheduling
71% A (94%)DK (88%)UK (87%)
S (38%) AS (56%)FI (56%)
BC (33%)EQ (34%)
Table 10: Tools and technology - Countries and sectors with high and low adoption levels
16/04/1998
22
Section 6 - Conclusions
The analysis of the survey data leads to the conclusion that there are significant differences inadoption levels across countries and industrial sectors. At the same time, adoption levels vary alongdifferent sections of the SBPQ, each involving different dimensions of best practices.
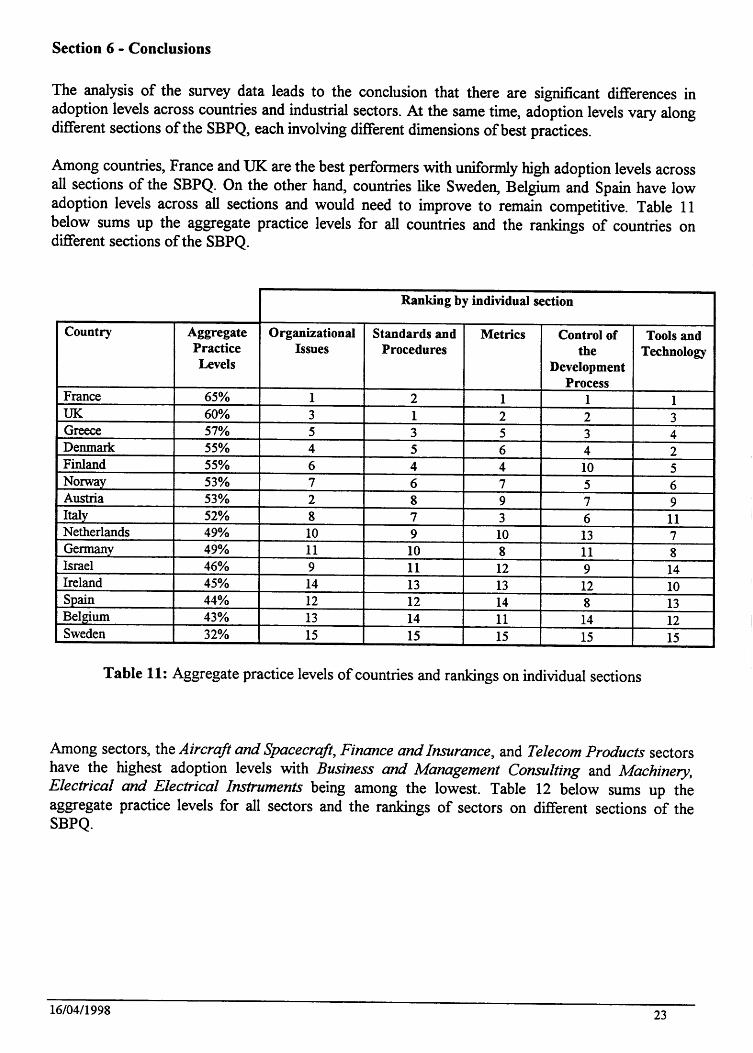
Among countries, France and UK are the best performers with uniformly high adoption levels acrossall sections of the SBPQ. On the other hand, countries like Sweden, Belgium and Spain have lowadoption levels across all sections and would need to improve to remain competitive. Table 11below sums up the aggregate practice levels for all countries and the rankings of countries ondifferent sections of the SBPQ.
Ranking by individual section
Country AggregatePracticeLevels
OrganizationalIssues
Standards andProcedures
Metrics Control ofthe
DevelopmentProcess
Tools andTechnology
France 65% 1 2 1 1 1UK 60% 3 1 2 2 3Greece 57% 5 3 5 3 4Denmark 55% 4 5 6 4 2Finland 55% 6 4 4 10 5Norway 53% 7 6 7 5 6Austria 53% 2 8 9 7 9Italy 52% 8 7 3 6 11Netherlands 49% 10 9 10 13 7Germany 49% 11 10 8 11 8Israel 46% 9 11 12 9 14Ireland 45% 14 13 13 12 10Spain 44% 12 12 14 8 13Belgium 43% 13 14 11 14 12Sweden 32% 15 15 15 15 15
Table 11: Aggregate practice levels of countries and rankings on individual sections
Among sectors, the Aircraft and Spacecraft, Finance and Insurance, and Telecom Products sectorshave the highest adoption levels with Business and Management Consulting and Machinery,Electrical and Electrical Instruments being among the lowest. Table 12 below sums up theaggregate practice levels for all sectors and the rankings of sectors on different sections of theSBPQ.
16/04/1998 23
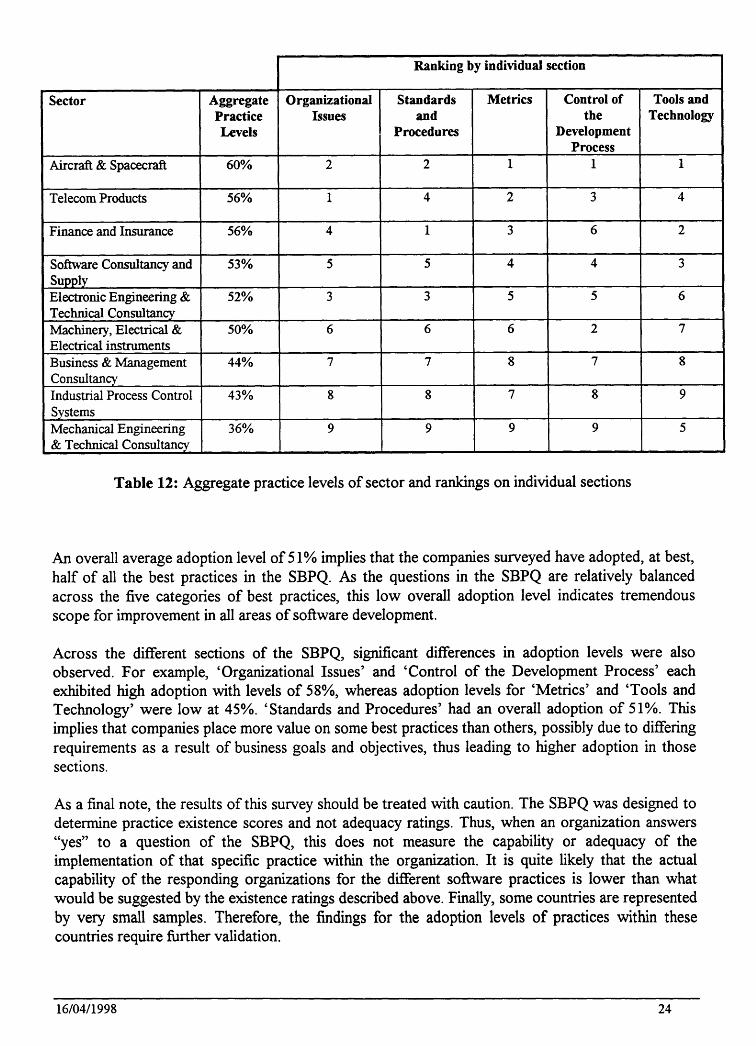
Ranking by individual section
Sector AggregatePracticeLevels
OrganizationalIssues
Standardsand
Procedures
Metrics Control ofthe
DevelopmentProcess
Tools andTechnology
Aircraft & Spacecraft 60% 2 2 1 1 1
Telecom Products 56% 1 4 2 3 4
Finance and Insurance 56% 4 1 3 6 2
Software Consultancy andSupply
53% 5 5 4 4 3
Electronic Engineering &Technical Consultancy
52% 3 3 5 5 6
Machinery, Electrical &Electrical instruments
50% 6 6 6 2 7
Business & ManagementConsultancy
44% 7 7 8 7 8
Industrial Process ControlSystems
43% 8 8 7 8 9
Mechanical Engineering& Technical Consultancy
36% 9 9 9 9 5
Table 12: Aggregate practice levels of sector and rankings on individual sections
An overall average adoption level of 51% implies that the companies surveyed have adopted, at best,half of all the best practices in the SBPQ. As the questions in the SBPQ are relatively balancedacross the five categories of best practices, this low overall adoption level indicates tremendousscope for improvement in all areas of software development.
Across the different sections of the SBPQ, significant differences in adoption levels were alsoobserved. For example, 'Organizational Issues' and 'Control of the Development Process' eachexhibited high adoption with levels of 58%, whereas adoption levels for 'Metrics' and 'Tools andTechnology' were low at 45%. 'Standards and Procedures' had an overall adoption of 51%. Thisimplies that companies place more value on some best practices than others, possibly due to differingrequirements as a result of business goals and objectives, thus leading to higher adoption in thosesections.
As a final note, the results of this survey should be treated with caution. The SBPQ was designed todetermine practice existence scores and not adequacy ratings. Thus, when an organization answers"yes" to a question of the SBPQ, this does not measure the capability or adequacy of theimplementation of that specific practice within the organization. It is quite likely that the actualcapability of the responding organizations for the different software practices is lower than whatwould be suggested by the existence ratings described above. Finally, some countries are representedby very small samples. Therefore, the findings for the adoption levels of practices within thesecountries require further validation.
16/04/1998 24