Embed Size (px)
Citation preview
US Army Corpsof EngineersConstruction Engineering USACERL Technical Report 96/23Research Laboratories December 1995
Long-Term Field Test Results forPolyvinyl Chloride (PVC) Roofing
byWalter J. Rossiter, Jr.James A. LechnerDavid M. BaileyStuart D. Foltz
19960124 104
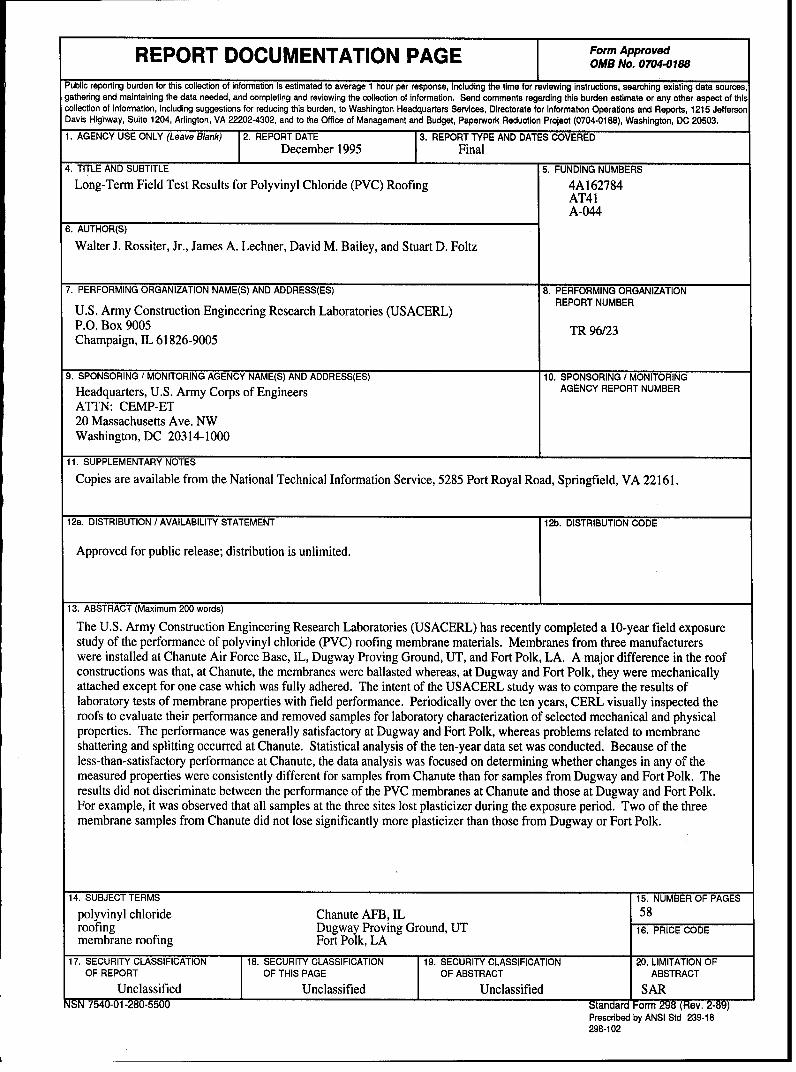
The U.S. Army Construction Engineering Research physical properties. The performance was generallyLaboratories (USACERL) has recently completed a 10- satisfactory at Dugway and Fort Polk, whereas problemsyear field exposure study of the performance of polyvinyl related to membrane shattering and splitting occurred atchloride (PVC) roofing membrane materials. Membranes Chanute. Statistical analysis of the 10-year data set wasfrom three manufacturers were installed at Chanute Air conducted. Because of the less-than-satisfactory per-Force Base, IL, Dugway Proving Ground, UT, and Fort formance at Chanute, the data analysis was focused onPolk, LA. A major difference in the roof constructions determining whether changes in any of the measuredwas that, at Chanute, the membranes were ballasted properties were consistently different for samples fromwhereas, at Dugway and Fort Polk, they were mechani- Chanute than for samples from Dugway and Fort Polk.cally attached except for one case which was fully The results did not discriminate between the performanceadhered. The intent of the USACERL study was to of the PVC membranes at Chanute and those at Dugwaycompare the results of laboratory tests of membrane and Fort Polk. For example, it was observed that allproperties with field performance. Periodically over the samples at the three sites lost plasticizer during the10 years, USACERL visually inspected the roofs to exposure period. Two of the three membrane samplesevaluate their performance and removed samples for from Chanute did not lose significantly more plasticizerlaboratory characterization of selected mechanical and than those from Dugway or Fort Polk.
Approved for public release; distribution is unlimited.
The contents of this report are not to be used for advertising, publication,or promotional purposes. Citation of trade names does not constitute anofficial endorsement or approval of the use of such commercial products.The findings of this report are not to be construed as an officialDepartment of the Army position, unless so designated by other authorizeddocuments.
DESTROY THIS REPORT WHEN IT IS NO LONGER NEEDED
DO NOT RETURN IT TO THE ORIGINATOR
USER EVALUATION OF REPORT
REFERENCE: USACERL Technical Report 96/23, Long-Term Field Test Results for Polyvinyl Chloride(PVC) Roofing
Please take a few minutes to answer the questions below, tear out this sheet, and return it to USACERL. As userof this report, your customer comments will provide USACERL with information essential for improving futurereports.
1. Does this report satisfy a need? (Comment on purpose, related project, or other area of interest for whichreport will be used.)
2. How, specifically, is the report being used? (Information source, design data or procedure, managementprocedure, source of ideas, etc.)
3. Has the information in this report led to any quantitative savings as far as manhours/contract dollars saved,operating costs avoided, efficiencies achieved, etc.? If so, please elaborate.
4. What is your evaluation of this report in the following areas?
a. Presentation:
b. Completeness:
c. Easy to Understand:
d. Easy to Implement:
e. Adequate Reference Material:
f. Relates to Area of Interest:
g. Did the report meet your expectations?
h. Does the report raise unanswered questions?
i. General Comments. (Indicate what you think should be changed to make this report and future reportsof this type more responsive to your needs, more usable, improve readability, etc.)
5. If you would like to be contacted by the personnel who prepared this report to raise specific questions or
discuss the topic, please fill in the following information.
Name:
Telephone Number:
Organization Address:
6. Please mail the completed form to:
Department of the ArmyCONSTRUCTION ENGINEERING RESEARCH LABORATORIESATUN: CECER-TR-IP.O. Box 9005Champaign, IL 61826-9005
REPORT DOCUMENTATION PAGE Form ApprovedR DOMB No. 0704-0188
Public reporting burden for this collection of information is estimated to average 1 hour per response, including the time for reviewing Instructions, searching existing data sources,gathering and maintaining the data needed, and completing and reviewing the collection of information. Send comments regarding this burden estimate or any other aspect of thiscollection of information, including suggestions for reducing this burden, to Washington Headquarters Services, Directorate for Information Operations and Reports, 1215 JeffersonDavis Highway, Suite 1204, Arlington, VA 22202-4302, and to the Office of Management and Budget, Paperwork Reduction Project (0704-0188), Washington, DC 20503.
1. AGENCY USE ONLY (Leave Blank) 2. REPORT DATE 3. REPORT TYPE AND DATES COVERED
December 1995 Final4. TITLE AND SUBTITLE 5. FUNDING NUMBERS
Long-Term Field Test Results for Polyvinyl Chloride (PVC) Roofing 4A162784AT41A-044
6. AUTHOR(S)
Walter J. Rossiter, Jr., James A. Lechner, David M. Bailey, and Stuart D. Foltz
7. PERFORMING ORGANIZATION NAME(S) AND ADDRESS(ES) 8. PERFORMING ORGANIZATIONREPORT NUMBER
U.S. Army Construction Engineering Research Laboratories (USACERL)P.O. Box 9005 TR 96/23Champaign, IL 61826-9005
9. SPONSORING / MONITORING AGENCY NAME(S) AND ADDRESS(ES) 10. SPONSORING / MONITORING
Headquarters, U.S. Army Corps of Engineers AGENCY REPORT NUMBER
ATTN: CEMP-ET20 Massachusetts Ave. NWWashington, DC 20314-1000
11. SUPPLEMENTARY NOTES
Copies are available from the National Technical Information Service, 5285 Port Royal Road, Springfield, VA 22161.
12a. DISTRIBUTION / AVAILABILITY STATEMENT 12b. DISTRIBUTION CODE
Approved for public release; distribution is unlimited.
13. ABSTRACT (Maximum 200 words)
The U.S. Army Construction Engineering Research Laboratories (USACERL) has recently completed a 10-year field exposurestudy of the performance of polyvinyl chloride (PVC) roofing membrane materials. Membranes from three manufacturerswere installed at Chanute Air Force Base, IL, Dugway Proving Ground, UT, and Fort Polk, LA. A major difference in the roofconstructions was that, at Chanute, the membranes were ballasted whereas, at Dugway and Fort Polk, they were mechanicallyattached except for one case which was fully adhered. The intent of the USACERL study was to compare the results oflaboratory tests of membrane properties with field performance. Periodically over the ten years, CERL visually inspected theroofs to evaluate their performance and removed samples for laboratory characterization of selected mechanical and physicalproperties. The performance was generally satisfactory at Dugway and Fort Polk, whereas problems related to membraneshattering and splitting occurred at Chanute. Statistical analysis of the ten-year data set was conducted. Because of theless-than-satisfactory performance at Chanute, the data analysis was focused on determining whether changes in any of themeasured properties were consistently different for samples from Chanute than for samples from Dugway and Fort Polk. Theresults did not discriminate between the performance of the PVC membranes at Chanute and those at Dugway and Fort Polk.For example, it was observed that all samples at the three sites lost plasticizer during the exposure period. Two of the threemembrane samples from Chanute did not lose significantly more plasticizer than those from Dugway or Fort Polk.
14. SUBJECT TERMS 15. NUMBER OF PAGES
polyvinyl chloride Chanute AFB, IL 58roofing Dugway Proving Ground, UT 16. PRICE CODEmembrane roofing Fort Polk, LA
17. SECURITY CLASSIFICATION 18. SECURITY CLASSIFICATION 19. SECURITY CLASSIFICATION 20. LIMITATION OFOF REPORT OF THIS PAGE OF ABSTRACT ABSTRACT
Unclassified Unclassified Unclassified SARqSN 7540-01-280-5570 Standard Form 298 (Rev. 2-89)
Prescribed by ANSI Std 239-18298-102
2 USACERL TR 96/23
Foreword
This study was conducted for Headquarters, U.S. Army Corps of Engineers underProject 4A162784AT41, "Military Facilities Engineering Technology"; Work UnitA-044, "Improved and New Roofing for Military Construction." The technical monitorwas Rodger Seeman, CEMP-ET.
The work was performed by the Materials Science and Technology Division (FL-M) ofthe Facilities Technology Laboratory (FL), U.S. Army Construction EngineeringResearch Laboratories (USACERL). The USACERL principal investigator was DavidM. Bailey. Walter J. Rossiter, Jr., and James A. Lechner are with the NationalInstitute of Standards and Technology. Ellen G. Segan is Acting Chief, CECER-FL-M;Donald F. Fournier is Acting Operations Chief, CECER-FL; and Alvin Smith is Chief,CECER-FL. The USACERL technical editor was Linda L. Wheatley, TechnicalResources Center.
COL James T. Scott is Commander and Acting Director, and Dr. Michael J. O'Connoris Technical Director of USACERL.
USACERL TR 96/23 3
ContentsS F 298 . . . . . . . . . . . . . . . . . . . . . . . . . . . . . . . . . . . . . . . . . . . . . . . . . . . . . . . . . . . . 1
Forew ord .......................................................... 2
List of Tables and Figures ............................................. 5
1 Introduction .................................................... 9Background ................................................ 9O bjective ..................................................... 10Approach ..... ............................................ 10Mode of Technology Transfer ...................................... 10Metric Conversion Factors ......................................... 10
2 Description of Test Program ...................................... 11Description of Test Roofs ......................................... 11ASTM Categorization of PVC Membranes ............................. 12Test Program .................................................. 13
3 Visual Inspections .............................................. 15
4 Analysis of Test Data ........................................... 19Treatment and Presentation of Data .................................. 19Plasticizer Content and Plasticizer Loss ............................... 21Tensile Strength ................................................ 24E longation .................................................... 26Tear Strength .................................................. 28Ply Adhesion .................................................. 28A brasion Loss .................................................. 30Thickness ..................................................... 30Specific G ravity ................................................. 32W ater Vapor Transmission ......................................... 32W ater Absorption ............................................... 33Dim ensional Stability ............................................. 36Seam Shear Strength ............................................ 38Seam Peel Strength ............................................. 40
4 USACERL TR 96/23
5 Conclusions and Commentary .................................... 47C onclusions ................................................... 47Final Com m ent ................................................. 48
References ........................................................ 50
Appendix: Variability in the Descriptors for the Measured Properties .............. 51
Distribution
USACERL TR 96/23 5
List of Tables and Figures
Tables
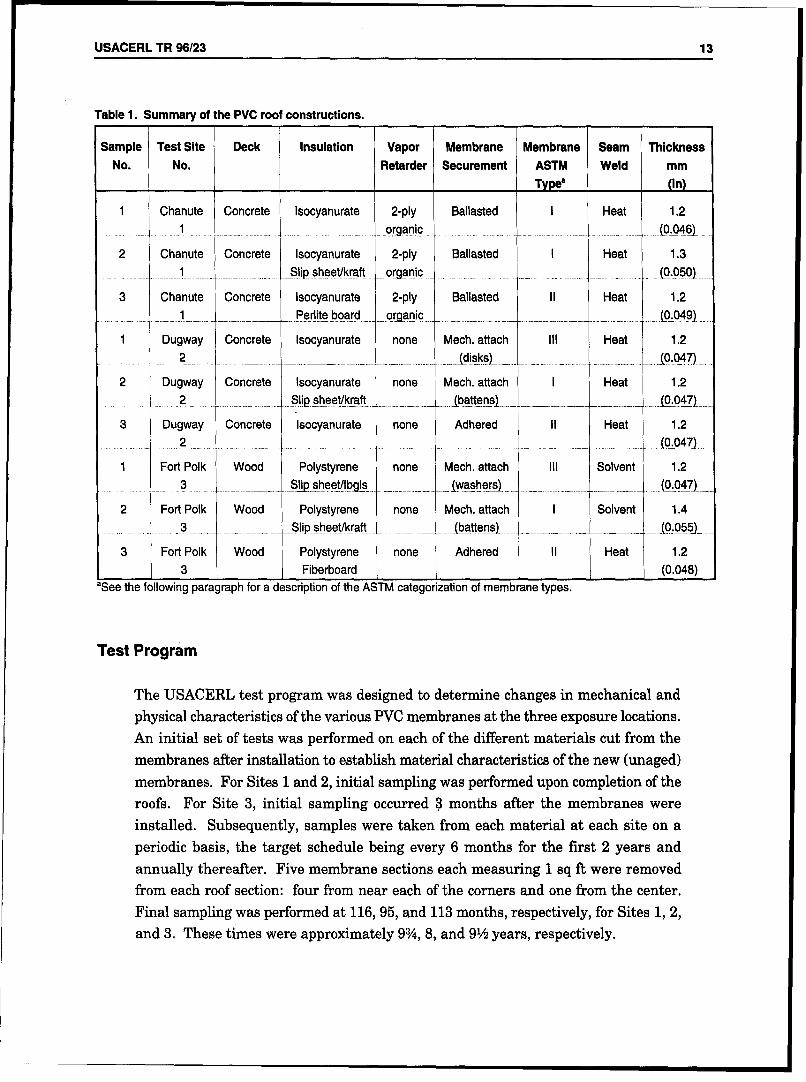
1 Summary of the PVC roof constructions ....................... 13
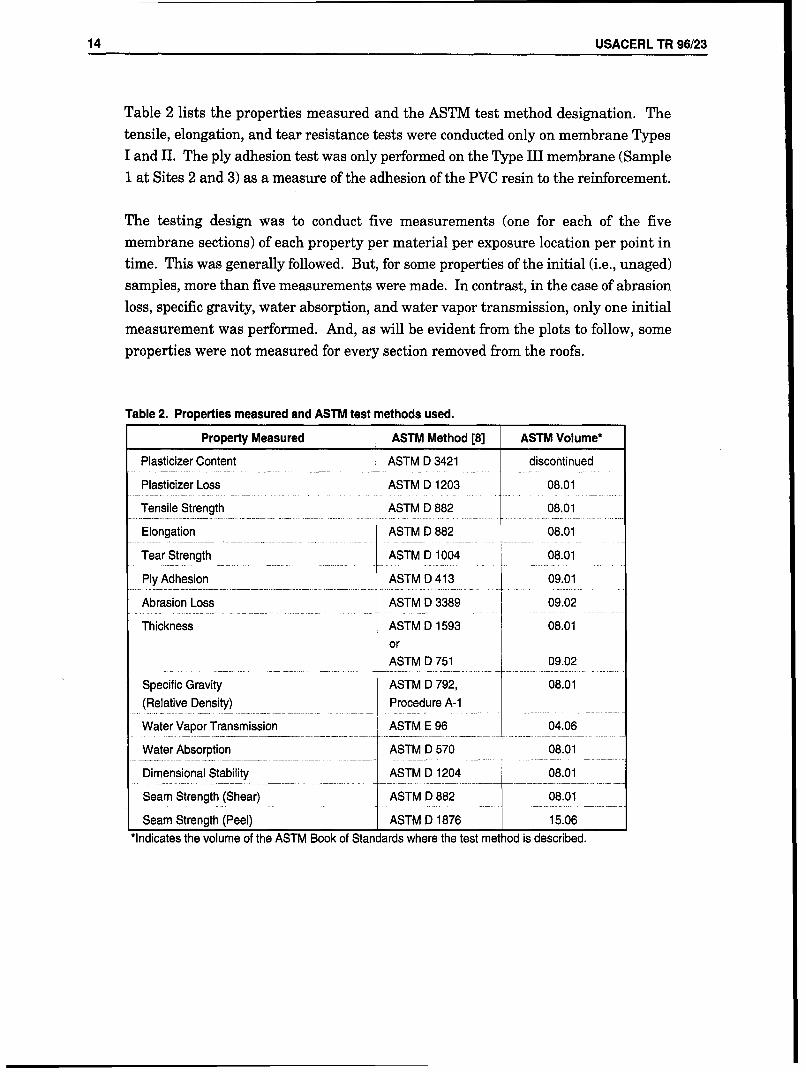
2 Properties measured and ASTM test methods used .............. 14
3 Plasticizer content measurements (ASTM D 3421) ............... 21
4 Summary of plasticizer loss results (ASTM D 1203) ............... 22
5 Summary of tensile strength results (ASTM D 882) ............... 24
6 Summary of elongation results (ASTM D 882) ................... 26
7 Summary of tear strength results (ASTM D 1004) ................ 28
8 Summary of ply-adhesion results (ASTM D 413) ................. 30
9 Summary of abrasion loss results (ASTM D 3389) ................ 32
10 Summary of thickness results (ASTM D 1593 or D 751) ........... 34
11 Summary of specific gravity results (ASTM D 792) ............... 36
12 Summary of WVT results (ASTM E 96) ........................ 38
13 Summary of water absorption results (ASTM D 570) .............. 40
14 Summary of dimensional stability results (ASTM D 1204) ........... 42
15 Summary of seam shear strength results (ASTM D 882) ........... 44
16 Summary of seam peel strength results (ASTM D 1876) ........... 44
Al Variability of the descriptors for the plasticizer loss results .......... 51
A2 Variability of the descriptors for the tensile strength results ......... 51
6 USACERL TR 96/23
A3 Variability of the descriptors for the elongation results ............. 51
A4 Variability of the descriptors for the tear strength results ........... 52
A5 Variability of the descriptors for the ply-adhesion results ........... 52
A6 Variability of the descriptors for the abrasion loss results ........... 52
A7 Variability of the descriptors for the thickness results .............. 52
A8 Variability of the descriptors for the specific gravity results .......... 53
A9 Variability of the descriptors for the water vapor transmission results .. 53
A10 Variability of the descriptors for the water absorption results ........ 53
Al1 Variability of the descriptors for the dimensional stability results forthe transverse direction ................................... 53
A12 Variability of the descriptors for the dimensional stability results forthe longitudinal direction .................................. 54
A13 Variability of the descriptors for the seam shear strength results ...... 54
A14 Variability of the descriptors for the seam peel strength results ....... 54
Figures
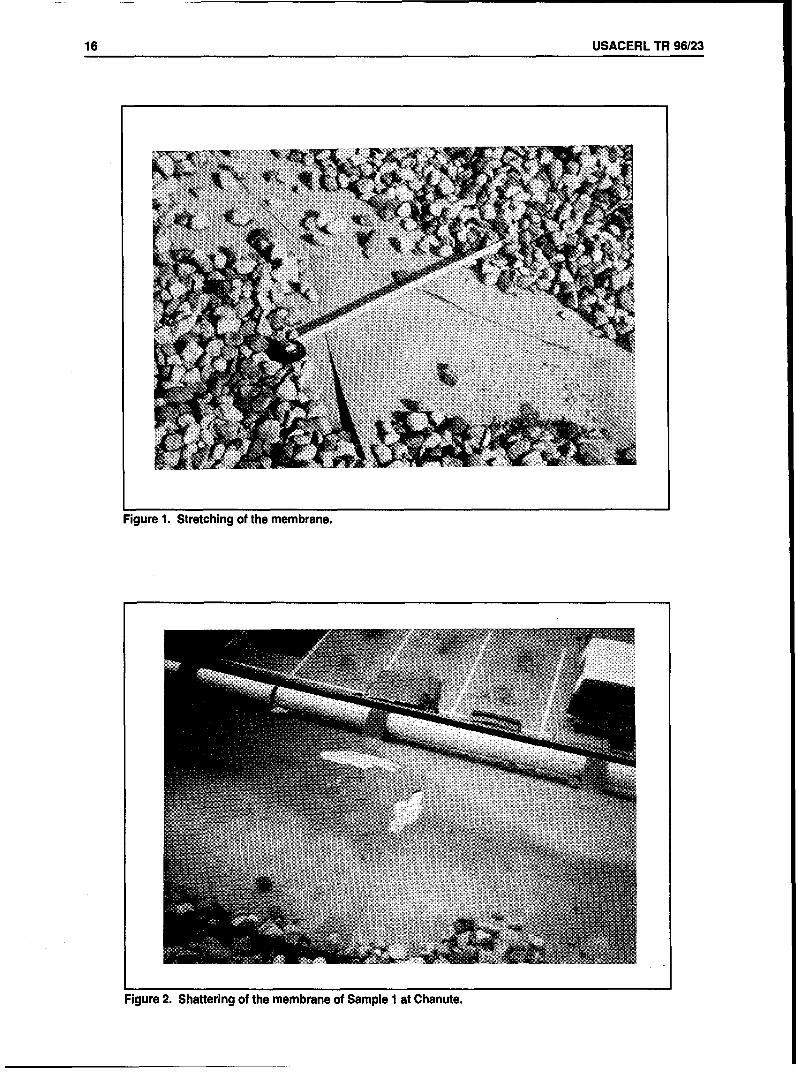
1 Stretching of the membrane ................................ 16
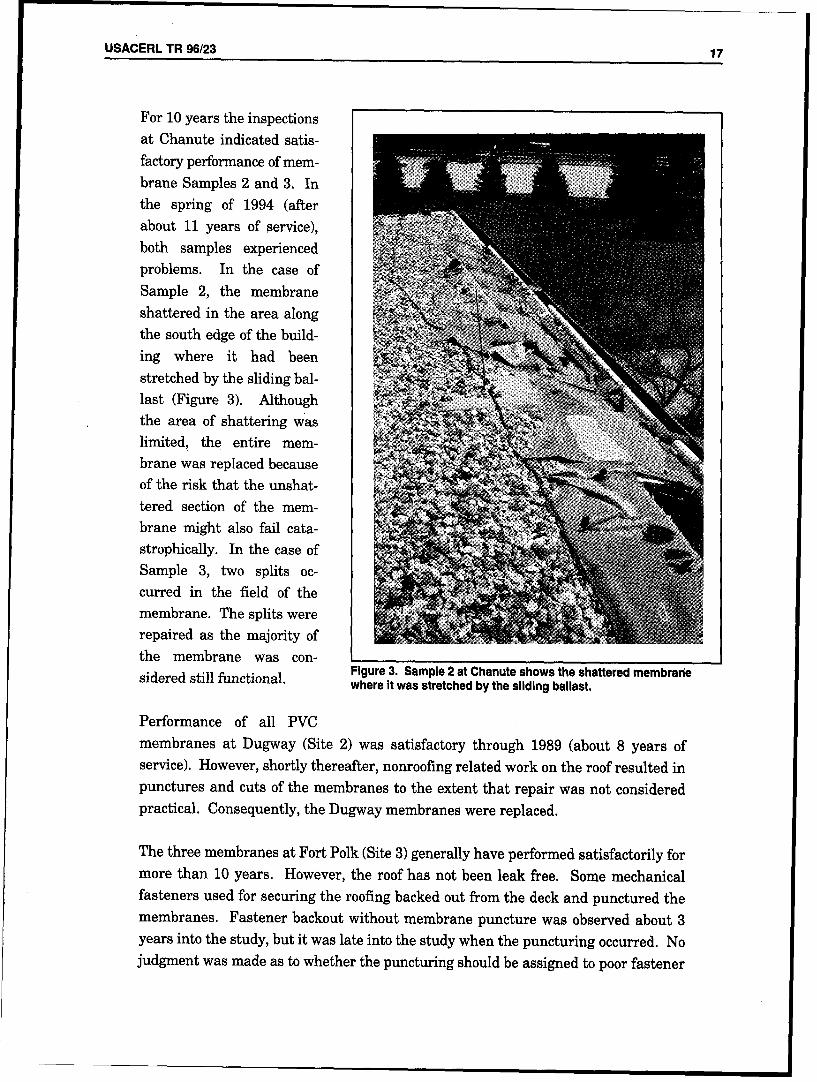
2 Shattering of the membrane of Sample 1 at Chanute ............. 16
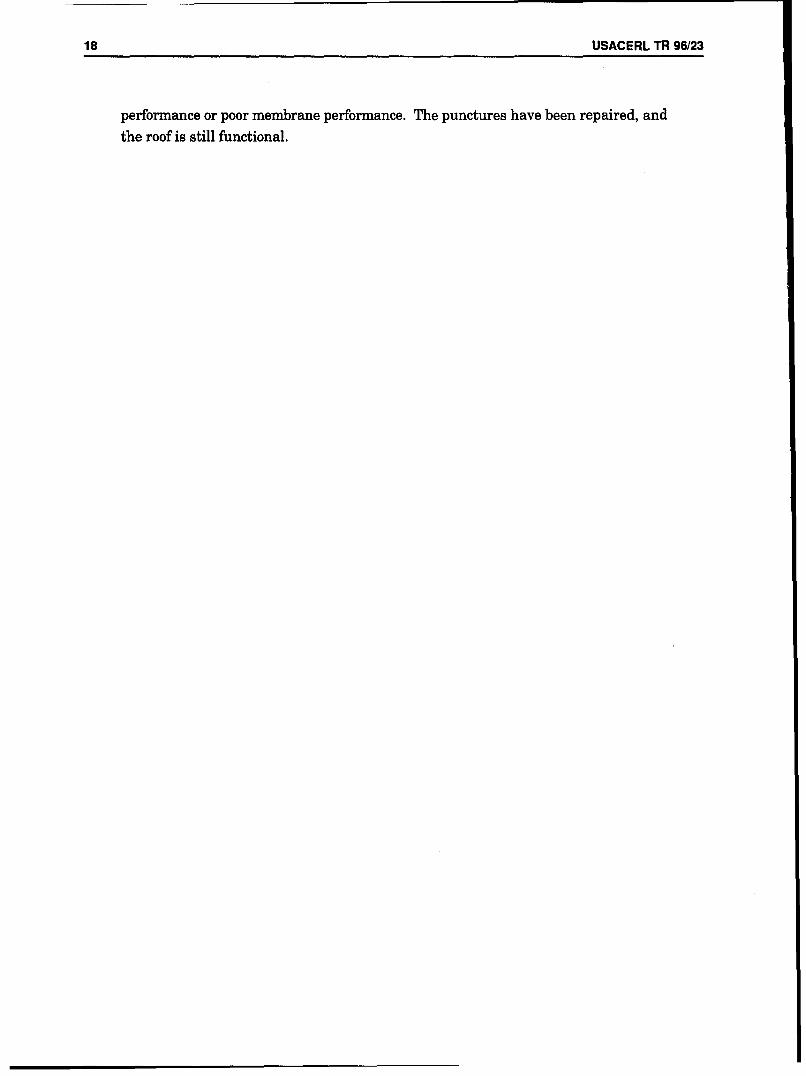
3 Sample 2 at Chanute shows the shattered membrane where it wasstretched by the sliding ballast .............................. 17
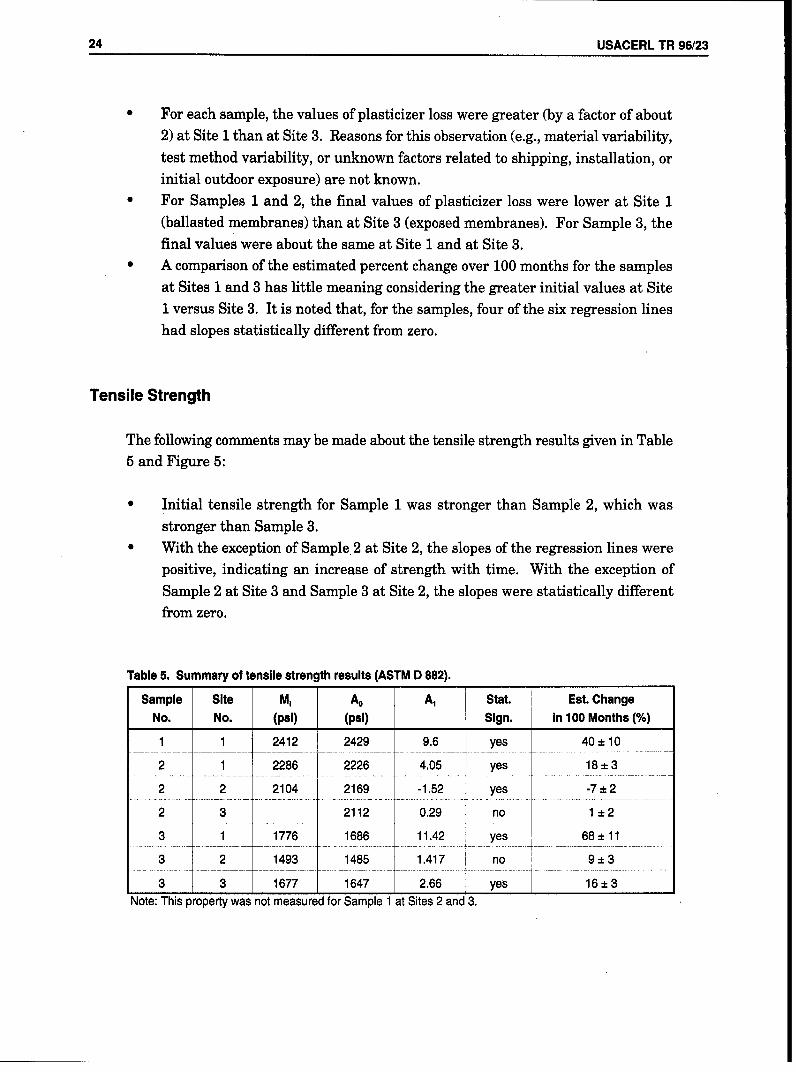
4 Results of the plasticizer loss tests ........................... 23
5 Results of the tensile strength tests .......................... 25
6 Results of the elongation tests .............................. 27
7 Results of the tear strength tests ............................ 29
USACERL TR 96/23 7
8 Results of the ply-adhesion tests ............................ 31
9 Results of the abrasion loss tests ............................ 33
10 Results of the thickness tests ............................... 35
11 Results of the specific gravity tests ........................... 37
12 Results of the water vapor transmission tests ................... 39
13 Results of the water absorption tests ......................... 41
14 Results of the dimensional stability tests ....................... 43
15 Results of the seam shear strength tests ...................... 45
16 Results of the seam peel strength tests ....................... 46
USACERL TR 96/23 9
1 Introduction
Background
The use of synthetic single-ply and polymer-modified membranes as alternatives to
built-up roofing (BUR) has increased dramatically since the late 1970s. Recent esti-
mates show that single plies and modified bitumen materials now account for about
65 percent of the total low-sloped roofing market (Cullen 1993). This increase hasoccurred despite improvements in BUR materials and construction specifications.
Recognizing the importance of having performance information on alternative
membrane roofing, the U.S Army Corps of Engineers (HQUSACE) has asked the
Construction Engineering Research Laboratories (USACERL) to investigate such
systems for Army facilities (Marvin et al. 1979).
One of the roofing membrane materials selected for long-term field testing was
polyvinyl chloride (PVC) (Rosenfield 1981). In 1982 and 1983, test roofs were installed
on buildings in three different areas of the country: Chanute Air Force Base, IL,Dugway Proving Ground, UT, and Fort Polk, LA (designated Sites 1, 2, and 3,
respectively). Products from three manufacturers (designated Samples 1, 2, and 3)
were selected for the study, which was designed to track the performance of theinstalled roofing over 10 years (Marvin et al. 1979). Laboratory testing of mechanical
and physical properties was scheduled for membrane samples taken every 6 months
for the first 2 years and annually thereafter. The exact times of removal of the sample
sets varied from the scheduled times because of unforeseen contracting constraints.
Two interim papers have been published on the progress of the study. In 1987,
Rosenfield and Wilcoski reported early test results along with a description of the
study design. In 1990, Foltz and Bailey published results through 6 years of field
exposure. Since then, data for 4 more years of exposure have been gathered and the
entire PVC data set statistically analyzed.
10 USACERL TR 96/23
Objective
The objective of this report is to document long-term results of a field test program toevaluate PVC roofing membrane. The results of the statistical analysis of the data setare compared to the reported field performance of the roofing systems.
Approach
The following procedures were used to achieve the objective of this study:
1. Roof systems for a 10-year field evaluation were selected based on earlier
USACERL studies.
2. A test plan was developed using standard test methods published by the
American Society for Testing and Materials (ASTM).
3. Test sites were selected.
4. Test guide specifications were developed.
5. Construction of the test roofing systems was monitored.6. Test data were collected for 10 years after construction.
7. Test roofs were inspected visually once a year.
Mode of Technology Transfer
Information generated by this study will impact on Corps of Engineers Guide Specifi-cations (CEGS) 07555, Polyvinyl Chloride (PVC) Roofing as well as aid in the develop-
ment of test methodologies for assessing the in-service performance of PVC roofing.
Metric Conversion Factors
U.S. standard units of measure are used throughout this report. A table of metric
conversion factors is presented below.
1 in. = 25.4 mm1ft = 0.305m
lsqft = 0.093m 2
llbf = 0.138kgrm1 psi = 6.89 kPa
USACERL TR 96/23 11
2 Description of Test Program
Description of Test Roofs
The three sites for the test program were selected for geographic and climatic
diversity. A project building was chosen at each site. Each building roof was dividedinto three sections, allowing membrane material from each of the three manufacturers
(Samples 1, 2, and 3) to be installed. The roof sections ranged in area from 6,930 to
13,600 sq ft.
The roofing systems at Chanute AFB consist of a poured-in-place concrete deck, a two-
ply organic felt and asphalt vapor retarder, and 2-1/2 in. of aluminum foil-faced
isocyanurate foam board in two layers, loose laid. The PVC membranes were installed
loose laid and ballasted.
At Dugway Proving Ground, the systems consist of a poured-in-place concrete deck,3 in. of aluminum foil-faced isocyanurate foam board in two layers mechanically
fastened to the deck without a vapor retarder. The Sample 1 membrane was
mechanically fastened with the membrane adhered to discs of PVC material; the
Sample 2 membrane was mechanically fastened with the membrane adhered to steel
battens; the Sample 3 membrane was fully adhered.
The systems at Fort Polk consist of a tongue-and-groove wood plank deck and 4-1/2 in.
of aluminum foil-faced expanded polystyrene insulation board in two layers that are
mechanically fastened to the decks without a vapor retarder. Sample 1 membrane was
mechanically fastened along one edge of each sheet using fasteners and washers;
Sample 2 membrane was mechanically fastened with the membrane adhered to steel
battens; Sample 3 membrane was fully adhered to the fiberboard surface of composite
insulation board.
Table 1 gives a summary description of the roof systems. A discussion of the
construction of the test roofs can be found in USACERL Technical Report M-343
Construction of Experimental Polyvinyl Chloride (PVC) Roofing (Rosenfield 1984).
12 USACERL TR 96/23
ASTM Categorization of PVC Membranes
In 1985, ASTM issued standard specification D 4434 that categorized PVC membranesinto Types I, II, and III, with Type II subdivided into two grades:
Type I: Unreinforced sheetType II: Grade 1 - Unreinforced sheet containing fibers
Grade 2 - Unreinforced sheet containing fabricsType III: Reinforced sheet containing fibers or fabric.
The Type II terminology may be misleading as fibers and fabrics are used to "reinforce"
polymeric sheets.* By way of explanation, the ASTM Standard D 4434 contains a note
that reads:
(F)abrics or fibers may be incorporated into a production process, for example, asa carrier, without appreciably affecting such physical property characteristics of thefinished product as tensile strength or ultimate elongation, but may provide otherdesirable characteristics, such as dimensional stability.
Membranes used in this field study included all three types (Table 1). Sample 1 wasa Type I product at Chanute and a Type III product at Dugway and Fort Polk. Sample2 and Sample 3 were Type I and Type II products, respectively, at each of the threeexposure locations. When the study began, most manufacturers specified an unrein-forced membrane (either ASTM Type I or Type II) for ballasted systems. As shown inTable 1, the three ballasted membrane systems at Chanute Air Force Base were eitherType I or Type II membrane materials. Field experience with PVC roofing has shown
that some unreinforced PVC membranes (ASTM Type I) have undergone splitting,cracking, and shattering in service, particularly those that are ballasted (Paroli,Smith, and Whelan 1993). As a consequence, ballasted PVC systems are seldom
specified today.** As will be discussed later in the report, the ballasted systems atChanute (Site 1) experienced splitting and related problems.
ASTM D 4434 also contains a requirement that the minimum thickness of a PVCroofing sheet be 0.045 in. Note in Table 1 that all samples in the study were in
conformance with this requirement.
As this report is being written, ASTM D 4434 is under revision, and this terminology is expected to change.
ASTM task group actions on the revision of D 4434 have proposed the elimination of Type I membrane materialbecause it is no longer used for roofing.
USACERL TR 96/23 13
Table 1. Summary of the PVC roof constructions.
Sample Test Site Deck Insulation Vapor Membrane Membrane Seam ThicknessNo. No. Retarder Securement ASTM Weld mm
Type _ (in)
1 Chanute Concrete Isocyanurate 2-ply Ballasted I Heat 1.2. 1 . organi.c --.-.-.. . ... ... .. .... _ _0.046)
2 Chanute Concrete Isocyanurate 2-ply Ballasted I Heat 1.3. {.... ... pshe-eet/k.raft organc ... (0.050 .
3 Chanute Concrete Isocyanurate 2-ply Ballasted II Heat 1.2o . Perlite board . organic . . . . . . . . . . . .(0.049)
1 Dugway Concrete Isocyanurate none Mech. attach Ill Heat 1.2. .2 _di~sks_ .. _(0.047).
2 Dugway Concrete Isocyanurate none Mech. attach I Heat 1.2. .2 Slip sheet/kraft . . .battens} .. 047)
3 Dugway Concrete Isocyanurate none Adhered II Heat 1.22_ _ _(0.047)
1 Fort Polk Wood Polystyrene none Mech. attach III Solvent 1.23 Slip sheet/fbgls .. (washers).. -.Q..47.
2 Fort Polk Wood Polystyrene none Mech. attach I Solvent 1.43 . . Slip sheet/kraft ..... fbattens_ JO.055 .
3 Fort Polk Wood Polystyrene none Adhered II Heat 1.23 Fiberboard I I I_1 _ 1_ (0.048)
aSee the following paragraph for a description of the ASTM categorization of membrane types.
Test Program
The USACERL test program was designed to determine changes in mechanical and
physical characteristics of the various PVC membranes at the three exposure locations.
An initial set of tests was performed on each of the different materials cut from the
membranes after installation to establish material characteristics of the new (unaged)
membranes. For Sites 1 and 2, initial sampling was performed upon completion of the
roofs. For Site 3, initial sampling occurred 3 months after the membranes wereinstalled. Subsequently, samples were taken from each material at each site on a
periodic basis, the target schedule being every 6 months for the first 2 years and
annually thereafter. Five membrane sections each measuring 1 sq ft were removedfrom each roof section: four from near each of the corners and one from the center.
Final sampling was performed at 116, 95, and 113 months, respectively, for Sites 1, 2,
and 3. These times were approximately 93, 8, and 91/ years, respectively.
14 USACERL TR 96/23
Table 2 lists the properties measured and the ASTM test method designation. The
tensile, elongation, and tear resistance tests were conducted only on membrane TypesI and II. The ply adhesion test was only performed on the Type III membrane (Sample1 at Sites 2 and 3) as a measure of the adhesion of the PVC resin to the reinforcement.
The testing design was to conduct five measurements (one for each of the fivemembrane sections) of each property per material per exposure location per point intime. This was generally followed. But, for some properties of the initial (i.e., unaged)samples, more than five measurements were made. In contrast, in the case of abrasionloss, specific gravity, water absorption, and water vapor transmission, only one initialmeasurement was performed. And, as will be evident from the plots to follow, someproperties were not measured for every section removed from the roofs.
Table 2. Properties measured and ASTM test methods used.
Property Measured ASTM Method [8] ASTM Volume*
Plasticizer Content ASTM D 3421 discontinued
Plasticizer Loss ASTM D 1203 08.01
Tensile Strength ASTM D 882 08.01
Elongation ASTM D 882 08.01
Tear Strength ASTM D 1004 08.01
Ply Adhesion ASTM D 413 09.01
Abrasion Loss ASTM D 3389 09.02
Thickness ASTM D 1593 08.01orASTM D 751 09.02
Specific Gravity ASTM D 792, 08.01
(Relative Density) Procedure A-1
Water Vapor Transmission ASTM E 96 04.06
Water Absorption ASTM D 570 08.01
Dimensional Stability ASTM D 1204 08.01
Seam Strength (Shear) ASTM D 882 08.01
Seam Strength (Peel) ASTM D 1876 15.06*Indicates the volume of the ASTM Book of Standards where the test method is described.
USACERL TR 96/23 15
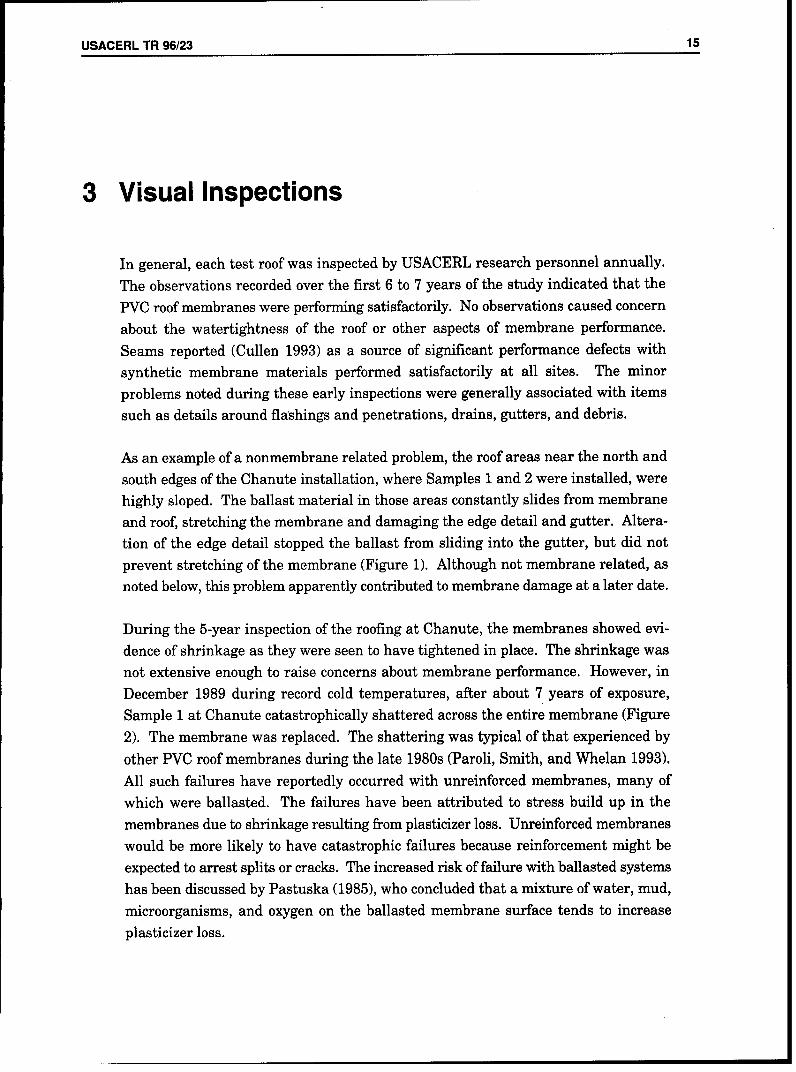
3 Visual Inspections
In general, each test roof was inspected by USACERL research personnel annually.
The observations recorded over the first 6 to 7 years of the study indicated that the
PVC roof membranes were performing satisfactorily. No observations caused concern
about the watertightness of the roof or other aspects of membrane performance.
Seams reported (Cullen 1993) as a source of significant performance defects with
synthetic membrane materials performed satisfactorily at all sites. The minor
problems noted during these early inspections were generally associated with items
such as details around flashings and penetrations, drains, gutters, and debris.
As an example of a nonmembrane related problem, the roof areas near the north and
south edges of the Chanute installation, where Samples 1 and 2 were installed, were
highly sloped. The ballast material in those areas constantly slides from membrane
and roof, stretching the membrane and damaging the edge detail and gutter. Altera-
tion of the edge detail stopped the ballast from sliding into the gutter, but did not
prevent stretching of the membrane (Figure 1). Although not membrane related, as
noted below, this problem apparently contributed to membrane damage at a later date.
During the 5-year inspection of the roofing at Chanute, the membranes showed evi-
dence of shrinkage as they were seen to have tightened in place. The shrinkage was
not extensive enough to raise concerns about membrane performance. However, in
December 1989 during record cold temperatures, after about 7 years of exposure,
Sample 1 at Chanute catastrophically shattered across the entire membrane (Figure
2). The membrane was replaced. The shattering was typical of that experienced by
other PVC roof membranes during the late 1980s (Paroli, Smith, and Whelan 1993).
All such failures have reportedly occurred with unreinforced membranes, many of
which were ballasted. The failures have been attributed to stress build up in the
membranes due to shrinkage resulting from plasticizer loss. Unreinforced membranes
would be more likely to have catastrophic failures because reinforcement might be
expected to arrest splits or cracks. The increased risk of failure with ballasted systems
has been discussed by Pastuska (1985), who concluded that a mixture of water, mud,
microorganisms, and oxygen on the ballasted membrane surface tends to increase
plasticizer loss.
16 USACERL TR 96/23
Figure 1. Stretching of the membrane.
Figure 2. Shattering of the membrane of SampleI tCnu.
USACERL TR 96/23 17
For 10 years the inspections
at Chanute indicated satis-
factory performance of mem-brane Samples 2 and 3. In
the spring of 1994 (after
about 11 years of service),
both samples experiencedproblems. In the case of
Sample 2, the membraneshattered in the area alongthe south edge of the build-ing where it had been
stretched by the sliding bal-last (Figure 3). Althoughthe area of shattering waslimited, the entire mem- - ,+
brane was replaced because
of the risk that the unshat-tered section of the mem-brane might also fail cata-strophically. In the case ofSample 3, two splits oc-
curred in the field of themembrane. The splits were
repaired as the majority ofthe membrane was con-sidered still functional. Figure 3. Sample 2 at Chanute shows the shattered membrane
where it was stretched by the sliding ballast.
Performance of all PVCmembranes at Dugway (Site 2) was satisfactory through 1989 (about 8 years ofservice). However, shortly thereafter, nonroofing related work on the roof resulted inpunctures and cuts of the membranes to the extent that repair was not consideredpractical. Consequently, the Dugway membranes were replaced.
The three membranes at Fort Polk (Site 3) generally have performed satisfactorily formore than 10 years. However, the roof has not been leak free. Some mechanicalfasteners used for securing the roofing backed out from the deck and punctured themembranes. Fastener backout without membrane puncture was observed about 3years into the study, but it was late into the study when the puncturing occurred. Nojudgment was made as to whether the puncturing should be assigned to poor fastener
18 USACERL TR 96/23
performance or poor membrane performance. The punctures have been repaired, and
the roof is still functional.
USACERL TR 96/23 19
4 Analysis of Test Data
Treatment and Presentation of Data
This chapter presents the data and their analyses. The data are presented graphically
(Figures 4 through 16)* and, for each property, one plot gives the measured value
versus time for a given membrane sample (Samples 1, 2, and 3) and installation site
(Sites 1, 2, and 3). Thus, in general, nine plots are given for each property (three
samples times three sites) in each figure. For comparison, all nine plots are given on
a single page. By examining a set of plots across a row, any differences between the
samples at a fixed site are observed. Likewise, by considering a set of plots down a
column, the effect of site on a fixed sample is seen. All individual data points are
plotted, but the plots do not distinguish overstrikes.
The analysis of the data was conducted using a linear model:
response = A0 + A~t
where t = time in months
Ao = a constant (the intercept)
A, = a constant (the slope).
This model was selected after reviewing the plots of measured property value versus
time, which in general did not support the selection of a more complex model.
Although exceptions were noted (for example, see Figure 9, Sample 3 at Site 1), the
number of exceptions was not sufficient to warrant the use of other models. In some
cases where a nonlinear model might be suggested by the plots, scatter in the data
with increasing age was considered partially responsible for this appearance (for
example, see Figure 9, Sample 3 at Site 1 vs Site 3, page 32).
Each plot contains the best-fit straight line for a set of data for each sample at each
site. In slightly over half the analyses, the slope was statistically different from zero(i.e., the magnitude of the slope was at least three times greater than its standard
deviation). In some cases where the slope was not statistically different from zero, the
Figures begin on page 23.
20 USACERL TR 96/23
data exhibited no appreciable time dependence. In others, the apparent change inproperty over time was overshadowed by the large uncertainty in the estimated slope
due to a large scatter in the data.
To aid interpretation of the results, tables for each property (except for plasticizercontent) were prepared to summarize:
"* the initially measured average property value (Mi)"* the estimate of the true value at initial time (Ao)"* the slope of the line '(A1)
Note: In the tables where the units for A1 are [(the units for Ao) x months1 ]either for the S.I. (metric) or customary values.
"* whether the slope was statistically different from zero; the column contains a"yes" whenever the magnitude of the estimated value was at least three times itsstandard deviation
"* an estimate of the percent change in the property over 100 months calculatedusing the model for each data set. The indicated uncertainty in the estimatedpercent change represents one standard deviation.
The estimated percent change in a property was taken as an indicator of how muchthat property changed during the study. A nominal study period of 100 months wasused in the estimate because it was within the range of time over which the samplingat the three sites was performed. The estimate of percent change in property valueprovides a uniform means of comparing the properties as a function of sample and site
and determining those which underwent the greatest change over time.
A summary of the variability in the descriptors Mi, A0, and A1 is given in the Appendix.The variations listed are one standard deviation.
The following sections contain the tables and plots of the data analyses. Commentson key observations for each set of plots and table are given for each property. Manyof these comments focus on the change in properties of the ballasted roofs at Chanute(Site 1) because of the less-than-satisfactory performance at this site. The intent wasto determine whether changes in any of the measured properties were consistentlydifferent for samples from Chanute than for samples from Dugway and Fort Polk.Additionally, in reviewing the results of the seam strength tests, a point of evaluationwas whether solvent-welded seams performed differently than heat-welded seams. As
a note regarding all properties, it was observed that the measured average propertyvalue (Mi) and the estimate of the true value at initial time (Ao) generally were inagreement.
USACERL TR 96/23 21
Plasticizer Content and Plasticizer Loss
The first properties presented are those related to plasticizer loss. However, the
measurement of plasticizer content was not included in the study until 1989, when it
was conducted only on retained initial samples from Chanute and Fort Polk, and those
cut from all roofs after about 5 years of exposure. Initial samples from Dugway hadnot been retained. The membrane materials specified at Dugway and Fort Polk were
the same but probably from different lots. Thus, the initial plasticizer contents of the
Dugway materials might be expected to be comparable to those at Fort Polk.
The following comments may be made about the plasticizer content results given in
Table 3:
"* The data set is limited in that measurements were made only for the original
membrane material and after the roofs had been in service for about 5 to 6 years.
Thus, only trends can be noted."* For each of the three samples, the measured initial plasticizer contents were
essentially the same at Chanute and Fort Polk."* Assuming that, for each of the three samples, the initial Dugway materials were
comparable to those at Chanute and Fort Polk, all PVCs lost plasticizer over the
5 to 6 years of exposure. The range was from about 15 to 30 percent."* In most cases, little difference was seen between many of the plasticizer content
values after 5 to 6 years of exposure. For six of the nine measurements, the
average plastizicer contents of the aged samples ranged from 23 to 26 percent.The others were higher.
Table 3. Plasticizer content measurements (ASTM D 3421).
SITE PLASTICIZER CONTENT, % by mass
Membrane Age Sample 1 Sample 2 Sample 3
Site 1 (Chanute)original 31 ± 3 32 ± 2 35 ±168 months 23 ± 2 26 ±1 25 ±1
-r. .. . . . . . . . . . . . . . . . . . . . . . . . . . . . . . . . . . . . . . . . . .... . .. .. .. .
Site 2 (Dugway)original .........62 months 26 ±1 28 ±2 31 ±1
Site 3 (Fort Polk)original 30 ±1 31 ±1 34 ±160 months 25 ±1 26 ± 2 29 ±1
Note: This property was not measured for unaged samples from Site 2.
22 USACERL TR 96/23
The ballasted aged Sample 1 at Chanute showed the lowest average plasticizer
content; this was the membrane that experienced catastrophic shatter. The
exposed aged Sample 1 at Fort Polk had the second lowest average value; this
membrane has performed satisfactorily. Considering the variation in the data,
these two aged samples had essentially the same plasticizer content after about
5 to 6 years of service. Chanute is located in the North; whereas Fort Polk is in
the South.
Similarly, the average plasticizer content for aged Sample 2 at Chanute was the
same as that of aged Sample 2 at Fort Polk. Chanute experienced problems;
whereas Fort Polk has performed satisfactorily.
In the case of Sample 3, the ballasted membrane at Chanute lost more plasticizer
than the exposed membranes at Dugway and Fort Polk.
The plasticizer loss test "drives" plasticizer from the sheet material. The loss value is
determined by heating the specimen removed from the roof and measuring the mass
lost during heating. If the amount lost during the test decreases with time of field
exposure, it may be that the plasticizer was lost during field exposure.
The following comments may be made about the plasticizer loss results given in Table
4 and Figure 4:
For Site 2, no initial data were available to include in the analysis. The first
measurements were made when the Site 2 samples were 52 months old. For the
available data at Site 2, none of the slopes of the regression lines were
statistically different from zero. This may be an indication that the plasticizer
available for loss during the test may have reached a constant value when the
series of tests of Site 2 samples began. Note, in a similar observation, that the
samples at Sites 1 and 3 showed little variation in the plasticizer loss values
measured after 48 months.
Table 4. Summary of plasticizer loss results (ASTM D 1203).Sample Site M, A0 A, Stat. Est. Change
No. No. (% mass) (% mass) Sign. in 100 Months (%)
1 1 8.1 7.8 -0.0810 yes -103 ±16
1 2 2.5 2.8 -0.0019 no -7 ± 39
1 3 4.9 4.4 -0.0145 no -33 ± 14
2 1 7.7 6.6 -0.0053 yes -80 ± 19
2 2 2.7 3.2 -0.0087 no -27 ± 32
2 3 4.4 3.7 -0.0192 yes -51 ±18
3 1 4.3 3.8 -0.0273 yes -72 ± 17
3 2 1.5 1.6 -0.0032 no -2 ±4
3 3 1.8 1.5 -0.0031 no -21 ±22
USACERL TR 96/23 23
site 1 , sample 1 site 1 , sample 2 site 1 , sample 310 10 10
it* *4 *
0 30 60 90 120 0 30 60 90 120 0 30 60 90 120
site 2 sample 1 site 2 , sample 2 site 2 , sample 3
:0* *
' . 0' , 0 ,0 30 60 90 120 0 30 60 90 120 0 30 60 90 120
TIME, months
Figure 4. Results of the plasticizer loss tests.
24 USACERL TR 96/23
For each sample, the values of plasticizer loss were greater (by a factor of about
2) at Site 1 than at Site 3. Reasons for this observation (e.g., material variability,
test method variability, or unknown factors related to shipping, installation, or
initial outdoor exposure) are not known."* For Samples 1 and 2, the final values of plasticizer loss were lower at Site 1
(ballasted membranes) than at Site 3 (exposed membranes). For Sample 3, thefinal values were about the same at Site 1 and at Site 3.
"* A comparison of the estimated percent change over 100 months for the samples
at Sites 1 and 3 has little meaning considering the greater initial values at Site
1 versus Site 3. It is noted that, for the samples, four of the six regression lines
had slopes statistically different from zero.
Tensile Strength
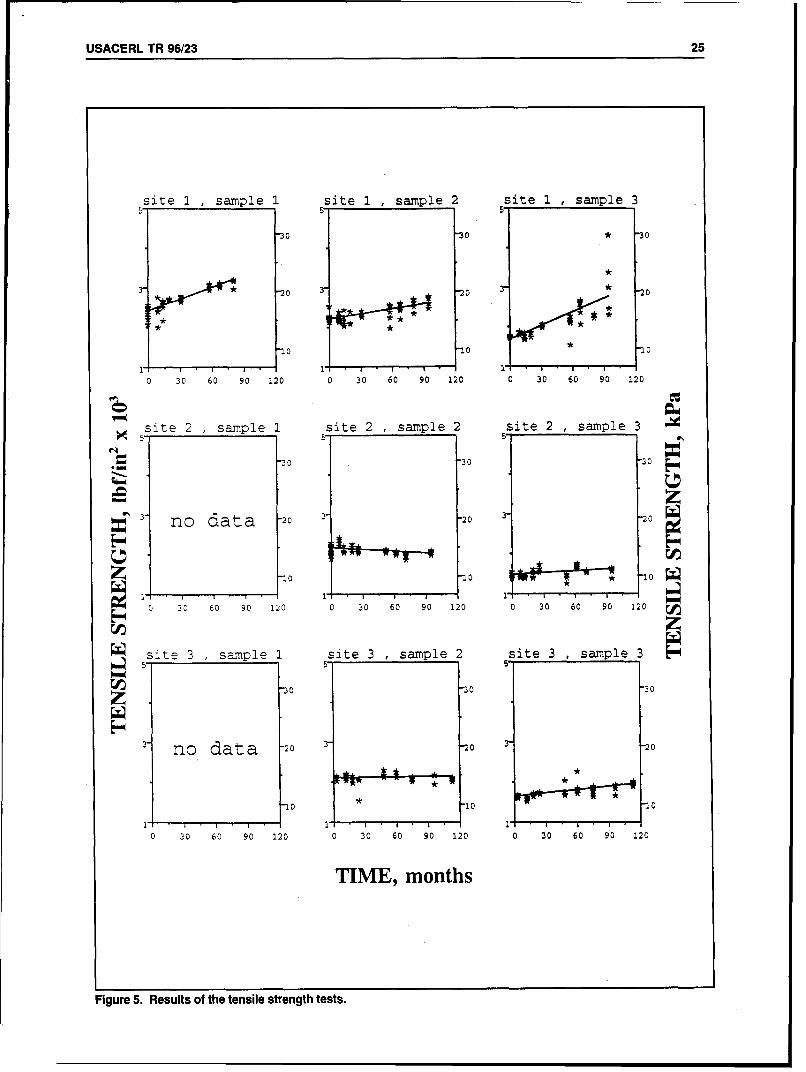
The following comments may be made about the tensile strength results given in Table
5 and Figure 5:
"* Initial tensile strength for Sample 1 was stronger than Sample 2, which was
stronger than Sample 3."* With the exception of Sample 2 at Site 2, the slopes of the regression lines were
positive, indicating an increase of strength with time. With the exception of
Sample 2 at Site 3 and Sample 3 at Site 2, the slopes were statistically differentfrom zero.
Table 5. Summary of tensile strength results (ASTM D 882).
Sample Site M, A, A1 Stat. Est. ChangeNo. No. (psi) (psi) Sign. in 100 Months (%)
1 1 2412 2429 9.6 yes 40± 10
2 1 2286 2226 4.05 yes 18 3
2 2 2104 2169 -1.52 yes -7 2
2 3 2112 0.29 no 1 ±2
3 1 1776 1686 11.42 yes 68 ±11
3 2 1493 1485 1.417 no 9 3
3 3 1677 1647 2.66 yes 16 3Note: This property was not measured for Sample 1 at Sites 2 and 3.
USACERL TR 96/23 25
site I , sample 1 site 1 , sample 2 site 1 , sample 3
"30 "30 * 30
q*
""20 0- * "20
-,0 "10 * 101* • , 1 , 1 ' i •
0 30 60 90 120 0 30 60 90 120 0 30 60 90 120
site 2 sample 1 site 2 , sample 2 site 2 , sample 3_ ' 5 , 5
S30 "30 "30
zzz3 r no data -20 3- -20 3- -20
COOZ 0 10W1
* 30 60 90 120 0 30 60 90 120 0 30 60 90 120
site 3, sample 1 site 3 ,sample 2 site 3 ,sample 3
-30 "30 "30
no data -20 "20 3 -20
0 10 "10
1 1I 1 I
0 30 60 90 120 0 30 60 90 120 0 30 60 90 120
TIME, months
Figure 5. Results of the tensile strength tests.
26 USACERL TR 96/23
"* Sample 3 at Site 1 showed the largest estimated percent increase over time (68
percent). The data for this sample had considerable scatter at the longer
exposure times, which may have contributed to the estimated increase."* For the data set, the three samples at Site 1 showed the largest estimated per-
cent increase. Site 1 membranes were ballasted and experienced problems in
service."* The largest estimated percent change for a nonballasted system was found for
Sample 3 at Site 3. This value (16 percent) was comparable to that (18 percent)
found for the ballasted Sample 2 at Site 1.
Elongation
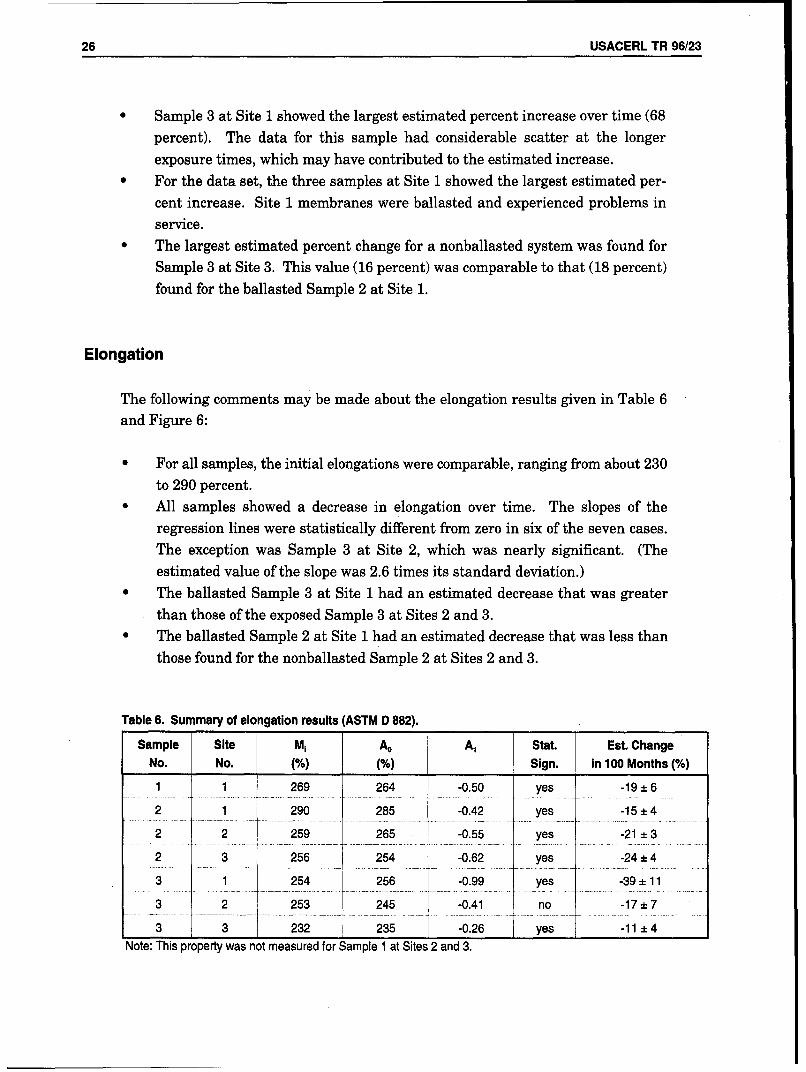
The following comments may be made about the elongation results given in Table 6
and Figure 6:
"* For all samples, the initial elongations were comparable, ranging from about 230
to 290 percent."* All samples showed a decrease in elongation over time. The slopes of the
regression lines were statistically different from zero in six of the seven cases.The exception was Sample 3 at Site 2, which was nearly significant. (The
estimated value of the slope was 2.6 times its standard deviation.)"* The ballasted Sample 3 at Site 1 had an estimated decrease that was greater
than those of the exposed Sample 3 at Sites 2 and 3."* The ballasted Sample 2 at Site I had an estimated decrease that was less than
those found for the nonballasted Sample 2 at Sites 2 and 3.
Table 6. Summary of elongation results (ASTM D 882).Sample Site M, A, A1 Stat. Est. Change
No. No. (%) (%) Sign. in 100 Months (%)
1 1 269 264 -0.50 yes -19± 6
2 1 290 285 -0.42 yes -15 4
2 2 259 265 -0.55 yes -21± 3
2 3 256 254 -0.62 yes -24± 4
3 1 254 256 -0.99 yes -39 ±11
3 2 253 245 -0.41 no -17± 7
3e232 235 -0.26pryt -11 4Note: This property was not measured for Sample 1 at Sites 2 and 3.
USACERL TR 96/23 27
site 1 , sample 1 site 1 , sample 2 site 1 , sample 3400 40 Cr 400
** .• •* * ** * ** *
20 * 200 200" *
0 30 60 90 120 0 30 60 90 120 0 30 60 90 120
site 2 , sample 1 site 2 , sample 2 site 2 , sample 34001, 40C
2 ac 2 0 ýý 2o0 ' i- no data 2z *
0 *
30 60 90 120 0 30 60 90 120 0 30 60 90 120
zsite 3 sample 1 site 3 , sample 2 site 3 , sample 3
4 C" 400 400
2 C,- 2 0 Cr 2 0 c i '
2 no data20*0*
0 30 60 90 120 0 30 60 90 120 0 30 60 90 120
TIME, months
Figure 6. Results of the elongation tests.
28 USACERL TR 96/23
Tear Strength
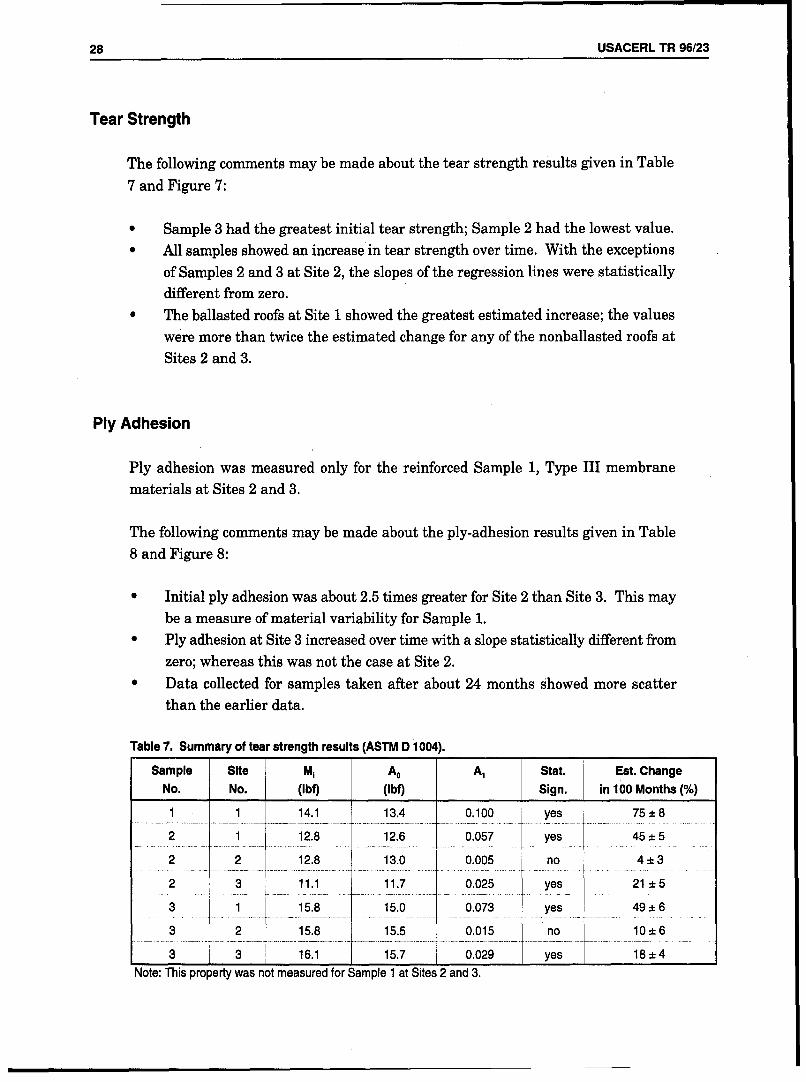
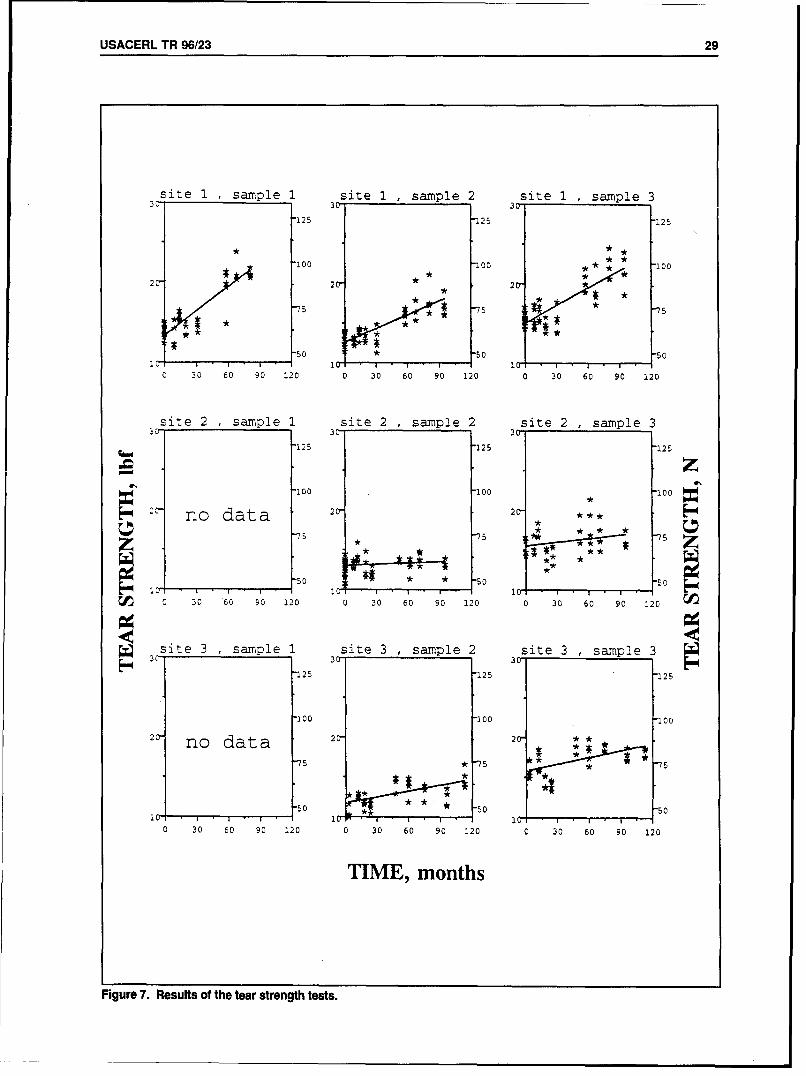
The following comments may be made about the tear strength results given in Table
7 and Figure 7:
* Sample 3 had the greatest initial tear strength; Sample 2 had the lowest value.* All samples showed an increase in tear strength over time. With the exceptions
of Samples 2 and 3 at Site 2, the slopes of the regression lines were statisticallydifferent from zero.The ballasted roofs at Site I showed the greatest estimated increase; the valueswere more than twice the estimated change for any of the nonballasted roofs atSites 2 and 3.
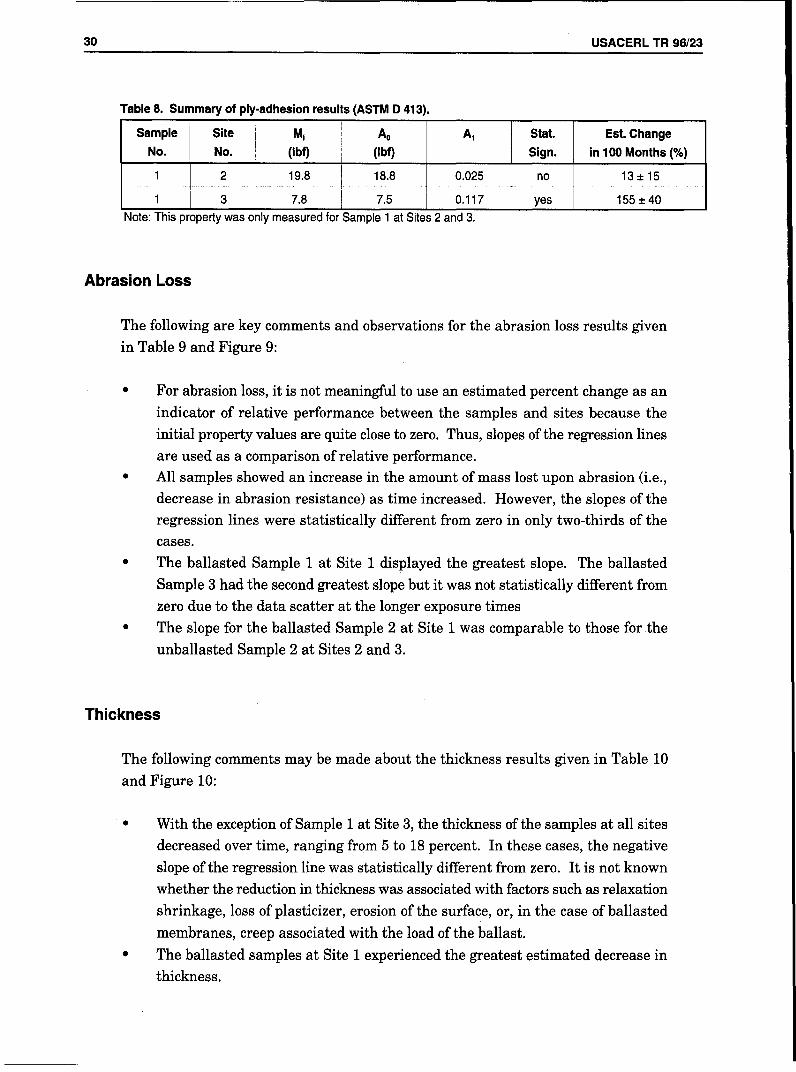
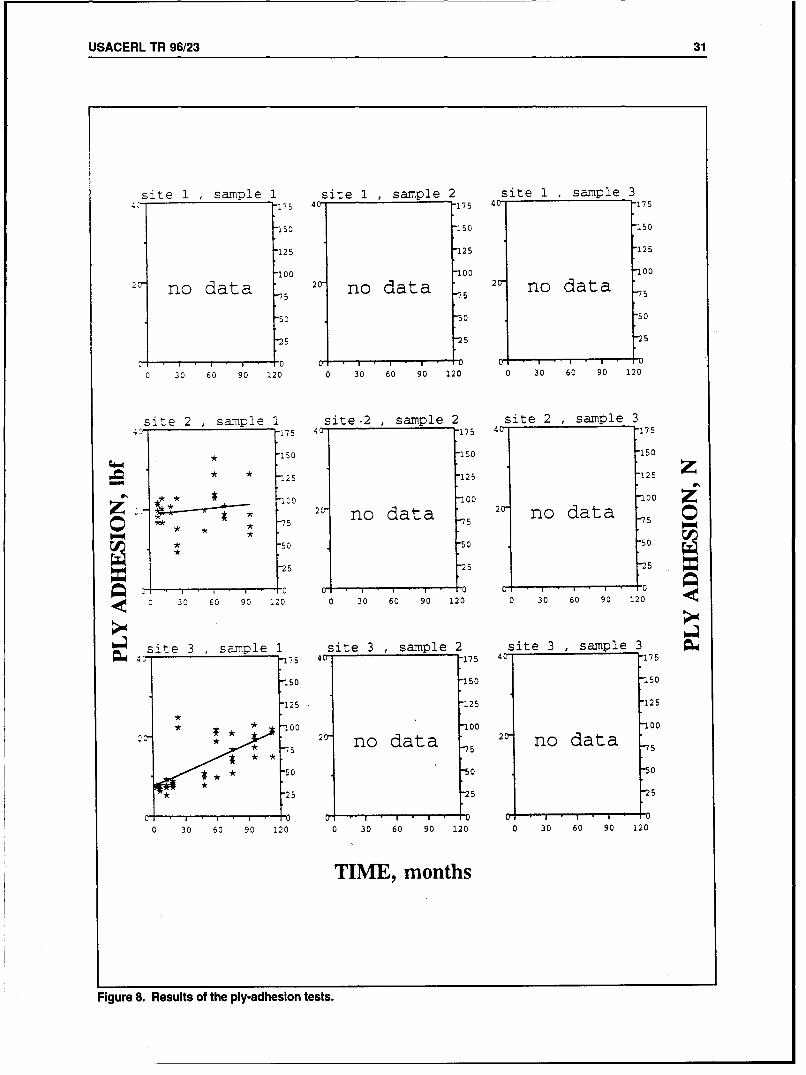
Ply Adhesion
Ply adhesion was measured only for the reinforced Sample 1, Type III membranematerials at Sites 2 and 3.
The following comments may be made about the ply-adhesion results given in Table
8 and Figure 8:
"* Initial ply adhesion was about 2.5 times greater for Site 2 than Site 3. This maybe a measure of material variability for Sample 1.
"* Ply adhesion at Site 3 increased over time with a slope statistically different fromzero; whereas this was not the case at Site 2.
"* Data collected for samples taken after about 24 months showed more scatterthan the earlier data.
Table 7. Summary of tear strength results (ASTM D i004).
Sample Site M, Ao A1 Stat. Est. ChangeNo. No. (lbf) (lbf) Sign. in 100 Months (%)1 1 14.1 13.4 0.100 yes 75± 8
2 1 12.8 12.6 0.057 yes 45± 5
2 2 12.8 13.0 0.005 no 4:± 3
2 3 11.1 11.7 0.025 yes 21 ±5
3 1 15.8 15.0 0.073 yes 49± 6
3 2 15.8 15.5 0.015 no 10:± 6
3 3 16.1 15.7 0.029 yes 18 ± 4Note: This property was not measured for Sample 1 at Sites 2 and 3.
USACERL TR 96/23 29
site 1 , sample 1 site 1 , sample 2 site 1 , sample 33, 30 30 i
"125 2125 "125
* *
"100 -100 * * 1
22 * 2 (, 2
* 275 *7 -75
I so * "50 500 30 60 90 120 0 30 60 90 120 0 30 60 90 120
site 2 , sample 1 site 2 , sample 2 site 2 , sample 3-,,.30 30
125 "125 "125
-100 -100 *'00
no data 2 2 0.-7 5 * -75
[.50-5o -50 •.0' ___ __ __ __ 50 10 ''i • , o 10 ______ __- __ ' o
0 30 60 90 120 0 30 60 90 120 0 30 60 90 120 ,
site 3 ,sample I site 3 ,sample2 site23sample 330 0 30sie3 sml3
"125 "125 "125
3100 -00 2100
2c no data 2 2
"5 * 75 -75
:050 "50 50
0 30 60 90 120 0 30 60 90 120 0 30 60 90 120
TIME, months
Figure 7. Results of the tear strength tests.
30 USACERL TR 96/23
Table 8. Summary of ply-adhesion results (ASTM D 413).
Sample Site Mj A0 A, Stat. Est. ChangeNo. No. (Ibf) (lbf) Sign. in 100 Months (%)
1 2 19.8 18.8 0.025 no 13±15
1 3 7.8 7.5 0.117 yes 155 ± 40
Note: This property was only measured for Sample 1 at Sites 2 and 3.
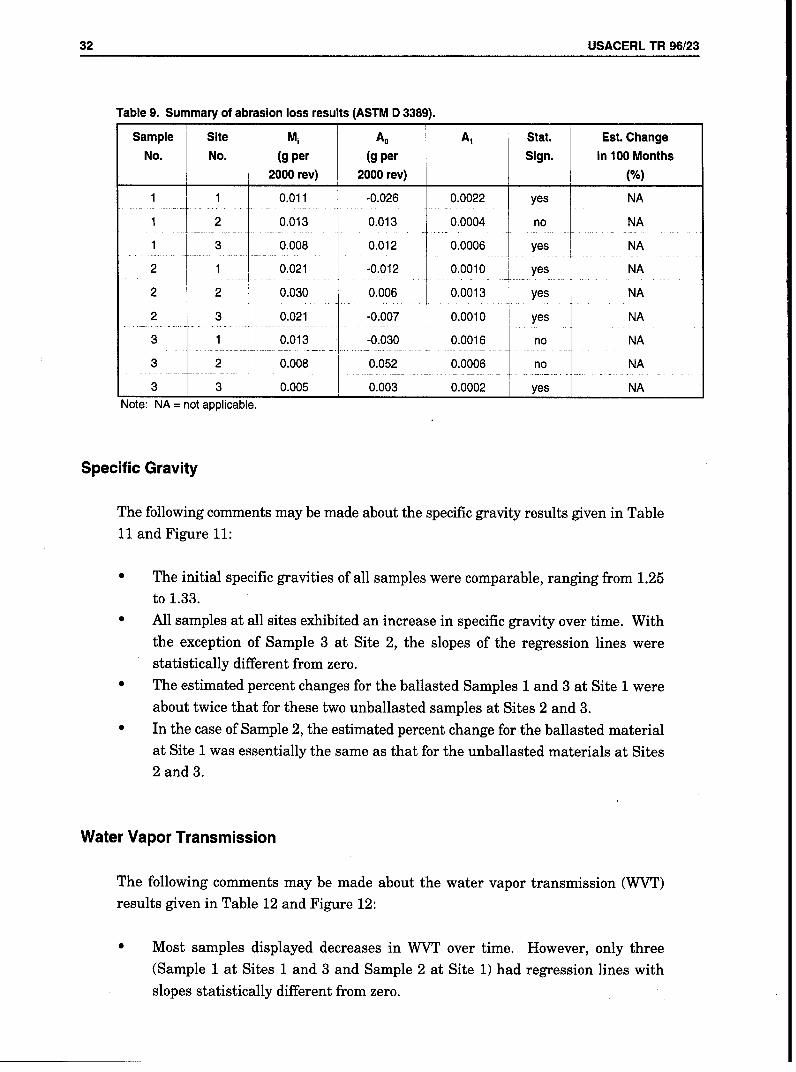
Abrasion Loss
The following are key comments and observations for the abrasion loss results given
in Table 9 and Figure 9:
For abrasion loss, it is not meaningful to use an estimated percent change as an
indicator of relative performance between the samples and sites because the
initial property values are quite close to zero. Thus, slopes of the regression linesare used as a comparison of relative performance.All samples showed an increase in the amount of mass lost upon abrasion (i.e.,
decrease in abrasion resistance) as time increased. However, the slopes of the
regression lines were statistically different from zero in only two-thirds of the
cases.The ballasted Sample 1 at Site 1 displayed the greatest slope. The ballasted
Sample 3 had the second greatest slope but it was not statistically different fromzero due to the data scatter at the longer exposure times
The slope for the ballasted Sample 2 at Site 1 was comparable to those for the
unballasted Sample 2 at Sites 2 and 3.
Thickness
The following comments may be made about the thickness results given in Table 10
and Figure 10:
"* With the exception of Sample 1 at Site 3, the thickness of the samples at all sites
decreased over time, ranging from 5 to 18 percent. In these cases, the negative
slope of the regression line was statistically different from zero. It is not knownwhether the reduction in thickness was associated with factors such as relaxation
shrinkage, loss of plasticizer, erosion of the surface, or, in the case of ballasted
membranes, creep associated with the load of the ballast.
"* The ballasted samples at Site 1 experienced the greatest estimated decrease in
thickness.
USACERL TR 96/23 31
site 1 , sample 1 site 1 , sample 2 site 1 , sample 34. 175 4/ "175 40 175
"150 -150 "150
"125 "125 1125
-100 "100 " 00
no data 2 no data 2 no data 5
"50 50 I50
"25 5 -25
0 ,0 0 i ,0 l0
0 30 60 90 120 0 30 60 90 120 0 30 60 90 120
sike 2 , sample I site .2 , sample 2 site 2 , sample 3175 40 175 40 -175
S-150 -150 -150
* * s "125 -125 e
1i00 1100 700- * 2• no data 20- no dataC -5 -7 5 -75
* 50 "50 50
-5 25 -25
. , 0 0 .0 0 •,
0 30 60 90 120 0 30 60 90 120 0 30 60 90 120
site 3 sample 1 site 3 sample 2 site 3 sample 34 475 40- 175 40 175
150 -150 "150
-125 7125 "125*{00 100 "100
"*° *• : 2 no data 2 no data-75 nodta -5 -75
-50 50 50
"* "25 -25 -5
0 0 00 30 60 90 120 0 30 60 90 120 0 30 60 90 120
TIME, months
Figure 8. Results of the ply-adhesion tests.
32 USACERL TR 96123
Table 9. Summary of abrasion loss results (ASTM D 3389).
Sample Site Mi A0 A, Stat. Est. ChangeNo. No. (g per (g per Sign. in 100 Months
2000 rev) 2000 rev) (%)1 . 1 0.011 -0.026 0. 0022 yes NA
1 2 0.013 0.013 0.0004 no NA
1 3 0.008 0.012 0.0006 yes NA
2 1 0.021 -0.012 0.0010 yes NA
2 2 0.030 0.006 0.0013 yes NA
2 3 0.021 -0.007 0. 0010 yes NA
3 1 0.013 -0.030 0.0016 no NA
3 2 0.008 0.052 0.0006 no NA
3 3 0.005 .0.003 0.002 yes NANote: NA = not applicable.
Specific Gravity
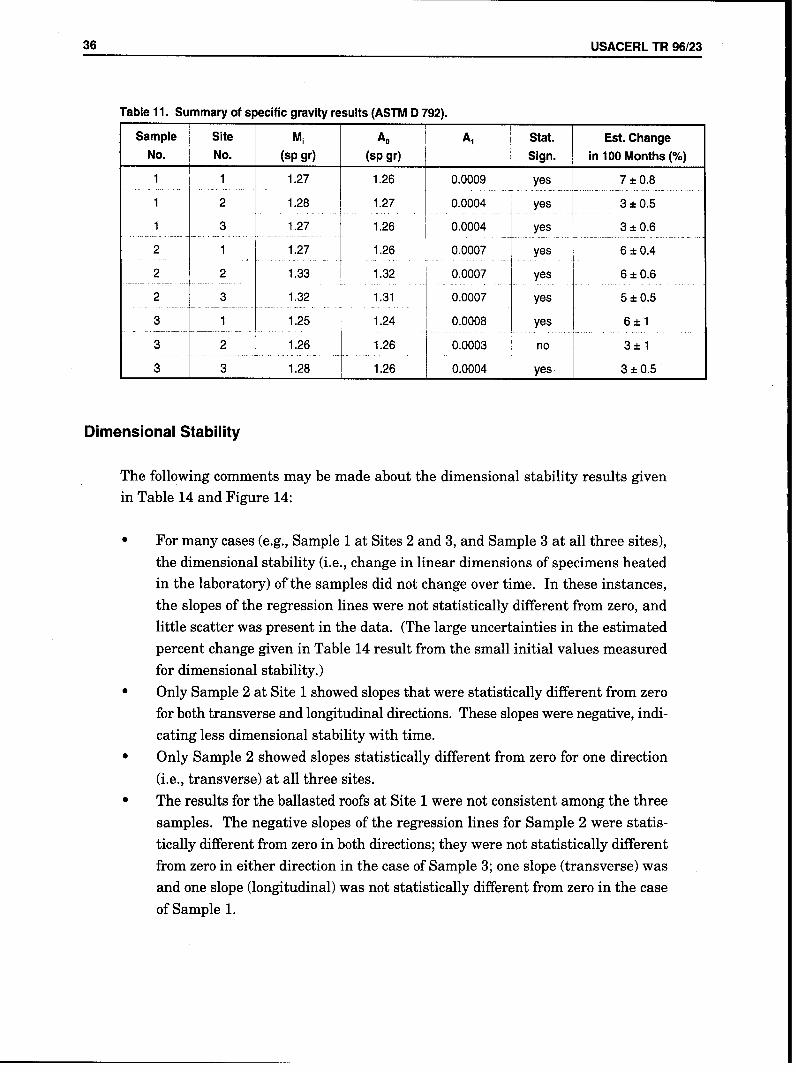
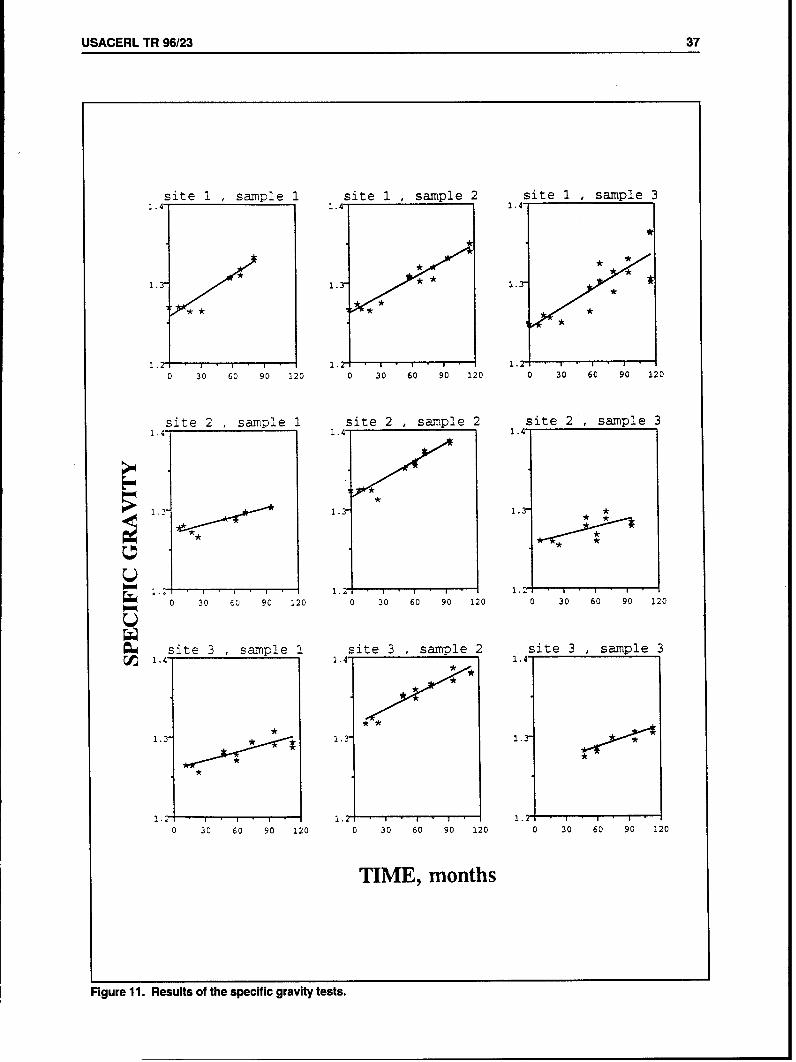
The following comments may be made about the specific gravity results given in Table
11 and Figure 11:
"* The initial specific gravities of all samples were comparable, ranging from 1.25
to 1.33."* All samples at all sites exhibited an increase in specific gravity over time. With
the exception of Sample 3 at Site 2, the slopes of the regression lines were
statistically different from zero."* The estimated percent changes for the ballasted Samples 1 and 3 at Site 1 were
about twice that for these two unballasted samples at Sites 2 and 3."* In the case of Sample 2, the estimated percent change for the ballasted material
at Site 1 was essentially the same as that for the unballasted materials at Sites2 and 3.
Water Vapor Transmission
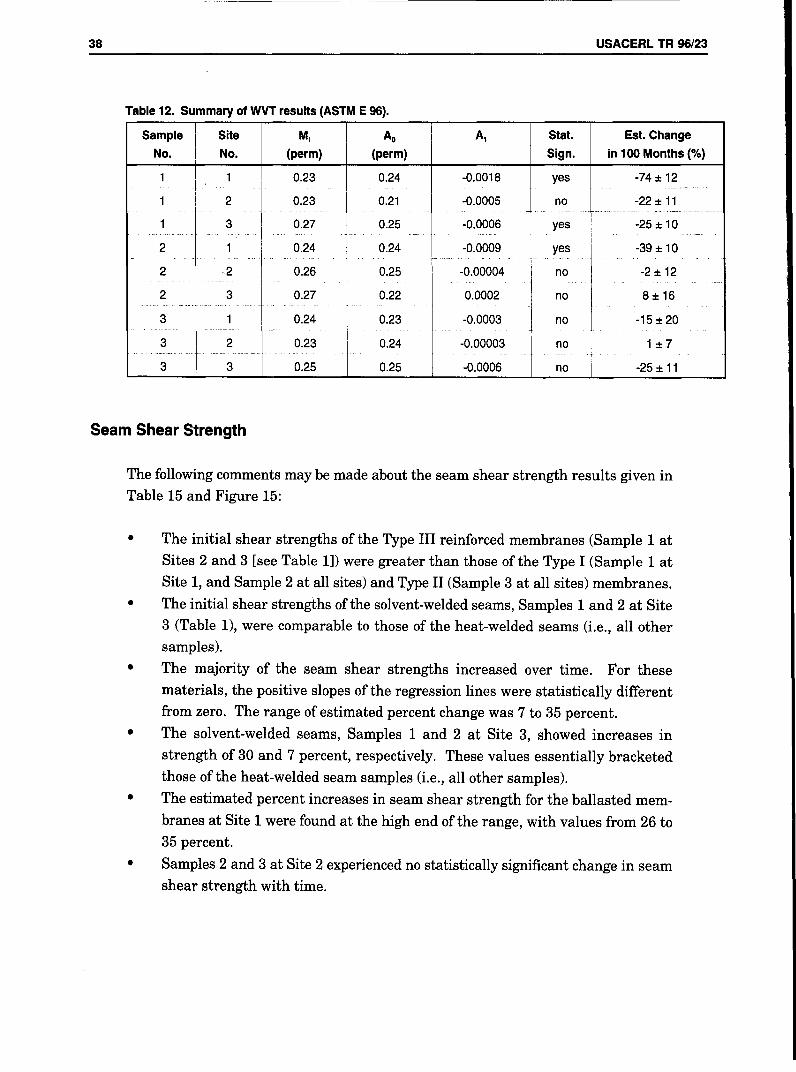
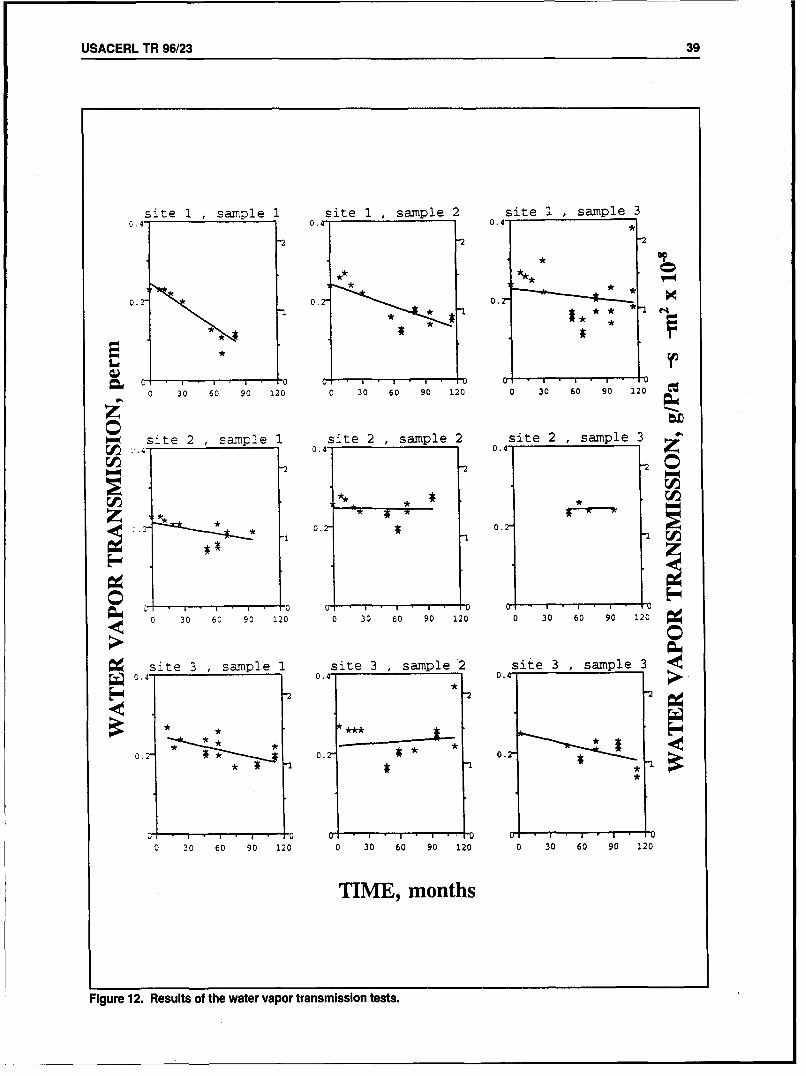
The following comments may be made about the water vapor transmission (WVT)
results given in Table 12 and Figure 12:
Most samples displayed decreases in WVT over time. However, only three
(Sample 1 at Sites 1 and 3 and Sample 2 at Site 1) had regression lines with
slopes statistically different from zero.
USACERL TR 96/23 33
site 1 , sample 1 site 1 , sample 2 site 1 , sample 3C. S 0.5- 0.5
I*
0.25" 0.25- 0.25-
* *
0 30 60 90 120 0 30 60 90 120 0 30 60 90 120
" site 2 , sample 1 site 2 , sample 2 site 2 , sample 3o ,.
S• .- 0.25- 0.25-
r• .. o • , , , •• *. , • •*
So • • o :•o o •o o , ~ o • •o ,o*site3 ,sampe 1 site3 ,samle 2 sit 3 ,samle*
0* 0 I
0 20 60 90 120 0 30 60 90 120 0 30 60 90 120
Fiur 9.Rslte 3f th sampsiles 1es sit. ape2 sie3,sml
34 USACERL TR 96/23
Table 10. Summary of thickness results (ASTM D 1593 or D 751).
Sample Site Mi A, A, x 106 Stat. Est. ChangeNo. No. (in.) (in.) Sign. in 100 Months (%)1 1 0.046 0.046 -71 yes -15:± 1
1 2 0.050 0.050 -25 yes -5±k1
1 3 0.049 0.049 -3 no <-1±3
2 1. 0047 . 0.047 -60 yes .13•± 1
2 2 0.047 0.048 -52 yes -11 ± 1
0.047 0. 047-48 yes -10±t1
3 I 0.047 0.047 -84 yes -18 ± 1
3 2 0.055 0.054 -60 yes -11±3
3 3 0.048 0.050 -33 yes -7 ± 2
"* In most cases where the slope was not statistically different from zero, con-siderable scatter in the data occurred.
"* For Samples 1 and 2, the WVT was considerably greater at Site 1 (ballasted
installation) than at the other two sites."* For Sample 3, the ordering is unclear due to the large uncertainties in the esti-
mated changes at Sites 1 and 3.
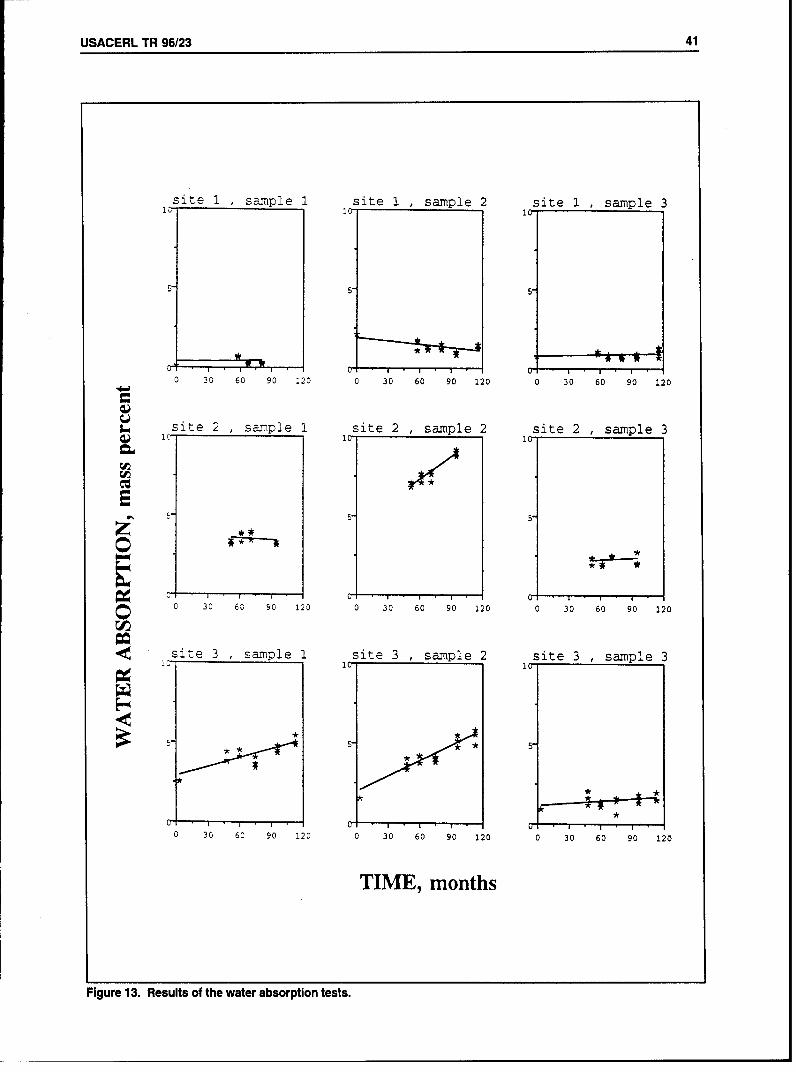
Water Absorption
The following comments may be made about the water absorption results given inTable 13 and Figure 13:
"* In six cases (exceptions for Sample 1 at Site 3 and Sample 2 at Sites 2 and 3), the
slopes of the regression lines were not statistically different from zero. For thesix cases, no statistically significant change in water absorption occurred over
time. In these cases, little scatter in the data was observed. (The large uncer-
tainties in the estimated percent change given in Table 13 result from the smallinitial values measured for water absorption.)
"* In contrast to the six samples that showed no change of water absorption, forSample 1 at Site 3 and Sample 2 at Sites 2 and 3, the slopes of the regression
lines were positive and statistically different from zero. The estimated percentincreases over time for these samples was 65, 108, and 165 percent, respectively.
USACERL TR 96/23 35
site 1 , sample 1 site 1 , sample 2 site 1 , sample 31• .9C.075 1.90.075! 1.9
"1.6 -1.6 -1.6
.05- -1.3 0.05-1".. 0.05- -1.3
0.05 13 0.025 1.3 0.025
*" *
_____________ 0.7 ".7 -. 7S" _.0 . , , . 0.025 1 0.025 • , . , • •[•
0 30 60 90 120 0 30 60 90 120 0 30 60 90 120
site 2 , sample 1 site 2 , sample 2 site 2 , sample 3
. .- .9 0.075 ! 1.9 0.075 -1.9
"1.6 -1.6 -1.6
1.3 0.05t -1.3 0.05" -1.3
1*
"0..7 0.7 *0.70.025 1 0.025 9 1 E-006 90 120 0 30 60 90 120 0 30 60 90 120
Ssite 3 sample 1 e site 3 tsample 2 7site 3 sample 3
-1.6 -. 6 -. 6
*1. *- 1,3o0.o *ý .3
_____________ 0.7 0.7 0.70032 5' 0.025 0025'
0 .30 60 90 120 0 30 60 90 120 0 30 60 90 120
TIME, months
Figure 10. Results of the thickness tests.
36 USACERL TR 96/23
Table 11. Summary of specific gravity results (ASTM D 792).
Sample Site Mi A, A1 Stat. Est. ChangeNo. No. (sp gr) (sp gr) Sign. in 100 Months (%)
1 1 1.27 1.26 0.0009 yes 7 + 0.8
1 2 1.28 1.27 0.0004 yes 3 ±0.5
1 3 1.27 1.26 0.0004 yes 3± 0.6
2 1 1.27 1.26 0.0007 yes 6±0.4
2. 1 2 1.33 1.32 0.0007 yes 6 ± 0.6
2 3 1.32 1.31 0.0007 yes 5 ± 0.5
3 1 1.25 1.24 0.0008 yes i 6±1
3 2 1.26 1.26 0.0003 no 3 ± 1
3 3 1.28 1.26 0.0004 yes 3 ±0.5
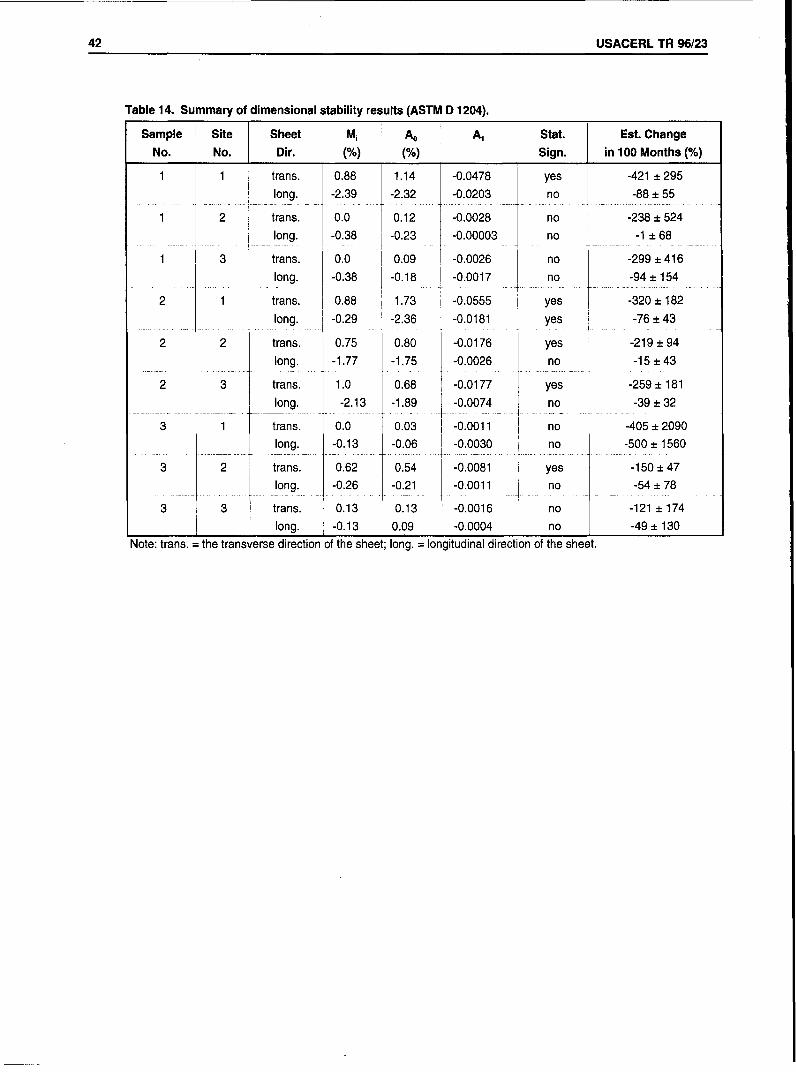
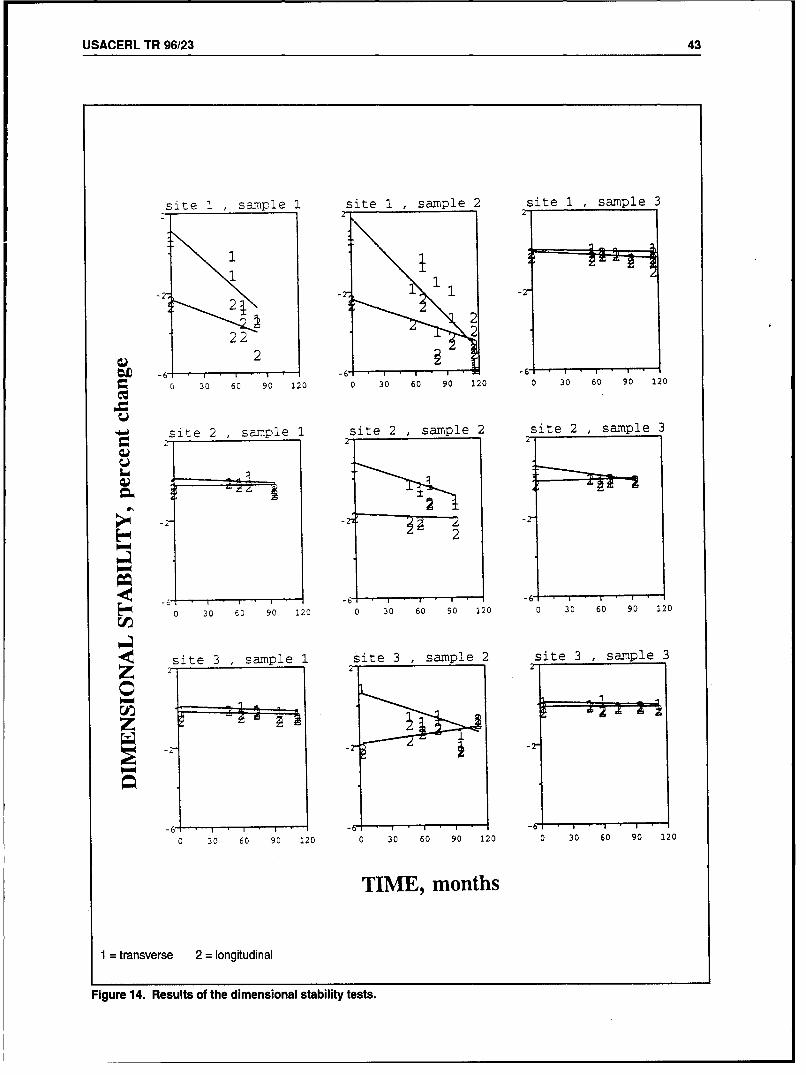
Dimensional Stability
The following comments may be made about the dimensional stability results given
in Table 14 and Figure 14:
"* For many cases (e.g., Sample 1 at Sites 2 and 3, and Sample 3 at all three sites),the dimensional stability (i.e., change in linear dimensions of specimens heatedin the laboratory) of the samples did not change over time. In these instances,the slopes of the regression lines were not statistically different from zero, andlittle scatter was present in the data. (The large uncertainties in the estimatedpercent change given in Table 14 result from the small initial values measuredfor dimensional stability.)
"* Only Sample 2 at Site 1 showed slopes that were statistically different from zerofor both transverse and longitudinal directions. These slopes were negative, indi-cating less dimensional stability with time.
"* Only Sample 2 showed slopes statistically different from zero for one direction(i.e., transverse) at all three sites.
"* The results for the ballasted roofs at Site 1 were not consistent among the threesamples. The negative slopes of the regression lines for Sample 2 were statis-tically different from zero in both directions; they were not statistically differentfrom zero in either direction in the case of Sample 3; one slope (transverse) wasand one slope (longitudinal) was not statistically different from zero in the caseof Sample 1.
USACERL TR 96/23 37
site 1 , sample 1 site 1 , sample 2 site 1 , sample 3
0 30 •60 90 120 0 30 60 90 120 0 30 60 90 120
site 2 ,sample 1 14s ite 2 ,sample 2 14site 2 ,sample 31.4 1.43 1.4
* 1.2*
0 30 60 90 120 0 30 60 90 100 3 0 9 2
O site 3 ,sample 1 site 3 ,sample 2 site 3 ,sample 31. 1.4 i*1.4
_A 1.2 1.,
0 30 60 90 120 0 30 60 90 120 0 30 60 90 120
TIME, months
Figure 11. Results of the specific gravity tests.
38 USACERL TR 96/23
Table 12. Summary of WVT results (ASTM E 96).
Sample Site M, A0 A1 Stat. Est. ChangeNo. ! No. (perm) (perm) Sign. in 100 Months (%)
1 1 0.23 0.24 -0.0018 yes -74:± 12
1 2 0.23 0.21 -0.0005 no -22:± 11
1 3 0.27 0.25 -0.0006 yes -25 ± 10
2 1 0.24 0.24 -0.0009 yes -39 ± 10
2 -2 0.26 0.25 -0.00004 no -2 ± 12
2 3 0.27 0.22 0.00,02 no 8 ± 16
3 1 0.24 0.23 -0.0003 no -15 ± 20
3 2 0.23 0.24 -0.00003 no 1 ± 7
3 . 3 0.25 0.25 -0.0006 no j -25±11
Seam Shear Strength
The following comments may be made about the seam shear strength results given inTable 15 and Figure 15:
The initial shear strengths of the Type III reinforced membranes (Sample 1 atSites 2 and 3 [see Table 1]) were greater than those of the Type I (Sample 1 atSite 1, and Sample 2 at all sites) and Type II (Sample 3 at all sites) membranes.The initial shear strengths of the solvent-welded seams, Samples 1 and 2 at Site3 (Table 1), were comparable to those of the heat-welded seams (i.e., all other
samples).The majority of the seam shear strengths increased over time. For these
materials, the positive slopes of the regression lines were statistically differentfrom zero. The range of estimated percent change was 7 to 35 percent.
The solvent-welded seams, Samples 1 and 2 at Site 3, showed increases in
strength of 30 and 7 percent, respectively. These values essentially bracketedthose of the heat-welded seam samples (i.e., all other samples).The estimated percent increases in seam shear strength for the ballasted mem-
branes at Site 1 were found at the high end of the range, with values from 26 to
35 percent.Samples 2 and 3 at Site 2 experienced no statistically significant change in seam
shear strength with time.
USACERL TR 96/23 39
site 1 , sample 1 site 1 , sample 2 site 1 , sample 3.40.4 0.4-
*"*
** *.** ,.
0.2- 0..0
0 . *10 0 aa0 30 60 90 120 0 30 60 90 120 0 30 60 90 120
z0*• site 2 ,sample I site 2 ,sample 2 site 2 ,sample3
site2 3 sample 1 site23, samnple 2 site23, sample 3
0.4 0.4- 0.4- z
* **
*.2" 0.2 0.2-Fz
O ' • i • 0 , • , • 0 • • • i • 0
C 30 60 90 120 0 30 60 90 1200 30 60 90 120
site 3 sample 1 site 3 thsample 2 site 3 t isample 30.4- 0.4-0.
020.-0.2-
SU V 40
0 30 60 90 120 0 30 60 90 120 0 30 60 90 120
TIME, months
Figure 12. Results of the water vapor transmission tests.
40 USACERL TR 96/23
Table 13. Summary of water absorption results (ASTM D 570).
Sample Site Mi A, A, Stat. Est. Change
No. No. (% mass) (% mass) Sign. in 100 Months (%)1 1 0.2 0.40 0.0009 1 no 23 ±94
1 2 3.3 3.8 -0.0037 no -10 ± 16
1 3 2.6 2.9 0.0189 yes 65 ±19
2 1 2.2 1.9 -0.0070 no -36 ± 15
2 2 7.0 4.4 0.0477 yes 108 ± 20
2 3 1.6 2.0 0.0324 yes 165 ± 38
3 1 0.8 0.8 0.0015 no 18 ± 25
3 2 2.3 2.0 0.0038 no 19 ± 32
3 3 1.0 1.2 0.0046 no 40 ± 35
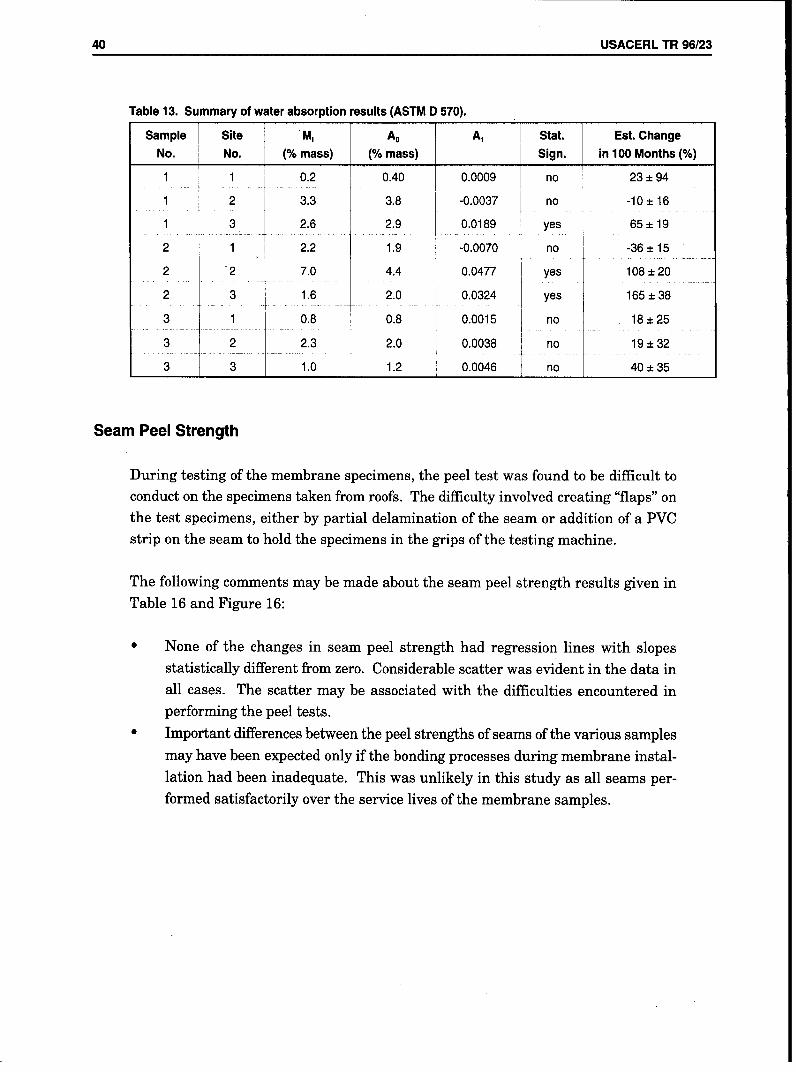
Seam Peel Strength
During testing of the membrane specimens, the peel test was found to be difficult to
conduct on the specimens taken from roofs. The difficulty involved creating "flaps" onthe test specimens, either by partial delamination of the seam or addition of a PVC
strip on the seam to hold the specimens in the grips of the testing machine.
The following comments may be made about the seam peel strength results given in
Table 16 and Figure 16:
None of the changes in seam peel strength had regression lines with slopesstatistically different from zero. Considerable scatter was evident in the data inall cases. The scatter may be associated with the difficulties encountered in
performing the peel tests.
Important differences between the peel strengths of seams of the various samples
may have been expected only if the bonding processes during membrane instal-lation had been inadequate. This was unlikely in this study as all seams per-
formed satisfactorily over the service lives of the membrane samples.
USACERL TR 96/23 41
site 1 , sample 1 site 1 , sample 2 site 1 sample 3
55
v*00 ' l • 0 l a0 30 60 90 120 0 30 60 90 120 0 30 60 90 120
site 2 , sample 1 site 2 , sample 2 site 2 , sample 3
10 1 .
z
0 30 60 90 120 0 30 60 90 120 0 30 60 90 120
Ssite 3 sample 1 site 3 , sample 2 site 3 , sample 300 10I 10 1
*
*
0 30 60 90 120 0 30 60 90 120 0 30 60 90 120
TIME, months
Figure 13. Results of the water absorption tests.
42 USACERL TR 96123
Table 14. Summary of dimensional stability results (ASTM D 1204).
Sample Site Sheet Mi A0 A, Stat. Est. Change
No. No. Dir. (%) (%) Sign. in 100 Months (%)
1 1 trans. 0.88 1.14 -0.0478 yes -421 ± 295
long. -2.39 -2.32 -0.0203 no -88 ± 55
1 2 trans. 0.0 0.12 -0.0028 no -238 ± 524
0long. 0.38 -0.23 -0.00003 no -1 ± 68
1 3 trans. 0.0 0.09 -0.0026 no -299 ± 416
long. -0.38 -0.18 -0.0017 no -94 ± 154
2 1 trans. 0.88 1.73 -0.0555 yes -320 ± 182
long. -0.29 -2.36 -0.0181 yes -76 ± 43
2 2 trans. 0.75 0.80 -0.0176 yes -219 ± 94
long. -1.77 -1.75 -0.0026 no -15 ±43
2 3 trans. 1.0 0.68 -0.0177 yes -259 ± 181
long. -2.13 -1.89 -0.0074 no -39 ±32
3- trans. 0.0 0.03 -0.0011 no -405 ± 2090
long. -0.13 -0.06 -00030 no -500 ± 1560
3 2 trans. / 0.62 0.54 -0.0081 I yes -150 ± 47
long. -0.26 -0.21 -0.0011 j no -54 ±78
3 3 trans. 0.13 0.13 -0.0016 1 no -121 ± 174
_ long. -0.13 0.09 -0.0004 no -49 ± 130
Note: trans. = the transverse direction of the sheet; long. = longitudinal direction of the sheet.
USACERL TR 96/23 43
site 1 , sample 1 site 1 , sample 2 site 1 , sample 3
1 3: £ =•
-27 -2"
212 222 2
2-6 -6"-6
0 30 60 90 120 0 30 60 90 120 0 30 60 90 120
site 2 , sample 1 site 2 , sample 2 site 2 , sample 3
-; 722
-- 0
0 30 60 90 120 0 30 60 90 120 0 30 60 90 120
site 3 , sample 1 site 3 , sample 2 site 3 , sample 3, 2 2-
-6 -6 ' i -6' •
0 30 60 90 120 0 30 60 90 120 0 30 60 90 120
TIME, months
1 = transverse 2 = longitudinal
Figure 14. Results of the dimensional stability tests.
44 USACERL TR 96/23
Table 15. Summary of seam shear strength results (ASTM D 882).
Sample Site MiA, A, Stat. Est. ChangeNo. No. (lbfiin) (I bfri n) _ _____ Sign. inl100Months (%)
1 1 79.3 82.1 0.29 yes 35±t4
1 12 14 9. 2 --- 15,6.0- { 0:31 --ye~s,. 20±
1 3 116.3 130.2 0.39 yes 30±8
2 1 76.2 75.4 0.20 yes 26 ±4
2 -2 82.3 81.1 0.004 no 0.5±3
2 3 - 79.8 80.4 -0.06 -yes 7±2
3 1 76.1 74.5 0.22 yes 30±3
3 2 74.0 66.8 0.03 no 5±6
3 3 77.0 75.6 0.08 yes 11±2
Table 16. Summary of seam peel strength results (ASTMV D 1876). ____ ________
Sample Site M, AO A, Stat. [ Est. ChangeNo. No. (lbfiin.) (IbfI~n.) _ _____JSign. [in 100 Months (%)
1 1 44.4 35.0 0.134 no 38 2140.6-34.2--0.--1
40.6 34--- -06..no -81
1319.8 22.3 039no 17±3
2 1 25. 28.4 I 0.054 no 19±14
2 ij37 3. -0.005 - no _4 ±- 12 3 13.5 12.3 0.042 1 no 34 ±14
-3 1 35.5 --- 37.2 0.046 { o { 12 ±10
3 2 25.2 18.3 0.068 j no 37±41
3 3 50.8 44.2 -0.050 L no -11 ±14
USACERL TR 96/23 45
site 1 , sample 1 site 1 , sample 2 site 1 , sample 3250 250 250-
"4 0 "4 0 ,4 0
125- 1252 125-2
0 0 0
0 30 60 90 120 0 30 60 90 120 0 30 60 90 120
site 2, sample 1 site 2, sample 2 site 2, sample 325C25 250,"4 0 "4 0 4 0
,,** * *
-£-20 15-20 2520S125- 125'
I0 0 0 0 0c 60 90 120 0 30 60 90 120 0 30 60 90 120
site 3 , sample 1 site 3 , sample 2 site 3 , sample 32 250 250'-
"-40 "40 -4044
.2£ 125 125""0 0 0
*I*I
,0• , *, 0 0 ,* • , • 0 0 • , C
0 30 60 90 120 0 30 60 90 120 0 30 60 90 120
TIME, months
Figure 15. Results of the seam shear strength tests.
46 USACERL TR 96/23
site I , sample 1 site 1 sample 2 site 1 , sample 37- -12 7 D '12 2
** ,-** * * *
"*6 3*5 -*6
' . . 0 0 0 0 00 30 60 90 120 0 30 60 90 120 0 30 60 90 120
site 2 sample 1 site 2 , sample 2 site 2 , sample 3-12 712 70 I -12, -
6 35* 5
0• U 1 . 0 ci . o
- *c * * "635* "6 35- *6 35* *
* *)
** I* * *
10 0 30 60 90 120 0 30 60 90 120
Fsite 3 , sample 1 site 3 , sample 2 site 3 sample 3S212 "1*2
* * *• , **
35 " *** 6 25"6 35" * "6
*,*t *_._1- *** **. * *
30 60 90 120 0 30 60 90 120 0 30 60 90 120
Figure 16. Results of the seam peel strength tests.
USACERL TR 96/23 47
5 Conclusions and Commentary
Conclusions
The intent of the 10-year field exposure study of the performance of PVC roofing mem-brane materials installed at Chanute Air Force Base, IL, Dugway Proving Ground, UT,
and Fort Polk, LA was to compare the results of laboratory tests of membraneproperties with the observations noted on field performance. Periodically over the 10
years, USACERL obtained samples from the roofs for laboratory characterization ofselected mechanical and physical properties. Additionally, the roofs were visuallyinspected to evaluate their performance. The performance was generally satisfactoryat Dugway and Fort Polk, but problems relating to membrane shattering and splitting
occurred at Chanute. A major difference in the roof construction at Chanute was thatthe membranes were ballasted; at Dugway and Fort Polk, they were mechanically
attached or fully adhered. Experience with the performance of PVC roofing has shown
that ballasted systems may have an elevated risk of poor performance.
Because of the less-than-satisfactory performance at Chanute, statistical analysis ofthe 10-year PVC data set focused on whether changes in any of the measured proper-
ties were consistently different for samples from Chanute than for samples fromDugway and Fort Polk. The properties measured during the study were: plasticizercontent, plasticizer loss, tensile strength, elongation, tear strength, ply adhesion,
abrasion loss, thickness, specific gravity, water vapor transmission, water absorption,
dimensional stability, seam shear strength, and seam peel strength.
The results of the analyses indicated that most of the measurements did not
discriminate between the performance of the PVC membranes at Chanute and those
at Dugway and Fort Polk. This indiscriminate performance may be because a fieldexperiment has hidden variables that are difficult to control and may have significant
influence on the test results (i.e., the variability of membrane materials installed inlarge quantities at different locations and times).
As an illustration of the nondiscriminating nature of the results, it was observed that,as may have been expected, all samples at the three sites lost plasticizer during the
exposure period. Two of the three samples from Chanute did not lose significantly
more plasticizer than those from Dugway or Fort Polk. The limited data on plasticizer
48 USACERL TR 96123
content showed that the aged membrane sample that eventually shattered at Chanutehad the lowest average content. However, these data also indicated that, with the
exception of the shattered membrane at Chanute, aged Sample 1 that performed well
at Fort Polk had, on the average, equal or less plasticizer than any of the other
samples at the other sites. Also, the plasticizer loss test gave mixed results. While the
tests implied that aged membrane Samples 1 and 2 had less plasticizer at Chanute
than at Dugway and Fort Polk, tests of the aged membrane Sample 3 suggested that
samples from the three sites had about the same amount.
Only in the case of tear strength and thickness were the changes larger for the
ballasted membranes at Chanute than for the nonballasted membranes at Dugwayand Fort Polk. In general for all samples, tear strength increased with exposure time,
whereas the thickness decreased with time. It is questioned whether loss of plasticizer
would cause embrittlement of the PVC material which, in turn, would increase tearresistance. Similarly, plasticizer loss could shrink the membrane and be displayed as
a loss in thickness. Both possibilities would need to be investigated in the laboratoryto reach a definitive conclusion.
For a number of other tests, the results showed that changes in the measured property
were greater for two, but not all three, of the ballasted membranes at Chanute thanfor the nonballasted membranes at Dugway and Fort Polk. Included here were tensilestrength, specific gravity, and water vapor transmission. Tests that showed no distinc-
tion between the ballasted Chanute membranes and the nonballasted membranes
were elongation, abrasion loss, water absorption, and dimensional stability.
Finally, the shear and peel tests on the seams did not detect differences between heat-
welded and solvent-welded seams. This finding may have been expected, as both typesof seams performed satisfactorily over the duration of the study. This would imply
that, for the test roofs, the two seam fabrication techniques provided acceptable bonds.
The initial shear strengths for both types of seams were comparable, and generallyincreased with exposure time. Seam peel strengths had considerable data scatter and
differences were not statistically significant.
Final Comment
Note that the data, analyses, and other information in this report are for PVC
membrane materials manufactured over a decade ago. Changes in PVC roofingmembrane technology have occurred since that time, as evidenced by the proposed
revisions to ASTM Standard Specification D 4434. Because of changing technology,
USACERL TR 96/23 49
readers are cautioned against broadening the interpretation of the results of this study
to current PVC membrane materials without supporting data to do so.
50 USACERL TR 96/23
References
ASTM D 4434, "Standard Specification for Poly(vinyl Chloride) Sheet Roofing," ASTM Annual Book of
Standards, Vol 04.04 (American Society for Testing and Materials [ASTM], 1985).
Corps of Engineers Guide Specification (CEGS) 07555, Polyvinyl Chloride (PVC) Roofing, April 1994.
Cullen, William C., Project Pinpoint Analysis: Ten-Year Performance Experience of Commercial Roofing
1983-1992 (National Roofing Contractors Association, 1993).
Foltz, S., and D.M. Bailey, "Polyvinyl Chloride (PVC) Roofing: Preliminary Field Test Results," Roofing
Research and Standards Development: Second Volume, ASTM STP 1088, Thomas J. Wallace andWalter J. Rossiter, eds. (ASTM, November 1990), pp 63-81.
Marvin, E., G. Middleton, L. Eubanks, M. Rosenfield, J. Blair, and E. Lindow, Evaluation of AlternativeReroofing Systems, Technical Report (TR) M-263/ADA071578 (U.S. Army Construction Engineering
Research Laboratory [USACERL], June 1979).
Paroli, Ralph M., Thomas L. Smith, and Brian J. Whelan, "Shattering of Unreinforced PVC RoofingMembranes: Problem Phenomenon, Causes and Prevention," Proceedings, 10th Conference on
Roofing Technology (National Roofing Contractors Association, April 1993), pp 173-176.
Pastuska, Gerhard, "Roof Coverings Made of PVC Sheetings: The Effect of Plasticizers on Lifetime andService Performance," Proceedings, Second International Symposium on Roofing Technology(National Roofing Contractors Association, September 1985), pp 173-176.
Rosenfield, Myer J., Construction of Experimental Polyvinyl Chloride (PVC) Roofing, TR M-343/ADA145406 (USACERL, April 1984).
Rosenfield, Myer J., An Evaluation of Polyvinyl Chloride (PVC) Single-Ply Membrane Roofing System, TRM-284/ADA097931 (USACERL, March 1981).
Rosenfield, M.J., and J. Wilcoski, Experimental Polyvinyl Chloride (PVC) Roofing: Field Test Results, TR
M-87/04/ADA178193 (USACERL, February 1987).
USACERL TR 96/23 51
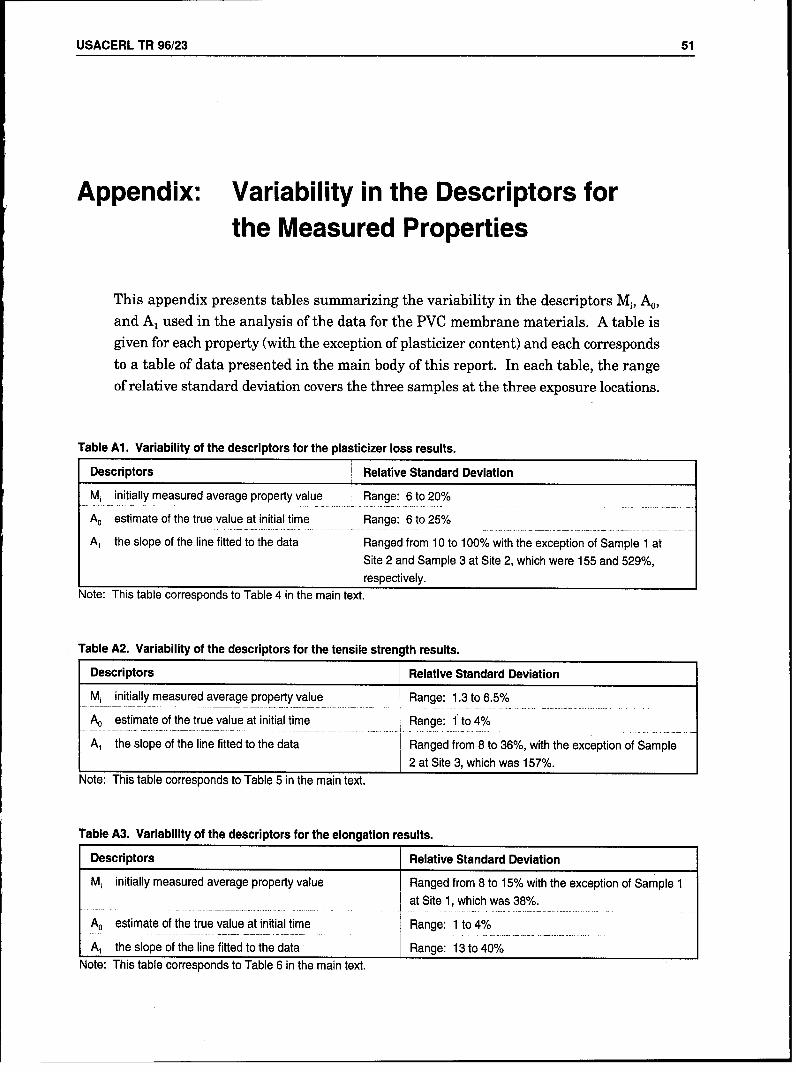
Appendix: Variability in the Descriptors forthe Measured Properties
This appendix presents tables summarizing the variability in the descriptors Mi, Ao,and A, used in the analysis of the data for the PVC membrane materials. A table isgiven for each property (with the exception of plasticizer content) and each correspondsto a table of data presented in the main body of this report. In each table, the rangeof relative standard deviation covers the three samples at the three exposure locations.
Table Al. Variability of the descriptors for the plasticizer loss results.
Descriptors Relative Standard Deviation
Mi initially measured average property value Range: 6 to 20%
A, estimate of the true value at initial time Range: 6 to 25%
A, the slope of the line fitted to the data Ranged from 10 to 100% with the exception of Sample 1 at
Site 2 and Sample 3 at Site 2, which were 155 and 529%,respectively.
Note: This table corresponds to Table 4 in the main text.
Table A2. Variability of the descriptors for the tensile strength results.
Descriptors Relative Standard Deviation
M, initially measured average property value Range: 1.3 to 6.5%
A, estimate of the true value at initial time Range: 1 to 4%
A, the slope of the line fitted to the data Ranged from 8 to 36%, with the exception of Sample2 at Site 3, which was 157%.
Note: This table corresponds to Table 5 in the main text.
Table A3. Variability of the descriptors for the elongation results.
Descriptors Relative Standard Deviation
M, initially measured average property value Ranged from 8 to 15% with the exception of Sample 1
at Site 1, which was 38%.
A, estimate of the true value at initial time Range: 1 to 4%
A, the slope of the line fitted to the data Range: 13 to 40%Note: This table corresponds to Table 6 in the main text.
52 USACERL TR 96/23
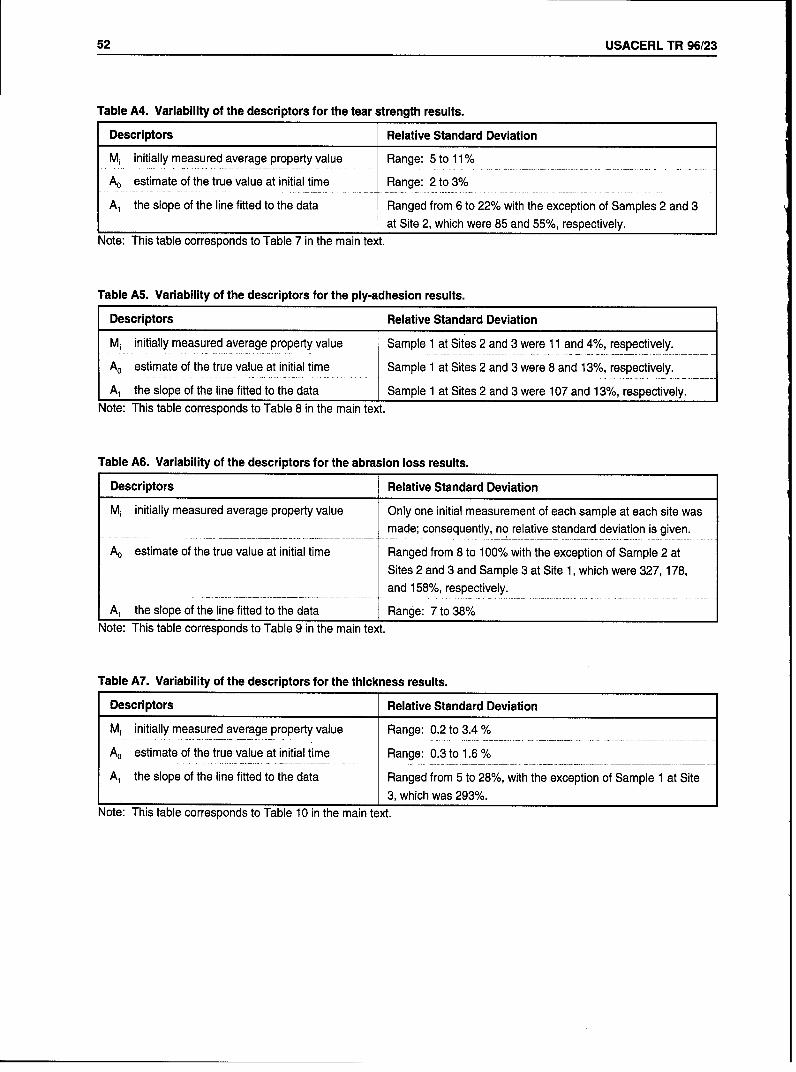
Table A4. Variability of the descriptors for the tear strength results.
Descriptors Relative Standard Deviation
M, initially measured average property value Range: 5 to 11%
A0 estimate of the true value at initial time Range: 2 to 3%
A1 the slope of the line fitted to the data Ranged from 6 to 22% with the exception of Samples 2 and 3at Site 2, which were 85 and 55%, respectively.
Note: This table corresponds to Table 7 in the main text.
Table AS. Variability of the descriptors for the ply-adhesion results.
Descriptors Relative Standard Deviation
Mi initially measured average property value Sample 1 at Sites 2 and 3 were 11 and 4%, respectively.
A, estimate of the true value at initial time Sample 1 at Sites 2 and 3 were 8 and 13%, respectively.
A1 the slope of the line fitted to the data Sample 1 at Sites 2 and 3 were 107 and 13%, respectively.Note: This table corresponds to Table 8 in the main text.
Table A6. Variability of the descriptors for the abrasion loss results.
Descriptors Relative Standard Deviation
M, initially measured average property value Only one initial measurement of each sample at each site wasmade; consequently, no relative standard deviation is given.
A0 estimate of the true value at initial time Ranged from 8 to 100% with the exception of Sample 2 atSites 2 and 3 and Sample 3 at Site 1, which were 327,178,and 158%, respectively.
A1 the slope of the line fitted to the data Range: 7 to 38%Note: This table corresponds to Table 9 in the main text.
Table A7. Variability of the descriptors for the thickness results.
Descriptors Relative Standard Deviation
M, initially measured average property value Range: 0.2 to 3.4 %
A0 estimate of the true value at initial time Range: 0.3 to 1.6 %
A1 the slope of the line fitted to the data Ranged from 5 to 28%, with the exception of Sample 1 at Site_ 3, which was 293%.
Note: This table corresponds to Table 10 in the main text.
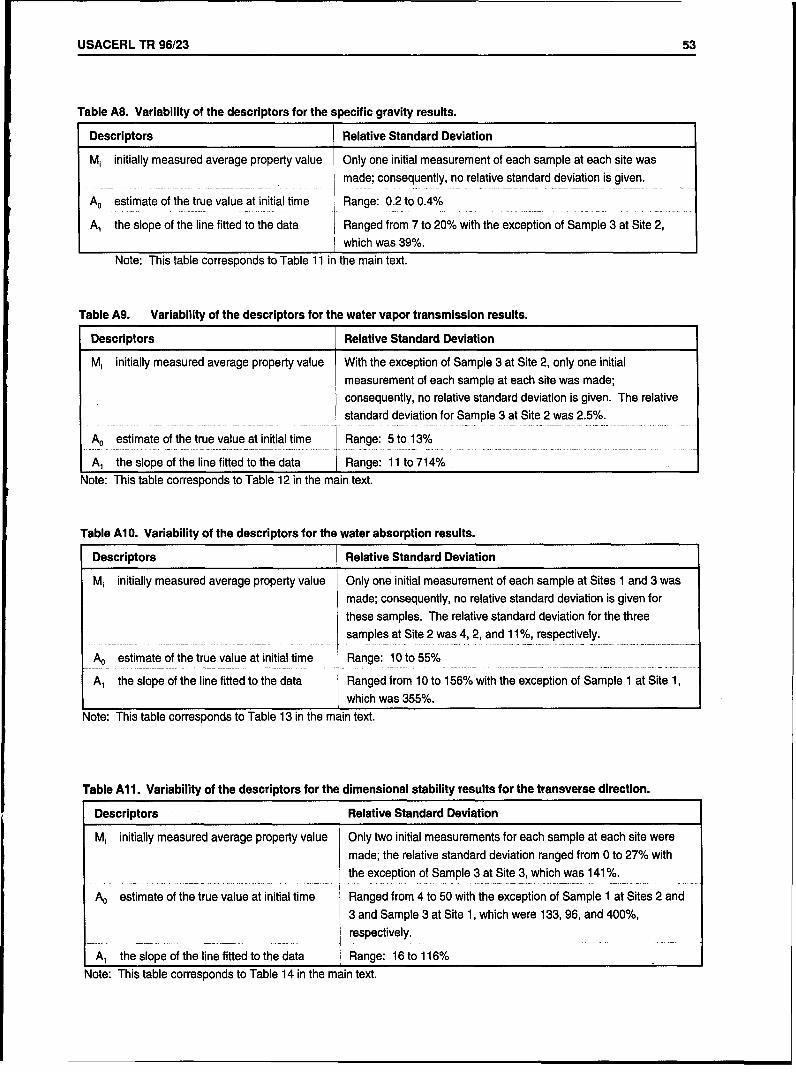
USACERL TR 96/23 53
Table A8. Variability of the descriptors for the specific gravity results.
Descriptors Relative Standard Deviation
M, initially measured average property value Only one initial measurement of each sample at each site was
. made; consequently, no relative standard deviation is given.
A, estimate of the true value at initial time Range: 0.2 to 0.4%
A, the slope of the line fitted to the data Ranged from 7 to 20% with the exception of Sample 3 at Site 2,
which was 39%.
Note: This table corresponds to Table 11 in the main text.
Table A9. Variability of the descriptors for the water vapor transmission results.
Descriptors Relative Standard Deviation
Mi initially measured average property value With the exception of Sample 3 at Site 2, only one initial
measurement of each sample at each site was made;
consequently, no relative standard deviation is given. The relative
standard deviation for Sample 3 at Site 2 was 2.5%.
A0 estimate of the true value at initial time Range: 5 to 13%
A, the slope of the line fitted to the data Range: 11 to 714%
Note: This table corresponds to Table 12 in the main text.
Table Al 0. Variability of the descriptors for the water absorption results.
Descriptors Relative Standard Deviation
M, initially measured average property value Only one initial measurement of each sample at Sites 1 and 3 was
made; consequently, no relative standard deviation is given for
these samples. The relative standard deviation for the three
samples at Site 2 was 4, 2, and 11%, respectively.
A0 estimate of the true value at initial time Range: 10 to 55%
A, the slope of the line fitted to the data Ranged from 10 to 156% with the exception of Sample 1 at Site 1,
which was 355%.
Note: This table corresponds to Table 13 in the main text.
Table All. Variability of the descriptors for the dimensional stability results for the transverse direction.
Descriptors Relative Standard Deviation
M, initially measured average property value Only two initial measurements for each sample at each site were
made; the relative standard deviation ranged from 0 to 27% with
the exception of Sample 3 at Site 3, which was 141%.
Ao estimate of the true value at initial time Ranged from 4 to 50 with the exception of Sample 1 at Sites 2 and
3 and Sample 3 at Site 1, which were 133, 96, and 400%,
respectively.
A1 the slope of the line fitted to the data Range: 16 to 116%
Note: This table corresponds to Table 14 in the main text.
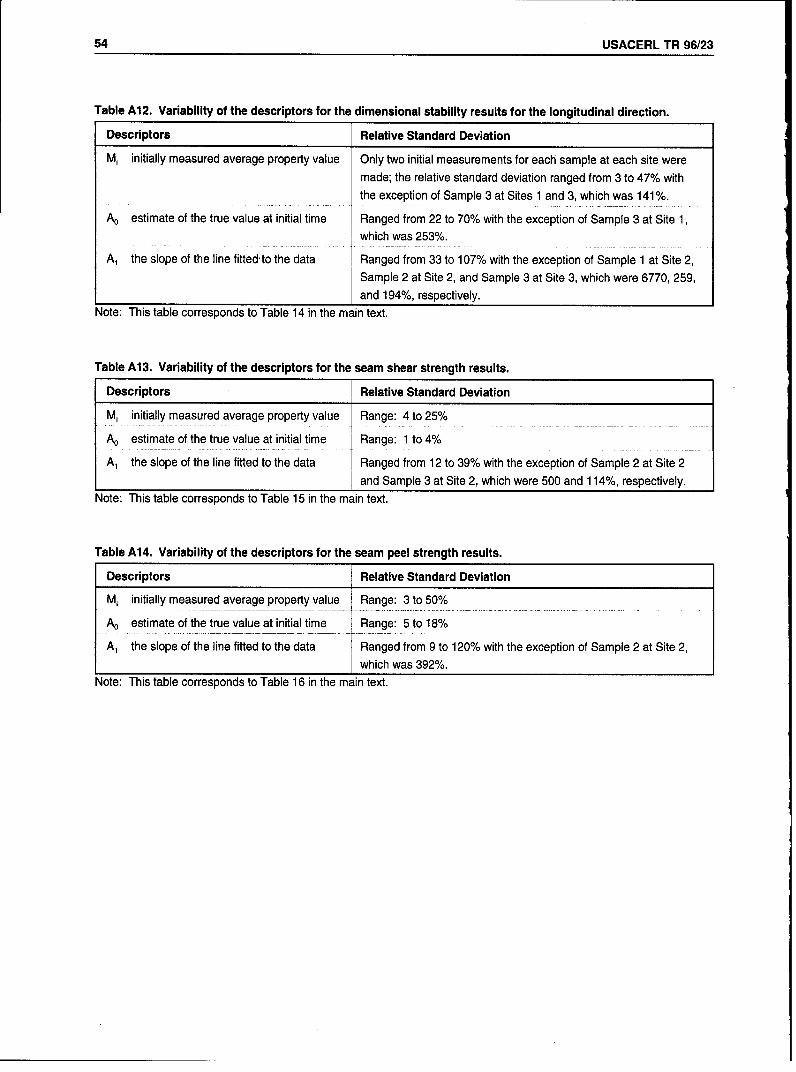
54 USACERL TR 96/23
Table A12. Variability of the descriptors for the dimensional stability results for the longitudinal direction.
Descriptors Relative Standard Deviation
M, initially measured average property value Only two initial measurements for each sample at each site were
made; the relative standard deviation ranged from 3 to 47% with
the exception of Sample 3 at Sites 1 and 3, which was 141%.
A0 estimate of the true value at initial time Ranged from 22 to 70% with the exception of Sample 3 at Site 1,which was 253%.
A1 the slope of the line fitted'to the data Ranged from 33 to 107% with the exception of Sample 1 at Site 2,
Sample 2 at Site 2, and Sample 3 at Site 3, which were 6770, 259,
and 194%, respectively.Note: This table corresponds to Table 14 in the main text.
Table A13. Variability of the descriptors for the seam shear strength results.
Descriptors Relative Standard Deviation
Mi initially measured average property value Range: 4 to 25%
A, estimate of the true value at initial time Range: 1 to 4%
A1 the slope of the line fitted to the data Ranged from 12 to 39% with the exception of Sample 2 at Site 2
and Sample 3 at Site 2, which were 500 and 114%, respectively.Note: This table corresponds to Table 15 in the main text.
Table A14. Variability of the descriptors for the seam peel strength results.
Descriptors Relative Standard Deviation
Mi initially measured average property value Range: 3 to 50%
A, estimate of the true value at initial time [ Range: 5 to 18%
A, the slope of the line fitted to the data Ranged from 9 to 120% with the exception of Sample 2 at Site 2,
which was 392%.Note: This table corresponds to Table 16 in the main text.
USACERL TR 96/23 55
USACERL DISTRIBUTION
Chief of Engineers 4th Infantry Div (MECH) 80913-5000 USA Engr Activity, Capital AreaATTN: CEHEC-IM-LH (2) ATTN: AFZC-FE ATTN: Library 22211ATTN: CEHEC-IM-LP (2)ATTN: CECG US Army Materiel Command (AMC) US Army ARDEC 07806-5000ATTN: CECC-P Alexandria, VA 22333-0001 ATTN: AMSTA-AR-IMCATTN: CECC-R ATTN: AMCEN-FATTN: CECW Installations: (20) Engr Societies LibraryATTN: CECW-O ATTN: Acquisitions 10017ATTN: CECW-P FORSCOM
AITN: CECW-PR Forts Gillem & McPherson 30330 Defense Nuclear AgencyATTN: CEMP ATTN: FCEN ATTN: NADS 20305ATTN: CEMP-ET Installations: (22)
ATTN: CEMP-C 6th Infantry Division (Light) Defense Logistics AgencyATTN: CEMP-M ATTN: APVR-DE 99505 ATTN: MMDIS 22060-6221ATTN: CEMP-R ATTN: APVR-WF-DE 99703ATTN: CERD-C Walter Reed Army Medical Ctr 20307ATTN: CERD-ZA TRADOCATTN: CERD-L Fort Monroe 23651 National Guard Bureau 20310ATTN: CERD-M ATTN: ATBO-G ATTN: NGB-ARIATTN: CERM Installations: (20)ATTN: DAEN-ZC US Military Academy 10996ATTN: DAIM-FDP Fort Belvoir 22060 ATTN: MAEN-A
ATTN: CETEC-IM-T ATTN: Facilities EngineerCECPW 22310-3862 ATTN: CETEC-ES 22315-3803 ATTN: Geography & Envr EngrgATTN: CECPW-E ATTN: Water Resources Support CirATTN: CECPW-FT Naval Facilities Engr CommandATTN: CECPW-ZC USA Natick RD&E Center 01760 ATTN: Facilities Engr Command (8)
ATTN: STRNC-DT ATTN: Division Offices (11)US Army Engr District ATTN: DRDNA-F ATTN: Public Works Center (8)ATTN: Library (40) ATTN: Naval Constr Battalion Cir 93043
US Army Materials Tech Lab ATTN: Naval Facilities Engr Service Center
US Army Engr Division ATTN: SLCMT-DPW 02172 93043-4328ATTN: Library (12)
USARPAC 96858 8th US Army KoreaUS Army Europe ATTN: DPW ATTN: DPW (11)
ATTN: AEAEN-EH 09014 ATTN: APEN-AATTN: AEAEN-ODCS 09014 USA Japan (USARJ)
29th Area Support Group SHAPE 09705 ATTN: APAJ-EN-ES 96343ATTN: AEUSG-K-E 09054 ATTN: Infrastructure Branch LANDA ATTN: HONSHU 96343
100th Area Support Group ATTN: DPW-Okinawa 96376ATTN: AETT-SG-DPW 09114 Area Engineer, AEDC-Area Office
222d BSB Unit #23746 Arnold Air Force Station, TN 37389 416th Engineer Command 60623ATTN: AETV-BHR-E 00034 ATTN: Gibson USAR Ctr
235th BSB Unit #28614 HO USEUCOM 09128ATTN: AETV-WG-AM 09177 ATTN: ECJ4-LIE US Army HSC
293d BSB Unit #29901 Fort Sam Houston 78234ATTN: AEUSG-MA-E 09086 AMMRC 02172 ATTN: HSLO-F
409th Support Battalion (Base) ATTN: DRXMR-AF Fitzsimons Army Medical CtrATTN: AETTG-DPW 09114 ATTN: DRXMR-WE ATTN: HSHG-DPW 80045
412th Base Support Battalion 09630ATTN: Unit 31401 CEWES 39180 Tyndall AFB 32403
CMTC Hohenfels 09173 ATTN: Library ATTN: HOAFCESA Program OfcATTN: AETTH-SB-DPW ATTN: Engrg & Srvc Lab
Mainz Germany 09185 CECRL 03755A-TN: AETV-MNZ-E AITN: Library USA TSARCOM 63120
21st Support Command ATTN: STSAS-FATTN: DPW (9) USA AMCOM
SETAF ATTN: Facilities Engr 21719 American Public Works Assoc. 64104-1806ATTN: AESE-EN-D 09613 ATTN: AMSMC-EH 61299AITN: AESE-EN 09630 ATTN: Facilities Engr (3) 85613 US Army CHPPM
Supreme Allied Command ATTN: MCHB-DE 21010ATrN: ACSGEB 09703 USiMRMC 40121ATTN: SHIHBIENGR 09705 ATTN: ATZIC-EHA US Gov' Printing Office 20401
ATTN: Rec Sec/Deposit Sec (2)INSCOM Military Traffic Mgmt Command
ATTN: IALOG-I 22060 AITN: MTEA-GB-EHP 07002 Nat'l Institute of Standards & TechATTN: IAV-DPW 22186 ATTN: MT-LOF 20315 ATTN: Library 20899
ATTN: MTE-SU-FE 28461USA TACOM 48397-5000 ATTN: MTW-IE 94626 Defense General Supply Center
ATTN: AMSTA-XE ATTN: DGSC-WI 23297-5000Fort Leonard Wood 65473
Defense Distribulion Rogion East ATTN: ATSE-DAC-LB (3) Defense Construction Supply CenterATTN: ASCE-WI 17070-5001 ATiN: ATZT ATTN: DCSC-WI 43216-5000
ATTN: ATSE-CFLODefense Distribution Region West ATTN: ATSE-DAC-FL Defense Tech Info Center 22304ATTN: ASCW-WG 95296-0100 ATTN: Australian Liaison Office ATTN: DTIC-O (2)
HQ XVIII Airborne Corps 28307 Military Dist of WASH 277ATTN: AFZA-DPW-EE Fort McNair 12/95
ATTN: ANEN 20319
This publication was reproduced on recycled paper.