Embed Size (px)
Citation preview
1 9 9 6 T A L I S M A N E N E R G Y I N C . A N N U A L R E P O R T
Brought to you by Global Reports
T A L I S M A N ’ S R E S U L T S
C O R P O R AT E P R O F I L E
Talisman Energy Inc. is an independent, Canadian-based,
international upstream oil and gas company whose main
business activities include exploration, development,
production and marketing of crude oil, natural gas and
natural gas liquids. The Company’s production comes from
Canada, the North Sea and Indonesia. Talisman is active in a
number of high-potential international exploration areas,
including Algeria, Trinidad and Peru.
Talisman’s extraordinary results stem from successful
exploration and development programs in and around the
Company’s core areas supported by strategic acquisitions.
The Company has consistently replaced its production
through the drill bit, while achieving competitive finding,
development and operating costs.
Talisman (TLM) is a widely-held company listed on the
Toronto, Montreal and Vancouver stock exchanges. The
Company currently has 109 million issued shares and is
included in the TSE 35 index.
Table o f Contents
Talisman in 1996 2
Highlights 3
President’s Message 4
Canada 8
North Sea 16
Indonesia 22
Exploration Areas 27
Human Resources 29
Health, Safety and Environment 29
Corporate Contributions 29
Management’s Discussion and Analysis 30
Corporate Governance 41
Report of Management 43
Auditors’ Report 44
Consolidated Financial Statements and Notes 45
Supplementary Information
Five Year Financial Summary 60
Operations Summary 61
Selected Quarterly Financial Data 62
Consolidated Financial Ratios 62
1996 Land Summary 63
1996 Drilling Summary 63
Summary of Proved and Probable Reserves 64
Proved Reserves Continuity 64
Five Year Finding and Development Costs 65
Investor Information 66
Directors and Executive 67
Corporate Information 68
Abbreviations 68
Brought to you by Global Reports
TA L I S M A N I N 1 9 9 6
Drilling success, strategic acquisitions, diversification of markets and geographical areas, and a strong asset base
combined to produce another record year for Talisman. Major operating and financial results include:
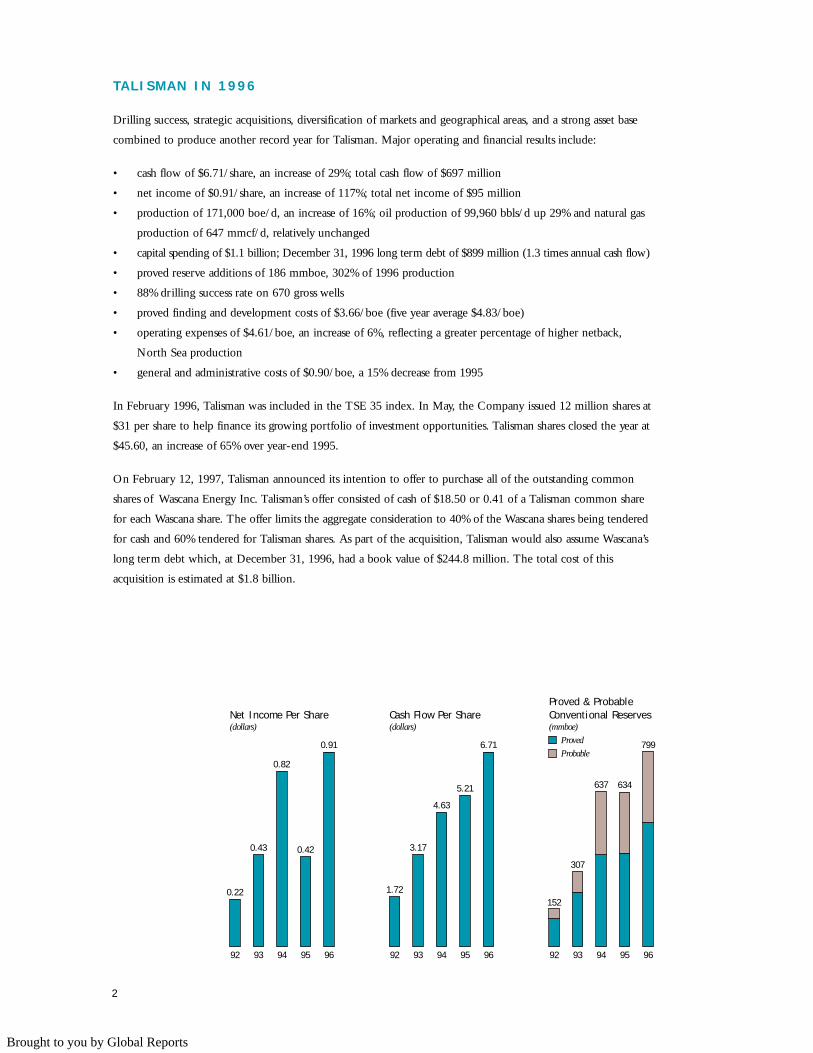
• cash flow of $6.71/share, an increase of 29%; total cash flow of $697 million
• net income of $0.91/share, an increase of 117%; total net income of $95 million
• production of 171,000 boe/d, an increase of 16%; oil production of 99,960 bbls/d up 29% and natural gas
production of 647 mmcf/d, relatively unchanged
• capital spending of $1.1 billion; December 31, 1996 long term debt of $899 million (1.3 times annual cash flow)
• proved reserve additions of 186 mmboe, 302% of 1996 production
• 88% drilling success rate on 670 gross wells
• proved finding and development costs of $3.66/boe (five year average $4.83/boe)
• operating expenses of $4.61/boe, an increase of 6%, reflecting a greater percentage of higher netback,
North Sea production
• general and administrative costs of $0.90/boe, a 15% decrease from 1995
In February 1996, Talisman was included in the TSE 35 index. In May, the Company issued 12 million shares at
$31 per share to help finance its growing portfolio of investment opportunities. Talisman shares closed the year at
$45.60, an increase of 65% over year-end 1995.
On February 12, 1997, Talisman announced its intention to offer to purchase all of the outstanding common
shares of Wascana Energy Inc. Talisman’s offer consisted of cash of $18.50 or 0.41 of a Talisman common share
for each Wascana share. The offer limits the aggregate consideration to 40% of the Wascana shares being tendered
for cash and 60% tendered for Talisman shares. As part of the acquisition, Talisman would also assume Wascana’s
long term debt which, at December 31, 1996, had a book value of $244.8 million. The total cost of this
acquisition is estimated at $1.8 billion.
949392 95 96
0.82
0.43
0.22
0.42
0.91
Net Income Per Share(dollars)
949392 95 96
4.63
3.17
1.72
5.21
6.71
Cash Flow Per Share(dollars)
Proved & ProbableConventional Reserves(mmboe)
Proved
Probable
949392 95 96
637
307
152
634
799
2
Brought to you by Global Reports
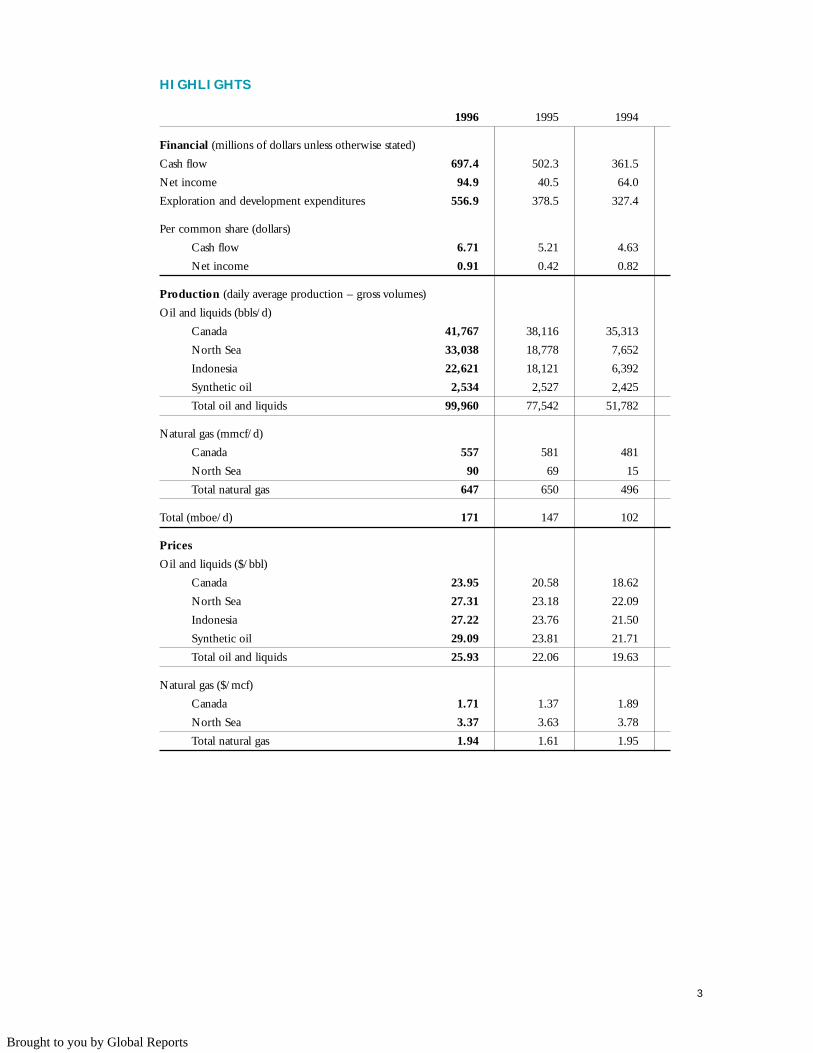
H I G H L I G H T S
1996 1995 1994
Financial (millions of dollars unless otherwise stated)
Cash flow 697.4 502.3 361.5
Net income 94.9 40.5 64.0
Exploration and development expenditures 556.9 378.5 327.4
Per common share (dollars)
Cash flow 6.71 5.21 4.63
Net income 0.91 0.42 0.82
Production (daily average production – gross volumes)
Oil and liquids (bbls/d)
Canada 41,767 38,116 35,313
North Sea 33,038 18,778 7,652
Indonesia 22,621 18,121 6,392
Synthetic oil 2,534 2,527 2,425
Total oil and liquids 99,960 77,542 51,782
Natural gas (mmcf/d)
Canada 557 581 481
North Sea 90 69 15
Total natural gas 647 650 496
Total (mboe/d) 171 147 102
Prices
Oil and liquids ($/bbl)
Canada 23.95 20.58 18.62
North Sea 27.31 23.18 22.09
Indonesia 27.22 23.76 21.50
Synthetic oil 29.09 23.81 21.71
Total oil and liquids 25.93 22.06 19.63
Natural gas ($/mcf)
Canada 1.71 1.37 1.89
North Sea 3.37 3.63 3.78
Total natural gas 1.94 1.61 1.95
3
Brought to you by Global Reports
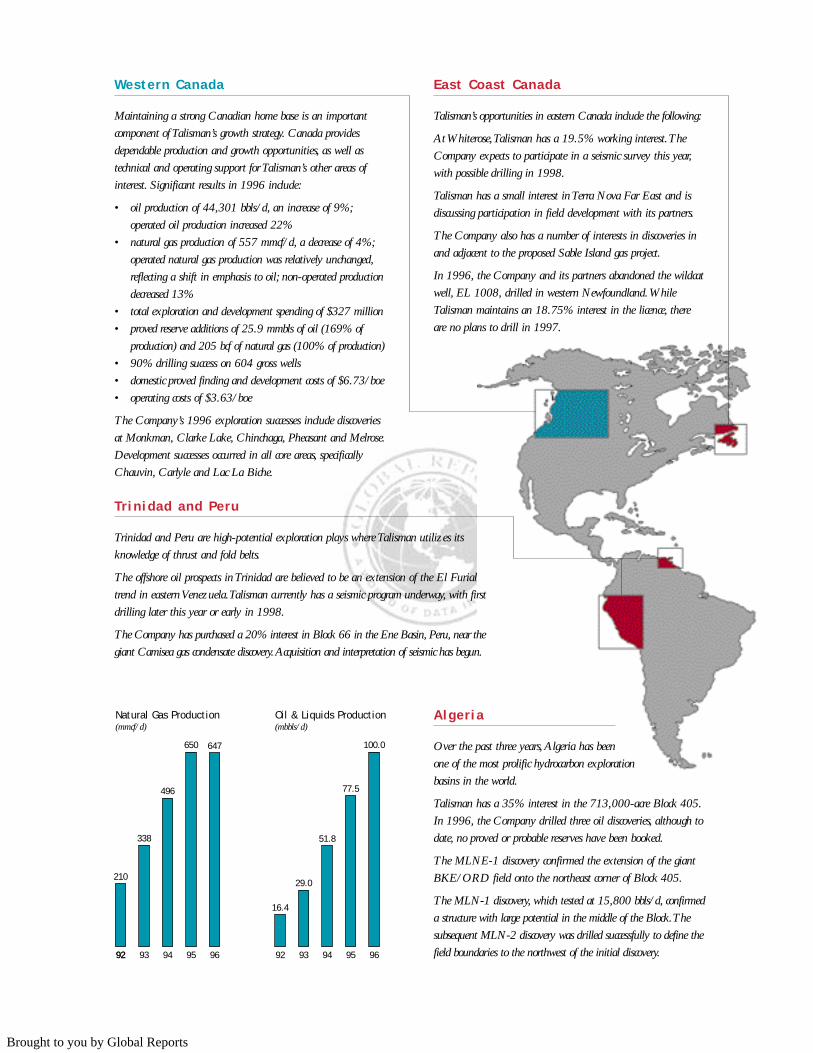
Western Canada
Maintaining a strong Canadian home base is an important
component of Talisman’s growth strategy. Canada provides
dependable production and growth opportunities, as well as
technical and operating support for Talisman’s other areas of
interest. Significant results in 1996 include:
• oil production of 44,301 bbls/d, an increase of 9%;
operated oil production increased 22%
• natural gas production of 557 mmcf/d, a decrease of 4%;
operated natural gas production was relatively unchanged,
reflecting a shift in emphasis to oil; non-operated production
decreased 13%
• total exploration and development spending of $327 million
• proved reserve additions of 25.9 mmbls of oil (169% of
production) and 205 bcf of natural gas (100% of production)
• 90% drilling success on 604 gross wells
• domestic proved finding and development costs of $6.73/boe
• operating costs of $3.63/boe
The Company’s 1996 exploration successes include discoveries
at Monkman, Clarke Lake, Chinchaga, Pheasant and Melrose.
Development successes occurred in all core areas, specifically
Chauvin, Carlyle and Lac La Biche.
East Coast Canada
Talisman’s opportunities in eastern Canada include the following:
At Whiterose,Talisman has a 19.5% working interest.The
Company expects to participate in a seismic survey this year,
with possible drilling in 1998.
Talisman has a small interest in Terra Nova Far East and is
discussing participation in field development with its partners.
The Company also has a number of interests in discoveries in
and adjacent to the proposed Sable Island gas project.
In 1996, the Company and its partners abandoned the wildcat
well, EL 1008, drilled in western Newfoundland.While
Talisman maintains an 18.75% interest in the licence, there
are no plans to drill in 1997.
Tr inidad and Peru
Trinidad and Peru are high-potential exploration plays where Talisman utilizes its
knowledge of thrust and fold belts.
The offshore oil prospects in Trinidad are believed to be an extension of the El Furial
trend in eastern Venezuela.Talisman currently has a seismic program underway, with first
drilling later this year or early in 1998.
The Company has purchased a 20% interest in Block 66 in the Ene Basin, Peru, near the
giant Camisea gas condensate discovery.Acquisition and interpretation of seismic has begun.
Alger ia
Over the past three years,Algeria has been
one of the most prolific hydrocarbon exploration
basins in the world.
Talisman has a 35% interest in the 713,000-acre Block 405.
In 1996, the Company drilled three oil discoveries, although to
date, no proved or probable reserves have been booked.
The MLNE-1 discovery confirmed the extension of the giant
BKE/ORD field onto the northeast corner of Block 405.
The MLN-1 discovery, which tested at 15,800 bbls/d, confirmed
a structure with large potential in the middle of the Block.The
subsequent MLN-2 discovery was drilled successfully to define the
field boundaries to the northwest of the initial discovery.949392 95 96
496
338
210
650 647
Natural Gas Production(mmcf/d)
92 949392 95 96
51.8
29.0
16.4
77.5
100.0
Oil & Liquids Production(mbbls/d)
Brought to you by Global Reports
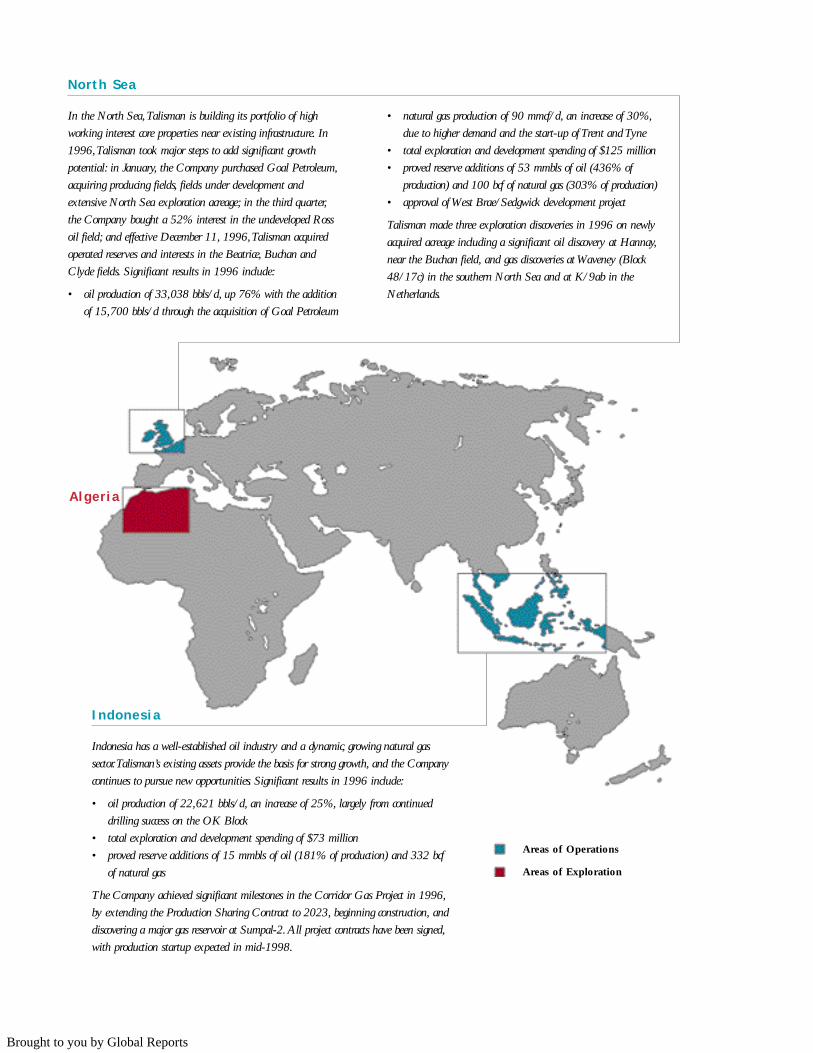
North Sea
In the North Sea,Talisman is building its portfolio of high
working interest core properties near existing infrastructure. In
1996,Talisman took major steps to add significant growth
potential: in January, the Company purchased Goal Petroleum,
acquiring producing fields, fields under development and
extensive North Sea exploration acreage; in the third quarter,
the Company bought a 52% interest in the undeveloped Ross
oil field; and effective December 11, 1996,Talisman acquired
operated reserves and interests in the Beatrice, Buchan and
Clyde fields. Significant results in 1996 include:
• oil production of 33,038 bbls/d, up 76% with the addition
of 15,700 bbls/d through the acquisition of Goal Petroleum
• natural gas production of 90 mmcf/d, an increase of 30%,
due to higher demand and the start-up of Trent and Tyne
• total exploration and development spending of $125 million
• proved reserve additions of 53 mmbls of oil (436% of
production) and 100 bcf of natural gas (303% of production)
• approval of West Brae/Sedgwick development project
Talisman made three exploration discoveries in 1996 on newly
acquired acreage including a significant oil discovery at Hannay,
near the Buchan field, and gas discoveries at Waveney (Block
48/17c) in the southern North Sea and at K/9ab in the
Netherlands.
Indonesia
Indonesia has a well-established oil industry and a dynamic, growing natural gas
sector.Talisman’s existing assets provide the basis for strong growth, and the Company
continues to pursue new opportunities. Significant results in 1996 include:
• oil production of 22,621 bbls/d, an increase of 25%, largely from continued
drilling success on the OK Block
• total exploration and development spending of $73 million
• proved reserve additions of 15 mmbls of oil (181% of production) and 332 bcf
of natural gas
The Company achieved significant milestones in the Corridor Gas Project in 1996,
by extending the Production Sharing Contract to 2023, beginning construction, and
discovering a major gas reservoir at Sumpal-2.All project contracts have been signed,
with production startup expected in mid-1998.
Areas of Operations
Areas of Exploration
Alger ia
Brought to you by Global Reports

Ted Bogle, Vice-President, Exploration
Jim Buckee, President and Chief Executive Officer
Bob Mitchell, Vice-President, Canadian Operations
Bruce Waterman, Vice-President, Finance and Chief Financial Officer
Jackie Sheppard, Vice-President, Legal and Corporate Projects, and Corporate Secretary
Nigel Hares, Vice-President, Frontier and International Operations
Bob Redgate, Vice-President, Human Resources and Corporate Services
Joe Horler, Vice-President, Marketing
4
Brought to you by Global Reports
Talisman had another great year in 1996. I would like to emphasize how much Talisman’s success is attributable
to the impact of our employees knowing the corporate direction and making the right decisions. Thank you all
for your hard work and dedication in 1996.
In addition to achieving exceptional operating and financial results, the Company established a strong base for
future growth. The acquisition of Goal Petroleum and addition of operated interests in the Ross, Beatrice,
Buchan and Clyde fields positioned Talisman as a growing force in the North Sea. Progress on the Corridor Gas
Project, combined with exploration success, continues to increase the value of our Indonesian assets. Talisman’s
strength, skills, and unique investment inventory will underpin continued, successful growth.
P R E S I D E N T ’ S M E S S A G E T O S H A R E H O L D E R S
5
Strategy
The objective of Talisman’s strategy is to increase share value by growing hydrocarbon production and consequently
cash flow per share. Behind Talisman’s strategy is the premise that hydrocarbons are a finite source of energy for
which there are few alternatives. The Company develops its business plans towards gaining control of large volumes
of hydrocarbons at the lowest possible cost to meet growing demand resulting from population growth and economic
activity. Talisman is an upstream oil and gas company. The major elements of Talisman’s strategy are:
Low risk: The Company focuses on regions with proven oil and gas potential, developed infrastructure and
established fiscal regimes.
Timely return on investment: Talisman strives to shorten the time between investment and production, and to
achieve pay-out in two-to-three years. The Company maintains a ‘development hopper’ (inventory of investment
projects) by either exploring or acquiring, whichever is most cost effective.
Diversity: Basin and market diversity allows Talisman to select the best from a variety of investment choices.
Operatorship and control: Talisman establishes high working interests and operatorship, whenever possible, to
control costs and timing.
The Company will maintain and grow its western Canadian base as a source of financial and operational strength.
The North Sea and Indonesia provide strong production growth opportunities. Talisman is investing in a few select,
high-potential international exploration plays for longer term growth.
Brought to you by Global Reports
Our technical expertise and financial resources enable Talisman to undertake investments that are beyond the
grasp of many of our competitors while being too small for major integrated oil and gas companies. There is a
large niche for companies of our size, our skills and our motivation. As we grow, the number of attractive
investment opportunities increases.
We view both exploration and acquisition as valid methods for providing targets for the drill bit. Consequently,
as we continue to look for opportunities that will add value and cash flow, acquisitions will likely play a role in
Talisman’s future growth.
Canada will remain central to Talisman’s strategy for the future. A powerful home base provides us with a reliable
source of opportunities, skills and people. Accordingly, on February 12, 1997, Talisman announced its intention
to offer to purchase Wascana Energy Inc. to increase our home base commensurate with our international
growth. I believe the offer for Wascana promises to deliver good value to both Wascana and Talisman shareholders.
In the North Sea, Talisman is rapidly building on the entry position acquired in 1994. The addition of the
Beatrice, Buchan and Clyde producing fields gives Talisman immediate operating expertise, talented people and
first rate safety, environmental and management systems. We are excited about the number of opportunities
coming to light and Talisman expects to produce these properties for many years to come. The Ross field is
Talisman’s first venture as operator of a new North Sea field development. The North Sea presents many
substantial opportunities which we will continue to evaluate and pursue.
Talisman’s production from Indonesia is positioned to double in the next three years, with increases primarily
coming from the Corridor Gas Project which is due to commence production in 1998. We have tripled oil
production from the OK Block since its acquisition, continued to increase production at the Tanjung waterflood
project, and are working on a major new exploration play.
In addition to the abundant opportunities in our core areas, Talisman is exploring a number of high-potential
plays. To date, the Company has drilled four wells in Algeria, all of which have discovered hydrocarbons.
Although the subtle nature of the trapping makes it difficult to predict the ultimate potential of this play, we are
very optimistic. There are four or five wells planned for 1997, and it is likely we will decide on future
development plans for Algeria later this year. No reserves for Algeria have been booked yet.
1997 Outlook
We are very positive about all areas of our operations. At year-end, Talisman was producing approximately 117,000
bbls/d of oil and liquids worldwide and we expect to increase this level in 1997. For example, the winter drilling
season in Canada has been typically successful for Talisman as we continue to increase oil production.
Over the past year, Talisman has deliberately kept its operated Canadian gas production at rates similar to 1995,
reflecting prevailing low gas prices and attractive oil opportunities; however, we have maintained a strong
inventory of gas prospects, particularly in northeast British Columbia. In response to changing gas price
expectations, we may increase our natural gas drilling program in 1997.
6
Brought to you by Global Reports
Talisman’s North Sea production increases in 1997 will be led by the Beatrice, Buchan and Clyde fields which
are currently contributing about 20,000 bbls/d. This production rate is expected to increase as a result of
Talisman’s activities in and around these fields.
In the last quarter of 1996, Indonesian oil production averaged over 25,000 bbls/d. We expect an increase in
1997 due to improving performance at the Tanjung waterflood project and continued development in the
OK Block.
In total, the Company expects a 15-20% production increase this year on capital spending of approximately $850
million. With production commencing from major projects such as Corridor and Ross in 1998, we are confident
of continued increases in Talisman’s underlying production profile.
In 1996, demand for oil reached new highs based on continuing growth in the Pacific Rim and stable growth in
the OECD. This demand was firm in the face of recent higher prices. Energy prices remain low in real terms. I
am confident that the fundamentals are positive for oil prices; nonetheless, the Company bases its plans on
conservative prices and assumptions. We have the financial capacity and portfolio of opportunities to take full
advantage of higher prices as they arise.
Sadly, Talisman’s former Chairman, Keith McWalter, passed away unexpectedly in February of this year. Keith
was highly regarded in the industry. His distinguished approach to the business belied an intense enthusiasm for
the major strides made by Talisman. He will be greatly missed by me, among his many friends at Talisman.
I would also like to thank the Board and our new Chairman, Peter Widdrington, for their continuing support this
past year.
James W. Buckee
President and Chief Executive Officer
March 5, 1997
7
“James W. Buckee”
Brought to you by Global Reports

949392 95 96
481
338
210
581557
Natural Gas Production(mmcf/d)
92949392 95 96
37.7
28.9
16.4
40.6
44.3
Oil & Liquids Production(mbbls/d)
92
Middle Devonian Slave Point Formation, British Columbia, Canada.
Intercrystalline pores (black) in hydrothermal or saddle dolomite.
These pores form the effective reservoir of the Sextet Slave Point “B” Gas Pool.
8
A Talisman-operated
well at Carlyle
in southeast
Saskatchewan
where Talisman has
grown production by
52% in two years.
Brought to you by Global Reports

9
Maintaining Talisman’s strong Canadian home base is a major component of the Company’s growth strategy.
Talisman’s diverse Canadian activities enable the Company to build and enhance its worldwide technical and
operating expertise. As well, the Canadian base provides a dependable source of production and growth
opportunities. The Company controls land and infrastructure and maintains high working interests in its core
areas to manage costs and exploration and development timing. Talisman consistently replaces more than 100% of
its production through drilling while achieving top quartile finding, development and operating costs: 1996
operating costs averaged $3.63/boe and domestic proved finding and development costs averaged $6.73/boe.
Canada Highl ights 1996 1995 1994
Production
Oil and liquids (bbls/d) 41,767 38,116 35,313
Syncrude (bbls/d) 2,534 2,527 2,425
Natural gas (mmcf/d) 557 581 481
Total production (boe/d) 100,016 98,656 85,859
Proved reserves
Oil and liquids (mmbls) 115.1 104.5 103.1
Natural gas (bcf) 1,551.4 1,550.4 1,520.9
Total reserves (mmboe) 270.2 259.5 255.2
Capital expenditures (millions of dollars)
Exploration 91.1 89.7 96.8
Development 236.1 153.0 152.2
Total capital expenditures 327.2 242.7 249.0
1996 Drilling (number of wells) Gross Net
Oil 417 231.2
Gas 128 59.4
Dry 60 36.1
Total wells drilled 605 326.7
1996 Land holdings (acres) Gross Net
Developed 2,075,800 714,720
Undeveloped 7,139,346 2,773,598
Total acreage 9,215,146 3,488,318
Details can be found under “Supplementary Information”10 mcf of natural gas equals 1 boe
C A N A D A
Brought to you by Global Reports

10
In 1996, Talisman’s Canadian production averaged 100,016 boe/d. The Company emphasized oil and liquids
exploration and development projects in 1996. Total oil and liquids production increased by 9%, while operated
production increased 22% over 1995, reflecting exploration and development success in all core areas. Talisman
maintained its rate of operated natural gas production through 1996; however, non-operated production declined
by 13%, resulting in an overall 4% decline in total natural gas production.
The Company drilled 349 operated and 256 non-operated wells in Canada with a 90% success rate. In 1997,
Talisman plans to drill 380 operated wells and 280 non-operated wells.
Capital spending in 1996 totalled $327 million with 52% directed at oil projects, compared with 36% in 1995.
Expected 1997 exploration and development spending will total $298 million, of which half will be directed at
oil projects. The Company replaced 169% of oil production and 100% of natural gas production. Talisman is
well-positioned to take advantage of improved natural gas prices and maintains a substantial inventory of
exploration prospects.
Car ly le
This past year was the fourth year of an expanding and very successful drilling program at Carlyle, Talisman’s
largest operated Canadian oil property. The Company drilled 93 vertical and horizontal wells and added 6.8
mmbls of proved reserves. Oil production averaged 11,214 bbls/d in 1996, a 35% increase over 1995.
Talisman drilled three successful exploration wells in 1996, resulting in new pool discoveries at Pheasant and
Melrose. To date, 2 mmbls of proved and probable reserves have been added and these properties are currently
being delineated and developed.
Talisman Interests
British Columbia
Alberta Saskatchewan
Edmonton
Saskatoon
Calgary
Regina
Carlyle
Shaunavon
Chauvin
Warburg
Lac La Biche
Greater Arch
West Central Plains
Alberta Foothills
Northern Plains
Monkman
Brought to you by Global Reports
11
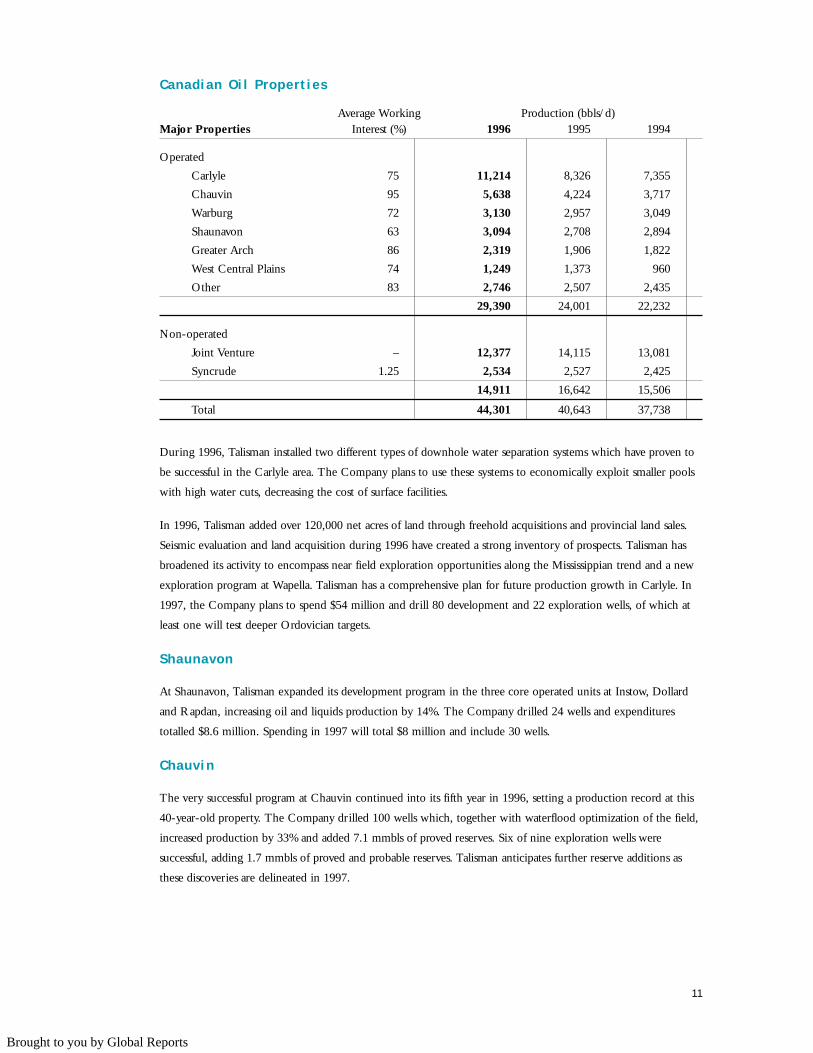
During 1996, Talisman installed two different types of downhole water separation systems which have proven to
be successful in the Carlyle area. The Company plans to use these systems to economically exploit smaller pools
with high water cuts, decreasing the cost of surface facilities.
In 1996, Talisman added over 120,000 net acres of land through freehold acquisitions and provincial land sales.
Seismic evaluation and land acquisition during 1996 have created a strong inventory of prospects. Talisman has
broadened its activity to encompass near field exploration opportunities along the Mississippian trend and a new
exploration program at Wapella. Talisman has a comprehensive plan for future production growth in Carlyle. In
1997, the Company plans to spend $54 million and drill 80 development and 22 exploration wells, of which at
least one will test deeper Ordovician targets.
Shaunavon
At Shaunavon, Talisman expanded its development program in the three core operated units at Instow, Dollard
and Rapdan, increasing oil and liquids production by 14%. The Company drilled 24 wells and expenditures
totalled $8.6 million. Spending in 1997 will total $8 million and include 30 wells.
Chauvin
The very successful program at Chauvin continued into its fifth year in 1996, setting a production record at this
40-year-old property. The Company drilled 100 wells which, together with waterflood optimization of the field,
increased production by 33% and added 7.1 mmbls of proved reserves. Six of nine exploration wells were
successful, adding 1.7 mmbls of proved and probable reserves. Talisman anticipates further reserve additions as
these discoveries are delineated in 1997.
Canadian Oi l Propert ies
Average Working Production (bbls/d)Major Properties Interest (%) 1996 1995 1994
Operated
Carlyle 75 11,214 8,326 7,355
Chauvin 95 5,638 4,224 3,717
Warburg 72 3,130 2,957 3,049
Shaunavon 63 3,094 2,708 2,894
Greater Arch 86 2,319 1,906 1,822
West Central Plains 74 1,249 1,373 960
Other 83 2,746 2,507 2,435
29,390 24,001 22,232
Non-operated
Joint Venture – 12,377 14,115 13,081
Syncrude 1.25 2,534 2,527 2,425
14,911 16,642 15,506
Total 44,301 40,643 37,738
Brought to you by Global Reports
12
The Company acquired 42,000 net acres of land, making it the most active purchaser around the Chauvin area
in 1996. The Company’s position at Chauvin was strengthened with the purchase of partner interests in key areas
and the acquisition of an adjacent property. Talisman will continue its program of land acquisition, infill, step-out
and exploration drilling in 1997. Plans include $38 million in capital spending, 110 development and 10
exploration wells.
Talisman also expanded its pipeline and custom treating facilities at Chauvin in 1996 to maintain its strategic
heavy oil marketing position. Pipeline throughput averaged 37,922 bbls/d in 1996, up 26% from 1995.
Throughput in the custom treating facilities averaged 3,406 bbls/d in 1996, a 10% increase from 1995.
Warburg
The sweet light crude in the Warburg area provides Talisman’s highest domestic netbacks, averaging over $18/bbl
in 1996. Talisman drilled 33 oil wells during the year, including two successful horizontal wells. Development of
the recently acquired Knobhill property through vertical and horizontal drilling has increased its production by
some 150%. The Company’s infill drilling program will continue into 1997 with plans for 26 oil wells and 17
injector conversions. The Company plans to spend $8 million at Warburg in 1997.
Monkman
Monkman is Talisman’s largest natural gas producing area. The Company has a large land position, high working
interests and controls infrastructure through operatorship. In 1996, Talisman reduced its production at Monkman to
135 mmcf/d to match existing firm service capacity more closely during the recent period of low natural gas prices.
Talisman continued its successful exploration program in the area, drilling and completing five wells in 1996,
three of which were tied in and producing by year-end. The Sukunka c-27-B well, which tested at rates of 44
mmcf/d, was put on stream in the fourth quarter and set new records for low costs and short drilling time. The
Company continued to reduce well completion and tie in costs in the area during the year. In total, Talisman
spent $31 million at Monkman in 1996.
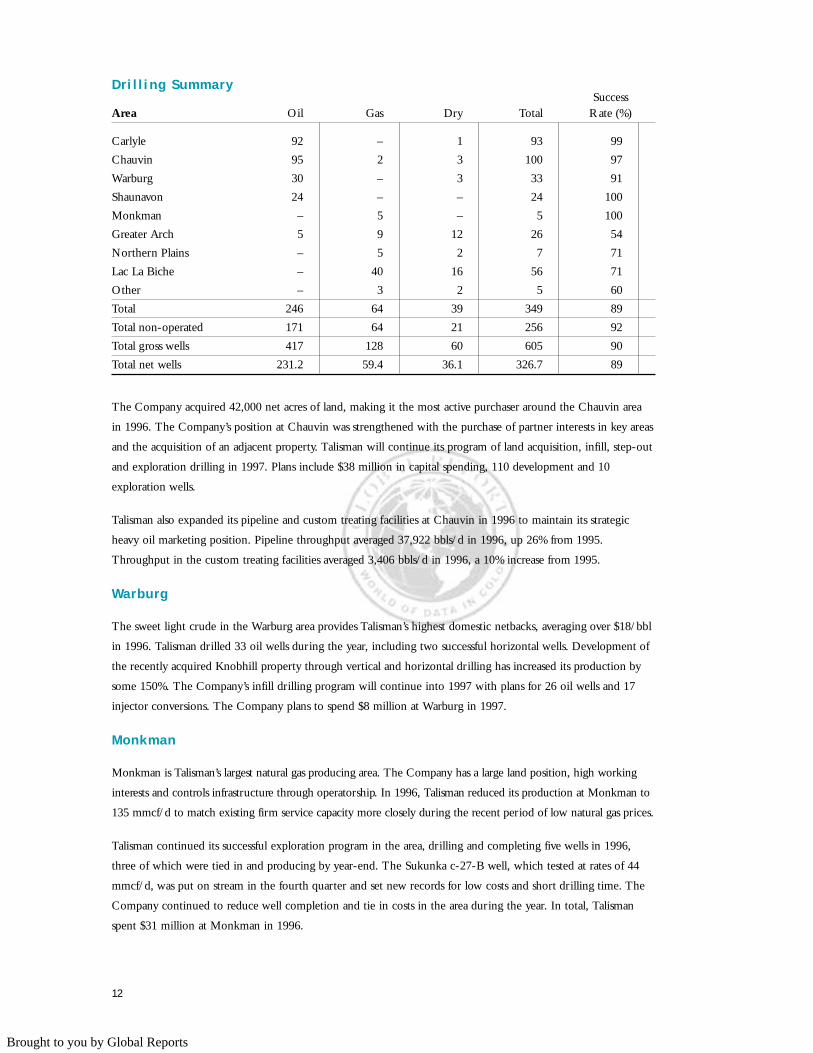
Dri l l ing SummarySuccess
Area Oil Gas Dry Total Rate (%)
Carlyle 92 – 1 93 99
Chauvin 95 2 3 100 97
Warburg 30 – 3 33 91
Shaunavon 24 – – 24 100
Monkman – 5 – 5 100
Greater Arch 5 9 12 26 54
Northern Plains – 5 2 7 71
Lac La Biche – 40 16 56 71
Other – 3 2 5 60
Total 246 64 39 349 89
Total non-operated 171 64 21 256 92
Total gross wells 417 128 60 605 90
Total net wells 231.2 59.4 36.1 326.7 89
Brought to you by Global Reports

13
Plans for 1997 include seven exploration wells and expenditures of $33 million, with emphasis on the Murray
River area. A central dehydration facility, with 90 mmcf/d capacity, is planned for construction at Murray River
in 1997 to handle increased production.
Talisman continually examines ways to lower costs and create new opportunities in the area. The Company is
currently evaluating a number of new technologies, including remote sensing, acid gas removal, and downhole
gas/water separation and disposal.
Northern Plains
Talisman’s Northern Plains production increased 40% in 1996. The Company drilled seven wells, including three
exploration discoveries which added 41 bcf of proved reserves. Spending in the area totalled $20 million.
Additional water handling facilities will be completed in 1997, increasing the production capacity of the area.
The Company continued the development of the North Chinchaga field in 1996 with one successful horizontal
well. In addition, the production facility was debottlenecked, increasing oil production to over 1,200 bbls/d.
Talisman continued to expand its land base in the area by adding over 40,000 net acres in 1996. Talisman’s 1997
exploration program will continue to emphasize prospects close to infrastructure where production can be tied in
quickly. The Company plans to drill one development well and four vertical exploration wells during 1997,
primarily targeting large pools. Expected spending in 1997 will total $15 million.
Greater Arch
The Greater Arch is a multi-zone oil and gas area with extensive infrastructure. Talisman’s natural gas properties in
the Greater Arch area include Pouce Coupe, Gordondale, Belloy and Teepee as well as oil properties at Clairmont,
Progress and Rigel. Talisman operates four gas plants in the area and has working interests in an additional four.
Total production in the Greater Arch region increased by 20% in 1996 with spending of $40 million.
Canadian Natural Gas Propert ies
Average Working Production (mmcf/d)Major Properties Interest (%) 1996 1995 1994
Operated
Monkman 58 135.2 144.1 83.0
West Central Plains 74 75.6 83.8 87.9
Lac La Biche 82 73.1 69.9 37.5
Greater Arch 77 69.8 58.7 59.7
Northern Plains 88 17.4 12.4 –
Alberta Foothills 85 8.1 4.0 –
Hatton – – – 24.5
Other 56 18.4 25.0 21.0
397.6 397.9 313.6
Non-operated 159.6 183.1 167.6
Total 557.2 581.0 481.2
Brought to you by Global Reports

14
During the year, Talisman acquired a new property at Clairmont and built facilities to bring previously shut-in
production on stream, resulting in a 60% increase by year-end. Since the acquisition of Teepee in 1993,
Talisman’s production has tripled to 18 mmcf/d. Both Teepee and Talisman’s gas plant at Belloy set production
records in 1996, with further growth anticipated in 1997.
In 1996, the Company drilled 26 wells in the area including two exploration discoveries at Webster. This
program added over 5.2 mmboe of proved and probable reserves.
Talisman is targeting multiple prospective zones in its core plays and plans to drill 35 to 40 wells in 1997. During
the coming year, the Company will also debottleneck the Teepee plant and expand nearby pipeline capacity.
Talisman expects to spend $30 million in the area in 1997.
West Centra l P la ins
West Central Plains is another area of multi-zone oil and gas potential with extensive infrastructure. The
Company continues to focus on liquids rich natural gas opportunities which can be brought on stream quickly.
Within this region, the Company’s major asset is the Edson natural gas property.
In 1996, Talisman shipped over 18 mmcf/d of new third-party gas to the Edson gas plant through a converted oil
pipeline. In 1997, the Company expects to add significant new third-party volumes, both through the existing
pipeline and a new raw gas gathering system which could extend some 160 km northwest of the plant. This
additional infrastructure will allow the Company to access its extensive deep gas prospect inventory in the
Berland River area.
The Company plans to drill up to four exploration wells on deep gas plays in 1997. Total spending in West
Central Plains is expected to be $11 million.
Lac La Biche
Lac La Biche is Talisman’s major shallow gas producing area and is the Company’s lowest-cost gas area: 1996
operating costs averaged $0.20/mcf. During 1996, the Company added new compression, over 50 kilometres of
pipeline and 50,000 net acres of land. The Company will continue to expand its drilling, seismic and land
acquisition programs in 1997. The 1996/97 winter drilling program, which includes 70 wells, is currently
underway. Talisman will spend $20 million in the area in 1997.
Alberta Foothi l ls
Alberta Foothills is a new core gas area for Talisman, where the Company is using horizontal drilling to
maximize deliverability from the reservoirs. Talisman’s major property in the area is Blackstone/Cordel, where
production in 1996 doubled to over 8 mmcf/d. In 1996, the Company participated in five wells, including two
successful horizontal and one operated vertical well, all of which were tied in by year-end. In 1996, capital
expenditures of $17 million included drilling and completion, seismic work and the acquisition of a significant
tract of land at Lovett River. In 1997, Talisman plans to drill one horizontal exploration well and three
horizontal development wells at Lovett River. Talisman’s spending in the Alberta Foothills area is expected to
total $19 million in 1997.
Brought to you by Global Reports

15
Acquis it ions and Divest i tures
Asset trading is important to Talisman as the Company continues to increase its working interests in core areas.
In 1996, there were 72 transactions, worth approximately $100 million. Talisman’s western Canadian gross well
count was reduced by 9% through rationalization activities during 1996. This reduction in low working interest
wells, combined with Talisman’s successful 1996 drilling program, increased the Company’s operated share of
production by 4.5% to 69.1%.
Marketing
The benchmark WTI price averaged US$22.00/bbl in 1996, up US$3.70/bbl from 1995 as world oil demand
reached 72 mmbls/d and all but a small number of OPEC producers were at capacity. Talisman’s realized
domestic oil and liquids price averaged $23.95, up 16% from 1995. There was strong demand for all grades of
Canadian crude oil during 1996. Pipeline capacity and apportionment of deliveries continued to be an industry
issue, although Talisman was not adversely affected in 1996.
North American natural gas prices were volatile during 1996. NYMEX natural gas futures reached record highs
in the first quarter of 1996 as a result of cold weather, supply concerns and storage draw-down. However,
pipeline logistics and warm Pacific northwest weather constrained prices in Alberta and British Columbia. In the
second half of 1996, this situation began to change when strong gas demand for electrical generation in
California, followed by an early cold winter and storage concerns resulted in higher domestic prices. To illustrate,
the benchmark British Columbia index price at Sumas averaged US$1.08/mcf for the 1995/96 contract year, but
escalated to US$3.55/mcf for December 1996. However, towards the end of the first quarter of 1997, North
American gas prices softened considerably.
In 1996, Talisman linked a large component of its British Columbia gas production to US-based indices.
Consequently, Talisman’s realized gas netbacks in British Columbia were well above depressed regional prices.
For the 1997 contract year, Talisman changed to a regional index price methodology, and benefited when the
index increased rapidly in November 1996.
1996/97 Contract Year
Gas Sales Price Portfolio
Other (including oil) Prices
Fixed Prices 27%
NYMEX/US Index Prices 31%
British Columbia Basin Prices 18%
Alberta Basin Prices 19%
5%
Power Generation Companies 11%
Aggregators 42%
Direct Sales 33%
Local Distribution Companies 14%
Gas Sales Customer Portfolio
Brought to you by Global Reports

Upper Jurassic Fulmar Formation, Clyde Field, UK Continential Shelf.
This porous sandstone is one of two reservoirs in the Clyde field.
Porosity (blue) due to leaching of Rhaxella sponge spicules in very fine
grained sandstone.
94 95 96
15
69
90
Natural GasProduction(mmcf/d)
969594
33.0
18.8
7.7
Oil & LiquidsProduction(mbbls/d)
16
Talisman-operated
platform at Clyde
in the central
North Sea.
Brought to you by Global Reports
17
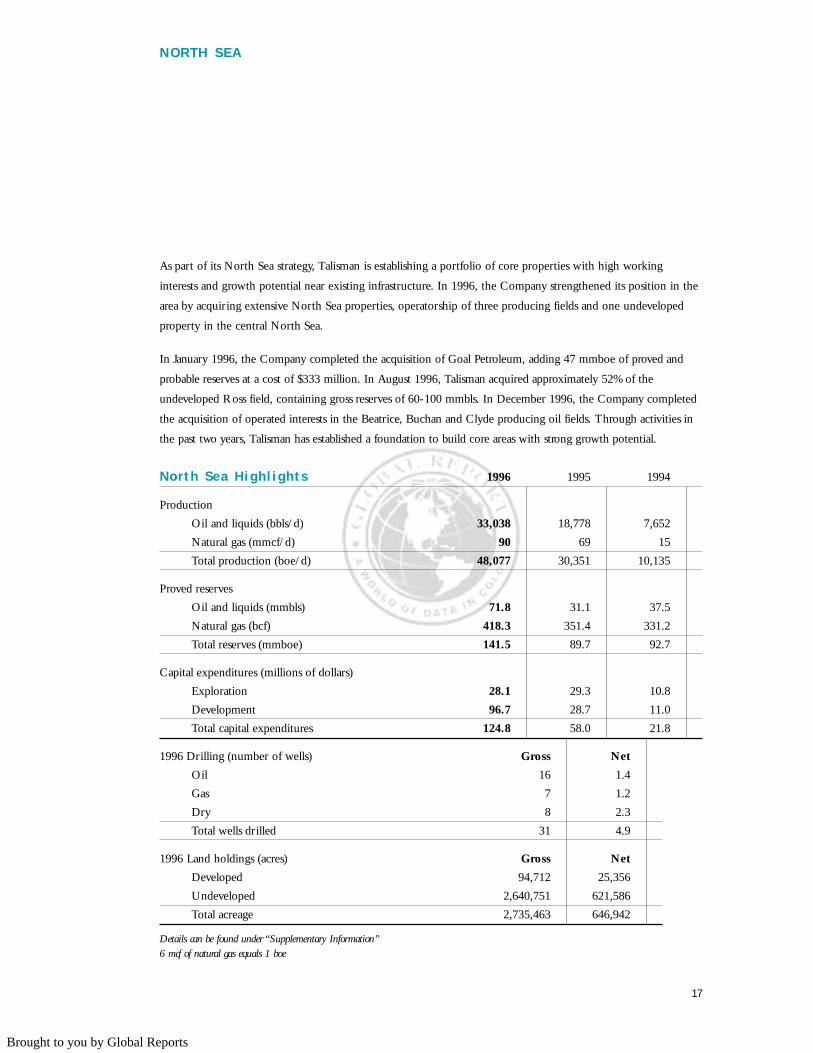
As part of its North Sea strategy, Talisman is establishing a portfolio of core properties with high working
interests and growth potential near existing infrastructure. In 1996, the Company strengthened its position in the
area by acquiring extensive North Sea properties, operatorship of three producing fields and one undeveloped
property in the central North Sea.
In January 1996, the Company completed the acquisition of Goal Petroleum, adding 47 mmboe of proved and
probable reserves at a cost of $333 million. In August 1996, Talisman acquired approximately 52% of the
undeveloped Ross field, containing gross reserves of 60-100 mmbls. In December 1996, the Company completed
the acquisition of operated interests in the Beatrice, Buchan and Clyde producing oil fields. Through activities in
the past two years, Talisman has established a foundation to build core areas with strong growth potential.
N O R T H S E A
North Sea Highl ights 1996 1995 1994
Production
Oil and liquids (bbls/d) 33,038 18,778 7,652
Natural gas (mmcf/d) 90 69 15
Total production (boe/d) 48,077 30,351 10,135
Proved reserves
Oil and liquids (mmbls) 71.8 31.1 37.5
Natural gas (bcf) 418.3 351.4 331.2
Total reserves (mmboe) 141.5 89.7 92.7
Capital expenditures (millions of dollars)
Exploration 28.1 29.3 10.8
Development 96.7 28.7 11.0
Total capital expenditures 124.8 58.0 21.8
1996 Drilling (number of wells) Gross Net
Oil 16 1.4
Gas 7 1.2
Dry 8 2.3
Total wells drilled 31 4.9
1996 Land holdings (acres) Gross Net
Developed 94,712 25,356
Undeveloped 2,640,751 621,586
Total acreage 2,735,463 646,942
Details can be found under “Supplementary Information”6 mcf of natural gas equals 1 boe
Brought to you by Global Reports
18
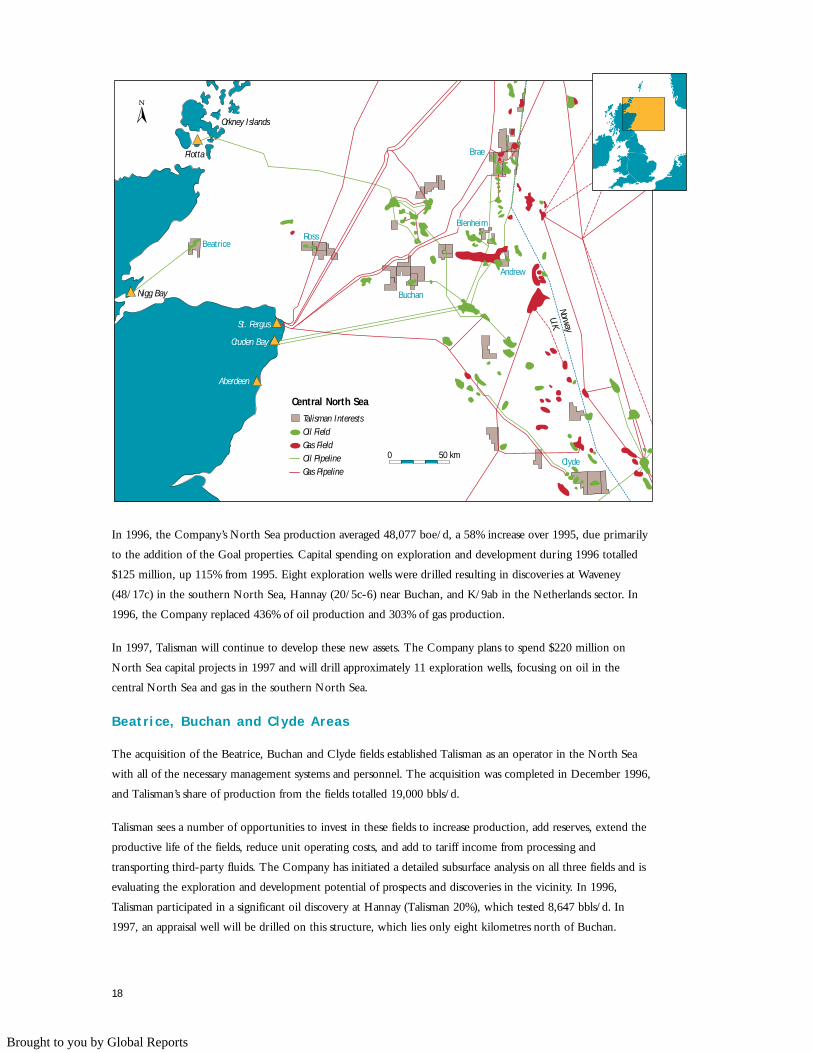
In 1996, the Company’s North Sea production averaged 48,077 boe/d, a 58% increase over 1995, due primarily
to the addition of the Goal properties. Capital spending on exploration and development during 1996 totalled
$125 million, up 115% from 1995. Eight exploration wells were drilled resulting in discoveries at Waveney
(48/17c) in the southern North Sea, Hannay (20/5c-6) near Buchan, and K/9ab in the Netherlands sector. In
1996, the Company replaced 436% of oil production and 303% of gas production.
In 1997, Talisman will continue to develop these new assets. The Company plans to spend $220 million on
North Sea capital projects in 1997 and will drill approximately 11 exploration wells, focusing on oil in the
central North Sea and gas in the southern North Sea.
Beatr ice, Buchan and Clyde Areas
The acquisition of the Beatrice, Buchan and Clyde fields established Talisman as an operator in the North Sea
with all of the necessary management systems and personnel. The acquisition was completed in December 1996,
and Talisman’s share of production from the fields totalled 19,000 bbls/d.
Talisman sees a number of opportunities to invest in these fields to increase production, add reserves, extend the
productive life of the fields, reduce unit operating costs, and add to tariff income from processing and
transporting third-party fluids. The Company has initiated a detailed subsurface analysis on all three fields and is
evaluating the exploration and development potential of prospects and discoveries in the vicinity. In 1996,
Talisman participated in a significant oil discovery at Hannay (Talisman 20%), which tested 8,647 bbls/d. In
1997, an appraisal well will be drilled on this structure, which lies only eight kilometres north of Buchan.
Orkney Islands
Aberdeen
Cruden Bay
St. Fergus
Flotta
Nigg Bay
Norway
U.K.
Oil Field
Oil PipelineGas Field
Gas Pipeline
Talisman Interests
0 50 km
Brae
Clyde
Andrew
Buchan
RossBeatrice
Blenheim
Central North Sea
Brought to you by Global Reports
19
At Beatrice, the Company’s plans for 1997 include reprocessing and reinterpretation of 3-D seismic data,
recompleting a number of wells, and increasing water injection. Talisman also operates the Nigg Bay terminal,
approximately 80 kilometres west of Beatrice. In January, agreement was reached to ship oil from the Captain
field through the Nigg Bay terminal, generating additional revenues. At Clyde, Talisman plans to drill three
horizontal development wells in the upper sands in 1997. Total 1997 capital expenditures in the Beatrice, Buchan
and Clyde areas are expected to be $48 million.
Brae Area
Talisman has interests in five producing fields in the Brae area: South Brae, Central Brae, North Brae, East Brae
and Beinn, as well as interests in three fields under development at West Brae, Sedgwick and Kingfisher.
During 1996, commercial arrangements were completed for the development of the West Brae (Talisman 14%)
and Sedgwick (Talisman 20%) fields, with first production expected at the end of 1997. At present, the Company
anticipates its share of peak production to be approximately 4,500 bbls/d. The Company is also evaluating
development of the Braemar discovery, which tested 3,400 bbls/d of liquids and 49 mmcf/d of gas in 1995.
Development of the Kingfisher field, in which Talisman has a minor interest, commenced in 1996, and will
result in substantial tariff income for the Brae partners. First production from Kingfisher is scheduled for late
1997. Expansion of the SAGE terminal (Talisman 7%), to accommodate gas production from the Britannia field,
will continue in 1997.
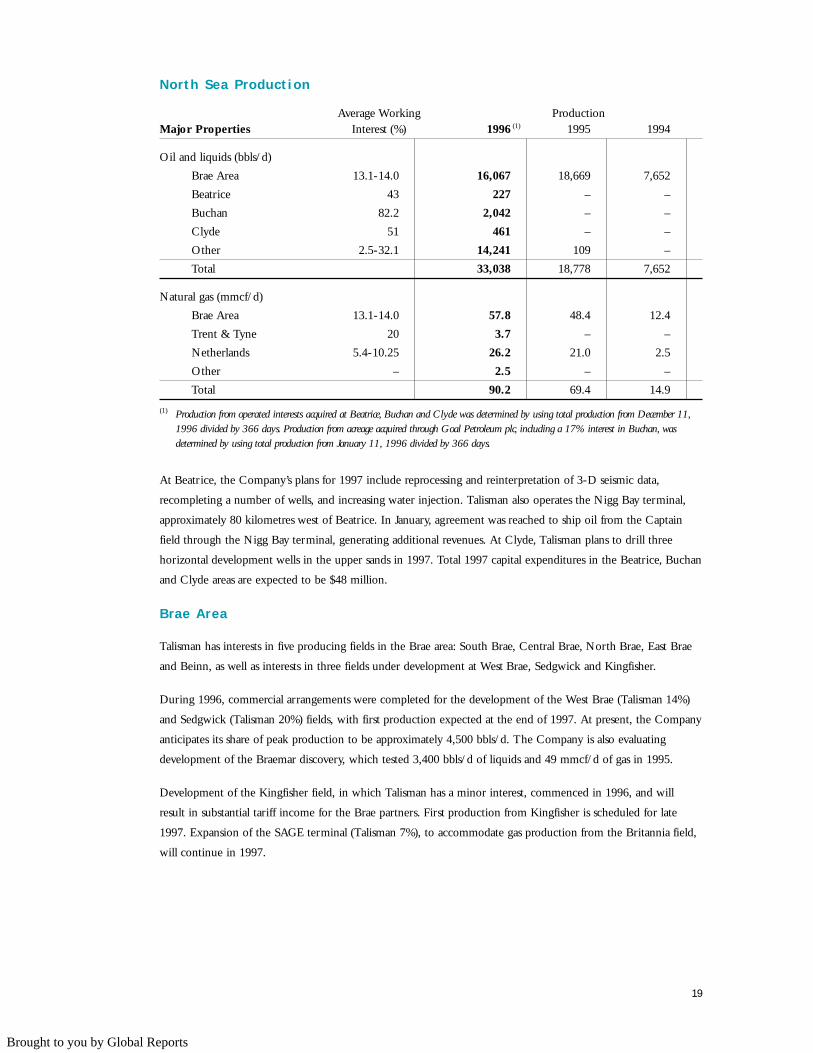
North Sea Product ion
Average Working ProductionMajor Properties Interest (%) 1996 (1) 1995 1994
Oil and liquids (bbls/d)
Brae Area 13.1-14.0 16,067 18,669 7,652
Beatrice 43 227 – –
Buchan 82.2 2,042 – –
Clyde 51 461 – –
Other 2.5-32.1 14,241 109 –
Total 33,038 18,778 7,652
Natural gas (mmcf/d)
Brae Area 13.1-14.0 57.8 48.4 12.4
Trent & Tyne 20 3.7 – –
Netherlands 5.4-10.25 26.2 21.0 2.5
Other – 2.5 – –
Total 90.2 69.4 14.9
(1) Production from operated interests acquired at Beatrice, Buchan and Clyde was determined by using total production from December 11,1996 divided by 366 days. Production from acreage acquired through Goal Petroleum plc, including a 17% interest in Buchan, wasdetermined by using total production from January 11, 1996 divided by 366 days.
Brought to you by Global Reports

20
During 1996, six development and two sidetrack wells were drilled, including a successful sidetrack well at South
Brae which is currently producing 6,000 bbls/d. One development and four sidetrack wells are planned for 1997.
Talisman and its partners are exploring for smaller targets in the Brae area which can be tied back to existing
facilities. Talisman’s 1997 plans for the Brae area include exploration, development of existing discoveries, infill
drilling in established fields, and development of additional third-party income. This program will include two or
three exploration wells, with capital expenditures of $45 million in the area.
Ross Area
In August 1996, Talisman completed the acquisition of a 52% interest in the undeveloped Ross oil field which
has been appraised by 10 wells since its initial discovery 20 years ago. Talisman expects to initiate development
with three wells in Ross in 1997, and capital spending of approximately $50 million. The Company plans to
develop the field using a tanker-based floating production storage and offtake system, and expects its share of
production from the area to be approximately 20,000 bbls/d in mid-1998.
Andrew, Balmoral , Blenheim, Magnus and Wytch Farm
Talisman added these non-operated fields through the Goal acquisition. First production from the Andrew field
commenced in June 1996, and from the South Magnus satellite in May 1996. Continued development of the
offshore extension of Wytch Farm resulted in an increase in proved reserves of 4.2 mmbls. Talisman plans to
spend approximately $16 million on these properties in 1997, including continued development at Andrew,
Blenheim and Wytch Farm.
Southern North Sea
The Carboniferous region of the southern North Sea offers exploration and development opportunities which
will allow Talisman to expand its gas business in the area.
In November 1996, gas production from the Trent and Tyne fields commenced through the EAGLES
Transportation System. Talisman’s share of production from these two fields is expected to average 28 mmcf/d
in 1997.
Close to the Trent field, Talisman has interests ranging from 28% to 37% in three gas discoveries in Blocks 43/21
and 43/22. An appraisal program started in 1996 with 3-D seismic, and will continue in 1997 with an appraisal
well on the 43/21 discovery, and re-entry and stimulation of one of the discovery wells in 43/22. If successful,
Talisman anticipates first production in 1999. Two exploration wells are planned in the EAGLES catchment area
in 1997.
The Waveney discovery (Talisman 25%) in the Rotliegendes area of the southern North Sea was drilled in 1996
and tested 37 mmcf/d of gas and 600 bbls/d of condensate. Talisman is currently evaluating subsea development
and tie back to nearby facilities, with first production expected by the end of 1998. Appraisal of the 50/26b gas
discovery made in 1995 was disappointing; the appraisal well tested gas with a CO2 content higher than usual for
the southern North Sea.
In the Netherlands sector, the K/5a Echo South (Talisman 10.25%) prospect tested at 67 mmcf/d and was tied in
during 1996. Production will be added in late 1997 through the combined development of the K/5a Charlie and
North Echo fields.
Brought to you by Global Reports
21
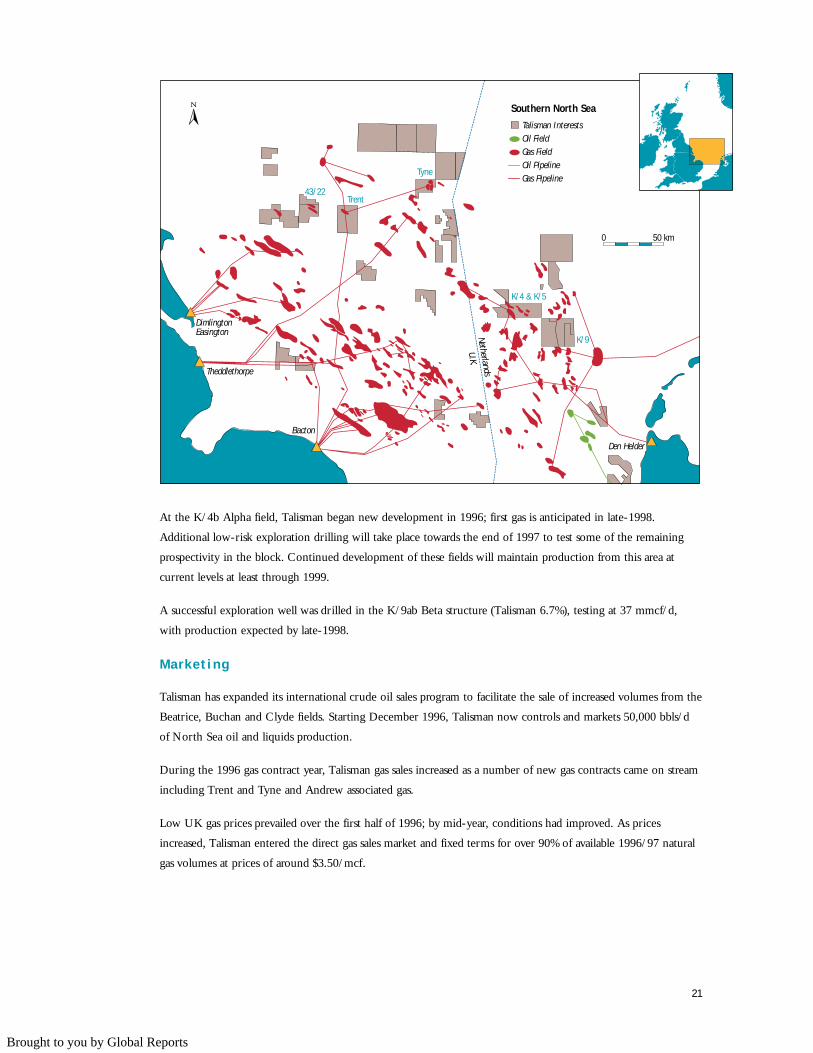
At the K/4b Alpha field, Talisman began new development in 1996; first gas is anticipated in late-1998.
Additional low-risk exploration drilling will take place towards the end of 1997 to test some of the remaining
prospectivity in the block. Continued development of these fields will maintain production from this area at
current levels at least through 1999.
A successful exploration well was drilled in the K/9ab Beta structure (Talisman 6.7%), testing at 37 mmcf/d,
with production expected by late-1998.
Marketing
Talisman has expanded its international crude oil sales program to facilitate the sale of increased volumes from the
Beatrice, Buchan and Clyde fields. Starting December 1996, Talisman now controls and markets 50,000 bbls/d
of North Sea oil and liquids production.
During the 1996 gas contract year, Talisman gas sales increased as a number of new gas contracts came on stream
including Trent and Tyne and Andrew associated gas.
Low UK gas prices prevailed over the first half of 1996; by mid-year, conditions had improved. As prices
increased, Talisman entered the direct gas sales market and fixed terms for over 90% of available 1996/97 natural
gas volumes at prices of around $3.50/mcf.
0 50 km
Oil Field
Bacton
Theddlethorpe
DimlingtonEasington
Den Helder
Oil PipelineGas Field
Gas Pipeline
Talisman Interests
Netherlands
U.K.
Tyne
Trent
K/4 & K/5
43/22
K/9
Southern North Sea
Brought to you by Global Reports
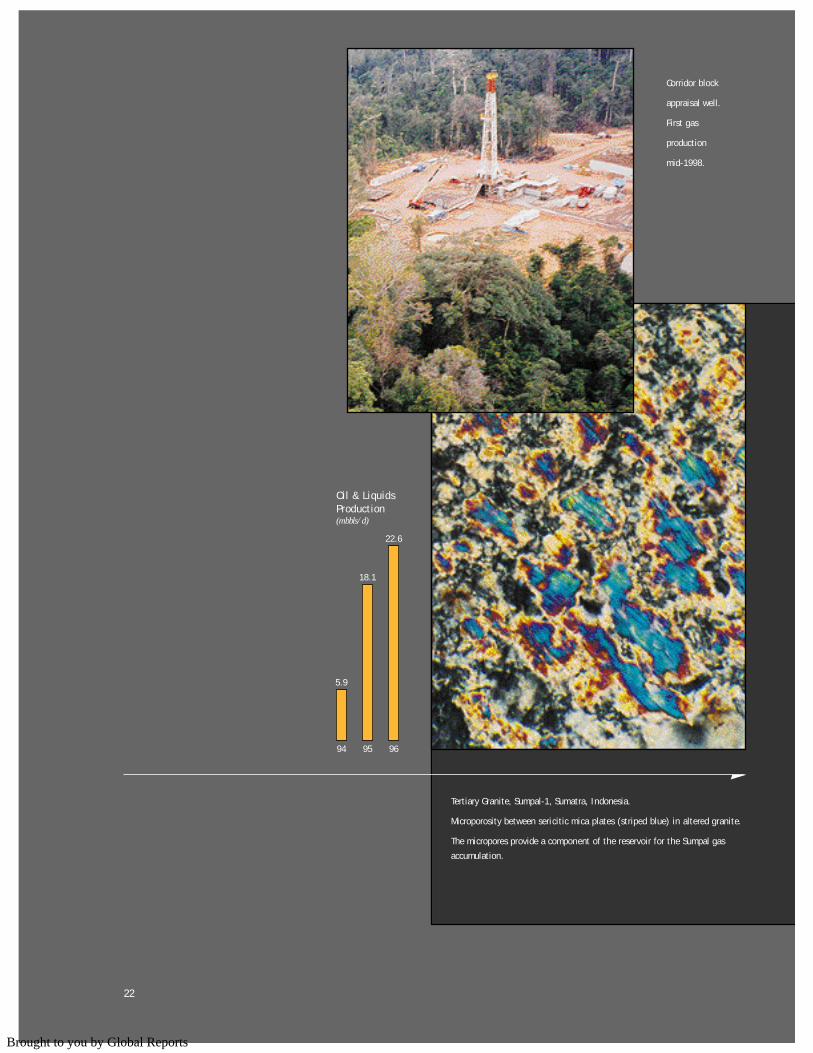
Tertiary Granite, Sumpal-1, Sumatra, Indonesia.
Microporosity between sericitic mica plates (striped blue) in altered granite.
The micropores provide a component of the reservoir for the Sumpal gas
accumulation.
969594
22.6
18.1
5.9
Oil & LiquidsProduction(mbbls/d)
22
Corridor block
appraisal well.
First gas
production
mid-1998.
Brought to you by Global Reports

23
Indonesia has a well established oil industry and a growing natural gas sector. The objective of Talisman’s strategy
in Indonesia is to exploit its existing assets and to search for significant new growth opportunities. During 1996,
the Company’s production increased 25% to 22,621 bbls/d. In 1997, Talisman plans to spend $259 million on
capital projects in Indonesia, with the Corridor Gas Project accounting for 75% of the total.
I N D O N E S I A
Indonesia Highl ights 1996 1995 1994
Production
Oil and liquids (bbls/d) 22,621 18,121 5,919
Total production (boe/d) 22,621 18,121 5,919
Proved reserves
Oil and liquids (mmbls) 39.0 32.3 27.2
Natural gas (bcf) 332.0 – –
Total reserves (mmboe) 94.3 32.3 27.2
Capital expenditures (millions of dollars)
Exploration 11.0 11.8 8.8
Development 61.5 47.9 15.5
Total capital expenditures 72.5 59.7 24.3
1996 Drilling (number of wells) Gross Net
Oil 19 9.5
Gas 4 2.7
Dry 6 3.3
Total wells drilled 29 15.5
1996 Land holdings (acres) Gross Net
Developed 312,427 136,267
Undeveloped 2,210,036 1,082,207
Total acreage 2,522,463 1,218,474
Details can be found under “Supplementary Information”6 mcf of natural gas equals 1 boe
Brought to you by Global Reports
24
Corr idor
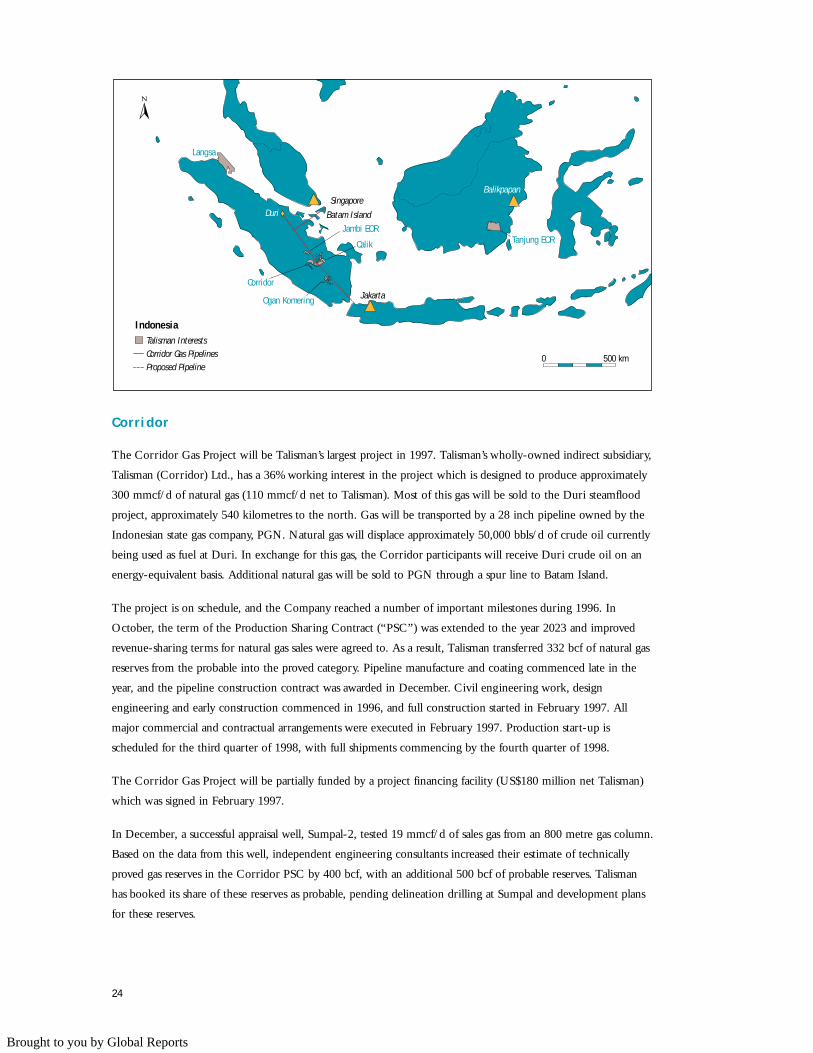
The Corridor Gas Project will be Talisman’s largest project in 1997. Talisman’s wholly-owned indirect subsidiary,
Talisman (Corridor) Ltd., has a 36% working interest in the project which is designed to produce approximately
300 mmcf/d of natural gas (110 mmcf/d net to Talisman). Most of this gas will be sold to the Duri steamflood
project, approximately 540 kilometres to the north. Gas will be transported by a 28 inch pipeline owned by the
Indonesian state gas company, PGN. Natural gas will displace approximately 50,000 bbls/d of crude oil currently
being used as fuel at Duri. In exchange for this gas, the Corridor participants will receive Duri crude oil on an
energy-equivalent basis. Additional natural gas will be sold to PGN through a spur line to Batam Island.
The project is on schedule, and the Company reached a number of important milestones during 1996. In
October, the term of the Production Sharing Contract (“PSC”) was extended to the year 2023 and improved
revenue-sharing terms for natural gas sales were agreed to. As a result, Talisman transferred 332 bcf of natural gas
reserves from the probable into the proved category. Pipeline manufacture and coating commenced late in the
year, and the pipeline construction contract was awarded in December. Civil engineering work, design
engineering and early construction commenced in 1996, and full construction started in February 1997. All
major commercial and contractual arrangements were executed in February 1997. Production start-up is
scheduled for the third quarter of 1998, with full shipments commencing by the fourth quarter of 1998.
The Corridor Gas Project will be partially funded by a project financing facility (US$180 million net Talisman)
which was signed in February 1997.
In December, a successful appraisal well, Sumpal-2, tested 19 mmcf/d of sales gas from an 800 metre gas column.
Based on the data from this well, independent engineering consultants increased their estimate of technically
proved gas reserves in the Corridor PSC by 400 bcf, with an additional 500 bcf of probable reserves. Talisman
has booked its share of these reserves as probable, pending delineation drilling at Sumpal and development plans
for these reserves.
0 500 km
Kalimantan
Sarawak
Sabah
Malaysia
Java
Sumatra
Langsa
Corridor
Jambi EOR
Ogan Komering
Tanjung EORCalik
Duri
Balikpapan
Jakarta
Singapore
Batam Island
Corridor Gas PipelinesProposed Pipeline
Talisman Interests
Indonesia
Brought to you by Global Reports
25
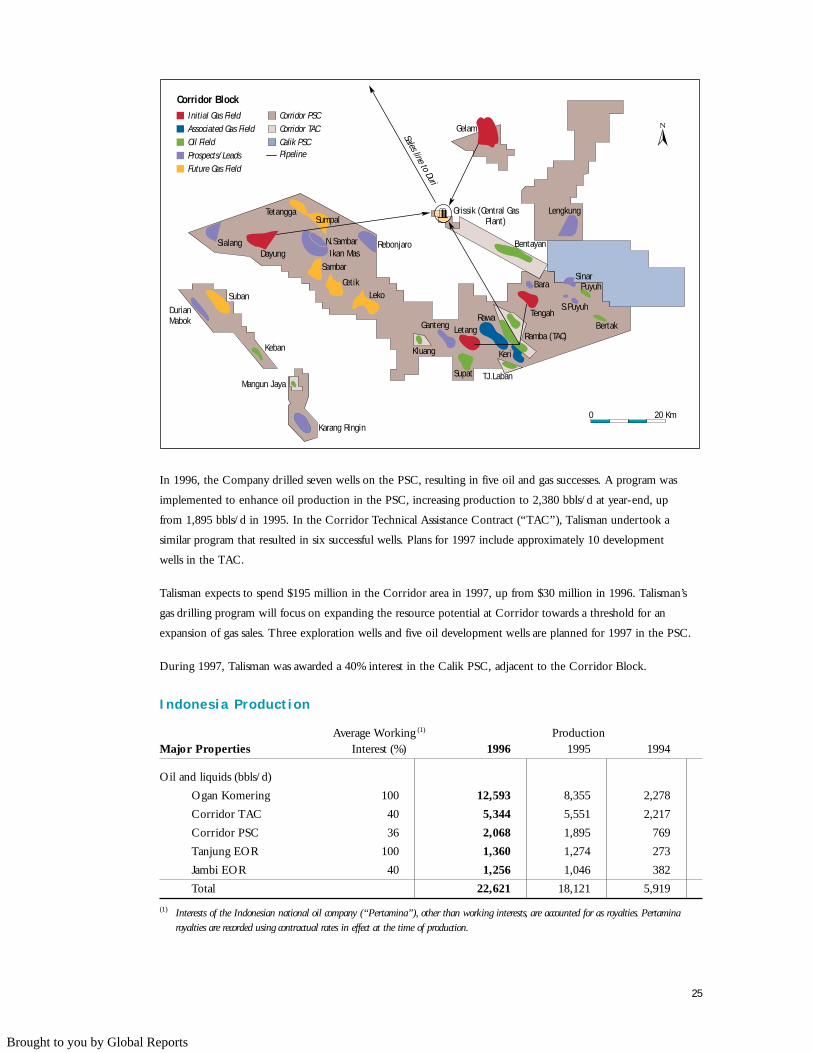
In 1996, the Company drilled seven wells on the PSC, resulting in five oil and gas successes. A program was
implemented to enhance oil production in the PSC, increasing production to 2,380 bbls/d at year-end, up
from 1,895 bbls/d in 1995. In the Corridor Technical Assistance Contract (“TAC”), Talisman undertook a
similar program that resulted in six successful wells. Plans for 1997 include approximately 10 development
wells in the TAC.
Talisman expects to spend $195 million in the Corridor area in 1997, up from $30 million in 1996. Talisman’s
gas drilling program will focus on expanding the resource potential at Corridor towards a threshold for an
expansion of gas sales. Three exploration wells and five oil development wells are planned for 1997 in the PSC.
During 1997, Talisman was awarded a 40% interest in the Calik PSC, adjacent to the Corridor Block.
Indonesia Product ion
Average Working (1) ProductionMajor Properties Interest (%) 1996 1995 1994
Oil and liquids (bbls/d)
Ogan Komering 100 12,593 8,355 2,278
Corridor TAC 40 5,344 5,551 2,217
Corridor PSC 36 2,068 1,895 769
Tanjung EOR 100 1,360 1,274 273
Jambi EOR 40 1,256 1,046 382
Total 22,621 18,121 5,919
(1) Interests of the Indonesian national oil company (“Pertamina”), other than working interests, are accounted for as royalties. Pertaminaroyalties are recorded using contractual rates in effect at the time of production.
�
0 20 KmSales line to Duri
Corridor TAC
Future Gas FieldProspects/LeadsOil FieldAssociated Gas FieldInitial Gas Field
Corridor BlockCorridor PSC
Calik PSC
Kluang
Mangun Jaya
Keban
Durian Mabok
Karang Ringin
Ramba (TAC)
Supat
Keri
TJ.Laban
LetangRawa Tengah
Bara
Bertak
Sinar
Lengkung Grissik (Central Gas Plant)
Gelam
Puyuh
S.PuyuhLeko
Cetik
Sambar
Sialang
Suban
Ikan MasN.Sambar Rebonjaro
Tetangga
Ganteng
DayungBentayan
Sumpal
Pipeline
Brought to you by Global Reports

Ogan Komering
Talisman’s share of production increased by 51% in 1996 due to the further extension of the Air Serdang field,
continued development drilling and a redetermination of working interests. Talisman’s working interest in the Air
Serdang Unitized Area was increased from 55% to 64.4%. For a period of 12 months starting July 1, 1996,
Talisman will recover 3,218 bbls/d to compensate the Company for past production. Talisman’s working interest
in the field may increase again in 1997, as a result of successful 1996 development drilling.
Spending in the Ogan Komering area during 1996 totalled $14 million with six successful development wells
drilled in the Air Serdang field and one in the Guruh field. An exploration well and subsequent appraisal well
discovered and tested hydrocarbons at Metur, however, this field is small and probably non-commercial. Although
unsuccessful, this exploration program provided encouragement that new hydrocarbon discoveries can be made
on the block.
In 1997, the Company plans to evaluate a project for the sale of gas from Guruh, Air Serdang and Mandala
(a previously undeveloped gas discovery). Talisman plans to drill 14 development wells and two exploration
wells in 1997, with total spending of $29 million.
Tanjung Raya
Tanjung Raya is a major oilfield located in Kalimantan with original oil in place of 600 mmbls. The reservoir
was on primary production from 1961 to 1995, and Talisman commenced water injection in 1995 at rates of up
to 140,000 bbls/d. Response to the waterflood has been slower than anticipated. In early 1997, the Company
conducted fracture stimulations on three of 50 producing wells and production increased to over 1,900 bbls/d.
Based on this success, an increased fracture stimulation program will be conducted in 1997.
In 1996, Talisman initiated a major operating cost reduction program. The Company anticipates that 1997
operating costs will be 38% below 1994 levels, when Talisman acquired the property. Plans for 1997 include $16
million in capital spending, including seven development wells and an extension of the fracture stimulation program.
Jambi
Enhanced oil recovery operations continued at the Kenali Assam field and commenced at the Tempino and
Bajubang fields in 1996. Production increased by 20% to 1,256 bbls/d. In 1997, Talisman will participate in 77
well recompletions and waterflood operations at Tempino and Bajubang. Capital expenditures in 1997 are
expected to be $4 million.
Cenako
Following evaluation of the Cenako acreage in 1996, the Company has given notice of relinquishment of the block.
Langsa
During 1996, Talisman farmed out a portion of its interest in the block on a seismic option agreement. Seismic
is currently being evaluated and may lead to a well in the fourth quarter of 1997. Talisman has retained an option
to participate in this well.
26
Brought to you by Global Reports

E X P L O R AT I O N A R E A S
Alger ia
Algeria is one of the most prolific hydrocarbon exploration basins in the world in terms of recent oil and gas
discoveries. Talisman has a 35% interest in Blocks 215 and 405 in the oil-prone Ghadames Basin in eastern
Algeria. Block 405 immediately offsets major new oil discoveries at Hassi Berkine and El Merk. Despite the
subtleties and complexities associated with this play, Talisman has discovered hydrocarbons in its first four wells
on this 713,000 acre block.
During 1996, Talisman drilled three successful wells in Block 405. The MLNE-1 well, located in the northeast
corner of the block, tested 750 bbls/d, confirming the extension onto Block 405 of the BKE/ORD field which
is estimated to have oil in place of two and one half billion barrels. In early 1997, Block 405 became a party to
the unit. Talisman expects first production from the unitized area by the year 2000. Talisman plans to drill an
additional well on the structure in 1997 as part of the field development plan.
During 1996, the Company also completed and tested two wells on the exploration discovery at MLN, located
in the eastern part of the block. The discovery well, MLN-1, tested at rates of 15,580 bbls/d and 61 mmcf/d
from three zones. An appraisal well, MLN-2, two kilometres to the northwest, was tested in December 1996.
This well, drilled downdip on the structure, was located to define the oil/water contact and to test the pool
boundaries. The well tested at 3,400 bbls/d and 9 mmcf/d from one of the three Triassic sands found in MLN-1.
These wells confirm a significant hydrocarbon accumulation at MLN. At year-end, drilling commenced on
MLN-3, five kilometres northeast of the MLN-1 location. This third well will assess the size of the MLN
structure and allow consideration of development potential.
Block 405
Prospect
0 20 Km
SF-1
El Merk
Hassi Berkine
EKT
MLNE-1
EMK-1EMK-2
EME-2
HAD-1
WT-1
WT-2
WT-3
BKNE-1
BK-2RKF-2
RKF-1
RE-1
BRSW-1,2,3
RDP-1
BBK-2
BBK-1HBN-1
HBNN-1
HBNN-1
BRW-1
BRW-2
ROM-2AROM-1
HBNS-1,2,3
BBKN-1
ORD-1BKE-2
BKE-1BKE-4
Oil Pipeline
Gas and Condensate
Oil
Talisman Interests
Gas Pipeline MLN-2 MLN-3
MLE-1
MZL-1
MLN-1
Tunisia
Morocco
Block 215
Spain
Oran
Hassi R' Mel
Algiers
Mali Algeria
Libya
Block 405
Niger
HassiMessaoud
Block 405
27
Brought to you by Global Reports

In 1996, Talisman spent $19 million in Algeria and plans to spend an additional $21 million this year. The
Company plans to drill four or five wells in 1997, including one well on Block 215, located 105 kilometres
west of Block 405.
East Coast Canada
Talisman holds various interests in the Jeanne d’Arc Basin off eastern Newfoundland, including a small interest in
Terra Nova, a 19.5% interest in Whiterose, and a number of small interests in acreage within and adjacent to the
proposed Sable Island Gas Project.
Plans for Whiterose are currently being formulated. Talisman expects to participate in a 3-D seismic survey over
the field, beginning in 1997. Talisman also has a minor interest in Terra Nova Far East and is discussing
participation in field development.
In western Newfoundland, Talisman drilled one wildcat well on Block EL1008 which was abandoned after
producing water on test. Talisman maintains an 18.75% interest in the block, but there are no plans to drill on
this acreage in 1997.
United States
Talisman has acquired a significant land position in the Nevada overthrust, where the Company is using its thrust
and fold belt expertise. Talisman participated in two wildcat exploration wells during 1996 in order to gain
subsurface information. Both wells were dry and abandoned; however, the Company obtained excellent
geological information for seismic data correlation. Talisman is now defining its exploration prospects for drilling
in late 1997 or early 1998.
Latin America
In Trinidad, the Company was awarded a 50% working interest in Block 2(ab) and 25% of Block 2(c) situated off
the northeast coast. This is an area along trend from recent oil discoveries in the Venezuelan thrust and fold belt.
An extensive 3-D seismic survey is underway and interpretation will begin in the second half of 1997. Talisman
has committed to drilling a well in each block, with drilling expected in 1998.
In Peru, the Company has acquired a 20% interest in Block 66 in the Ene Basin close to the giant Camisea gas
condensate field. Acquisition and interpretation of seismic data on Block 66 has commenced, with possible
drilling in 1999.
28
Brought to you by Global Reports
Human Resources
Talisman continues to invest in employee training and development as part of the ongoing program to ensure that
the Company’s leadership and technical capabilities match its operational growth. Talisman emphasizes the link
between corporate performance and individual reward through its stock option plan, savings plan and variable
pay program.
Talisman continues to utilize third-party alliances and outsourcing arrangements to meet personnel and corporate
service needs. This has proven very successful in providing Talisman with flexibility, access to resources and
leading edge capabilities.
Talisman has achieved a 68% growth in production over the past two years while staff levels have increased only
5% during the period, to the current level of 791 employees.
Health, Safety and Environment
Talisman recognizes the importance of a high level of performance in areas of health, safety and environment (“HSE”).
Environment planning in conjunction with asset acquisitions is an important aspect of Talisman’s HSE
management system. In 1996, approximately 80 Canadian properties were reviewed specifically for their
environmental compliance. Internationally, the acquisition of the Beatrice, Buchan and Clyde fields was preceded
by an extensive review of operational HSE performance, facility integrity, and abandonment liabilities and costs.
Letters of Acceptance for the Talisman Safety Cases submitted for the Beatrice, Buchan and Clyde fields were
received from the UK Health and Safety Executive in mid-December.
To ensure continuing HSE integrity, environmental and safety audits were completed at 32 operated production
facilities in Canada and internationally during 1996. Third-party specialists participated in all audits. Talisman’s
Board of Directors is apprised of the Company’s HSE performance at each Board meeting.
Consistent with the Company’s commitment to the Federal Government’s Climate Change Voluntary Challenge
and Registry Program, Talisman continued to achieve its stated objective of year-over-year reduction in energy
use and carbon dioxide emissions on a per unit of production basis.
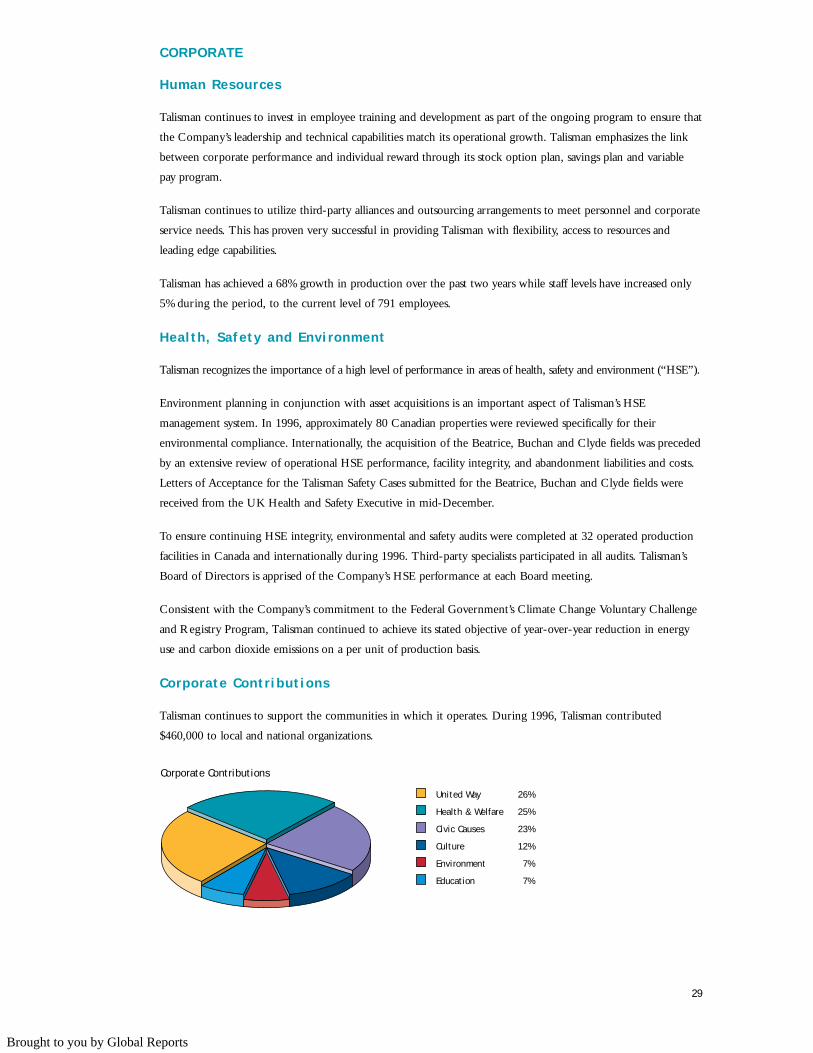
Corporate Contr ibutions
Talisman continues to support the communities in which it operates. During 1996, Talisman contributed
$460,000 to local and national organizations.
29
C O R P O R AT E
Corporate Contributions
United Way
Health & Welfare
Civic Causes
Culture
Education
Environment
26%
25%
23%
12%
7%
7%
Brought to you by Global Reports

THE FOLLOWING DI SCUSSION AND ANALYSIS SHOULD BE READ IN CONJUNCTION WITH THE CONSOLIDATED
FINANCIAL STATEMENTS INCLUDED ON PAGES 43 T O 59 OF THIS ANNUAL REPORT.
Talisman continued to create value for its shareholders through exceptional performance in 1996. Talisman’s 1996
cash flow per share increased 29% to $6.71. Net income per share was $0.91, an increase of 117%.
This strong financial performance was driven by a 16% increase in total production and a 20% increase in overall
prices. Talisman’s crude oil and liquids production increased 29% over the prior year. Roughly two-thirds of this
increase came from acquired Goal properties, with the remainder coming from successful drilling programs in
western Canada and Indonesia.
A full year of production from the Beatrice, Buchan and Clyde fields and continued
exploration and development success in western Canada and Indonesia are expected to
provide continued growth in 1997. The Company also has a number of ongoing and
planned projects which will contribute to additional growth in 1998 and beyond. These
include: development of the Ross oil field in the North Sea, construction of the Corridor
Gas Project in Indonesia, continued drilling in Algeria and exploration in Trinidad and
Peru. On February 12, 1997, Talisman announced its intention to offer to purchase
Wascana Energy Inc. If successful, this acquisition would double Talisman’s undeveloped
Canadian land base and provide a large inventory of drilling prospects. The addition of
Wascana’s production would increase Talisman’s 1997 production by approximately 30%.
Financia l Highl ights
A 29% increase in oil and liquids production and an 18% increase in oil and liquids prices
contributed to a 134% increase in net income and a 39% increase in cash flow in 1996.
Talisman’s realized natural gas price increased 20% over 1995. Gross sales increased 39% to
$1.4 billion in 1996 from $1.0 billion in 1995. Oil and liquids revenues accounted for
68% of sales.
Royalties, operating expenses and depreciation, depletion and amortization (“DD&A”)
expense increased in 1996 as a result of increased production volumes. Unit operating costs
increased to $4.61 per barrel of oil equivalent (“boe”), up slightly from $4.34/boe in 1995,
as higher cost, higher netback, North Sea production constituted a greater proportion of
total production. Increased exploration expense reflects a 40% increase in geological and
geophysical spending as the Company prepares for increased exploration activity in 1997
and beyond. Dry hole expense increases primarily relate to the North Sea. Increased
pre-tax income resulted in additional taxes in 1996; Talisman’s effective tax rate remained
relatively unchanged.
TA L IS M A N E N E R G Y I N C .
M A N A G E M E N T ’ S D I S C U S S I O N A N D A N A LY S I S
969594
697.4
502.3
361.5
Cash Flow(millions of dollars)
969594
94.9
40.5
64.0
Net Income(millions of dollars)
30
Brought to you by Global Reports
31
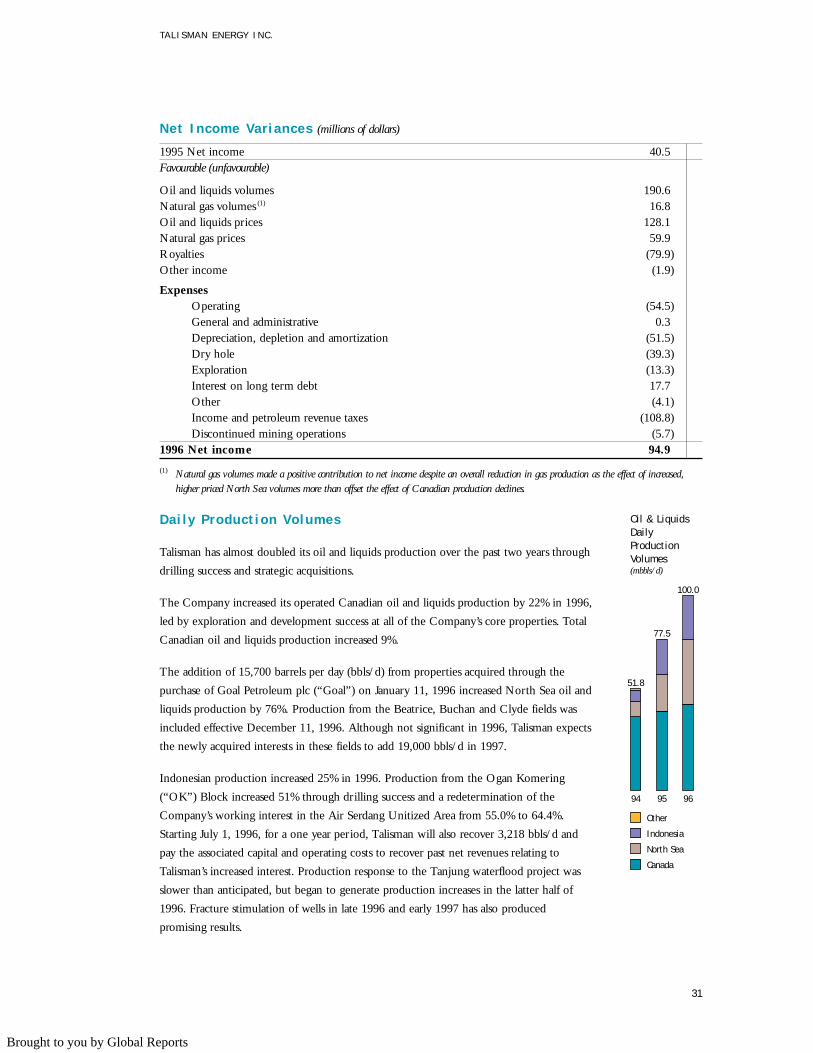
Net Income Var iances (millions of dollars)
1995 Net income 40.5Favourable (unfavourable)
Oil and liquids volumes 190.6Natural gas volumes (1) 16.8Oil and liquids prices 128.1Natural gas prices 59.9Royalties (79.9)Other income (1.9)
ExpensesOperating (54.5)General and administrative 0.3Depreciation, depletion and amortization (51.5)Dry hole (39.3)Exploration (13.3)Interest on long term debt 17.7Other (4.1)Income and petroleum revenue taxes (108.8)Discontinued mining operations (5.7)
1996 Net income 94.9
(1) Natural gas volumes made a positive contribution to net income despite an overall reduction in gas production as the effect of increased,higher priced North Sea volumes more than offset the effect of Canadian production declines.
Dai ly Product ion Volumes
Talisman has almost doubled its oil and liquids production over the past two years through
drilling success and strategic acquisitions.
The Company increased its operated Canadian oil and liquids production by 22% in 1996,
led by exploration and development success at all of the Company’s core properties. Total
Canadian oil and liquids production increased 9%.
The addition of 15,700 barrels per day (bbls/d) from properties acquired through the
purchase of Goal Petroleum plc (“Goal”) on January 11, 1996 increased North Sea oil and
liquids production by 76%. Production from the Beatrice, Buchan and Clyde fields was
included effective December 11, 1996. Although not significant in 1996, Talisman expects
the newly acquired interests in these fields to add 19,000 bbls/d in 1997.
Indonesian production increased 25% in 1996. Production from the Ogan Komering
(“OK”) Block increased 51% through drilling success and a redetermination of the
Company’s working interest in the Air Serdang Unitized Area from 55.0% to 64.4%.
Starting July 1, 1996, for a one year period, Talisman will also recover 3,218 bbls/d and
pay the associated capital and operating costs to recover past net revenues relating to
Talisman’s increased interest. Production response to the Tanjung waterflood project was
slower than anticipated, but began to generate production increases in the latter half of
1996. Fracture stimulation of wells in late 1996 and early 1997 has also produced
promising results.
TA L IS M A N E N E R G Y I N C .
94 95 96
51.8
77.5
100.0
Oil & LiquidsDailyProductionVolumes(mbbls/d)
Other
Indonesia
North Sea
Canada
Brought to you by Global Reports
32
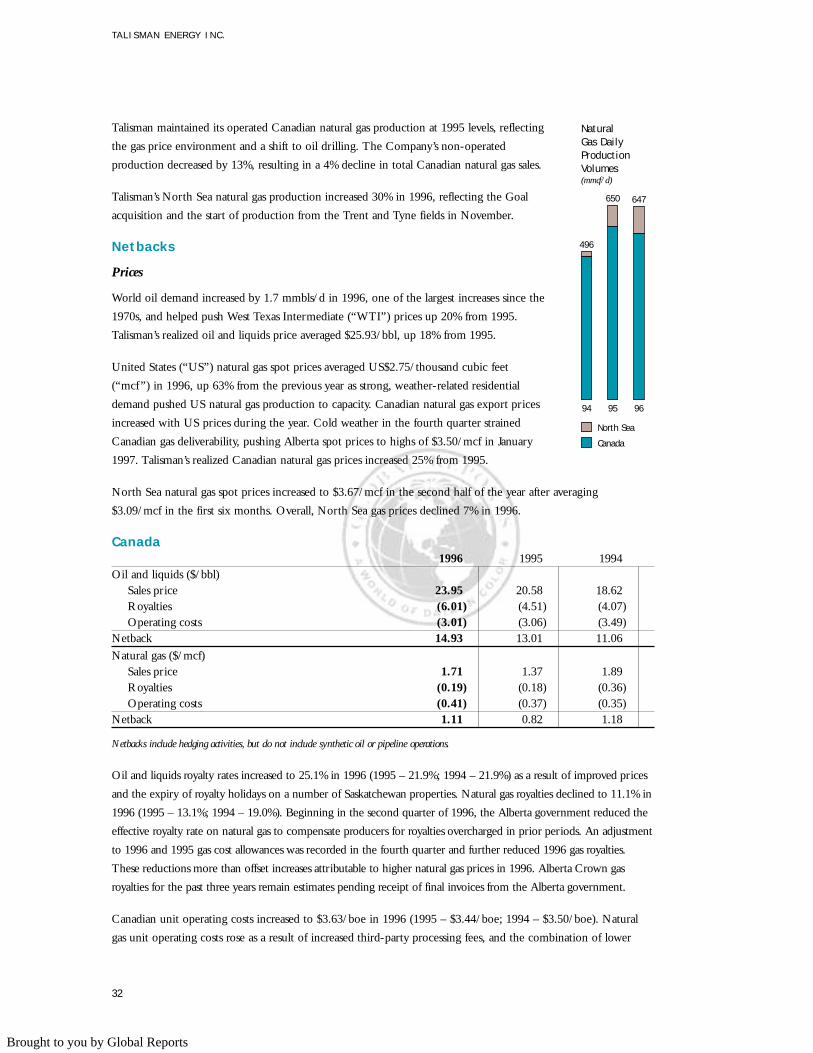
Talisman maintained its operated Canadian natural gas production at 1995 levels, reflecting
the gas price environment and a shift to oil drilling. The Company’s non-operated
production decreased by 13%, resulting in a 4% decline in total Canadian natural gas sales.
Talisman’s North Sea natural gas production increased 30% in 1996, reflecting the Goal
acquisition and the start of production from the Trent and Tyne fields in November.
Netbacks
Prices
World oil demand increased by 1.7 mmbls/d in 1996, one of the largest increases since the
1970s, and helped push West Texas Intermediate (“WTI”) prices up 20% from 1995.
Talisman’s realized oil and liquids price averaged $25.93/bbl, up 18% from 1995.
United States (“US”) natural gas spot prices averaged US$2.75/thousand cubic feet
(“mcf”) in 1996, up 63% from the previous year as strong, weather-related residential
demand pushed US natural gas production to capacity. Canadian natural gas export prices
increased with US prices during the year. Cold weather in the fourth quarter strained
Canadian gas deliverability, pushing Alberta spot prices to highs of $3.50/mcf in January
1997. Talisman’s realized Canadian natural gas prices increased 25% from 1995.
North Sea natural gas spot prices increased to $3.67/mcf in the second half of the year after averaging
$3.09/mcf in the first six months. Overall, North Sea gas prices declined 7% in 1996.
Canada1996 1995 1994
Oil and liquids ($/bbl)Sales price 23.95 20.58 18.62Royalties (6.01) (4.51) (4.07)Operating costs (3.01) (3.06) (3.49)
Netback 14.93 13.01 11.06
Natural gas ($/mcf)Sales price 1.71 1.37 1.89Royalties (0.19) (0.18) (0.36)Operating costs (0.41) (0.37) (0.35)
Netback 1.11 0.82 1.18
Netbacks include hedging activities, but do not include synthetic oil or pipeline operations.
Oil and liquids royalty rates increased to 25.1% in 1996 (1995 – 21.9%; 1994 – 21.9%) as a result of improved prices
and the expiry of royalty holidays on a number of Saskatchewan properties. Natural gas royalties declined to 11.1% in
1996 (1995 – 13.1%; 1994 – 19.0%). Beginning in the second quarter of 1996, the Alberta government reduced the
effective royalty rate on natural gas to compensate producers for royalties overcharged in prior periods. An adjustment
to 1996 and 1995 gas cost allowances was recorded in the fourth quarter and further reduced 1996 gas royalties.
These reductions more than offset increases attributable to higher natural gas prices in 1996. Alberta Crown gas
royalties for the past three years remain estimates pending receipt of final invoices from the Alberta government.
Canadian unit operating costs increased to $3.63/boe in 1996 (1995 – $3.44/boe; 1994 – $3.50/boe). Natural
gas unit operating costs rose as a result of increased third-party processing fees, and the combination of lower
TA L IS M A N E N E R G Y I N C .
94 95 96
496
650 647
NaturalGas DailyProductionVolumes(mmcf/d)
North Sea
Canada
Brought to you by Global Reports
33
volumes and relatively fixed operating costs. Talisman continues to reduce oil and liquids unit operating expenses
by adding low-cost, Company-operated production. Talisman’s operated lifting costs are significantly lower than
those on its non-operated properties.
Revenues from Talisman’s share of Syncrude increased 23% over the prior year as a result of increased prices.
Production and operating costs were relatively unchanged from the prior year.
North Sea1996 1995 1994
Oil and liquids ($/bbl)Sales price 27.31 23.18 22.09Royalties (1.23) (0.17) (0.30)Operating costs (6.50) (5.63) (1) (6.59)
Netback 19.58 17.38 15.20
Natural gas ($/mcf)Sales price 3.37 3.63 3.78Royalties (0.15) (0.04) (0.05)Operating costs (0.76) (0.96) (1) (1.10)
Netback 2.46 2.63 2.63
(1) 1995 operating costs are restated to reflect intracompany transactions.Netbacks include hedging activities, but do not include pipeline operations.
A majority of Talisman’s 1996 North Sea oil and liquids production was marketed to The British Petroleum
Company plc; however, a significant portion of Talisman’s 1997 production will be marketed to a variety
of purchasers.
Royalty rates increased in 1996 as a result of the addition of Goal properties which are subject to United
Kingdom (“UK”) royalties.
Unit operating expenses increased to $5.89/boe in 1996 (1995 – $5.67/boe; 1994 – $6.59/boe), reflecting higher
operating costs associated with Goal properties. Unit operating expenses are expected to increase in 1997 as a
result of additional production from the Beatrice, Buchan and Clyde fields.
Indonesia1996 1995 1994
Oil and liquids ($/bbl)Sales price 27.22 23.76 22.40Royalties (8.06) (5.66) (5.22)Operating costs (6.17) (6.90) (6.97)
Netback 12.99 11.20 10.21
Netbacks include hedging activities.
All of Talisman’s Indonesian production is sold directly to the Indonesian national oil company, Pertamina, at
prices referenced to world crude oil markets.
Royalties include Pertamina’s share of profit oil from all producing areas and oil committed to the domestic
market at reduced prices pursuant to contract terms. Talisman accounts for Indonesian royalties based on rates in
effect at the time of production. Rates will increase significantly when Talisman’s cost recovery pools are
TA L IS M A N E N E R G Y I N C .
Brought to you by Global Reports
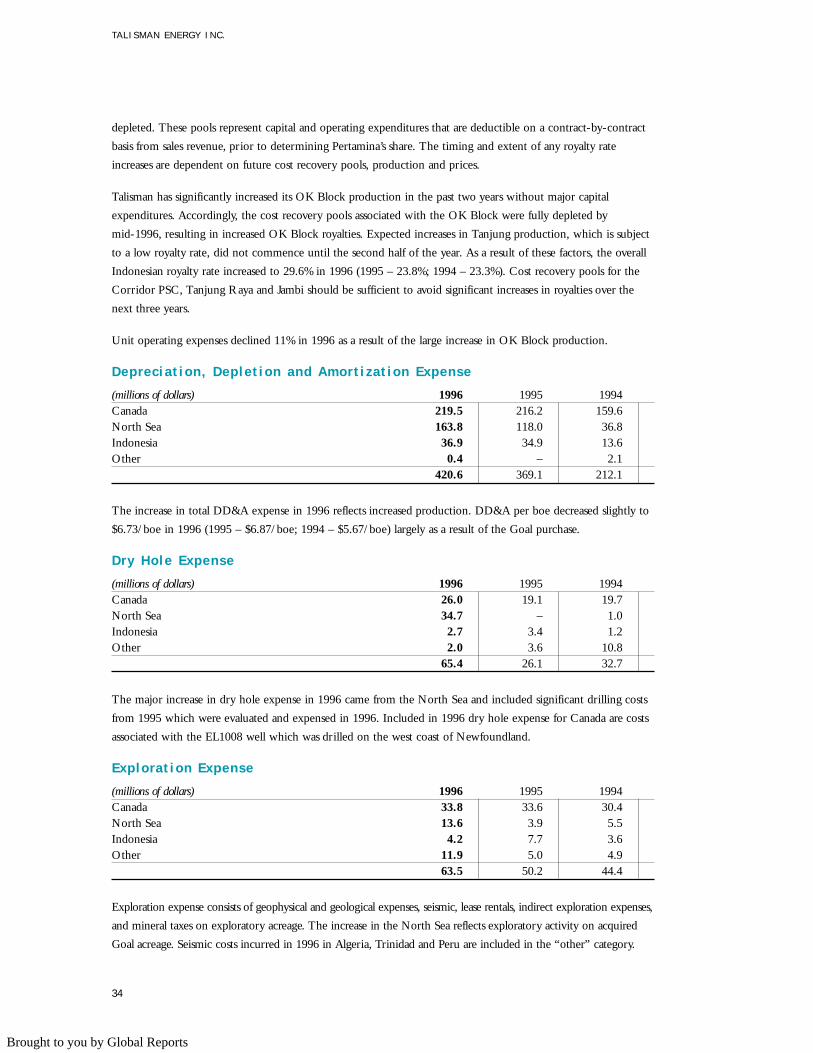
34
depleted. These pools represent capital and operating expenditures that are deductible on a contract-by-contract
basis from sales revenue, prior to determining Pertamina’s share. The timing and extent of any royalty rate
increases are dependent on future cost recovery pools, production and prices.
Talisman has significantly increased its OK Block production in the past two years without major capital
expenditures. Accordingly, the cost recovery pools associated with the OK Block were fully depleted by
mid-1996, resulting in increased OK Block royalties. Expected increases in Tanjung production, which is subject
to a low royalty rate, did not commence until the second half of the year. As a result of these factors, the overall
Indonesian royalty rate increased to 29.6% in 1996 (1995 – 23.8%; 1994 – 23.3%). Cost recovery pools for the
Corridor PSC, Tanjung Raya and Jambi should be sufficient to avoid significant increases in royalties over the
next three years.
Unit operating expenses declined 11% in 1996 as a result of the large increase in OK Block production.
Depreciat ion, Deplet ion and Amort izat ion Expense
(millions of dollars) 1996 1995 1994Canada 219.5 216.2 159.6North Sea 163.8 118.0 36.8Indonesia 36.9 34.9 13.6Other 0.4 – 2.1
420.6 369.1 212.1
The increase in total DD&A expense in 1996 reflects increased production. DD&A per boe decreased slightly to
$6.73/boe in 1996 (1995 – $6.87/boe; 1994 – $5.67/boe) largely as a result of the Goal purchase.
Dry Hole Expense
(millions of dollars) 1996 1995 1994Canada 26.0 19.1 19.7North Sea 34.7 – 1.0Indonesia 2.7 3.4 1.2Other 2.0 3.6 10.8
65.4 26.1 32.7
The major increase in dry hole expense in 1996 came from the North Sea and included significant drilling costs
from 1995 which were evaluated and expensed in 1996. Included in 1996 dry hole expense for Canada are costs
associated with the EL1008 well which was drilled on the west coast of Newfoundland.
Explorat ion Expense
(millions of dollars) 1996 1995 1994Canada 33.8 33.6 30.4North Sea 13.6 3.9 5.5Indonesia 4.2 7.7 3.6Other 11.9 5.0 4.9
63.5 50.2 44.4
Exploration expense consists of geophysical and geological expenses, seismic, lease rentals, indirect exploration expenses,
and mineral taxes on exploratory acreage. The increase in the North Sea reflects exploratory activity on acquired
Goal acreage. Seismic costs incurred in 1996 in Algeria, Trinidad and Peru are included in the “other” category.
TA L IS M A N E N E R G Y I N C .
Brought to you by Global Reports
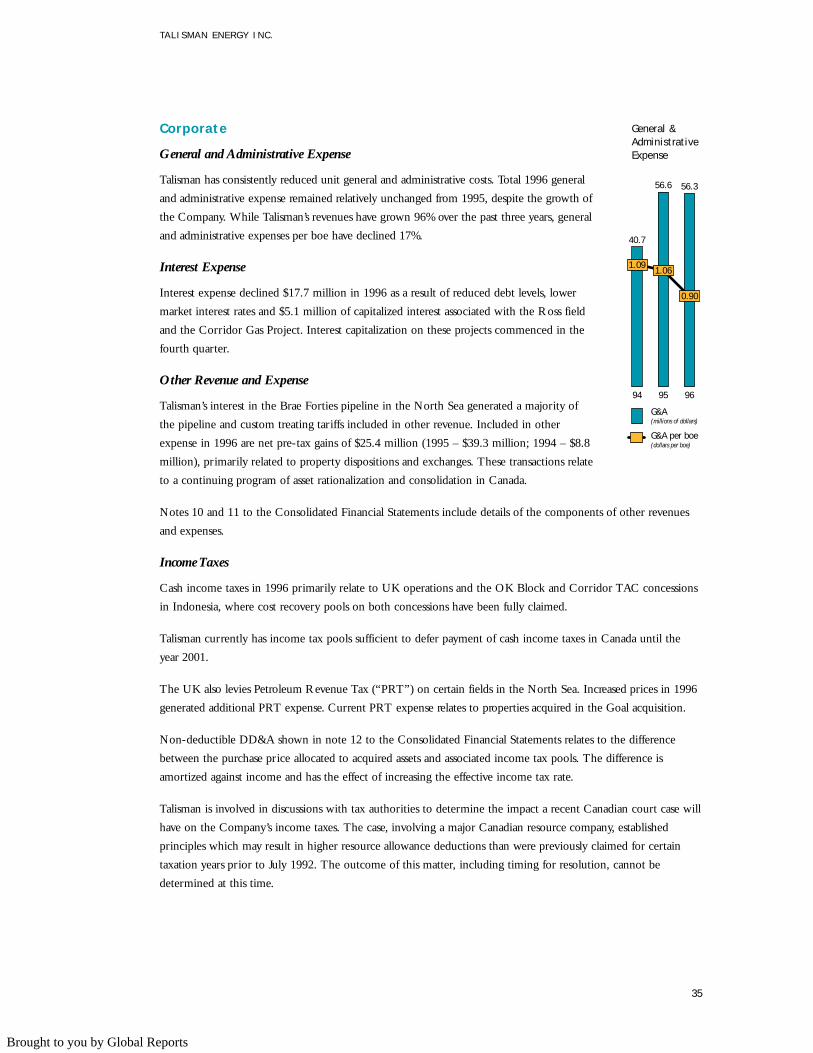
35
Corporate
General and Administrative Expense
Talisman has consistently reduced unit general and administrative costs. Total 1996 general
and administrative expense remained relatively unchanged from 1995, despite the growth of
the Company. While Talisman’s revenues have grown 96% over the past three years, general
and administrative expenses per boe have declined 17%.
Interest Expense
Interest expense declined $17.7 million in 1996 as a result of reduced debt levels, lower
market interest rates and $5.1 million of capitalized interest associated with the Ross field
and the Corridor Gas Project. Interest capitalization on these projects commenced in the
fourth quarter.
Other Revenue and Expense
Talisman’s interest in the Brae Forties pipeline in the North Sea generated a majority of
the pipeline and custom treating tariffs included in other revenue. Included in other
expense in 1996 are net pre-tax gains of $25.4 million (1995 – $39.3 million; 1994 – $8.8
million), primarily related to property dispositions and exchanges. These transactions relate
to a continuing program of asset rationalization and consolidation in Canada.
Notes 10 and 11 to the Consolidated Financial Statements include details of the components of other revenues
and expenses.
Income Taxes
Cash income taxes in 1996 primarily relate to UK operations and the OK Block and Corridor TAC concessions
in Indonesia, where cost recovery pools on both concessions have been fully claimed.
Talisman currently has income tax pools sufficient to defer payment of cash income taxes in Canada until the
year 2001.
The UK also levies Petroleum Revenue Tax (“PRT”) on certain fields in the North Sea. Increased prices in 1996
generated additional PRT expense. Current PRT expense relates to properties acquired in the Goal acquisition.
Non-deductible DD&A shown in note 12 to the Consolidated Financial Statements relates to the difference
between the purchase price allocated to acquired assets and associated income tax pools. The difference is
amortized against income and has the effect of increasing the effective income tax rate.
Talisman is involved in discussions with tax authorities to determine the impact a recent Canadian court case will
have on the Company’s income taxes. The case, involving a major Canadian resource company, established
principles which may result in higher resource allowance deductions than were previously claimed for certain
taxation years prior to July 1992. The outcome of this matter, including timing for resolution, cannot be
determined at this time.
TA L IS M A N E N E R G Y I N C .
94
G&A(millions of dollars)
95 96
40.7
56.6 56.3
G&A per boe(dollars per boe)
General &AdministrativeExpense
1.091.06
0.90
Brought to you by Global Reports
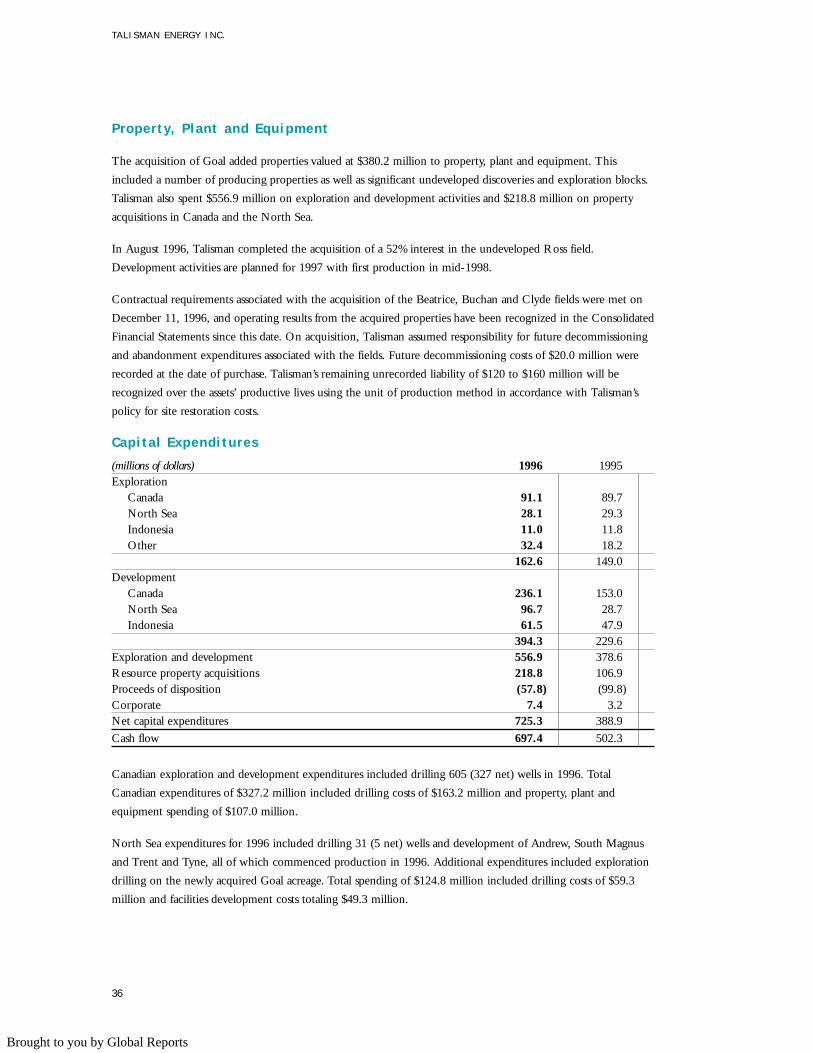
36
Property, P lant and Equipment
The acquisition of Goal added properties valued at $380.2 million to property, plant and equipment. This
included a number of producing properties as well as significant undeveloped discoveries and exploration blocks.
Talisman also spent $556.9 million on exploration and development activities and $218.8 million on property
acquisitions in Canada and the North Sea.
In August 1996, Talisman completed the acquisition of a 52% interest in the undeveloped Ross field.
Development activities are planned for 1997 with first production in mid-1998.
Contractual requirements associated with the acquisition of the Beatrice, Buchan and Clyde fields were met on
December 11, 1996, and operating results from the acquired properties have been recognized in the Consolidated
Financial Statements since this date. On acquisition, Talisman assumed responsibility for future decommissioning
and abandonment expenditures associated with the fields. Future decommissioning costs of $20.0 million were
recorded at the date of purchase. Talisman’s remaining unrecorded liability of $120 to $160 million will be
recognized over the assets’ productive lives using the unit of production method in accordance with Talisman’s
policy for site restoration costs.
Capita l Expenditures
(millions of dollars) 1996 1995Exploration
Canada 91.1 89.7North Sea 28.1 29.3Indonesia 11.0 11.8Other 32.4 18.2
162.6 149.0Development
Canada 236.1 153.0North Sea 96.7 28.7Indonesia 61.5 47.9
394.3 229.6Exploration and development 556.9 378.6Resource property acquisitions 218.8 106.9Proceeds of disposition (57.8) (99.8)Corporate 7.4 3.2Net capital expenditures 725.3 388.9
Cash flow 697.4 502.3
Canadian exploration and development expenditures included drilling 605 (327 net) wells in 1996. Total
Canadian expenditures of $327.2 million included drilling costs of $163.2 million and property, plant and
equipment spending of $107.0 million.
North Sea expenditures for 1996 included drilling 31 (5 net) wells and development of Andrew, South Magnus
and Trent and Tyne, all of which commenced production in 1996. Additional expenditures included exploration
drilling on the newly acquired Goal acreage. Total spending of $124.8 million included drilling costs of $59.3
million and facilities development costs totaling $49.3 million.
TA L IS M A N E N E R G Y I N C .
Brought to you by Global Reports

37
Increased Indonesian expenditures reflect $29.7 million spent on the Corridor Gas Project and continued
exploration drilling in the Corridor area. Funds were also spent on additional drilling at the OK Block and
development expenditures at Tanjung. In total, Talisman drilled 29 (16 net) wells in Indonesia in 1996.
Included in other exploration costs in 1996 was $14.5 million to drill three wells in Algeria.
Resource property acquisitions included North Sea acquisitions and Canadian asset rationalization activities.
Dispositions relate to Canadian asset rationalization activity.
Note 5 to the Consolidated Financial Statements identifies capital which was not subject to DD&A at
December 31, 1996, including significant acquired probable reserve costs. Acquired probable reserve costs for the
North Sea increased as a result of Goal, Ross and Buchan. Talisman received an extensive inventory of properties
with probable reserves in the Goal acquisition which the Company plans to evaluate over the next three years.
Value assigned to the Ross field will be transferred to development costs when project sanction is received and
proved reserves are booked — anticipated to occur in mid-1997. Development expenditures will be depleted
once commercial production commences in mid-1998. Reduced Indonesian probable reserve costs reflect the
transfer of Corridor Gas Project reserves from the probable to proved category.
Liquidity and Capita l Resources
Debt and Equity
Record cash flow and the proceeds from an equity issue exceeded Talisman’s 1996 capital requirements and
resulted in a reduction of long term debt at year-end. Talisman’s debt to cash flow ratio of 1.3:1 at December 31,
1996, met the Company’s standard of less than 2:1. Talisman’s debt to debt-plus-equity ratio improved to 30% at
December 31, 1996, from 36% at the end of 1995.
The acquisition of Goal in January 1996 was partially financed by a new $250 million unsecured interim bank
credit facility. On acquisition, Talisman also assumed Goal’s outstanding debt of $57 million which was
refinanced in March from a new US$150 million unsecured revolving term credit facility.
On May 30, 1996, Talisman issued 12 million common shares at a price of $31.00 per share. Proceeds, net of
related issue costs, were $357 million. Net proceeds were initially applied against long term debt, including the
June 10 redemption of the $100 million 8.5% convertible subordinated debentures and repayment of the $250
million Goal acquisition facility.
In December 1996, the Company replaced the US$150 million facility and its $300 million and $400 million
facilities with new unsecured revolving term credit facilities totaling $800 million.
The commercial paper market continues to offer the lowest cost source of funds to the Company. Accordingly,
Talisman expanded the maximum amount of its commercial paper program in 1996 from $350 million to $450
million while maintaining its debt ratings. The Company’s revolving credit facilities backstop the commercial
paper program.
Maturities of Talisman’s debt portfolio are spread over a number of years to mitigate refinancing risk and
maximize operational flexibility.
The Corridor Gas Project will be partially funded by a US$450 million (US$180 million net to Talisman) project
loan facility which was finalized in February 1997. The project sponsors, Talisman and Gulf Canada Resources
TA L IS M A N E N E R G Y I N C .
Brought to you by Global Reports
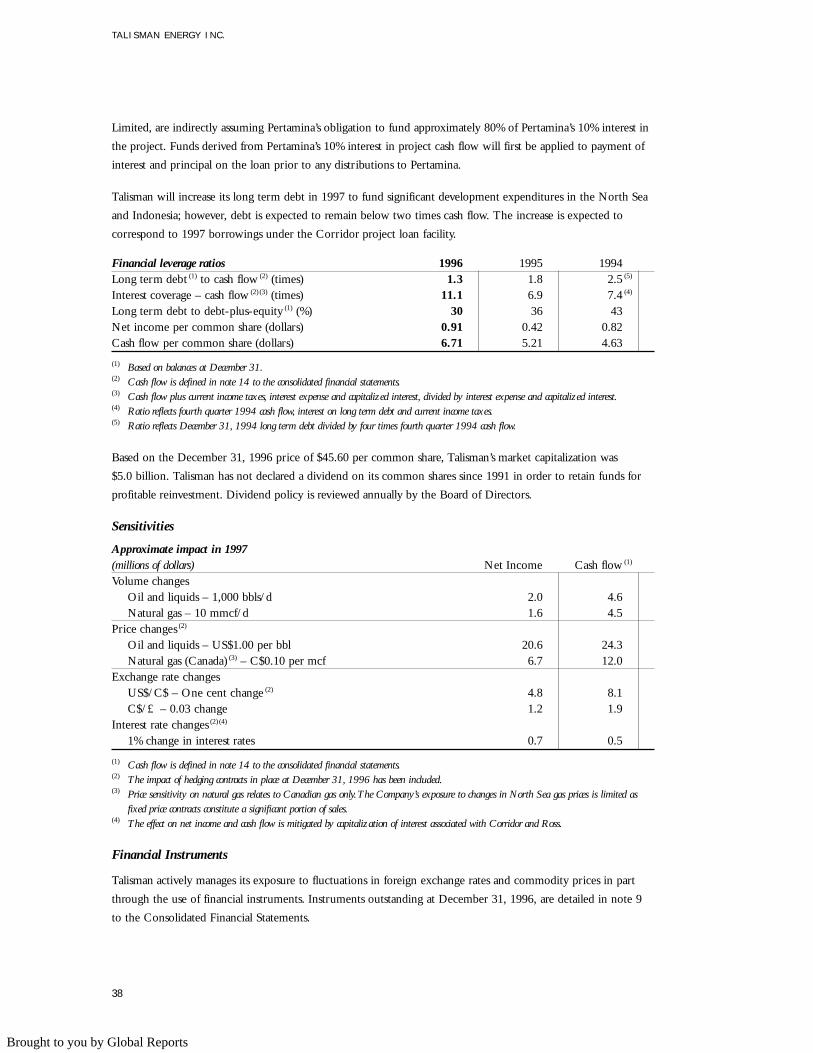
38
Limited, are indirectly assuming Pertamina’s obligation to fund approximately 80% of Pertamina’s 10% interest in
the project. Funds derived from Pertamina’s 10% interest in project cash flow will first be applied to payment of
interest and principal on the loan prior to any distributions to Pertamina.
Talisman will increase its long term debt in 1997 to fund significant development expenditures in the North Sea
and Indonesia; however, debt is expected to remain below two times cash flow. The increase is expected to
correspond to 1997 borrowings under the Corridor project loan facility.
Financial leverage ratios 1996 1995 1994Long term debt (1) to cash flow (2) (times) 1.3 1.8 2.5 (5)
Interest coverage – cash flow (2) (3) (times) 11.1 6.9 7.4 (4)
Long term debt to debt-plus-equity (1) (%) 30 36 43Net income per common share (dollars) 0.91 0.42 0.82Cash flow per common share (dollars) 6.71 5.21 4.63
(1) Based on balances at December 31.(2) Cash flow is defined in note 14 to the consolidated financial statements.(3) Cash flow plus current income taxes, interest expense and capitalized interest, divided by interest expense and capitalized interest.(4) Ratio reflects fourth quarter 1994 cash flow, interest on long term debt and current income taxes.(5) Ratio reflects December 31, 1994 long term debt divided by four times fourth quarter 1994 cash flow.
Based on the December 31, 1996 price of $45.60 per common share, Talisman’s market capitalization was
$5.0 billion. Talisman has not declared a dividend on its common shares since 1991 in order to retain funds for
profitable reinvestment. Dividend policy is reviewed annually by the Board of Directors.
Sensitivities
Approximate impact in 1997(millions of dollars) Net Income Cash flow (1)
Volume changesOil and liquids – 1,000 bbls/d 2.0 4.6Natural gas – 10 mmcf/d 1.6 4.5
Price changes (2)
Oil and liquids – US$1.00 per bbl 20.6 24.3Natural gas (Canada) (3) – C$0.10 per mcf 6.7 12.0
Exchange rate changesUS$/C$ – One cent change (2) 4.8 8.1C$/£ – 0.03 change 1.2 1.9
Interest rate changes (2) (4)
1% change in interest rates 0.7 0.5
(1) Cash flow is defined in note 14 to the consolidated financial statements.(2) The impact of hedging contracts in place at December 31, 1996 has been included.(3) Price sensitivity on natural gas relates to Canadian gas only.The Company’s exposure to changes in North Sea gas prices is limited as
fixed price contracts constitute a significant portion of sales.(4) The effect on net income and cash flow is mitigated by capitalization of interest associated with Corridor and Ross.
Financial Instruments
Talisman actively manages its exposure to fluctuations in foreign exchange rates and commodity prices in part
through the use of financial instruments. Instruments outstanding at December 31, 1996, are detailed in note 9
to the Consolidated Financial Statements.
TA L IS M A N E N E R G Y I N C .
Brought to you by Global Reports
In addition to limits established by the Board of Directors, Talisman maintains a system of internal controls to
minimize risks associated with its derivatives program and credit risk associated with derivatives counterparties.
The Company’s derivatives program is reviewed at each Board of Directors’ meeting.
Talisman’s gross revenues benefit from a weak Canadian dollar relative to the US dollar, as a significant
proportion of the Company’s revenues are effectively denominated in US dollars. In anticipation of a
strengthening Canadian dollar in 1997 and future years, Talisman entered into forward foreign exchange contracts
to fix the exchange rate on a portion of future revenues. In 1996, Talisman realized a net gain of $2.9 million
(1995 – $3.6 million) from its foreign exchange hedging program.
Talisman’s gross revenues fluctuate significantly with changes in commodity prices. Accordingly, Talisman has
entered into a number of contracts to hedge against significant price declines. Strong commodity prices in
1996 increased cash flow and pre-tax earnings for the Company by $188.0 million, net of a $19.5 million loss
(1995 – gain of $4.7 million) from commodity price hedging activities.
In addition to financial contracts, the Company uses physical contracts to manage prices received and mitigate risk.
Risks and Uncertaint ies
Talisman is exposed to operational risks inherent in exploring for, developing and producing crude oil and
natural gas. A comprehensive insurance program is maintained to mitigate risks and to protect against significant
losses, while maintaining certain acceptable levels of risk within the Company. Liability and property insurance is
considered adequate and consistent with common industry practice. Talisman also maintains comprehensive
programs and contingency plans necessary to control health, safety and environmental risks across its operations
which comply with existing legislative and regulatory requirements. Regular audits of operations ensure
compliance with applicable regulations and standards. Compliance with health, safety and environmental
standards are reviewed at each Board of Directors’ meeting. Long term abandonment and restoration provisions
have been recorded in accordance with accounting principles generally accepted in Canada.
The Company is exposed to risks and uncertainties inherent in conducting international operations. Canada, the
UK, the Netherlands and Indonesia offer stable fiscal regimes and well-developed business environments for the
petroleum industry. Certain of the Company’s non-core areas are potentially subject to political instability;
however, the Company’s investment in these areas is not material.
Outlook
The major factors affecting Talisman are production volumes and commodity prices.
Talisman expects 1997 volume growth comparable to the 16% realized in 1996. The main contributor to growth
in 1997 will be a full year of production from Talisman’s operated Beatrice, Buchan and Clyde fields in the
North Sea, augmented by higher oil and liquids volumes in Canada and Indonesia.
Production in 1998 is expected to increase from known projects such as the Ross oil field development and
Corridor Gas Project start up.
39
TA L IS M A N E N E R G Y I N C .
Brought to you by Global Reports
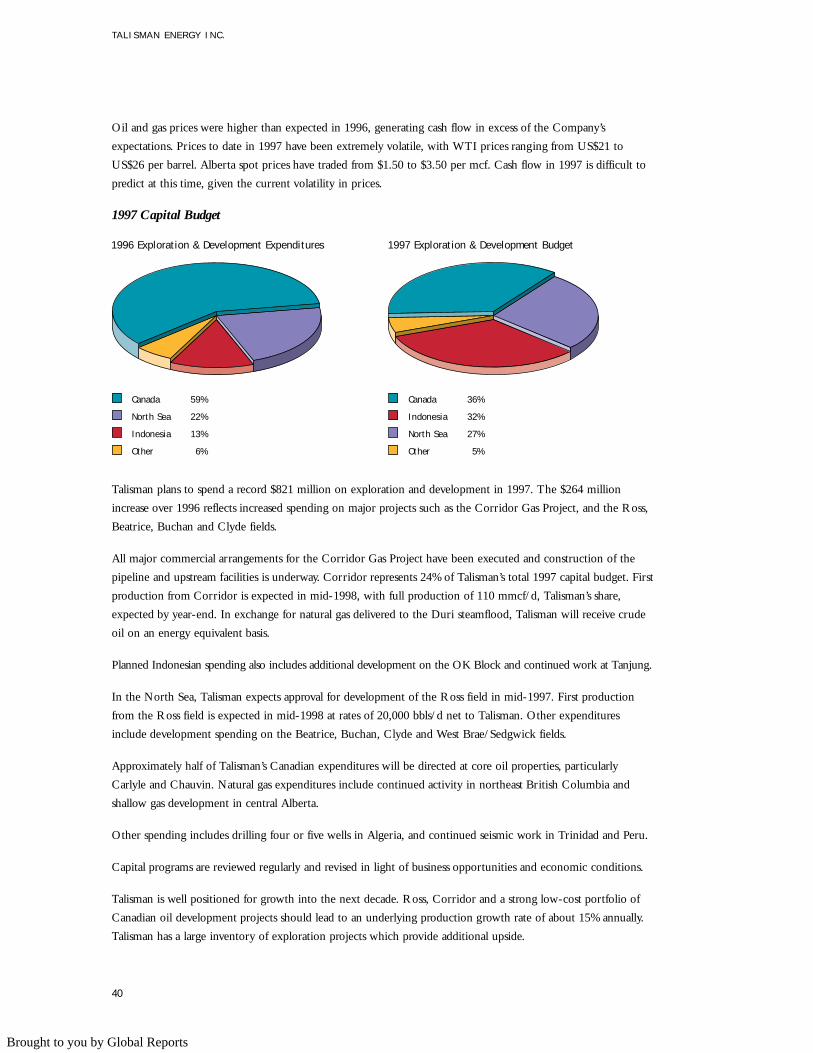
Oil and gas prices were higher than expected in 1996, generating cash flow in excess of the Company’s
expectations. Prices to date in 1997 have been extremely volatile, with WTI prices ranging from US$21 to
US$26 per barrel. Alberta spot prices have traded from $1.50 to $3.50 per mcf. Cash flow in 1997 is difficult to
predict at this time, given the current volatility in prices.
1997 Capital Budget
Talisman plans to spend a record $821 million on exploration and development in 1997. The $264 million
increase over 1996 reflects increased spending on major projects such as the Corridor Gas Project, and the Ross,
Beatrice, Buchan and Clyde fields.
All major commercial arrangements for the Corridor Gas Project have been executed and construction of the
pipeline and upstream facilities is underway. Corridor represents 24% of Talisman’s total 1997 capital budget. First
production from Corridor is expected in mid-1998, with full production of 110 mmcf/d, Talisman’s share,
expected by year-end. In exchange for natural gas delivered to the Duri steamflood, Talisman will receive crude
oil on an energy equivalent basis.
Planned Indonesian spending also includes additional development on the OK Block and continued work at Tanjung.
In the North Sea, Talisman expects approval for development of the Ross field in mid-1997. First production
from the Ross field is expected in mid-1998 at rates of 20,000 bbls/d net to Talisman. Other expenditures
include development spending on the Beatrice, Buchan, Clyde and West Brae/Sedgwick fields.
Approximately half of Talisman’s Canadian expenditures will be directed at core oil properties, particularly
Carlyle and Chauvin. Natural gas expenditures include continued activity in northeast British Columbia and
shallow gas development in central Alberta.
Other spending includes drilling four or five wells in Algeria, and continued seismic work in Trinidad and Peru.
Capital programs are reviewed regularly and revised in light of business opportunities and economic conditions.
Talisman is well positioned for growth into the next decade. Ross, Corridor and a strong low-cost portfolio of
Canadian oil development projects should lead to an underlying production growth rate of about 15% annually.
Talisman has a large inventory of exploration projects which provide additional upside.
1996 Exploration & Development Expenditures
Canada
North Sea
Indonesia
Other
59%
22%
13%
6%
Canada
Other
36%
North Sea 27%
Indonesia 32%
5%
1997 Exploration & Development Budget
40
TA L IS M A N E N E R G Y I N C .
Brought to you by Global Reports

TA L IS M A N E N E R G Y I N C .
C O R P O R AT E G O V E R N A N C E
TALISMAN ’S APPROACH TO CORPORATE GOVERNANCE ALI GNS CLOSELY WITH THE GUIDELINES SET OUT IN THE
DECEMBER , 1994 REPORT OF THE TORONTO STOCK EX CHANGE COMMITTEE ON CORPORATE GOVERNANCE IN CANADA.
Composit ion o f the Board o f Directors
The Board of the Company is composed of nine directors. Eight directors, including the Chairman of the Board,
are independent of management and are otherwise unrelated, that is, free from any interests that could interfere
with their ability to act in the best interest of the Company. The President and Chief Executive Officer is the
only member of the Company’s management who is a director. The Company has no principal shareholder;
accordingly, no director is a representative of any particular shareholder or shareholder group.
The Chairman of the Board is specifically charged with responsibility for leading and managing the Board in
discharging its responsibilities and acts as the Board’s spokesman to management. The composition of the Board,
including the independence of the Chairman and his specified role, ensures that the Board is able to function
independently of management. The Board believes that it can operate effectively at its current size.
Responsibi l i t ies o f the Board o f Directors
The Board of Directors has explicitly assumed responsibility for the stewardship of the Company. As part of that
responsibility the Board ensures that: the Company has established long term goals and a strategic planning
process; the principal risks of the Company’s business are identified and appropriate systems are implemented to
manage those risks; there is sufficient succession planning to manage and monitor the management risk; the
Company has a communications policy; and the Company’s internal controls and management information
systems have sufficient integrity. The Board of Directors has plenary power over all matters not explicitly
delegated to a committee of the Board. In particular, it is responsible for approving the Company’s debt and
borrowing policy and its dividend policy, and it has established authorities regarding the Company’s hedging and
derivative activities. In addition, prior Board approval is required of all major debt financing agreements, the
annual capital expenditure plan, and all acquisitions, dispositions or expenditures exceeding specified limits. The
Board of Directors, together with the President and Chief Executive Officer, have developed mandates for the
Board embodying the foregoing, and for the President and Chief Executive Officer, indicating limits to
management’s authority. To assist Board members in performing their responsibilities, the Company has adopted
a policy whereby, with the approval of the Governance and Nominating Committee, a Board member may
engage an outside advisor at the Company’s expense.
Committees o f the Board
There are five committees of the Board: the Executive Committee, the Governance and Nominating
Committee, the Audit Committee, the Management Succession and Compensation Committee and the Pension
Funds Committee. The President and Chief Executive Officer is a member of the Executive Committee and the
Pension Funds Committee and is the only inside and related director on these committees. The Governance and
Nominating Committee, the Audit Committee and the Management Succession and Compensation Committee
are composed exclusively of outside directors. Each committee is composed of four Board members. With the
exception of the Executive Committee, for which there are no regularly scheduled meetings, the committees of
the Board convene in accordance with an annually developed schedule. Additional committee meetings are
convened as required throughout the year.
41
Brought to you by Global Reports

TA L IS M A N E N E R G Y I N C .
The Executive Committee is an extension of the full Board and convenes to take action where necessary and
where it is not practicable to call a meeting of the full Board.
The Governance and Nominating Committee, together with the Board, develops the Company’s approach to
corporate governance. The Committee, in consultation with the President and Chief Executive Officer, is
responsible for establishing a long term plan for the composition of the Board and for identifying new board
nominees when required. In determining appropriate nominees, the Committee considers the strengths, skills
and experience level of Board members and the Company’s strategic objectives. In addition, an orientation and
education program has been implemented to assist new Board recruits. The Committee reviews and determines
the compensation to be paid to Board members with a view to ensuring that the compensation reflects the
responsibilities and risks involved in being a Director. The Committee is also responsible for regularly assessing
the effectiveness of the Board as a whole, the committees of the Board and the contribution of each director.
The Audit Committee oversees the Company’s internal accounting and financial systems and its controls to
ensure that the Company maintains effective internal control systems and adequate processes for detecting risks
and control weaknesses. The Committee has direct access to the Company’s internal and external auditors and
meets separately with each group on a regular basis.
The Management Succession and Compensation Committee is responsible for reviewing succession plans for key
management positions within the Company. It also reviews management development and staffing plans,
compensation and benefit plans and, in conjunction with the Board, annual performance contracts of the
Company’s Chief Executive Officer and Vice-Presidents.
The Pension Funds Committee is responsible for approving the investment policy and strategy, and reviewing the
performance of the Company’s pension plans.
Management Performance
The terms of the mandate of the Board ensures that the Company annually confirms or redetermines its long
term strategy and strategic objectives and sets its budget and development plan for the ensuing year. This process
produces specific annual goals for the Company which are then further developed into specific contracts for each
of the officers of the Company based upon that officer’s role in the Company. Through this process, each officer
individually (including the President and Chief Executive Officer), and the officers as a whole, are made directly
responsible for achieving the annual goals of the Company. A significant portion of the annual compensation of
each officer is based upon achieving these Company and individual goals.
Shareholder Communicat ions
Talisman’s policy regarding shareholder communications specifically adopts the principles of timely, accurate and
efficient disclosure of information concerning the Company to all shareholders. In addition to the required
annual, quarterly and timely reporting of information, the Company regularly makes presentations to industry
analysts and investors. The Company also meets informally upon request with investors and analysts and its
Corporate Communications Department has the specific mandate of responding in a timely manner to all
inquiries received from shareholders, analysts and potential investors.
42
Brought to you by Global Reports
TA L IS M A N E N E R G Y I N C .
R E P O R T O F M A N AG E M E N T
T H E B O A R D O F D I R E C T O R S I S R E S P O N S I B L E F O R T H E C O N S O L I DAT E D F I N A N C I A L S TAT E M E N TS B U T H A S
D E L E GAT E D R E S P O N S I B I L I T Y F O R T H E I R P R E PA R AT IO N TO M A N A G E M E N T.
The Consolidated Financial Statements have been prepared by management in accordance with accounting
principles generally accepted in Canada. If alternative accounting methods exist, management has chosen those it
deems most appropriate in the circumstances. Financial statements are not precise since they include certain
amounts based on estimates and judgments. Management has ensured that the Consolidated Financial
Statements are presented fairly in all material respects. Management has also prepared the financial information
presented elsewhere in the annual report and ensured that it is consistent with information in the Consolidated
Financial Statements.
Talisman maintains internal accounting and administrative controls designed to provide reasonable assurance that
the financial information is relevant, reliable and accurate and that assets are appropriately accounted for and
adequately safeguarded.
The Board of Directors is responsible for reviewing and approving the Consolidated Financial Statements and
Management’s Discussion and Analysis and, primarily through its Audit Committee, ensures that management
fulfills its responsibilities for financial reporting.
The Audit Committee is appointed by the Board and is composed of Directors who are not employees of the
Company. The Audit Committee meets periodically with management, and with the internal and external
auditors, to discuss internal controls and reporting issues and to satisfy itself that each party is properly
discharging its responsibilities. It reviews the Consolidated Financial Statements and the external auditors’ report.
The Audit Committee also considers, for review by the Board and approval by the shareholders, the engagement
or re-appointment of the external auditors.
The Consolidated Financial Statements have been audited by Ernst & Young, the external auditors, in
accordance with generally accepted auditing standards, on behalf of the shareholders. Ernst & Young has full and
free access to the Audit Committee.
James W. Buckee Bruce G. Waterman
President and Chief Executive Officer Vice-President, Finance and Chief Financial Officer
February 12, 1997
43
“James W. Buckee” “Bruce G. Waterman”
Brought to you by Global Reports
TA L IS M A N E N E R G Y I N C .
A U D I TO R S ’ R E P O R T
TO T H E S H A R E H O L D E R S O F TA L I S M A N E N E R G Y I N C .
We have audited the Consolidated Balance Sheets of Talisman Energy Inc. as at December 31, 1996 and 1995
and the Consolidated Statements of Income and Retained Earnings and Cash Flows for each of the years in the
three year period ended December 31, 1996. These financial statements are the responsibility of the Company’s
management. Our responsibility is to express an opinion on these financial statements based on our audits.
We conducted our audits in accordance with generally accepted auditing standards. Those standards require that
we plan and perform an audit to obtain reasonable assurance whether the financial statements are free of material
misstatement. An audit includes examining, on a test basis, evidence supporting the amounts and disclosures in
the financial statements. An audit also includes assessing the accounting principles used and significant estimates
made by management, as well as evaluating the overall financial statement presentation.
In our opinion, these Consolidated Financial Statements present fairly, in all material respects, the financial
position of the Company as at December 31, 1996 and 1995 and the results of its operations and the changes in
its financial position for each of the years in the three year period ended December 31, 1996 in accordance with
accounting principles generally accepted in Canada.
Calgary, Canada
February 12, 1997 Chartered Accountants
44
“Ernst & Young”
Brought to you by Global Reports
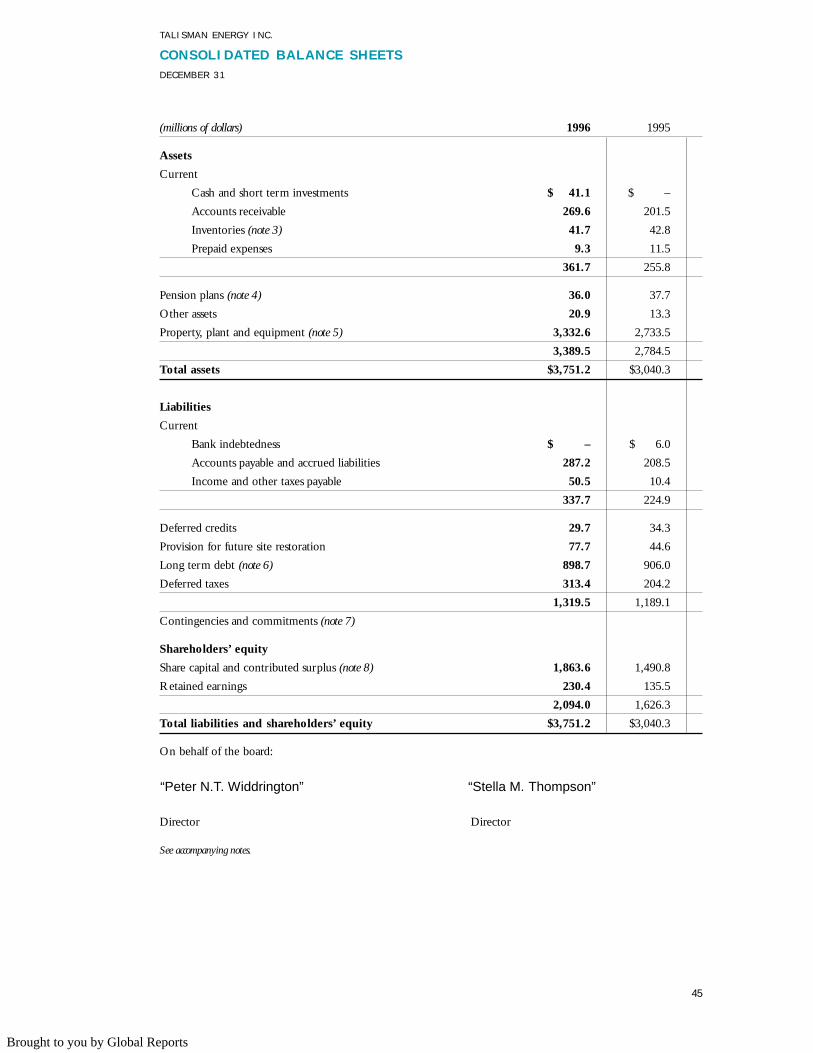
45
TA L IS M A N E N E R G Y I N C .
C O N S O L I DAT E D B A L A N C E S H E E T SD E C E M B E R 3 1
(millions of dollars) 1996 1995
Assets
Current
Cash and short term investments $ 41.1 $ –
Accounts receivable 269.6 201.5
Inventories (note 3) 41.7 42.8
Prepaid expenses 9.3 11.5
361.7 255.8
Pension plans (note 4) 36.0 37.7
Other assets 20.9 13.3
Property, plant and equipment (note 5) 3,332.6 2,733.5
3,389.5 2,784.5
Total assets $3,751.2 $3,040.3
Liabilities
Current
Bank indebtedness $ – $ 6.0
Accounts payable and accrued liabilities 287.2 208.5
Income and other taxes payable 50.5 10.4
337.7 224.9
Deferred credits 29.7 34.3
Provision for future site restoration 77.7 44.6
Long term debt (note 6) 898.7 906.0
Deferred taxes 313.4 204.2
1,319.5 1,189.1
Contingencies and commitments (note 7)
Shareholders’ equity
Share capital and contributed surplus (note 8) 1,863.6 1,490.8
Retained earnings 230.4 135.5
2,094.0 1,626.3
Total liabilities and shareholders’ equity $3,751.2 $3,040.3
On behalf of the board:
Director Director
See accompanying notes.
“Peter N.T. Widdrington” “Stella M. Thompson”
Brought to you by Global Reports
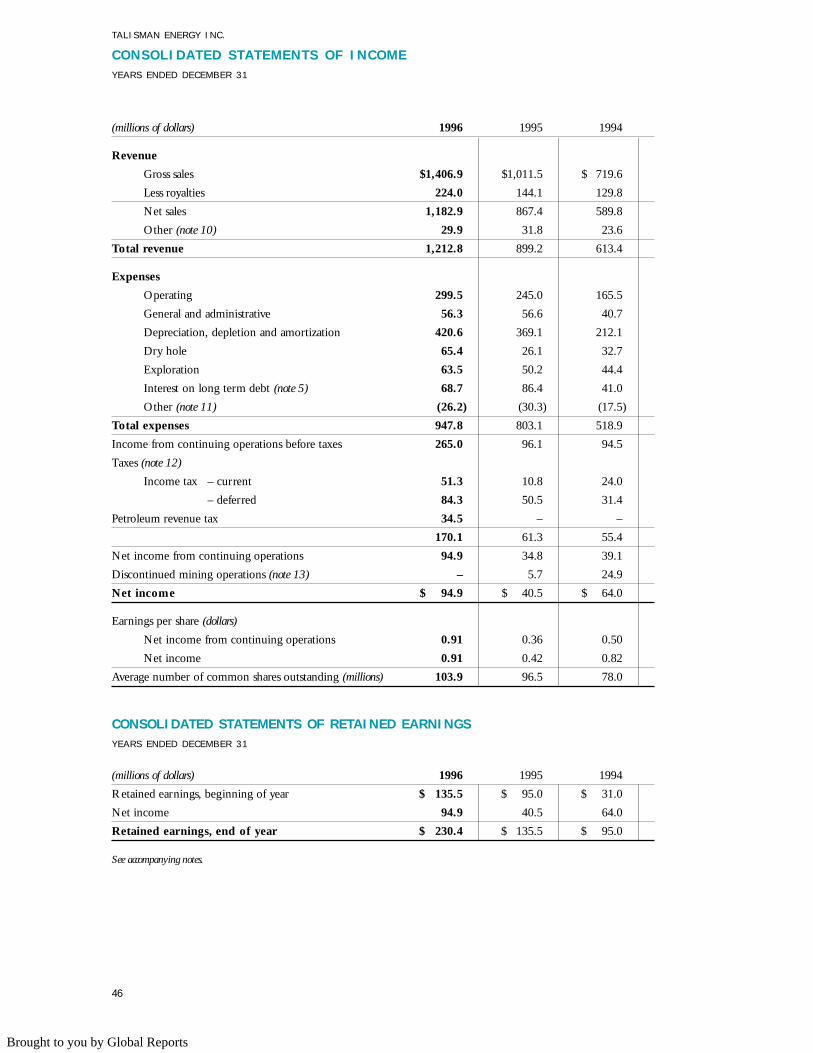
46
TA L IS M A N E N E R G Y I N C .
C O N S O L I DAT E D S TAT E M E N T S O F I N C O M EY E A R S E N D E D D E C E M B E R 3 1
(millions of dollars) 1996 1995 1994
Revenue
Gross sales $1,406.9 $1,011.5 $ 719.6
Less royalties 224.0 144.1 129.8
Net sales 1,182.9 867.4 589.8
Other (note 10) 29.9 31.8 23.6
Total revenue 1,212.8 899.2 613.4
Expenses
Operating 299.5 245.0 165.5
General and administrative 56.3 56.6 40.7
Depreciation, depletion and amortization 420.6 369.1 212.1
Dry hole 65.4 26.1 32.7
Exploration 63.5 50.2 44.4
Interest on long term debt (note 5) 68.7 86.4 41.0
Other (note 11) (26.2) (30.3) (17.5)
Total expenses 947.8 803.1 518.9
Income from continuing operations before taxes 265.0 96.1 94.5
Taxes (note 12)
Income tax – current 51.3 10.8 24.0
– deferred 84.3 50.5 31.4
Petroleum revenue tax 34.5 – –
170.1 61.3 55.4
Net income from continuing operations 94.9 34.8 39.1
Discontinued mining operations (note 13) – 5.7 24.9
Net income $ 94.9 $ 40.5 $ 64.0
Earnings per share (dollars)
Net income from continuing operations 0.91 0.36 0.50
Net income 0.91 0.42 0.82
Average number of common shares outstanding (millions) 103.9 96.5 78.0
CONSOLIDATED STATEMENTS OF RETAINED EARNINGSY E A R S E N D E D D E C E M B E R 3 1
(millions of dollars) 1996 1995 1994
Retained earnings, beginning of year $ 135.5 $ 95.0 $ 31.0
Net income 94.9 40.5 64.0
Retained earnings, end of year $ 230.4 $ 135.5 $ 95.0
See accompanying notes.
Brought to you by Global Reports
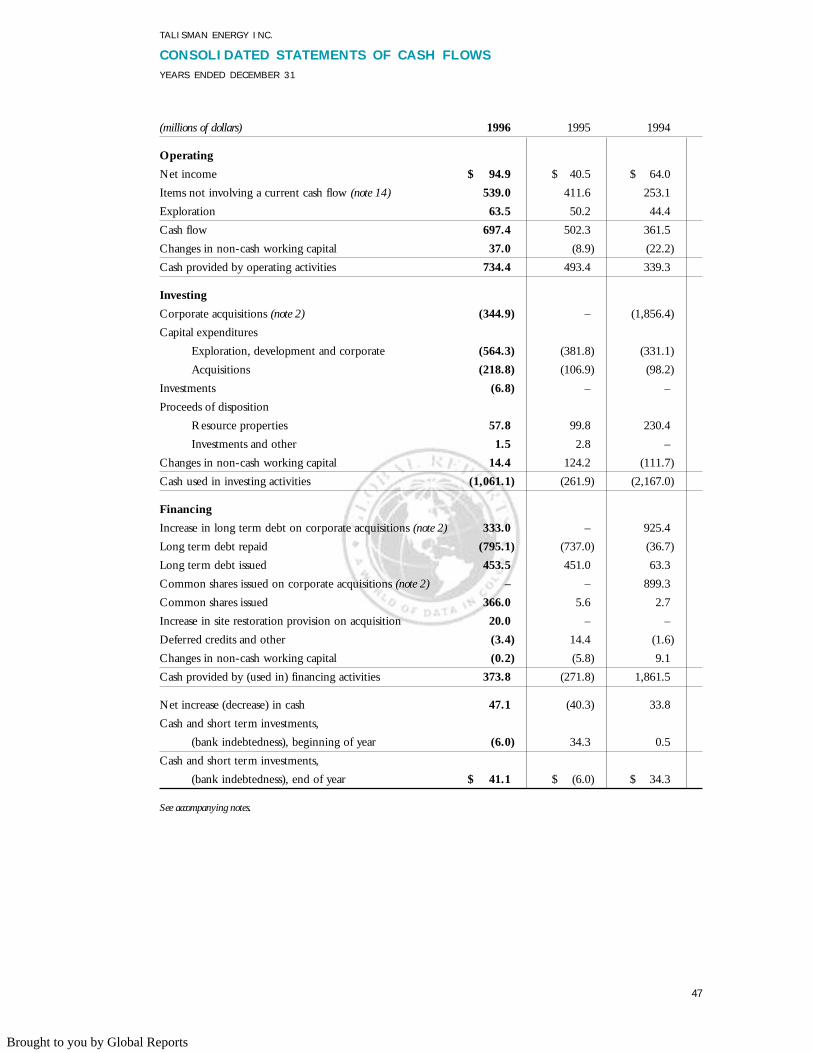
TA L IS M A N E N E R G Y I N C .
C O N S O L I DAT E D S TAT E M E N T S O F C A S H F L OW SY E A R S E N D E D D E C E M B E R 3 1
(millions of dollars) 1996 1995 1994
Operating
Net income $ 94.9 $ 40.5 $ 64.0
Items not involving a current cash flow (note 14) 539.0 411.6 253.1
Exploration 63.5 50.2 44.4
Cash flow 697.4 502.3 361.5
Changes in non-cash working capital 37.0 (8.9) (22.2)
Cash provided by operating activities 734.4 493.4 339.3
Investing
Corporate acquisitions (note 2) (344.9) – (1,856.4)
Capital expenditures
Exploration, development and corporate (564.3) (381.8) (331.1)
Acquisitions (218.8) (106.9) (98.2)
Investments (6.8) – –
Proceeds of disposition
Resource properties 57.8 99.8 230.4
Investments and other 1.5 2.8 –
Changes in non-cash working capital 14.4 124.2 (111.7)
Cash used in investing activities (1,061.1) (261.9) (2,167.0)
Financing
Increase in long term debt on corporate acquisitions (note 2) 333.0 – 925.4
Long term debt repaid (795.1) (737.0) (36.7)
Long term debt issued 453.5 451.0 63.3
Common shares issued on corporate acquisitions (note 2) – – 899.3
Common shares issued 366.0 5.6 2.7
Increase in site restoration provision on acquisition 20.0 – –
Deferred credits and other (3.4) 14.4 (1.6)
Changes in non-cash working capital (0.2) (5.8) 9.1
Cash provided by (used in) financing activities 373.8 (271.8) 1,861.5
Net increase (decrease) in cash 47.1 (40.3) 33.8
Cash and short term investments,
(bank indebtedness), beginning of year (6.0) 34.3 0.5
Cash and short term investments,
(bank indebtedness), end of year $ 41.1 $ (6.0) $ 34.3
See accompanying notes.
47
Brought to you by Global Reports
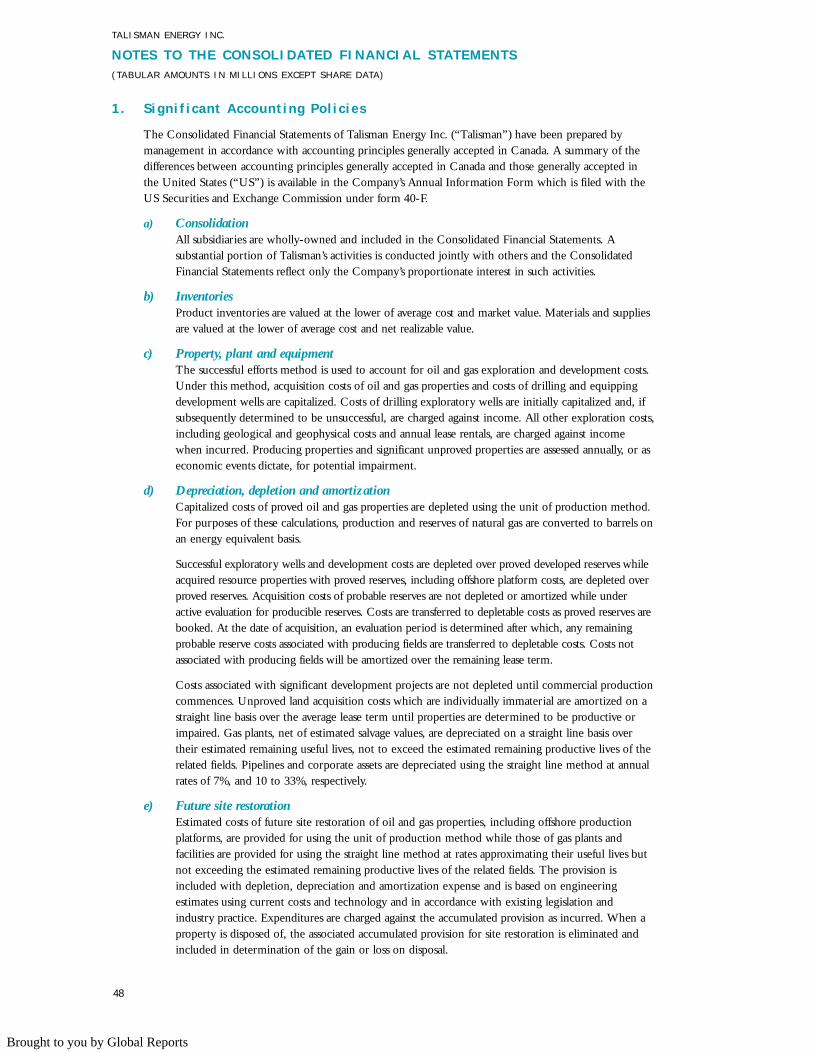
48
1. Signif icant Accounting Pol ic ies
The Consolidated Financial Statements of Talisman Energy Inc. (“Talisman”) have been prepared bymanagement in accordance with accounting principles generally accepted in Canada. A summary of thedifferences between accounting principles generally accepted in Canada and those generally accepted inthe United States (“US”) is available in the Company’s Annual Information Form which is filed with theUS Securities and Exchange Commission under form 40-F.
a) ConsolidationAll subsidiaries are wholly-owned and included in the Consolidated Financial Statements. Asubstantial portion of Talisman’s activities is conducted jointly with others and the ConsolidatedFinancial Statements reflect only the Company’s proportionate interest in such activities.
b) InventoriesProduct inventories are valued at the lower of average cost and market value. Materials and suppliesare valued at the lower of average cost and net realizable value.
c) Property, plant and equipmentThe successful efforts method is used to account for oil and gas exploration and development costs.Under this method, acquisition costs of oil and gas properties and costs of drilling and equippingdevelopment wells are capitalized. Costs of drilling exploratory wells are initially capitalized and, ifsubsequently determined to be unsuccessful, are charged against income. All other exploration costs,including geological and geophysical costs and annual lease rentals, are charged against incomewhen incurred. Producing properties and significant unproved properties are assessed annually, or aseconomic events dictate, for potential impairment.
d) Depreciation, depletion and amortizationCapitalized costs of proved oil and gas properties are depleted using the unit of production method.For purposes of these calculations, production and reserves of natural gas are converted to barrels onan energy equivalent basis.
Successful exploratory wells and development costs are depleted over proved developed reserves whileacquired resource properties with proved reserves, including offshore platform costs, are depleted overproved reserves. Acquisition costs of probable reserves are not depleted or amortized while underactive evaluation for producible reserves. Costs are transferred to depletable costs as proved reserves arebooked. At the date of acquisition, an evaluation period is determined after which, any remainingprobable reserve costs associated with producing fields are transferred to depletable costs. Costs notassociated with producing fields will be amortized over the remaining lease term.
Costs associated with significant development projects are not depleted until commercial productioncommences. Unproved land acquisition costs which are individually immaterial are amortized on astraight line basis over the average lease term until properties are determined to be productive orimpaired. Gas plants, net of estimated salvage values, are depreciated on a straight line basis overtheir estimated remaining useful lives, not to exceed the estimated remaining productive lives of therelated fields. Pipelines and corporate assets are depreciated using the straight line method at annualrates of 7%, and 10 to 33%, respectively.
e) Future site restorationEstimated costs of future site restoration of oil and gas properties, including offshore productionplatforms, are provided for using the unit of production method while those of gas plants andfacilities are provided for using the straight line method at rates approximating their useful lives butnot exceeding the estimated remaining productive lives of the related fields. The provision isincluded with depletion, depreciation and amortization expense and is based on engineeringestimates using current costs and technology and in accordance with existing legislation andindustry practice. Expenditures are charged against the accumulated provision as incurred. When aproperty is disposed of, the associated accumulated provision for site restoration is eliminated andincluded in determination of the gain or loss on disposal.
TA L IS M A N E N E R G Y I N C .
N OT E S T O T H E C O N S O L I DAT E D F I N A N C I A L S TAT E M E N T S( TA B U L A R A M O U N TS I N M I L L I O N S E X C E P T S H A R E D ATA )
Brought to you by Global Reports
49
f) Capitalized interestInterest expense associated with major development projects is capitalized until commercialproduction commences.
g) Indonesian royaltiesIndonesian operations conducted jointly with the Indonesian national oil company (“Pertamina”)are reflected in the Consolidated Financial Statements based on the Company’s proportionateinterest in such activities. All other Pertamina interests, other than income taxes, are considered tobe royalty interests. Royalties on production from Indonesian properties represent the entitlement ofthe Indonesian government and Pertamina to a portion of Talisman’s share of crude oil, liquids andnatural gas production and are recorded using rates in effect under the terms of contracts at the timeof production.
h) Foreign currency translationMonetary assets and liabilities denominated in foreign currencies are translated at exchange rates ineffect at the balance sheet date. Non-monetary assets and liabilities denominated in foreigncurrencies are translated at rates in effect on the dates the assets were acquired or liabilities wereassumed. Revenues and expenses are translated at rates of exchange prevailing on the transactiondates. Gains and losses on translation are reflected in income when incurred, except for gains orlosses on translation of foreign currency denominated long term debt which are deferred andamortized over the expected minimum period to settlement.
i) Financial instrumentsThe Company enters into forward foreign exchange contracts to hedge anticipated future saleswhich are effectively denominated in US dollars. Interest rate swap contracts are used to hedgeagainst adverse fluctuations in interest rates. The Company uses various instruments to hedgeagainst unfavorable fluctuations in commodity prices. Payments or receipts on contracts that aredesignated and effective as hedges are recognized in income concurrently with the hedgedtransaction. The fair values of these contracts are not reflected in the Consolidated FinancialStatements. If the hedge of an anticipated future transaction is terminated or if a hedge ceases to beeffective, the gain or loss at that date is deferred and recognized concurrently with the anticipatedtransaction. Subsequent changes in value are reflected in income. Any instrument that does notconstitute a hedge is recorded at fair value with any resulting gain or loss reflected in income.
j) Post retirement benefitsPENSION PLANSThe Company sponsors both defined benefit and defined contribution pension arrangementscovering substantially all employees. The cost of defined benefit pensions is determined using theprojected benefit method prorated on services and is charged to income as services are rendered.Pension fund assets are measured at market value. Adjustments arising from plan amendments,experience gains and losses and changes in assumptions are amortized on a straight line basis overthe expected average remaining service life of the employee group. Gains or losses arising from plancurtailments and settlements are recognized in the year in which they occur.
The cost of defined contribution pensions is expensed as earned by employees.
OTHER POST RETIREMENT BENEFITSThe cost of post-retirement benefits, other than pensions, including group life and supplementalhealth insurance to eligible retired employees, is determined using the projected benefit methodprorated on services and is charged to income as services are rendered.
k) Petroleum revenue taxUnited Kingdom Petroleum Revenue Tax (“PRT”) is accounted for using the life of the fieldmethod whereby total future PRT is estimated using current reserves and anticipated costs andprices and charged to income based on current revenues as a proportion of estimated futurerevenues. Changes in the estimated total future PRT are accounted for prospectively.
TA L IS M A N E N E R G Y I N C .
Brought to you by Global Reports
50
2. Corporate Acquis i t ions
GOAL PETROLEUM PLCEffective January 11, 1996, Talisman purchased all the issued common shares of Goal Petroleum plc(“Goal”) for cash of $276.1 million and long term debt assumed of $56.9 million.
Net Assets AcquiredProperty, plant and equipment $380.2Non-cash working capital (7.9)Deferred income taxes and other (27.4)
344.9Cash 3.9Less acquisition costs (15.8)
$333.0
BOW VALLEY ENERGY INC.Talisman purchased all the issued common and preferred shares of Bow Valley Energy Inc. in August 1994.Consideration included the issue of common shares valued at $899.3 million, cash of $626.6 million, andthe assumption of $298.8 million in long term debt.
Net Assets AcquiredProperty, plant and equipment $1,944.2Non-cash working capital 41.3Deferred income taxes and other (129.1)
1,856.4Cash 14.4Less acquisition costs (46.1)
$1,824.7
3. Inventor ies
December 31 1996 1995Materials and supplies $36.0 $33.5Product 5.7 9.3
$41.7 $42.8
4. Pension Plans
At December 31, 1996, the Company’s defined benefit pension arrangements consisted of accrued pensionobligations with an actuarial net present value of $64.0 million (1995 – $60.2 million) and pension planassets with a market-related value of $126.3 million (1995 – $107.6 million). The Company used actuarialreports prepared by independent actuaries for funding and accounting purposes, the most recent of whichwas prepared as at January 1, 1996.
Net pension expense (credit) (1) 1996 1995 1994Current service costs $ 3.3 $ 3.4 $ 1.8Interest cost of projected benefit obligations 4.3 4.1 3.8Return on plan assets (9.0) (8.1) (8.5)Net amortization and deferral and other 1.5 (0.9) (3.9)
$ 0.1 $(1.5) $(6.8)
(1) Includes both defined benefit and defined contribution plans.
At December 31, 1996, the actuarial net present value of the accrued obligation for other post-retirementbenefits was $6.1 million (1995 – $6.1 million).
TA L IS M A N E N E R G Y I N C .
Brought to you by Global Reports
51
The actuarial net present value of accrued obligations and market-related value of plan assets for definedbenefit plans and other post-employment benefits are determined using management’s best estimates on agoing concern assumption and approximate fair value. The Company bears the risk associated withexperience losses from differences between assumed rates and actual results. The Company is also exposedto credit risk associated with the pension asset portfolio. Credit risk is reduced by placing plan assets intrust and through the Company’s pension plan investment policy. Plan assets consist of a diverse base ofCanadian and foreign cash, short term notes and equity securities and Canadian bonds and debentures.Pension plan assets significantly exceed the present value of accrued defined benefit obligations.
5. Property, P lant and EquipmentAccumulated
depreciation,
depletion and
As at December 31, 1996 Cost amortization Net book value
Crude oil and natural gas properties $3,356.0 $ 990.2 $2,365.8Production equipment 1,306.2 361.3 944.9Corporate 68.7 46.8 21.9
$4,730.9 $1,398.3 $3,332.6
Accumulated
depreciation,
depletion and
As at December 31, 1995 Cost amortization Net book value
Crude oil and natural gas properties $2,595.7 $ 740.9 $1,854.8Production equipment 1,126.9 271.6 855.3Corporate 64.5 41.1 23.4
$3,787.1 $1,053.6 $2,733.5
In the year ended December 31, 1996, $5.1 million (1995 – nil) of interest expense was capitalized forsignificant development projects underway in the North Sea and Indonesia.
Included in property, plant and equipment are the following costs which were not subject to depreciation,depletion or amortization:
Undepleted capital at December 31 1996 1995Acquired probable reserve costs $337.6 $244.7Development projects 250.4 59.0Exploration costs 50.2 46.1North Sea platform costs – 12.3
$638.2 $362.1
Acquired probable reserve costs which were not subject to depreciation, depletion or amortization consistof the following:
Acquired probable reserve costs at December 31 1996 1995Associated with producing fields
Canada $ – $ 25.4North Sea 73.8 25.4Indonesia 6.1 9.3
79.9 60.1Not associated with producing fields
North Sea 257.7 82.8Indonesia – 101.8
257.7 184.6$337.6 $244.7
TA L IS M A N E N E R G Y I N C .
Brought to you by Global Reports

Development costs primarily relate to the Corridor gas and Tanjung waterflood projects in Indonesia andthe West Brae/Sedgwick field in the North Sea and are not being depleted pending initial production. AtDecember 31, 1996, this includes $26.5 million (1995 – $15.5 million) of non-capital expendituresassociated with the water injection program at the Tanjung Raya field in Indonesia which have beendeferred to the earlier of March 31, 1997, or until commercial rates of production are achieved.Thereafter, amortization of deferred non-capital expenditures and depletion of development costs willcommence on a unit of production basis.
Exploration costs consist of drilling in progress and wells awaiting determination of proved reserves orcommencement of production. The portion of acquired North Sea platform costs which representedunutilized capacity was transferred to depletable costs in 1996 coincident with additional production.
The carrying values of capital assets, including acquired probable reserve costs, are subject to uncertaintyassociated with the quantity of oil and gas reserves, future production rates, commodity prices and other factors. Future events could result in material changes to the carrying values recognized in thefinancial statements.
6. Long Term Debt1996 1995
Bank Credit Facilities (1996 – 5.96%)(1) $148.4 $ –Commercial Paper (1996 – 3.38%; 1995 – 6.03%)(1) 250.6 307.1Debentures and Notes
7.125% unsecured debentures (US$175 million) due 2007 239.7 238.99.45% unsecured debentures, Series A, due 1999 100.0 100.09.80% unsecured debentures, Series B, due 2004 75.0 75.09.18% unsecured medium term notes, due 1998 50.0 50.09.66% unsecured medium term notes, due 2002 35.0 35.08.50% unsecured convertible subordinated debentures, due 2000 – 100.0
$898.7 $906.0
(1) Rates reflect the weighted average interest rate on instruments outstanding at December 31. Rates are floating rate-based and varywith changes in short term market interest rates.
BANK CREDIT FACILITIESTalisman has unsecured extendible revolving term credit facilities totaling $800 million, consisting of two$400 million facilities. The term dates of these facilities are June 30, 1997 and December 16, 1997respectively. Until each term date, the Company may increase or decrease outstanding borrowings at itsdiscretion. Annually, upon agreement between the Company and the syndicate of lenders, each term datemay be extended for an additional 364 days.
Facility borrowings are available in the form of prime loans, bankers’ acceptances, US base rate loans orLondon Interbank Offered Rate (“LIBOR”) loans. Borrowings at December 31, 1996 consisted of USdollar LIBOR loans.
Each facility expires five years after the term date and must be repaid in equal semi-annual paymentsbeginning six months after the term date.
COMMERCIAL PAPERCommercial paper is issued in the form of unsecured discount notes for terms that generally do notexceed six months. Commercial paper has been classified as long term debt since the Company has theability to replace it with borrowings under the revolving facilities and it is management’s intent that thisdebt be continually renewed throughout the next fiscal year.
DEBENTURES AND NOTESUS dollar debentures, unsecuredIn 1995, the Company issued US$175 million of unsecured debentures maturing June 1, 2007. Interest ispaid semi-annually.
TA L IS M A N E N E R G Y I N C .
52
Brought to you by Global Reports
53
In December 1994, the Company entered into interest rate swap contracts which result in the Companypaying interest at a rate of 8.295% in exchange for receiving the three month LIBOR rate on notionalprincipal of US$100 million until May 16, 2005. Based on the LIBOR rate at December 31, 1996, thesecontracts result in an effective rate of interest on the debentures of 8.65%.
Debentures, series A and B, unsecuredThe series A and B debentures are due December 22, 1999, and December 22, 2004, respectively. Interest is paidsemi-annually on both debentures. The series B debentures may be redeemed by the Company at any time.
Medium term notes, unsecuredMedium term notes consist of $50 million of notes maturing March 25, 1998, and $35 million of notesmaturing March 25, 2002. Interest is paid semi-annually.
Convertible subordinated debentures, unsecuredThe debentures were redeemed on June 10, 1996 at their face value plus accrued interest.
The Company’s contractual minimum repayments of long term debt in the next 10 years are as follows:
Year Required Repayment1997 $ –1998 129.81999 179.82000 79.82001 79.82002 114.82003 –2004 75.02005 –2006 –Subsequent to 2006 239.7Total $898.7
Repayments of bank credit facilities and commercial paper have been presented based on the five year repayment term of the December1997 term date revolving term credit facility assuming no extension.
7. Contingencies and Commitments
Talisman is party to various legal claims associated with the ordinary conduct of business. In the opinion ofmanagement, these claims are not expected to have a material impact on the Company’s financial position.
The Company has provided letters of credit in the amount of £27.8 million ($65.3 million) as securityagainst future decommissioning costs for certain North Sea fields.
8. Share Capita l and Contr ibuted Surplus
Talisman’s authorized share capital consists of an unlimited number of common shares without nominal orpar value and first and second preferred shares. No preferred shares have been issued.
1996 1995Shares Amount Shares Amount
Common sharesBalance, beginning of year 96,679,831 $1,411.8 96,282,419 $1,406.2Issued during year
Share issue 12,000,000 363.4 – –Share option plan 398,450 9.4 397,500 5.6
Redeemed during year – – (88) –Balance, end of year 109,078,281 1,784.6 96,679,831 1,411.8Contributed Surplus 79.0 79.0
109,078,281 $1,863.6 96,679,831 $1,490.8
TA L IS M A N E N E R G Y I N C .
Brought to you by Global Reports
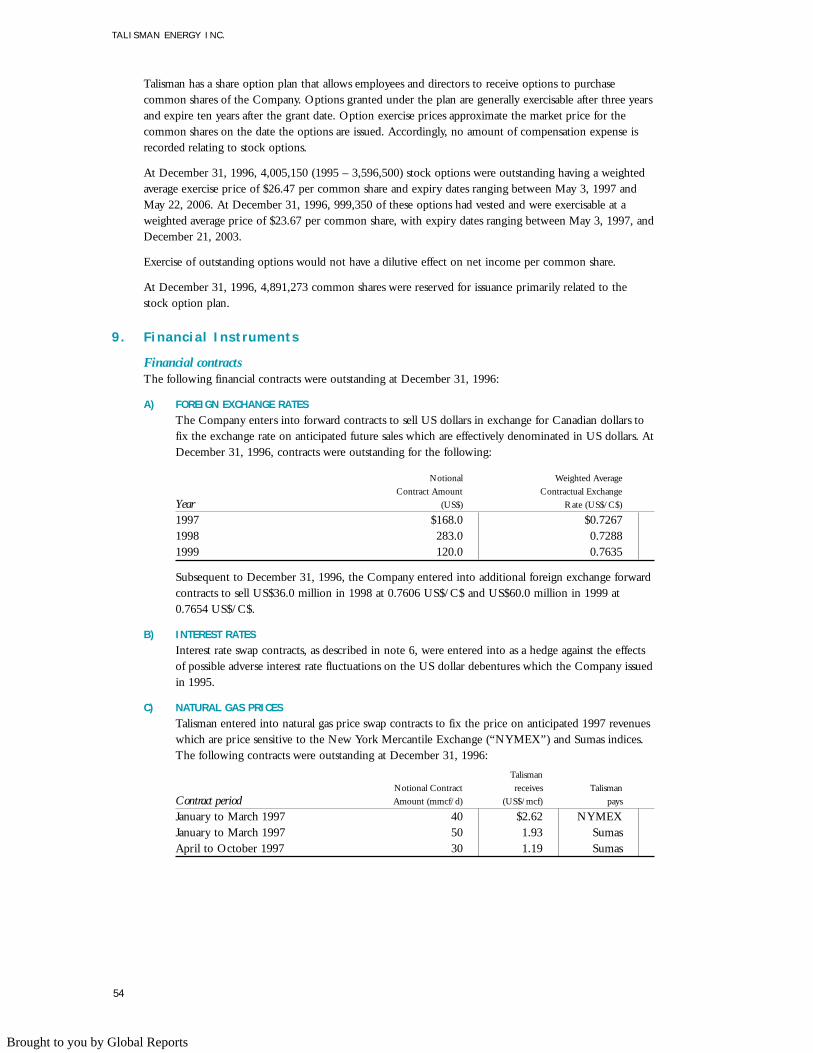
54
Talisman has a share option plan that allows employees and directors to receive options to purchasecommon shares of the Company. Options granted under the plan are generally exercisable after three yearsand expire ten years after the grant date. Option exercise prices approximate the market price for thecommon shares on the date the options are issued. Accordingly, no amount of compensation expense isrecorded relating to stock options.
At December 31, 1996, 4,005,150 (1995 – 3,596,500) stock options were outstanding having a weightedaverage exercise price of $26.47 per common share and expiry dates ranging between May 3, 1997 andMay 22, 2006. At December 31, 1996, 999,350 of these options had vested and were exercisable at aweighted average price of $23.67 per common share, with expiry dates ranging between May 3, 1997, andDecember 21, 2003.
Exercise of outstanding options would not have a dilutive effect on net income per common share.
At December 31, 1996, 4,891,273 common shares were reserved for issuance primarily related to thestock option plan.
9. Financia l Instruments
Financial contractsThe following financial contracts were outstanding at December 31, 1996:
A) FOREIGN EXCHANGE RATESThe Company enters into forward contracts to sell US dollars in exchange for Canadian dollars tofix the exchange rate on anticipated future sales which are effectively denominated in US dollars. AtDecember 31, 1996, contracts were outstanding for the following:
Notional Weighted Average
Contract Amount Contractual Exchange
Year (US$) Rate (US$/C$)
1997 $168.0 $0.72671998 283.0 0.72881999 120.0 0.7635
Subsequent to December 31, 1996, the Company entered into additional foreign exchange forwardcontracts to sell US$36.0 million in 1998 at 0.7606 US$/C$ and US$60.0 million in 1999 at0.7654 US$/C$.
B) INTEREST RATESInterest rate swap contracts, as described in note 6, were entered into as a hedge against the effectsof possible adverse interest rate fluctuations on the US dollar debentures which the Company issuedin 1995.
C) NATURAL GAS PRICESTalisman entered into natural gas price swap contracts to fix the price on anticipated 1997 revenueswhich are price sensitive to the New York Mercantile Exchange (“NYMEX”) and Sumas indices.The following contracts were outstanding at December 31, 1996:
Talisman
Notional Contract receives Talisman
Contract period Amount (mmcf/d) (US$/mcf) pays
January to March 1997 40 $2.62 NYMEXJanuary to March 1997 50 1.93 SumasApril to October 1997 30 1.19 Sumas
TA L IS M A N E N E R G Y I N C .
Brought to you by Global Reports
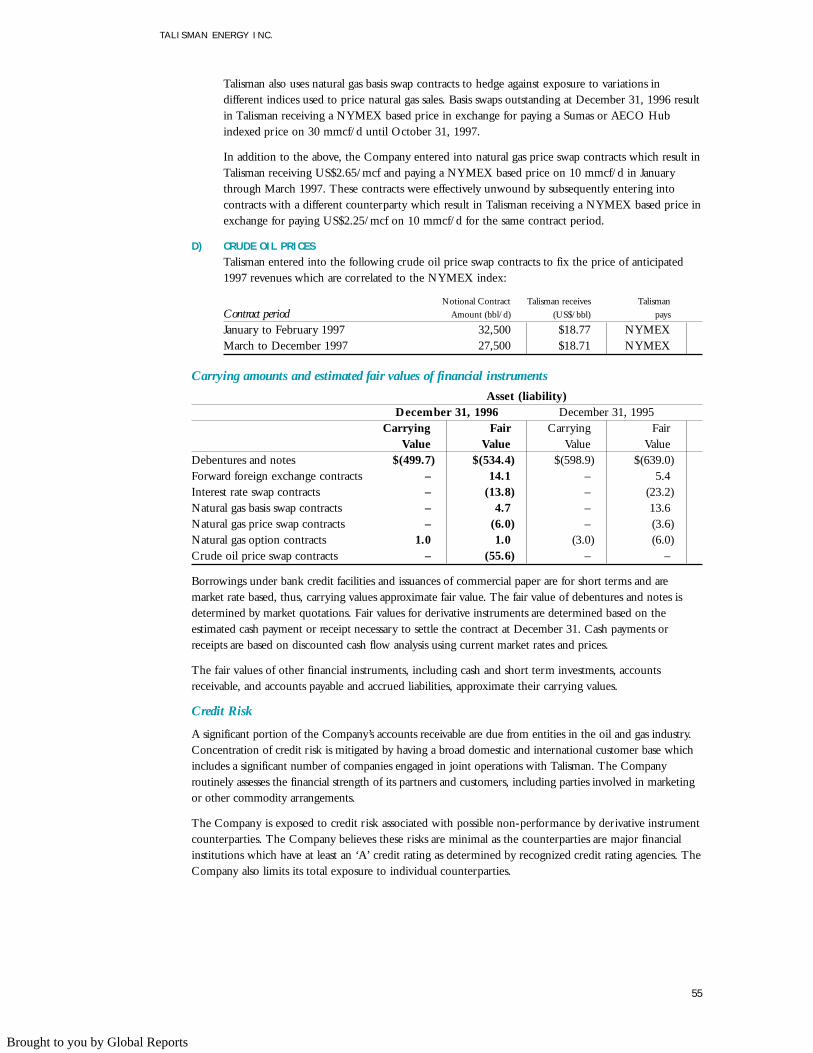
55
Talisman also uses natural gas basis swap contracts to hedge against exposure to variations indifferent indices used to price natural gas sales. Basis swaps outstanding at December 31, 1996 resultin Talisman receiving a NYMEX based price in exchange for paying a Sumas or AECO Hubindexed price on 30 mmcf/d until October 31, 1997.
In addition to the above, the Company entered into natural gas price swap contracts which result inTalisman receiving US$2.65/mcf and paying a NYMEX based price on 10 mmcf/d in Januarythrough March 1997. These contracts were effectively unwound by subsequently entering intocontracts with a different counterparty which result in Talisman receiving a NYMEX based price inexchange for paying US$2.25/mcf on 10 mmcf/d for the same contract period.
D) CRUDE OIL PRICESTalisman entered into the following crude oil price swap contracts to fix the price of anticipated1997 revenues which are correlated to the NYMEX index:
Notional Contract Talisman receives Talisman
Contract period Amount (bbl/d) (US$/bbl) pays
January to February 1997 32,500 $18.77 NYMEXMarch to December 1997 27,500 $18.71 NYMEX
Carrying amounts and estimated fair values of financial instruments
Asset (liability)December 31, 1996 December 31, 1995
Carrying Fair Carrying FairValue Value Value Value
Debentures and notes $(499.7) $(534.4) $(598.9) $(639.0)Forward foreign exchange contracts – 14.1 – 5.4Interest rate swap contracts – (13.8) – (23.2)Natural gas basis swap contracts – 4.7 – 13.6Natural gas price swap contracts – (6.0) – (3.6)Natural gas option contracts 1.0 1.0 (3.0) (6.0)Crude oil price swap contracts – (55.6) – –
Borrowings under bank credit facilities and issuances of commercial paper are for short terms and aremarket rate based, thus, carrying values approximate fair value. The fair value of debentures and notes isdetermined by market quotations. Fair values for derivative instruments are determined based on theestimated cash payment or receipt necessary to settle the contract at December 31. Cash payments orreceipts are based on discounted cash flow analysis using current market rates and prices.
The fair values of other financial instruments, including cash and short term investments, accountsreceivable, and accounts payable and accrued liabilities, approximate their carrying values.
Credit Risk
A significant portion of the Company’s accounts receivable are due from entities in the oil and gas industry.Concentration of credit risk is mitigated by having a broad domestic and international customer base whichincludes a significant number of companies engaged in joint operations with Talisman. The Companyroutinely assesses the financial strength of its partners and customers, including parties involved in marketingor other commodity arrangements.
The Company is exposed to credit risk associated with possible non-performance by derivative instrumentcounterparties. The Company believes these risks are minimal as the counterparties are major financialinstitutions which have at least an ‘A’ credit rating as determined by recognized credit rating agencies. TheCompany also limits its total exposure to individual counterparties.
TA L IS M A N E N E R G Y I N C .
Brought to you by Global Reports
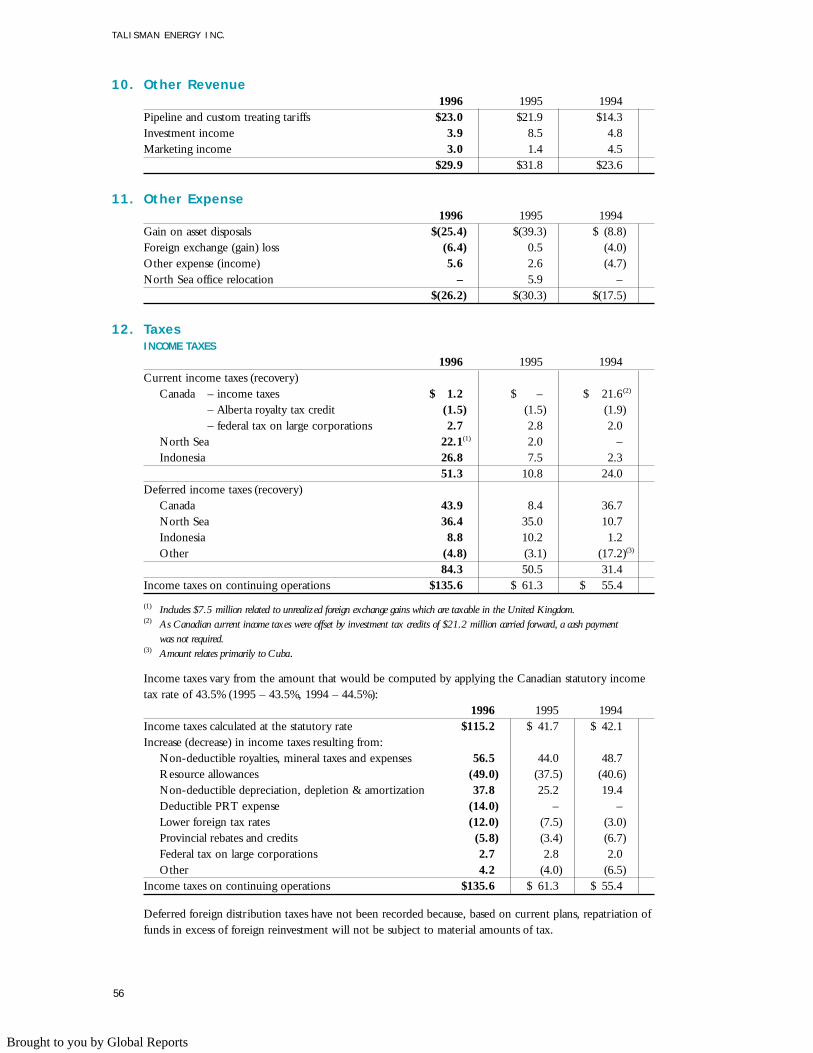
56
10. Other Revenue1996 1995 1994
Pipeline and custom treating tariffs $23.0 $21.9 $14.3Investment income 3.9 8.5 4.8Marketing income 3.0 1.4 4.5
$29.9 $31.8 $23.6
11. Other Expense1996 1995 1994
Gain on asset disposals $(25.4) $(39.3) $ (8.8)Foreign exchange (gain) loss (6.4) 0.5 (4.0)Other expense (income) 5.6 2.6 (4.7)North Sea office relocation – 5.9 –
$(26.2) $(30.3) $(17.5)
12. TaxesINCOME TAXES
1996 1995 1994Current income taxes (recovery)
Canada – income taxes $ 1.2 $ – $ 21.6(2)
– Alberta royalty tax credit (1.5) (1.5) (1.9)– federal tax on large corporations 2.7 2.8 2.0
North Sea 22.1(1) 2.0 –Indonesia 26.8 7.5 2.3
51.3 10.8 24.0Deferred income taxes (recovery)
Canada 43.9 8.4 36.7North Sea 36.4 35.0 10.7Indonesia 8.8 10.2 1.2Other (4.8) (3.1) (17.2)(3)
84.3 50.5 31.4Income taxes on continuing operations $135.6 $ 61.3 $ 55.4
(1) Includes $7.5 million related to unrealized foreign exchange gains which are taxable in the United Kingdom.(2) As Canadian current income taxes were offset by investment tax credits of $21.2 million carried forward, a cash payment
was not required.(3) Amount relates primarily to Cuba.
Income taxes vary from the amount that would be computed by applying the Canadian statutory incometax rate of 43.5% (1995 – 43.5%, 1994 – 44.5%):
1996 1995 1994Income taxes calculated at the statutory rate $115.2 $ 41.7 $ 42.1Increase (decrease) in income taxes resulting from:
Non-deductible royalties, mineral taxes and expenses 56.5 44.0 48.7Resource allowances (49.0) (37.5) (40.6)Non-deductible depreciation, depletion & amortization 37.8 25.2 19.4Deductible PRT expense (14.0) – –Lower foreign tax rates (12.0) (7.5) (3.0)Provincial rebates and credits (5.8) (3.4) (6.7)Federal tax on large corporations 2.7 2.8 2.0Other 4.2 (4.0) (6.5)
Income taxes on continuing operations $135.6 $ 61.3 $ 55.4
Deferred foreign distribution taxes have not been recorded because, based on current plans, repatriation offunds in excess of foreign reinvestment will not be subject to material amounts of tax.
TA L IS M A N E N E R G Y I N C .
Brought to you by Global Reports
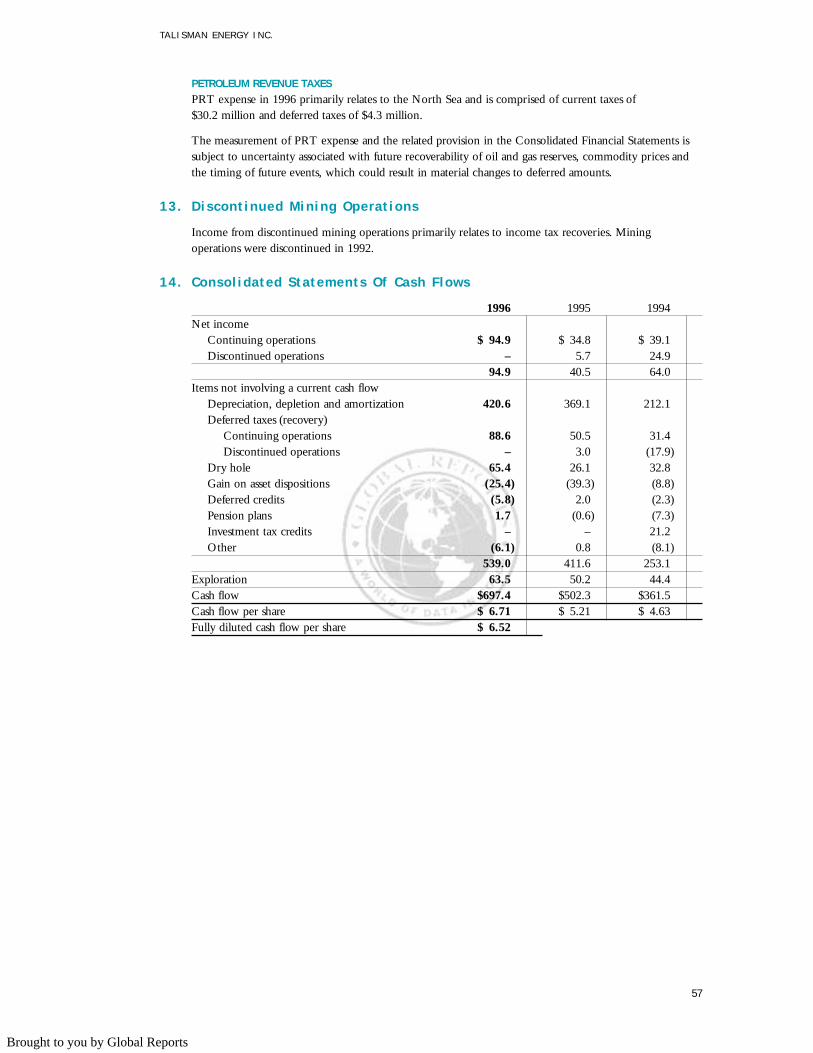
57
PETROLEUM REVENUE TAXESPRT expense in 1996 primarily relates to the North Sea and is comprised of current taxes of $30.2 million and deferred taxes of $4.3 million.
The measurement of PRT expense and the related provision in the Consolidated Financial Statements issubject to uncertainty associated with future recoverability of oil and gas reserves, commodity prices andthe timing of future events, which could result in material changes to deferred amounts.
13. Discontinued Mining Operat ions
Income from discontinued mining operations primarily relates to income tax recoveries. Miningoperations were discontinued in 1992.
14. Consol idated Statements Of Cash F lows
1996 1995 1994Net income
Continuing operations $ 94.9 $ 34.8 $ 39.1Discontinued operations – 5.7 24.9
94.9 40.5 64.0Items not involving a current cash flow
Depreciation, depletion and amortization 420.6 369.1 212.1Deferred taxes (recovery)
Continuing operations 88.6 50.5 31.4Discontinued operations – 3.0 (17.9)
Dry hole 65.4 26.1 32.8Gain on asset dispositions (25.4) (39.3) (8.8)Deferred credits (5.8) 2.0 (2.3)Pension plans 1.7 (0.6) (7.3)Investment tax credits – – 21.2Other (6.1) 0.8 (8.1)
539.0 411.6 253.1Exploration 63.5 50.2 44.4Cash flow $697.4 $502.3 $361.5Cash flow per share $ 6.71 $ 5.21 $ 4.63Fully diluted cash flow per share $ 6.52
TA L IS M A N E N E R G Y I N C .
Brought to you by Global Reports
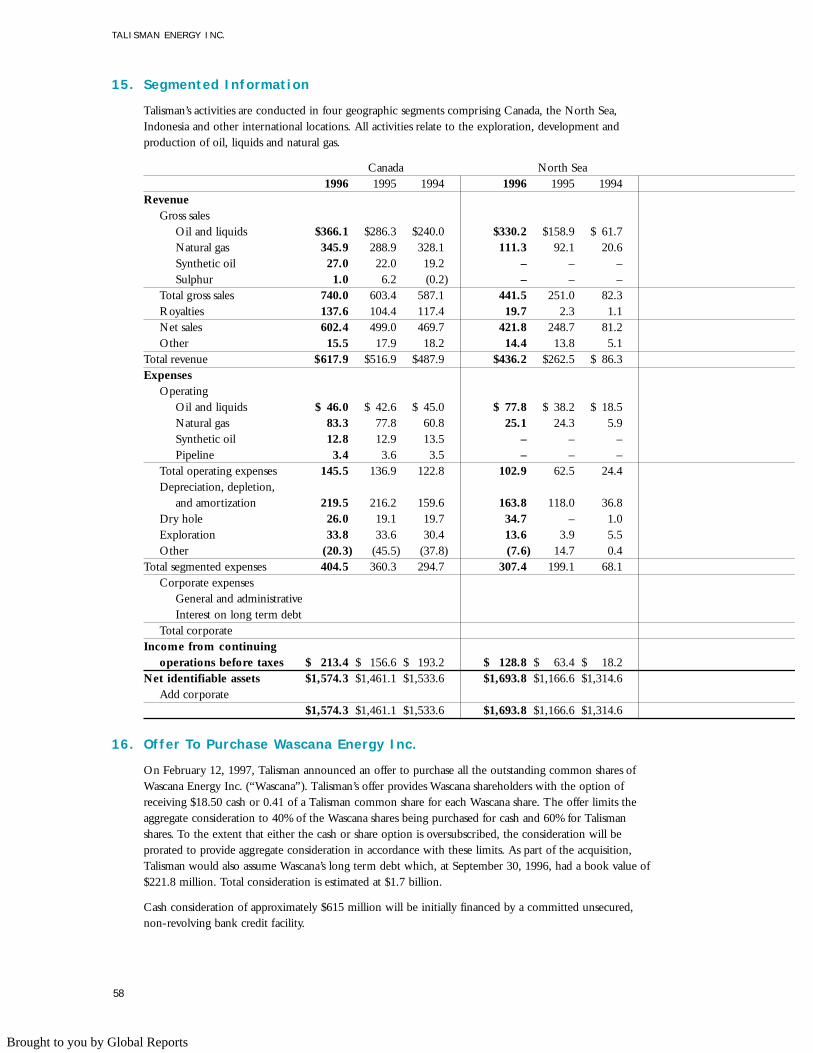
58
15. Segmented Information
Talisman’s activities are conducted in four geographic segments comprising Canada, the North Sea,Indonesia and other international locations. All activities relate to the exploration, development andproduction of oil, liquids and natural gas.
Canada North Sea1996 1995 1994 1996 1995 1994
RevenueGross sales
Oil and liquids $366.1 $286.3 $240.0 $330.2 $158.9 $ 61.7Natural gas 345.9 288.9 328.1 111.3 92.1 20.6Synthetic oil 27.0 22.0 19.2 – – –Sulphur 1.0 6.2 (0.2) – – –
Total gross sales 740.0 603.4 587.1 441.5 251.0 82.3Royalties 137.6 104.4 117.4 19.7 2.3 1.1Net sales 602.4 499.0 469.7 421.8 248.7 81.2Other 15.5 17.9 18.2 14.4 13.8 5.1
Total revenue $617.9 $516.9 $487.9 $436.2 $262.5 $ 86.3Expenses
OperatingOil and liquids $ 46.0 $ 42.6 $ 45.0 $ 77.8 $ 38.2 $ 18.5Natural gas 83.3 77.8 60.8 25.1 24.3 5.9Synthetic oil 12.8 12.9 13.5 – – –Pipeline 3.4 3.6 3.5 – – –
Total operating expenses 145.5 136.9 122.8 102.9 62.5 24.4Depreciation, depletion,
and amortization 219.5 216.2 159.6 163.8 118.0 36.8Dry hole 26.0 19.1 19.7 34.7 – 1.0Exploration 33.8 33.6 30.4 13.6 3.9 5.5Other (20.3) (45.5) (37.8) (7.6) 14.7 0.4
Total segmented expenses 404.5 360.3 294.7 307.4 199.1 68.1Corporate expenses
General and administrativeInterest on long term debt
Total corporateIncome from continuing
operations before taxes $ 213.4 $ 156.6 $ 193.2 $ 128.8 $ 63.4 $ 18.2Net identifiable assets $1,574.3 $1,461.1 $1,533.6 $1,693.8 $1,166.6 $1,314.6
Add corporate$1,574.3 $1,461.1 $1,533.6 $1,693.8 $1,166.6 $1,314.6
16. Offer To Purchase Wascana Energy Inc .
On February 12, 1997, Talisman announced an offer to purchase all the outstanding common shares ofWascana Energy Inc. (“Wascana”). Talisman’s offer provides Wascana shareholders with the option ofreceiving $18.50 cash or 0.41 of a Talisman common share for each Wascana share. The offer limits theaggregate consideration to 40% of the Wascana shares being purchased for cash and 60% for Talismanshares. To the extent that either the cash or share option is oversubscribed, the consideration will beprorated to provide aggregate consideration in accordance with these limits. As part of the acquisition,Talisman would also assume Wascana’s long term debt which, at September 30, 1996, had a book value of$221.8 million. Total consideration is estimated at $1.7 billion.
Cash consideration of approximately $615 million will be initially financed by a committed unsecured,non-revolving bank credit facility.
TA L IS M A N E N E R G Y I N C .
Brought to you by Global Reports

59
Indonesia Other Total1996 1995 1994 1996 1995 1994 1996 1995 1994
$225.4 $157.1 $ 48.4 $ – $ – $ 1.8 $ 921.7 $ 602.3 $ 351.9– – – – – – 457.2 381.0 348.7– – – – – – 27.0 22.0 19.2– – – – – – 1.0 6.2 (0.2)
225.4 157.1 48.4 – – 1.8 1,406.9 1,011.5 719.666.7 37.4 11.3 – – – 224.0 144.1 129.8
158.7 119.7 37.1 – – 1.8 1,182.9 867.4 589.8– 0.1 – – – 0.3 29.9 31.8 23.6
$158.7 $119.8 $ 37.1 $ – $ – $ 2.1 $1,212.8 $ 899.2 $ 613.4
$ 51.1 $ 45.6 $ 15.0 $ – $ – $ 3.3 $ 174.9 $ 126.4 $ 81.8– – – – – – 108.4 102.1 66.7– – – – – – 12.8 12.9 13.5– – – – – – 3.4 3.6 3.5
51.1 45.6 15.0 – – 3.3 299.5 245.0 165.5
36.9 34.9 13.6 0.4 – 2.1 420.6 369.1 212.12.7 3.4 1.2 2.0 3.6 10.8 65.4 26.1 32.74.2 7.7 3.6 11.9 5.0 4.9 63.5 50.2 44.41.6 (1.2) 1.4 0.1 1.7 18.5 (26.2) (30.3) (17.5)
96.5 90.4 34.8 14.4 10.3 39.6 822.8 660.1 437.2
56.3 56.6 40.768.7 86.4 41.0
125.0 143.0 81.7
$ 62.2 $ 29.4 $ 2.3 $ (14.4) $ (10.3) $ (37.5) $ 265.0 $ 96.1 $ 94.5$395.4 $339.5 $324.6 $ 29.8 $ 13.1 $ 29.2 $3,693.3 $2,980.3 $3,202.0
57.9 60.0 57.3$395.4 $339.5 $324.6 $ 29.8 $ 13.1 $ 29.2 $3,751.2 $3,040.3 $3,259.3
TA L IS M A N E N E R G Y I N C .
Brought to you by Global Reports
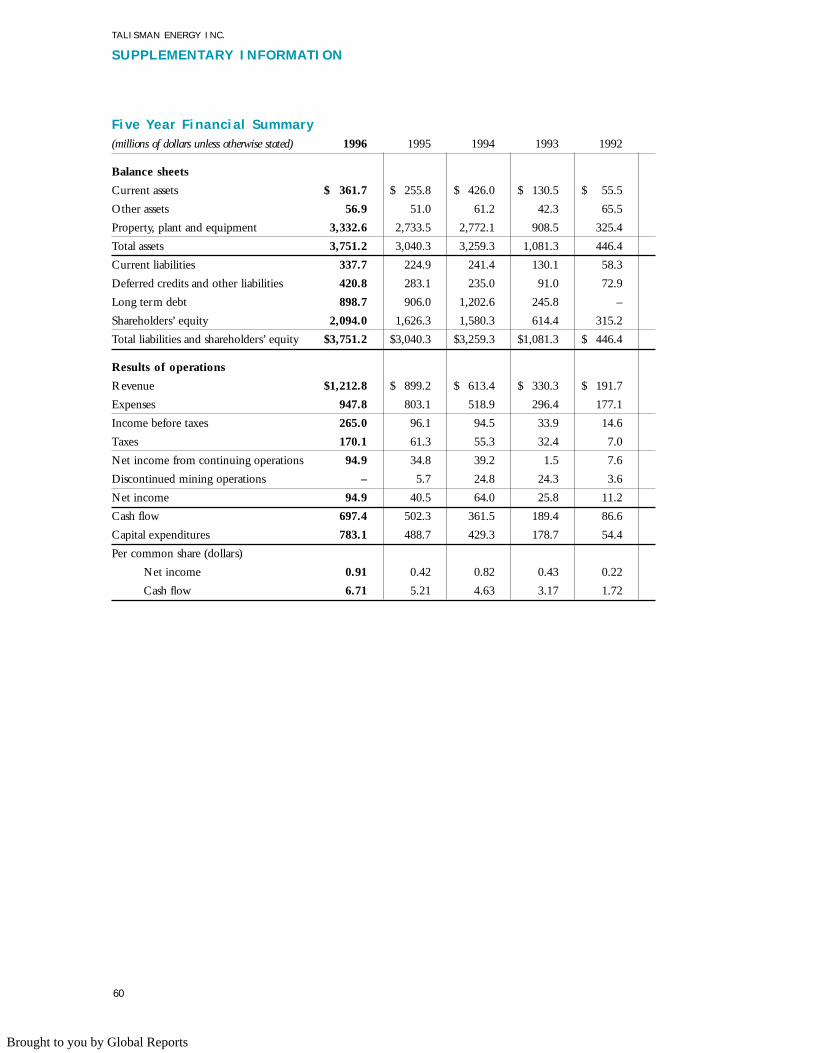
60
Five Year F inancia l Summary(millions of dollars unless otherwise stated) 1996 1995 1994 1993 1992
Balance sheets
Current assets $ 361.7 $ 255.8 $ 426.0 $ 130.5 $ 55.5
Other assets 56.9 51.0 61.2 42.3 65.5
Property, plant and equipment 3,332.6 2,733.5 2,772.1 908.5 325.4
Total assets 3,751.2 3,040.3 3,259.3 1,081.3 446.4
Current liabilities 337.7 224.9 241.4 130.1 58.3
Deferred credits and other liabilities 420.8 283.1 235.0 91.0 72.9
Long term debt 898.7 906.0 1,202.6 245.8 –
Shareholders’ equity 2,094.0 1,626.3 1,580.3 614.4 315.2
Total liabilities and shareholders’ equity $3,751.2 $3,040.3 $3,259.3 $1,081.3 $ 446.4
Results of operations
Revenue $1,212.8 $ 899.2 $ 613.4 $ 330.3 $ 191.7
Expenses 947.8 803.1 518.9 296.4 177.1
Income before taxes 265.0 96.1 94.5 33.9 14.6
Taxes 170.1 61.3 55.3 32.4 7.0
Net income from continuing operations 94.9 34.8 39.2 1.5 7.6
Discontinued mining operations – 5.7 24.8 24.3 3.6
Net income 94.9 40.5 64.0 25.8 11.2
Cash flow 697.4 502.3 361.5 189.4 86.6
Capital expenditures 783.1 488.7 429.3 178.7 54.4
Per common share (dollars)
Net income 0.91 0.42 0.82 0.43 0.22
Cash flow 6.71 5.21 4.63 3.17 1.72
TA L IS M A N E N E R G Y I N C .
S U P P L E M E N TA R Y I N F O R M AT I O N
Brought to you by Global Reports
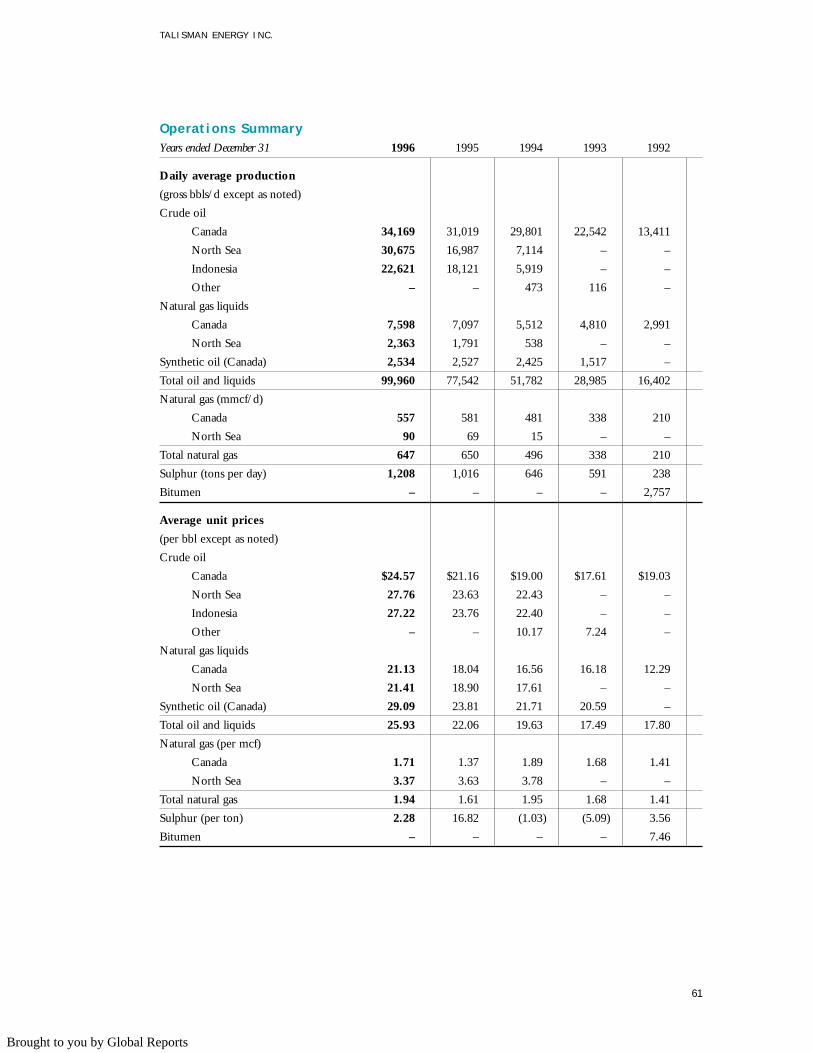
61
TA L IS M A N E N E R G Y I N C .
Operat ions SummaryYears ended December 31 1996 1995 1994 1993 1992
Daily average production
(gross bbls/d except as noted)
Crude oil
Canada 34,169 31,019 29,801 22,542 13,411
North Sea 30,675 16,987 7,114 – –
Indonesia 22,621 18,121 5,919 – –
Other – – 473 116 –
Natural gas liquids
Canada 7,598 7,097 5,512 4,810 2,991
North Sea 2,363 1,791 538 – –
Synthetic oil (Canada) 2,534 2,527 2,425 1,517 –
Total oil and liquids 99,960 77,542 51,782 28,985 16,402
Natural gas (mmcf/d)
Canada 557 581 481 338 210
North Sea 90 69 15 – –
Total natural gas 647 650 496 338 210
Sulphur (tons per day) 1,208 1,016 646 591 238
Bitumen – – – – 2,757
Average unit prices
(per bbl except as noted)
Crude oil
Canada $24.57 $21.16 $19.00 $17.61 $19.03
North Sea 27.76 23.63 22.43 – –
Indonesia 27.22 23.76 22.40 – –
Other – – 10.17 7.24 –
Natural gas liquids
Canada 21.13 18.04 16.56 16.18 12.29
North Sea 21.41 18.90 17.61 – –
Synthetic oil (Canada) 29.09 23.81 21.71 20.59 –
Total oil and liquids 25.93 22.06 19.63 17.49 17.80
Natural gas (per mcf)
Canada 1.71 1.37 1.89 1.68 1.41
North Sea 3.37 3.63 3.78 – –
Total natural gas 1.94 1.61 1.95 1.68 1.41
Sulphur (per ton) 2.28 16.82 (1.03) (5.09) 3.56
Bitumen – – – – 7.46
Brought to you by Global Reports
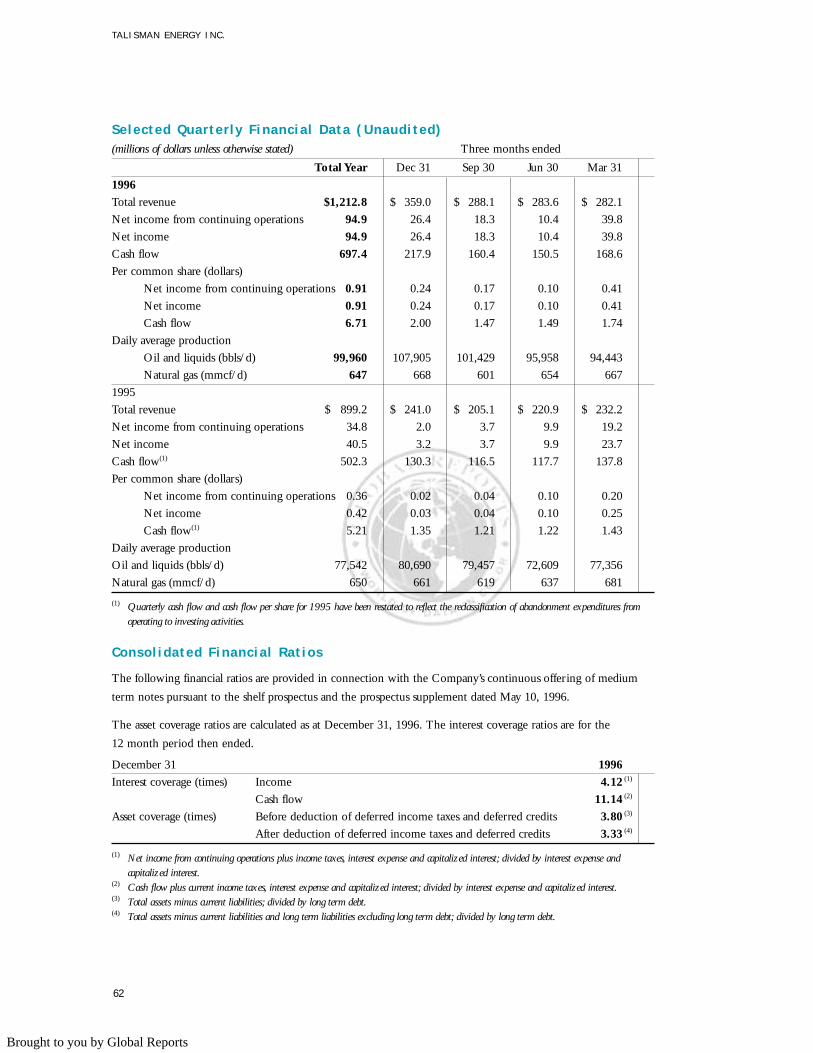
62
Selected Quarter ly F inancia l Data (Unaudited)(millions of dollars unless otherwise stated) Three months ended
Total Year Dec 31 Sep 30 Jun 30 Mar 31
1996
Total revenue $1,212.8 $ 359.0 $ 288.1 $ 283.6 $ 282.1
Net income from continuing operations 94.9 26.4 18.3 10.4 39.8
Net income 94.9 26.4 18.3 10.4 39.8
Cash flow 697.4 217.9 160.4 150.5 168.6
Per common share (dollars)
Net income from continuing operations 0.91 0.24 0.17 0.10 0.41
Net income 0.91 0.24 0.17 0.10 0.41
Cash flow 6.71 2.00 1.47 1.49 1.74
Daily average production
Oil and liquids (bbls/d) 99,960 107,905 101,429 95,958 94,443
Natural gas (mmcf/d) 647 668 601 654 667
1995
Total revenue $ 899.2 $ 241.0 $ 205.1 $ 220.9 $ 232.2
Net income from continuing operations 34.8 2.0 3.7 9.9 19.2
Net income 40.5 3.2 3.7 9.9 23.7
Cash flow(1) 502.3 130.3 116.5 117.7 137.8
Per common share (dollars)
Net income from continuing operations 0.36 0.02 0.04 0.10 0.20
Net income 0.42 0.03 0.04 0.10 0.25
Cash flow(1) 5.21 1.35 1.21 1.22 1.43
Daily average production
Oil and liquids (bbls/d) 77,542 80,690 79,457 72,609 77,356
Natural gas (mmcf/d) 650 661 619 637 681
(1) Quarterly cash flow and cash flow per share for 1995 have been restated to reflect the reclassification of abandonment expenditures fromoperating to investing activities.
Consol idated Financia l Rat ios
The following financial ratios are provided in connection with the Company’s continuous offering of medium
term notes pursuant to the shelf prospectus and the prospectus supplement dated May 10, 1996.
The asset coverage ratios are calculated as at December 31, 1996. The interest coverage ratios are for the
12 month period then ended.
December 31 1996
Interest coverage (times) Income 4.12 (1)
Cash flow 11.14 (2)
Asset coverage (times) Before deduction of deferred income taxes and deferred credits 3.80 (3)
After deduction of deferred income taxes and deferred credits 3.33 (4)
(1) Net income from continuing operations plus income taxes, interest expense and capitalized interest; divided by interest expense andcapitalized interest.
(2) Cash flow plus current income taxes, interest expense and capitalized interest; divided by interest expense and capitalized interest.(3) Total assets minus current liabilities; divided by long term debt.(4) Total assets minus current liabilities and long term liabilities excluding long term debt; divided by long term debt.
TA L IS M A N E N E R G Y I N C .
Brought to you by Global Reports
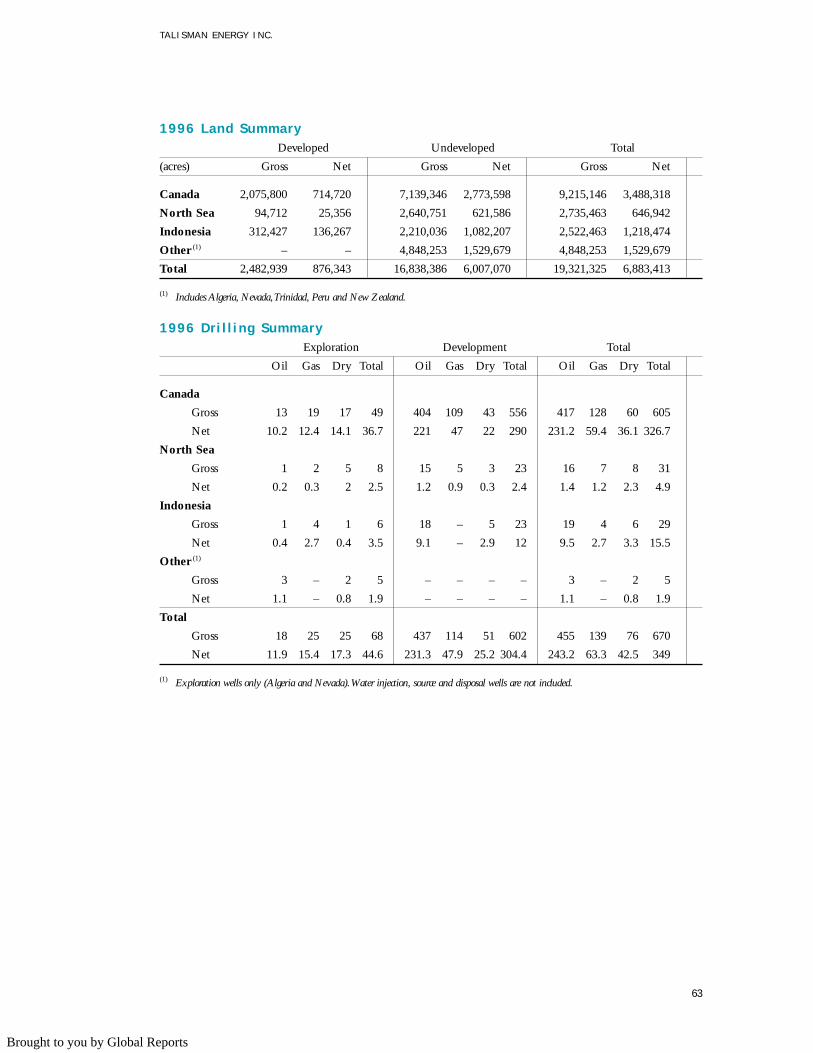
63
1996 Land SummaryDeveloped Undeveloped Total
(acres) Gross Net Gross Net Gross Net
Canada 2,075,800 714,720 7,139,346 2,773,598 9,215,146 3,488,318
North Sea 94,712 25,356 2,640,751 621,586 2,735,463 646,942
Indonesia 312,427 136,267 2,210,036 1,082,207 2,522,463 1,218,474
Other (1) – – 4,848,253 1,529,679 4,848,253 1,529,679
Total 2,482,939 876,343 16,838,386 6,007,070 19,321,325 6,883,413
(1) Includes Algeria, Nevada,Trinidad, Peru and New Zealand.
1996 Dri l l ing SummaryExploration Development Total
Oil Gas Dry Total Oil Gas Dry Total Oil Gas Dry Total
Canada
Gross 13 19 17 49 404 109 43 556 417 128 60 605
Net 10.2 12.4 14.1 36.7 221 47 22 290 231.2 59.4 36.1 326.7
North Sea
Gross 1 2 5 8 15 5 3 23 16 7 8 31
Net 0.2 0.3 2 2.5 1.2 0.9 0.3 2.4 1.4 1.2 2.3 4.9
Indonesia
Gross 1 4 1 6 18 – 5 23 19 4 6 29
Net 0.4 2.7 0.4 3.5 9.1 – 2.9 12 9.5 2.7 3.3 15.5
Other (1)
Gross 3 – 2 5 – – – – 3 – 2 5
Net 1.1 – 0.8 1.9 – – – – 1.1 – 0.8 1.9
Total
Gross 18 25 25 68 437 114 51 602 455 139 76 670
Net 11.9 15.4 17.3 44.6 231.3 47.9 25.2 304.4 243.2 63.3 42.5 349
(1) Exploration wells only (Algeria and Nevada).Water injection, source and disposal wells are not included.
TA L IS M A N E N E R G Y I N C .
Brought to you by Global Reports
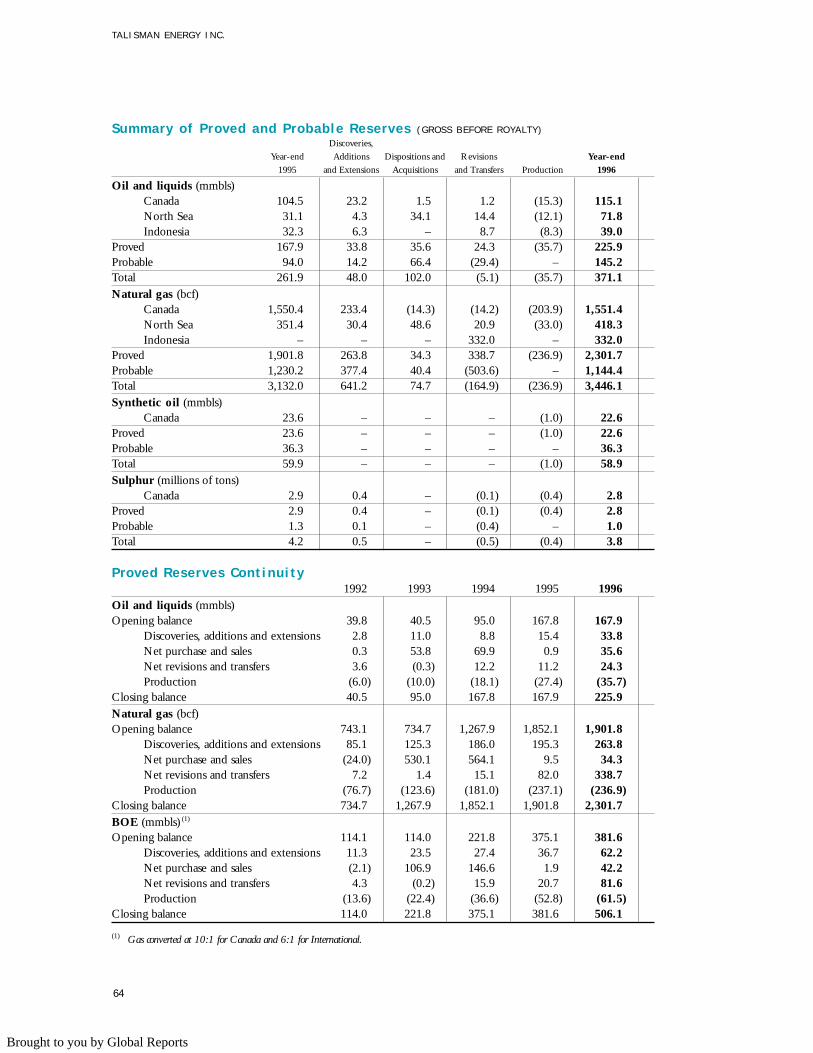
64
TA L IS M A N E N E R G Y I N C .
Summary o f Proved and Probable Reserves ( G R O S S B E F O R E R O YA LT Y )Discoveries,
Year-end Additions Dispositions and Revisions Year-end
1995 and Extensions Acquisitions and Transfers Production 1996
Oil and liquids (mmbls)Canada 104.5 23.2 1.5 1.2 (15.3) 115.1North Sea 31.1 4.3 34.1 14.4 (12.1) 71.8Indonesia 32.3 6.3 – 8.7 (8.3) 39.0
Proved 167.9 33.8 35.6 24.3 (35.7) 225.9Probable 94.0 14.2 66.4 (29.4) – 145.2Total 261.9 48.0 102.0 (5.1) (35.7) 371.1
Natural gas (bcf)Canada 1,550.4 233.4 (14.3) (14.2) (203.9) 1,551.4North Sea 351.4 30.4 48.6 20.9 (33.0) 418.3Indonesia – – – 332.0 – 332.0
Proved 1,901.8 263.8 34.3 338.7 (236.9) 2,301.7Probable 1,230.2 377.4 40.4 (503.6) – 1,144.4Total 3,132.0 641.2 74.7 (164.9) (236.9) 3,446.1
Synthetic oil (mmbls)Canada 23.6 – – – (1.0) 22.6
Proved 23.6 – – – (1.0) 22.6Probable 36.3 – – – – 36.3Total 59.9 – – – (1.0) 58.9
Sulphur (millions of tons)Canada 2.9 0.4 – (0.1) (0.4) 2.8
Proved 2.9 0.4 – (0.1) (0.4) 2.8Probable 1.3 0.1 – (0.4) – 1.0Total 4.2 0.5 – (0.5) (0.4) 3.8
Proved Reserves Continuity1992 1993 1994 1995 1996
Oil and liquids (mmbls)Opening balance 39.8 40.5 95.0 167.8 167.9
Discoveries, additions and extensions 2.8 11.0 8.8 15.4 33.8Net purchase and sales 0.3 53.8 69.9 0.9 35.6Net revisions and transfers 3.6 (0.3) 12.2 11.2 24.3Production (6.0) (10.0) (18.1) (27.4) (35.7)
Closing balance 40.5 95.0 167.8 167.9 225.9
Natural gas (bcf)Opening balance 743.1 734.7 1,267.9 1,852.1 1,901.8
Discoveries, additions and extensions 85.1 125.3 186.0 195.3 263.8Net purchase and sales (24.0) 530.1 564.1 9.5 34.3Net revisions and transfers 7.2 1.4 15.1 82.0 338.7Production (76.7) (123.6) (181.0) (237.1) (236.9)
Closing balance 734.7 1,267.9 1,852.1 1,901.8 2,301.7
BOE (mmbls) (1)
Opening balance 114.1 114.0 221.8 375.1 381.6Discoveries, additions and extensions 11.3 23.5 27.4 36.7 62.2Net purchase and sales (2.1) 106.9 146.6 1.9 42.2Net revisions and transfers 4.3 (0.2) 15.9 20.7 81.6Production (13.6) (22.4) (36.6) (52.8) (61.5)
Closing balance 114.0 221.8 375.1 381.6 506.1
(1) Gas converted at 10:1 for Canada and 6:1 for International.
Brought to you by Global Reports

65
TA L IS M A N E N E R G Y I N C .
Five Year F inding and Development Costs1992 1993 1994 1995 1996 3-year 5-year
Proved reserves additions (1)
Canada liquids (mmbls) 6.4 10.5 14.8 14.4 24.3 53.5 70.4gas (bcf) 92.3 126.7 167.7 231.8 219.2 618.7 837.7
Canada (mmboe) 15.6 23.2 31.6 37.5 46.2 115.3 154.2International liquids (mmbls) – 0.2 6.2 12.2 33.7 52.2 52.4
gas (bcf) – – 33.4 45.5 383.4 462.3 462.3International (mmboe) – 0.2 11.7 19.8 97.6 129.2 129.4Total liquids (mmbls) 6.4 10.7 21.0 26.6 58.0 105.6 122.7
gas (bcf) 92.3 126.7 201.1 277.3 602.6 1,081.0 1,300.0Total (mmboe) 15.6 23.4 43.3 57.4 143.8 244.5 283.6
Proved net acquisitions (2)
Canada (mmboe) (2.1) 106.9 32.5 1.9 0.1 34.5 139.2International (mmboe) – – 114.0 – 42.2 156.1 156.1Total (2.1) 106.9 146.5 1.9 42.3 190.7 295.5
Capital spending (millions of dollars)Canada (3)
Exploration 16.4 39.2 90.1 80.1 82.9 253.0 308.6Development 24.2 64.9 144.7 149.4 228.3 522.4 611.6Total 40.6 104.1 234.8 229.5 311.2 775.4 920.2
International (3)
Exploration – 14.6 36.2 53.1 62.5 151.8 166.4Development – 20.3 33.2 76.6 153.0 262.8 283.1Total – 34.9 69.4 129.7 215.5 414.6 449.5
Total exploration and developmentExploration 16.4 53.8 126.3 133.1 145.4 404.8 475.0Development 24.2 85.2 177.9 226.1 381.3 785.2 894.7Total 40.6 139.0 304.2 359.2 526.7 1,190.0 1,369.7
Net acquisitions and divestitures (4) (4.7) 519.0 1,724.2 7.1 505.9 2,237.2 2,751.5Total capital 35.9 658.0 2,028.4 366.3 1,032.6 3,427.2 4,121.2
Proved finding and development costs ($/boe)Canada 2.60 4.49 7.43 6.11 6.73 6.72 5.97International – 174.34 5.91 6.54 2.21 3.21 3.47Total 2.60 5.95 7.02 6.26 3.66 4.87 4.83
Proved finding, development and acquisition costs ($/boe)Canada 2.65 4.79 8.91 5.65 6.51 7.31 5.98International – 174.34 11.59 7.23 5.23 8.17 8.29Total 2.65 5.05 10.69 6.18 5.55 7.88 7.12
(1) Proved discoveries and revisions only, excluding acquisitions, conventional oil only.(2) Reserve purchases less dispositions, includes asset sales, dispositions, swaps and corporate acquisitions.(3) Exploration and development spending excludes indirect exploration expenses, Syncrude, enhanced oil recovery, Chauvin pipeline and
capitalized interest.(4) Corporate and property acquisitions less dispositions.
Gas converted at 10:1 for Canada and 6:1 for International.
Brought to you by Global Reports
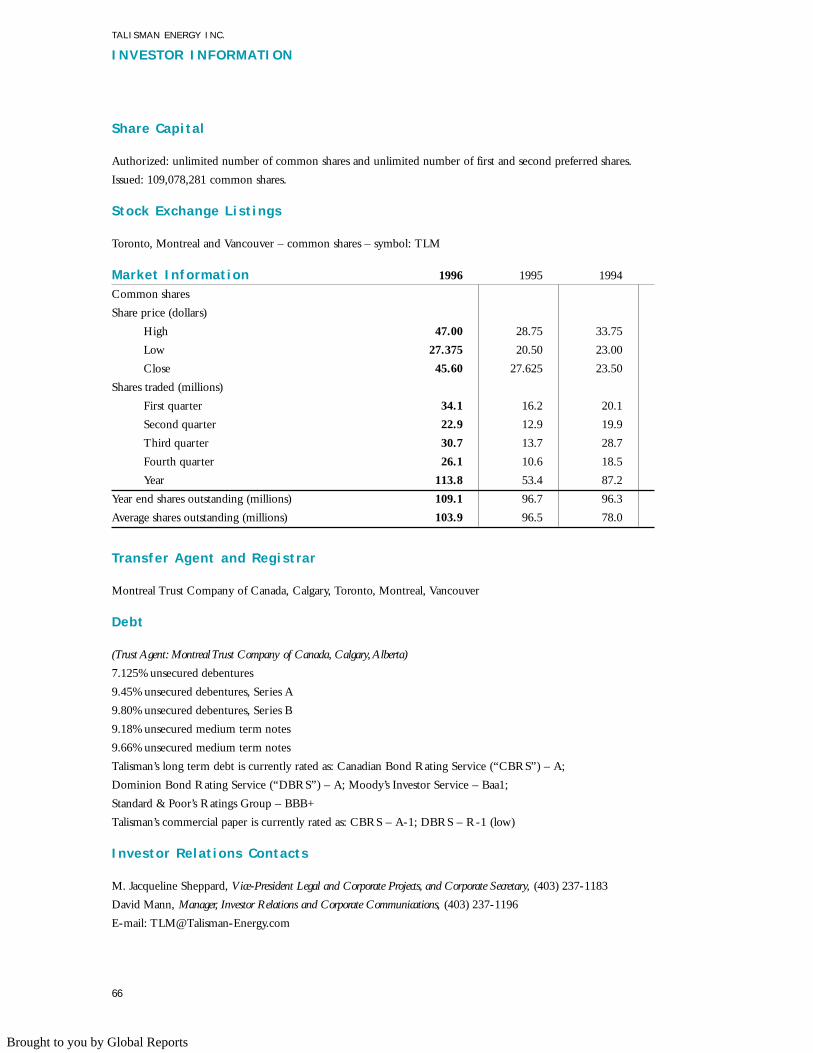
66
TA L IS M A N E N E R G Y I N C .
I N V E S T O R I N F O R M AT I O N
Share Capita l
Authorized: unlimited number of common shares and unlimited number of first and second preferred shares.
Issued: 109,078,281 common shares.
Stock Exchange List ings
Toronto, Montreal and Vancouver – common shares – symbol: TLM
Market Information 1996 1995 1994
Common shares
Share price (dollars)
High 47.00 28.75 33.75
Low 27.375 20.50 23.00
Close 45.60 27.625 23.50
Shares traded (millions)
First quarter 34.1 16.2 20.1
Second quarter 22.9 12.9 19.9
Third quarter 30.7 13.7 28.7
Fourth quarter 26.1 10.6 18.5
Year 113.8 53.4 87.2
Year end shares outstanding (millions) 109.1 96.7 96.3
Average shares outstanding (millions) 103.9 96.5 78.0
Transfer Agent and Registrar
Montreal Trust Company of Canada, Calgary, Toronto, Montreal, Vancouver
Debt
(Trust Agent: Montreal Trust Company of Canada, Calgary,Alberta)
7.125% unsecured debentures
9.45% unsecured debentures, Series A
9.80% unsecured debentures, Series B
9.18% unsecured medium term notes
9.66% unsecured medium term notes
Talisman’s long term debt is currently rated as: Canadian Bond Rating Service (“CBRS”) – A;
Dominion Bond Rating Service (“DBRS”) – A; Moody’s Investor Service – Baa1;
Standard & Poor’s Ratings Group – BBB+
Talisman’s commercial paper is currently rated as: CBRS – A-1; DBRS – R-1 (low)
Investor Relat ions Contacts
M. Jacqueline Sheppard, Vice-President Legal and Corporate Projects, and Corporate Secretary, (403) 237-1183
David Mann, Manager, Investor Relations and Corporate Communications, (403) 237-1196
E-mail: [email protected]
Brought to you by Global Reports

67
TA L IS M A N E N E R G Y I N C .
D I R E C T O R S A N D E X E C U T I V E
Board o f Directors
Peter N.T. Widdrington (1,3,5)
London, Ontario
Chairman,Talisman Energy Inc.
Donald J. Anderson (3,4)
Calgary
Robert A. Bandeen, O.C.,(3,5)
Toronto
Chairman & President, Cluny Corporation
Roy F. Bennett (4,5)
Etobicoke
Chairman, Bennecon Limited
James W. Buckee (1,4)
Calgary
President and Chief Executive Officer,
Talisman Energy Inc.
Clement W. Dumett (1,2,4)
Calgary
Corporate Director
Dale G. Parker (2,5)
Vancouver
President & Chief Executive Officer,
Workers’ Compensation Board of British Columbia
Stella M. Thompson (2,3)
Calgary
Principal, Governance West Inc.
President, Stellar Energy Ltd.
Margaret K. Witte (1,2)
Medina,Washington
Chairman, President & Chief Executive Officer,
Royal Oak Mines Inc.
Executive
James W. Buckee
President and Chief Executive Officer
Edward W. Bogle
Vice-President,
Exploration
T. Nigel D. Hares
Vice-President,
Frontier and International Operations
Joseph E. Horler
Vice-President,
Marketing
Robert W. Mitchell
Vice-President,
Canadian Operations
Robert M. Redgate
Vice-President,
Human Resources and Corporate Services
M. Jaqueline Sheppard
Vice-President, Legal and Corporate
Projects, and Corporate Secretary
Bruce G. Waterman
Vice-President, Finance
and Chief Financial Officer
(1) Member of Executive Committee(2) Member of Audit Committee(3) Member of Management Succession and Compensation Committee(4) Member of Pension Funds Committee(5) Member of Governance and Nominating Committee
Brought to you by Global Reports

68
TA L IS M A N E N E R G Y I N C .
C O R P O R AT E I N F O R M AT I O N
Executive Off ice
Talisman Energy Inc.
2400, 855 - 2 Street S.W.
Calgary, Alberta, Canada T2P 4J9
Telephone: (403) 237-1234
Facsimile: (403) 237-1902
Selected Subsidiar ies
Talisman Energy (UK) Limited
Belmont House
1 Berry Street
Aberdeen AB1 1DL
Scotland
Telephone: (122) 441-3200
Facsimile: (122) 441-3400
Talisman (Asia) Limited
Setiabudi Atrium Office, Suite 802
Jl. H.R. Rasuna Said Kav.62
Jakarta, 12920, Indonesia
Telephone: (021) 521-0650
Facsimile: (021) 521-0660
Annual Meeting
The annual meeting of shareholders of Talisman
Energy Inc. will be held at 11:00 a.m. on
Wednesday, May 7, 1997 in the Crystal Ballroom of
the Palliser Hotel, 133 - 9th Avenue S.W.,
Calgary, Alberta. Shareholders are encouraged to
attend the meeting, but those who are unable to do
so are requested to sign and return the form of proxy
mailed with this report.
Abbreviat ions
bbls – barrels
bbls/d – barrels per day
mbbls/d – thousands of barrels per day
mmbls – million barrels
boe – barrels of oil equivalent
mmboe – million barrels of oil equivalent
mcf – thousand cubic feet
mmcf – million cubic feet
bcf – billion cubic feet
liquids – natural gas liquids
Bow Valley – Bow Valley Energy Inc.
Encor – Encor Inc.
OPEC – Organization of Petroleum
Exporting Countries
WTI – West Texas Intermediate
LIBOR – London Interbank Offered Rate
Goal – Goal Petroleum plc
2-D – Two-dimensional
3-D – Three-dimensional
UK – United Kingdom
US – United States of America
NYMEX – New York Mercantile Exchange
SAGE – Scottish Area Gas Evacuation
EAGLES – East Anglia Gas and Liquids
Evacuation System
Talisman – “Talisman Energy Inc.” or the
“Company” includes subsidiaries
of Talisman
Conversion & Equivalency Factors
Imperial Metric
1 ton = .907 tonnes
1 acre = .40 hectares
1 barrel = .159 cubic metres
1 cubic foot = .0282 cubic metres
Barrels of oil equivalent have been
calculated on the basis of:
domestic gas – 10 mcf = 1 boe
International gas – 6 mcf = 1 boe
Brought to you by Global Reports
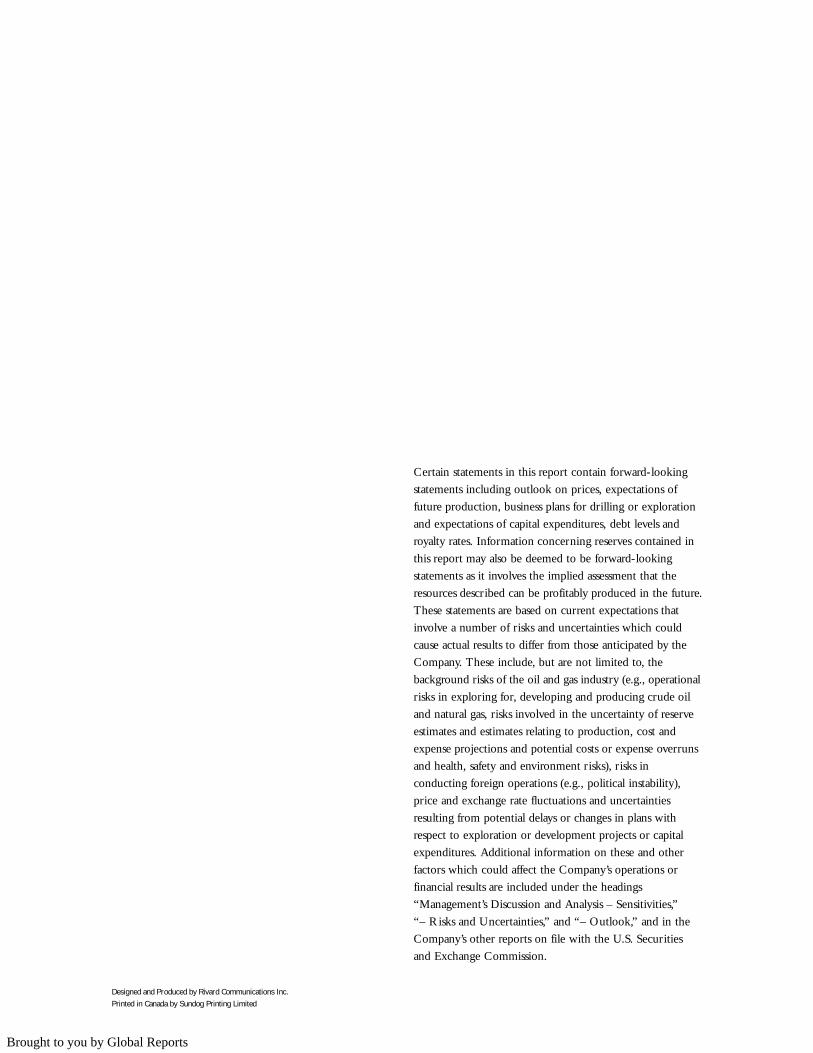
Designed and Produced by Rivard Communications Inc.Printed in Canada by Sundog Printing Limited
Certain statements in this report contain forward-looking
statements including outlook on prices, expectations of
future production, business plans for drilling or exploration
and expectations of capital expenditures, debt levels and
royalty rates. Information concerning reserves contained in
this report may also be deemed to be forward-looking
statements as it involves the implied assessment that the
resources described can be profitably produced in the future.
These statements are based on current expectations that
involve a number of risks and uncertainties which could
cause actual results to differ from those anticipated by the
Company. These include, but are not limited to, the
background risks of the oil and gas industry (e.g., operational
risks in exploring for, developing and producing crude oil
and natural gas, risks involved in the uncertainty of reserve
estimates and estimates relating to production, cost and
expense projections and potential costs or expense overruns
and health, safety and environment risks), risks in
conducting foreign operations (e.g., political instability),
price and exchange rate fluctuations and uncertainties
resulting from potential delays or changes in plans with
respect to exploration or development projects or capital
expenditures. Additional information on these and other
factors which could affect the Company’s operations or
financial results are included under the headings
“Management’s Discussion and Analysis – Sensitivities,”
“– Risks and Uncertainties,” and “– Outlook,” and in the
Company’s other reports on file with the U.S. Securities
and Exchange Commission.
Brought to you by Global Reports
![RENAULT TALISMAN [2016+] 31110 RENAULT TALISMAN … · 31110 1.0 28/09/2018 2 31110 renault talisman renault talisman grandtour [2016+] [2016+] type rfd kg s = 100 e3 55r-01 7907](https://img.pdfslide.us/doc/110x75/5ed0802b8862292f7d0cdc2a/renault-talisman-2016-31110-renault-talisman-31110-10-28092018-2-31110-renault.jpg)


![The Talisman [1959]](https://img.pdfslide.us/doc/110x75/629e7533fc0e2a31bf33ff35/the-talisman-1959.jpg)