Embed Size (px)
Citation preview

Atmos. Chem. Phys. Discuss., 7, 5173–5251, 2007www.atmos-chem-phys-discuss.net/7/5173/2007/© Author(s) 2007. This work is licensedunder a Creative Commons License.
AtmosphericChemistry
and PhysicsDiscussions
Validation of MIPAS HNO3 operationaldataD. Y. Wang1,2, M. Hopfner1, C. E. Blom1, W. E. Ward2, H. Fischer1,T. Blumenstock1, F. Hase1, C. Keim1, G. Y. Liu1, S. Mikuteit1, H. Oelhaf1,G. Wetzel1, U. Cortesi3, F. Mencaraglia3, G. Bianchini3, G. Redaelli4, M. Pirre5,V. Catoire5, N. Huret5, C. Vigouroux6, M. De Maziere6, E. Mahieu7, P. Demoulin7,S. Wood8, D. Smale8, N. Jones9, H. Nakajima10, T. Sugita10, J. Urban11,D. Murtagh11, C. D. Boone12, P. F. Bernath12,13, K. A. Walker12,14,J. Kuttippurath15,16, A. Kleinbohl15,18, G. Toon18, and C. Piccolo19
1Forschungszentrum Karlsruhe und Universitat Karlsruhe, Institut fur Meteorologie undKlimaforschung (IMK), Karlsruhe, Germany2Physics Department, University of New Brunswick, Fredericton, New Brunswick, Canada3Istituto di Fisica Applicata “N. Carrara” (IFAC) del Consiglio Nazionale delle Ricerche (CNR),Firenze, Italy4CETEMPS, Universita’ di L’Aquila, Dipartimento di Fisica, L’Aquila, Italy5Laboratoire de Physique et Chimie de l’Environnement, Universite d’Orleans (LPCE-CNRS),Orleans, France6Belgian Institute for Space Aeronomy (BIRA-IASB), Brussels, Belgium7Institut d’Astrophysique et de Geophysique, University of Liege (ULg), Liege, Belgium8National Institute for Water and Atmospheric Research (NIWA), Lauder, Otago, New Zeland
5173
9University of Wollongong, Wollongong, Australia10National Institute for Environmental Studies, Tsukuba, Japan11Chalmers University of Technology, Department of Radio and Space Science, Goteborg,Sweden12Department of Chemistry, University of Waterloo, Waterloo, Ontario, Canada13Department of Chemistry, University of York, Heslington, York, UK14Department of Physics, University of Toronto, Toronto, Canada15Institute of Environmental Physics, University of Bremen, Bremen, Germany16CNRS/LMD Ecole Polytechnique, Palaiseau Cedex, France18Jet Propulsion Laboratory, California Institute of Technology, Pasadena, California, USA19Department of Physics, Oxford University, Oxford, UK
Received: 29 March 2007 – Accepted: 5 April 2007 – Published: 17 April 2007
Correspondence to: D. Y. Wang ([email protected])
5174

Abstract
Nitric acid (HNO3) is one of the key products that are operationally retrieved by the Eu-ropean Space Agency (ESA) from the emission spectra measured by the Michelson In-terferometer for Passive Atmospheric Sounding (MIPAS) onboard ENVISAT. The prod-uct version 4.61/4.62 for the observation period between July 2002 and March 20045
is validated by comparisons with a number of independent observations from ground-based stations, aircraft/balloon campaigns, and satellites. Individual HNO3 profilesof the ESA MIPAS level-2 product show good agreement with those of MIPAS-B andMIPAS-STR (the balloon and aircraft version of MIPAS, respectively), and the balloon-borne infrared spectrometers MkIV and SPIRALE, mostly matching the reference data10
within the combined instrument error bars. In most cases differences between the cor-relative measurement pairs are less than 1 ppbv (5–10%) throughout the entire altituderange up to about 38 km (∼6 hPa), and below 0.5 ppbv (15–20% or more) above 30 km(∼17 hPa). However, differences up to 4 ppbv compared to MkIV have been found athigh latitudes in December 2002 in the presence of polar stratospheric clouds. The15
degree of consistency is further largely affected by the temporal and spatial coinci-dence, and differences of 2 ppbv may be observed between 22 and 26 km (∼50 and30 hPa) at high latitudes near the vortex boundary, due to large horizontal inhomo-geneity of HNO3. Similar features are also observed in the mean differences of theMIPAS ESA HNO3 VMRs with respect to the ground-based FTIR measurements at20
five stations, aircraft-based SAFIRE-A and ASUR, and the balloon campaign IBEX.The mean relative differences between the MIPAS and FTIR HNO3 partial columnsare within ±2%, comparable to the MIPAS systematic error of ∼2%. For the verticalprofiles, the biases between the MIPAS and FTIR data are generally below 10% in thealtitudes of 10 to 30 km. The MIPAS and SAFIRE HNO3 data generally match within25
their total error bars for the mid and high latitude flights, despite the larger atmosphericinhomogeneities that characterize the measurement scenario at higher latitudes. TheMIPAS and ASUR comparison reveals generally good agreements better than 10–13%
5175
at 20–34 km. The MIPAS and IBEX measurements agree reasonably well (mean rel-ative differences within ±15%) between 17 and 32 km. Statistical comparisons of theMIPAS profiles correlated with those of Odin/SMR, ILAS-II, and ACE-FTS generallyshow good consistency. The mean differences averaged over individual latitude bandsor all bands are within the combined instrument errors, and generally within 1, 0.5,5
and 0.3 ppbv between 10 and 40 km (∼260 and 4.5 hPa) for Odin/SMR, ILAS-II, andACE-FTS, respectively. The standard deviations of the differences are between 1 to2 ppbv. The standard deviations for the satellite comparisons and for almost all othercomparisons are generally larger than the estimated measurement uncertainty. This isassociated with the temporal and spatial coincidence error and the horizontal smooth-10
ing error which are not taken into account in our error budget. Both errors becomelarge when the spatial variability of the target molecule is high.
1 Introduction
Space-based measurements are essential for monitoring the behaviour and trends ofchemical species in the atmosphere since a global set of simultaneously derived atmo-15
spheric parameters can be obtained. Nitric acid (HNO3) is formed in the atmosphereeither by gas phase reaction (Austin et al., 1986) and ion cluster reactions (Bohringeret al., 1983) or, less probable in the higher stratosphere, by heterogeneous reactionson sulphate aerosols (de Zafra et al., 2001). Early HNO3 observations from spacewere performed by the Atmospheric Trace Molecule Spectroscopy (ATMOS) experi-20
ment in a series of Space Shuttle-based missions during 1985 to 1994 (Gunson et al.,1996; Abrams et al., 1996). The existence of HNO3 is found to be a key component inthe photochemistry of stratospheric ozone destruction through its role in the formationof Type I Polar Stratospheric Clouds (PSCs) and as a main reservoir for the reactivenitrogen oxides (World Meteorological Organization, 2003). The global distributions25
of HNO3 concentration have been measured from satellite observations, such as theLimb Infrared Monitor of the Stratosphere (LIMS) instrument, mounted on the Nimbus-
5176
7 satellite (Gille and Russell, 1984), the Cryogenic Limb Array Etalon Spectrometer(CLAES) (Kumer et al., 1996) and the Microwave Limb Sounder (MLS) onboard theUpper Atmosphere Research Satellite (UARS) (Santee et al., 1999 and Santee et al.,2004) and on Aura (Santee et al., 2005), the Improved Limb Atmospheric Spectrometer(ILAS) onboard the Advanced Earth Observing Satellite (ADEOS) (Koike et al., 20005
and Irie et al., 2002) and ILAS-II on ADEOS-II (Irie et al., 2006), and the Sub-MillimetreRadiometer (SMR) on Odin (Murtagh et al., 2002 and Urban et al., 2005), as well asthe high-resolution Fourier Transform Spectrometer (FTS) on SCISAT-1, also known asAtmospheric Chemistry Experiment (ACE) (Bernath et al., 2005).
Recent measurements of HNO3 volume mixing ratios (VMRs) in the troposphere10
and stratosphere are also provided by the Michelson Interferometer for Passive Atmo-spheric Sounding (MIPAS) (Fischer et al., 1996 and European Space Agency, 2000)onboard the ENVISAT satellite. The instrument is a high resolution Fourier transformspectrometer and measures vertical profiles of temperature and various gas species bylimb observations of mid-infrared emissions. The operational Level 1B and level 2 data15
have been produced by ESA using the operational retrieval algorithm (Raspollini et al.,2006 and Carli et al., 2004). The updated ESA version 4.61 HNO3 data have been val-idated successfully against balloon-borne, aircraft and ground-based measurements(Oelhaf et al., 2004), though the reported validation cases have been confined to there-analyzed operational MIPAS data almost only for the year 2002 and to mid-latitudes.20
Generally, the MIPAS HNO3 operational profiles being processed with v4.61 are ingood agreement with airborne observations in all cases with a good coincidence intime and space between the MIPAS observations and the correlative measurements,with negative deviations from correlative field campaign data of less than 0.5 ppbv be-tween 30 and 4 hPa, and positive deviations of less than 1 ppbv at lower altitudes.25
The ESA MIPAS HNO3 profiles are also validated by comparison with the measure-ments from the far Infrared Balloon Experiment (IBEX) (Mencaraglia et al., 2006), andan agreement of ±5% is obtained in the altitudes between 15 and 70 hPa. Recently,Vigouroux et al. (2007) compared the ESA MIPAS HNO3 profiles with regular ground-
5177
based Fourier Transform InfraRed (FTIR) measurements for the year 2003 at 5 sta-tions in both hemispheres, i.e. Jungfraujoch (46.5◦ N) and Kiruna (68◦ N), Wollongong(34◦ S), Lauder (45◦ S), and Arrival Heights (78◦ S). After making some corrections totake into account the known bias due to the use of different spectroscopic parame-ters, the comparisons of HNO3 partial columns show biases below 3% and standard5
deviations below 15% for all the stations except Arrival Heights (bias of 5%, standarddeviation of 21%). The results at this latter station, where HNO3 has a larger spa-tial variability, highlight the necessity of defining appropriate collocation criteria and ofaccounting for the spread of the observed airmasses.
Complementary to the ESA operational data products, there are six different off-line10
data processors at five institutions for science-oriented data analysis of the high res-olution limb viewing infrared spectra (von Clarmann et al., 2003a). The HNO3 VMRprofiles produced by the MIPAS data processor developed at the Institut fur Meteo-rologie und Klimaforschung (IMK) and complemented by the component of non-localthermodynamic equilibrium (non-LTE) treatment from the Instituto de Astrofısica de An-15
dalucıa (IAA) have been validated by Mengistu Tsidu et al. (2005), Stiller et al. (2005),and Wang et al. (2007). The ESA operational HNO3 data are also compared withthe IMK-IAA profiles taken on 42 days between September 2002 and December 2003(Wang et al., 2007) and covering the whole latitude range of MIPAS. The MIPAS ESAand IMK-IAA HNO3 datasets generally show good consistency. The global mean dif-20
ferences between 200 and 1 hPa are less than 0.3 ppbv with a standard deviation of∼0.5 ppbv. The global means have a high bias (IMK-IAA being higher than ESA) of0.1 ppbv between 30 and 2 hPa, and a low bias of less than 0.3 ppbv at lower alti-tudes. A large negative bias of 0.6 ppbv is observed at 1 hPa around 30◦ S and 60◦ S.The characteristic shape of the difference profile indicates an altitude shift between the25
ESA and IMK-IAA retrievals. That obviously does not only depend on pressure andaltitude representations, but reflects a small systematic effect.
Increasing amount and enhanced diversity of MIPAS HNO3 products demand foreven increased efforts in validation. A validation meeting was held on 29–30 Novem-
5178
ber 2005 at Karlsruhe, Germany, to coordinate the activities. The validation data setshave been reprocessed after the meeting so the results are different from those re-ported in the previous documents (e.g. Vigouroux et al., 2007). This study focuseson the validation of the ESA operational HNO3 data version 4.61/4.62 and, in partic-ular, on the comparisons with other coincident satellite observations for cross check.5
The profiles of the ESA-retrieved MIPAS operational HNO3 data are compared with1) the ground-based FTIR measurements at five stations at mid and high latitudes ofboth hemispheres (Sect. 4); 2) the MIPAS STRatospheric (MIPAS-STR) (aircraft-basedversion of MIPAS) measurements and the Spectroscopy of the Atmosphere by usingFar-InfraRed Emission - Airborne (SAFIRE-A) measurements (Sect. 5.1), as well as10
the Airborne Sub-millimetre Radiometer (ASUR) observations (Sect. 5.2); 3) field cam-paign data obtained from the balloon-borne version of MIPAS (MIPAS-B, Sect. 6.1),the infrared spectrometer MkIV (Sect. 6.2), the tunable diode laser instrument SPI-RALE (Spectrometre Infra Rouge pour l’etude de l’Atmosphere par diodes Laser Em-barquees, Sect. 6.3), and the Infrared Balloon Experiment (IBEX, Sect. 6.4); and 4)15
other satellite observations, such as from the SMR instrument on Odin (Sect. 7.1),from ILAS-II on ADEOS-II (Sect. 7.2), as well as from the FTS on ACE (Sect. 7.3). Thecharacteristics of the ESA MIPAS data are outlined in Sect. 2, while our comparisonmethod is described in Sect. 3. The reference data sets and their comparison resultswith the MIPAS data are presented in Sects. 4 to 7. Our conclusions are contained in20
Sect. 8.
2 The MIPAS operational data
Data to be validated here are the vertical profiles of abundances of HNO3 measuredby MIPAS/ENVISAT during the period July 2002 to March 2004. The data sets areversion 4.61/4.62 retrieved with the ESA operational data processor from the MIPAS25
spectra. The MIPAS observations provide global coverage with 14.4 orbits per day. Thestandard observation mode covers nominal tangent altitudes in a scanning sequence
5179
from the top 68 km down to 60, 52, and 47 km, and between 42 and 6 km at a stepwidth of ∼3 km. The horizontal sampling interval is ∼500 km along-track and ∼2800 kmacross-track at the equator. The operational HNO3 profiles are retrieved based onthe most recent re-processed L1B data version 4.61/4.62, with a vertical resolution of∼3 km.5
The tangent altitudes are registered by the engineering measurements. These arebased on the satellite’s orbit and attitude control system using star tracker informationas a reference (called engineering data henceforth). The calibrated L1B spectra areanalyzed using a global fit approach (Carlotti , 1988) by varying the input parameters ofthe forward model according to a non-linear Gauss-Newton procedure. In a first step,10
temperature and pressure at the engineering tangent altitudes are retrieved simultane-ously (p, T retrieval), then the VMR profiles of the primary target species O3, H2O, CH4,N2O, HNO3 and NO2 are retrieved individually in sequence. Detailed descriptions ofthe operational retrieval algorithm have been reported by Ridolfi et al. (2000), Carli etal. (2004), and Raspollini et al. (2006).15
Details about the retrieval error budget for the ESA operational HNO3 data havebeen reported by Dudhia et al. (2002). The MIPAS noise error is the covariance ma-trix given in the MIPAS level 2 operational products. We have taken the systematicerrors from the Oxford web page (www.atm.ox.ac.uk/group/mipas/err). The error anal-ysis for the nominal sets of microwindows used in both Near Real Time (NRT) and20
Off-Line (OFL) processing in normal MIPAS operations has been evaluated for 5 dif-ferent atmospheric conditions, i.e. mid-latitude day-time (similar to the U.S. StandardAtmosphere), mid-latitude night-time, polar summer day-time, polar winter night-time,and equatorial day-time. A global composite of results for the five atmospheres, withtwice the weight given to results from the polar winter case, is also provided. For HNO325
VMR profiles, the global random, systematic, and total errors are about 3.8%, 6.2%,and 7.3%, respectively, at 24 km altitude near the concentration peak, but increase to35–50%, 20–25%, and 40–55% at 9 km and 42 km altitudes. In the present analysis,contrary to the approach of Oxford, we have considered the PT-error as a systematic
5180
error with random variability and added this to the noise error term.
3 Comparison methods
For comparisons between individual profiles, the MIPAS and other data sets aresearched for coincident measurements. The coincidence criteria of horizontal sepa-ration less than 300 km and time difference less than 3 h are used. However, due to5
characteristics of the data sampling scenarios, other more or less restricted coinci-dence criteria have also been applied. Details will be discussed later in Sects. 4 to 7.To avoid the influence of the error in the ESA MIPAS altitude registration (von Clarmannet al., 2003b; Wang et al., 2005; Kiefer et al., 2006), the comparisons are conducted inpressure coordinates.10
When two correlative profiles with different vertical resolutions are compared, somesmall structures of the atmospheric field could be resolved by the higher resolutionmeasurement, but not by the lower one. To account for this effect, the altitude (orpressure level) resolution should be adjusted using the averaging kernels. The methodused is that described by Rodgers and Connor (2003), and its simplified application to15
our study is outlined below. Without loss of generality, the MIPAS data are assumed tohave low resolution. The correlative high-resolution profiles are interpolated to a com-mon grid, in this case to the pressure grid of the MIPAS data. The vertical resolution ofthe correlative profiles x is adjusted by applying the averaging kernel of MIPAS Amipas.Also, the correlative profiles, which are assumed to be free of a priori information, are20
transformed to the a priori xamipas that is used by the MIPAS data. Both the a priori
transformation and smoothing are done by
x = Amipasx + (I − Amipas)xamipas, (1)
where x is the result derived with the MIPAS inverse model, if x happens to be the trueprofile. More discussions about this transformation can be found in the paper of Wang25
et al. (2007).5181
The difference between the MIPAS measurement xmipas and the transformed otherprofile x is
δ = xmipas − x
= (xmipas − x) + (I − Amipas)(x − xamipas), (2)
where the negative of the last term represents the differences originated from different5
vertical resolution and a priori. These contribute to the (xmipas−x) difference, but notto δ. Thus, the residual δ is taken as proxy for the discrepancy between the twomeasurements. For the i th pair of correlative profiles, the individual elements of thedifference profile vector δi at each pressure level z will be denoted as δi (z) hereafter.The residuals δi (z) are assembled in several ways (details are described in Sects. 4 to10
7) for statistical analysis.For each ensemble, mean difference profiles ∆(z) and their standard deviations σ(z)
are calculated; σ(z) allows the precision of MIPAS profiles to be assessed. The statisti-cal uncertainty in the mean difference ∆(z) is quantified by σ(z)/N1/2, which representsthe uncertainty of ∆(z) due to random-type errors. In the case of ∆(z) being larger than15
σ(z)/N1/2, their difference is an indicator of systematic errors between the compari-
son data sets. We also compute the mean difference, standard deviation, and σ/N1/2
uncertainty averaged over pressure levels. These averaged quantities are directly eval-uated according to the statistical definitions by assembling data points available at allpressure levels.20
4 Comparisons with ground-based FTIR measurements
The ESA MIPAS operational HNO3 data v4.61 recorded in the period of 26 July 2002to 26 March 2004 were compared with the ground-based FTIR measurements at fivestations at Jungfraujoch, Switzerland (46.5◦ N, 8.0◦ E), Wollongong, Australia (34.4◦ S,150.5◦ E), Lauder, New Zealand (45.0◦ S, 169.7◦ E), Arrival Heights, Antarctica (77.5◦ S,25
5182
166.4◦ E), and Kiruna, Sweden (67.8◦ N, 20.4◦ E). These stations are part of theNDACC (Network for Detection of Atmospheric Composition Change, formerly knownas NDSC), and infrared solar absorption spectra have been recorded routinely. HNO3profiles – with low vertical resolution – are retrieved from the absorption line shapes us-ing a semi-empirical implementation of the Optimal Estimation Method (Rodgers, 1990,5
2000). At Kiruna, the retrieval is performed with the inversion code PROFFIT (PRO-File FIT) (Hase, 2000) and the forward model KOPRA (Karlsruhe Optimized PreciseRadiative transfer Algorithm) (Hopfner et al., 1998) while the other stations use theretrieval algorithm SFIT2 (Pougatchev and Rinsland, 1995; Pougatchev et al., 1995;Rinsland et al., 1998). It has been shown in Hase et al. (2004) that both algorithms10
give similar results (within 1% for HNO3 total columns amount) under similar retrievalconditions. The retrieval process, in both codes, involves the selection of retrieval pa-rameters: spectral microwindows, spectroscopic parameters, a priori information, andmodel parameters. The choice of these retrieval parameters has been optimized inde-pendently at each station. An exception was made for the spectroscopic database: all15
stations agreed in using the HITRAN2004 database in order to avoid biases due to dif-ferent spectroscopic parameters. In the HITRAN2004 database (Rothman et al., 2005)and the MIPAS database (MIPAS pf3.1 for the v4.61/4.62 products; see Raspollini etal., 2006), the HNO3 line positions and intensities, in the 11-µm region that is usedfor the retrievals, are indeed following the same improvements based on laboratory20
measurements (Flaud et al., 2003). The present work is an update of a previous val-idation paper (Vigouroux et al., 2007) where the FTIR retrievals were made using theHITRAN2000 database. A high bias of about 14% was found between MIPAS and FTIRpartial columns, which is in agreement with the differences in HNO3 line intensities inthe HITRAN2000 and MIPAS pf3.1 databases.25
The correlative measurements of FTIR and MIPAS were selected by coincidencecriterions of time difference less than 3 h and horizontal distance less than 300 kmat the MIPAS nominal tangent height of 21 km. Only at the Kiruna station have weapplied an additional coincidence criterion of potential vorticity (PV) difference smaller
5183
than 15%. The MIPAS profiles have been degraded to the lower vertical resolution ofthe ground-based FTIR measurements using the FTIR averaging kernels (see Sect. 3,but in contrast to the case described there, MIPAS profiles have a higher resolutionthan those of FTIR). The trace of the kernel matrix gives the degrees of freedom forsignal (DOFS) of the FTIR retrievals. It is quite small for the HNO3 molecule and5
depends on the retrieval parameters and the solar zenith angle. The mean value ofthe DOFS varies between 1.7 for Jungfraujoch to 2.7 for Arrival Heights. Thus, theshapes of the profile comparisons depend on the retrieval conditions, and it is moreappropriate to compare FTIR and MIPAS partial columns. The MIPAS partial columnshave been calculated from the smoothed profiles. We have evaluated the combined10
random error covariance matrix of the difference (MIPAS – FTIR) (see Vigouroux et al.,2007 for more details). The FTIR random error budget has been estimated for a typicalmeasurement at Kiruna. There are different contributions to the MIPAS random errorcovariance matrix. The error covariance matrix due to the noise is given in the MIPASlevel 2 products for each profile. We have chosen to use, as the noise contribution to15
the MIPAS random error matrix, the mean of the covariance matrices of the coincidentMIPAS profiles. Following the approach adopted for the MIPAS comparison with othersatellite measurements, we have added the systematic errors with random variabilityto the MIPAS random error budget (i.e. PT-error; see Sect. 2).
Figure 1 shows the time series of partial columns at the ground-based stations, ex-20
cept for Wollongong where only one coincidence occurs. For both instruments sea-sonal variations are captured well at the four ground-based stations Jungfraujoch,Lauder, Arrival Heights, and Kiruna. The pressure range defining the partial columnsand the numbers of coincidences for these comparisons are given in Table 1. The lowpressure limits are chosen based on the ground-based FTIR sensitivity which varies25
from station to station, and which is good up to ∼28, 32, 36, and 43 km (18, 9, 5, and2 hPa, resp.), for Jungfraujoch, Lauder, Arrival Heights, and Kiruna, respectively. Thehigh pressure limits of partial columns are determined by the lowest altitudes of theMIPAS profiles, which have a mean value of about 12 km. MIPAS profiles for which the
5184

lowest altitude is higher than 12 km have not been used for the calculation of partialcolumns. Table 1 also gives the means (M), standard deviations (STD), and the com-bined random errors and standard errors on the means (SEM) of the relative partialcolumn differences at the five stations. For calculation of mean relative differences,the mean absolute difference of (MIPAS – FTIR) has been divided by the mean FTIR5
partial column. The SEM are calculated as 3×STD/√n with n being the number of
coincidences, in order to distinguish with 99% of confidence whether the biases arestatistically significant.
As shown in Table 1, the mean relative differences between the MIPAS and FTIRHNO3 partial columns are within ±2%, and the statistical standard errors on the means10
are 6–11% for the Jungfraujoch, Arrival Heights, Lauder, and Kiruna stations. The MI-PAS systematic error for the partial columns is around 2%. Considering these factors,we can conclude that there is no statistically significant bias between the MIPAS andFTIR partial columns in the considered pressure ranges, for the Jungfraujoch, Lauder,Arrival Heights, and Kiruna stations. The statistical standard deviations of Jungfrau-15
joch, Arrival Heights, Lauder, and Kiruna stations (where the number of coincidencesis reasonable for statistical conclusions) are 13%, 11%, 5%, and 9%, respectively.These values are larger than the estimated random error of about 3% on the relativedifference of the partial columns. These large standard deviations, compared to theestimated random error, should be explained by the temporal and spatial coincidence20
errors and the horizontal smoothing error which are not taken into account in our errorbudget. Both errors become large when the spatial variability of the target molecule ishigh (see von Clarmann, 2006 and Cortesi et al., 2007). No conclusions can be drawnfor the Wollongong station because there is only one coincidence. Nevertheless, con-sidering the SEM obtained for the other stations, the observed bias at Wollongong of25
–5.7% may be assumed to be non-significant.Figure 2 displays the means and the 1-σ standard deviations of the relative differ-
ences between the ground-based FTIR and the MIPAS profiles at the five ground-basedstations. The given combined random error (shaded area) is a combination of the ran-
5185
dom error of FTIR with the noise error and the systematic error with random variabilityof MIPAS. The 3-σ standard error on the mean is also indicated to facilitate the dis-cussion of the statistical significance of the observed bias. The profile comparisonsconfirm what has been seen for the partial columns comparisons. The bias is statis-tically insignificant and below 10% at Kiruna and Jungfraujoch in the whole altitude5
range and at Arrival Heights for altitudes lower than 15 hPa.The result of Kiruna shows much smaller bias than those of Jungfraujoch, Wol-
longong, Lauder and Arrival Heights. The reason is not fully clear at the moment.The mean difference profiles show strong oscillations at Wollongong and Lauder. Oneshould remember that the DOFS of the retrieved profiles between the partial column10
limits (black solid lines) is small: it is only about 1.8 and 2.3 for Wollongong and Lauder,respectively. Therefore the detailed shape of FTIR profiles depends on the choice ofretrieval parameters. In the present exercise Lauder and Wollongong used similar re-trieval parameters. This could explain why we observe similar oscillations in the profiledifferences at these stations. Regarding the standard deviations, we can see in Fig. 2,15
that they are always larger than the combined random error, probably for the samereason than for partial column comparisons: the coincidence errors of the soundedairmasses and the horizontal smoothing errors are not taken into account in the errorbudget.
5 Comparisons with aircraft-borne Instruments20
5.1 SAFIRE-A and MIPAS-STR
SAFIRE-A (Spectroscopy of the Atmosphere by using Far-InfraRed Emission – Air-borne, IFAC-CNR, Firenze, Italy) is a high-resolution FT instrument, performing limbemission measurements in narrow bands (∼1–2 cm−1) within the far-infrared spectralregion (10–250 cm−1), as described by Bianchini et al. (2004). MIPAS-STR (MIPAS25
STRatospheric aircraft, FZK-IMK, Karlsruhe, Germany) is an aircraft version of the
5186
MIPAS satellite spectrometer and operates in the middle infrared spectral region withsimilar characteristics and performances (Piesch et al., 1996). Both instruments obtainHNO3 profiles from the upper troposphere up to the flight altitude and the total HNO3column above. SAFIRE-A mean profiles have been calculated over fixed pressure lev-els, corresponding approximately to a regular altitude grid with steps of 1.0 km. MIPAS-5
STR profiles have been retrieved on a fixed altitude grid (Hopfner et al., 2001 and Keimet al., 2004). Their vertical resolution (approximately 1–2 km) is slightly better, but stillcomparable with the one of MIPAS ESA operational v4.61/v4.62 data. Therefore, thedata are directly compared with the satellite measurements without correcting for thevertical smoothing effects.10
The error budget estimates are reported for both instruments. For a single profile,the random errors for MIPAS-STR and SAFIRE-A are between 4 and 2% (1σ). Thesystematic error in MIPAS-STR profiles is about 6%, mainly due to temperature used toobtain the trace gases. No HITRAN error is considered for MIPAS-STR since the samespectral bands are used as in case of MIPAS/ENVISAT. The estimate of the systematic15
error in the SAFIRE-A profiles takes into account the contribution of the assumed (notretrieved from the measurements) pressure and temperature profile (∼2%) and thespectroscopic error (∼5% as an upper limit and a better estimate around 2%). Effectssuch as non-LTE, uncertainties in the pointing of the instrument, horizontal atmosphericinhomogeneity along the line of sight can cause further errors, which were considered20
of minor importance.The two FT spectrometers flew aboard the M-55 Geophysica stratospheric high alti-
tude aircraft. A total of 11 flights and about 45 flight hours was performed for the vali-dation of the ENVISAT chemistry payload in the frame of the 2002–2003 ESABC (EN-VISAT Stratospheric Aircraft and Balloon Campaign) field campaigns at mid-latitude25
(Forlı, Italy, July and October 2002) and in the Arctic region (Kiruna, Sweden, February-March 2003), as reported in details by Cortesi et al. (2004). Figures 3 and 4 show theSAFIRE observation configurations for two flights on 24 October 2002 and 2 March2003, respectively. The aircraft measurements conducted in the polar region (Fig. 4
5187
aimed at validating MIPAS/ENVISAT products in presence of strong vertical and hor-izontal gradients; consequently, the corresponding datasets (February-March 2003data) generally includes data acquired at the border of the polar vortex, with vertical andhorizontal inhomogeneities much larger than those encountered at mid-latitude (Julyand October 2002 data). To avoid strong gradients along the line of sight of the remote5
sensing instruments, which decrease the quality of the measured profiles, the flightswere planned with long north-south legs. The aircraft measurements have been per-formed in west-east direction, while the MIPAS/ENVISAT measured north-south alongthe gradients.
Using these data, multiple coincidences can be identified – based on the matching10
criteria (∆s <300 km, ∆t <3 h) – between MIPAS/ENVISAT and the remote sensingand in situ aircraft observations, thus obtaining a comprehensive set of collocatedHNO3 profiles to be considered for validation purposes. We have selected a subsetof the above comparison pairs by choosing, for each MIPAS/ENVISAT scan, the HNO3profiles measured with the best spatial and temporal coincidence by SAFIRE-A and15
MIPAS-STR. The resulting validation data sets have very high quality coincidences,both in the spatial and in the temporal domain, as listed in Tables 2 and 3 for SAFIREand in Table 4 for MIPAS-STR during three high latitude campaigns at Kiruna, Swedenon 28 February, 2 March, and 12 March of year 2003 .
Results of the comparison between MIPAS/ENVISAT HNO3 profiles and the20
SAFIRE-A correlative measurements obtained during northern mid-latitude flights(Forlı, Italy, 24 October 2002 ) and during the Arctic campaign (Kiruna, Sweden, 2March 2003) are shown in Figs. 5 and 6, respectively. Each plot displays the HNO3vertical distribution retrieved by MIPAS/ENVISAT for one of the selected overpasses,which is compared with the mean VMR profile of SAFIRE-A obtained by averaging25
over all the limb scanning sequences collocated with the selected satellite overpass.The comparisons cover the altitude range between ∼25 km (slightly above the maxi-mum flight altitude) and MIPAS/ENVISAT lowest tangent altitude. The error bars onMIPAS/ENVISAT, and SAFIRE-A profiles indicate the total uncertainty on the corre-
5188

sponding HNO3 values.Very good agreement is found at mid-latitude (Fig. 5). The SAFIRE HNO3 measure-
ments and satellite data are generally matched within their total error bars. The onlyexception is the profile of MIPAS/ENVISAT orbit 3402/scan 16, that compared with asingle profile of SAFIRE. Reasonably good results are found, on the other hand, also5
from the comparison of the SAFIRE HNO3 profiles from the Arctic flight Fig. 6, despitethe larger atmospheric inhomogeneities that characterize the measurement scenario athigher latitudes. The occurrence of strong vertical gradients is highlighted in the com-parison with in situ measurements (see, for instance, the profile of MIPAS/ENVISATorbit 5250/scan 21) and can account for the observed differences with remote-sensing10
data, whilst horizontal gradients encountered at the border of the polar vortex mightat least partially justify the discrepancy in HNO3 values retrieved by the airborne andsatellite limb-sounders.
Comparisons between MIPAS/ENVISAT and MIPAS-STR also show very goodagreement at the northern mid latitude campaigns, as shown in Fig. 7 for three MI-15
PAS measurements. The reason for the profile measured at 09:19 UTC (blue line)being too high might be a strong N-S gradient of HNO3 VMRs as indicated by theMIPAS/ENVISAT observations. Results of the comparisons between MIPAS/ENVISATHNO3 profiles and the MIPAS-STR correlative measurements obtained during the threeArctic campaigns at Kiruna on 28 February, 2 March and 12 March in 2003 are shown20
in Figs. 8 to 10, respectively. Also shown in these figures are flight routes and obser-vation configurations (top panels) of each campaign. The HNO3 vertical distributionretrieved by MIPAS/ENVISAT for one of the selected overpasses has been comparedwith the single VMR profile of MIPAS-STR collocated with the selected satellite over-pass. We can notice from Figs. 8 to 10 that MIPAS/ENVISAT normally tends to be25
in a very good agreement with MIPAS-STR and only occasionally to show somewhatlarge differences, mostly in terms of a slight overestimate of the HNO3 VMR. The lattertrend is more pronounced in comparison with SAFIRE-A mean profiles, that are almostconstantly lower MIPAS/ENVISAT HNO3 values.
5189
The observed differences could be explained by the fact that the selected collocatedHNO3 profiles, satisfying the spatial and temporal coincidence criteria, can sample dif-ferent air masses across a region of strong horizontal (and vertical) gradients. Forinstance, as displayed in Fig. 9 for the potential vorticity field on the isentropic sur-face Θ = 400 K (approximately 16 km) in the region covered by the M-55 flight on 25
March 2003, the geolocation of the collocated measurements from MIPAS/ENVISAT(UT =20:37) and MIPAS-STR (UT = 22:08) mostly overlaps on a region with PV valuesof about (15±1) pvu. In contrast, as seen in Fig. 4, the same MIPAS/ENVISAT scan(orbit 5250 – scan 21) was compared with the mean SAFIRE profile averaged overscans 21–24, which cover a more extended area including air masses with PV values10
as low as ∼11 pvu. Correspondingly, we observe matching HNO3 values retrieved at16 km by MIPAS/ENVISAT and MIPAS-STR with differences less than 0.5 ppbv (Fig. 9),but significantly lower (by 3 ppbv) HNO3 VMR measured by SAFIRE-A (Fig. 6). Simi-lar checks have been performed using different combinations of coincident data, andconfirmed that a significant difference between simultaneous HNO3 measurements of15
MIPAS/ENVISAT and one of the M-55 Geophysica sensors is mostly due to samplingof different air masses across a region of strong horizontal (and vertical) gradients.
5.2 ASUR
The Airborne Submillimeter Radiometer (ASUR) is a passive heterodyne sensor thatoperates in a tunable frequency range of 604.3−662.3 GHz (Mees et al., 1995 and20
von Konig et al., 2000) The receiver carries two spectrometers, an Acousto OpticalSpectrometer (AOS) and a Chirp Transform Spectrometer (CTS). Stratospheric mea-surements with the AOS are analyzed for this comparison study. The total bandwidthof the AOS is 1.5 GHz and its resolution is 1.27 MHz. The observations are performedonboard a research aircraft to avoid signal absorption due to tropospheric water vapor.25
The instrument looks upward at a constant zenith angle of 78◦. Thermal emissions fromthe rotational states of the molecule (a rotational line band at 606.8 GHz for HNO3) aredetected by the sensor and the shape of the pressure broadened lines can be related
5190
to its vertical distribution. The measured single spectra are integrated over 90 s to ob-tain a sufficient signal-noise-ratio. The horizontal resolution of the profile is ∼20 km,which depends on the aircraft speed and the integration time. The vertical profiles areretrieved on a 2 km grid applying the optimal estimation method (Rodgers, 1976). Alti-tude resolution of the HNO3measurement is 6–10 km in the lower stratosphere and the5
vertical range is 14–35 km (16–32 km for the tropical measurements). The precision ofa typical measurement is 0.3 ppb and the estimated accuracy is about 0.6 ppb or 15%,whichever is higher (Kleinbohl et al., 2003 and von Konig et al., 2002). Further detailsabout the ASUR HNO3 retrieval is given in (Kuttippurath , 2005).
The ASUR HNO3 measurements during the SCIAVALUE (Sciamachy Validation and10
Utilization Experiment) (Fix et al., 2005) and EuPLEx (European Polar Leewave Experi-ment) (Kleinbohl et al., 2005) campaign are taken for the comparison with MIPAS v4.61data. The predefined criterion that the airborne measurements must be within 300 kmand 3 h of the satellite observations is considered for the validation analysis. However,since the number of collocated measurements were too small (23 coincidences) to15
make a statistically significant analysis. Another more relaxed criterion, ∼1000 km andwithin ±12 h, is also chosen for the intercomparisons. This criterion resulted in a totalof 768 collocated measurements from 15 ASUR measurement flights in September2002, and in January, February, and March 2003. The date and flight track of thesecollocated measurements are given in Table 5.20
The MIPAS HNO3 VMRs are convolved with the ASUR HNO3 averaging kernels toaccount for lower vertical resolution of the ASUR profiles. The differences (∆VMR= MIPAS VMR −ASUR VMR) are calculated from the individual MIPAS and ASURprofile comparisons (an example is shown in Fig. 11). The resulting delta profilesare averaged over the low latitudes (5 S–30 N), mid-latitudes (30 N–60 N), and high25
latitudes (60 N–90 N). The analysis results are presented in terms of these latitudesections separately.
Figure 12 (blue curves) shows the results from the comparison between ASUR andMIPAS profiles with the predefined criterion, 300 km and 3 h. There are 6 coincident
5191
measurements in the tropics, 9 in mid-latitudes and 8 in high-latitudes. Between 20and 34 km, the differences range from −0.4 to +0.7 ppb or −25 to +30% in the tropics,up to 0.7 ppb or 15% in the mid-latitudes and −0.3 to +0.1 ppb or −5 to +2% in thehigh latitudes. The average MIPAS−ASUR deviation is −0.1 to +0.4 ppb or −5 to +13%above 20 km. The differences are highest in the tropics and lowest in the high-latitudes.5
Figure 12 (red curves) also shows the results from the comparison between ASURand MIPAS profiles with the additional criterion of 1000 km and 12 h. There are 36 co-incident measurements in the tropics, 67 in mid-latitudes and 665 in high-latitudes. Inthe low latitudes, the deviation is within ∼0.3 ppb or −10 to +15% at 20–34 km. The dif-ference in the mid-latitudes is up to 1.4 ppb or 18%, whereas in the Arctic the difference10
between the profiles is up to 0.4 ppb or 3%, above 20 km. The mean MIPAS−ASURdeviation for the entire latitude band is up to 0.6 ppb or 10%. The MIPAS−ASUR differ-ence is found to be largest in the mid latitudes and is lowest in the high latitudes with apeak around 23 km.
Beside the fact that the standard deviation of the differences for the predefined crite-15
rion (not shown) is greater than for the relaxed criterion, the shape of the delta profilesare alike in both analyses. It reveals that the largest deviation is in the 20–30 km re-gion, where the MIPAS profiles generally exceed the ASUR profiles. Below 20 km,the ASUR values appear to be relatively small and thus give rise to large differencesand high spread (1-σ deviation of the values). The agreements between the profiles20
are very good above 30 km. Nevertheless, the general overall agreement between theMIPAS and ASUR profiles is better than 10–13% at 20–34 km.
6 Comparisons with balloon-borne Instruments
6.1 MIPAS-B
Balloon-borne observations are a very useful tool to obtain distributions of HNO3 with25
sufficiently high vertical resolution over most of the stratospheric altitude region. Three
5192
validation campaigns were carried out with MIPAS-B, the balloon-borne version of MI-PAS (Friedl-Vallon et al., 2004) (see Table 6). They were conducted on 24 September2002, 20/21 March 2003, and 3 July 2003. Figures 13 to 15 show comparisons ofHNO3 VMR profiles between the MIPAS/ENVISAT ESA retrieval and balloon-borneMIPAS-B measurements on 24 September 2002, 20/21 March 2003, and 3 July 2003,5
together with the satellite and balloon flight tracks. As shown in Fig. 13, the twoSeptember MIPAS-B profiles were obtained from sequences measured near 40◦ N and46◦ N on 24 September 2002. The MIPAS/ENVISAT coincident measurement for thesequence near 46◦ N covered nearly the same latitudes and longitudes along track ofthe flight while the sequence near 40◦ N is slightly different from the location of the MI-10
PAS/ENVISAT observation. The two March 2003 measurements (Fig. 14) were takenin the late winter Arctic vortex near 66◦ N, 15◦ E over Kiruna (67.8◦ N, 20.4◦ E), Swe-den and covered a wide range of longitudes (greater than 10◦). The two sequencesmeasured during the July flight (Fig. 15) were performed under polar summer con-ditions near 70◦ N around 10◦ E and 25◦ E with a longitudinal coverage of 10◦ to 15◦
15
respectively.The agreement between ESA MIPAS and MIPAS-B HNO3 profiles derived from the
September radiance measurements at 40◦ N and 46◦ N is good (Fig. 13). During thenorthern sequence at 46◦ N the collocation was better than 20 min in time and bet-ter than 100 km in horizontal distance. The comparison between MIPAS-B (northern20
sequence) and MIPAS/ENVISAT reveals a good agreement with only slightly larger val-ues of the MIPAS ESA data between 15 and 22 km (∼130 and 50 hPa). The deviationsare below 1 ppbv throughout the entire height range up to 38 km (∼6 hPa), and below0.5 ppbv above 26 km (∼30 hPa). During the southern sequence at 40◦ N, the spatialmismatch between the MIPAS-B and MIPAS/ENVISAT measurements became slightly25
larger, and the difference of the measured HNO3 VMR slightly increased, with a maxi-mum of ∼1.5 ppbv around the HNO3 peak at 26 km (∼30 hPa) and in the lower strato-sphere at 18 km (∼90 hPa). This difference is attributed to less perfect coincidence.However, parts of the disagreement can be attributed to some retrieval instabilities in
5193
the MIPAS profile measured at 22:05 UT exhibiting an unrealistic VMR double peak.Nevertheless, above 30 km (∼17 hPa) no substantial difference between MIPAS andMIPAS-B HNO3 profiles was found.
The HNO3 profiles derived from the March flight at 66◦ N have shown larger differ-ences of 1 to 3 ppbv between 17 and 22 km (∼100 and 50 hPa) (Fig. 14). The dis-5
crepancies in the March measurements are attributed to horizontal inhomogeneitieswithin a wide range of longitudes (larger than 10◦) covered by MIPAS-B. Moreover,the March measurements were made near the vortex boundary (see violet contours inFig. 14) where the variation of NOy species is highly pronounced due to differences inchemical processes on either side of the vortex edge. As shown by Mengistu Tsidu10
et al. (2005) the disagreements, which are more pronounced for HNO3 than N2O5,are mainly caused by the horizontal inhomogeneity since HNO3 exhibits a strongerlatitudinal gradient than N2O5, particularly near the vortex edge.
In contrast, the HNO3 profiles from the ESA MIPAS and MIPAS-B measurementsnear 70◦ N in July 2003 show better agreement, even the MIPAS-B July flight covered15
nearly the same wide longitude range, in comparison with the March observations(Fig. 15). The deviations are less than 1 ppbv throughout the entire altitude rangebetween 10 and 40 km (∼260 and 4.5 hPa), and below 0.5 ppbv at the lower and higheraltitudes. This reflects much smaller horizontal variations of the HNO3 distributionsduring polar summer.20
6.2 MkIV
Three balloon campaigns were made with the Jet Propulsion Laboratory (JPL) MkIVinstrument (Toon, 1991) (see Table 6). It is a Fourier transform spectrometer and mea-sures high signal-to-noise ratio solar occultation spectra throughout the mid-infraredregion (650 to 5650 cm−1) at high spectral resolution (0.01 cm−1) at sunrise or sun-25
set. Two sunrise MkIV measurements (Figs. 16 and 17) were taken over Esrangelocated 45 km from the town of Kiruna in 16 December 2002 and 1 April 2003 dur-ing SOLVE2/VINTERSOL campaigns (http://mark4sun.jpl.nasa.gov/solve2a.html and
5194
http://mark4sun.jpl.nasa.gov/solve2b.html). The December measurement has a widelatitude coverage while the April one extends over a wide longitude range. They have 3and 4 coincident MIPAS/ENVISAT HNO3 profiles, respectively. The third sunrise MkIVmeasurement (Fig. 18) was conducted in 20 September 2003 at a mid-latitude of 35◦ Nwith a wide longitude range. There are 6 coincident MIPAS/ENVISAT HNO3 profiles5
available for this MkIV flight.Figures 16 and 17 compare two sunrise MkIV measurements taken at high northern
latitudes over Esrange during 2002 winter and 2003 spring with respect to their 3 and4 coincident MIPAS/ENVISAT ESA profiles, respectively. The local time differences aresmall for these correlative profiles. Thus, their solar zenith angle differences are not10
adjusted.The comparison of the December measurements (Fig. 16) shows substantial differ-
ences (e.g. zigzag in orange and blue curves), as large as ±(2 to 4) ppbv. Only thegreen curve, measured about one day earlier at similar latitudes shows a relativelygood agreement with the MkIV result. A comparison with the HNO3 results by the IMK-15
IAA data processor (see Wang et al., 2007, Fig. 4) shows that data below 24–25 kmare not reported there for the orange and blue curves. The reason for this is that thosetangent altitudes have been discarded from the IMK-IAA retrievals due to cloud con-tamination. These polar stratospheric clouds (PSCs) have not been detected with theESA cloud index limit but with the IMK more stringent one (Glatthor et al., 2006). Thus,20
there are two explanations for the strong zigzag in the ESA results: 1) the profilesare correctly representing the gas-phase depletion of HNO3 due to uptake into PSCsand possible denitrification/renitrification at lower altitudes, or 2) due to the interferingcloud signal the retrieval might have become instable. We assume that both factorscontribute to the observed profile shapes since 1) PSCs must have been present as25
indicated by the IMK-IAA cloud detection and, thus, an uptake of HNO3 is probable and2) there is also a zigzag in the ESA retrieved MIPAS ozone profiles (not shown here)at the same geolocations as the orange and blue curves which is in phase with thezigzag of the HNO3 results, however, with an amplitude of about 20% compared to up
5195
to 70% in case of HNO3. Since ozone is not known to be influenced directly by PSCs,we conclude that the observed instability is an artefact of the retrieval in presence ofclouds.
In contrast, MIPAS and MkIV April HNO3 measurements (Fig. 17) are in reasonableagreement. The highest deviations in HNO3 VMR were found below 17 km (∼100 hPa),5
with MkIV being 1.5 ppbv lower than ESA retrieved MIPAS HNO3 VMR. In the primaryHNO3 VMR maximum around 23 km (∼45 hPa) and above, deviations were around0.5 ppbv.
The sunrise MkIV measurement at 35◦N in September 2003 (Fig. 18) also showgenerally good agreement with its 6 coincident MIPAS/ENVISAT HNO3 profiles. The10
differences are less than 1.5 ppbv throughout the entire altitude range between 10 and40 km (∼260 and 4.5 hPa), and below 0.5 ppbv at the lower and higher ends. This isdue to more homogeneous airmasses at the autumn mid-latitude, though there wasspatial mismatch of about 10◦ longitude between the coincident profiles. The forwardtrajectories started at the positions of the MkIV profile indicate that the turquoise MI-15
PAS/ENVISAT profile measured on 18:29 UTC should agree best with the MkIV profile,as it represents the same air masses, which is the case indeed.
6.3 SPIRALE
The tunable diode laser instrument SPIRALE (Spectrometre Infra Rouge pour l’etudede l’Atmosphere par diodes Laser Embarquees) is a balloon-borne instrument for the in20
situ measurement of stratospheric trace species (Moreau et al., 2005). Concentrationsof O3, CO, CO2, CH4, N2O, NO2, NO, HNO3, HCl, HOCl, H2O2, and COF2 have beenretrieved from direct absorption in the mid-infrared spectral region by fitting experimen-tal spectra and spectra calculated using spectroscopic parameters of absorption linesfrom the HITRAN2004 database (Rothman et al., 2005). Estimations of the uncertain-25
ties on SPIRALE measurements have been previously described in detail (Moreau etal., 2005). The global uncertainty on the HNO3 mixing ratio is estimated to be 30%below 20 km height mainly due to random errors and 20% above 20 km mainly due to
5196
systematic errors. The sources of random errors are the fluctuations of the laser back-ground emission signal, and the low signal-to-noise ratio for weakly absorbing speciessuch as HNO3. The sources of systematic errors are on the laser linewidth (an in-trinsic characteristic of the diode laser) and on the non-linearity of the detectors. Itis to be noted that systematic errors on spectroscopic data (essentially molecular line5
strength and pressure broadening coefficients) are not considered. MIPAS systematicerrors have been computed by the Oxford University: Polar winter night conditions andnight mid-latitude conditions have been used, respectively, for the Arctic case and themid-latitude case.
Validation flights were carried out from Aire sur l’Adour, France (43.7◦ N, 0.3◦ E) on 210
October 2002 and from Kiruna, Sweden (67.8◦ N, 20.4◦ E) on 21 January 2003. MIPASHNO3 operational data have been compared with the SPIRALE profiles obtained dur-ing the descent phase of the October 2002 flight and during the ascent phase of theJanuary 2003 flight.
Figure 19 shows comparisons of the HNO3 profiles obtained by SPIRALE during the15
Kiruna 2003 flight. For the Arctic flight, direct coincidences with two MIPAS scans (orbit4677-scan 20 and orbit 4678-scan 6), whose temporal separation from the SPIRALEmeasurements satisfied the baseline matching criterion ∆t <3 h, were available. Thelocation of this flight was close to the vortex edge and, although the spatial separa-tion does not satisfy the baseline criterion ∆s <300 km (300–500 km for scan 20 and20
600–800 km for scan 6), MIPAS and SPIRALE measurements were made on locationswhere PV computed by the contour advection model MIMOSA (Hauchecorne et al.,2002) were close (5 to 25% for scan 20 and 5 to 35% for scan 6). Both the SPIRALEoriginal high vertical resolution profile and its smoothed version after application ofMIPAS averaging kernels are displayed. In general, a good agreement is observed in25
both cases, with MIPAS HNO3 data from orbit 4677, scan 20 mostly matching SPIRALEsmoothed values within the error bars. Discrepancies which can reach 4 ppbv at thelevel above 100 hPa, are found in the comparison with MIPAS orbit 4678, scan 6, pos-sibly due to increased comparison errors introduced by the greater spatial separation
5197
(600–800 km) and by the large PV differences at the level above 100 hPa (35%).Figure 20 shows comparisons of the HNO3 profiles obtained by SPIRALE on the
October 2002 flight with coincident MIPAS profiles from orbit 3019, scans 14 and 15 on27 September at 23:52:50 UT and 23:54:11 UT respectively. For the mid-latitude flight,direct coincidences satisfying the criteria of ∆t<3 h and ∆s<300 km where not possible,5
and the intercomparison was carried out by means of trajectory analysis with MIPASprofiles. The backward trajectories ending at the location of the SPIRALE profiles(44◦ N, 0◦ E) on 2 October 2002 (09:15–10:30 UT at descent) have been computed asa function of potential temperature in 25 K steps (about 1 km). Scans 14 and 15 oforbit 3019 have been proven to be the best matches for comparison with SPIRALE.10
These scans where measured near 42◦ N and 46◦ N, 4.5 days before the SPIRALEflight. By comparing the PV values of SPIRALE and MIPAS profiles, it is found thatPV differences are lower than 10% between 400 K and 600 K for both MIPAS scansand above 700 K for scan 14. This concludes that the SPIRALE data may be usedto validate 1) MIPAS scan 14 of orbit 3019 on the potential surfaces between 400 K15
and 600 K and between 700 K and 900 K, which corresponds to the retrieval nominalMIPAS altitudes 18, 21, 24, 30 and 33 km, and 2) MIPAS scan 15 of orbit 3019 on thepotential surfaces between 400 K and 600 K, which corresponds to the nominal MIPASaltitudes: 18, 21 and 24 km. The comparison results shown in Fig. 20 reveal a generallygood overlapping between MIPAS and SPIRALE HNO3 measurements, except for the20
altitudes near the VMR peak (21 and 24 km) where the MIPAS data overestimate theSPIRALE observations by 2 ppbv at 21 km for both MIPAS scans and by 3 ppbv at24 km for MIPAS scan 15. In the latter case large differences on the PV values ofSPIRALE and MIPAS profiles above 24 km (35% at 27 km, 60% at 30 km) could explainthe discrepancies since MIPAS retrieved mixing ratios at a nominal tangent altitude25
depends on the true mixing ratio values at least within the half width of the vertical field-of-view above. Further, inspecting MIPAS HNO3 profiles of orbit 3019 further north (notshown here) reveals a strong S-N gradient at the altitude of the largest differences (30–40 hPa) compared to SPIRALE. This strong gradient is the result of a PV barrier close
5198
to SPIRALE and to MIPAS scan 15. Considering the time difference of 4.5 days smallerrors on the ECMWF (European Centre for Medium-range Weather Forecasts) windscould lead to small errors on the location of the PV barrier close to MIPAS or close toSPIRALE (or both) leading to larger errors on the PV differences between the locationsof SPIRALE and MIPAS.5
6.4 IBEX
IBEX (Infrared Balloon EXperiment) is a high resolution Fourier transform spectrom-eter operating in the Far-IR region (spectral range 10–250 cm−1, spectral resolution0.0025 cm−1) for limb emission measurements from stratospheric balloon (Bianchini etal., 2006). The correlative measurements with MIPAS/ENVISAT were obtained during10
the trans-Mediterranean flight from Trapani, Sicily (38◦ N, 12◦ E) to Spain on 29–30 July2002. However, useful coincidences between MIPAS observations and measurementsof the FT-FIR spectrometer could be obtained only after substantial relaxation of thespatial-temporal matching criteria (within 300 km and 3 h), as shown for instance inprevious analyses carried out for MIPAS ozone validation (Cortesi et al., 2004). As15
a consequence, the comparison of MIPAS and IBEX data was based on isentropictrajectories calculations performed using the University of L’Aquila Global TrajectoryModel (Redaelli, 1997 and Dragani et al., 2002) on the base of ECMWF meteoro-logical fields. Four days backward and forward isentropic trajectories, departing fromthe geolocations of the IBEX retrieved profiles, were calculated. Then MIPAS HNO320
profiles at locations within 2 degrees in longitude, 2 degrees in latitude and 2 hoursin time along these trajectories were identified and vertically interpolated in potentialtemperature, to obtain the HNO3 volume mixing ratio value to be compared with thecorresponding MIPAS measurements. The interpolation to the trajectories has beenmade by using the pressures of MIPAS as height coordinate and not the altitudes. The25
resulting intercomparison pairs were then binned by altitude, in steps of ∆ z = 1.5 kmand averaged. Preliminary results of a so called ‘self-hunting” analyses of MIPAS datathat matches satellite observation with themselves, providing a test for the precision
5199
of the instrument products and the quality of the calculated trajectories and thus as-sessing the noise in the technique and providing estimates to its possible extension tomulti-platform comparison for the selected time period, can be found in (Taddei et al.,2006).
Mean absolute and relative differences between the MIPAS and IBEX HNO3 data5
obtained during the trans-Mediterranean flight of 29–30 July 2002 are presented inFig. 21. The MIPAS measurements agree reasonably well with the balloon profile be-tween 17 and 32 km (mean relative differences within ±15%). However, at lower andhigher altitudes, MIPAS HNO3 VMRs appear to be higher than those of the IBEX by upto 50–100%.10
7 Comparisons with other satellite observations
For comparisons of MIPAS with Odin/SMR and ILAS-II measurements, the horizontalseparations between the collocated profiles are required to be smaller than 300 km,and the time differences are less than 3 h. However, for ACE-FTS, due to limitations ofsatellite’s sampling and database size, 800 km, 9 h and a maximum difference of po-15
tential vorticity of 3×10⁻⁶ Km2kg−1s−1 at an altitude of 475 K potential temperature areused to obtain enough coincidences for statistical analysis. The numbers of availablecoincident profiles are listed in Table 6. The mean spatial separations and temporaldifferences, as well as their standard deviations are averaged over all available cor-relative measurements and listed in Table 7. The spatial and temporal mismatch can20
cause HNO3 differences associated with geophysical variations of the atmosphericfield. However, imperfect spatial/temporal matches have virtually no effect on the ob-served mean differences since their effect largely averages out, but may significantlycontribute to the observed standard deviations. This has been confirmed by re-analysisof the Odin/SMR and ILAS-II data using much less restricted criteria, which require the25
latitude and longitude separations being smaller than 5 and 10 degrees, respectively,and the time differences less than 12 h (The results are not shown here).
5200
For a reference data set having enough correlative profiles, mean differences at in-dividual height levels are also calculated over the overlapped observation period. Forinter-satellite comparison, zonal mean differences are calculated with latitude intervalsof 30◦ and for the MIPAS descending (daytime) and ascending (nighttime) orbit nodesseparately. The results from both nodes are generally similar and thus combined to-5
gether. The global means are averaged over all latitudes and both orbit nodes.
7.1 Odin/SMR
The Sub-Millimetre Radiometer (SMR) on board the Odin satellite, launched on 20February 2001, observes key species with respect to stratospheric chemistry and dy-namics such as O3, ClO, N2O, and HNO3 using two bands centered at 501.8 and10
544.6 GHz. Stratospheric mode measurements are performed typically twice per week.Vertical profiles are retrieved from the spectral measurements of a limb scan by twosimilar data processors in Sweden and in France. The data used in this comparisonstudy are taken from the level 2 operational data retrieved at the Chalmers University ofTechnology (Gothenburg, Sweden). The most recent version is version 2.0, and HNO315
is retrieved from the 544.6 GHz band. The spectroscopic line intensities are taken fromthe JPL spectral line compilation. These intensities are corrected to correspond to atotal partition function (not only the rotational partition function provided by the JPLdatabase). Comparisons are under way in order to check differences between the JPLand HITRAN (TIPS) partition functions. The profiles in the altitude range from 18 to20
45 km are retrieved with a vertical resolution of 1.5 to 2 km and a 1-σ precision of bet-ter than 1.5 ppbv. In the height regions below ∼18–20 km (∼88–67 hPa), the Odin/SMRHNO3 data usually have a measurement response (a ratio derived from the Odin/SMRaveraging kernel matrix and providing a measure on how much information comes fromthe spectral measurement and the a priori profile for each individual retrieval altitude25
level) lower than 0.75, implying dominance of the a priori climatology. Thus, we selectdata with the measurement response larger than 0.75 for comparison. Detailed infor-mation on the data characteristics and analysis of systematic retrieval errors, resulting
5201
from spectroscopic and instrumental uncertainties can be found in (Urban et al., 2005)and (Urban et al. , 2006).
Comparison between the MIPAS IMK-IAA and Odin/SMR HNO3 data by Wang et al.(2007) has shown that the characteristic shape of the difference profile likely indicatean altitude shift in the SMR profiles, and the best value of the mean altitude increase5
for Odin/SMR, which minimizes the HNO3 VMRs differences was estimated to be ap-proximately 1.5 km. Therefore, the altitudes of Odin/SMR data have been increasedby 1.5 km, and the retrieved pressures have been adjusted by interpolating the origi-nal altitude-pressure scales to the adjusted heights. The adjusted retrieved pressurevalues are used in this analysis.10
Figure 22 shows the comparisons between the ESA retrieved MIPAS and Odin/SMRHNO3 VMR profiles, which are zonally averaged for 3 latitude bands during a period of37 days from 19 September 2002 to 28 February 2003. No coincident measurement isavailable between 30 ◦ N and 60◦ S due to our requirement of the horizontal separation<300 km, more restricted than that used by Wang et al. (2007). The comparison results15
are consistent with preliminary results obtained from the Odin/SMR validation studybased on comparisons of Odin/SMR with a couple of balloons and with satellite data(ILAS-II, MIPAS ESA operational data) (Urban et al. , 2006).
The Odin/SMR HNO3 version 2.0 data used in this analysis show good agreementwith the correlative data. Their differences at the three latitude bands and the over-20
all means averaged over these bands (not shown) are generally smaller than thecombined measurement errors of both instruments in the altitude range above 30 km(∼17 hPa), and slightly larger below 30 km. The Odin/SMR VMRs tend to be larger thanthose of the MIPAS by 10–20% in the altitude range 20–35 km, depending on latitude.Largest difference are found at high northern latitudes (up to 2 ppbv at 20–25 km), oth-25
erwise the agreement is within 1 ppbv or 10%. This indicates that the altitude shift isnot the only reason for the disagreement, and other error sources (spectroscopy, cali-bration) may also contribute. Also, we note that a correction of 1.5 km looks too largein one of the chosen latitude bands, but very reasonable in the others, suggesting a
5202

possible latitude dependence of the altitude shift.The standard deviations of the difference residuals (2–4 ppbv or more) shown in
Fig. 22 are always larger than the combined measurement error. This is probably dueto the temporal and spatial coincidence error and the horizontal smoothing error whichare not taken into account in our error budget (see Sect. 4). Also, it is worth noting that5
the standard deviations are larger (by 1 ppbv or more) than those of the MIPAS IMK-IAA retrievals with respect to the Odin/SMR data (see Wang et al., 2007, Figs. 8–10),in spite of much less restricted coincidence criteria used for the IMK-IAA data. Thehigher standard deviations in the operational dataset come likely from the effects ofundetected clouds and different regularization used for the MIPAS ESA and IMK-IAA10
retrievals (see Sect. 6.2).
7.2 ILAS-II
The ILAS-II instrument is a solar occultation sensor designed to measure variousstratospheric constituents. The operational observations were made with a frequencyof about 14 times per day in each hemisphere for about 7 months from 2 April through15
24 October 2003. The measurement latitudes ranged from 54◦ to 71◦ N and from65◦ to 88◦ S, varying seasonally. Vertical profiles of HNO3 and several key strato-spheric species (O3, NO2, N2O, CH4, H2O etc.) are simultaneously retrieved by theso-called onion-peeling method, primarily using the strong absorption lines around 7.6and 11.3 µm for the HNO3 retrieval, with vertical resolutions of 1.3 to 2.9 km at tangent20
heights of 15 and 55 km (see Yokota et al., 2002, for details of the retrieval algorithmcloud-clearing technique). For altitude registration, the geometric altitude data are ob-tained from the sun-edge sensor. However, the pressure/temperature (p/T) data of theILAS-II-retrievals are not good in accuracy (Sugita et al., 2004). Thus, the assimilationanalysis data (registered in geopotential altitude) from the Met Office (METO, also pre-25
viously referred to as UKMO), United Kingdom are converted to get the interpolatedT/p profiles. This choice is a continuation from ILAS experiment. However, to facilitatecomparisons of HNO3 in this study, we obtain the p/T profiles from the ECMWF as-
5203
similation, which is used to derive the hydrostatic pressure profiles in the MIPAS dataretrievals. For the version 1.4 ILAS-II algorithm, spectroscopic data were adopted fromthe HITRAN2000 database, including updates through the end of 2001 (Rothman etal., 2003). The influence of the different version of HITRAN database (2000 versus2004) on ILAS-II HNO3 retrievals is very small, according to a sensitivity test made for5
a couple of specific cases. The ILAS-II stratospheric HNO3 profiles (version 1.4) werevalidated with balloon-borne instruments and climatological comparisons, showing thatthe precision is better than 13–14%, 5%, and 1% at 15, 20, and 25 km, respectively,and that the accuracy in the altitude region is estimated to be better than −13% to+26% (Irie et al., 2006 and Yamamori et al., 2006).10
Figure 23 shows comparisons between the ESA retrieved MIPAS and ILAS-II mea-sured HNO3 VMR profiles, which are zonally averaged over three latitude bands forthe 82 days between 12 February to 24 October 2003. No coincident measurementis available in other latitude bands. The ILAS-II data were convolved with the MIPASaveraging kernel. Therefore, the ILAS-II mixing ratios are somewhat degraded from15
the original vertical resolutions. Also, the ILAS-II data were filtered by requiring the re-trieved VMR values greater than the total error values. This rejected some data pointsabove about 35 km (∼9 hPa), in particular, in the southern high latitude region.
The consistency between the MIPAS and ILAS-II data is very impressive, with themean differences at individual latitude bands and averaged over the three bands (not20
shown) being less than the combined measurement errors of both instruments in thewhole altitude range of 10 to 50 km. The 82-day mean differences being less than±0.5 ppbv between 10 and 45 km (∼260 and 2.3 hPa) and the standard deviations1−2 ppbv. As seen from Fig. 23, the standard deviations are generally comparableto or smaller than the combined instrument measurement errors, except for the south-25
ern polar region around 20 km. Also, vertical trends in the difference between MIPASand ILAS-II are different for the two hemispheres, with the ILAS-II data larger than theMIPAS at the height levels below the VMR peak in the southern polar region. Thesefeatures are probably due to the same reasons for other comparisons (see Sects. 4
5204
and 7.1): the coincidence of sounding airmasses and the horizontal smoothing errorsare not taken into account in the error budget. Both errors become large in the southernpolar region where the spatial variability of target molecule is high. On a first instance,the good consistency between ILAS-II and MIPAS is surprising, since different spec-troscopic data (HITRAN2000 for ILAS-II and HITRAN2004 for MIPAS) are used in the5
retrievals. A possible explanation, arising from the additional absorption band used forthe ILAS-II retrieval, is given in Wang et al. (2007).
7.3 ACE-FTS
The ACE-FTS (Bernath et al., 2005) is a high resolution (0.02 cm−1) Fourier transformspectrometer operating from 2 to 13 µm (750 to 4500 cm−1). The ACE-FTS records10
atmospheric absorption spectra during sunrise and sunset (solar occultation mode)and has a nominal vertical resolution of about 4 km. The ACE satellite was launchedon 12 August 2003 and the first useful atmospheric spectra were recorded in earlyFebruary 2004. The ACE-FTS retrieval algorithm is based on a global fit procedurethat first derives temperature and pressure profiles using CO2 absorption (Boone et al.,15
2005). The nitric acid is based primarily on microwindows near 1710 cm−1 containingν2 absorption. In the troposphere additional microwindows near 879 cm−1 (ν5) are usedbecause of strong water absorption near the ν2 band. The HNO3 line parameters usedare those of HITRAN 2004 (Rothman et al., 2005). Version 2.2 FTS retrievals takenduring 9 February to 25 March 2004 are used for the comparisons in this paper. The20
retrievals are carried out in the 10 to 37 km range with a typical precision of 2 to 3%.Figure 24 shows comparisons between the zonal mean profiles of the ESA MIPAS
and ACE-FTS HNO3 VMR taken during 9 February to 25 March 2004 at latitude bandsof 30◦ N−60◦ N and 60◦ N−90◦ N. The ACE-FTS data are from the sunset measure-ments, while the MIPAS data include both daytime and nighttime measurements. The25
consistency between the MIPAS and ACE-FTS data is very good. The mean differ-ences are less than ±0.1 to 0.5 ppbv and rms deviations of ∼0.6 to 1 ppbv, with thesmaller values corresponding to the lower and higher altitudes around 10 and 35 km
5205
(∼260 and 9 hPa). The relative differences are 5 to 10% below 30 km (∼17 hPa), and 10to 15% at higher altitudes around 35 km (∼9 hPa). We have also compared the ACE-FTS sunset data with the daytime and nighttime MIPAS measurements separately, andno significant differences are found. For latitude bands of 30◦ S–0◦ and 0◦–30◦ N, only1 and 4 events are available respectively. Thus these comparison results are not pre-5
sented here.
8 Conclusions
Stratospheric nitric acid VMR profiles are retrieved by ESA from the MIPAS observa-tions using the operational data processor. The profiles of version v4.61/4.62 obtainedbetween July 2002 and March 2004 are validated in this paper. They are compared10
with a number of ground-based measurements, balloon and aircraft campaigns, andsatellite observations.
HNO3 partial columns and vertical profiles taken from the MIPAS ESA data andFTIR observations at five ground-based stations (Jungfraujoch, Lauder, Arrival Heights,Kiruna, and Wollongong) are compared (Figs. 1 and 2). These comparisons represent15
different geographic and seasonal conditions, except for Wollongong where only onecoincidence is available. The mean relative differences between the MIPAS and FTIRHNO3 partial columns are within ±2%, and the statistical standard errors on the meansare 6–11% for the Jungfraujoch, Arrival Heights, Lauder, and Kiruna stations. Com-pared to the MIPAS systematic error for the partial columns of ∼2%, we can conclude20
that there is no statistically significant bias in the relative differences of partial columns.The results for the partial columns are confirmed by comparisons of vertical profiles.The bias between the MIPAS and FTIR profiles is statistically insignificant and below10% at Kiruna and Jungfraujoch in the whole altitude range and at Arrival Heights foraltitudes lower than 15 hPa. The statistical standard deviations of the mean differences25
are 13%, 11%, 5%, and 9% for Jungfraujoch, Arrival Heights, Lauder, and Kiruna, re-spectively. These large standard deviations, compared to the estimated measurement
5206

uncertainty, are explained by the temporal and spatial coincidence error and the hori-zontal smoothing error which are not taken into account in our error budget. Both errorsbecome large when the spatial variability of target molecule is high.
Good agreement is also found for the comparisons between the MIPAS ESA HNO3profiles and the aircraft-borne SAFIRE-A correlative measurements obtained during5
northern mid-latitude flights (Forlı, Italy, 24 October 2002 ) and during the Arctic cam-paign (Kiruna, Sweden, 2 March 2003) (Figs. 5 and 6). The SAFIRE HNO3 measure-ments and satellite data are generally matched within their total error bars for the midand high latitude flights, despite the larger atmospheric inhomogeneities that charac-terize the measurement scenario at higher latitudes. The occurrence of strong vertical10
gradients and horizontal gradients encountered at the border of the polar vortex canaccount for the discrepancy in HNO3 values retrieved by the airborne and satellite limb-sounders.
To further investigate the characteristics of HNO3 values at the border of the po-lar vortex, the MIPAS/ENVISAT HNO3 profiles are compared, on a profile-to-profile15
basis, with the aircraft-based MIPAS-STR correlative measurements obtained duringthe three Arctic campaigns at Kiruna on 28 February, 2 March and 12 March in 2003(Figs. 8 to 10). It was found that MIPAS/ENVISAT normally tends to be in a very goodagreement with MIPAS-STR and only occasionally shows somewhat large differences,mostly in terms of a slight overestimation of the HNO3 VMR. The latter trend is more20
pronounced in comparison with SAFIRE-A mean profiles, that are almost constantlylower MIPAS/ENVISAT HNO3 values. The observed differences could be explainedby the fact that the selected collocated HNO3 profiles, satisfying the spatial and tem-poral coincidence criteria, can sample different air masses across a region of stronghorizontal (and vertical) gradients.25
The comparison between the aircraft-based ASUR and MIPAS/ENVISAT profiles(Fig. 12) reveals that the agreements between the profiles are very good above 30 km.The general overall agreement between the MIPAS and ASUR profiles is better than10–13% at 20–34 km. The largest deviation is in the 20–30 km region, where the MI-
5207
PAS profiles generally exceed the ASUR profiles. Below 20 km, the ASUR valuesappear to be relatively small and thus give rise to large differences and high spread(1-σ deviation of the values).
The comparison between individual profiles of the ESA retrieved MIPAS and MIPAS-B HNO3 shows good agreement, but their degree of consistency is largely affected5
by their temporal and spatial coincidence (Figs. 13 to 15). In the case of a colloca-tion better than 20 min in time and 100 km in horizontal distance (northern sequencein September 2002), the two data sets show an excellent agreement above 26 km(∼30 hPa). Below this altitude range, a small positive bias of 1 ppbv is visible in theMIPAS data which turns out to be significant with respect to the combined error limits.10
All differences for the comparison with MIPAS-B in September 2002 are below 1 ppbvthroughout the entire altitude range up to about 38 km (∼6 hPa), and below 0.5 ppbvabove 30 km (∼17 hPa). For the 2003 March measurements differences of 1 to 3 ppbvbetween 22 and 26 km (∼50 and 30 hPa) were observed. One of the MIPAS-B profilescovered a wide range of longitudes larger than 10◦ at high latitudes near the vortex15
boundary where HNO3 is sensitive to both latitudinal and longitudinal differences inthis region. Thus, the high differences are thought to be related to horizontal inho-mogeneity. In contrast, HNO3 profiles measured in July 2003 are in good agreementalthough the mismatch of both sensors was quite large. This reflects the smaller hori-zontal variations of HNO3 in polar summer.20
Similar features are also observed in comparisons between individual profiles ofthe MkIV and MIPAS/ENVISAT (Figs. 16 to 18). In spite of the same level of spa-tial mismatch, the April 2003 measurements showed reasonable agreements due tomore homogeneous airmasses, but substantial differences as large as 2 to 4 ppbv,were observed for the December 2002 measurements. From comparisons with MI-25
PAS/ENVISAT ozone retrievals showing similar profile instabilities at the same loca-tions, we conclude that at least part of the deviations with respect to the MkIV observa-tions have been caused by undetected polar stratospheric clouds leading to oscillationsin the MIPAS HNO3 profiles. A more stringent cloud detection as in case of the IMK-
5208
IAA HNO3 dataset (Wang et al., 2007) would likely have avoided this problem. Wetherefore conclude that for cases of possible cloud interference (like wintertime polarvortex studies) care must be taken that profiles affected by clouds are sorted out.
The MIPAS HNO3 profiles are compared directly with the correlative measurementsobtained by balloon-borne SPIRALE during the Kiruna flight on 21 January 2003, and5
indirectly, by means of trajectory analysis, with those during the Aire sur l’Adour flight on2 October 2002. For the direct comparison with the Kiruna 2003 flight (Fig. 19), whoselocation was close to the vortex edge, a good agreement is generally observed withMIPAS HNO3 data mostly matching SPIRALE values within the combined instrumenterror bars (the largest bias is less than 1 ppbv), when the location of the SPIRALE mea-10
surement is closer to that of MIPAS (∆s<300–500 km, and ∆PV <5 to 25%). However,much larger discrepancies, as large as 5 ppbv at the level above 100 hPa, are foundwhen the spatial separation of the correlative profiles increases (600–800 km, PV dif-ferences up to 35%), due to increased comparison errors introduced by the greaterseparation. The indirect comparison results (Fig. 20) revealed a general good over-15
lapping between MIPAS and SPIRALE HNO3 measurements, except for the altitudesnear the VMR peak (around 24 km), where the MIPAS data overestimates the SPIRALEobservations by 2 ppbv.
The IBEX HNO3 profiles were obtained during the trans-Mediterranean balloon flighton 29–30 July 2002. Useful coincidences between MIPAS observations and the IBEX20
measurements of the balloon-borne FT-FIR spectrometer could be obtained only aftersubstantial relaxation of the spatial-temporal matching criteria (within 300 km and 3 h).As a consequence, the comparison of MIPAS and IBEX data was based on isentropictrajectories calculations. As shown in Fig. 21, the MIPAS measurements agree rea-sonably well with the balloon profile between 17 and 32 km (mean relative differences25
within ±15%). However, at lower and higher altitudes, MIPAS HNO3 VMRs appear tobe higher than those of the IBEX by up to 50–100%.
Statistical comparison results of MIPAS ESA HNO3 VMR with respect to those ofthe Odin/SMR, ILAS-II, ACE-FTS measurements (Figs. 22 to 24), show generally
5209
good agreement. For each pair of the correlative measurements, their mean differ-ences averaged over individual latitude bands or over all available bands are generallysmaller than the combined instrument measurement errors throughout the whole alti-tude range between 10 and 50 km, and thus statistically insignificant. The ESA MIPASand Odin/SMR V2.0 HNO3 VMR profiles taken between September 2002 and Febru-5
ary 2003 showed reasonable agreement (Fig. 22),with the global mean differencesgenerally less than 1 ppbv at the heights between 20 and 40 km (∼67 and 4.5 hPa),and with largest differences of ±2 ppbv only seen around 17 km and 22 km (∼100 and50 hPa) at high latitudes of 60◦. Much better agreements are observed for the meanHNO3 VMR profiles of the ESA MIPAS, with respect to ILAS-II and ACE-FTS measure-10
ments (Figs. 23 to 24). The mean differences of the MIPAS ESA data with respect tothe ILAS-II data are less than ±0.5 ppbv between 10 and 45 km (∼260 and 2.3 hPa)and the standard deviations 1−2 ppbv. The mean differences between the MIPAS andACE-FTS are less than ±0.1 to 0.5 ppbv and rms deviations are of ∼0.6 to 1 ppbv,with the small values corresponding to the lower and higher altitudes around 10 and15
35 km (∼260 and 9 hPa). The relative differences are 5 to 10% below 30 km (∼17 hPa),and 10 to 15% at higher altitudes around 35 km (∼9 hPa). Finally, we note that, ex-cept Odin/SMR, all other satellite instruments (ACE-FTS, ILAS-II, and MIPAS) mea-sure in the IR. These instruments use some overlapped spectral lines/ranges, and thatwouldn’t be so astonishing to have a better agreement. Spectroscopic uncertainties20
could explain why the differences between Odin/SMR and MIPAS are larger. That hasto do with the mix of HITRAN partition functions and JPL intensities used in the Odinv2.0 retrievals, to be optimized. An improved Odin/SMR HNO3 product is underway atthe time of writing this article.
An overall assessment of the MIPAS ESA HNO3 intercomparisons with independent25
observations – as a function of latitudes, seasons, and altitude ranges and ignoringcases where differences are probably caused by strong atmospheric gradients andpresence of clouds - is given in Table 8. In summary, most of these comparisons showthat the ESA MIPAS HNO3 product is generally in good shape, suggesting suitability of
5210
the MIPAS HNO3 VMR profiles for use in geophysical studies.
Acknowledgements. The FTIR work was supported partly by ESA-funded projects EQUAL andTASTE, and by the ProDEx project CINAMON. The FTIR teams acknowledge their national au-thorities for supporting the observations and the people who have participated to them. TheBelgian teams wish to thank the Stiftungsrat of the Jungfraujoch for supporting the facilities al-5
lowing to perform long term and regular observations at that site. Financial support by the DLR(Project 50EE0020) and ESA for the MIPAS-B2 balloon flights is gratefully acknowledged. Wethank the Centre National d’Etudes Spatiales (CNES) balloon launching team and the SwedishSpace Corporation (SSC) Esrange people for excellent balloon operations and the Free Univer-sity of Berlin (K. Grunow and B. Naujokat) for meteorological support. The SPIRALE technical10
team (C. Robert, M. Chartier, L. Pomathiod, T. Lemaire) is acknowledged for making the flightspossible and successful. The campaigns were funded by the European Space Agency (ESA),the French Space Agency (CNES). The MIPAS-B and SPIRALE balloon teams thank the Cen-tre National d’Etudes Spatiales (CNES) launching team and the Swedish Space Corporation(SSC) team at Esrange for the success of the validation campaigns. A. Hauchecorne is ac-15
knowledged for supplying us with the ECMWF data necessary for the computation of PV aswell as F. Coquelet for PV analysis and trajectory calculations. We also thank the Free Uni-versity of Berlin (K. Grunow and B. Naujokat) for meteorological support. The ASUR team ac-knowledge the help and support from their colleagues H. Bremer, K. Kullmann, M. Sinnhuber,J. Notholt and K. Kunzi prior to and during the measurement campaigns. Odin is a Swedish20
led satellite project funded jointly by Sweden (SNSB), Canada (CSA), Finland (TEKES) andFrance (CNES). The ACE mission is supported by the Canadian Space Agency and the Natu-ral Sciences and Engineering Research Council of Canada.
References
Abrams, M. C., Chang, A. Y., Gunson, M. R., Abbas, M. M., Goldman, A., Irion, F. W.,25
Michelsen, H. A., Newchurch, M. J., Rinsland, C. P., Stiller, G. P., and Zander, R.: On theassessment and uncertainty of atmospheric trace gas burden measurements with high res-olution infrared solar occultation spectra from space by the ATMOS experiment, Geophys.Res. Lett., 23(17), 2337–2340, doi:10.1029/96GL01794, 1996. 5176
5211
Austin, J., Garcia, R. R., Russell III, J. M., Solomon, S., and Tuck A. F.: On the atmosphericphotochemistry of nitric acid, J. Geophys. Res., 91(D5), 5477–5485, 1986. 5176
Bianchini, G., Cortesi, U., Palchetti, L., and Pascale, E.: SAFIRE-A (Spectroscopy of the Atmo-sphere by Far-Infrared Emission - Airborne): Optimized Instrument Configuration and NewAssessment of Improved Performance, Appl. Opt., 43(14), 2962–2977, 2004. 51865
Bianchini, G., Boscaleri, A., Carli, B., Mencaraglia, F., Palchetti, L., and Pascale, E.: InfraredBalloon Experiment: improved instrumental configuration and assessment of instrument per-formance, Appl. Opt., 45, 1041–1051, 2006. 5199
Bernath, P. F., McElroy, C. T., Abrams, M. C., et al.: Atmospheric Chemistry Experiment (ACE):Mission Overview, Geophys. Res. Lett., 32, L15S01, doi:10.1029/2005GL022386, 2005.10
5177, 5205Boone, C. D., Nassar, R., Walker, K. A., Rochon, Y., McLeod, S. D., Rinsland, C. P., and
Bernath, P. F.: Retrievals for the atmospheric chemistry experiment Fouriertransform spec-trometer, Appl. Opt., 44(33), 7218–7231, 2005. 5205
Bohringer, H., Fahey, D. W., Fehsenfeld, F. C., and Ferguson, E. E.: The role of ion–molecule15
reactions in the conversion of N2O5 to HNO3 in the stratosphere, Planet. Space. Sci., 31,185–191, 1983. 5176
Bremer, H., von Konig, M., Kleinbohl, A., Kullmann, H., Kunzi, K., Bramstedt, K., Burrows, J.P., Eichmann, K. U., Weber, M., Goede, A. P. H.: Ozone depletion observed by the AirborneSubmillimeter Radiometer (ASUR) during the Arctic Winter 1999/2000, J. Geophys. Res.,20
107(D20), 8277, doi:10.1029/2001JD000546, 2002.Carli, B., Alpaslan, D., Carlotti, M., et al.: First results of MIPAS/ENVISAT with operational Level
2 code, Adv. Space Res., 33, 1012–1019, 2004. 5177, 5180Carlotti, M.: Global-fit approach to the analysis of limb-scanning atmospheric measurements,
Appl. Opt., 27, 3250–3254, 1988. 518025
Cortesi, U., Blom, C. E., Camy-Peyret, C., Chance, K., Davies, J., Goutail, F., Kuttippurath, J.,McElroy, C. T., Mencaraglia, F., Oelhaf, H., Petritoli, A., Pirre, M., Pommereau, J.P., Raveg-nani, F., Renard, J.B. , Strong, K.: MIPAS ozone validation by stratospheric balloon andaircraft measurements, ESA SP-562, Proceedings Second Atmospheric Chemistry Valida-tion of ENVISAT Workshop (ACVE-2), ESRIN, Frascati, Italy, 2004. 5187, 519930
Cortesi, U., Lambert, J. C., De Clercq, C., et al.: Geophysical validation of MIPAS-ENVISAToperational ozone data, Atmos. Chem. Phys. Discuss., in press, 2007. 5185
de Zafra, R. L. and Smyshlyaev, S. P.: On the formation of HNO3 in the Antarc-
5212
tic mid to upper stratosphere in winter, J. Geophys. Res., 106(D19), 23 115–23 126,doi:10.1029/2000JD000314, 2001. 5176
Dragani, R., Redaelli, G., Mariotti, A., Rudakov, V.V., MacKenzie, A.R., Stefanutti, L., andVisconti, G.: High resolution stratospheric tracer fields reconstructed with Lagrangian tech-niques: a comparative analysis of predictive skill, J. Atmos. Sci., 59, 1943–1958, 2002. 51995
Dudhia, A., Jay, V. L., and Rodgers, C. D.: Microwindow selection for high-spectral-resolutionsounders, Appl. Optics, 41, 3665, 2002. 5180
ESA, Envisat: MIPAS, An instrument for atmospheric chemistry and climate research, ESASP-1229, European Space Agency, Noordwijk, The Netherlands, 2000. 5177
Fischer, H. and Oelhaf, H.: Remote sensing of vertical profiles of atmospheric trace con-10
stituents with MIPAS limb emission spectrometers, Appl. Opt., 35(16), 2787–2796, 1996.5177
Fix, A., Ehret, G., Flentje, H., Poberaj, G., Gottwald, M., Finkenzeller, H., Bremer, H., Bruns,M., Burrows, J. P., Kleinbohl, A., Kullmann, H., Kuttippurath, J., Richter, A., Wang, P., Heue,K.-P., Platt, U., and Wagner, T.: SCIAMACHY validation by aircraft remote measurements:15
Design, execution, and first results of the SCIA-VALUE mission, Atmos. Chem. Phys., 5,1273–1289, 2005,http://www.atmos-chem-phys.net/5/1273/2005/. 5191
Flaud, J. M., Perrin, A., Orphal, J., Kou, Q., Flaud, P.-M., Dutkiewicz, Z., and Piccolo, C.: Newanaylsis of the ν5 + ν9 − ν9 hot band of HNO3, J. Quant. Spectrosc. Radiat. Transfer, 77,20
355–364, 2003. 5183Friedl-Vallon, F., Maucher, G., Kleinert, A., Lengel, A., Keim, C., Oelhaf, H., Fischer, H.,
Seefeldner, M., and Trieschmann, O.: Design and characterization of the balloon-borneMichelson Interferometer for Passive Atmospheric Sounding (MIPAS-B2), Appl. Opt., 43,3335–3355, 2004. 519325
Gille, J. C. and Russell, J. M.: The Limb Infrared Monitor of the Stratosphere: ExperimentDescription, Performance, and Results, J. Geophys. Res., 89, 5125–5140, 1984. 5177
Glatthor, N., von Clarmann, T., Fischer, H., Funke, B., Gil-Lopez, S., Grabowski, U., Hopfner,M., Kellmann, S., Linden, A., Lopez-Puertas, M., Mengistu Tsidu, G., Milz, M., Steck, T.,Stiller, G.P., and Wang, D.Y.: Retrieval of stratospheric ozone profiles from MIPAS/ENVISAT30
limb emission spectra: a sensitivity study, Atmos. Chem. Phys., 6, 2767–2781, 2006,http://www.atmos-chem-phys.net/6/2767/2006/. 5195
Gunson, M. R., Abbas, M. M., Abrams, M. C., Allen, M., Brown, L. R., Brown, T. L., Chang,
5213
A. Y., Goldman, A., Irion, F. W., Lowes, L. L., Mahieu, E., Manney, G. L., Michelsen, H.A., Newchurch, M. J., Rinsland, C. P., Salawitch, R. J., Stiller, G. P., Toon, G. C., Yung,Y. L., and Zander, R.: The Atmospheric Trace Molecule Spectroscopy (ATMOS) experiment:Deployment on the ATLAS Space Shuttle missions, Geophys. Res. Lett., 23(17), 2333–2336,doi:10.1029/96GL01569, 1996. 51765
Hase, F.: Inversion von Spurengasprofilen aus hochaufgelosten bodengebundenen FTIR-Messungen in Absorption, Dissertation, FZK Report No. 6512, Forschungszentrum Karl-sruhe, Germany, 2000. 5183
Hase, F., Hannigan, J. W., Coffey, M. T., et al.: Intercomparison of retrieval codes used forthe analysis of high-resolution, ground-based FTIR measurements, Journal of Quantitative10
Spectroscopy & Radiative Transfer 87, 25–52, 2004. 5183Hauchecorne, A., Godin, S., Marchand, M., Heese, B., and Souprayen, C.: Quantification
of the transport of chemical constituents from the polar vortex to midlatitudes in the lowerstratosphere using the high-resolution advection model MIMOSA and effective diffusivity, J.Geophys. Res., 107(D20), 8289, doi:10.1029/2001JD000491, 2002. 519715
Hopfner M., Stiller, G. P., Kuntz, M., et al.: The Karlsruhe optimized and precise radiativetransfer algorithm, Part II: Interface to retrieval applications, SPIE Proceedings, 3501, 186–195, 1998. 5183
Hopfner, M., Blom, C.E., Echle, G., Glatthor, N., Hase, F. Stiller, G.: Retrieval simulations forMIPAS-STR measurements, Smith, W.L. [Hrsg.] IRS 2000: Current Problems in Atmospheric20
Radiation; Proc.of the Internat. Radiation Symp., St.Petersburg, Russia, July 24-29, 2000Hampton, Va. : DEEPAK Publ., 2001. 5187
Irie, H., Kondo, Y., Koike, M., et al.: Validation of NO2 and HNO3 measurements from theImproved Limb Atmospheric Spectrometer (ILAS) with the version 5.20 retrieval algorithm, J.Geophys. Res., 107(D24), 8206, doi:10.1029/2001JD001304, 2002. 517725
Irie, H., Sugita, T., Nakajima, H., et al.: Validation of stratospheric nitric acid profiles observedby Improved Limb Atmospheric Spectrometer (ILAS)-II, J. Geophys. Res., 111, D11S03,doi:10.1029/2005JD006115, 2006. 5177, 5204
Irion, F. W., Gunson, M. R., Toon, G. C., et al.: Atmospheric Trace Molecule Spectroscopy(ATMOS) Experiment Version 3 data retrievals, Appl. Opt., 41(33), 6968–6979, 2002.30
Kiefer, M., von Clarmann, T., Grabowski, U., De Laurentis, M., Mantovani, R., Milz, M., andRidolfi, M.: Characterization of MIPAS elevation pointing, Atmos. Chem. Phys. Discuss., 6,13 075–13 110, 2006. 5181
5214
Kleinbohl, A., Bremer, H., von Konig, M., Kullmann, H., Kunzi, K., Goede, A. P. H., Browell, E,V., Grant, W. B., Toon, G. C., Blumenstock, T., Galle, B., Sinnhuber, B.-M., and Davies, S.:Vortexwide denitrification of the Arctic polar stratosphere in winter 1999/2000 determined byremote observations, J. Geophys. Res., 108(D5), 8305, doi:10.1029/2001JD001042, 2003.51915
Kleinbohl, A., Kuttippurath, J., Sinnhuber, M., Sinnhuber, B.-M., Kullmann, H., Kunzi, K., andNotholt, J.: Rapid meridional transport of tropical airmasses to the Arctic during the majorstratospheric warming in January 2003, Atmos. Phys. Chem., 5, 1291–1299, 2005. 5191
Keim, C., Blom, C.E., Von Der Gathen, P., Gulde, T., Hopfner, M., Liu, G.Y., Oulanovski, A.,Piesch, C., Ravegnani, F., Sartorius, C., Schlager, H., Volk, C.M.: Validation of MIPAS-10
ENVISAT by correlative measurements of MIPAS-STR, Proc. ACVE-2 meeting, 3–7 May2004, Frascati, Italy, ESA SP-562, 2004. 5187
Koike, M., Kondo, Y., Irie, H., et al.: A comparison of Arctic HNO3 profiles measured by theImproved Limb Atmospheric Spectrometer and balloon-borne sensors, J. Geophys. Res.,105(D5), 6761–6771, 2000. 517715
Kumer, J. B., Mergenthaler, J. L., Roche, A. E., Nightingale, R. W., Ely, G. A., Uplinger, W. G.,Gille, J. C., Massie, S. T., Bailey, P. L., Gunson, M. R., Abrams, M. C., Toon, G. C., Sen,B., Blavier, J., Stachnik, R. A., Webster, C. R., May, R. D., Murcray, D. G., Murcray, F. J.,Goldman, A., Traub, W. A., Jucks, K. W., and Johnson, D.G.: Comparison of correlative datawith HNO3 version 7 from the CLAES instrument deployed on the NASA Upper Atmosphere20
Research Satellite, J. Geophys. Res., 101(D6), 9621–9656, doi:10.1029/95JD03759, 1996.5177
Kuttippurath, J.: Study of stratospheric composition using airborne submillimeter radiometryand a chemical transport model, Ph D. Thesis, ISBN 3-8325-11069-9, Logos Verlag, Berlin,2005. 519125
Mees, J., Crewell, S., Nett, H., de Lange, G., van de Stadt, H., Kuipers, J. J., and Panhuyzen,R. A.: ASUR – An Airborne SIS-Receiver for Atmospheric Measurements at 625 to 720 GHz,IEEE Trans. Microwave Theory Tech., 43(11), 2543–2548, 1995. 5190
Mencaraglia, F., G. Bianchini, A. Boscaleri, B. Carli, S. Ceccherini, P. Raspollini, A. Perrin, J-M.Flaud: Validation of MIPAS satellite measurements of HNO3 using comparison of rotational30
and vibrational spectroscopy, J. Geophys. Res., 111, D19305, doi:10.1029/2005JD006099,2006. 5177
Mengistu Tsidu, G., Stiller, G. P., von Clarmann, T., Funke, B., Hopfner, M., Fischer, H., Glatthor,
5215
N., Grabowski, U., Kellmann, S., Kiefer, M., Linden, A., Lopez-Puertas, M., Milz, M., Steck,T., and Wang, D.-Y.: NOy from Michelson Interferometer for Passive Atmospheric Sound-ing on environmental satellite during the southern hemisphere polar vortex split in Septem-ber/October 2002, J. Geophys. Res., 110(D11), D11301, doi:10.1029/2004JD005322, 2005.5178, 51945
Moreau, G., Robert, C., Catoire, V., Chartier, M., Camy-Peyret, C., Huret, N., Pirre, M., Po-mathiod, L., and Chalumeau, G.: SPIRALE: a multispecies in situ balloon-borne instrumentwith six tunable diode laser spectrometers, Appl. Opt., 44, 28, 5972–5989, 2005. 5196
Murtagh, D. P., Frisk, U., Merino, F., et al.: An overview of the Odin atmospheric mission, Can.J. Phy., 80(4), 309–319, 2002. 517710
Oelhaf, H., Blumenstock, T., de Maziere, M., Mikuteit, S., Vigouroux, C., Wood, S., Bianchini,G., Baumann, R., Blom, C., Cortesi, U., Liu, G. Y., Schlager, H., Camy-Peyret, C., Catoire,V., Pirre, M., Strong, K., and Wetzel, G.: Validation of MIPAS-ENVISAT Version 4.61 HNO3operational data by stratospheric ballon, aircraft and ground–based measurements, in: Pro-ceedings of the Second Workshop on the Atmospheric Chemistry Validation of ENVISAT15
(ACVE-2), 3–7 May 2004, ESA-ESRIN, Frascati, Italy, edited by: Danesy, D., vol. ESA SP–562, CD-ROM, ESA Publications Division, ESTEC, Postbus 299, 2200 AG Noordwijk, TheNetherlands, August 2004. 5177
Piesch, C., Gulde, T., Sartorius, C., Friedl-Vallon, F., Seefeldner, M., Wolfel, M., Blom, C.E.,and Fischer, H.: Design of a MIPAS instrument for high-altitude aircraft, Proc. of the 2nd20
Internat. Airborne Remote Sensing Conference and Exhibition, ERIM, Ann Arbor, MI, Vol. II,199–208, 1996. 5187
Pougatchev, N. S. and Rinsland, C. P.: Spectroscopic study of the seasonal variation of carbonmonoxide vertical distribution above Kitt Peak, J. Geophys. Res., 100, 1409–1416, 1995.518325
Pougatchev, N. S., Connor, B. J., and Rinsland, C. P.: Infrared measurements of the ozonevertical distribution above Kitt Peak, J. Geophys. Res., 100, 16 689–16 697, 1995. 5183
Raspollini, P., Belotti, C., Burgess, A., et al.: MIPAS level 2 operational analysis, Atmos. Chem.Phys., 6, 5605–5630, 2006,http://www.atmos-chem-phys.net/6/5605/2006/. 5177, 5180, 518330
Redaelli, G.: Lagrangian techniques for the analysis of stratospheric measurements, Ph.Dthesis, University of L’Aquila, Italy, 1997. 5199
Rinsland, C.P., Jones, N. B., Connor, B. J., et al.: Northern and southern hemisphere ground-
5216
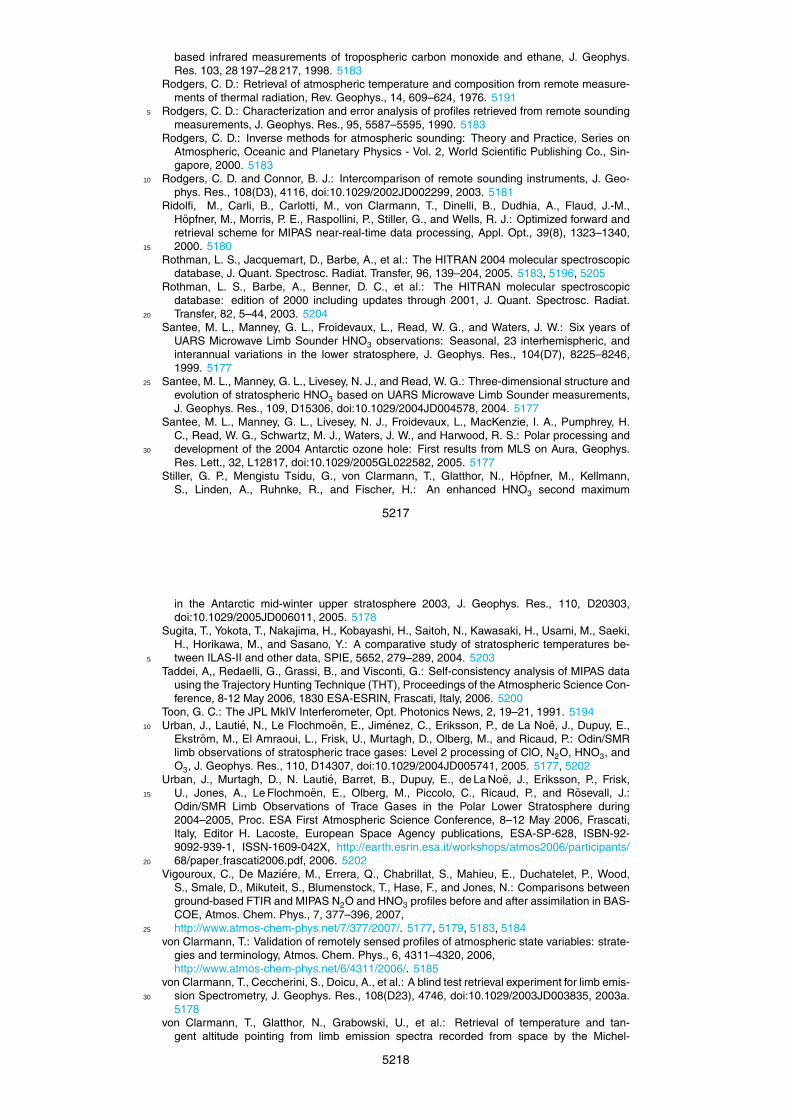
based infrared measurements of tropospheric carbon monoxide and ethane, J. Geophys.Res. 103, 28 197–28 217, 1998. 5183
Rodgers, C. D.: Retrieval of atmospheric temperature and composition from remote measure-ments of thermal radiation, Rev. Geophys., 14, 609–624, 1976. 5191
Rodgers, C. D.: Characterization and error analysis of profiles retrieved from remote sounding5
measurements, J. Geophys. Res., 95, 5587–5595, 1990. 5183Rodgers, C. D.: Inverse methods for atmospheric sounding: Theory and Practice, Series on
Atmospheric, Oceanic and Planetary Physics - Vol. 2, World Scientific Publishing Co., Sin-gapore, 2000. 5183
Rodgers, C. D. and Connor, B. J.: Intercomparison of remote sounding instruments, J. Geo-10
phys. Res., 108(D3), 4116, doi:10.1029/2002JD002299, 2003. 5181Ridolfi, M., Carli, B., Carlotti, M., von Clarmann, T., Dinelli, B., Dudhia, A., Flaud, J.-M.,
Hopfner, M., Morris, P. E., Raspollini, P., Stiller, G., and Wells, R. J.: Optimized forward andretrieval scheme for MIPAS near-real-time data processing, Appl. Opt., 39(8), 1323–1340,2000. 518015
Rothman, L. S., Jacquemart, D., Barbe, A., et al.: The HITRAN 2004 molecular spectroscopicdatabase, J. Quant. Spectrosc. Radiat. Transfer, 96, 139–204, 2005. 5183, 5196, 5205
Rothman, L. S., Barbe, A., Benner, D. C., et al.: The HITRAN molecular spectroscopicdatabase: edition of 2000 including updates through 2001, J. Quant. Spectrosc. Radiat.Transfer, 82, 5–44, 2003. 520420
Santee, M. L., Manney, G. L., Froidevaux, L., Read, W. G., and Waters, J. W.: Six years ofUARS Microwave Limb Sounder HNO3 observations: Seasonal, 23 interhemispheric, andinterannual variations in the lower stratosphere, J. Geophys. Res., 104(D7), 8225–8246,1999. 5177
Santee, M. L., Manney, G. L., Livesey, N. J., and Read, W. G.: Three-dimensional structure and25
evolution of stratospheric HNO3 based on UARS Microwave Limb Sounder measurements,J. Geophys. Res., 109, D15306, doi:10.1029/2004JD004578, 2004. 5177
Santee, M. L., Manney, G. L., Livesey, N. J., Froidevaux, L., MacKenzie, I. A., Pumphrey, H.C., Read, W. G., Schwartz, M. J., Waters, J. W., and Harwood, R. S.: Polar processing anddevelopment of the 2004 Antarctic ozone hole: First results from MLS on Aura, Geophys.30
Res. Lett., 32, L12817, doi:10.1029/2005GL022582, 2005. 5177Stiller, G. P., Mengistu Tsidu, G., von Clarmann, T., Glatthor, N., Hopfner, M., Kellmann,
S., Linden, A., Ruhnke, R., and Fischer, H.: An enhanced HNO3 second maximum
5217
in the Antarctic mid-winter upper stratosphere 2003, J. Geophys. Res., 110, D20303,doi:10.1029/2005JD006011, 2005. 5178
Sugita, T., Yokota, T., Nakajima, H., Kobayashi, H., Saitoh, N., Kawasaki, H., Usami, M., Saeki,H., Horikawa, M., and Sasano, Y.: A comparative study of stratospheric temperatures be-tween ILAS-II and other data, SPIE, 5652, 279–289, 2004. 52035
Taddei, A,, Redaelli, G., Grassi, B., and Visconti, G.: Self-consistency analysis of MIPAS datausing the Trajectory Hunting Technique (THT), Proceedings of the Atmospheric Science Con-ference, 8-12 May 2006, 1830 ESA-ESRIN, Frascati, Italy, 2006. 5200
Toon, G. C.: The JPL MkIV Interferometer, Opt. Photonics News, 2, 19–21, 1991. 5194Urban, J., Lautie, N., Le Flochmoen, E., Jimenez, C., Eriksson, P., de La Noe, J., Dupuy, E.,10
Ekstrom, M., El Amraoui, L., Frisk, U., Murtagh, D., Olberg, M., and Ricaud, P.: Odin/SMRlimb observations of stratospheric trace gases: Level 2 processing of ClO, N2O, HNO3, andO3, J. Geophys. Res., 110, D14307, doi:10.1029/2004JD005741, 2005. 5177, 5202
Urban, J., Murtagh, D., N. Lautie, Barret, B., Dupuy, E., de La Noe, J., Eriksson, P., Frisk,U., Jones, A., Le Flochmoen, E., Olberg, M., Piccolo, C., Ricaud, P., and Rosevall, J.:15
Odin/SMR Limb Observations of Trace Gases in the Polar Lower Stratosphere during2004–2005, Proc. ESA First Atmospheric Science Conference, 8–12 May 2006, Frascati,Italy, Editor H. Lacoste, European Space Agency publications, ESA-SP-628, ISBN-92-9092-939-1, ISSN-1609-042X, http://earth.esrin.esa.it/workshops/atmos2006/participants/68/paper frascati2006.pdf, 2006. 520220
Vigouroux, C., De Maziere, M., Errera, Q., Chabrillat, S., Mahieu, E., Duchatelet, P., Wood,S., Smale, D., Mikuteit, S., Blumenstock, T., Hase, F., and Jones, N.: Comparisons betweenground-based FTIR and MIPAS N2O and HNO3 profiles before and after assimilation in BAS-COE, Atmos. Chem. Phys., 7, 377–396, 2007,http://www.atmos-chem-phys.net/7/377/2007/. 5177, 5179, 5183, 518425
von Clarmann, T.: Validation of remotely sensed profiles of atmospheric state variables: strate-gies and terminology, Atmos. Chem. Phys., 6, 4311–4320, 2006,http://www.atmos-chem-phys.net/6/4311/2006/. 5185
von Clarmann, T., Ceccherini, S., Doicu, A., et al.: A blind test retrieval experiment for limb emis-sion Spectrometry, J. Geophys. Res., 108(D23), 4746, doi:10.1029/2003JD003835, 2003a.30
5178von Clarmann, T., Glatthor, N., Grabowski, U., et al.: Retrieval of temperature and tan-
gent altitude pointing from limb emission spectra recorded from space by the Michel-
5218
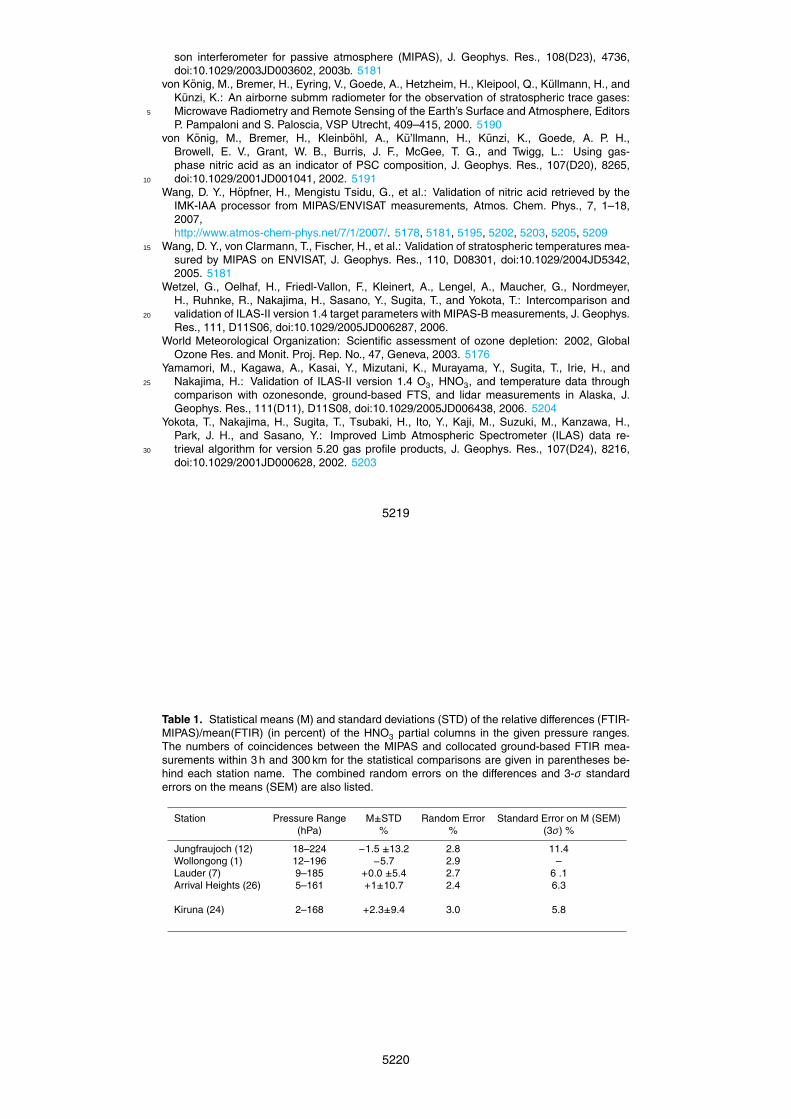
son interferometer for passive atmosphere (MIPAS), J. Geophys. Res., 108(D23), 4736,doi:10.1029/2003JD003602, 2003b. 5181
von Konig, M., Bremer, H., Eyring, V., Goede, A., Hetzheim, H., Kleipool, Q., Kullmann, H., andKunzi, K.: An airborne submm radiometer for the observation of stratospheric trace gases:Microwave Radiometry and Remote Sensing of the Earth’s Surface and Atmosphere, Editors5
P. Pampaloni and S. Paloscia, VSP Utrecht, 409–415, 2000. 5190von Konig, M., Bremer, H., Kleinbohl, A., Ku’llmann, H., Kunzi, K., Goede, A. P. H.,
Browell, E. V., Grant, W. B., Burris, J. F., McGee, T. G., and Twigg, L.: Using gas-phase nitric acid as an indicator of PSC composition, J. Geophys. Res., 107(D20), 8265,doi:10.1029/2001JD001041, 2002. 519110
Wang, D. Y., Hopfner, H., Mengistu Tsidu, G., et al.: Validation of nitric acid retrieved by theIMK-IAA processor from MIPAS/ENVISAT measurements, Atmos. Chem. Phys., 7, 1–18,2007,http://www.atmos-chem-phys.net/7/1/2007/. 5178, 5181, 5195, 5202, 5203, 5205, 5209
Wang, D. Y., von Clarmann, T., Fischer, H., et al.: Validation of stratospheric temperatures mea-15
sured by MIPAS on ENVISAT, J. Geophys. Res., 110, D08301, doi:10.1029/2004JD5342,2005. 5181
Wetzel, G., Oelhaf, H., Friedl-Vallon, F., Kleinert, A., Lengel, A., Maucher, G., Nordmeyer,H., Ruhnke, R., Nakajima, H., Sasano, Y., Sugita, T., and Yokota, T.: Intercomparison andvalidation of ILAS-II version 1.4 target parameters with MIPAS-B measurements, J. Geophys.20
Res., 111, D11S06, doi:10.1029/2005JD006287, 2006.World Meteorological Organization: Scientific assessment of ozone depletion: 2002, Global
Ozone Res. and Monit. Proj. Rep. No., 47, Geneva, 2003. 5176Yamamori, M., Kagawa, A., Kasai, Y., Mizutani, K., Murayama, Y., Sugita, T., Irie, H., and
Nakajima, H.: Validation of ILAS-II version 1.4 O3, HNO3, and temperature data through25
comparison with ozonesonde, ground-based FTS, and lidar measurements in Alaska, J.Geophys. Res., 111(D11), D11S08, doi:10.1029/2005JD006438, 2006. 5204
Yokota, T., Nakajima, H., Sugita, T., Tsubaki, H., Ito, Y., Kaji, M., Suzuki, M., Kanzawa, H.,Park, J. H., and Sasano, Y.: Improved Limb Atmospheric Spectrometer (ILAS) data re-trieval algorithm for version 5.20 gas profile products, J. Geophys. Res., 107(D24), 8216,30
doi:10.1029/2001JD000628, 2002. 5203
5219
Table 1. Statistical means (M) and standard deviations (STD) of the relative differences (FTIR-MIPAS)/mean(FTIR) (in percent) of the HNO3 partial columns in the given pressure ranges.The numbers of coincidences between the MIPAS and collocated ground-based FTIR mea-surements within 3 h and 300 km for the statistical comparisons are given in parentheses be-hind each station name. The combined random errors on the differences and 3-σ standarderrors on the means (SEM) are also listed.
Station Pressure Range M±STD Random Error Standard Error on M (SEM)(hPa) % % (3σ) %
Jungfraujoch (12) 18–224 −1.5 ±13.2 2.8 11.4Wollongong (1) 12–196 −5.7 2.9 –Lauder (7) 9–185 +0.0 ±5.4 2.7 6 .1Arrival Heights (26) 5–161 +1±10.7 2.4 6.3
Kiruna (24) 2–168 +2.3±9.4 3.0 5.8
5220

Table 2. Coincident measurements between SAFIRE and MIPAS scans of orbit 3403 on 24October 2002. See Fig. 3 for the absolute geolocations.
MIPAS scan SAFIRE scan ∆t [min] ∆lat [degree] ∆lon [degree] ∆s [km]
14 5 102 –1.85 0.05 205.914 6 95 –1.07 –0.07 119.814 7 86 –1.33 –1.47 196.314 8 62 –1.17 0.59 14014 9 53 –1.84 0.27 205.714 10 46 –2.39 0.89 277.415 1 135 –0.17 –0.39 37.815 2 128 0.16 –0.52 46.315 3 119 1.09 –0.62 132.115 4 112 1.89 –0.73 218.615 10 47 2.31 –0.07 257.715 11 38 1.53 0.64 178.615 12 30 0.91 1.24 144.615 13 21 0.21 1.97 164.415 14 14 -0.39 2.43 204.815 15 5 -0.67 2.05 18415 16 –1 –1.49 1.89 226.715 18 –18 –1.84 2.47 287.415 19 –27 –1.87 1.00 223.115 20 —34 –1.85 –0.10 206.616 17 –9 2.42 0.83 277.1
5221
Table 3. Coincident measurements between SAFIRE and MIPAS scans of orbit 5250 on 2March 2003. See Fig. 4 for the absolute geolocations.
MIPAS scan SAFIRE scan ∆t [min] ∆lat [degree] ∆lon [degree] ∆s [km]
19 6 51 –2.59 0.99 292.619 7 43 –1.89 1.23 219.419 8 34 –1.14 1.52 149.219 9 27 –0.63 1.82 118.119 10 18 –0.51 2.16 126.419 11 11 –0.21 2.7 143.719 12 2 -0.15 –0.2 20.119 13 –4 –0.83 –0.28 93.619 14 –13 –1.7 –0.45 190.119 15 –21 –2.34 –0.57 262.120 1 93 –0.7 –1.33 97.820 2 84 –1.35 0.22 150.420 3 77 –0.55 0.2 62.220 4 68 0.46 0.1 51.220 5 61 1.26 0.09 140.520 6 52 2.12 –0.04 235.820 7 44 2.82 0.2 31420 15 –20 2.37 –1.59 273.920 16 –29 1.47 –1.65 179.920 17 –36 0.8 –1.71 118.520 18 –45 -0.1 –1.83 82.120 19 –52 -0.77 –1.83 117.420 20 –61 –1.6 –1.98 197.220 21 –69 –2.3 –1.98 269.221 21 –67 2.54 –1.95 292.921 22 –76 1.76 –2.05 210.121 23 –83 1.08 –2.15 14421 24 –92 –0.46 0.19 52.1
5222
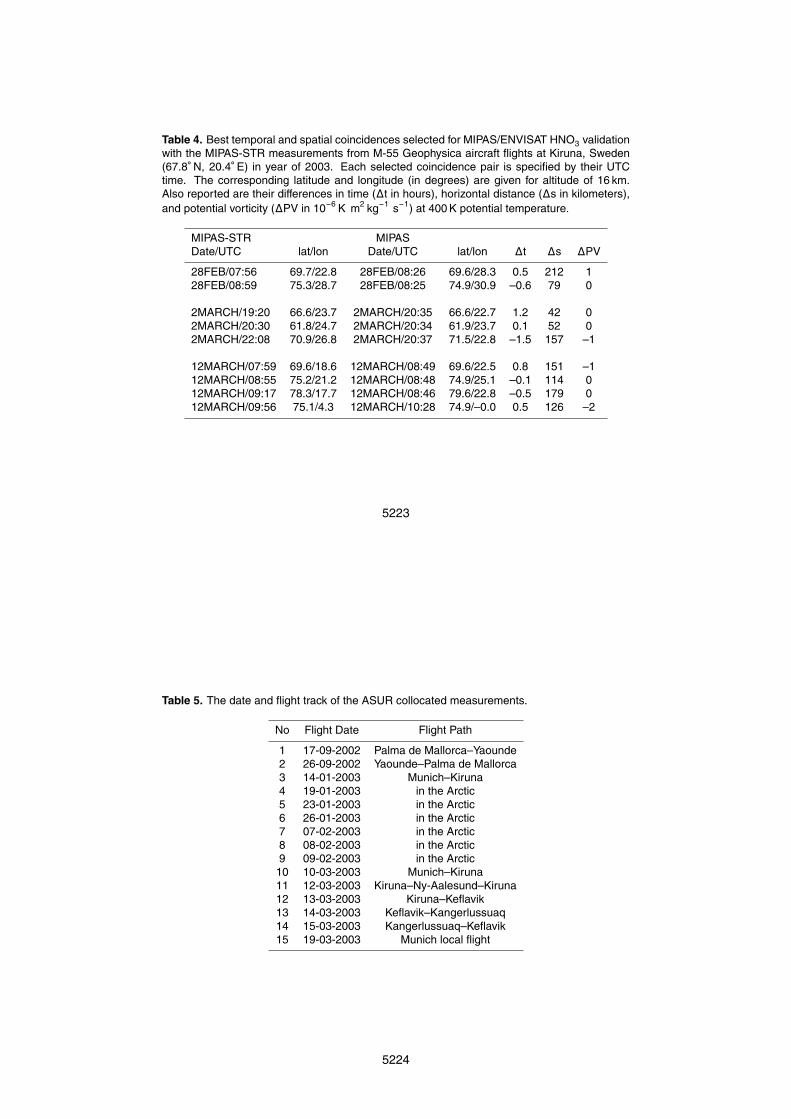
Table 4. Best temporal and spatial coincidences selected for MIPAS/ENVISAT HNO3 validationwith the MIPAS-STR measurements from M-55 Geophysica aircraft flights at Kiruna, Sweden(67.8◦ N, 20.4◦ E) in year of 2003. Each selected coincidence pair is specified by their UTCtime. The corresponding latitude and longitude (in degrees) are given for altitude of 16 km.Also reported are their differences in time (∆t in hours), horizontal distance (∆s in kilometers),and potential vorticity (∆PV in 10−6 K m2 kg−1 s−1) at 400 K potential temperature.
MIPAS-STR MIPASDate/UTC lat/lon Date/UTC lat/lon ∆t ∆s ∆PV
28FEB/07:56 69.7/22.8 28FEB/08:26 69.6/28.3 0.5 212 128FEB/08:59 75.3/28.7 28FEB/08:25 74.9/30.9 –0.6 79 0
2MARCH/19:20 66.6/23.7 2MARCH/20:35 66.6/22.7 1.2 42 02MARCH/20:30 61.8/24.7 2MARCH/20:34 61.9/23.7 0.1 52 02MARCH/22:08 70.9/26.8 2MARCH/20:37 71.5/22.8 –1.5 157 –1
12MARCH/07:59 69.6/18.6 12MARCH/08:49 69.6/22.5 0.8 151 –112MARCH/08:55 75.2/21.2 12MARCH/08:48 74.9/25.1 –0.1 114 012MARCH/09:17 78.3/17.7 12MARCH/08:46 79.6/22.8 –0.5 179 012MARCH/09:56 75.1/4.3 12MARCH/10:28 74.9/–0.0 0.5 126 –2
5223
Table 5. The date and flight track of the ASUR collocated measurements.
No Flight Date Flight Path
1 17-09-2002 Palma de Mallorca–Yaounde2 26-09-2002 Yaounde–Palma de Mallorca3 14-01-2003 Munich–Kiruna4 19-01-2003 in the Arctic5 23-01-2003 in the Arctic6 26-01-2003 in the Arctic7 07-02-2003 in the Arctic8 08-02-2003 in the Arctic9 09-02-2003 in the Arctic
10 10-03-2003 Munich–Kiruna11 12-03-2003 Kiruna–Ny-Aalesund–Kiruna12 13-03-2003 Kiruna–Keflavik13 14-03-2003 Keflavik–Kangerlussuaq14 15-03-2003 Kangerlussuaq–Keflavik15 19-03-2003 Munich local flight
5224
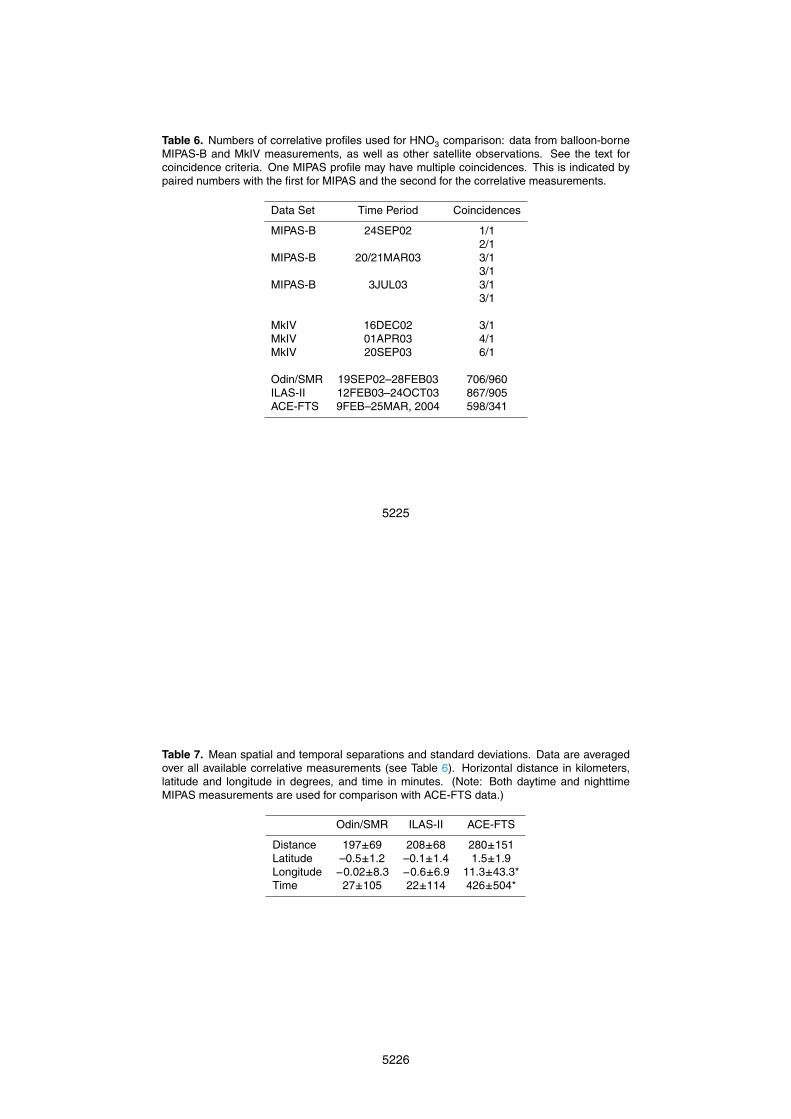
Table 6. Numbers of correlative profiles used for HNO3 comparison: data from balloon-borneMIPAS-B and MkIV measurements, as well as other satellite observations. See the text forcoincidence criteria. One MIPAS profile may have multiple coincidences. This is indicated bypaired numbers with the first for MIPAS and the second for the correlative measurements.
Data Set Time Period Coincidences
MIPAS-B 24SEP02 1/12/1
MIPAS-B 20/21MAR03 3/13/1
MIPAS-B 3JUL03 3/13/1
MkIV 16DEC02 3/1MkIV 01APR03 4/1MkIV 20SEP03 6/1
Odin/SMR 19SEP02–28FEB03 706/960ILAS-II 12FEB03–24OCT03 867/905ACE-FTS 9FEB–25MAR, 2004 598/341
5225
Table 7. Mean spatial and temporal separations and standard deviations. Data are averagedover all available correlative measurements (see Table 6). Horizontal distance in kilometers,latitude and longitude in degrees, and time in minutes. (Note: Both daytime and nighttimeMIPAS measurements are used for comparison with ACE-FTS data.)
Odin/SMR ILAS-II ACE-FTS
Distance 197±69 208±68 280±151Latitude –0.5±1.2 –0.1±1.4 1.5±1.9Longitude −0.02±8.3 −0.6±6.9 11.3±43.3*Time 27±105 22±114 426±504*
5226

Table 8. Overview of HNO3 profile comparisons between MIPAS and validation instruments fordifferent latitudes, seasons and altitude ranges.
Instrument Time Region MIPAS – Instrument [ppbv]below 100 hPa 100–10 hPa above 10 hPa
SAFIRE Autumn N-midlat ±0.5 −0.5–1.0SAFIRE Spring N-highlat ±0.5 1.0MIPAS-STR Summer N-midlat ±0.1 0.3MIPAS-STR Spring N-highlat ±0.5 −0.5–1.0ASUR Autumn–Spring Trop −1.3–0.7 0.5ASUR Autumn–Spring N-midlat −1.2–0.7 ±0.1ASUR Autumn–Spring N-highlat −0.4 0.1MIPAS-B Autumn N-midlat −0.5–1.0 −0.5–0.1MIPAS-B Spring N-highlat ±1.0MIPAS-B Summer N-highlat ±0.5 −0.5 – 1.0 −0.5–0.3MkIV Spring N-highlat ±1.0 ±1.0MkIV Autumn N-midlat −0.3 ±0.5 ±0.5SPIRALE Winter N-highlat −0.3 −3–1.5IBEX Summer N-midlat 0.3 −0.9–0.5 0.8ODIN Autumn–Winter N-highlat −2.5–−0.5 −0.5–0.3ODIN Autumn–Winter N-midlat −2–−1 −0.5–0.5ODIN Autumn–Winter S-highlat −1–0 0–0.5ILAS-II Spring–Autumn N-highlat −0.1 −0.1–0.5 −0.8–0.1ILAS-II Spring–Autumn N-midlat −0.3–0 ±0.7 −0.9–−0.1ILAS-II Spring–Autumn S-highlat –0.3–0.1 ±0.5 −3–0ACE-FTS Spring N-midlat ±0.5 ±0.5 −0.4–−0.2ACE-FTS Spring N-highlat ±0.1 −0.3–0.5 −0.4–−0.1
5227
1.2
1.4
1.6
1.8
2
2.2
2.4
2.6
2.8x 10
16
PC
am
ount
[mol
ec. c
m−
2 ]
Partial columns (168−2 hPa) of HNO3 at Kiruna
Jul 02 Oct 02 Jan 03 Apr 03 Jul 03 Oct 03 Jan 04 Apr 04−40−20
02040
Diff
eren
ces
[%]
Date
FTIRMIPAS
0.8
1
1.2
1.4
1.6
1.8
2
2.2x 10
16
PC
am
ount
[mol
ec. c
m−
2 ]
Partial columns (224−18 hPa) of HNO3 at Jungfraujoch
Jul 02 Oct 02 Jan 03 Apr 03 Jul 03 Oct 03 Jan 04 Apr 04−40−20
02040
Diff
eren
ces
[%]
Date
1
1.1
1.2
1.3
1.4
1.5
1.6
1.7
1.8
1.9x 10
16
PC
am
ount
[mol
ec. c
m−
2 ]
Partial columns (185−9 hPa) of HNO3 at Lauder
Jul 02 Oct 02 Jan 03 Apr 03 Jul 03 Oct 03 Jan 04 Apr 04−40−20
02040
Diff
eren
ces
[%]
Date
0.4
0.6
0.8
1
1.2
1.4
1.6
1.8
2
x 1016
PC
am
ount
[mol
ec. c
m−
2 ]
Partial columns (161−5 hPa) of HNO3 at Arrival Heights
Jul 02 Oct 02 Jan 03 Apr 03 Jul 03 Oct 03 Jan 04 Apr 04−40−20
02040
Diff
eren
ces
[%]
Date
Fig. 1. Time series of ground-based FTIR (red circles) and ESA operational MIPAS (bluestars) HNO3 partial columns (large panels) and their relative differences (small panels) at fourstations: Kiruna (top-left), Jungfraujoch (top-right), Lauder (bottom-left), and Arrival Heights(bottom-right). The pressure ranges used for the partial columns are given in the titles. Therelative differences are calculated as (MIPAS-FTIR)/mean(FTIR).
5228
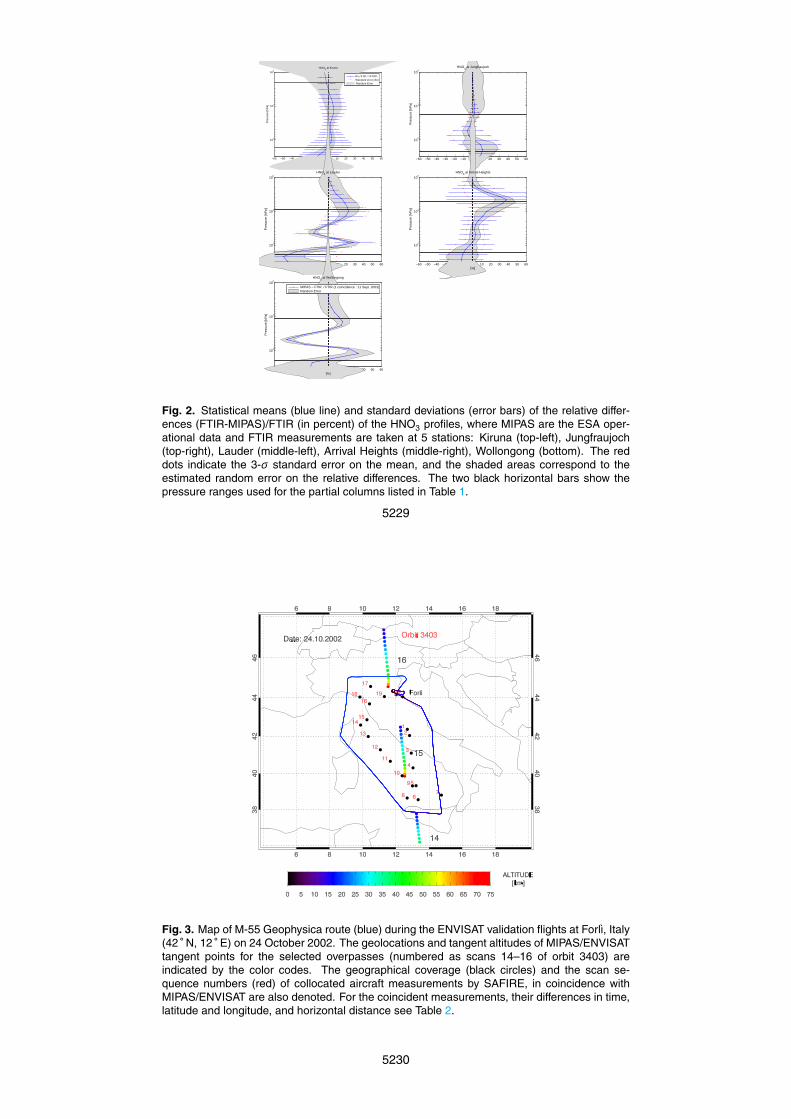
−60 −50 −40 −30 −20 −10 0 10 20 30 40 50 60
100
101
102
[%]
Pre
ssur
e [h
Pa]
HNO3 at Kiruna
M ± STD / <FTIR>Standard error (3σ) Random Error
−60 −50 −40 −30 −20 −10 0 10 20 30 40 50 60
100
101
102
[%]
Pre
ssur
e [h
Pa]
HNO3 at Jungfraujoch
−60 −50 −40 −30 −20 −10 0 10 20 30 40 50 60
100
101
102
[%]P
ress
ure
[hP
a]
HNO3 at Lauder
−60 −50 −40 −30 −20 −10 0 10 20 30 40 50 60
100
101
102
[%]
Pre
ssur
e [h
Pa]
HNO3 at Arrival Heights
−60 −50 −40 −30 −20 −10 0 10 20 30 40 50 60
100
101
102
[%]
Pre
ssur
e [h
Pa]
HNO3 at Wollongong
MIPAS − FTIR / FTIR (1 coincidence : 11 Sept. 2003) Random Error
Fig. 2. Statistical means (blue line) and standard deviations (error bars) of the relative differences (FTIR-
MIPAS)/FTIR (in percent) of the �)��� � profiles, where MIPAS are the ESA operational data and FTIR mea-
surements are taken at 5 stations: Kiruna (top-left), Jungfraujoch (top-right), Lauder (middle-left), Arrival
Heights (middle-right), Wollongong (bottom). The red dots indicate the 3- � standard error on the mean, and
the shaded areas correspond to the estimated random error on the relative differences. The two black horizontal
bars show the pressure ranges used for the partial columns listed in Table 1.
46
Fig. 2. Statistical means (blue line) and standard deviations (error bars) of the relative differ-ences (FTIR-MIPAS)/FTIR (in percent) of the HNO3 profiles, where MIPAS are the ESA oper-ational data and FTIR measurements are taken at 5 stations: Kiruna (top-left), Jungfraujoch(top-right), Lauder (middle-left), Arrival Heights (middle-right), Wollongong (bottom). The reddots indicate the 3-σ standard error on the mean, and the shaded areas correspond to theestimated random error on the relative differences. The two black horizontal bars show thepressure ranges used for the partial columns listed in Table 1.
5229
Fig. 3. Map of M-55 Geophysica route (blue) during the ENVISAT validation flights at Forlı, Italy(42 ◦ N, 12 ◦ E) on 24 October 2002. The geolocations and tangent altitudes of MIPAS/ENVISATtangent points for the selected overpasses (numbered as scans 14–16 of orbit 3403) areindicated by the color codes. The geographical coverage (black circles) and the scan se-quence numbers (red) of collocated aircraft measurements by SAFIRE, in coincidence withMIPAS/ENVISAT are also denoted. For the coincident measurements, their differences in time,latitude and longitude, and horizontal distance see Table 2.
5230

Fig. 4. Same as Fig. 3, but for the SAFIRE measurements on the M-55 Geophysica flightat Kiruna, Sweden (68 ◦ N, 20 ◦ E) on 2 March 2003. The MIPAS/ENVISAT observations arenumbered as scans 19–21 of orbit 5250. For the coincident measurements, their differences intime, latitude and longitude, and horizontal distance see Table 3.
5231
Fig. 5. Comparisons of HNO3 VMR (in ppbv) profiles (right panels) between MIPAS ESAoperational data and correlative aircraft-based SAFIRE measurements (red) during the mid-latitude flight on 24 October 2002 from Forlı, Italy (42 ◦ N, 12 ◦ E). The left panels show thedifferences (in ppbv of MIPAS minus SAFIRE (blue), and the combined random (white circles)and systematic (black circles) errors.
5232
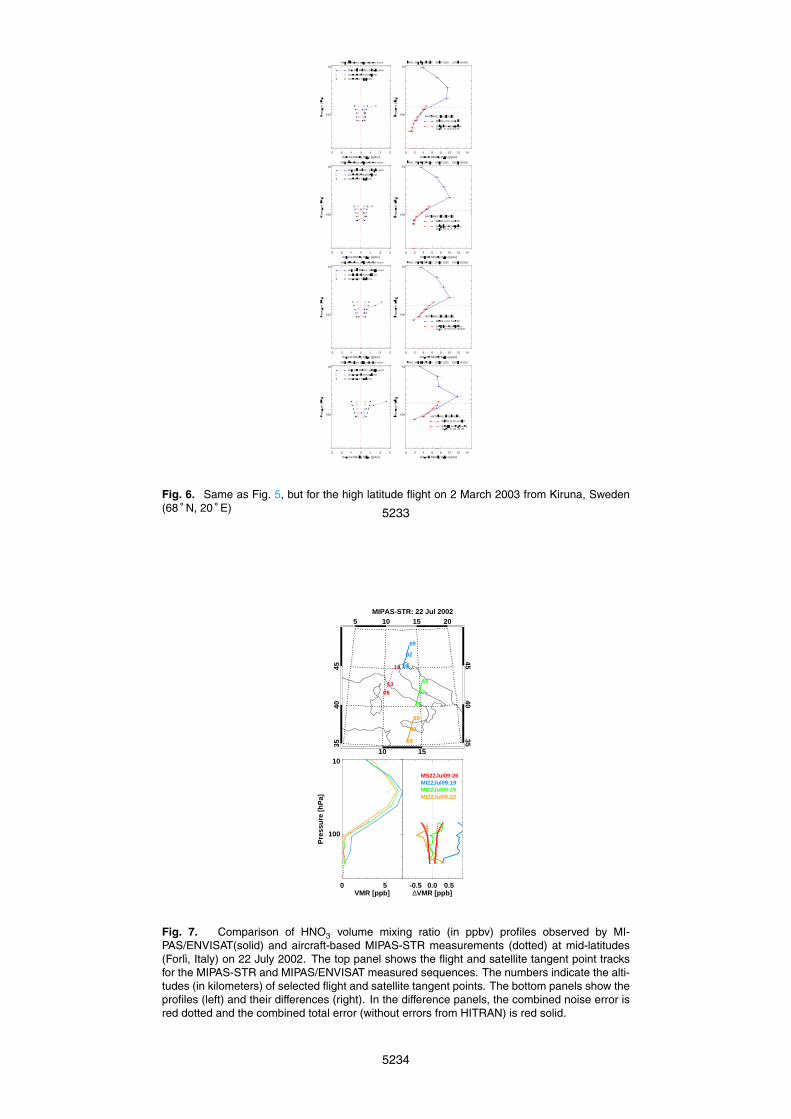
Fig. 6. Same as Fig. 5, but for the high latitude flight on 2 March 2003 from Kiruna, Sweden (68 � � , 20 � � )
50Fig. 6. Same as Fig. 5, but for the high latitude flight on 2 March 2003 from Kiruna, Sweden(68 ◦ N, 20 ◦ E) 5233
10 15
5 10 15 20
3540
45
3540
45
MIPAS-STR: 22 Jul 2002
19
06
13
69
09
32
69
09
32
69
09
32
0 5VMR [ppb]
100
10
Pre
ssu
re [
hP
a]
-0.5 0.0 0.5∆VMR [ppb]
100
10
MS22Jul09:26MI22Jul09:19MI22Jul09:20MI22Jul09:22
MS22Jul09:26MI22Jul09:19MI22Jul09:20MI22Jul09:22
Fig. 7. Comparison of HNO3 volume mixing ratio (in ppbv) profiles observed by MI-PAS/ENVISAT(solid) and aircraft-based MIPAS-STR measurements (dotted) at mid-latitudes(Forlı, Italy) on 22 July 2002. The top panel shows the flight and satellite tangent point tracksfor the MIPAS-STR and MIPAS/ENVISAT measured sequences. The numbers indicate the alti-tudes (in kilometers) of selected flight and satellite tangent points. The bottom panels show theprofiles (left) and their differences (right). In the difference panels, the combined noise error isred dotted and the combined total error (without errors from HITRAN) is red solid.
5234
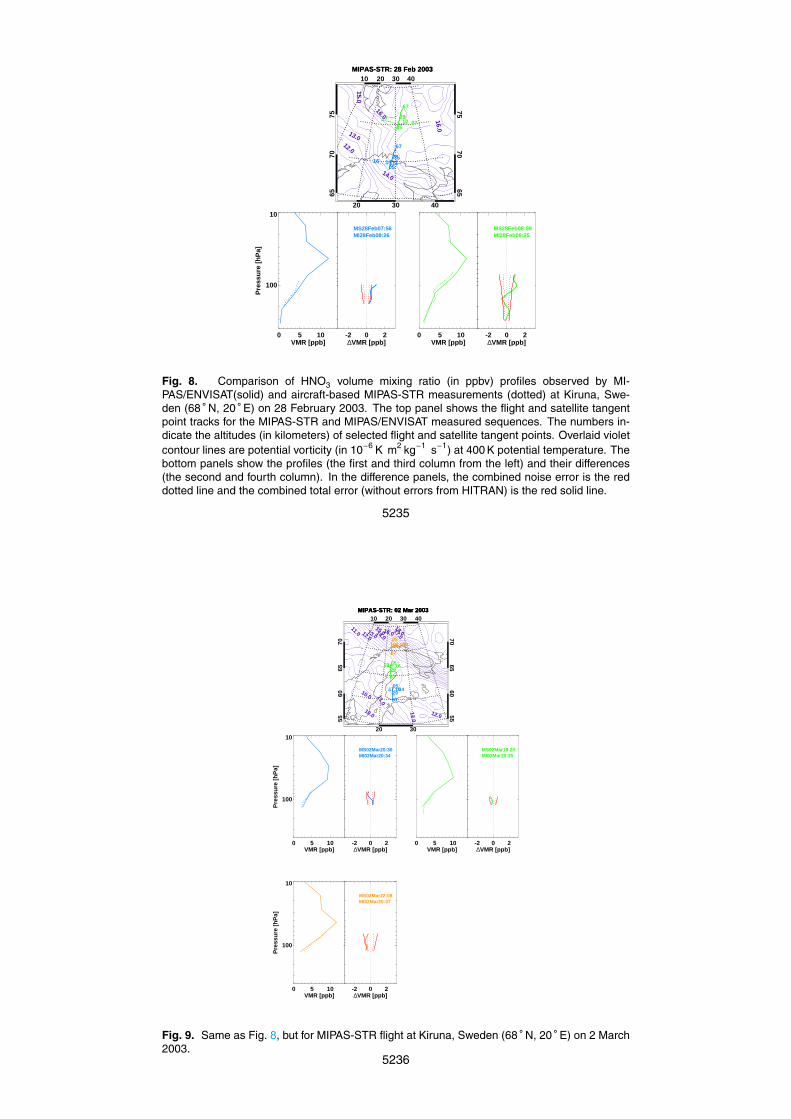
20 30 40
10 20 30 40
6570
7565
7075
MIPAS-STR: 28 Feb 2003
12.0
13.0
14.0
15.0
16.0
16.0
16 1114
67
05
29
MIPAS-STR: 28 Feb 2003
170712
67
05
29
0 5 10VMR [ppb]
100
10
Pre
ssu
re [
hP
a]
-2 0 2∆VMR [ppb]
100
10
MS28Feb07:56MI28Feb08:26MS28Feb07:56MI28Feb08:26
0 5 10VMR [ppb]
100
10
-2 0 2∆VMR [ppb]
100
10
MS28Feb08:59MI28Feb08:25MS28Feb08:59MI28Feb08:25
Fig. 8. Comparison of HNO3 volume mixing ratio (in ppbv) profiles observed by MI-PAS/ENVISAT(solid) and aircraft-based MIPAS-STR measurements (dotted) at Kiruna, Swe-den (68 ◦ N, 20 ◦ E) on 28 February 2003. The top panel shows the flight and satellite tangentpoint tracks for the MIPAS-STR and MIPAS/ENVISAT measured sequences. The numbers in-dicate the altitudes (in kilometers) of selected flight and satellite tangent points. Overlaid violetcontour lines are potential vorticity (in 10−6 K m2 kg−1 s−1) at 400 K potential temperature. Thebottom panels show the profiles (the first and third column from the left) and their differences(the second and fourth column). In the difference panels, the combined noise error is the reddotted line and the combined total error (without errors from HITRAN) is the red solid line.
5235
20 30
10 20 30 40
5560
6570
5560
6570
MIPAS-STR: 02 Mar 2003
10.0
10.0
11.0
11.0 12.0
12.0
12.0
13.014.0
15.016.0
17.0
18.0
17 1416
67
0529
MIPAS-STR: 02 Mar 2003
161214
67
0529
MIPAS-STR: 02 Mar 2003
18 1416
67
0529
0 5 10VMR [ppb]
100
10
Pre
ssu
re [
hP
a]
-2 0 2∆VMR [ppb]
100
10
MS02Mar20:30MI02Mar20:34MS02Mar20:30MI02Mar20:34
0 5 10VMR [ppb]
100
10
-2 0 2∆VMR [ppb]
100
10
MS02Mar19:20MI02Mar20:35MS02Mar19:20MI02Mar20:35
0 5 10VMR [ppb]
100
10
Pre
ssu
re [
hP
a]
-2 0 2∆VMR [ppb]
100
10
MS02Mar22:08MI02Mar20:37MS02Mar22:08MI02Mar20:37
Fig. 9. Same as Fig. 8, but for MIPAS-STR flight at Kiruna, Sweden (68 ◦ N, 20 ◦ E) on 2 March2003.
5236
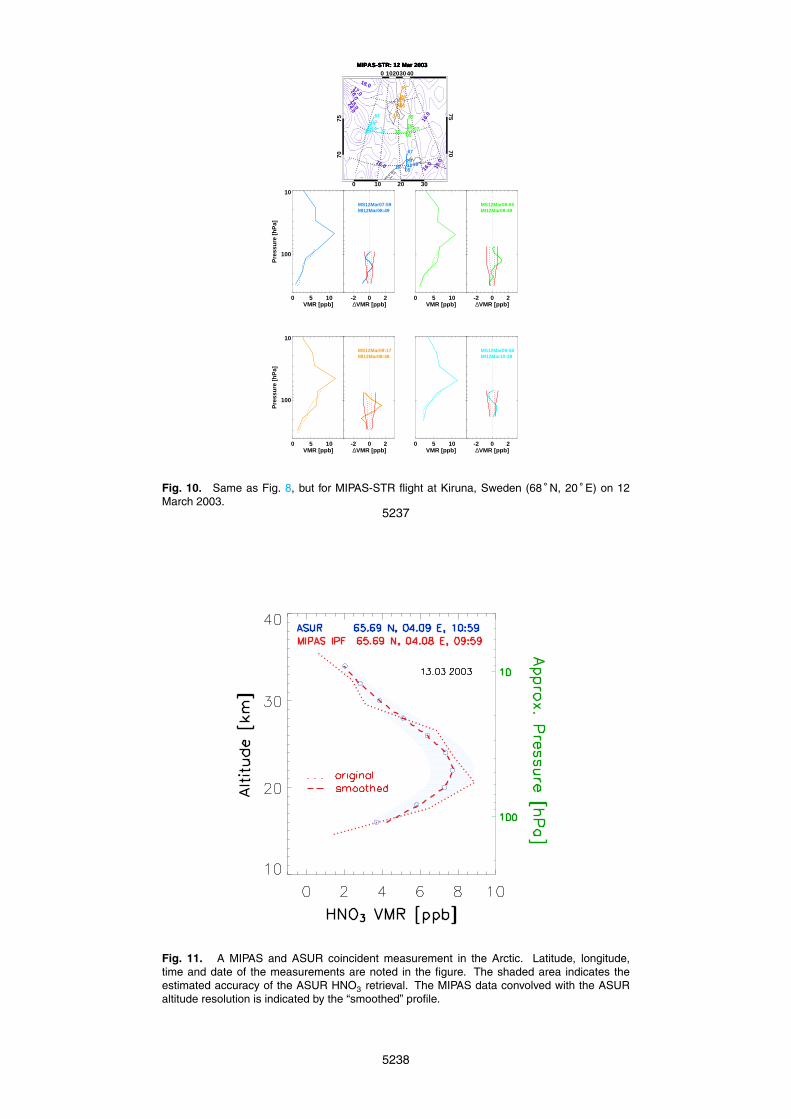
0 10 20 30
0 10203040
7075
7075
MIPAS-STR: 12 Mar 2003
14.015.0
15.0
16.0
16.0
16.016
.0
17.0
18.0
16 0812
67
05
29
MIPAS-STR: 12 Mar 2003
170712
67
05
29
MIPAS-STR: 12 Mar 2003
17
0712
67
05
29
MIPAS-STR: 12 Mar 2003
171114
67
05
29
0 5 10VMR [ppb]
100
10
Pre
ssu
re [
hP
a]
-2 0 2∆VMR [ppb]
100
10
MS12Mar07:59MI12Mar08:49MS12Mar07:59MI12Mar08:49
0 5 10VMR [ppb]
100
10
-2 0 2∆VMR [ppb]
100
10
MS12Mar08:55MI12Mar08:48MS12Mar08:55MI12Mar08:48
0 5 10VMR [ppb]
100
10
Pre
ssu
re [
hP
a]
-2 0 2∆VMR [ppb]
100
10
MS12Mar09:17MI12Mar08:46MS12Mar09:17MI12Mar08:46
0 5 10VMR [ppb]
100
10
-2 0 2∆VMR [ppb]
100
10
MS12Mar09:56MI12Mar10:28MS12Mar09:56MI12Mar10:28
Fig. 10. Same as Fig. 8, but for MIPAS-STR flight at Kiruna, Sweden (68 ◦ N, 20 ◦ E) on 12March 2003.
5237
Fig. 11. A MIPAS and ASUR coincident measurement in the Arctic. Latitude, longitude,time and date of the measurements are noted in the figure. The shaded area indicates theestimated accuracy of the ASUR HNO3 retrieval. The MIPAS data convolved with the ASURaltitude resolution is indicated by the “smoothed” profile.
5238
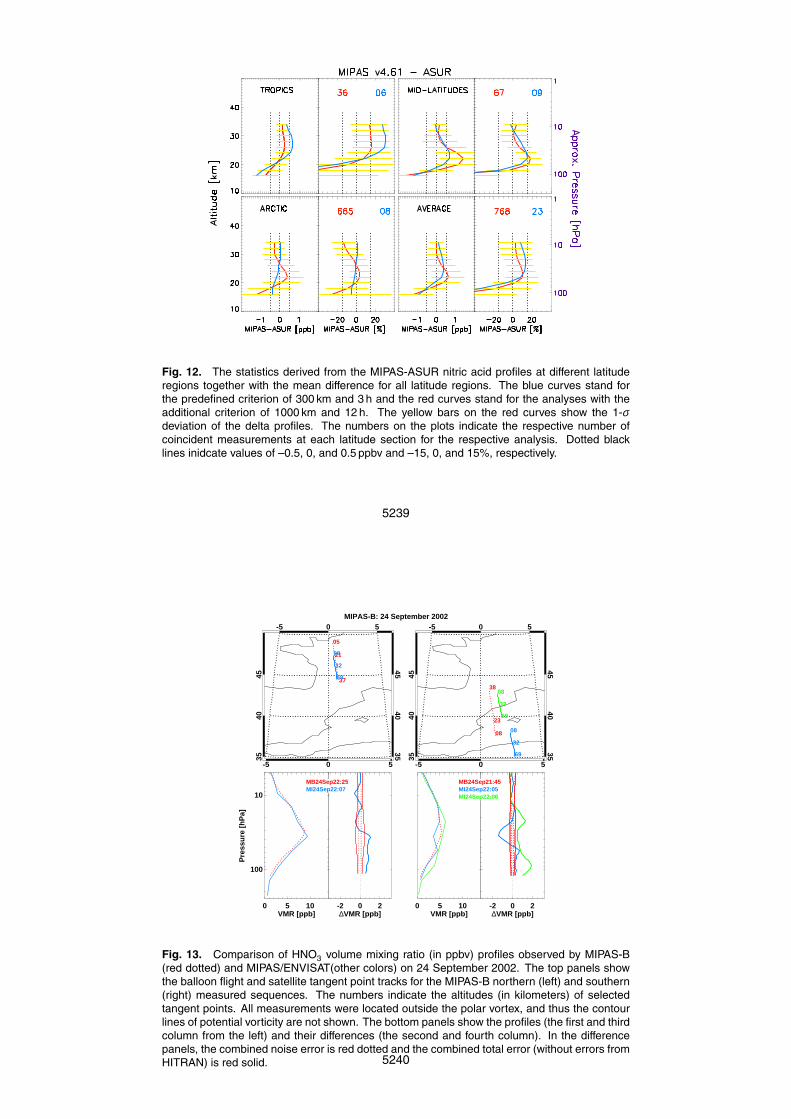
Fig. 12. The statistics derived from the MIPAS-ASUR nitric acid profiles at different latituderegions together with the mean difference for all latitude regions. The blue curves stand forthe predefined criterion of 300 km and 3 h and the red curves stand for the analyses with theadditional criterion of 1000 km and 12 h. The yellow bars on the red curves show the 1-σdeviation of the delta profiles. The numbers on the plots indicate the respective number ofcoincident measurements at each latitude section for the respective analysis. Dotted blacklines inidcate values of –0.5, 0, and 0.5 ppbv and –15, 0, and 15%, respectively.
5239
-5 0 5
-5 0 5
3540
45
3540
45
MIPAS-B: 24 September 2002
05
37
21
69
08
32
0 5 10VMR [ppb]
100
10
Pre
ssu
re [
hP
a]
-2 0 2∆VMR [ppb]
100
10
MB24Sep22:25MI24Sep22:07MB24Sep22:25MI24Sep22:07
-5 0 5
-5 0 5
3540
45
3540
45
08
38
23
69
08
32
69
08
32
0 5 10VMR [ppb]
100
10
-2 0 2∆VMR [ppb]
100
10
MB24Sep21:45MI24Sep22:05MI24Sep22:06
MB24Sep21:45MI24Sep22:05MI24Sep22:06
Fig. 13. Comparison of HNO3 volume mixing ratio (in ppbv) profiles observed by MIPAS-B(red dotted) and MIPAS/ENVISAT(other colors) on 24 September 2002. The top panels showthe balloon flight and satellite tangent point tracks for the MIPAS-B northern (left) and southern(right) measured sequences. The numbers indicate the altitudes (in kilometers) of selectedtangent points. All measurements were located outside the polar vortex, and thus the contourlines of potential vorticity are not shown. The bottom panels show the profiles (the first and thirdcolumn from the left) and their differences (the second and fourth column). In the differencepanels, the combined noise error is red dotted and the combined total error (without errors fromHITRAN) is red solid. 5240

10 20
0 10 20
6070
6070
MIPAS-B: 20/21 March 2003
60
70
80
90
100
100
110
110
06
31
20
67
05
29
67
05
29
67
05
29
0 5 10VMR [ppb]
100
10
Pre
ssu
re [
hP
a]
-2 0 2∆VMR [ppb]
100
10
MB20Mar20:55MI20Mar21:08MI20Mar21:10MI20Mar21:11
MB20Mar20:55MI20Mar21:08MI20Mar21:10MI20Mar21:11
10 20
0 10 20
6070
6070
70
80 90
100
100
110
09
31
19
67
05
29
67
05
29
67
05
29
0 5 10VMR [ppb]
100
10
-2 0 2∆VMR [ppb]
100
10
MB21Mar08:47MI21Mar09:06MI21Mar09:08MI21Mar09:09
MB21Mar08:47MI21Mar09:06MI21Mar09:08MI21Mar09:09
Fig. 14. Same as Fig. 13, but for two MIPAS-B sequences measured on 20/21 March 2003.Overlaid violet contour lines are potential vorticity (in 10−6 K m2 kg−1 s−1) at 550 K potentialtemperature.
5241
10 20 30
0 10 20 30
6070
6070
MIPAS-B: 3 July 2003
11
38
24
66
0428
66
0528
66
0428
0 5 10VMR [ppb]
100
10
Pre
ssu
re [
hP
a]
-2 0 2∆VMR [ppb]
100
10
MB03Jul00:33MI03Jul09:38MI03Jul09:39MI03Jul19:31
MB03Jul00:33MI03Jul09:38MI03Jul09:39MI03Jul19:31
10 20 30
0 10 20 30
6070
6070
07
38
23
66
0428
66
0528
66
0428
0 5 10VMR [ppb]
100
10
-2 0 2∆VMR [ppb]
100
10
MB03Jul01:06MI03Jul09:38MI03Jul09:39MI03Jul19:31
MB03Jul01:06MI03Jul09:38MI03Jul09:39MI03Jul19:31
Fig. 15. Same as Fig. 13, but for two MIPAS-B sequences measured on 3 July 2003.
5242
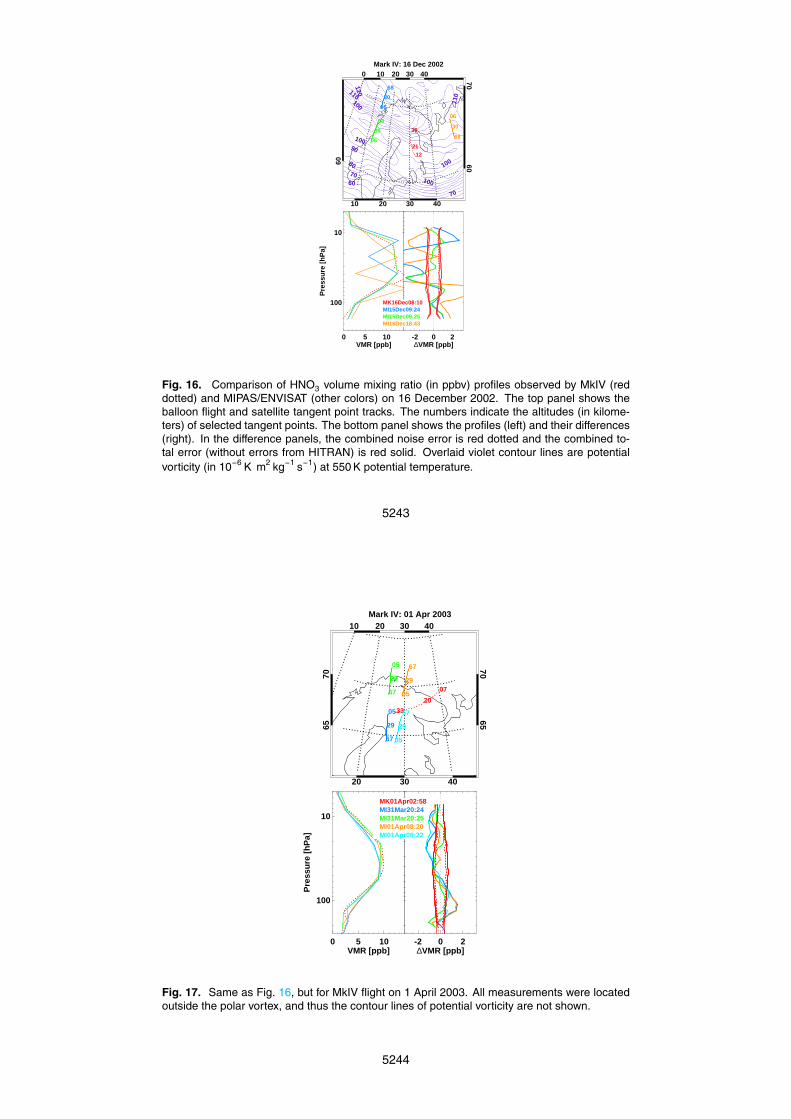
10 20 30 40
0 10 20 30 40
60 6070
Mark IV: 16 Dec 2002
60
70
70
80
90
100
100
100
100
110
110
120
12
30
21
68
06
30
68
06
3068
06
30
0 5 10VMR [ppb]
100
10
Pre
ssu
re [
hP
a]
-2 0 2∆VMR [ppb]
100
10
MK16Dec08:10MI15Dec09:24MI15Dec09:25MI16Dec18:43
MK16Dec08:10MI15Dec09:24MI15Dec09:25MI16Dec18:43
Fig. 16. Comparison of HNO3 volume mixing ratio (in ppbv) profiles observed by MkIV (reddotted) and MIPAS/ENVISAT (other colors) on 16 December 2002. The top panel shows theballoon flight and satellite tangent point tracks. The numbers indicate the altitudes (in kilome-ters) of selected tangent points. The bottom panel shows the profiles (left) and their differences(right). In the difference panels, the combined noise error is red dotted and the combined to-tal error (without errors from HITRAN) is red solid. Overlaid violet contour lines are potentialvorticity (in 10−6 K m2 kg−1 s−1) at 550 K potential temperature.
5243
20 30 40
10 20 30 40
6570
6570
Mark IV: 01 Apr 2003
07
33
20
67
05
29
67
05
29
67
05
29
67
05
29
0 5 10VMR [ppb]
100
10
Pre
ssu
re [
hP
a]
-2 0 2∆VMR [ppb]
100
10
MK01Apr02:58MI31Mar20:24MI31Mar20:25MI01Apr08:20MI01Apr08:22
MK01Apr02:58MI31Mar20:24MI31Mar20:25MI01Apr08:20MI01Apr08:22
Fig. 17. Same as Fig. 16, but for MkIV flight on 1 April 2003. All measurements were locatedoutside the polar vortex, and thus the contour lines of potential vorticity are not shown.
5244
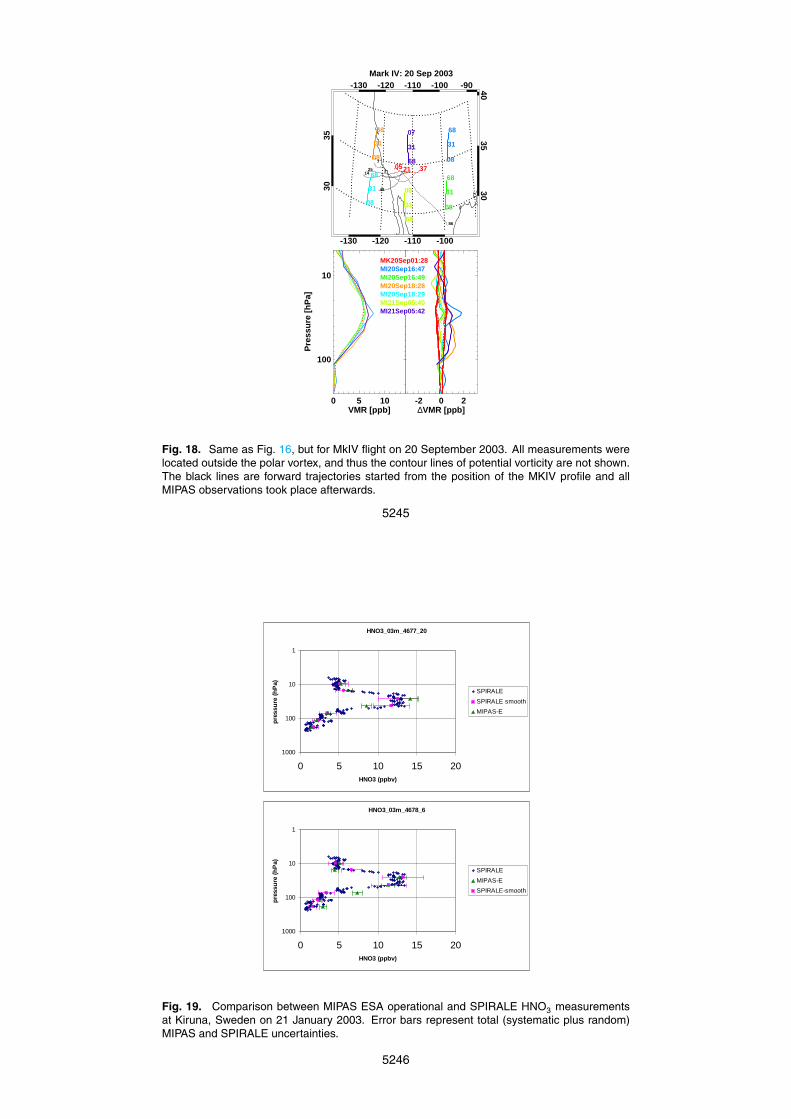
-130 -120 -110 -100
-130 -120 -110 -100 -90
3035
3035
40
Mark IV: 20 Sep 2003
86
48
25 14
7
305 3721
68
08
31
68
08
31
68
08
31
68
08
31
68
08
31
68
07
31
0 5 10VMR [ppb]
100
10
Pre
ssu
re [
hP
a]
-2 0 2∆VMR [ppb]
100
10
MK20Sep01:28MI20Sep16:47MI20Sep16:49MI20Sep18:28MI20Sep18:29MI21Sep05:40MI21Sep05:42
MK20Sep01:28MI20Sep16:47MI20Sep16:49MI20Sep18:28MI20Sep18:29MI21Sep05:40MI21Sep05:42
Fig. 18. Same as Fig. 16, but for MkIV flight on 20 September 2003. All measurements werelocated outside the polar vortex, and thus the contour lines of potential vorticity are not shown.The black lines are forward trajectories started from the position of the MKIV profile and allMIPAS observations took place afterwards.
5245
HNO3_03m_4677_20
1
10
100
1000
0 5 10 15 20HNO3 (ppbv)
pre
ssu
re (
hP
a)
SPIRALE
SPIRALE smooth
MIPAS-E
HNO3_03m_4678_6
1
10
100
1000
0 5 10 15 20HNO3 (ppbv)
pre
ssu
re (
hP
a)
SPIRALE
MIPAS-E
SPIRALE-smooth
Fig. 19. Comparison between MIPAS ESA operational and SPIRALE HNO3 measurementsat Kiruna, Sweden on 21 January 2003. Error bars represent total (systematic plus random)MIPAS and SPIRALE uncertainties.
5246

HNO3_02d_3019_14_supr
1
10
100
1000
0 2 4 6 8
HNO3 (ppbv)
pre
ssu
re (
hP
a)
SPIRALE
SPIRALE smooth
MIPAS E
HNO3_02d_3019_15supr
1
10
100
1000
0 2 4 6 8 10
HNO3 (ppbv)
pre
ssu
re (
hP
a)
SPIRALE smooth
MIPAS-E
SPIRALE
Fig. 20. Comparison between MIPAS ESA operational and SPIRALE HNO3 measurements atAire sur l’Adour, France on 2 October 2002. Error bars represent total (systematic plus random)MIPAS and SPIRALE uncertainties.
5247
Fig. 21. Comparison between MIPAS ESA operational and IBEX (29–30 July 2002 ) HNO3measurements. Mean absolute (left) and relative (right) differences between MIPAS and IBEXHNO3 VMR were reconstructed using trajectory analysis and averaged in altitude bins of ∆z =1.5 km. Error bars represent 1-σ standard deviations. The number of elements per altitude binis also displayed.
5248
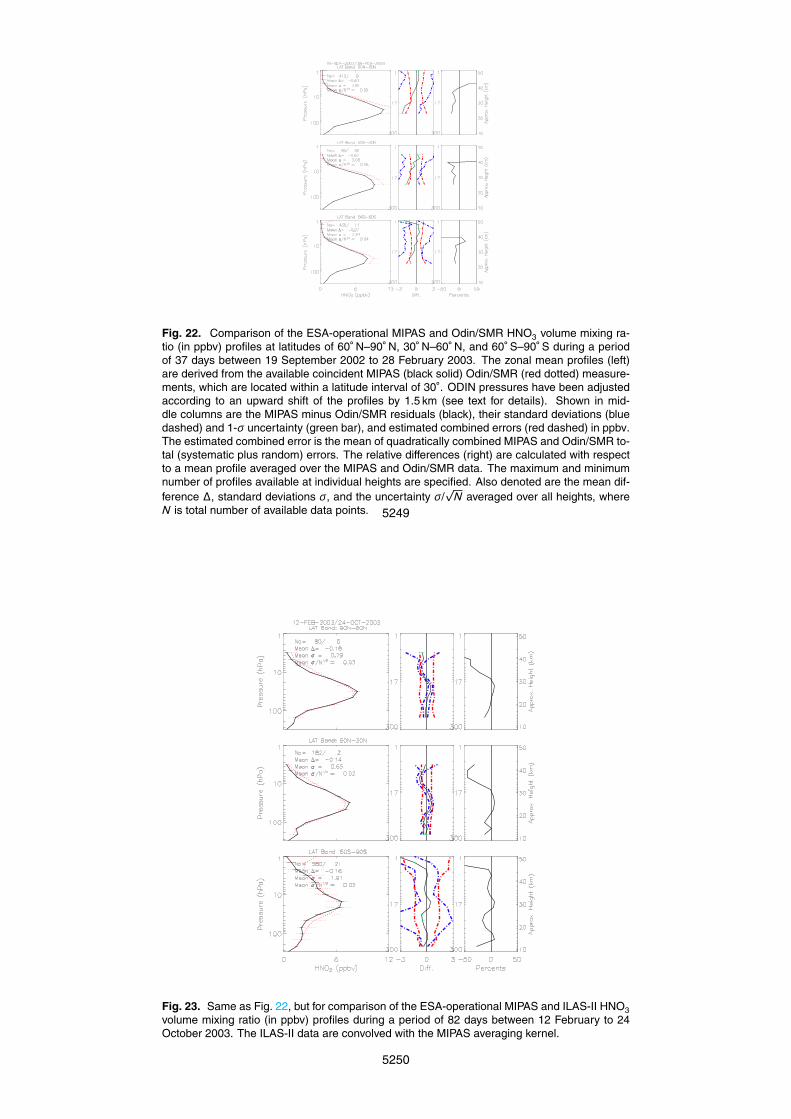
Fig. 22. Comparison of the ESA-operational MIPAS and Odin/SMR HNO3 volume mixing ra-tio (in ppbv) profiles at latitudes of 60◦ N–90◦ N, 30◦ N–60◦ N, and 60◦ S–90◦ S during a periodof 37 days between 19 September 2002 to 28 February 2003. The zonal mean profiles (left)are derived from the available coincident MIPAS (black solid) Odin/SMR (red dotted) measure-ments, which are located within a latitude interval of 30◦. ODIN pressures have been adjustedaccording to an upward shift of the profiles by 1.5 km (see text for details). Shown in mid-dle columns are the MIPAS minus Odin/SMR residuals (black), their standard deviations (bluedashed) and 1-σ uncertainty (green bar), and estimated combined errors (red dashed) in ppbv.The estimated combined error is the mean of quadratically combined MIPAS and Odin/SMR to-tal (systematic plus random) errors. The relative differences (right) are calculated with respectto a mean profile averaged over the MIPAS and Odin/SMR data. The maximum and minimumnumber of profiles available at individual heights are specified. Also denoted are the mean dif-ference ∆, standard deviations σ, and the uncertainty σ/
√N averaged over all heights, where
N is total number of available data points. 5249
Fig. 23. Same as Fig. 22, but for comparison of the ESA-operational MIPAS and ILAS-II HNO3volume mixing ratio (in ppbv) profiles during a period of 82 days between 12 February to 24October 2003. The ILAS-II data are convolved with the MIPAS averaging kernel.
5250
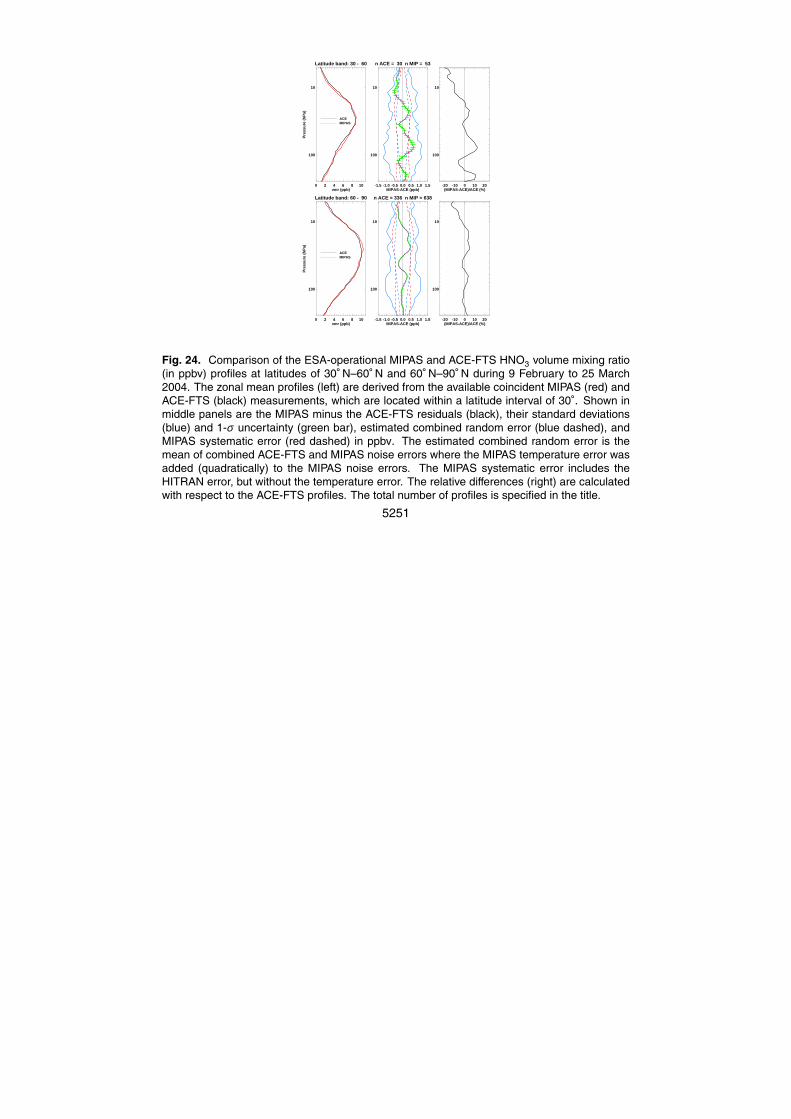
Latitude band: 30 - 60
0 2 4 6 8 10vmr (ppb)
100
10
Pre
ssu
re (
hP
a)
ACEMIPAS
n ACE = 30 n MIP = 53
-1.5 -1.0 -0.5 0.0 0.5 1.0 1.5MIPAS-ACE (ppb)
100
10
-20 -10 0 10 20(MIPAS-ACE)/ACE (%)
100
10
Latitude band: 60 - 90
0 2 4 6 8 10vmr (ppb)
100
10
Pre
ssu
re (
hP
a)
ACEMIPAS
n ACE = 336 n MIP = 638
-1.5 -1.0 -0.5 0.0 0.5 1.0 1.5MIPAS-ACE (ppb)
100
10
-20 -10 0 10 20(MIPAS-ACE)/ACE (%)
100
10
Fig. 24. Comparison of the ESA-operational MIPAS and ACE-FTS HNO3 volume mixing ratio(in ppbv) profiles at latitudes of 30◦ N–60◦ N and 60◦ N–90◦ N during 9 February to 25 March2004. The zonal mean profiles (left) are derived from the available coincident MIPAS (red) andACE-FTS (black) measurements, which are located within a latitude interval of 30◦. Shown inmiddle panels are the MIPAS minus the ACE-FTS residuals (black), their standard deviations(blue) and 1-σ uncertainty (green bar), estimated combined random error (blue dashed), andMIPAS systematic error (red dashed) in ppbv. The estimated combined random error is themean of combined ACE-FTS and MIPAS noise errors where the MIPAS temperature error wasadded (quadratically) to the MIPAS noise errors. The MIPAS systematic error includes theHITRAN error, but without the temperature error. The relative differences (right) are calculatedwith respect to the ACE-FTS profiles. The total number of profiles is specified in the title.
5251


![PAMAPLA 22 - unb.ca · les voyelles nasales S tp £ on chagraignes [fon]’faim’(N-E) œ an on [safë]’chacun’ les semi-consonnes](https://img.pdfslide.us/doc/110x75/5b9b9e5e09d3f21b2f8d9069/pamapla-22-unbca-les-voyelles-nasales-s-tp-on-chagraignes-fonfaimn-e.jpg)


![Untitled-6 [] · tis 1227-2539 (1996) tis 1390-2539 (1996) tis 1227-2539 (1996) tis 1390-2539 (1996) tis 1227-2539 (1996)](https://img.pdfslide.us/doc/110x75/5e1a6a0f6b8d9f48bd19bcad/untitled-6-tis-1227-2539-1996-tis-1390-2539-1996-tis-1227-2539-1996-tis.jpg)