Embed Size (px)
Citation preview

1 9 9 4 A N N U A L R E P O R T


1 9 9 4 M I L E S T O N E S : B U I L D I N G M O M E N T U M
z INFORMIX-Onltne
Dynamtc ServerTM 6 0,
the f t r r t p roduct based
o n I n fo rm~x ' s D y n a m ~ c
Scalab le Arch~tecture'M
(DSA], enters genera l
customer a v a ~ l a b ~ l ~ t y
> INFORMIX-Onl ine
Dynamic Server 7.0, w i t h
its f i rst-of-a-kind pa ra l l e l
da ta query (PDQ) technol-
ogy, beg ins f i rs t customer
shipments.
> ln formix ships
INFORMIX-Onl ine/Secure
5.0, the f irst UNIX@
re la t i ona l database to
meet the s t r ingent B I , 82,
a n d C 2 levels o f securi ty
eva luat ion set forth b y
the Na t i ona l Computer
Security Center.
> ln formix becomes the
f irst database vendor to
announce its do to ware-
hous ing strategy. As p o r t
o f the in i t ia t ive , Prism
Solut ions, a l ead ing do to
warehous ing sof tware
vendor , agrees to
p rov ide enabl ing tech-
no logy for O n l i n e
Dynamic Server.
> ln formix announces
several customer wins
wi th O n l i n e Dynamic
Server, inc lud ing a
mo io r dea l w i th The
Kroger Company.
March
> Expanding i ts c l ient /
server o f fer ings for
Microaof t 's W indows NTT"
ln farmix beg ins
sh ipp ing the INFORMIX-SE
Client/Server Sof tware
Developers' K i t (SDK] for
the W indows N T Advanced
Server operat ing system.
> ln formix par tner
System Sof tware
Assoc~otes (SSA) b e g ~ n s
b u ~ l d ~ n g the f ~ r s t UNlX
verslon of ~ t s BPCS/AS
software product based
on O n l l n e D y n o m ~ c
Server
> DHL W o r l d w ~ d e
Express, a l ong t ~ m e
lnformtx customer, selects
lnformtx a n d O n l ~ n e
D y n o m ~ c Server o r t h e ~ r
c o m p o n y w ~ d e s tandard
do tobo re At the some
tlme, l n f o r m ~ x selects
DHL o r Its pre fer red
~ n t e r n o t ~ o n o l a l r express
s u p p l ~ e r
> N e w b r i d g e Networks
Corporat ion, a leader
i n network management
software, announces i t
w i l l use O n l i n e Dynamic
Server as the core dafa-
base for a l l o f its next-
generat ion network
management products.

r Over 2 . 3 0 0
lnformix users, par t -
ners, and employees
attend the th i rd annu-
al lnformix W o r l d w i d e
User Conference and
Exposition. Dur ing the
conference,
INFORMIX-NewEraTM
and INFORMIX-
NewEra ViewpointTM
Pro are announced, as
> NewEro and NewEra
V iewpoin t Pro beg in
sh ipp ing to customers
o round the wor ld-
inc lud ing HCIA, Inc., the
U.S. IRS, the Swedish
draf t board, C roy
Systems, and the
M in i s t r y o f the Defense
of the Czech Republic.
> In o move to s impl i fy
the management o f
large, d is t r ibuted dota-
bases, ln formix and
T ivo l i Systems Inc. par t -
ner to embed Tivol i 's
TME Arch i tec ture in to
O n l i n e Dynamic Server.
> Further expanding its
product o f fer ings for
enterprise connectivi ty,
ln formix ships the 6 .1
version o f INFORMIX-
Ga teway wi th DRDA."
ln formix also l icenses
core technology from
> M o r e customers
select O n l i n e Dynamic
Server as the i r co re
database-including
such industry leaders
as Transamerica
Commerc ia l Finance
Co rpo ra t i on and the
Uni ted Kingdom's
Royal A i r Force.
> ln formix a n d O n l i n e
Dynamic Server o re
selected b y other industry
leaders from o round the
world-such as the
Cent ra l Bank of the
Russian Federation, Home
Depot, and the Amer ican
Automobi le Assoc ia t ion
( A A A J
> ln formix de l ivers new
versions o f several
cl ient/server tools:
INFORMIX-NewEro
V iewpoin t ( for Windows,
Macin tosh, a n d M o t i f ]
and INFORMIX-
Hyperscr ip t * Tools 1 . 1
( for W indows a n d Mo t i f ] .
> INFORMIX-Onl ine
Dynamic Server 7 .1 , the
latest DSA product
implementation, becomes
w ide l y ava i l ab le on every
maior ha rdware p la t form.
> ln formix achieves
record-break ing TPC-C
benchmark results (based
on the Transaction
Processing Counci l 's
pr ice /per formonce bench-
mark tests] using O n l i n e
Dynamic Server 7 .1 on
Hewlett-Packard's open
symmetric mult iprocessing
(SMP) ha rdware server.
> INFORMIX-Enterprise
Gateway, bu i l t w i th
technology from industry-
l ead ing connect iv i ty prod-
ucts vendor In format ion
Bui lders, Inc., begins
sh ipp ing-a l lowing
ln formix customers to
access data from more
than 6 0 dotabases on
over 3 5 d i f ferent
computer platforms.
well as a new th i rd-
party partners
program to support
the creotion o f class
l ibraries that extend
and enhance the
NewEro development
environment.
> lnformix expands
its presence i n key
international markets
by acquir ing d is t r ib -
utors in Germany
(Garmhausen a n d
Partners) ond
Malaysia ( N e x t w a r e ) .
Open Ho r i zon to create
INFORMIX-DCE/NET, t o
p rov ide add i t i ona l secu-
r i t y a n d standards-based
connect iv i ty for ln formix
customers.
> Several major
customers-including
Ho l i day Inn W o r l d w i d e
and Uni ted Air l ines-
s tandard ize on ln formix
and O n l i n e Dynamic
Server for their enter-
pr isewide appl ico t ionr .
z In the f irst yeor since
par tner ing wi th SAP AG,
the wo r l dw ide leader i n
cl ient/server business
softwore, ln formix
announces i t has ga ined
1 7 9 new l icensed
ins ta l la t ions through
the SAP re la t ionsh ip .
> In o rde r to expand its
leadersh ip i n the g row ing
Japanese market, ln formix
announces its in tent ion
to acqui re ASCII
Corporat ion 's Japanese
dotabase division-to
be ca l l ed ln formix
ASCII, K .K .
> PeopleSoft, Inc., o
recognized leader i n
cl ient/server opp l ico t ion
software, announces i t
w i l l p rov i de PeopleSoft
F inanc ia l r and Peoplesoft
HRMS running on O n l i n e
Dynamic Server.
> ln formix launches
Ingres-to-lnformix migra-
t ion program, a l l ow ing
companies using lngres
database technology
(recently acqu i red b y
Computer Associates) to
leverage their ex is t ing
investment i n Ingres-
based appl ica t ions whi le
migrat ing to In formix .

T O O U R S T O C K H O L D E R S
For Informix Corporation, 1994 was a year of significant achievement, company milestones, and cus-
tomer wins. But more importantly, I believe the year's accomplishments represent a fundamental
shift in our prospects for the future-in terms of how we do business worldwide, our product technol-
ogy, and the types of markets we serve.
Informix's 1994 revenues climbed to $468,697,000, 33 percent growth over 1993 revenues of
$352,915,000. Earnings grew to $66,196,000, an 18 percent increase over last year's net income of
$56,115,000. Earnings per share also grew by 18 percent to $0.98 from $0.83 a year earlier.
Our 1994 operating margin remains high at approximately 22 percent, compared to 24 percent
for 1993. Our 1994 annualized revenue per employee figures increased to approximately $271,000 in
the fourth quarter of 1994, compared to approximately $236,000 for the same period in 1993.
Informix also increased its cash, cash equivalents, and investments by approximately $52 million in
1994, and finished the year with cash and investment balances of approximately $196 million.
Strong financial results like these mean our products are not only selling well, but that we art.
successfully managing the business as it grows worldwide-and I'd like to salute the outstanding
efforts and dedication of the people behind this success: our employees.
G R o w I N G o u R B U I 1 N E s S Informix continues to build upon its success in the global
marketplace-in established lines of business as well as emerging market opportunities. To do so,
we're reshaping our business programs to fit the needs of our growing and changing customer base.
We've realigned our sales, marketing, and support efforts to provide a more direct presence
worldwide-for the first time, more than half of our 1994 sales revenues came from end users of our
technology. Our workforce has grown to more than 2,200 employees worldwide. We formed six new
international subsidiaries, and now have offices in over 35 countries. Our customers are now support-
ed by eight regional customer service hubs strategically located around the world, which allows us to
respond quickly and effectively to our customers' global needs.
In October we formed an agreement with long-time Informix partner ASCII Corporation to
acquire ACSII's database division-now called Informix ASCII, K.K. We took this action to further
Informix's leadership in the lucrative Japanese market. We've taken similar measures in other inter-
national markets by acquiring distributors in Germany (Garmhausen and Partners) and Malaysia
(Nextware).
We've also worked to strengthen our already successful third-party distribution channels-
value-added resellers, systems integrators, consultants, trainers, hardware manufacturers, and inde-
pendent software vendors-by forming new, strategic partnerships with many of the world's largest
and most successful solution providers, such as SAP, PeopleSoft, SSA, and Baan.

D E L 1 v E R I N K E P R o D u c T s Key to Informix's future growth and stability is the success
of our core product technology. Informix is unique in its efforts to build database products based on
an enduring, underlying architecture-a strategy designed to better enable our customers with scal-
able product technology, so they can successfully run their business today and in the future.
In 1994, we delivered, as promised, two new core products that not only position us well for the
future, but also establish a new standard for high-end relational database technology.
The 7.1 version of INFORMIX-OnLine Dynamic ServerrM-our next-generation parallel data-
base server-shipped on schedule, and is now available on every leading symmetric multiprocessing
(SMP) hardware platform. OuLine Dynamic Server is already being deployed by hundreds of cus-
tomers around the world, enabling them to make more strategic business decisions as well as keep
pace with future database growth.
We also began shipping our second-generation application development tool, INFORMIX-
NewEra;~ to a number of organizations such as American Express, Motorola, McCaw Cellular, and
the U.S. Internal Revenue Service. NewEra has already been recognized by customers and industry
analysts for defining a "new breed" of clienttserver software development technology, because it pro-
vides the ability to create large, mission-critical database applications that will grow to accommodate
evolving business needs.
M E E T 1 N e T H E N E E D S 0 F 0 U R C U s T 0 M E R s Looking back on 1994, it's clear that our
success is due in large part to new Informix customers who represent a higher profile of users of our
technology. Many of these organizations are household names and recognized leaders in their respec-
tive industry segments-for example, United Airlines, GTE, Holiday Inn, Wal*Mart, Sears Roebuck
and Company, and Great Britain's Royal Air Force. Moving forward into 1995, we're working hard to
continue this momentum and remain optimistic about our future growth potential.
On the following pages, we've highlighted just a few of the thousands of companies throughout
the world whose information systems run on Informix software. Some of these companies are new cus-
tomers, while others have chosen to reaffirm their commitment to Informix. Nevertheless, these indus-
try leaders all have something in common- they have come to rely on Informix's next-generation
technology and proven leadership to meet their increasingly diverse information management needs.
Sincerely,
P H I L L I P E . W H I T E
C h a i r m a n , C h i e f E x e c u t i u e Of f icer , a n d Pres iden t

" I n f o r m i x c l e a r l y d e m o n s t r a t e d i f s f e c h n i c o l s u p e r i o r i t y t h r o u g h a n a d v a n c e d ,
w e l l - d e s i g n e d p r a d u c t s r e h i t e c t u r e . W e ' r e particularly i m p r e s s e d w i t h t h e i r o v e r
a l l d e d i c a t i o n t a m s e f i n g H o l i d a y I n n ' s h i g h - d e m a n d , c o n s t a n t l y e v o l v i n g
t e c h n o l o g y n e e d s . " > D I C K S M I T H , C l o , H O L I D A Y I N N W O R L D W I D E
Holiday Inn is the world's largest single hotel brand. The company operates or
franchises more than 1,850 hotels and 350,000 guest rooms in some 60 countries and
territories, and has been developing hotels at a record-breaking pace during the past
two years, opening on average one new hotel every other day.
To keep pace with such dramatic growth, Holiday Inn is using Informix's parallel
database technology as the core of its Holiday Inn Reservation Optimization (HIRO)
system-a large, mission-critical application that automates their hotel inventory man-
agement tasks with the objective of maximizing reservation availability.
After extensive evaluation and benchmark testing, Holiday Inn selected
INFORMM-OnLine Dynamic Server based on its ability to meet or exceed the scalabil-
ity, performance, and support needs of the HIRO application. The Informix-based
HIRO system will be deployed in all Holiday Inn Worldwide properties and will repre-
sent over 40 gigabytes of data. "Informix was selected due to its scalability, outstand-
ing performance, and ability to handle large amounts of data," says Mark Marcus,
manager of advanced application information technologies at Holiday Inn Worldwide.
Holiday Inr


" I n f o r m i x w a s t h e o n l y d a t a b a s e v e n d o r t o o f f e r t h e p r o d u c t s c a l a b i l i t y a n d t h e
t e c h n i c a l d i r e c t i m n F o e f f e c t i v e l y m e e t o u r I T n e e d s t o g e t u s i n t o t h e n e x t
d e c a d e . l n f a r m i x d e m o n s f r a t e d a l e v e l o f c o m m i t m e n t t o d o i t r i g h t , a n d t h a t l s
t h e k i n d o f c o m p a n y w e w o n t t o d o b u s i n e s s w i t h . " > R O N G R I F F I N , C I O , H O M E D E P O T
Home Depot is the largest home center retailer in North America, currently operating
328 warehouse-style home centers in 28 U.S. states and 12 centers in Canada, with
gross sales for 1994 in excess of $12.4 billion.
Home Depot is another example of a customer using Informix's DSA technology to
minimize operating costs and manage growth. With store transactions doubling every
two years, OnLine Dynamic Server gives Home Depot a cost-effective, scalable solu-
tion that also ensures the freedom to accommodate Home Depot's future growth. "Our
new, Informix-based system gives us the flexibility to adapt and evolve our applica-
tions so we can respond to the needs of the field and our customers more quickly,"
says Ron Griffin, CIO at Home Depot.
Home Depot is using OnLine Dynamic Server for all of its future in-store process-
ing and select host systems, including a data warehousing application that will main-
tain sales, marketing, and merchandise information.

" I n f o r m i x ' s d a t a b a s e f e e h n o l a g y w n e b l e s u s t o r e a l i z e b o t h o h i e r a r c h i c a l o s w e l l
a s a d i s t r i b u t e d d a t a b a s e s t r u c t u r e . T h e i r c l i e n t / r e r v e r a r c h i t e c t u r e f i t s p e r f e c t l y
i n t o t h e c u r r e n t o r g a n i z a t i o n o f t h e C e n t r o l B a n k . " , E V G E N I J G E R O V I ~ H E V , D E P U T Y C H I E F
O F A G E N C Y , I N F O R M A T I O N D E P A R T M E N T , C E N T R A L B A N K O F T H E R U S S I A N F E D E R A T I O N
Joining more than 160 financial services organizations worldwide who have selected
Informix as the database supplier of choice, the Central Bank of the Russian
Federation (Bank of Russia), has selected Informix software and the UNIX operating
system as its standard to replace a wide range of proprietary software and operating
systems. The contract is one of the largest ever for information technology in the
former Soviet Union.
The Bank of Russia is using a number of Informix products to help integrate com-
panywide information management and logistics control in its 83 regional banks.
Informix products include INFORMIX-OnLine, INFORMIX-SE, INFORMIX-4GL,
INFORMIX-ESQLIC, C-ISAMP INFORMIX-Hyperscript Tools, INFORMIX-NewEra
Viewpoint, and a variety of Informix connectivity products.
The new system, which will be accessed by more than 40,000 end users,
will run on Sun Microsystems, AT&T Global Information Solutions, and Intel-based
computer platforms.


l n f o r m i x w a s c h o s e n p r i m a r i l y b e e r r u s e o f i t s a b i l i t y t o s u p p o r t c o m m e r c i a l - o f f -
t h e - s h e l f a p p l i c a t i o n s i n a s e c u r e e n v i r o n m e n i o n commercial $ r o d e o p e r a t i n g
s y s t e m s . T h e s e f a c t o r s , . l o n g w i t h t h e s c a l o b i i i t y a n d p e r f s r m a n c e o f t h e O n i i r r e
I ) y n o m i c S e r v e r a r c h i t e c t u r e , e n s u r e t h a t l n f o r m i x p r o d u c t s a r e w e l l s u i t e d t o t h e
d e f e o s e m a r k e t p l a c e , c R O Y A L ~ I R F O R C E
The United Kingdom's Royal Air Force (RAF) and its prime systems integrator, IBM,
selected Informix as the database supplier for the RAF's ten-year Logistics Information
Technology Strategy (LITS) program.
The LITS program will create a comprehensive system that will support all of the
supply and engineering communities in the RAF. The first installation will include to
the order of 8,000 workstations, local servers, and a global data center connected to
IBM's RISC System 6000 hardware.
The RAF is also using Informix's secure database, INFORMIX-OnLine/Secure, in
the RAF's Warehousing and Transport Management System (WTMS). The WTMS aims
to increase efficiency and cost savings in the management of the RAF's vast supply of
185 million stock items.
Force
" I t w o s t i m e t o m a k e 0 c o m m i t m e n t t o o n e d a t a b a s e . I n f o r m i x ' s d a t a b o s e h a s
p r o v e n t o p r o v i d e r e l i a b l e o n d o u t s t a n d i n g p e r f o r m a n c e . B y s t a n d a r d i z i n g o n
I n f o r m i x , w e e x p e c t o u r o p e r a t i a n o l c o s t s t o d r o p s i g n i f i c a n t l y . "
> BLAYNE M A R I N G , VICE P R E S I D E N T O F TECHNOLOGY S P E C I F I C A T I O N , G T E T E L E P H O N E OPERATIONS
GTE Telephone Operations, the largest U.S.-based local telephone company with 1993
revenues of $15.8 billion, has standardized on OnLine Dynamic Server as its strategic
database. In this enterprisewide initiative, GTE is planning to move all its corporate
data from a proprietary mainframe environment to a flexible, cost-effective, and open
systems-based clientlserver environment.
Virtually all of GTE's applications, including sales, marketing, customer
support, and facilities are being moved to the new Informix-based, clientlserver
environment. Once fully deployed, the system will support nearly 50,000 users and 18
terabytes of data running on AT&T Global Information Solutions, Hewlett-Packard,
and IBM hardware.
OnLine Dynamic Server, with its built-in parallelism, was chosen because it
delivered the superior performance and scalability GTE required for such a large sys-
tem. Other Informix products include INFORMIX-4GL and 1 ~ ~ 0 ~ ~ 1 x - E n t e r p r i s e Gateway.
GTE - epho

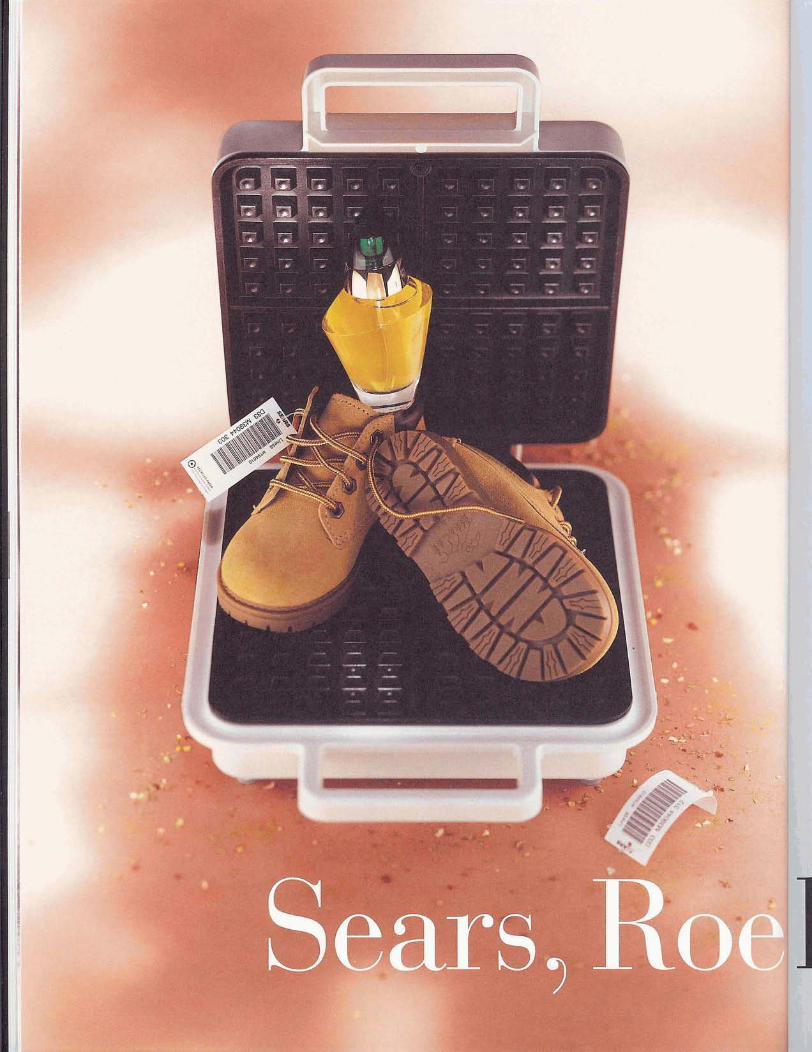

" I n f o r m i x d e m o n s t r a t e d o w t s f a n d i n g c o m m i t m e n f t o S e e r s a t e v e r y l e v e l , f r o m t h e
t e c h n i c a l a n d c u s t o m e r s u p p o r t p e a p l e a l l t h e w a y u p t o C E O P h i l W h i t e . W e ' r e
g l a d t o b e i n p a r t n e r s h i p w i t h l n f o r m i x b e c a u s e t h e y ' r e t h e t y p e o f c o m p a n y
w h o ' l l b e t h e r e w i t h u s f o r t h e l o n g h a u l . " , B O B C H E C K , D I R E C I O R O F D E V E L O P M E N T
S U P P O R T , S E A R S M E R C H A N D I S E G R O U P
Sears Merchandise Group, the $30 billion retail arm of Sears, Roebuck and Company
and the nation's third-largest retailer, has selected Informix technology to develop sev-
eral new corporatewide information systems. The Informix-based systems will support
more than 4,800 users and hundreds of service centers nationwide.
Sears' decision to choose Informix's high-performance, parallel database server
was based on its ability to handle very large volumes of data- several of Sears' appli-
cations will grow to hundreds of gigabytes.
"We selected OnLine Dynamic Server because it was designed to handle very
large transaction volumes in many locations," says Bob Check, director of develop-
ment support at Sears Merchandise Group. "We manage hundreds of thousands of
parts and need to respond rapidly to changing demands. Informix has proven its lead-
ership in technology and support and will enable us to increase productivity, reduce
costs, and deliver better service to our customers."
and co.

" I n f o r m i x D S A ' s ' c a r e i n f e r n a l p a r a l l e l i s m ' i s d l f f a r e n t t h a n o t h e r t y p e s o f a d d -
o n p a r a l l e l d a t a b a s e c a p a b i l i t i e s w e ' v e s e e n . W e ' r e s e e i n g i m p r e s s i v e p e r f o r m a n c e
g a i n s . I t ' s c l e a r t h a t l n f o r m i x t h o u g h t t h i s t e c h n o l o g y t h r o u g h . "
r MICHAEL BLOOMBERG, PRESIDENT AND F O U N D E R , BLOOMBERG F INANCIAL MARKETS
Bloomberg Financial Markets, the world's leading provider of securities information
and analytics, was one of the original users of Informix's DSA technology to provide
market information to scores of traders, brokers, bankers, and other financial deci-
sion makers worldwide. Bloomberg's Informix database is expected to grow to well
over 200 gigabytes as they roll out a number of new decision-support and multi-
media applications for their customers.
The information Bloomberg provides is absolutely critical-it is the lifeblood of
each customer's revenue stream-so they must be assured their customers can
access this information immediately, 24 hours a day, seven days a week. Informix's
OnLine Dynamic Server parallel processing technology is proving to be the answer.
"Informix offered the best UNIX-based products in terms of superior performance
and functionality to help us deliver more functionality to our customers," says
Bloomberg's founder Michael Bloomberg.


Financial Overview
F I V E - Y E A R ( I N THOUSANDS, EXCEPT PER SHARE DATA)
S U M M A R Y
N E T R E V E N U E S
N E T I N C O M E ( L O S S )
N E T I N C O M E l L O S S 1
P E R S H A R E
T O T A L A S S E T S
L O N G . T E R M O B L I G A T I O N S
The Company has not paid and does not anticipate paying cash dividends on its common stock.
' In 1991 , the Compony wor selected to provide the database componenl o f o decision-support ryr tem for the Army Not ional Guord ond Army Rerervsr.
In 1992 , the Company received $26.8 mil l ion in 1992 for l icense fees ond support or part of this Reserve Component Automation System (RCAS) contract
and recorded $21 .8 mill ion os l icense revenue and incurred $3 .2 mil l ion in operating expenses i n 1992 . The remaining $5.0 milltan of service revenue i s
being recognized over the support per iod.

Management's Discussion and Analysis
R E s u r T s o F Selected elements of the Company's financial statements are shown below for the last three years as a percentage
o P E R A T I o N s of revenue and a s a percentage change from year to year.
In 1991, the Company was selected to provide the database component of a decision-support system for the
Army National Guard and Army Reserves. In 1992, the Company received $26.8 million as part of this Reserve
Component Automation System (RCAS) contract and recorded $21.8 million as license revenue and incurred
$3.2 million in related operating expenses. The remaining $5.0 million of service revenue is being recognized over
the suppoa period. In 1992, the Company also recorded a $10.5 million charge due to a settlement of a securities
class action lawsuit (see Litigation Settlement). In providing comparative information, corresponding tables are
presented with Table 1 showing 1992 amounts as reported and Table 2 showing 1992 pro forma amounts exclud-
ing the RCAS license revenue and related expenses and the litigation settlement charge. The Company believes
that year-to-year comparisons of financial results are not necessarily indicative of future results.
% I N C R E A S E [ D E C R E A S E )
5 O F N E T R E V E N U E S 1994 1993
Y E A R S E N D E D D E C E M B E R 31, C O M P A R E D C O M P A R E D
T A B L E 1 [ A S R E P O R T E D ) 1994 1993 1992 T O 1993 T O 1992 . . . . . . . . . . . . . . . . . . . . . . . . . . . . . . . . . . . . . . . . . . . . . . . . . . . . . . . , . . , , . . . . , , . . . . , , . , . . , , . . . . . . . . . . . . . , . . . , . . . . . . . . . . , . . . . . . , . . . . . , . . . . , . . . . . . . . . . . . . . . . . . , . . . . . . , , . . . , . . , . ,
Net revenues
Costs and Expenses:
Cost of software distribution
Cost of services
Sales and marketing
Research and development
General and administrative
Total costs and expenses
Operating income
Net income
T A B L E 2 [ P R O F O R M A I
Net revenues
Costs and Expenses:
Cost of software distribution
Cost of services
Sales and marketing
Research and development
General and administrative
Total costs and expenses
Operating income
Net income
% O F N E T R E V E N U E S
Y E A R S E N D E D D E C E M B E R 31,
1994 1993 1992
% I N C R E A S E ( D E C R E A S E ]
I994 1993
C O M P A R E D C O M P A R E D
T O 1993 T O 1992
The Company's operating income in 1994 was 22 percent of net revenues compared to 24 percent i n 1993
and 26 percent in 1992. Excluding the revenue from the RCAS contract and associated expenses, 1992 operating
income was 21 percent. The decrease in operating margin in 1994 compared to 1993 was primarily due to exten-
sive investment in customer services, marketing and research and development expenditures and personnel addi-
tions to the Company's sales force worldwide. In 1995, the Company expects this trend to continue, which may

Management's Discussion and Analysis
adversely affect the Company's operating margin if there are no offsetting increases in revenue or reductions in
other operating expenses.
Internally, the Company generally has a goal to achieve an annual 20 percent operating margin. Although the
Company achieved these operating margin targets in 1994, 1993, and 1992 through revenue growth and expense
controls, the Company's expenses are relatively fixed in the near term and unexpected variances in planned
revenues, which are difficult to forecast, can result in variations in operating margins and cost ratios. The
Company's revenues have been increasingly derived from sales contracts directly with end users and less from
the distributor or OEM sales channels. These end-user sales contracts can be relatively large in size and are
difficult to forecast both in timing and dollar value. In addition, the Company's quarterly operating margins
generally follow a seasonal pattern, with second half revenues and operating margins being higher than those of
the preceding first half.
The Company's stock price may be subject to significant volatility, particularly on a quarterly basis. Any short-
fall in revenue or earnings from levels expected by securities analysts or others could have an immediate and sig-
nificant adverse effect on the trading price of the Company's common stock in any given period. Additionally, the
Company may not learn of, or be able to confirm, revenue or earnings shortfalls until the end of each quarter, which
could result in an even more immediate and adverse effect on the trading price of the Company's common stock.
Finally, the Company participates in a highly dynamic industry, which often results in significant volatility of the
Company's common stock price.
The effect of inflation on the Company's financial position has not been significant.
R E v E N u E s The Company derives revenues principally from licensing its software. Such revenues may involve the shipment
of product by the Company or the granting of a license to manufacture products. From time to time, the Company
has recognized substantial net revenue from large software license agreements. These transactions, which are dif-
ficult to predict, have caused fluctuations in net revenues and net income because of the relatively high gross mar-
gin on such revenues. The Company expects that this sort of transaction and the resultingfluctuations may continue.
Additionally, as is common in the industry, a disproportionate amount of the Company's license revenue is derived
from transactions that close in the last few weeks of a quarter which makes quarterly revenues difficult to forecast.
Although the Company expects revenues to continue to grow in 1995, there can be no assurance that such
growth will be achieved or that growth rates in the future will be comparable to those of 1994.
TABLE 3 [ A S REPORTED) ( D O L L A R S I N M I L L I O N S 1 1994 C H A N G E I993 C H A N G E I992
License fees
Percentage of net revenues
Services
Percentage of net revenues
Net revenues
TABLE 4 [ P R O F O R M A ) ' ( D O L L A R S I N M l L l l O N S l
. . . . . . . . . . . , . . , . . . . . . . . . . . , . . . . . . . . . . . . , . . . . . . . . . . . . . . . . . . . . . .
License fees
Percentage of net revenues
Services
Percentage of net revenues
Net revenues
C H A N G E 1993 C H A N G E 1992
.Excluder RCAS l tcenre revenue tn 1992

1 Management's Discussion and Analysis I
Service revenue, consisting of customer support, training, and consulting, increased in each of the years pre-
sented. These increases were primarily attributable to the continued growth of the installed customer base and the
renewal of maintenance contracts. The Company continues to emphasize support services as a source of revenue.
The revenue growth in 1994 primarily reflects continued strong worldwide acceptance for the Company's new
and existing technology. The growth in 1993 reflects the Company's continued emphasis on increasing license vol-
ume for its database servers and connectivity products. The Company's revenues, along with those of the relational
database management system (RDBMS) industry as a whole, have shown substantial growth over the last several
years. The industry has benefited from trends to downsize from large, proprietary computer systems and market
acceptance of UNIX@ and other open operating environments.
The Company has focused on the UNM market since 1980 and has broadened its open environments by releas-
ing a WindowsT" and Windows NT'" version of an Informix database server in 1994. The Company has also devel-
oped and released connectivity products that provide access to other relational databases, both proprietary and
open, and access to data through various protocols such as IBM's DRDA"" and XIOpen's XA!" The industiy move-
ment to new, open operating systems like Windows NT and access to database information through low-end, desk-
top machines may cause downward pressure on prices of database and related products. If such downward pressure
on prices were to occur, margins would be adversely affected.
In 1993, the Company offered database server products in multiple versions, including a "secure"
product, and released several new server and connectivity products, including the first of its Dynamic Scalable
Architecture" product line, INFORMIX-OnLine Dynamic ServerTM 6.0. The Company also released several other
products in 1993 to provide market-specific extensions and enhancements to the Informix suite of 4GL applica-
tion development tools.
The license revenue growth in 1994 reflects continued strong demand particularly for the Company's new
generation of database servers and connectivity products. In 1994, the Company released INFORMIX-OnLine
Dynamic Server 7.1 on eleven symmetric multiprocessing platforms. The Company also introduced INFORMIX-
NewErdM in 1994, a second-generation clientlserver application development tool, and anticipates tools revenue
to increase in absolute dollars in 1995. However, there is significant competition in the tools market from other
companies and their product offerings: graphical, character-based, and object-oriented. Many of these tools prod-
ucts are "open:' meaning they will access data stored on virtually any relational database, including Informix.
The Company's ability to sustain growth depends in part on the timely release of successful new and updated
products, and the success of new and updated products from its competitors. The Company has experienced prod-
uct introduction delays in the past and may have delays in the future.
Over half of the Company's net revenues are derived from its international operations (see Note 7 of Notes to
Consolidated Financial Statements). In Europe, most revenues and expenses are denominated in local currencies.
In 1994 and 1992, the U.S. dollar weakened against the major European currencies, which resulted in higher rev-
enue and expenses recorded when translated into U.S. dollars and compared with the corresponding prior years.
In 1993, the U.S. dollar strengthened significantly against the major European currencies, which resulted in lower
revenue and expenses recorded when translated into U.S. dollars and compared with the prior year. Through 1994,
most revenues from AsiafPacific, Canada, and Latin America were denominated in U.S. dollars. The translations
of the revenues for these regions were less influenced by fluctuations in foreign exchange rates. The Company has
increased its direct sales presence in Asia/Pacific by opening offices and acquiring its primary software distribu-
tors in Malaysia in 1994, and Japan and Korea in early 1995. This will increase the proportion of direct sales in
local currency in these regions. The Company has also increased its direct presence in Latin America, although a
significant percentage of the revenue is still denominated in U.S. dollars. The Company incurred approximately
$0.4 million in foreign exchange loss in Mexico in the fourth quarter of 1994 due to the instability of the economic
climate in this country. In the future, the Company expects these currency fluctuations in Mexico and, to a lesser
extent, other Latin America countries to continue. The Company's operating and pricing strategies take into account

Management's Discussion and Analysis
changes in exchange rates over time, however, the Company's results of operations may be significantly affected
in the short term by fluctuations in foreign currency exchange rates.
Approximately 55 percent, 58 percent, and 53 percent of the Company's net revenues were derived from sales
to foreign customers for 1994, 1993, and 1992, respectively. The increase in foreign revenues in absolute dollars
is primarily attributable to the establishment of new subsidiaries and sales offices in Europe, Asia/Pacific, and
Latin America, and continued international acceptance for the Company's new and existing technology. Excluding
the RCAS contract, foreign revenue represented 58 percent of net revenues in 1992. The Company expects that
foreign revenues will continue to provide a significant portion of total revenues. However, changes in foreign cur-
rency exchange rates, the strength of local economies, and the general volatility of software markets may result in
a higher or lower proportion of foreign revenues in the future.
The Company has a hedging program in place to minimize foreign exchange gains or losses, where possible,
from recorded foreign denominated transactions resulting from fluctuations in exchange rates. This program
involves the use of forward foreign exchange contracts in the primary European and Asian currencies. The Company
has limited unhedged transaction exposures in certain secondary currencies in Latin America and Eastern Europe
because there are limited forward currency exchange markets in these currencies. The Company does not attempt
to hedge translation to U.S. dollars of foreign denominated revenues and expenses not yet incurred.
The Company's distribution markets were reorganized into three general markets at the beginning of the sec-
ond quarter of 1994: North America; Europe, Middle East, and Africa; and the Intercontinental Group, consisting
of Latin America, Japan, and the AsiaIPacific region. These organizations contributed 46 percent, 38 percent, and
16 percent of the Company's net revenues, respectively, in 1994, compared to 43 percent, 41 percent and 16 per-
cent, respectively, in 1993, and 43 percent, 42 percent and 15 percent, respectively, in 1992 (excluding the RCAS
revenue in North America).
C 0 S T 0 F [DOLLARS I N MILLIONS1 1 9 9 4 CHANGE 1 9 9 3 CHANGE 1 9 9 2
S O F T W A R E
, , , Manufactured cost of software distribution $ 16.9 13% $ 14.9 (6%) $ 15.8
Percentage of license revenue 5% 5% 7%
Amortization of cap~talized software $ 7.8 50% $ 5.2 (8%) $ 5.7
Percentage of license revenue
Cost of software distribution
Percentage of license revenue
Software distribution costs consist primarily of: 1) manufacturing and related costs such as media, documentation,
product assembly and purchasing costs, freight, customs, and third-party royalties; and 2) amortization of previ-
ousIy capitalized software development costs and any write-offs of previously capitalized software.
Excluding amortization of previously capitalized software development costs, costs of software distribution as
a percentage of license revenue declined to 5 percent in 1994 and in 1993 from 7 percent in 1992. The decreases
as a percentage of license revenue are the result of the recording of several large contracts which have low asso-
ciated costs of software distribution since these customers generally manufacture the software themselves, as well
as cost reduction programs implemented by the Company in 1992 and 1993. In 1995, the cost of software distrib-
ution as a percentage of license revenue will vary depending upon whether the product is reproduced by the
Company or by customers.
The increase in amortization of capitalized software in 1994 resulted from the release of several products in
the second half of 1994. The decrease of amortization of capitalized software in absolute dollars in 1993 was due
to several projects being fully amortized in early 1992.

I
Management's Discussian and Analysis
C 0 S T 0 F [DOLLARS 1N M lLL lONSI 1 9 9 4 CHANGE 1 9 9 3 CHANGE 1 9 9 2
S E R V I C E S
Cost of services $ 46.0 40% $ 32.9 23% $ 26.8
Percentage of service revenue 44% 48% 58%
Cost of services consists primarily of customer support, consulting, and training expenses. The decreases in cost
of services as a percentage of service revenue in both 1994 and 1993, compared to their corresponding prior year
periods, are primarily due to higher growth in maintenance revenues, derived from product update rights and
technical support, than in maintenance expenses, primarily related to technical customer support.
5 A L E S A N D [DOLLARS I N MILLIONS1 1 9 9 4 CHANGE 1 9 9 3 CHANGE 1 9 9 2
M A R K E T I N G
,, Sales and marketing $ 200.5 46% $ 137.7 37% $ 100.4
Percentage of net revenue 43% 39% 36%
The increase in sales and marketing expenses, in absolute dollars and as a percentage of net revenues, in 1994
and 1993 compared to their corresponding prior year periods, was a result of increased sales personnel worldwide
as the Company expanded its investment in the worldwide direct sales organizations, opening of new subsidiaries,
acquisition of several foreign distributors, higher commission expense associated with the increase in revenues,
and increased marketing programs associated with new product launches. Excluding RCAS revenue and associ-
ated expenses in 1992, sales and marketing expenses were 37 percent of net revenues.
With the continuing expansion throughout 1995 of worldwide operations, as well as increased sales and
marketing expenditures aimed at positioning the Company and its new and existing products in the marketplace.
the Company expects that sales and marketing expenses will Increase in absolute terms in 1995.
R E s E A R c H A N D The Company accounts for its software development expenses in accordance with Statement of Financial
D E v E L o P m E N T Accounting Standards No. 86, "Accounting for the Costs of Computer Software to Be Sold, Leased, or Otherwise
E x P E N s E s Marketed." This statement requires that, once technological feasibility of a developing product has been estab-
lished, all subsequent costs incurred in developing that product to a commercially acceptahle level be capitalized
and amortized ratably over the revenue life of the product. The Company's research and development expenses
exclude capitalized software costs of $13.6 milllon in 1994, $8.6 million in 1993, and $5.0 million in 1992, and
exclude amortization costs of previously capitalized software (see Note 1 of Notes to Consolidated Financial
Statements). The following table summarizes research and development costs for the prior three years:
[DOLLARS I N M lLL lONSI 1 9 9 4 CHANGE 1 9 9 3 CHANGE 1 9 9 2 '
Incurred product development costs
Expenditures capitalized
Research and development expenses
Percentage of net revenues
Expenditures capitalized as a % of incurred 18%
Amortization $ 7.8
*Exclude5 RCAS llcenre revenue ~n 1992

-
Management's Discussion and Analysis
The increase in research and development expenditures in absolute dollars and as a percentage of net
revenues from year to year was attributed to increased personnel and consultants working on new products and
product extensions.
The proportion of capitalized expenditures as a percentage of total incurred expenses increased from year to
year as several major projects in development had reached technological feasibility. The Company expects the pro-
portion of work on capitalized projects in 1995 as a percentage of net revenues to remain relatively stable com-
pared to 1994 as other major new products reach technological feasibility in 1995, and capitalization of the related
software development costs begins.
Major new programs under development in 1995 include OnLine Dynamic Server 8.0 servers and connectiv-
ity products, and new upgrades of INFORMIX-NewEra tools products. The Company believes that research and
development expenditures are essential to maintaining its competitive position in its primary markets and expects
the expenditure levels in 1995 to increase in absolute dollars.
G E N E R A L A N D IDOLLARS I N M lLL lONSI 1 9 9 4 CHANGE 1 9 9 3 CHANGE 1 9 9 2
A D M I N I S T R A T I V E
General and ad~nin~strative expenses $ 34.5 4% $ 33.2 3% $ 32.2
Percentage of net revenues 7% 10% 11%
General and administrative expenses in 1994 remained relatively flat with 1993 and 1992 in absolute dollars.
Excluding the RCAS contract, general and administrative expenses were 12 percent of net revenues in 1992. The
slight increase in absolute dollars from year to year was primarily due to an increase in the costs of supporting the
Company's international operations as new subsidiaries and branch offices were established and existing sub-
sidiaries were expanded. The Company expects that 1995 general and administrative expenses as a percentage of
net revenues will remain similar to 1994.
r I r I G n r I o N In 1992, a charge of $10.5 million was taken for the settlement of the securities class action lawsuit filed against
s E T T L E M I N T the Company and certain of its officers and directors in 1988. The settlement, which was completed in May 1993,
does not constitute an admission of liability or wrongdoing on the part of the Company or on the part of any of its
current or former officers and directors. The settlenlent represents a decision by the Company's Board of Directors
that a settlement at the time was in the best interest of the Company and its stockholders.
1 N T E R l S T 1 N C 0 M E [DOLLARS I N MILLIONS1 1 9 9 4 CHANGE 1 9 9 3 CHANGE I 9 9 2
Interest income
Percentage of net revenues
Interest income in 1994 remained flat compared with 1993 despite higher cash and investments as the Company
invested a large percentage of its cash and investments in tax-exempt securities. The increase in absolute dollars
fmm 1992 to 1993 resulted from higher balances of cash and cash equivalents and short-term investments.
I N T E R E S T [DOLLARS I N MILLIONS1 1 9 9 4 CHANGE 1 9 9 3 CHANGE 1 9 9 2 . . , . . . . . . . , . . , . . , . . . , , . , . , . . , . . , . , . . , . . , . , . , . , . , . . . , . , , . . . . . . , , , , . . . . . . . , . . . . . . . . . . . . . . . . . . . . . . . . . . . . . . . , . . . . . . . . . . . . . . . . . . . . . , . . , . . . . . . . . . . . . . . . .
E X P E N S E
Interest expense $ 0.4 2% $ 0.4 (84%) $ 2.3
Percentage of net revenues

Management's Discussion and Analysis
Interest expense in 1994 and 1993 consists principally of interest expense on capital leases of certain computer
and office equipment. Interest expense in 1992 consists primarily of interest expense on convertible debentures
and capital leases of certain computer and office equipment. The decrease from 1992 to 1993 resulted primarily
from the call for redemption of the convertible debentures in the fourth quarter of 1992.
o T H r R E x P E N s I , The Company recognized net other expense of $2.6 million, $1.3 million, and $1.4 million in 1994,1993, and 1992,
N E T respectively. In 1994, net other expense primarily consisted of foreign exchange losses, net, and expenses related
to the Company's financing programs for accounts receivable. In 1993, net other expense primarily consisted of
foreign exchange losses, net, partially offset by a reversal of a liability which was determined to be no longer nec-
essary, related to a real estate partnership. In 1992, net other expense consisted of foreign exchange losses, net,
partially offset by a gain on a sale of an investment.
P R 0 V 1 S I 0 N F 0 R [DOLLARS I N MILLIONS) CHANGE CHANGE
I N C O M E T A X E S
Provision for income taxes
Effective tax rate
The Company's effective tax rate increased to 36.0 percent of pretax income in 1994 and 1993 from 22.6 percent
in 1992. This increase resulted from net operating loss and tax credit carryovers which were substantially utilized
in 1992 and the 1.0 percent increase in the U.S. federal income tax rate in 1993. The Company's effective tax rate
for fiscal years 1994 and 1993 is less than the combined federal and state statutory rate primarily due to the fed-
eral research and development credit and the permanent re-investment offshore of a portion of the earnings of the
Company's lower-taxed Irish operations. The amount considered permanently invested in the Irish operations may
vary from year to year and may affect the Company's effective tax rate.
The Company anticipates its fiscal 1995 effective tax rate to remain approximately the same as 1994; how-
ever, this rate could change based on a change in the geographic mix of the Company's earnings, the amount of
permanent reinvestment offshore of a portion of the 1995 earnings of the Company's lower-taxed Irish operations
and the scheduled termination of the federal research and development credit.
A N D C A P I T A L
Cash, cash equivalents, and investments $ 196.0 $ 143.5 $ 119.4
Working capital $ 194.5 $ 156.0 $ 98.7
Cash provided by operations $ 114.5 $ 64.8 $ 90.5
Cash used in investing activities, excluding investments
of excess cash $ 51.4 $ 36.7 $ 14.7
Cash provided by (used in) financing activities $ (10.8) $ (3.5) $ 1.7
Cash generated by operations provided sufficient resources to fund the Company's personnel growth and capital
asset needs in all years presented.
The increase in cash provided by operations in 1994 compared with 1993 was due mainly to higher income
before depreciation and amortization charges, increased accounts payable and accrued expenses, and the litiga-
tion settlement payment in 1993, partially offset by an increase in accounts receivable. The decrease in cash gen-
erated by operations in 1993 compared with 1992 was primarily attributable to an increase in accounts receivable
and the litigation settlement payment, offset in part by increased net income.

Management's Discussion and Analysis
Accounts receivable increased by $23.2 million in 1994 and by $45.4 million in 1993, principally as a result
of increased sales. Days sales outstanding decreased to 79 days in the fourth quarter of 1994 from approximately
97 days in the fourth quarter of 1993, but increased from 63 days in the fourth quarter of 1992. Excluding RCAS,
the days sales outstanding in the fourth quarter of 1992 was 77 days. Commencing in late 1993, the Company insti-
tuted programs to have third-party financial institutions provide financing for extended credit terms instead of such
terms being provided by the Company. The Company believes these financing programs are primarily responsible
for the decrease in days sales outstanding in 1994. The days sales outstanding ratio is dependent on many factors,
including the mix of contract-based revenue with significant OEMs and large corporate and government end users
versus revenue recognized on shipments to application vendors and distributors and the success of the Company's
financing programs. Although a large portion of the Company's revenues are derived from resellers, the Company's
revenues since 1993, particularly in Europe, have shifted substantially from distributors to direct end users. These
end-user sales contracts frequently bear extended payment terms which result in an increase in days sales out-
standing ratios unless the contracts are financed. The shift in distributor channels is likely to continue as prod-
ucts and markets mature. The Company is utilizing a variety of means to reduce the days sales outstanding ratio.
In the future, the Company expects this ratio to vary within the range which prevailed in the last several quarters.
Excluding investments of excess cash, net cash and cash equivalents used in investing activities increased
in 1994, compared with 1993 and 1992 levels. In 1994, 1993, and 1992, the Company acquired $25.2 million,
$22.1 million, and $9.7 million, respectively, of capital equipment consisting primarily of computer equipment,
computer software, and office equipment. The increase of capital equipment purchases in 1994 and 1993 resulted
from the Company's growing employee headcount, the replacement of older equipment, and investment in new tech-
nology. In the future, the Company anticipates the actual level of capital spending will be dependent on a variety
of factors, including the Company's business requirements and general economic conditions. In 1994 and 1993,
the Company made equity investments of $1.6 million and $3.5 million, respectively, in companies of strategic
interest to the Company.
The Company's investments in software costs were previously discussed under "Results of Operations" and
Note 1 of Notes to Consolidated Financial Statements.
In the third quarter of 1994, the Company acquired two of its distributors, one in Germany and the other in
Malaysia. The transactions were accounted for as purchases. The operating results of the distributors subsequent
to the acquisition dates, which were not significant in relation to those of Informix, were included in the consoli-
dated results of operations since the third quarter of 1994. The aggregate purchase price of these two distributors
was approximately $12.5 million, of which $8.8 million has been paid in 1994 with the remaining balance to be
paid in 1995.
In January 1995, the Company acquired a 90 percent interest in the database division of ASCII Corporation,
a distributor of its products in Japan. The Company will acquire the remaining 10 percent interest in January 1996.
The Company will account for the acquisition as a purchase. The purchase price of ASCII's database division is
approximately $46.0 million, of which approximately $34.8 million is allocated to intangible assets acquired.
In February 1995, the Company entered into an agreement to acquire in April 1995 an 80 percent interest in
the database division of Daou Corporation, a distributor of its products in Korea. The Company will acquire the
remaining 20 percent interest by January 1997. The purchase price of Daou's database division is approximately
$4.3 million.
The Board of Directors has authorieed the purchase of up to 4 million shares of the Company's common stock
in the open market to satisfy requirements under Stock Option and Stock Purchase Plans. Through December 1994,
1,790,000 shares with an aggregate cost of approximately $32.1 million had been repurchased on the open market.
During 1994 and 1993, all repurchased shares were re-issued to partially satisfy requirements under Stock Option
and Stock Purchase Plans.

Management's Discussion and Analysis
Net cash and cash equivalents provided by, or used in, financing activities in 1994 and 1993 included pay-
ments on capital leases and the repurchase of the Company's common stock offset by proceeds from the sale of the
Company's common stock to employees.
Net cash and cash equivalents provided by, or used in, financing activities was not significant in 1992 as
proceeds from the sale of the Company's common stock to employees was partially offset by the payments on
capital leases.
The Company expects current balances of cash, cash equivalents, and short-term investments, along with the
cash generated by operations, will be sufficient to fund anticipated levels of operations at least through 1995, to
purchase the Japanese and Korean distributors and may be used for investments and additional acquisitions
to supplement internal revenue growth and for other corporate purposes.

Consolidated Balance Sheets
DECEMBER 3 1 , DECEMBER 1 1 ,
I I N T H O U S A N D S , EXCEPT S H A R E A N D PER S H A R E A M O U N T S ) 1 9 9 4 1 9 9 3
A S S E T S
Current Assets:
Cash and cash equivalents
Short-term investments
Accounts receivable, less allowances for doubtful accounts of
$6,036 in 1994 and $3,181 in 1993
Deferred taxes
Other current assets
Total current assets
Property and Equipment, at cost:
Computer equipment
Office equipment and leasehold improvements
Less accumulated depreciation and amortization
Software Costs, less accumulated amortization of $7,973 in 1994 and
$7,989 in 1993
Deferred taxes
Long-term investments
Intangibles and other assets
Total Assets
L I A B I L I T I E S A N D S T O C K H O L D E R S ' E Q U I T Y
Current Liabilities:
Accounts payable
Accrued expenses
Accrued employee compensation
Income tax payable
Deferred taxes
Deferred revenue
Current portion of capital lease obligations
Other current liabilities
Total current liabilities
Capital lease obligations, less current portion
Other noncurrent liabilities
Deferred taxes
Commitments and contingencies
Stockholders' Equity:
Preferred stock, par value $.01 per share-5,000,000 shares authorized,
none issued
Common stock, par value $.01 per share-150,000,000 shares authorized,
issued 65,473,889 and 64,869,162 in 1994 and 1993, respectively
Additional paid-in capital
Treasury stock, at cost (133,389 shares in 1993)
Retained earnings
Unrealized gain on available-for-sale securities, net of tax
Foreign currency translation adjustment
Total stockholders' equity
Total Liabilities and Stockholders' Equity
See N o l e r l o Conrol ldoted Financial Statements

Consolidated Statements of Income
YEARS ENDED DECEMBER 31,
[IN THOUSANDS, EXCEPT PER SHARE DATA1 I994 1993 1992
N E T R E V E N U E S
Licenses
Services
C O S T S A N D E X P E N S E S
Cost of software distribution
Cost of services
Sales and marketing
Research and development
General and administrative
Operating income
Litigation settlement
Interest income
Interest expense
Other expense, net
Income before income taxes
Income Taxes
Net Income
Net Income Per Common Share
W E I G H T E D A V E R A G E N U M B E R O F C O M M O N A N D
C O M M O N E Q U I V A L E N I S H A R E S O U T S T A N D I N O :
See N o t e s to Consolidated Finoncia1 Sta tements
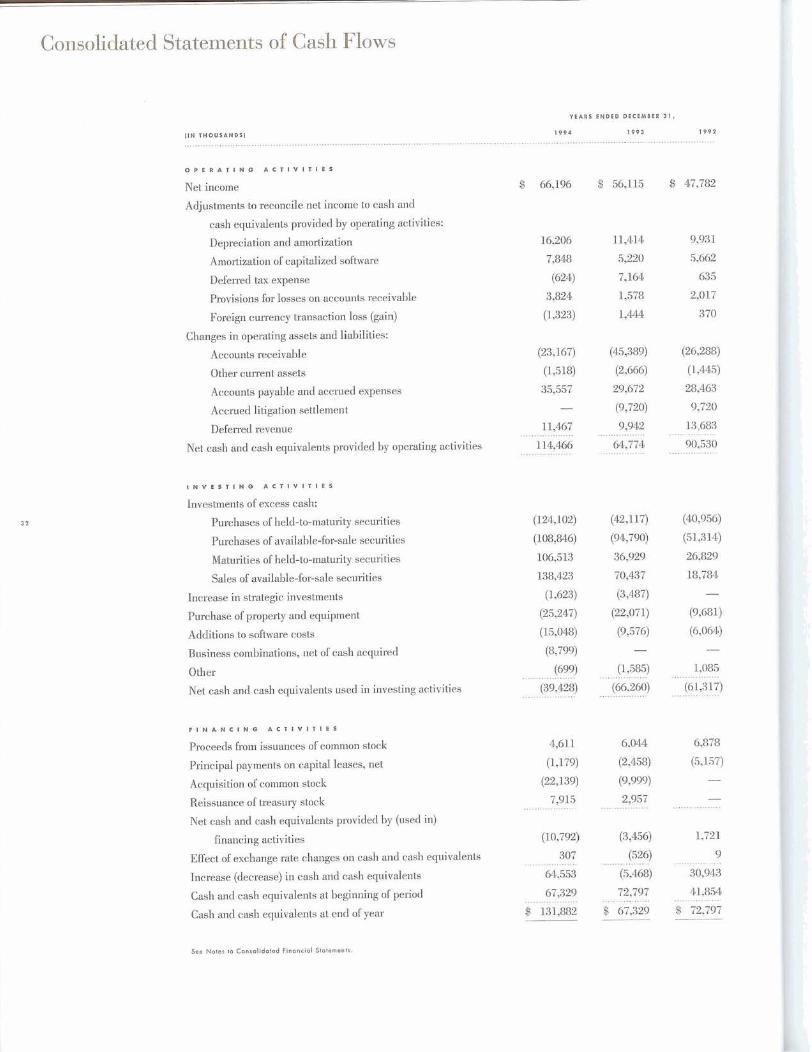
Consolidated Statements of Cash Flows
Y E A R S E N D E D DECEMBER 3 1 ,
1 9 9 4 1 9 9 3 1 9 9 2 ( I N T H O U S A N D S 1 ........................
O P E R A T I N G A C T I V I T I E S
Net income
Adjustments to reconcile net income to cash and
cash equivalents provided by operating activities:
Depreciation and amortization
Amortization of capitalized software
Deferred tax expense
Provisions for losses on accounts receivable
Foreign currency transaction loss (gain)
Changes in operating assets and liabilities:
Accounts receivable
Other current assets
Accounts payable and accrued expenses
Accrued litigation settlement
Deferred revenue
Net cash and cash equivalents provided by operating activities
I N V E S T I N G A C T I V I T I E S
Investments of excess cash:
Purchases of held-to-maturity securities
Purchases of available-for-sale securities
Maturities of held-to-maturity securities
Sales of available-for-sale securities
Increase in strategic investments
Purchase of property and equipment
Additions to software costs
Business combinations, net of cash acquired
Other
Net cash and cash equivalents used in investing activities
F I N A N C I N G A C l l V l T l E S
Proceeds from issuances of common stock
Principal payments on capital leases, net
Acquisition of common stock
Reissuance of treasury stock
Net cash and cash equivalents provided by (used in)
financing activities
Effect of exchange rate changes on cash and cash equivalents
Increase (decrease) in cash and cash equivalents
Cash and cash equivalents at beginning of period
Cash and cash equivalents at end of year
See Notes to C o n r a l ~ d o t e d F l n o n c ~ a l Stotementr

Consolidated Statements of Stockholders7 Equity
U N R E A L I Z E D
G A I N O N F O R E I G N
A D D I T I O N A L R E T A I N E D AVAILABLE CURRENCY
P A I D - I N TREASURY STOCK E A R N I N G S FOR SALE T R A N S L A T I O N
CAPITAL SHARES A M O U N T ( D E F I C I T ) SECURITIES A D J U S T M E N T TOTALS
C O M M O N STOCK
SHARES A M O U N T
Stock split effeoted in the f o m of a stock dividend
Exercise of stock options
Sale of cock to employees umdes employee stock purchase plan
T~JE benefits rdated to stock aiptions
Foreign currency translation adjustment
Conversion of convertible debentures
Net income
@ A L A N C E S A T D L C L W S P R 3 1 , I 9 9 2
Stock split effected in the form of a stock dividend
Exercise of stock optioh~
Sale of stock to employees under employee stock purchase plan
Tax benefits related to ~ tock options
Foreign currency traas1ation adjustment (864) 0354)
Acquisition sf treasury stock (4905 (9,999) paw) Reissuance of treasury stonk 357 7,568 (4,611) 2,957
Net imome . , .. 56,115 . . 56,115 . . . . . . . . . . . . . . . . . . . . . . . . . . . . . . . . .
B J\ L A w c E I A I D E c D 8 E B D i , 1 ~9 a 64,869 $ 649 6 125,230 (133) $ {2)431) $ 86,484 $ - $ (2,5i7) $ 207,4&5
Exe~cise of stock options 560 5 3,553 3,558
Sale of stock to employees undw employee stock purchase plm
Tax benefits related ts s t o k options
Foreign currenq translatian adjuattnent
Acquisition of treasury stock
Reissuance of treasury stock
Unrealked gain an available-for- sale securities, net of tax
Net income . . . . . . 66,196 . ,. ' 66,196 . . . . . . . . . .
s n r r N c r s A T B E ~ E M B E R 8 1 . 1 9 9 4 65,474, $655$139,897 - - $ 136,0& $ 665 b (1,598) 5 275,& I
) See NaPes t o Consol idated F~naneiol Jtofemedta

Notes to Consolidated Financial Statements
N O T E 1 S U M M A R Y O F S I G N I F I C A N T A C C O U N T I N G P O L I C I E S
Operations. Informix Corporation, a Delaware corporation, through its wholly owned subsidiary Informix Software,
Inc. and its foreign subsidiaries (collectively "the Company"), designs, develops, manufactures, markets, and
supports distributed relational database management systems (RDBMS), and object-oriented, graphical, and char-
acter-based application development tools, and graphical data-access tools for delivering information to most
significant desktop platforms. In addition to software products, the Company offers training, consulting, and main-
tenance to its customers.
Principles of Consolidation. The consolidated financial statements include the accounts of Informix Corporation
and its wholly owned subsidiaries. All material intercompany accounts, transactions, and profits have been elim-
inated in consolidation.
Foreign Currency Translation. For foreign operations with the local currency as the functional currency, assets
and liabilities are translated at year-end exchange rates, and statements of income are translated at the average
exchange rates during the year. Exchange gains or losses arising from translation of foreign currency denominated
assets and liabilities are included as a component of stockholders' equity.
For foreign operations with the U.S. dollar as the functional currency, assets and liabilities are translated at
the year-end exchange rates. Statements of income are translated at the average exchange rates during the year.
Gains and losses resulting from foreign currency translation are included in other expense, net.
The Company hedges, where possible, certain portions of its foreign exchange transaction exposures to for-
eign currency fluctuations primarily through the use of forward foreign exchange contracts in European and Asian
foreign currencies. The Company has limited unhedged transaction exposures in certain secondary currencies in
Latin America and Eastern Europe because there are limited forward currency exchange markets in these cur-
rencies. Gains and losses associated with exchange rate fluctuations on forward foreign exchange contracts are
recorded currently as income or loss as they offset corresponding gains and losses on the foreign currency denom-
inated assets and liabilities being hedged. The costs of the forward foreign exchange contracts are recordedas other
expense, net. See Note 3 of Notes to Consolidated Financial Statements.
Revenue Recognition. The Company generally recognizes license revenue from sales of software licenses upon
delivery of the software product to a customer. However, for certain computer hardware manufacturers and end-
user licensees with amounts payable within twelve months, the Company will recognize revenue at the time the
customer makes a contractual commitment for a minimum non-refundable license fee, if such computer hardware
manufacturers and end-user licensees meet certain criteria established by the Company. License revenue from
resellers (such as distributors and application vendors) and from other computer hardware manufacturers and
end users may be recognized at the earlier of either payment of the license fee or the shipment of the software
media on a per-unit basis. However, in no case is revenue recognized unless a master or first copy is delivered to
the customer.
Maintenance contracts generally call for the Company to provide technical support and software updates to
customers. Maintenance contract revenue is recognized ratably over the term of the maintenance contract, gener-
ally on a straight-line basis. Where maintenance revenue is not separately invoiced, it is unbundled from license
fees and deferred for revenue recognition purposes. Other service revenue, primarily training and consulting, is
generally recognized at the time the service is performed.
The Company's revenue recognition policy is in compliance with the provisions of the American Institute of
Certified Public Accountants' Statement of Position 91-1, "Software Revenue Recognition."
No single customer accounted for 10 percent or more of consolidated revenues in 1994,1993, or 1992.

Notes to Consolidated Financial Statements
Income Taxes. The Company accounts for income taxes in accordance with the provisions of the Financial
Accounting Standards Board Statement No. 109 (FAS 109) "Accounting for Income Taxes." Under FAS 109, the
liability method is used in accounting for income taxes. Under this method, deferred tax assets and liabilities are
determined based on differences between the financial reporting and income tax bases of assets and liabilities,
and are measured by applying enacted tax rates and laws to the taxable years in which such differences are
expected to reverse.
Inventories. Inventories, which consist primarily of software product components, finished software products, and
marketing and promotional materials, are carried at the lower of cost (first in, first out) or market value, and are
included in other current assets.
Sofhuare Costs. The Company capitalizes software development costs incurred in developing a product once tech-
nological feasibility of the product has been determined. Software costs also include amounts paid for purchased
software and outside development on products which have reached technological feasibility. All software costs are
amortized as a cost of software distribution either on a straight-line basis over the remaining estimated economic
life of the product, or on the basis of each product's projected revenues, whichever is greater. The Company
recorded amortization of $7.8 million, $5.2 million, and $5.7 million of software costs in 1994, 1993, and 1992,
respectively, in cost of software distribution.
Property and Equipment. Depreciation of property and equipment is calculated using the straight-line method over
the estimated useful life, generally the shorter of the lease term or three to seven years for financial reporting pur-
poses, and by accelerated methods for tax purposes.
Businesses Acquired. The purchase price of businesses acquired is allocated to the tangible and specifically iden-
tifiable intangible assets acquired based on their fair values with any amount in excess of such allocations being
designated as goodwill, Intangible assets are amortized over their estimated useful lives, which to date have been
five to seven years. The Company periodically monitors the recoverability of such intangible assets.
Net Zncome Per Common Share. Net income per common share is based on the weighted average number of com-
mon and dilutive common equivalent shares outstanding during each year. All stock options and convertible deben-
tures are considered common stock equivalents and are included in the weighted average computations when the
effect is dilutive.
Concentration of Credit Risk. The Company designs, develops, manufactures, markets, and supports computer soft-
ware systems to customers in diversified industries and in diversified geographic locations. The Company pelforms
ongoing credit evaluations of its customers' financial condition and generally requires no collateral.
Cash, Cash Equivalents, Short-Term Investments, and Long-Term Investments. The Company ronsiders liquid
investments purchased with an original maturity of three months or less to be cash equivalents. The Company ron-
siders investments with an original maturity of more than three months but less than one year to be short-term
investments. Investments with an original maturity of more than one year are considered long-term investments.
Short-term and long-term investments are carried at either amortized cost or fair value, depending on their rlas-
sifiration as held-to-maturity or available-for-sale, respectively. Cash equivalents are carried at amortized cost.
The Company invests its exress cash in accordance with its short-term and long-term investments poliry which
is approved by the Board of Directors. The policy authorizes the investment of excess cash in government securi-
ties, municipal bonds, time deposits, rertificates of deposit with approved financial institutions. commercial paper
rated A-IIP-1 (a small portion of the portfolio may consist of commeicial paper laled A-ZIP-2). and other specific
money market instruments ot similar liquidity and ciedit quality. The Company has not experienced any signifi-
cant losses related to thcse investments.

Notes to Consolidated Financial Statements
Securities Held-to-Maturity and Availablerfor-Sale. Management determines the appropriate classification of debt
securities at the time of purchase and re-evaluates such designation as of each balance sheet date. Debt securi-
ties are classified as held-to-maturity when the Company has the positive intent and the ability to hold the secu-
rities until maturity. Held-to-maturity securities are stated at amortized cost, adjusted for amoaization of premiums
and accretion of discounts to maturity. Such amortization, as well as any interest on the securities, is included in
interest income.
Marketable equity securities and debt securities not classified as held-to-maturity are classified as available-
for-sale. Available-for-sale securities are carried at fair value, with the unrealized gains and losses, net of tax,
reported in a separate component of stockholders' equity. The amortized cost of debt securities in this category is
adjusted for amortization of premiums and accretion of discounts to maturity. Such amortization is included in inter-
est income. Realized gains and losses and declines in value judged to be other-than-temporary on available-for-
sale securities are included in other expense, net. The cost of securities sold is based on the specific identification
method. Interest on securities classified as available-for-sale are included in interest income.
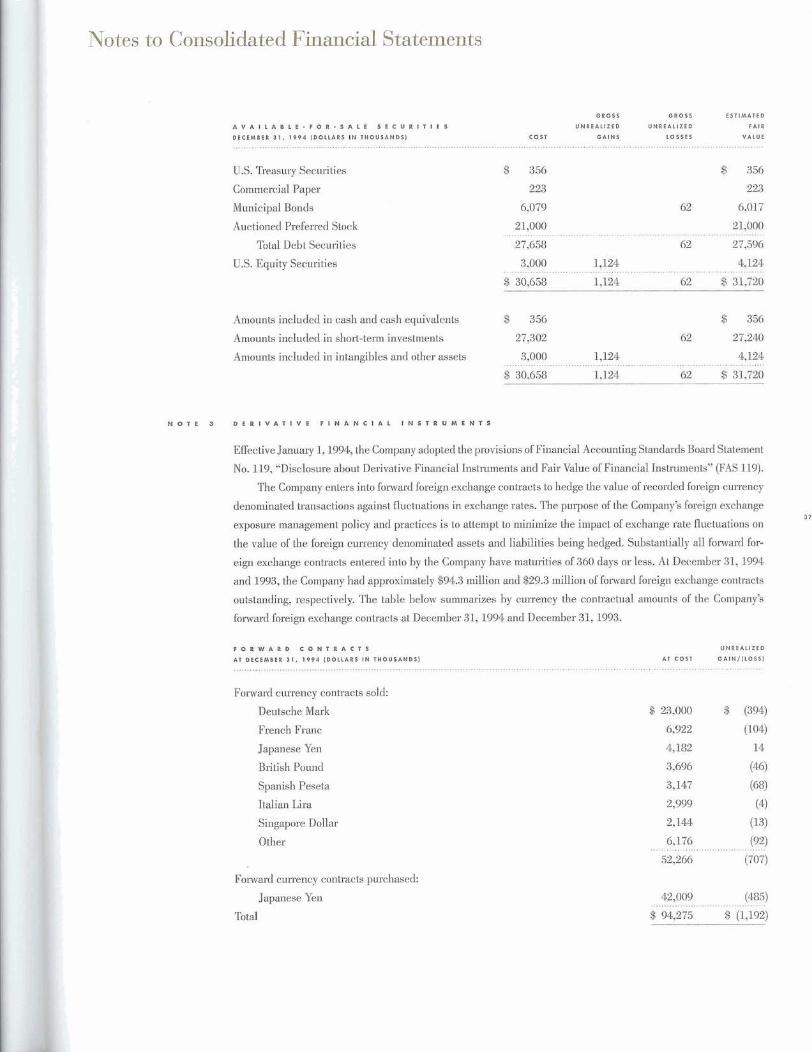
N O T E 2 F A I R V A L U E S O F F I N A N C I A L I N S T R U M E N T S
Effective January 1, 1994, the Company adopted Financial Accounting Standards Board Statement No. 115,
"Accounting for Certain Investments in Debt and Equity Securities" (FAS 115).
Due to insignificant differences at the date of adoption of FAS 115 between the cost and fair value of the
Company's investments, when considering both gross unrealized gains and gross unrealized losses, the adoption
of FAS 115 had no effect on the Company's financial statements. Consequently, in accordance with FAS 115, prior
period financial statements have not been restated.
The fair values for marketable debt and equity securities are based on quoted market prices.
The following is a summary of held-to-maturity securities and available-for-sale securities:
H E L D - T O - M A T U R I T Y S E C U R I T I E S
DECEMBER 3 1 , 1 9 9 4 [ D O L L A R S I N T H O U S A N D S )
G R O S S G R O S S E S T I M A T E D
U N R E A L I Z E D U N R E A L I Z E D FAIR
COST G A I N S LOSSES VALUE
U.S. Treasury Securities
Municipal Bonds
Commercial Paper
Amounts included in cash and cash equivalents
Amounts included in short-term investments
Amounts included in long-term investments
Notes to Consolidated Financial Statements
A V A l l A B L E - F O R - S A L E S E C U R I T I E S
DECEMBER 3 1 , 1 9 9 4 (DOLLARS I N T H O U S A N D S ]
U.S. Treasury Securities
Commercial Paper
Municipal Bonds
Auctioned Preferred Stock
Total Debt Securities
U.S. Equity Securities
Amounts included in cash and cash equivalents
Amounts included in short-term investments
Amounts included in intangibles and other assets
COST
GROSS GROSS
UNREALIZED UNREALIZED
G A I N S LOSSES
ESTIMATED
FAIR
VALUE
N O T E 3 D E R I V A T I V E F I N A N C I A L I N S T R U M E N T S
Effective January 1,1994, the Company adopted the provisions of Financial Accounting Standards Board Statement
No. 119, "Disclosure about Derivative Financial Instruments and Fair Value of Financial Instruments" (FAS 119).
The Company enters into forward foreign exchange contracts to hedge the value of recorded foreign currency
denominated transactions against fluctuations in exchange rates. The purpose of the Company's foreign exchange
exposure management policy and practices is to attempt to minimize the impact of exchange rate fluctuations on
the value of the foreign currency denominated assets and liabilities being hedged. Substantially all forward for-
eign exchange contracts entered into by the Company have maturities of 360 days or less. At December 31, 1994
and 1993, the Company had approximately $94.3 million and $29.3 million of forward foreign exchange contracts
outstanding, respectively. The table below summarizes by currency the contractual amounts of the Company's
forward foreign exchange contracts at December 31, 1994 and December 31, 1993.
F O R W A R D C O N T R A C T S
AT DECEMBER 3 1 , 1 9 9 4 (DOLLARS I N T H O U S A N D S )
Forward currency contracts sold:
Deutsche Mark
French Franc
Japanese Yen
British Pound
Spanish Peseta
Italian Lira
Singapore Dollar
Other
Forward currency contracts purchased:
Japanese Yen
Total
UNREALIZED
A T c o s r G A I N J I L O ~ S I

Notes to Consolidated Financial Statements
F O R W A R D C O N T R A C T S
AT DECEMBER 3 1 . 1 9 9 3 ( D O L L A R S I N T H O U S A N D S 1
Forward currency contracts sold:
Deutsche Mark
Italian Lira
British Pound
Spanish Peseta
French Franc
Other
Total
U N R E A L I Z E D
AT C O S T G A I N / I L O S S I
. . . . . . . . . . . . . . . . . . . . . . . . . . . . .
Other than the use of forward foreign exchange contracts as discussed immediately above, the Company does
not currently invest in or hold any other financial instruments defined as derivative financial instruments by
!?AS 119.
N O T E 4 E M P L O Y E E S T O C K O P T I O N A N D P U R C H A S E P L A N S
Under the Company's 1986 Employee Stock Option Plan, options are granted at fair marlcet value on the date of
the grant. Options are generally exercisable in cumulative annual installments over three to five years. Payment
for shares purchased upon exercise of options may be by cash or, with Board approval, by full recourse promissory
note or by exchange of shares of the Company's common stoclc at fair marlcet value on the exercise date. Options
expire 10 years after the date of grant. At December 31, 1994, 20,400,000 shares were authorized for issuance
under the Plan.
Additionally, 800,000 shares were authorized for issuance under the 1989 Outside Directors Stoclr Option
Plan, whereby non-employee directors are automatically granted non-qualified stock options upon election or re-
election to the Board of Directors.
Following is a summary of actlvity for both stoclc option plans for the three years ended December 31, 1994:
Outstanding at December 31, 1991
Options granted
Options exercised
Options canceled
Outstanding at December 31, 1992
Options granted
Opt~ons exercised
Options canceled
Outstanding at December 31, 1993
Options granted
Options exercised
Options canceled
Outstanding at December 31, 1994
Available for grant at December 31, 1994
N U M B E R
O F SHARES
9,126,680
3,430,372
(3,574,508)
(657,170)
8,325,374
2,283,900
(2,193,167)
(702,820)
O P T I O N S
PRICE PER SHARE ..................................
$ 0.25 to $ 3.82
4.97 to 16.13
0.42 to 3.82
0.85 to 7.82

Notes to Consolidated Financial Statements
In April 1994, the Company adopted the 1994 Stock Option and Award Plan. Options can be granted to
employees on terms substantially equivalent to those described above. The 1994 Stock Option and Award Plan
also allows the Company to award performance shares of the Company's common stoclc to be paid to recipients on
the achievement of certain performance goals set with respect to each recipient. At December 31, 1994,4,000,000
shares were authorized for issuance, but no options have been granted to date under this plan.
In connection with all stock option plans, 11,457,800 shares of common stock were reserved for issuance
as of December 31, 1994. At December 31, 1994 and 1993, options exercisable were 2,342,362 and 1,540,037,
respectively.
The Company also has a qualified Employee Stock Purchase Plan under which 3,800,000 shares of common
stock in the aggregate have been authorized for issuance. Under the terms of the Plan, employees may contribute
via payroll deductions up to 10 percent of their base pay and purchase up to 500 shares per quarter (with the lim-
itation of purchases of $25,000 annually in fair market value of the shares). Employees may elect to withdraw from
the Plan during any quarter and have their contributions for the period returned to them. Also, employees may
elect to reduce the rate of contribution one time in each quarter. The prlce at which employees may purchase shares
is 85 percent of the lower of the fair market value of the stock at the beginning or end of the quarter. The Plan is
qualified under Section 423 of the Internal Revenue Code of 1986, as amended. During 1994,1993, and 1992 the
Company issued 242,378 shares, 197,551 shares, and 332,966 shares, respectively, under this Plan. In connection
with the Employee Stock Purchase Plan, 807,229 shares were reserved for issuance as of December 31,1994.
The Board of Directors has authorized the purchase of up to 4 million shares of the Company's common
stoclc in the open market to satisfy requirements under Stock Option and Stock Purchase Plans. Such shares are
recorded using the cost method and are re-issued using the first-in, first-out (FIFO) method. During 1994 and 1993,
approximately 1,300,000 shares and 490,000 shares with an aggregate cost of approximately $22.1 million and
$10.0 million, respectively, had been repurchased on the open market. All such shares have been re-issued as of
December 31,1994.
N O T E 5 4 0 1 ( K ) P L A N
The Company has a 401(k) plan covering substantially all of its U.S. employees. Under this plan, participating
employees may defer up to 15 percent of their pre-tax earnings, subject to the Internal Revenue Service annual
contribution limit ($9,240 for 1994). In 1994, the Company matched 50 percent of each employee's contribution up
to a maximum of $1,500. The Company's matching contributions to this 401(k) plan for 1994,1993, and 1992 were
$1.4 million, $0.8 million, and $0.3 million, respectively.
N O T E 6 L E A S E S
The Company leases certain computer and office equipment under capital leases having terms of three to five years.
Amounts capitalized for such leases are included on the consolidated balance sheets as follows:
/IN T H O U S A N D S ]
Computer equipment (at cost)
Office equipment
Less: accumulated amortization
DECEMBER 3 1 , D E C E M B E R 3 1 ,
1 9 9 4 1 9 9 3

Notes to Consolidated Financial Statements
Amortization with respect to leased equipment is included in depreciation expense.
During 1994 and 1993, the Company financed approximately $381,000 and $373,000, respectively, of equip-
ment purchases under capital lease arrangements.
The Company leases certain of its office facilities and equipment under non-cancelable operating leases.
Future minimum payments, by year and in the aggregate, under the capital and non-cancelable operating
leases as of December 31, 1994, are as follows:
C A P I T A L N O N - C A N C E L A B L E
YEAR E N D I N G DECEMBER 3 1 ( I N T H O U S A N D S ] LEASES O P E R A T I N G LEASES . .,,...,.., ..................... . .,.. .,... . . . . ..... ........ .... ...... . , . . . ............... ........ . . . . . . . . . . . . . . . . , . . , . . . . . . . , . . . . . . . . . . . . . . . . . . . . . . . .
1998
1999
Thereafter
Total payments
Less amount representing interest
Present value of minimum lease payments
Less current portion
Total rent expense aggregated $17.1 million, $14.4 million, and $13.8 million in 1994, 1993, and 1992,
respectively.
In 1994, 1993, and 1992, the Company made interest payments on notes payable to banks, convertible sub-
ordinated debentures, and other obligations aggregating $0.4 million, $0.4 million and $2.4 million, respectively.
The Company's Lenexa, Kansas office and warehouse facilities are leased under an initial 10-gear operating
lease term (with two five-year renewal options) from a partnership in which Informix Software, h c . is a 50 per-
cent partner. Rental payments are approximately $1.4 million annually through 1997, exclusive of maintenance
costs for common areas. This related commitment is included in the above schedule of non-cancelable operating
lease payments.

Notes to Consolidated Financial Statements
N O T E 7 G E O G R A P H I C I N F O R M A T I O N
Net revenues, operating income (loss), and identifiable assets for the Company's U.S., European, and other foreign
operations are summarized below by year:
[ I N T H O U S A N D S ] U N I T E D STATES E U R O P E A N OTHER E L I M I N A T I O N S TOTAL
1994:
Net revenues $ 303,611 $ 172,947 $ 35,854 $ (43,715) $ 468,697
Operating income (loss) 78,620 39,013 (12,771) (2,301) 102,561
Identifiable assets 382,650 109,939 36,053 (84,232) 444,410
1993:
Net revenues $ 257,439 $ 137,404 $ 11,403 $ (53,331) $ 352,915
Operating income (loss) 92,987 11,192 (10,657) (8,133) 85,389
Identifiable assets 287,538 74,004 13,355 (48,264) 326,633
1992:
Net revenues
Operating income (loss)
Identifiable assets
Sales and transfers between geographic areas are accounted for at prices which the Company believes are
arm's length prices, which in general are in accordance with the rules and regulations of the respective governing
tax authorities.
Export revenues consisting of sales from the Company's U.S. operating subsidiary to non-affiliated customers
were as follows:
( I N T H O U S A N D S )
AsiaRacific
Other
Total
N O T E I N C O M E s r X E r
The provision for income taxes applicable to income before income taxes consists of the following:
( I N T H O U S A N D S 1 I 9 9 4 1 9 9 3
Currently payable:
Federal
State
Foreign
Deferred:
Federal
State
Foreign

Notes to Consolidated Financial Statements
In 1994 and 1993, the Company recognized tax benefits related to stock option plans of $10.1 million and
$20.5 million, respectively. Such benefits were recorded as an increase to additional paid-in capital.
Income before income taxes consists of the following:
Domestic
Foreign
The provision for income taxes differs from the amount computed by applying the federal statutory income
tax rate to income before income taxes. The sources and tax effects of the differences are as follows:
1 9 9 4
A M O U N T PERCENT
1 9 9 3
A M O U N T PERCENT
1 9 9 2
A M O U N T PERCENT
Computed tax at federal statutory rate
Losses which resulted in no current tax benefit
Research and development credits
Effect of foreign income and related taxes
State income taxes, net of federal tax benefit
Benefit from net earnings of foreign subsidiaries
considered to be permanently reinvested in non-U.S. operations
Benefit of tax net operating loss
Other, net

Notes to Consolidated Financial Statements
Deferred income taxes reflect the net tax effects of temporary differences between the carrying amounts of
assets and liabilities for financial statement purposes and the amounts used for income tax purposes. Significant
components of the Company's deferred tax assets and liabilities as of December 31, 1994 and 1993 are as follows:
Deferred tax assets:
Reserves and accrued expenses
Deferred revenue
Foreign net operating loss carryfonvards
Tax credit carryfonvards
Foreign taxes on unremitted earnings, net of related U.S tax liability
Other
Total deferred tax assets
Valuation allowance for deferred tax assets
Net deferred tax assets
Deferred tax liabilities:
Capitalized software
Revenue recognition
Undistributed earnings of profitable foreign subsidiaries
Valuation of investment portfolio
Other
Total deferred tax liabilities
Net deferred tax assets
Cumulative undistributed earnings of the Company's Irish subsidiary for which no income taxes have been
provided aggregated approximately $11.4 million at December 31, 1994. These earnings are considered to be
permanently re-invested in non-U.S. operations. Additional taxes of approximately $2.9 million would have to be
provided if these earnings were repatriated to the U.S.
At December 31, 1994 the Company had approximately $8.0 million of foreign net operating loss cairyfor-
wards which expire at various dates beginning in 1999. Income taxes paid amounted to $22.5 million, $7.8 million
and $3.1 million in 1994, 1993 and 1992, respectively.
The deferred tax asset valuation allowance increased by $0.9 million in 1994 and decreased $9.9 million and
$5.0 million in 1993 and 1992, respectively. Approximately $8.9 million of the 1993 valuation allowance decrease
of $9.9 million was related to tax carryfonvards attributable to stock option deductions which was credited to
paid-in capital.
N O T E 9 L I T I G A T I O N
On May 10, 1993, the Company settled the securities class action lawsuit filed against the Company and certain
of its officers and directors in 1988. The Company provided a charge of $10.5 million in the fourth quarter of 1992
for such settlement and related costs.
The settlement does not constitute an admission of liability or wrongdoing on the part of the Company or
on the part of any of its current or former officers and directors. The settlement does represent a decision by
the Company's Board of Directors that a settlement at the time was in the best interest of the Company and
its stockholders.

Notes to Consolidated Financial Statements
In the ordinary course of business, various lawsuits and claims are filed against the Company. It is the
Company's opinion that the resolution of such litigation will not have a material effect on the Company's financial
position, results of operations, or cash flows.
N O T E 1 0 B U S I N E S S C O M B l N A T l O N S
In July 1994, the Company acquired the business of a division of a distributor of its products in Germany. This
acquisition has been recorded as a purchase. The purchase cost of this business was approximately $10.6 million,
of which $4.8 million was allocated to intangible assets acquired.
In August 1994, the Company acquired the business of a distributor of its products in Malaysia. This acqui-
sition has also been recorded as a purchase. The purchase cost of this business was approximately $1.9 million,
of which $1.8 million was allocated to intangible assets acquired. An additional $1.0 million consideration may be
payable by the Company contingent upon the achievement of certain financial objectives by the business.
The operating results of these businesses have not been material in relation to those of the Company and are
included in the Company's consolidated results of operations from the date of acquisition.
N O T E I I S E L E C T E D Q U A R T E R L " ' I N A N C I A f " A T A ( U N A U D I T E D )
( I N T H O U S A N D S , EXCEPT PER SHARE D A T A ]
FIRST S E C O N D T H I R D FOURTH
QUARTER QUARTER QUARTER QUARTER
Net revenues
Gross profit
Net income
Net income per share
1993:
Net revenues
Gross profit
Net income
Net income per share
N O T E 1 2 S U B S E Q U E N T E V E N T S
In January 1995, the Company acquired a 90 percent interest in the database division of ASCII Corporation, a dis-
tributor of its products in Japan, and will acquire the remaining 10 percent in January 1996. This acquisition will
be recorded as a purchase. The purchase cost of this business is approximately $46.0 million, of which $34.8 mil-
lion is allocated to intangible assets acquired.
In February 1995, the Company entered into an agreement to acquire in April 1995 an 80 percent interest of
the database division of Daou Corporation, a distributor of its products in Korea. The Company will acquire the
remaining 20 percent by January 1997. The purchase price of this business is approximately $4.3 million.
Auditors' Letter
B O A R D O F D I R E C T O R S A N D S T O C K H O L D E R S
I N F O R M I X C O R P O R A T I O N
We have audited the accompanying consolidated balance sheets of Informix Corporation as of December 31,1994
and 1993, and the related consolidated statements of income, stockholders' equity, and cash flows for each of the
three years in the period ended December 31, 1994. These financial statements are the responsibility of the Com-
pany's management. Our responsibility is to express an opinion on these financial statements based on our audits.
We conducted our audits in accordance with generally accepted auditing standards. Those standards require
that we plan and perform the audit to obtain reasonable assurance about whether the financial statements are free
of material misstatement. An audit includes examining, on a test basis, evidence supporting the amounts and
disclosures in the financial statements. An audit also includes assessing the accounting principles used and
significant estimates made by management, as well as evaluating the overall financial statement presentation. We
believe that our audits provide a reasonable basis for our opinion.
In our opinion, the financial statements referred to above present fairly, in all material respects, the consol-
idated financial position of Informix Corporation at December 31, 1994 and 1993, and the consolidated results of
its operations and its cash flows for each of the three years in the period ended December 31, 1994 in conformity
with generally accepted accounting principles.
San Jose, California
February 6,1995

Corporate Directory
B O A R D O F D I R E C T O R S
PhillLi, E. White Chairman, President, and Chief Executive Officer, Informix Corporation
Albert K Knorp, Jr. Of Counsel Gray Cary Ware & Freidenrich
James L. Koch Dean, Leavey School of Business and Administration,
Santa Clara University
Thomas A. McDonnell Vice Chairman and Chief Executive Officer, DST Systems, Inc.
Cyril J. Yansouni Chairman and Chief Executive Officer, Read-Rite Corporation
T R A N S F E R A G E N I
First National Bank of Boston, Boston, Massachusetts
I N D E P E N D E N T A U D I T O R S
Erns t & Young LLP San Jose, California
C O R P O R A T E O F F I C E R 5
Phillip E. White Chairman, President, and Chief Executive Officer
D. Kenneth Coulter Senior Vice President, Europe, Middle East, and Africa
Howard H. Graham Senior Vice President, Finance and Chief Financial Officer
Mike Saranga Senior Vice President, Product Management and Development
Edwin C. Winder Senior Vice President, Intercontinental Group
Frank J. Bergandi Vice President, North America
Richard C. Blass Vice President, Corporate Controller and Chief Accounting Officer
Margaret R. Brauns Vice President and Treasurer
Ira H. Dopf Vice President. Human Resources
James K Hendrickson Jr. Vice President, Customer Service and Lenexa Site General Manager
Stephen E. Hill Vice President, Strategic Planning and Corporate Development
Steven R. Sommer Vice President, Marketing
David H. Stanley Vice President, Legal, General Counsel and Secretary

Corporate Infomation
, >-* .?*C' .+ <- 2 *?-7.
?<< ;#I: * .P
# @ & & t # " d b t J
" . _ I
+ : > ' I > ' *
aviU b @W w i h t e b up~n A W B ~ ~ Awtria Ibeatsrnvit& AR Ba$luo
%d R=pdic h m r k
C i m i d l DH I I N ~ U * I . ~ P D V ~ M C lh.&¶s, TX Ban%; 3Gxlg
~ t u a h ~ a l N ~ Q ~f ~ t p c ~ r h ~ r f e ~ w i ~ ip3e IteM at I&
mm&~, May 18,1995 at th Cmpmyk D&tait, hn
ar H B C . ~ at h h n m ~sive* M ~ B DBwmGrovq IE,
P& C d i f b e . Howtan, TIC radim"~i"1'is, M 1-
C O ~ B ~ R * I % - C K t s * m ~ m a L A M F I ~lvine, GA Ibirrlaysia
&* *u C A
Campy's irpitbd paiblic & g s a@ Kruni, FL (SFKi. ?k bUaaringl t r i b 1 ~ forth for H~ PwIa'e R e p u g gf Ghim
ef hi& dl ims
d Kom & * # a naen 101 I~.~~.n,*~~.,*.,~n"l.~~lm*l.s.~(l~.~U*,,,.,~..~.~.~,.~* .,.. + ....,..... *>..*., R w i a
% 28.B $ t3.w '27.00 1 3 B 25.25 1%%
&b W B t r P-m 16-63 $w& Stwr6.and
t @ cc ns ON r B w ~ . , . ~ . x . * ~ ~ ~ , . , ~ " ~ ~ ~ , , ~ ~ ~ ~ * , ~ . w ~ e , , ~ . . * ~ , ~ . . v , ~ ~ ~ . . % - . * 4 . , . ~ ~ . ' ~ - ~ ~ . ' . ~ . - . 9 " ~ ' . * . * . ~ . ~ ~ ,
T&wm
let c@w* @ %,13 dS 1 6 . ~ 22.13 14.N 2x75 G*rn 33-13
t O * P O I I l l Y I ! & & O W h f f t O P Z
41f10 B&= Drive S 0 1 6 1 0 W S 1 0 @ K M O E L 6 1 @ & R B C E O I O Me& htrk, California
jg3.wq; $',g a@lf*$.& a , ,<I jl$rlfirnW
.+-. $3. "-\ L*J & ++$:* %<:,,. tdi 2&$$ k&