Embed Size (px)
Citation preview

1985ANNUALREPORT

.. , ..... HIGHLIGHTS
8%
12
4
9
17
47
10
40
Percentageincrease'.
1985
$190 ,0 $169·3 12%
8·30 6.85 21
2·48 2.16 15
.67% .62% 8
14·05 12.88 9
$24,614 $22/894
29,429 28,184
1,458 1,344
2,217 1,892
4,333 2/955
7-44% 6.65%
14·53 10·39
21,139 21,235
$61.87 $56.21
FOR THE YEAR
Net income
Per common shareNet income
Dividends declared
(in millions)
Net income to average total assets
Net income applicable to common stock
to average common stockholders' equity
Common shares outstanding (in thousands)
Book value per common share
Primary capital to assets
Thtal capital to assets
AT YEAR END
Loans
AssetsStockholders' equity
Primary capital
Thtal capital
•
1 HIGHLIGHTS .2 LETTER TO SHAREHOLDERS
4 1985 WAS A YEAR OF PROGRESS
7 MANAGEMENT'S ANALYSIS OF
FINANCIAL OPERATIONS
7 OVERVIEW
9 EARNING PERFORMANCE
9 INTEREST DIFFERENTIAL
AND PREAD
13 NONINTEREST INCOME
13 NONINTEREST EXPENSE
14 INCOME TAXES
14 BALANCE SHEET ANALYSIS
IS INVESTMENT SECURITIES
IS LOAN PORTFOLIO
15 NONACCRUAL LOANS,
RESTRUCTURED LOANS
AND OTHER REAL ESTATE
16 ALLOWANCE FOR LOAN LOSSES
17 CROSS-BORDER OUTSTANDINGS
19 DEPOSITS
20 LIQUIDITY MANAGEMENT
20 CAPITAL ADEQUACY
21 ASSET/LIABILITY MANAGEMENT
22 COMPARISON OF 1984 VERSUS 1983
23 GENERAL INFORMATION
24 FINANCIAL STATEMENTS
28 NOTE TO FINANCIAL STATEMENTS • ..'" ..
43 ACCOUNTANTS' REPORT : .. •• •44 SUPPLEMENTAL QUARTERLY AND ..
•• •• • : • :ANNUAL FINANCIAL DATA
46 DIRECTORS AND MANAGEMENT .: ..

WELLS FARGO & COMPANY AND SUBSIDIARIES ,. WELL~FARGO & COMPANY AND SUBSIDIARIES
LETTER TO SHAREHOLDERS
February 20,1986Paul HazenPresident
help and strong support of ourstaff. They have tightened theirbelts and found imaginative newways to get the job done whileworking to maintain the quality ofour service. For this we thankthem. As tangible evidence ofour gratitude, in 1985 we gaveapproximately 10,000 full-time andsome 1,500 part-time employees agift of cash and time off to enjoy it.
Working together, the management, staff and directors ofWellsFargo have successfully broughtthe Company through unchartedwaters during the recent yearsof deregulation. In 1986 we willwelcome into this group themanagement and staff of CrockerNational Corporation, who haveworked hard and effectively overthe past two years to restore healthto that fine organization. Workingtogether, we hope to create anew and dynamic team that willachieve solid returns for ourshareholders while providingfirst-rate service for our customers.
Carl E. ReichardtChairman
certain branches and operationswhere there is overlap, and byclosing those in areas in whichtheir continued operation does notmake sense. To accomplish this,we will follow the same guidelinesthat we have used over the pastthree or four years as we made ourown system more efficient.
We will combine the productsand services now offered byCrocker with our own and willselect those that offer the greatestpotential, and discontinue thosethat make less economic ormarketing sense.
For their advice and guidancein this undertaking, as in allothers, Wells Fargo owes a debt ofgratitude to its Board of Directors.Their considered review of thisacquisition plan was beneficial tomanagement, and their soundcounsel will provide us with strongsupport in coming months.
In 1985, J. W Mailliard III retiredas a director after 31 years ofdedicated service and was nameddirector emeritus. Robert L.
Bridges retired from his position asdirector emeritus after 20 years ofwise counsel to our organization.We warmly thank both thesegentlemen for their years ofvaluedassistance.
Few of our Company'sachievements in adapting to thenew world of deregulation wouldhave been possible without the
gathering and lending, withemphasis on California. We expectto benefit from economies of scaleand efficiencies in a number ofour operations.
Studying the operations ofCrocker and preparing to blendthem with those ofWells Fargo willbe a major challenge for 1986, butone that we expect to carry outsmoothly and without disruption inservice for customers of eitherinstitution.
Significant economies will beachieved by the elimination ofduplicate management andsupport services. This will, ofcourse, involve personnel dislocation, but we believe that we canminimize the effects of this bytaking several actions. At WellsFargo, we established an immediate selective freeze on allnew hiring and will try to holdvacancies open so that uponcompletion of the acquisition wewill have openings for Crockerpersonnel. In line with trends inthe banking industry; we have anaverage staff turnover ofapproximately 20 percent. Crocker'sturnover rate is higher. Thus, wewill attempt to preserve opportunities for employees of Crockerto move into vacant Wells Fargopositions. This should mitigate theimpact on individuals.
We plan to consolidate the twobanks' structures by combining
service to customers, more exciting opportunities for employees,and increased returns to shareholders. Further, this acquisition isconsistent with our strategy ofemphasizing domestic banking,since Crocker has very littleforeign exposure. The Crockerbranch system has wide representation throughout California,particularly in the southern partofthe state where it is highlycomplementary to our own.
Crocker National Corporation,which had year-end 1985 assetsOf$19.2 billion, is the parent ofCrocker National Bank. We believethat the combined organization,after certain asset sales andadjustments, will be the tenthlargest bank holding company inthe United States.
Crocker reported 1985 netincome of$38 million. As ofyearend, its nonperforming assetsamounted to $297 million, or2-4 percent ofloans and other realestate. The allowance for loanlosses amounted to 2 percent ofloans. This was the lowest ratio ofnonperforming assets and thehighest ratio ofallowance to loansof any of the large Californiabanking companies.
We believe this acquisitionrepresents a continuation ofWellsFargo's policy of concentrating itsresources on basic domesticbanking activities, such as deposit
Chairman Carl E. Reichardt (right)
and President Paul Hazen
market conditions.The acquisition is expected to
be completed in 1986, subject toappropriate regulatory and shareholder approval. The combinedorganization will carry the nameWells Fargo & Company; and itsprincipal subsidiary will carry thename Wells Fargo Bank.
This combination of two ofthe oldest and proudest bankingorganizations in California shouldcreate an even stronger new bank,one that can offer more convenient
ells Fargo &Company in 1985
earned net income of$190 million, or $8.30
per share. The Company achievedthis performance by pursuing itsstated strategy of focusing on thefinancial services we know best,paring away lines ofbusiness thatdo not fit in with our Californiaand western banking goals, andstrengthening our organization tomake it more competitive andmore able to move quickly to takeadvantage of opportunities.
Early in 1986, we did move tocapitalize on such an opportunity.In the early hours of February 7,a definitive agreement was signedproviding for the purchase ofCrocker National Corporation fromMidland Bank pIc for an amountequivalent to Crocker's net assetvalue at the end of1985 as carriedon Midland's books.
The purchase price, subjectto certain adjustments, will be$1.08 billion. In connection withthe acquisition, Wells Fargo expectsto issue approximately $300 million of common stock, approximately $250-$350 million ofpreferred stock and up to approximately $500 million of debtsecurities. The amount of equityand debt securities to be issuedmay change depending on specificplans developed for integratingCrocker's assets as well as on
2 3

, WELLS FARGO & COMPANY AND SUBSIDIARIES .' WELL~FARGO & COMPANY AND SUBSIDIARIES
1985 WAS A YEAR OF PROGRESS
NET INCOME & DIVIDENDS
PER COMMON SHARE
($)
RETURN ON
COMMON STOCKHOLDERS' EQUITY
(%)
8915%
repurchase plan. It repurchased3 million common shares in 1984and 500,000 shares in 1985, all ofwhich were bought back at belowbook value.
Two other decisions in 1985 had adirect effect on shareholders. Basedon the Company's earnings trendand capital position, the Board ofDirectors increased the quarterlydividend on common stock in thefirst quarter Of198s from 54 cents a
1.92 1.92 1.98
5 5.33
in 1985. The allowance for loanlosses was increased to 1.70 percentof total loans at the end Of198S,from 1.14 percent at the end of1984. The larger allowancestrengthens the Company's balancesheet at a time ofgeneral fmancialuncertainties about both domesticand international credit.
PROFITABILITYAND STRATEGY
Building on the progress of1984,Wells Fargo continued to improveits key profitability measuresin 1985. The return on averagecommon equity increased to14.05 percent, from 12.88 percentin 1984. Return on assets increasedto .67 percent, from .62 percentin 1984.
To a large degree, these ratiosreflect Wells Fargo's strategy ofbuilding profitability by simplifying its operations and sharpeningits focus on basic domestic bankingactivities in California and theWest. During the past three years,the Company has reordered priorities and reorganized activities inorder to control costs and concentrate its resources in the businesslines it knows best. As part of thatprocess, the Company sold Wells
14.05
D51
81 82 83 84 8511
13
12
14
Ratio of net income applicable to common stockto average common stockholders' equity
Uneven economic growth,disinflation and the strong U.S.dollar continued to have harsheffects on portions ofthe domesticportfolio, particularly in theagricultural sector. The internationalloan situation will continueto present problems for theforeseeable future.
The Company'~provision forloan losses significantly exceededthe level of actual loan charge-offs
grew less rapidly than planned in1985 as the Company continuedto emphasize strict credit qualitystandards.
A range of service fees andcharges also contributed to earnings growth and overall profitabilityin 1985. The Company continued torationalize pricing for a variety ofnoninterest services and productsto ensure a satisfactory return.These changes combined withhigher core deposits led to a solidgain in service income on depositaccounts. Service income fromWells Fargo Investment Advisors, anonbank subsidiary; rose sharply asit increased the amount of pensionand endowment funds undermanagement from $14 billon atthe end of1984 to more than$29 billion at the end of198S. WFIAis now the largest manager ofindexfunds in the nation.
Leveraging income growth withmanagement of noninterestexpense continues to be an important element of the Company'sbusiness strategy. Noninterestexpense was held to a 6 percentincrease in 1985.
Higher loan losses partiallyoffset income gains in 1985. Inaddition, there were increases innonaccrual and restructured loansand other real estate obtained insettlement of troubled loans.
share to 60 cents, and in the fourthquarter to 68 cents a share. Thecombined effect of these twoactions was a 26 percent increasein the dividend.
Increased net interest incomewas a major factor behind WellsFargo's earnings performance in1985. Higher volumes ofloans andcore deposits contributed to thisincrease, as did the generally favorable funding conditions Of198S.
During the past three years,the Company has reorganized itsoperations and shifted a greaterportion of assets into its fourtargeted lending areas: consumers,commercial real estate andconstruction firms, small andmiddle-market commercialbusinesses, and West Coast-basedcorporations.
In 1985, the Company activelymarketed its consumer loan products. The Real Estate IndustriesGroup and the Company's two realestate subsidiaries, Wells FargoRealty Finance and Wells FargoRealty Advisors, also increasedtheir loans outstanding to top-tierdevelopers around the country.Another area of solid growth in1985 was the Corporate BankingGroup's increasing role as agentbank for large syndicated loansinvolving West Coast corporations.Loans to middle-market companies
85
2.48
8,30
84
2.16
6.85
6.03
83
Dividends
Net income
82
5,81
81
2
3
o
6
4
8
7
Two aspects of the Company'sperformance of particular interestto shareholders are earnings pershare (EPS) and dividends oncommon stock.
Wells Fargo earned $8.30 percommon share in 1985, an increaseof 21 percent from 1984. EPS grewat a higher rate than the 12 percentincrease in net income chieflybecause of the Company's stock
EPS ANDDIVIDENDS
The year 1985 was one ofprogress for Wells Fargo.
The Company producedrecord earnings, strength
ened its balance sheet andcontinued to build its reputationand market presence.
These achievements reflected asolid performance in the Company'sbasic businesses, as well as agreater concentration of resourcesin these selected core activities.
Wells Fargo's business andinvestment decisions during theyear were directed towardincreasing the profitability ofexisting operations, providing ahigher return for shareholders andpositioning the Company to meetthe challenges of deregulation.
45

~~- .~.
II WELLS FARGO & COMPANY AND SUBSIDIARIES WELLS FARGO & COMPANY AND SUBSIDIARIES
MANAGEMENT'S ANALYSIS OF FINANCIAL OPERATIONS
RETURN ON
AVERAGE TOTAL ASSETS
(%)
CAPITAL RATIOS
AT YEAR END
(%)
OVERVIEW
Change Five-year1985/ compound1984 growth
rate
1980
The average volume of core deposits in 1985 was $17.7 billion, a 6 percent increase over 1984. Core deposits, whichconsist ofnoninterest-bearing deposits, interest-bearingchecking accounts, savings accounts and savings certificates, funded 62 percent and 61 percent of the Company'saverage total assets in 1985 and 1984, respectively.
Noninterest income was $395.7 million in 1985, compared with $270.6 million in 1984. Noninterest income in1985 included a gain on the sale ofa mortgage banking subsidiary of$50.2 million and investment securities gains of$55.5 million. Investment securities gains were $3.0 millionin 1984. Noninterest expense of$943.8 million in 1985 wasup 6 percent compared with 1984.
The Company's provision for loan losses was $371.8 million in 1985, compared with $194.6 million in 1984. During1985, net charge-offs were $211.6 million, or .90 percent ofaverage loans, compared with $133.3 million, or .62 percentof average loans, during 1984. The allowance for loan lossesincreased to 1.70 percent of total loans at the end Of1985,compared with 1.14 percent at the end Of1984.
1981
TABLE 1
SIX-YEAR SUMMARY OF SELECTED FINANCIAL DATA
(in millions)
et income in 1985 was $190.0 million, anincrease 0f12 percent over $169.3 million in1984. Net income per share was $8.30, up21 percent from $6.85 in 1984. The percent-
age increase in net income per share exceeded that of netincome primarily due to a reduction in common shares outstanding. The repurchase of 3 million shares of commonstock during 1984 was fully reflected in net income pershare in 1985. In addition, 500 thousand shares of commonstock were repurchased during 1985, all in the second ha+f.
Improved spreads between lending and deposit rateson increased volumes ofloans and core deposits, as well asmanagement of noninterest expense, contributed to theearnings performance. Net interest income on a taxableequivalent basis (interest differential) increased 13 percentto $1.3 billion in 1985. The interest rate spread was 4.93 percent in 1985, an increase of 27 basis points over 1984.
The average volume ofloans in 1985 was $23-4 billion,up 8 percent from 1984, primarily because of increases of38 percent in both the real estate construction-related andconsumer loan portfolios.
7.44
14.53
-Total capital/assetsPrimary capital/assets
8] 82 83 84 85
]5%
14
]3
12
11
10
9
8
7
6 6.08
5 5.02
4
INCOME STATEMENTNet interest income $ 1,220.2 $ 1,069·5 $ 915.0 $ 821.9 $ 731.0 $ 677.6 14% 12%Provision for loan losses 371.8 194·6 121.1 115-4 63-4 77.0 91 37Noninterest income 395·7 270.6 279·5 293·9 231.3 163.3 46 19Noninterest expense 943.8 886.6 843·7 836.6 743·5 590.8 6 10
because they provide funding at Net income 190.0 169·3 154·9 138.6 124.0 121.9 12 9favorable rates. The average Per common sharevolume of core deposits increased Net income 8.30 6.85 6.03 5.81 5·33 5·33 21 96 percent over 1984. Dividends declared 2-48 2.16 1.98 1.92 1.92 1.92 15 5
Steadily increased earnings, aBALANCE SHEET
stronger balance sheet and progress Loans $ 24,614.2 $ 22,893.9 $ 20, 267.6 $ 19,768·5 $ 17,977·7 $ 16,834.2 8% 8%in organizing the Company for Allowance forloan losses 417.5 260·3 199·6 190·5 153·1 141.8 60 24competition in a deregulated Thtal assets 29,429.4 28,184.1 27,017.6 24,814.0 23, 219. 2 23,638.1 4 4environment have put Wells Fargo Senior debt 2,129.7 1,708.6 1,493·7 1,335. 2 968-4 765.8 25 23in a solid position to meet the Subordinated debt 2,056.5 1,011.7 38.8 38.8 38.8 38.8 103 121
challenges ahead. Stockholders' equity 1,458.0 1,343·7 1,347.8 1,100-4 1,020·9 913.6 9 10
Consistent with Wells Fargo'Sfocus on domestic banking activities, the Company entered into anagreement in February 1986 to purchase Crocker National Corporation.
FINANCIALSTABILITY
Wells Fargo also worked to furtherstrengthen its capital position in1985. The Company's ratio ofprimary capital to total assets wasthe second highest among the15 largest u.s. bank holdingcompanies at the end of the year.Its ratio of total capital to assetswas first among those companies.These ratios are considered keymeasures of financial stability byfederal regulators. The Companyremains committed to maintaininga strong capital position.
Capital increased in 1985 as aresult of the issuance of senior andsubordinated debt, and increases inthe allowance for loan losses andretained earnings. The issuance oflong-term debt, in conjunction withWells Fargo's large base of coredeposits, provides liquidity andfinancial stability for the Company.
Besides adding to liquidity, coredeposits are an important elementin Wells Fargo'S earnings stream
.67
.6
.51
.4
.7%
81 82 83 84 85
Ratio of net income to average total assets
.5
Fargo Mortgage Company in 1985.The Company also restructured
and further consolidated itsinternational operations, focusingits attention on trade-relatedfinance between the West Coastand the growing economies of thePacific Rim. The InternationalBanking Group continued todevelop new specialized servicesfor selected segments of this trade.
6 7
'd --- .-., WELLS FARGO & COMPANY AND SUBSIDIARIES WELLS FARGO & COMPANY AND SUBSIDIARIES
TABLE 2
RATIOS AND STATISTICS EARNINGS PERFORMANCE
(4) Based on daily closing prices listed on the New York Stock ExchangeComposite Transaction Reporting System.
(5) Based On actual number of holders of record at year end.
(6) Full-time eqUivalent. excluding hourly employees and unpaid leaves. 1,220,259
371.836
848,423
395,664
943,755
3°0,332110,298
$ 190.034
$ 3,016,9471,833.913
37.225
Year ended December 3', 1985
(154.584)(60.227)(35,227)
(179,584)
$ (456.460)(456.460)
Eliminations Consolidatedand Wells Fargo
reclassifications & Company
INTEREST DIFFERENTIAL AND SPREAD
WFBC's earnings was a lower net loss incurred by WellsFargo Ag Credit of$i2.1 million in 1985, compared with anet loss of$23,.3 million in 1984. These losses reflected netcharge-offs of$11.8 million in 1985 and $28.1 million in 1984.
Net interest income is the difference between interestincome (which includes certain loan-related fees) and interest expense. Net interest income was $1,220 million in 1985and $1,069 million in 1984. The interest differential is interest income on a "taxable-equivalent" basis reduced by interest expense. Interest differential was $1,269 million in 1985,an increase Of13 percent over $1,124 million in 1984. Theinterest differential expressed as a percentage ofaveragetotal earning assets is referred to as the "spread," which represents the average net effective rate on earning assets. For1985, the spread was 4.93%, 27 basis points higher than 1984.
Individual components ofinterest differential and spreadare presented in the rate/yield table on page 10.
Interest income shown in the rate/yield table exceedsthat in the consolidated statement of income by the amountof the taxable-equivalent adjustment ($48 million for 1985and $43 million for 1984). The taxable-equivalent adjustment is based on the 46% federal tax rate and reflects thestate tax applicable to income from securities and loans thatare exempt from federal taxes. Therefore, such incomeincluded in the rate/yield table is comparable with revenuethat is fully taxable.
Wells Fargo Wells Fargo Nonbank& Company Bank, N.A. subsidiaries
(Parent)
$ 466,067 $ 2.492,271 $ 515,069
481•851 1.426 ,238 382,284
37. 225
(15.784) 1.103. 258 132,7853,864 307.110 60,862
(19.648) 796.148 71.923154,58468,574 334.083 53.234
9,045 873.433 96.504
194,465 256.798 28,653
4.431 94.3 25 11,542
$ 190.034 $ 162.473 $ 17.111
(in thousands)
Interest incomeInterest expenseAmortized gain on interest rate hedging
Net interest incomeProvision for loan losses
Net interest income after provision for loan lossesEquity in earnings ofsubsidiariesNoninterest incomeNoninterest expense
Income before income tax expenseIncome tax expense
Net income
TABLE 3
CONDENSED CONSOLIDATING STATEMENT OF INCOME
ells Fargo & Company (Parent) is a bankholding company registered under the
Bank Holding Company Act Of1956, asamended. Its principal subsidiary is Wells
Fargo Bank, N.A. (Bank). In addition, the Parent, through itsnonbank subsidiaries, provides equipment lease, real estateand agricultural financing; originates and services realestate loans for investors; advises a real estate investmenttrust; provides consumer, accounts receivable and inventoryfinancing; and provides credit insurance to borrowers fromcertain of the Parent's subsidiaries. In the Annual Report,Wells Fargo & Company and its subsidiaries are referred toas the Company.
A condensed consolidating statement of income of theParent and its subsidiaries is shown in Table 3. Net incomeof the Parent increased 12 percent in 1985 to $190.0 million.This increase reflects an after-tax gain of$32.1 million onthe sale ofa mortgage banking subsidiary in 1985, partiallyoffset by a decline of $18.3 million in equity in earnings ofsubsidiaries. Net income of the Bank increased 6 percentin 1985 to $162.5 million, including a $25.0 million gain fromthe sale ofa subsidiary to the Parent. This gain was eliminated in consolidation.
Net income of the nonbank subsidiaries, all ofwhich arewholly owned by the Parent, was $17.1 million, down 14 percent from 1984. This decrease was primarily the result ofa $10.1 million net loss reported by Wells Fargo BusinessCredit (WFBC) in 1985, compared with net income of$5.6million in 1984. The results of operations ofWFBC reflectednet charge-offs of$26.6 million in 1985 and $.3 million in1984; contributing to this increase were higher charge-offsof energy-related loans. Partially offsetting the decline in
.61%12.29
12.88
.62%12.60
Year ended December 3'.
4·95% 4·77% 4.99%
7·44 6.65 5.68
14·53 10·39 7. 20
4·93 4·93 4·957.06 6.36 5.68
12·57 8-44 6.97
14.0 5
29.88% 31.53% 32.84%$61.87 $56.21 $5°.15
645/ 8 491k 4131445 III 313k 26114
633/ 8 471AJ 395/8
22.281 23.100 23.100
21,139 21,235 23.88214,000 15.400 16.200
314 337 380
PROFITABILITY RATIOSNet income to:
Average total assetsAverage stockholders' equity
Net income applicable to commonstock to average commonstockholders' equity
Average balances:Equity to assetsPrimary capital to assetsTotal capital to assets
Other year-end data:Common stockholders (5)Common shares
outstanding (in thousands)Company staff(6)Domestic and foreign
banking offices
CAPITAL RATIOSYear-end balances:
Equity to assetsPrimary capital to assets (1)
1btal capital to assets (2)
STATISTICAL SUMMARYPer common share:
Dividend payout (3)Book valueMarket prices (4):
HighLowYearend
(I) Based on regulatory concepts, primary capital ($2,217 million at December 31,1985) is defined as stockholders' equity ($1,458 million), qualifyingmandatory convertible debt ($369 million, net of Note Fund discussed on page33) and allowance for loan losses ($390 million, exclusive ofallocated transferrisk reserves discussed On page 16). Assets include unamortized goodwill of$15 million.
(2) Based on regulatory concepts. total capital ($4,333 million at December 3',1985) is defined as primary capital, certain senior and subordinated debt of theParent and its nonbank subsidiaries ($2,077 million) and subordinated notes ofthe Bank ($39 million).
(3) Dividends declared per COmmon share as a percentage of net income percommon share.
The ratios of primary capital and total capital to assetsalso increased over 1984. Primary capital was 7-44 percentof total assets at December 31,1985, compared with 6.65 percent at the end of1984. Total capital was 14.53 percent oftotal assets, compared with 10.39 percent at the end of1984.The increase in total capital was primarily due to theissuance of$1. 0 billion of subordinated debt during 1985.
On February 7,1986, the Company entered into a definitive stock purchase agreement (Purchase Agreement)with Midland Bank pIc (Midland) and certain Midland affiliates providing for the acquisition by the Company of all theissued and outstanding common stock of Crocker NationalCorporation (Crocker). On the basis of assets of $19. 2 billionas of December 31, 1985, Crocker was the 25th largest bankholding company in the United States. It is anticipated thatCrocker's wholly-owned subsidiary, Crocker National Bank,will be combined with Wells Fargo Bank, N.A. and operatedunder the Wells Fargo Bank name.
The base purchase price is $1,080 million and is subjectto certain adjustments. Subject to receipt ofappropriate regulatory and shareholder approvals, and the fulfillment ofcertain conditions, the acquisition is expected to close in1986. There is no assurance as to when or whether suchapprovals will be obtained and, if obtained, as to what, ifany,conditions or restrictions might be imposed. The PurchaseAgreement may be terminated by either party if the transaction has not closed on or before December 31, 1987 and incertain other circumstances.
The purchase price is payable in cash and, at the Company's election, common stock of the Company, providedthat the number of shares issued to Midland may notexceed the greater of (1) 4.9% of the total number of sharesof common stock outstanding at closing of the proposedacquisition (giving effect to the issuance of common stockto Midland) or (2) that number ofshares of common stockwhich has an aggregate value of$75 million.
Th meet the requirements for additional primary capitalin connection with the proposed acquisition, the Companyexpects to issue approximately $300 million ofcommonstock, including the stock that may be issued to Midland,approximately $250-$350 million of preferred stock and upto approximately $500 million ofdebt securities. Theamount of equity and debt securities to be issued maychange depending on specific plans developed for integrating Crocker's assets as well as on market conditions.
The acquisition will be accounted for as a purchase transaction. Accordingly, the results of operations of Crocker willbe included with that of the Company for periods subsequent to the date of acquisition.
An unaudited pro forma condensed combined incomestatement for 1985 for the Company and Crocker is presented in note 16 to the financial statements on page 42.
The Company's key performance ratios and otherselected data are shown in the following table.
8 9

TABLE 4
(in millions)
AVERAGE BALANCES. YIELDS (TAXABLE-EQUIVALENT BASIS) AND RATES PAID
EARNING ASSETSInterest-earning depositsInvestment securities:
U.S. Treasury securitiesSecurities of other U.S. government
agencies and corporationsObligations ofstates and political subdivisionsOther securities
Total investment securitiesTrading account securitiesFederal funds soldLoans:
Commercial, financial, and agriculturalReal estate construction-relatedReal estate mortgage (1)Consumer (1)Lease financingForeignFees and sundry interest
Total loans (2)
'Ibtal earning assets
FUNDING SOURCESInterest-bearing liabilities:
Deposits:Savings depositsNOW accountsMarket rate checkingMarket rate savingsSavings certificatesCertificates ofdeposit
Other time depositsDeposits in foreign offices
'Ibtal interest-bearing depositsFunds borrowedCommercial paperSenior and subordinated debt:
Senior debtSubordinated debt
Total senior and subordinated debt
'Ibtal interest-bearing liabilities
Portion ofnoninterest-bearing funding sources
'Ibtal funding sources
Amortized gain on interest rate hedging
Spread and interest differential
NONINTEREST-EARNING ASSETS
Cash and due from banksOther (3)
Total noninterest-earning assets
NONINTEREST-BEAIUNG FUNDING SOURCESDepositsOther liabilitiesStockholders' equityNoninterest-bearing funding sources used
to fund earning assets
'Ibtal net noninterest-bearing funding sources
TOTAL ASSETS
Averagebalance
$ 5°9
882
20162
~
1,353266210
7,840
3,746
4,7603,690
9152,427
$ 1,381
1,429
326
5,32 75,920
278265
~
16,061
1,321
1,951
1,797
~
3,359
22,692
3,024
$ 25,716
$ 1,639
~
$ 2,853
$ 3,366
1,1031,408
(3,024)
$ 2,853
$ 28,569
Yields!rates
9·71
7.70
8·7815.12
10.72
8.56
8·30
10.71
11.3811.10
14·7414.2 0
11.28
12.12
5·505.12
5·756.63
9.2 413·949·989.88
7·757. 628.23
10.64
8·73
9·75
8.08
Interestincome!expense
1.6
14.2
43.6
145.022.8
17·4
839·4426.2
528.3544·0130 .0
273·791 .8
2,833·4
3,065.3
75·973.1
18·7
353·0547.2
38.826.4
112.2
1,245·3100·7160·5
191.1
136·3
327.4
1,833·9
$ 1,268.6
Averagebalance
$ 92 6
65218202
1,126
137
374
7,5°42,721
4,9802,671
872
2,834
$ 1,5°71,376
287
4,742
5,343
414697
~16,186
1,0702,139
21,221
2,924
$ 24,145
$ 1,712
~
$ 3,088
$ 3,4221,247
1,343
(2,924)
$ 3,088
$ 27,233
Yields!rates
10.85
8·578.83
17.60
11·5410.88
10·75
12.50
13.6011.17
15.16
13.88
13·09
13. 22
13·02
5.51
5·106.89
8.51
10·7314.0611.00
llA6
9·2310.01
10.56
12.0810.28
11,7°
9·61
Interestincome!expense
$ 106.3
69·5
5.6
19·3
~130 .0
14·940 . 2
937·9370 .0
556.3
404·9121.1
371,0
~
2,853·3
3,144·7
83.1
70 .2
19.8
403·4
573·358.2
76.6
~
1,493·3107. 2
225. 8
174·1
~
~
2,°39·9
2,039·9
~
$ 1,124. 2
Averagebalance
$ 1,342
233
133282
__6_7
715111
233
6,80 32,194
4,962
2,190
9142,839
19,9°2
$ 22,3°3
$ 1,7681,270
225
4,5774,295
640
679
~15,420
1,1711,720
1,141
__3_9
~
19,491
~
$ 22,303
$ 1,713
~
$ 3,135
$ 3,4201,2671,260
(2,812)
$ 3,135
$ 25,438
Yields!rates
10.19
8.81
8.96
16·35
10.03
9·399·53
11·5812.6811.14
14.63
14. 2 7
11·90
12.58
12·34
5.2 95.18
6·98
8·3510A6
13·949·9611.16
12·78
4·54
9·19
8.03
Interestincome!expense
$ 144·1
23·7
11.7
25·311,0
71,7
10·422.2
787.7278.2
552 .932 0.3
13°·5337.896A
2,50 3.8
2,752.2
93.6
65·715·7
382.3
449·389.367.6
219.3
1,382.8
102·9
157·3
145.81,8
147.6
1,790 .6
1,790.6
3·2
Averagebalance
$ 1,756
2°4
215476
~
93085
187
5,8222,166
5,6341,761
9022,302
3305,7871,012
1,125
~
14,0941,3152,421
1,°51
__3_9
~
18,920
2,625
$ 21,545
$ 1,712
~
$ 3,273
$ 3,3801,4591,059
(2,625)
$ 3,273
$ 24,818
Yields!rates
13.80%
10.04
8.96
9.157.56
9. 2 414A111.89
14.90
15·3011.16
15.01
14·8215.63
5·335.17
9A312.86
14.1512.82
14.13
11.0712.8412A8
12.48
4·54
12.20
11,44
10.05
Interestincome!expense
19. 2
43·6
---'!:.:1.85.9
12·322.2
867.2
331A628·5264.4
133·7
359·785.1
2,670 .0
3,°32.8
129.565.8
31 . 2
744·1
143·3144.1
~
1,56o A168.8302.1
131,21,8
2,164.3
~$ 875.2
Averagebalance
$ 1,403
440
276
694
~
1,46962
226
4,9501,8905,6692,026
77°2,°74
$ 2,898
566
5,1051,382
1,°93
~13,696
1,3131,952
787
__3_9
826
17,7872,752
$ 20,539
$ 1,853
~
$ 3,667
$ 3,6441,8n
964
~)
$ 3,667
$ 24,206
Yields!rates
10AO
9·019.19
10.98
9·5916.0216.61
17.98
18.98
10.92
14.52
13·1418.08
15·57
15.22
5·315.00
13·9515.0 315. 2 316.16
12·3917Ao16·54
11.08
4·54
10.78
13·14
11.38
Interestincome!expense
$ 232.2
45·7
24·963.8
~
140·9
9·937.6
889.8
358.7618·9
294·1101.2
375.0
~2,706.2
3,126.8
154.0
28·3
712.0207.8
166A
~
1,697.1
228-4
323·1
2,337.6
___·_4
$ 789·6
(1) Effective January 1, Ig83, second mortgages and other junior lien loans to individuals that are secured by 1-4 family residential properties have been classified asconsumer loans. In prior periods, portions of these balances were included in both the real estate mortgage loan and consumer loan categories. The Ig83 averageCOnSumer loan balance included approximately $501 million that waS previously classified as real estate mortgage loans. Periods prior to Ig83 have not been reclassifiedfor this change as complete information is not available.
10
(2) Nonaccrual and restructured loans and related income are included in their respective loan categories.
(3) Includes the average allowance for loan losses of$336 million, $222 million, $197 million, $162 million and $152 million in 1985, 1984, 1983, 1982 and 1981, respectively.
11
SPREAD
(%) NONINTERESTINCOME
16%
*• 4.664.33 •
•
NONINTEREST EXPENSE
account profits and commissions was due to gains from anarbitrage program.
Most of the decrease in "all other" income in 1985 compared with 1984 resulted from the recognition in 1985 of$11.6 million in net closing costs associated with restructuring the Company's international activities. In addition,the decrease re'flected a $5.8 million decline in income frominvestments accounted for using the equity method, partially offset by a $5.5 million increase in gains on sales ofvarious branches and premises.
In connection with the restructuring of internationalactivities, the Company closed in 1985 its London branch,the New York office of its Edge Act subsidiary (Wells FargoBank International) and representative offices in Madrid,Manila, Taipei, Bangkok, Jakarta and Kuala Lumpur. Also,the Company sold its branch in Milan. Four Asian officeshave been retained: the Hong Kong, 1bkyo and Seoulbranches and the Singapore representative office. The SanFrancisco headquarters and the Asian branches will continue to engage in foreign exchange activities. In addition,the Company has retained its four Latin American representative offices and its merchant banking subsidiary in theCayman Islands. The restructuring focuses the Company'sinternational resources on providing domestic and international trade services to customers in the West.
14% 11%
17 30463
8 (9)
(14) (31)
251
(69) (46)
46 (3)
Percentage changeIg8S/ 1984/Ig84 1983
Year ended December 3',Ig8S 1984 1983
TABLE 6
NONINTEREST INCOME
(in millions)
Service charges ondeposit accounts $109·0 $ 95. 2 $ 85·5
Domestic fees andcommissions 88.2 75·4 58.0
Investment securities gains 55·5 3·0 ·5Trust and investment
services income 55.1 51.2 56.4International fees,
commissions andforeign exchange 17·7 20·7 30.1
Trading account profits(losses) and commissions 13·3 3.8 (.7)
Sale ofa mortgagebanking subsidiary 50 .2
Sale of major real estateholding 10.0
All other ~~~Total $ 395·7 $ 270.6 $ 279·5
The table below shows the major components ofnoninterest income.
84 8582 83
•4.06
•
81
*3.85
•
4
6
8
10
14
12
TABLE 5
LOAN FEES AND SUNDRY INTEREST
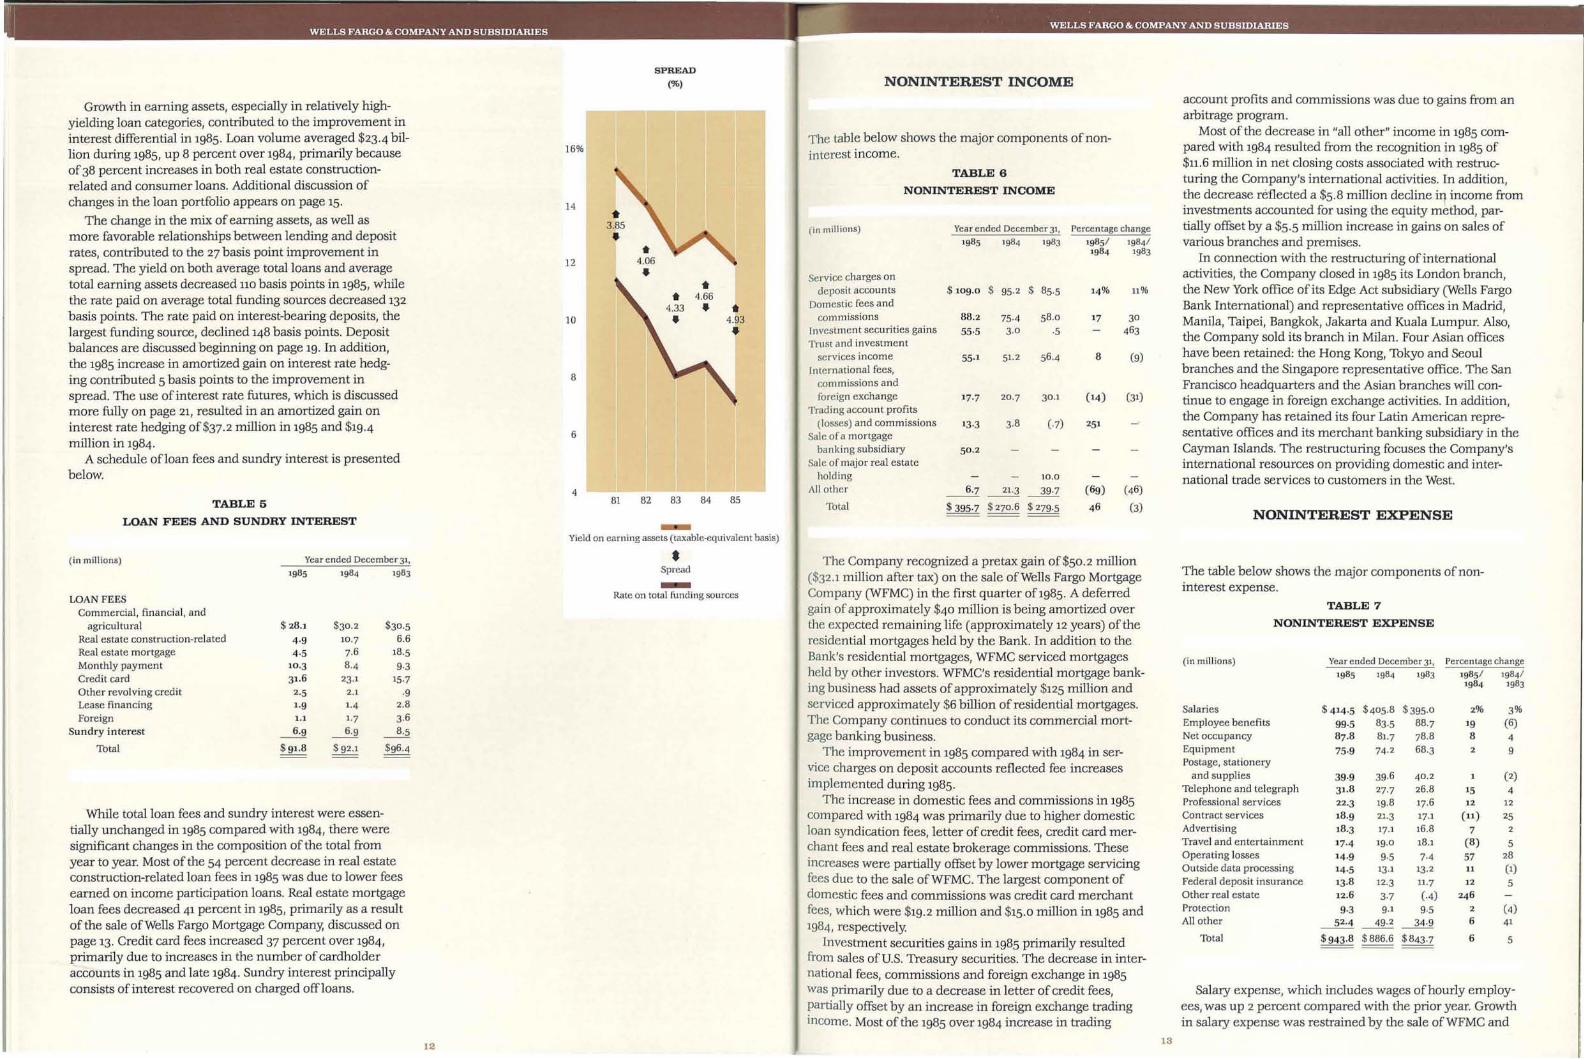
Growth in earning assets, especially in relatively highyielding loan categories, contributed to the improvement ininterest differential in 1985. Loan volume averaged $23-4 billion during 1985, up 8 percent over 1984, primarily becauseof38 percent increases in both real estate constructionrelated and consumer loans. Additional discussion ofchanges in the loan portfolio appears on page 15.
The change in the mix of earning assets, as well asmore favorable relationships between lending and depositrates, contributed to the 27 basis point improvement inspread. The yield on both average total loans and averagetotal earning assets decreased 110 basis points in 1985, whilethe rate paid on average total funding sources decreased 132basis points. The rate paid on interest-bearing deposits, thelargest funding source, declined 148 basis points. Depositbalances are discussed beginning on page 19. In addition,the 1985 increase in amortized gain on interest rate hedging contributed 5 basis points to the improvement inspread. The use of interest rate futures, which is discussedmore fully on page 21, resulted in an amortized gain oninterest rate hedging of$37.2 million in 1985 and $19-4million in 1984.
A schedule ofloan fees and sundry interest is presentedbelow.
Yield on earning assets (taxable-equivalent basis)
LOAN FEESCommercial, financial, and
agricultural $ 28.1 $30.2 $30.5Real estate construction-related 4·9 10·7 6.6Real estate mortgage 4·5 7. 6 18·5Monthly payment 10·3 8-4 9·3Credit card 31.6 23·1 15·7Other revolving credit 2·5 2.1 ·9Lease financing 1·9 1-4 2.8
Foreign 1.1 1·7 3.6Sundry interest ~ ~ ~
Thtal $91.8 $ 92.1 $96-4
While total loan fees and sundry interest were essentially unchanged in 1985 compared with 1984, there weresignificant changes in the composition ofthe total fromyear to year. Most of the 54 percent decrease in real estateconstruction-related loan fees in 1985 was due to lower feesearned on income participation loans. Real estate mortgageloan fees decreased 41 percent in 1985, primarily as a resultof the sale ofWells Fargo Mortgage Company, discussed onpage 13. Credit card fees increased 37 percent over 1984,primarily due to increases in the number of cardholderaccounts in 1985 and late 1984. Sundry interest principallyconsists of interest recovered on charged offloans.
(in millions) Year ended December 3',Ig8S 1984 1983 •Spread-Rate on total funding sources
The Company recognized a pretax gain of$50.2 million($32.1 million after tax) on the sale ofWells Fargo MortgageCompany (WFMC) in the first quarter Of1985. A deferredgain ofapproximately $40 million is being amortized overthe expected remaining life (approximately 12 years) of theresidential mortgages held by the Bank. In addition to theBank's residential mortgages, WFMC serviced mortgagesheld by other investors. WFMC's residential mortgage banking business had assets of approximately $125 million andserviced approximately $6 billion ofresidential mortgages.The Company continues to conduct its commercial mortgage banking business.
The improvement in 1985 compared with 1984 in service charges on deposit accounts reflected fee increasesimplemented during 1985.
The increase in domestic fees and commissions in 1985compared with 1984 was primarily due to higher domesticloan syndication fees, letter of credit fees, credit card merchant fees and real estate brokerage commissions. Theseincreases were partially offset by lower mortgage servicingfees due to the sale ofWFMC. The largest component ofdomestic fees and commissions was credit card merchantfees, which were $19.2 million and $15.0 million in 1985 and1984, respectively.
Investment securities gains in 1985 primarily resultedfrom sales of U.S. Treasury securities. The decrease in international fees, commissions and foreign exchange in 1985was primarily due to a decrease in letter of credit fees,partially offset by an increase in foreign exchange tradingincome. Most of the 1985 over 1984 increase in trading
The table below shows the major components ofnon-interest expense.
TABLE 7
NONINTEREST EXPENSE
(in millions) Year ended December 3', Percentage change1985 1984 1983 Ig8s/ 1984/
Ig84 1983
Salaries $ 414.5 $405·8 $395. 0 2% 3%Employee benefits 99·5 83·5 88.7 19 (6)Net occupancy 87·8 81.7 78.8 8 4Equipment 75·9 74·2 68·3 2 9Postage, stationery
and supplies 39·9 39.6 40 .2 (2)Telephone and telegraph 31.8 27·7 26.8 15 4Professional services 22·3 19.8 17.6 12 12Contract services 18·9 21.3 17·1 (11) 25Advertising 18·3 17·1 16.8 7 2Travel and entertainment 17·4 19·0 18.1 (8) 5Operating losses 14·9 9·5 7-4 57 28Outside data processing 14·5 13·1 13.2 11 (1)Federal deposit insurance 13.8 12·3 11.7 12 5Other real estate 12.6 3·7 (.4) 246Protection 9·3 9.1 9·5 2 (4)All other ~~~ 6 41
Total $943.8 $886.6 $843·7 6 5
Salary expense, which includes wages ofhourly employees, was up 2 percent compared with the prior year. Growthin salary expense was restrained by the sale ofWFMC and
12 13

[fll' - - --'i WELLS FARGO & COMPANY AND SUBSIDIARIES WELLS FARGO & COMPANY AND SUBSIDIARIES
BALANCE SHEET ANALYSIS
A ondensed consolidating balance sheet of theParent and its subsidiaries is shown in Table 8.Total assets of the Parent were up 36 percent at
December 31,1985 compared with year-end1984, reflecting increases in investment securities and intercompany loans and advances, which were primarily funded
closing of offices. Domestic and foreign banking officesdeclined to 314 at year-end 1985, from 337 at year-end 1984.
Employee benefits expense increased in 1985 comparedwith 1984, primarily due to an increase in retirement planexpense. Effective January 1, 1985, the Company changedits retirement plan from a defined benefit plan to a definedcontribution plan. The former plan was overfunded at mid1984; therefore, no retirement plan expense accrual or contribution was necessary for the last half of1984. Additionaldiscussion ofthe Company's retirement plans is presentedin note 9 to the financial statements beginning on page 35.
Most of the increase in operating losses in 1985 comparedwith 1984 resulted from credit card operating losses.
The 1985 over 1984 increase in net costs related to otherreal estate primarily resulted from the operation andreappraisal of real estate obtained in settlement of troubledagricultural- and energy-related loans.
LOAN PORTFOLIO
NONACCRUALLOANS, RESTRUCTUREDLOANS AND OTHER REAL ESTATE
A comparative schedule ofyear-end loans is presented innote 4 to the financial statements on page 30. A comparative schedule of average loan balances.is presented in therate/yield tabl~ on page 10. The average balances ofboththe real estate construction-related and consumer loan categories increased 38 percent in 1985 compared with 1984.Average foreign loans decreased 14 percent.
The increase in real estate construction-related loans,which generally have maturities of five years or less, wasbroadly based and resulted primarily from loans made tofinance commercial properties. Growth in credit card activity and real estate junior lien mortgage loans accounted formost of the increase in consumer loans. Credit card loansaveraged $1.1 billion during 1985, an increase of67 percentover 1984; real estate junior lien mortgage loans averaged$1.4 billion, an increase of 27 percent. Credit card loangrowth was due to origination of new cardholder accountsand line increases to existing accounts. There were 1.2 million cardholder accounts at year-end 1985, an increase of14percent over year-end 1984. The decrease in foreign loansreflected a general reduction and realignment of the Company's international activities. Average commercial, financial, and agricultural (commercial) loans were 4 percenthigher in 1985 compared with 1984, reflecting an increase incorporate commercial lending, partially offset by a reduction in loans to financial institutions.
Included in the commercial portfolio were agIiculturalloans ofapproximately $700 million at December 31, 1985and 1984. Agricultural loans include loans to finance agricultural production, fisheries and forestries and other loans tofarmers. Agricultural loans that are secured by real estateare included in real estate mortgage loans; such loans were$125 million and $102 million at December 31, 1985 and 1984,respectively.
Table 9 presents comparative data for nonaccmalloans,restructured loans and other real estate (ORE). In 1985, themost significant increase in nonaccruals occurred in agricultural loans included in the commercial portfolio. Foreignnonaccruals decreased at December 31, 1985 compared with1984, reflecting the return to accrual status ofloans to certain borrowers in Argentina and charge-offs of Mexican private sector loans, partially offset by increases in nonaccrualloans to borrowers in Brazil and Peru.
The increase in ORE at December 31,1985 comparedwith 1984 was primarily due to properties acquired in settlement ofagricultural-related loans.
15
Lease financingForeign
Consumer
LOAN MIX
AT YEAREND
(%)
-Real estate mortgage
Conunercial-Real estate construction-related
29 34 34 35 34
1981 1982 1983 1984 1985
INVESTMENT SECURITIES
Investment securities were $1.7 billion at December 31,1985, a 56 percent increase over 1984. The increase was primarily the result of a net increase of $497 million in u.s.Treasury securities. Note 3 to the financial statements onpage 30 shows the composition of the investment portfolioby type of issuer.
by the issuance of senior and subordinated debt. The Bank'stotal assets declined 2 percent. Combined total assets of thenonbank subsidiaries increased 15 percent, primarily due togrowth in consumer and commercial loans ofWells FargoCredit Corporation and in real estate construction-relatedloans ofWells Fargo Realty Advisors.
INCOME TAXES
The Company's effective income tax rate in 1985 was 37%compared with 35% in 1984. Most ofthe 1985 increaseresulted from a greater amount ofearnings subject to u.s.taxation, partially offset by an increase in income taxed atthe capital gains rate.
In management's opinion, the effective income tax rateis not indicative of the Company's true economic tax burden,because the rate computation does not include all the relevant financial characteristics of tax-sensitive transactions.
For a more complete discussion of income taxation, referto note 10 to the financial statements beginning on page 36.
December 31, 1985
Wells Fargo Wells Fargo Nonbank Eliminations Consolidated& Company Bank,N.A. subsidiaries and Wells Fargo
(Parent) reclassi fications & Company
$ 1,455 $ 1,393,138 $ 63,912 $ (56,343) $ 1,402,162
200,000 534,511 216 (200,216) 534,511
1,242,793 435,697 17,580 1,696,070
146,658 146,658
39,650 39,650
70,043 19,792,124 4,334,486 24,196,6531,622,848 (1,622,848)
4,565,406 14,000 252,500 (4,831,906)206,196 1,165,182 165,269 (122,957) 1,413,690
$ 7,908,741 $ 23,520,960 $ 4,833,963 $ (6,834,270) $ 29,429,394
$ $ 19,757,859 $ $ (256,559) $ 19,501,300
6,038,100 1, 214,°39 279,293 7,531,432
264,000 600,775 3,967,131 (4,831,906)148,681 579,932 333,°46 (122,957) 938,702
6,450,781 22,152,605 4,579,47° (5,211,422) 27,971,434
1,464,880 1,375,275 254,493 (1, 629,768) 1,464,880
(6,920) (6,920) 6,920 (6,920)
1,457,960 1,368,355 254,493 (1,622,848) 1,457,960
$ 7,908,741 $ 23,520,960 $ 4,833,963 $ (6,834,270) $ 29,429,394
14
CONDENSED CONSOLIDATING BALANCE SHEET
(in thousands)
Total assets
LIABILITIES ANDSTOCKHOLDERS' EQUITYDepositsBorrowingsIntercompany borrowingsOther liabilities
Total Iiabili ties
Paid-in capital and retained earningsEquity adjustment from foreign
currency translation
Total stockholders' equity
Total liabilities andstockholders' equity
ASSETSCash and due from banksInterest-earning deposi tsInvestment securitiesTrading account securitiesFederal funds soldNet loansInvestment in subsidiariesIntercompany loans and advancesOther assets
TABLE 8

~"" - .-.. '
I ! WELLS FARGO & COMPANY AND SUBSIDIARIES WELLS FARGO & COMPANY AND SUBSIDIARIES
Note 1to the fmancial statements on page 28 describesthe Company's policies relating to nonaccrualloans andother real estate. In cases where a borrower experiencesfinancial difficulties and the Company makes certain modifications to contractual terms, the loan is classified as a restructured loan. If the borrower's ability to meet the revisedpayment schedule is uncertain, the loan is classified as anonaccrualloan. Management's classification of a loan asnonaccrual or restructured does not necessarily indicatethat the principal of the loan is uncollectible in wholeorin part.
Loans contractually past due 90 days or more as to interest or principal, but not included in the nonaccrual or restructured categories, were $147.6 million at December 31,1985, compared with $93.7 million at December 31,1984·The 1985 increase was primarily due to increases in pastdue credit card and agricultural loans. A1lloans in this category are both well secured and in the process ofcollectionor are 1-4 family residential real estate loans or consumerloans that are exempt under regulatory rules from beingclassified as nonaccrual.
TABLE 9
NONACCRUAL LOANS, RESTRUCTURED LOANS
AND OTHER REAL ESTATE
(in millions) December 31,
1985 1984 1983 1982 1981
Commercial, financial,
and agricultural (1) $463.0 $382-4 $379.1 $249.8 $13°·3
Real estate
construction-related 51.0 26.2 57·9 146.6 155·7
Real estate mortgage (2) 49·5 43·7 15.6 17·5 6.1
Consumer 3.6 .6 8.3 1.6 5. 6
Lease financing 9·5 14-4 11.1 17.0 1.7
Foreign (3) 194.8 249·9 236.4 107·9 --±1:1Total $ 771.4 $717. 2 $708-4 $540 -4 $344.1
Restructured loans $ 18·4 $ 17-4 $ 40.2 $ 20·7 $ 93·9
Nonaccrual and
restructured loansas a percentage of
total loans 3.2% 3. 2% 3·7% 2.8% 2-4%
Other real estate
(ORE) (4) $ 169.3 $ 87. 6 $ 77·7 $ 58 .4 $ 27-1
Nonaccrual and
restructured loans and
ORE as a percentage
oftotal loans and ORE 3·9% 3. 6 % 4.1% 3·1% 2.6%
(1) Includes agricultural loans Of$180 million and $64 million at December 31,1985 and 1984, respectively.
(2) Includes agricultural loans secured by real estate of $24 million and $22 millionat December 31,1985 and 1984, respectively.
(3) Includes loans (all private sector) Of$16 million, $39 million and $61 millionin Mexicoand $13 million, $19 million and $68 million in Venezuela at December31,1985.1984 and 1983. respectively. Also includes $15 million ofloans (all privatesector) in Brazil at December 31,1985.
(4) Includes agricultural-related properties of$94 million and $46 million atDecember 31,1985 and 1984, respectively.
16
ALLOWANCE FOR LOAN LOSSES
An analysis of the changes in the allowance for loan losses,including net charge-offs by loan category, is presented innote 4 to the financial statements on page 31. At December31, 1985, the allowance for loan losses as a percentage oftotal loans was 1.70 percent, compared with 1.14 percent atDecember 31,1984.
The Company considers the allowance for loan losses of$417.5 million adequate to cover losses inherent in the loansoutstanding at December 31, 1985. It must be emphasized,however, that the determination of the adequacy of theallowance rests upon various judgments and assumptionsabout future economic conditions and other factors affecting loans. No assurance can be given that the Company willnot in any particular period sustain loan losses that are sizable in relation to the amount reserved, or that subsequentevaluations of the loan portfolio, in light of conditions andfactors then prevailing, will not require significant changesin the allowance for loan losses.
Federal banking agencies require banking institutions toestablish allocated transfer risk reserves against international assets which, in the agencies' judgment, have" ...been impaired by a protracted inability of public or privateborrowers in a foreign country to make payments ontheir external indebtedness." Included in the allowance atDecember 31, 1985 and 1984 are allocated transfer riskreserves of$27.6· million and $6.0 million, respectively.
The provision for loan losses in 1985 was $371.8 million,compared with $194.6 million in 1984. The amount of theprovision is dependent upon the amount that managementbelieves is required to maintain the allowance at an appropriate level after net charge-offs. During 1985, net chargeoffs were $211.6 million, compared with $133.3 million in1984. As a percentage of average loans outstanding, netcharge-offs were .90 percent in 1985 and .62 percent in 1984.The increase in net charge-offs in the commercial loan portfolio reflected higher charge-offs of energy-related loans,partially offset by a decline in charge-offs of agriculturalloans. The increase in net charge-offs for credit card andrelated plans reflected significant growth in credit cardloans as well as a higher ratio of charge-offs to average creditcard loans.
Net charge-offs of agricultural-related loans (included inboth the commercial and real estate mortgage loan portfolios) were $36.7 million in 1985 and $45.9 million in 1984·
Management has established Company-wide charge-offpolicies. Loans are charged offwhen classified as a loss byeither internal loan examiners or regulatory examiners.Additionally, any loan that is past due as to principal orinterest and that is not both well secured and in the processof collection is charged off after a predetermined period oftime that is based on loan category.
CROSS-BORDER OUTSTANDINGS
The following table shows the Company's cross-borderoutstandings to borrowers in individual countries thataccounted for. 75 percent or more of total assets at December 31, 1985, 1984 or 1983. Outstandings are defmed as loans,interest-earning time deposits with other banks, otherinterest-earning investments, accrued interest receivable,acceptances and other monetary assets that are denominated in dollars or other nonlocal currency. Country distributions are based on the location ofthe obligor or investment, except (1) for cross-border outstandings guaranteedby a third party, in which case the country is that of theguarantor, and (2) when tangible liquid collateral is held outside the foreign counh-y; in which case the country is thatin which the collateral is located. Loans made or depositsplaced with the branch ofa bank outside the bank's homecountry are considered outstandings of the home country.
TABLE 10
CROSS-BORDER OUTSTANDINGS AT YEAR END
(in millions) Governments Banks and Commercial Totaland official other andinstitutions(l) financial industrial
institutions
Mexico(2)
1985 $352 $ 45 $209 $606
1984 343 52 268 663
1983 312 56 287 655
Brazil
1985 356 235 12 6031984 269 335 13 6171983 2°9 347 12 568
Venezuela
1985 117 43 99 259
1984 121 44 111 276
1983 125 44 110 279
Japan
1985 292 65 3571984 360 60 420
1983 242 65 3°7
Italy
1985 37 4 1 3 81
1984 106 135 24 2651983 105 103 34 24 2
United Kingdom
1985 5 11 22 38
1984 6 17 20 431983 12 394 47 453
(1) Includes commercial enterprises that are majority-owned by centralgovernments.
(2) The Company also had approximately $39 million, $28 million and $32 million in 1985, 1984 and 1983, respectively, ofstandby letters of credit in support ofMexican entities, all of which were in the private sector. Standby letters ofcreditin support of entities in other Latin American countries were not significant.
17
The remainder of the Company's foreign outstandingswas spread among 45,55 and 68 countries at December 31,1985, 1984 and 1983, respectively. At December 31, 1985, theCompany did not have outstandings equaling or exceeding.25 percent oftotal assets in any ofthese countries, exceptfor Argentina ($133 million), Chile ($104 million), Korea($98 million) and Peru ($75 million).
A Country Review Committee, which includes seniorofficers ofthe International and Economics departments ofthe Bank, analyzes each country where the Company has ormay have exposure in order to assess the cross-borderrisk. Based on the Committee's assessments, InternationalBanking Group management recommends specific counhy limits.
As has been widely reported, various foreign countrieshave experienced serious economic and/or political difficulties in meeting scheduled payments of interest and principal on their debt. In the event of further deterioration inthese countries, additional loans may be placed on nonaccrual status, reserved for or charged off under Companypolicies and bank regulatory requirements. In late 1985 andearly 1986, there was a significant decline in the worldwidep1ice of oil. It is possible that declining oil revenue ofoil-exporting countries, such as Mexico and Venezuela,may result in new borrowing requirements from commercial banks and concessionary interest rates on existingand new debt.
MEXICO Cross-border outstandings to the Mexican government and official institutions (public sector) increasedby $9 million during 1985. This increase was the result ofthe following activity: a public entity's assumption of$10 million of existing private sector Mexican loans, theCompany's disbursement of the final $9 million of its$36 million participation in the 1984 $3.8 billion term loanfacility to the Mexican government, principal paymentsreceived of$4 million and a $6 million decrease in accruedinterest receivable. Accrued interest receivable decreasedfrom $9 million at December 31, 1984 to $3 million atDecember 31,1985. During 1985, the Company received$39 million of interest payments and accrued $33 million ofinterest income. There was no other significant revenuefrom Mexican public sector borrowers reported as incomeduring the year. At December 31, 1985, there were no loansto public sector borrowers on nonaccrual status.
In September 1984, a proposal to reschedule certain Mexican public sector debt falling due between 1985 and 1991was announced. The proposal included extension ofsomematurities, changes in loan pricing and prepayments ofother existing debt.
Under the terms of the proposal, certain Mexican publicsector debt existing before 1983 and originally due between1982 and 1991 would be rescheduled through 1998 and, effective January I, 1985, interest rates applicable to the Company's portion of this debt would be as follows: '01 % over theLondon Interbank Offered Rate (LIBOR) for dollar depositsfor the period 1985-1986, tl/8% over LIBOR for the period1987-1991 and 1'.4 % over LIBOR for the period 1992-1998. In

rn" - ~ - -~- .II[ ..•
WELLS FARGO & COMPANY AND SUBSIDIARIES ;.: WELLS FARGO & COMPANY AND SUBSIDIARIES
DEPOSITS
Comparative year-end detail of total deposits is presented inthe following table.
85
18.4
$ 3,921.81,756.36,411 .9
5,913.5
18,003·5287.6386.3
1,52 3.8
$ 20,201.2
December 31,
84
18.0
83
16.8
$ 3,702.11,718.1
6,876.56,060.8
18,357·5232.3223-9687.6
$ 19,501.3
82
Savings accounts-Savings certificates
Noninterest-beating deposits-Interest-beating checking accounts
81
5
o
IS
10
$20
CORE DEPOSITS
AT YEAR END
($ BILLIONS)
(in millions)
TABLE 11
DEPOSITS
Noninterest-bea1ing depositsInterest-bearing checking accountsSavings accountsSavings certificates
Core depositsCertificates ofdepositOther time depositsInterest-bearing deposits - foreign
Total deposits
Progress toward a public sector refinancing continuesto depend on successful implementation by the Venezuelan government ofmechanisms that permit privatesector debtors to repay foreign obligations. Successfulcompletion of this process should reduce creditors' privatesector loan problems. At December 31, 1985, total Venezuelan loans on nonaccrual status were $13 million, all toprivate sector borrowers.
ARGENTINA At December 31, 1985, the Company hadtotal cross-border outstandings in Argentina of $133 million(045 percent of total assets), including $32 million of nonaccrual loans, substantially all ofwhich were to privatesector borrowers.
In January 1985, the Company converted its BuenosAires branch into a representative office and transferredcertain branch assets and liabilities to a local Argentinebank in which the Company acquired a minority interest.
In June 1985, the Government ofArgentina announceda major, new program designed to counter inflahon andprovide the basis for an improved economy. The programincludes a substantial reduction in the public sector defiCit,a major reform of the monetary system and a plan to control the escalahon of prices and the resulhng escalation inwages. In addition, Argentina reached agreement with themanagement ofthe International Monetary Fund (IMF) onthe performance requirements for the country's financialprogram. This agreement has enabled Argentina to resumedrawings under an IMF 1.4 billion Special Drawings Rightsstandby facility.
In August 1985, Argentina and its creditor banks signedagreements for the new money and debt reschedulingcomponents of the 1984/85 Financing Plan. This signingwas made possible, in part, by Argentina's above-mentionedagreement with the IMF. The Financing Plan calls for eachcreditor bank to participate in a $4.2 billion long term andtrade fmance new money facility The Company's shareunder this facility is $20 million. During September andNovember 1985, $3 billion was disbursed under the newmoney component, of which the Company's net share was$14 million. Of its share, the Company has not yet disbursed$6 million. Under the terms of the debt rescheduling component of the Plan, the public sector loans due forrepayment during the period 1982 through 1985 are to beextended to mature during 1992 through 1997; the Companyhas $18 million outstanding in this category. The Plan alsocontains a provision for extending 1982 through 1985 privatesector maturities to 1992 through 1995. Approximately$25 million of the Company's private sector loans would beincluded in this rescheduling under the guarantee of theRepublic ofArgentina. The Company believes that theeffect of this rescheduling on it will not be material.
extension of these payments was granted. Also in the October communication, the Mexican government estimatedthat its net new 1986 borrowing requirements from commercial banks would be approximately $2.5 billion. Thegovernment and the Mexican Bank Advisory Group havedecided to defer further debt discussions pending a clarification of the country's financing requirements and the variousfinancing resources available to meet those requirements.
At December 31, 1985, the Company had $16 million ofprivate sector loans in Mexico on nonaccrual status, andapproximately $200 million ofloans to private sector Mexican borrowers had been rescheduled under a programadministered by the Trust for the Coverage of ExchangeRisks ("FICORCA"). This $200 million represents substantially all ofthe Company's loans to the private sectorin Mexico that are expected to be renegotiated underthis program.
BRAZIL During 1985, the Company had a net decrease incross-border outstandings to borrowers in Brazil Of$14 million, primarily due to a net decrease in loans and acceptances of $11 million. Accrued interest receivable decreasedfrom $13 million at December 31, 1984 to $10 million at December 31,1985, as the Company received $63 million of interest payments and accrued $60 million of interest income.At December 31, 1985, total Brazilian loans on nonaccrualstatus were $15 million, all to private sector borrowers.
During 1985, bank creditors of Brazil continued to provide trade and interbank facilities under intelim measuresrecommended by the Bank Advisory Committee for Brazil.In addition, all the 1985 maturities were deferred on aninterim basis. Both of these measures were adopted pendingfinalization of a refinancing package.
The Brazilian government is in the process of completinga draft of its economic program for 1986, which it intends tosubmit to the International Monetary Fund. It is widelyanticipated that submission will be merely on an advisory,and not on an approval, basis. Negotiations with the BankAdvisory Committee on the refinancing ofI985 and subsequent maturities, and on the trade and interbank facilitieshave resumed. The Brazilian government has askedits foreign creditors to extend the interim measures toMarch 1986.
VENEZUELA In May 1985, an agreement in principlewas reached between the Bank Advisory Committee andthe Venezuelan government on the terms of a reschedulingof the public sector debt. If such rescheduling is agreed toby all ofVenezuela's commercial bank creditors, includingthe Company; it will provide for the refinancing ofall publicsector debts falling due between March 22, 1983 and December 31, 1988. The Company's share of such debts is expectedto be approximately $150 million. The rescheduling proposal calls for repayment over 11 years through 1997. TheCompany believes the effect of this rescheduling on it willnot be material.
March 1985, documents were signed by the Company andother banks to amend the existing rescheduling agreementsfor some pre-1983 public sector debt in order to bring theminto conformity with the terms of this proposal. Theseexisting agreements had extended the principal of publicsector debt (originally falling due between August 1982 andDecember 1984) to mature between 1987 and 1990. Of theCompany's approximately $161 million of public sectorloans that originally were due between 1982 and 1984,approximately $122 million was amended as describedabove. In August 1985, the Company and other creditorbanks signed an agreement to reschedule most of the remaining pre-1983 public sector debt that falls due between1985 and 1991 in accordance with these terms. The Company's share of these 1985-1991 maturities is approximately$130 million.
Another portion of the September 1984 proposal wasinstituted when the Company and other banks signed agreements in March 1985 to amend a March 1983 $5 billion newmoney facility Under the terms of this amendment, theMexican government was to prepay $1 billion of this loan inOctober and November 1985, and the remaining principal(scheduled to mature between 1986 and 1990) was extendedto a new fmal maturity ofI994. The $1 billion overall prepayment would reduce the Company's $43 million currentbalance of this loan by approximately $9 million; the Company's remaining balance of this facility will carry an interest rate OfIV8% over prime. (The Company's $36 millionparticipation in the above-mentioned 1984 term loan wasnot amended, because it already carries a final maturity of1994 and interest ofIV8 over prime.)
Before the adoption of the SeptembeTl984 proposal, theweighted average contractual interest rate for the Company's public sector prime-based loans in Mexico wasapproximately 1.6% over prime and the weighted averagecontractual interest rate for its LIBOR-based public sectorloans in Mexico was approximately 1.1% over LIBOR. Whenthe terms of the proposal are fully instituted, the contractualrate will be IV8% over prime for prime-based loans and thecontractual rate will be initially 'l"8% over LIBOR (and, thereaftel~ increasing) for LIBOR-based loans. On the basis of thecurrent interest rate environment, it is estimated that theimmediate overall effect ofimplementing this proposalwould be a decline of approximately 150 basis points in thepretax yield of the Company's Mexican public sector portfolio, reflecting the changes in contractual interest rate andthe mix of prime- and LIBOR-based loans. The Companybelieves that the effect of this rescheduling on it will notbe material.
In October 1985, the Mexican government requested thatits creditor banks defer the above-mentioned $1 billionprepayment of the 1983 facility in light of the recent earthquakes, declining oil revenue and other factors. A six-month
18 19
J!i" - - -- -~
,I •I •, WELLS FARGO & COMPANY AND SUBSIDIARIES WELLS FARGO & COMPANY AND SUBSIDIARIES
1-2g days $ 2·5 $ 7.6 $ (5.1) (17-2)%Prime-based 9·5 9·5 32.1Market rate savings 5·5 (5.5)
(.g)(18.6)
(3. 0)
30-179 days 3·5 3·3 .2 ·7180-364 days 1.1 1.0 .1 ·31-5 years 4·5 2.1
2'418.1
1
Over 5 years 3·7 ·5 3. 2 .8 10.8 2·7Nonmarket ~ ~ (4. 8) (16.2)
Total $ 29.6 $ 2g.6
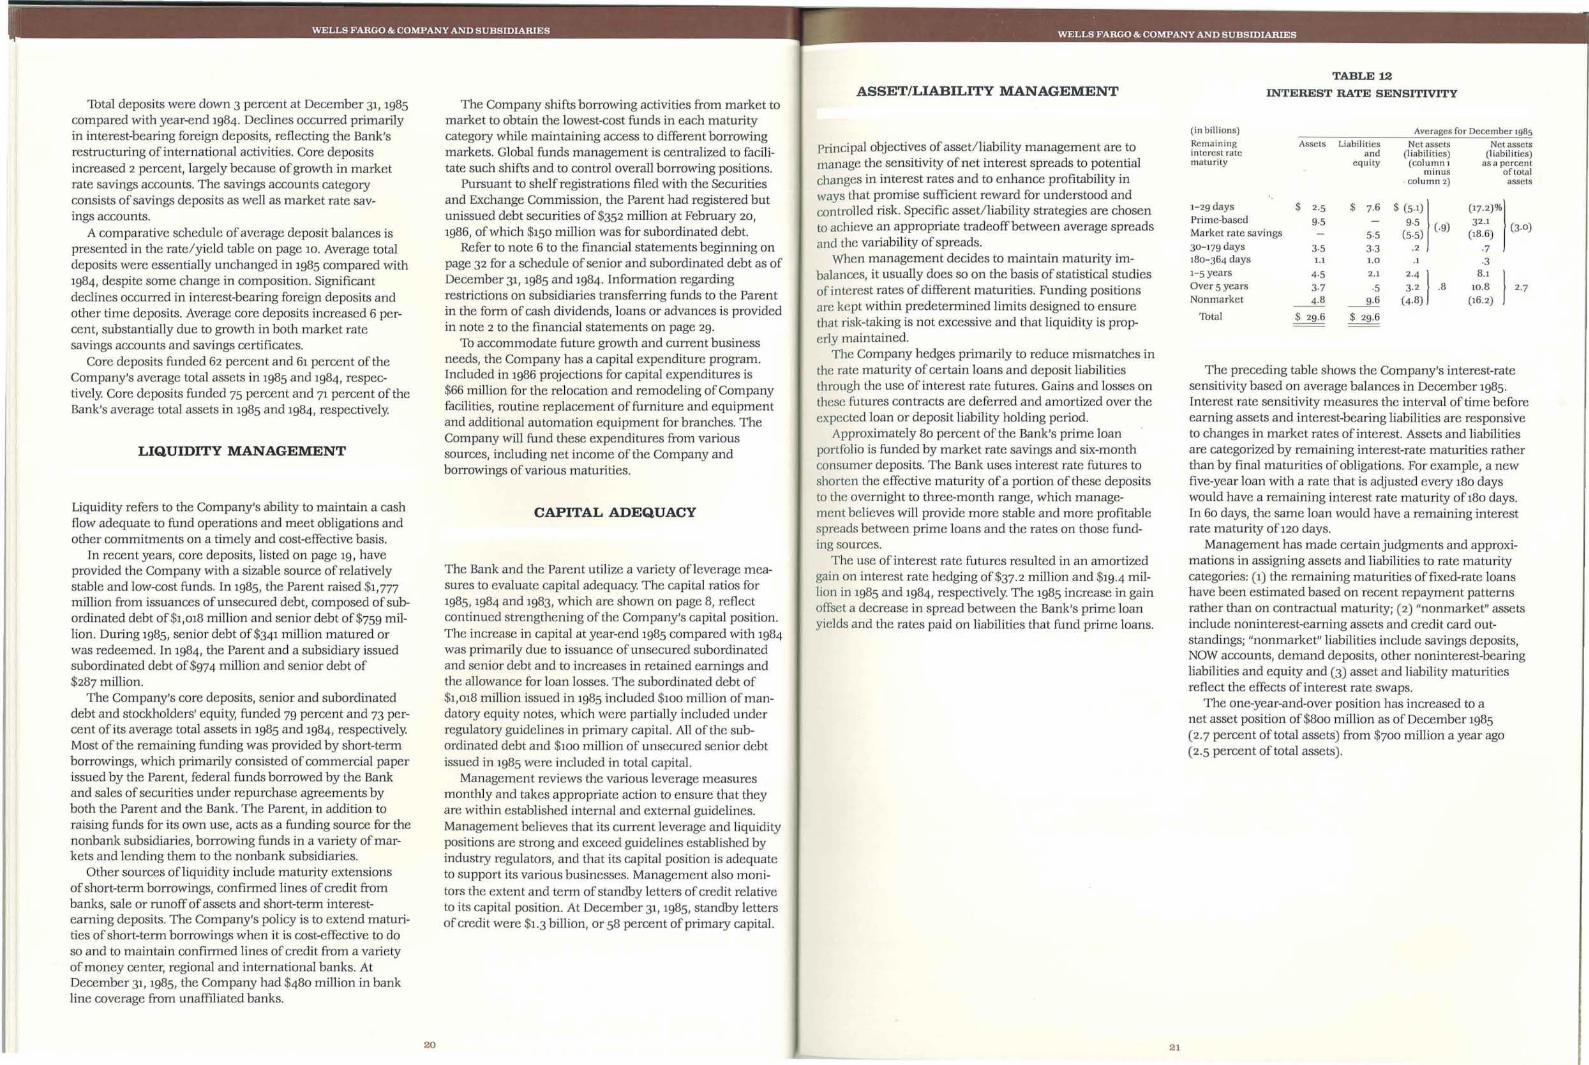
The preceding table shows the Company's interest-ratesensitivity based on average balances in December 1985.Interest rate sensitivity measures the interval oftiJne beforeearning assets and interest-bearing liabilities are responsiveto changes in market rates of interest. Assets and liabilitiesare categorized by remaining interest-rate maturities ratherthan by final maturities of obligations. For example, a newfive-year loan with a rate that is adjusted every 180 dayswould have a remaining interest rate maturity of180 days.In 60 days, the same loan would have a remaining interestrate maturity of120 days.
Management has made certain judgments and approximations in assigning assets and liabilities to rate maturitycategories: (1) the remaining maturities affixed-rate loanshave been estimated based on recent repayment patternsrather than on contractual maturity; (2) "nonmarket" assetsinclude noninterest-earning assets and credit card outstandings; "nonmarket" liabilities include savings deposits,NOW accounts, demand deposits, other nonulterest-bearingliabilities and equity and (3) asset and liability maturitiesreflect the effects ofulterest rate swaps.
The one-year-and-over position has increased to anet asset position of$800 million as of December 1985(2.7 percent of total assets) from $700 million a year ago(2.5 percent of total assets).
TABLE 12
INTEREST RATE SENSITIVITYTotal deposits were down 3 percent at December 31, 1985
compared with year-end 1984. Declines occurred primarilyin interest-bearing foreign deposits, reflecting the Bank'srestructuring of international activities. Core depositsincreased 2 percent, largely because ofgrowth in marketrate savings accounts. The savings accounts categoryconsists of savings deposits as well as market rate sav-ings accounts.
A comparative schedule of average deposit balances ispresented in the rate/yield table on page 10. Average totaldeposits were essentially unchanged in 1985 compared with1984, despite some change in composition. Significantdeclines occurred in interest-bearing foreign deposits andother time deposits. Average core deposits increased 6 percent, substantially due to growth in both market ratesavings accounts and savings certificates.
Core deposits funded 62 percent and 61 percent of theCompany's average total assets in 1985 and 1984, respectively. Core deposits funded 75 percent and 71 percent of theBank's average total assets in 1985 and 1984, respectively.
LIQUIDITY MANAGEMENT
Liquidity refers to the Company's ability to maintain a cashflow adequate to fund operations and meet obligations andother commitments on a timely and cost-effective basis.
In recent years, core deposits, listed on page 19, haveprovided the Company with a sizable source of relativelystable and low-cost funds. In 1985, the Parent raised $1,777million from issuances of unsecured debt, composed of subordinated debt Of$1,018 million and senior debt of$759 million. During 1985, senior debt of $341 million matured orwas redeemed. In 1984, the Parent and a subsidiary issuedsubordinated debt of$974 million and senior debt of$287 million.
The Company's core deposits, senior and subordinateddebt and stockholders' equity, funded 79 percent and 73 percent of its average total assets in 1985 and 1984, respectively.Most of the remaining funding was provided by short-termborrowings, which primarily consisted of commercial paperissued by the Parent, federal funds borrowed by the Bankand sales of securities under repurchase agreements byboth the Parent and the Bank. The Parent, in addition toraising funds for its own use, acts as a funding source for thenonbank subsidiaries, borrowing funds in a variety of markets and lending them to the nonbank subsidiaries.
Other sources ofliquidity include maturity extensionsof short-term borrowings, confirmed lines of credit frombanks, sale or runoff of assets and short-term interestearning deposits. The Company's policy is to extend maturities of short-term borrowings when it is cost-effective to doso and to maintain confirmed lines of credit from a varietyofmoney center, regional and international banks. AtDecember 31, 1985, the Company had $480 million in bankline coverage from unaffiliated banks.
20
The Company shifts borrowing activities from market tomarket to obtain the lowest-cost funds in each maturitycategory while maintaining access to different borrowingmarkets. Global funds management is centralized to facilitate such shifts and to control overall borro-wing positions.
Pursuant to shelf registrations filed with the Securitiesand Exchange Commission, the Parent had registered butunissued debt securities of$352 million at February 20,1986, of which $150 million was for subordinated debt.
Refer to note 6 to the financial statements beginning onpage 32 for a schedule of senior and subordinated debt as ofDecember 31, 1985 and 1984. Information regardingrestrictions on subsidiaries transferring funds to the Parentin the form of cash dividends, loans or advances is providedin note 2 to the financial statements on page 29.
To accommodate future growth and current businessneeds, the Company has a capital expenditure program.Included in 1986 projections for capital expenditures is$66 million for the relocation and remodeling of Companyfacilities, routine replacement of furniture and equipmentand additional automation equipment for branches. TheCompany will fund these expenditures from varioussources, including net income of the Company andborrowings of various maturities.
CAPITAL ADEQUACY
The Bank and the Parent utilize a variety of1everage measures to evaluate capital adequacy. The capital ratios for1985,1984 and 1983, which are shown on page 8, reflectcontinued strengthening of the Company's capital position.The increase in capital at year-end 1985 compared with 1984was primarily due to issuance of unsecured subordinatedand senior debt and to increases in retained earnulgs andthe allowance for loan losses. The subordinated debt of$1,018 million issued in 1985 included $100 million of mandatory equity notes, which were partially included underregulatory guidelines in primary capital. All of the subordinated debt and $100 million of unsecured senior debtissued in 1985 were included in total capital.
Management reviews the various leverage measuresmonthly and tal<es appropriate action to ensure that theyare within established internal and external guidelules.Management believes that its current leverage and liquiditypositions are strong and exceed guidelines established byindustry regulators, and that its capital position is adequateto support its various businesses. Management also monitors the extent and term ofstandby letters ofcredit relativeto its capital position. At December 31, 1985, standby lettersof credit were $1.3 billion, or 58 percent of primary capital.
ASSET/LIABILITY MANAGEMENT
Principal objectives of asset/liability management are tomanage the sensitivity of net interest spreads to potentialchanges in interest rates and to enhance profitability inways that promise sufficient reward for understood andcontrolled risk. Specific asset/liability strategies are chosento achieve an appropriate tradeoffbetween average spreadsand the variability ofspreads.
When management decides to maintain maturity imbalances, it usually does so on the basis ofstatistical studiesofinterest rates of different maturities. Funding positionsare kept within predetermined linlits designed to ensurethat risk-ta1<ing is not excessive and that liquidity is properly maintained.
The Company hedges primarily to reduce mismatches inthe rate maturity of certain loans and deposit liabilitiesthrough the use of interest rate futures. Gains and losses onthese futures contracts are deferred and amortized over theexpected loan or deposit liability holding period.
Approximately 80 percent of the Bank's prime loanportfolio is funded by market rate savings and six-monthconsumer deposits. The Bank uses interest rate futures toshorten the effective maturity ofa portion of these depositsto the overnight to three-month range, which management believes will provide more stable and more profitablespreads between prime loans and the rates on those funding sources.
The use ofinterest rate futures resulted in an amortizedgain on interest rate hedging of$37.2 million and $19-4 million in 1985 and 1984, respectively. The 1985 increase in gainoffset a decrease in spread between the Bank's prime loanyields and the rates paid on liabilities that fund prime loans.
21
(in billions)
Remainingintercst ratcmaturity
Assets Liabil itiesand
equity
Averages for December1g8s
Net assets Net assets(liabilities) (liabilities)
(column 1 as a percentminus of total
. column 2) assets

- ---
ill"'" .
I WELLS FARGO & COMPANY AND SUBSIDIARIES • WELLS FARGO & COMPANY AND SUBSIDIARIES
COMPARISON OF 1984 VERSUS 1983PRICE RANGE
OF COMMON STOCK-ANNUAL
(Ill)
PRICE RANGE
OF COMMON STOCK-QUARTERLY
(Ill)
GENERAL INFORMATION
Indicates price at end of quarter
IQ 2Q 3Q 4Q lQ 2Q 3Q 4Q
1984 1985
25
$70
65 645/u
60
55
50
45
40
35
30 3PII 3HlJ
by the Company's Board of Directors in light of the earningsand financial condition of the Company. In the first quarterOf1985, the common stock quarterly dividend was increasedto $.60 per share from $.54 per share and, in the fourthquarter, it was increased to $.68 per share. Informationregarding restrictions on the payment of dividends ispresented in note 2 to the financial statements on page 29.
In February 1986, the Board ofDirectors approved anincrease in the number of authorized common shares from50 million to 75 million, subject to stockholder approval.
Information on financial reporting and changing prices ispresented on page 45.
Indicates price at end ofyear
$70
65 645/u
60
55
5049 '18
45 451/2413/4
40
355Al35 34
30 313m
25 26'/424~h
20183/1
1581 82 83 84 85
Common stock ofthe Parent is traded on the NewYork Stock Exchange, the Pacific Stock Exchange,the London Stock Exchange and the FrankfurterBorse. The high, low and closing annual and
quarterly prices of the Parent's stock as reported on the NewYork Stock Exchange Composite Transaction ReportingSystem are presented in the above graphs. The approximatenumber ofholders of record of the Parent's common stockwas 22,100 as of January 31, 1986.
Common dividends declared per share totaled $2-48 in1985, $2.16 in 1984 and $1.98 in 1983. The Company intendsto continue its present policy of paying quarterly cash dividends to stockholders. Future dividends will be determined
Nonaccrual and restructured loans were $734.6 million,or 3.2 percent of total loans, at December 31,1984, compared with $748.6 million, or 3.7 percent of total loans, atDecember 31, 1983. The most significant increase in nonaccruals occurred in agricultural-related loans secured byreal estate, which are included in the real estate mortgageportfolio.
The Company's effective tax rate increased to 35% in1984, compared with 33% in 1983. The higher 1984 rate primarily resulted from a greater amount of earnings subjectto U.S. taxation and a decline in investment tax credits.
The Company's ratio of primary capital to assets was6.65 percent at December 31,1984, compared with 5.68 percent at the end 0f1983. Thtal capital was 10.39 percent ofassets at December 31,1984 and 7.20 percent a year earlier.The increases were primarily due to the issuance of unsecured subordinated debt of$974 million during 1984. Ofthis amount, $300 million was mandatory convertible debt,which qualified as primary capital. The remaining $674 million was included in total capital.
I n 1984, net income was $169.3 million, up 9 percentfrom $154.9 million in 1983. Net income per share for1984 was $6.85, compared with $6.03 in 1983.
Interest differential increased 17 percent, from$965 million in 1983 to $1,124 million in 1984, due to an 8percent growth in average earning assets and a 33 basispoint improvement in spread. The improvements in spreadand in interest differential were primarily attributable toincreases in targeted loan categories and core deposits,favorable funding conditions and management ofinterestrate risk.
Average loan volume in 1984 was $21.6 billion, anincrease of 8 percent over 1983. Contributing to the 10 percent increase in average commercial loans was growth inmiddle-market loans. The 24 percent increase in real estateconstruction-related loans was broadly based and resultedprimarily from loans made to finance commercial properties. Consumer loans rose 22 percent, reflecting origination ofnew credit card accounts and line increases to existing accounts.
Average core deposits increased 7 percent to $16.7 billionin 1984, largely because ofgrowth in savings certificates. Aschedule ofaverage loan and deposit balances for 1984 and1983 is shown in the rate/yield table on page 10.
Noninterest income was $270.6 million in 1984, adecrease of3 percent from $279.5 million in 1983. The 1984decrease reflected higher gains in 1983 from sales of property in San Francisco, equity securities received in troubleddebt restructurings, bank premises and loans, partiallyoffset by a 30 percent increase in domestic fees andcommissions.
Noninterest expense increased 5 percent in 1984 to$886.6 million. Salaries increased by less than 3 percent in1984 while employee benefits expense decreased 6 percent,primarily due to a decrease in retirement plan expense.'W.l other" expense was up 41 percent in 1984. In 1983, theCompany reversed a $9-4 million reserve it had establishedfor possible payments associated with settlement of outstanding tax issues, which had the effect of reducing "allother" expense in 1983.
The allowance for loan losses at the end of1984 was 1.14percent of total loans, compared with .98 percent at the end0f1983. The provision for loan losses was $194.6 million in1984/ compared with $121.1 million in 1983. During 1984, netcharge-offs were $133.3 million, compared with $111.9 million during 1983. As a percentage ofaverage loans outstanding, net charge-offs were .62 percent in 1984 and .56percent in 1983. A significant portion of the 1984 increasewas attributable to private sector foreign loans, agriculturalrelated loans and loans to small and mid-size borrowers in avariety of industries.
22 23

, ,. ..: ..;... - - -~ ---. ~ ~, . . ~ -" ~ ~ "'-~:-~~~.. , ~
_ . .',' '.- . WEL~SF~ IloCOMP~Y'AND SUBSIDIARIES
-.--:'1~ - ~ -- -
_, - - • _" -: . .~. I
- '-:.....&:.. - ~ _.. ':.. ~
CONSOLIDATED STATEMENT OF INCOME CONSOLIDATED BALANCE SHEET
(in thousands) Year ended December 31, (in thousands)].985 J984 1983
ASSETS
INTEREST INCOME Cash and due from banks
Loans $ 2,809,273 $ 2,830,880 $ 2.481,086Interest-earning deposits
Interest-earning deposits 46,664 106,309 144,094Investment securities (market value $1,675,112 and $1,048,986)
Investment securities: Trading account securities
Taxable 113,870 99,380 43.476Federal funds sold
Exempt from federal income taxes 7,389 9,937 13,075LoansTrading account securities 22,3°8 14,841 10,365
Federal funds sold 17.443 40,200 22,231Allowance for loan losses
Tbtal interest income 3,016,947Net loans
3,101,547 2,714,327
INTEREST EXPENSE Premises and equipment, net
Deposits 1,245,323 1.493,267 1,382,839Due from customers on acceptances
Short-term borrowings 261,209 332,738 259,631 Accrued interest receivable
Senior and subordinated debt 327,381 225,500 160,099Other assets
Tbtal interest expense 1,833,913 2,051,505 1,802,569Total assets
Amortized gain on interest rate hedging 37,225 19.437 3,236 LIABILITIES AND STOCKHOLDERS' EQUITY
NET INTEREST INCOME 1,220,259 1,069.479 914,994 Deposits:
Provision for loan losses 371,836 194,593 121,109 Noninterest-bearing- domestic
Net interest income after provision for loan losses 848.423 874,886 793,885Noninterest-bearing- foreignInterest-bearing - domestic
NONINTEREST INCOME Interest-bearing - foreignService charges on deposit accounts 108,994 95,236 85,503 Total depositsDomestic fees and commissions 88,176 75,396 57,986Investment securities gains 55.471 3,022 537 Short-term borrowings:
Trust and investment services income 55,132 51,159 56,379 Federal funds borrowed and repurchase agreements
International fees, commissions and foreign exchange 17,766 20,728 30,076 Commercial paper outstanding
Sale of a mortgage banking subsidiary 5°,152 Other
Other 19,973 25,088 48,976 Total short-tenn borrowings
Total noninterest income 395,664 270,629 279.457 Acceptances outstanding
NONINTEREST EXPENSE Accrued taxes and other expenses
Salaries 414.445 405,849 394,968 Senior debt
Employee benefits 99,468 83.499 88,756 Other liabilities
Net occupancy 87,788 81,654 78,764Equipment 75,940 74,189 68,267 Subordinated debtOther 266,114 241,396 212,894 Total liabilities
Tbtal noninterest expense 943,755 886,587 843,649 Stockholders' equity:INCOME BEFORE INCOME TAX EXPENSE 300,332 258,928 229,693 Preferred stock-no par value, authorized 10,000,000 shares;Income tax expense 110,298 89,663 74,793 issued and outstanding 3,000,000 shares
NET INCOME $ 190,034 $ 169, 265 $ 154,900 (nonconvertible, cumulative, stated value-$50)
NET INCOME APPLICABLE ro COMMON SroCK $ 177,246 $ $ 143,067Common stock-$5 par value, authorized 50,000,000 shares;
154,171 issued and outstanding 21,139,311 shares and 21,234,597 shares
PER COMMON SHARE Additional paid-in capital
Net income $ 8.30 $ 6.85 $ 6.03 Retained earnings
Dividends declared $ 2·48 $ 2.16 $ 1.98Equity adjustment from foreign currency translation
Tbtal stockholders' equityAverage common shares outstanding (in thousands) 21,351 22,514 23,737 Tbtalliabilities and stockholders' equity
December 3J,
1985 1984
$ 1,402,162 $ 2,048,981534,511 432,628
1,696,070 1,088,543146,658 198,61439,650 225,024
24,614,173 22,893,870417,520 260,314
24,196,653 22,633,556
444,408 453.467254,871 426,538222,549 283, 214491,862 393,559
$ 29,429,394 $ 28,184,124
$ 3,693,697 $ 3,799,7468,411 122,038
15,111,602 14,755,660687,59° 1,523,793
19,501,300 20,201,237
1,800,058 963,3331,436,227 1,783,885
108,898 50,880
3,345,183 2,798,098
255,225 426,661373,187 460.493
2,129,689 1,708,568310,290 233,694
25,914,874 25,828,7512,056,560 l,Oll,703
27,971,434 26,840.454
150,000 15°,000
105,697 106,173158,190 169,904
1,050,993 926,738(6,920) (9,145)
1,457,960 1,343,670
$ 29,429,394 $ 28,184,124
The accompanying notes are an integral part of these statements.
24
The accompanying notes are an integral part of these statements.
25

CONSOLIDATED STATEMENT OF CHANGES IN STOCKHOLDERS' EQUITY CONSOLIDATED STATEMENT OF CHANGES IN FINANCIAL POSITION
(in thousands) Preferred Common Additional Retained Foreign Total (in thousands) Year ended December 31,stock stock paid-in earnings currency stockholders'
1985 1984 1983capital translation equity
Financial resources provided by (applied to):Operations:
Balance December 31,1982 $ - $ 118,034 $ 262,556 $ 724,589 $ (4,744) $ 1,100,435 Net income $ 190,034 $ 169,265 $ 154,900
Net income-1983 154,900 154,900 Noncash charges:
Preferred stock issued, net of issuance costs 150,000 (3,800) 146,200 Provision for loan losses 371,836 194,593 121,109
Conversion of convertible notes 25 123 148 Depreciation and amortization 64,759 58,220 50,422
Common stock issued under employee Deferred income tax expense 29,407 44,135 49,953
benefit and dividend reinvestment plans 1,525 6,803 8,328 Financial resources provided by operations 656,036 466,213 376,384Common stock repurchased (175) (773) (948) Cash dividends declared (65,779) (63,138) (58,878)Preferred stock dividends (11,833) (11,833) Net financial resources provided by operations 317,506Common stock dividends (47,045) (47,045)
590,257 403,075
Equity adjustment from foreign currency Deposits and other financing activities:
translation (net of income tax expense Noninterest-bearing deposits (219,676) 77,082 198,375
Of$2,145) (2,414) (2,414) Interest-bearing deposits (480,261) (236,841) 1,982,831
Net change 96,022 (2,414) 247,336Short-term borrowings 547,085 146,573 (46,241)
150,000 1,375 2,353 Senior and subordinated debt 1,465,978 1,187,745 158,520Balance December 31, 1983 150,000 119,409 264,909 820,611 (7,158) 1,347,771 Exercise ofwarrants and conversion of
Net income -1984 169,265 169,265 convertible notes 3,336 3,821 148
Exercise ofwarrants and conversion of Common stock issued under employee benefit
convertible notes 776 3,045 3,821 and dividend reinvestment plans 10,823 6,779 8,328
Common stock issued under employee Common stock repurchased (26,349) (118,841) (948)
benefit and dividend reinvestment plans 1,029 5,750 6,779 Preferred stock issued, net of issuance costs 146,200
Common stock repurchased (15,041) (103,800) (118,841) Financial resources provided by deposits andPreferred stock dividends (15,094) (15,094) other financing activities 1,300,936 1,066,318 2.447, 213Common stock dividends (48,044) (48,044) Other activities-(increase) decrease in netEquity adjustment from foreign currency nonearning assets:
translation (net of income tax benefit Cash and due from banks 646,819 143,558 (507,167)of$860) (1,987) (1,987) Net additions to premises and equipment (51,287) (48,934) (62,983)
Net change (13,236) (95,005) 106,127 (1,987) (4,101) Other, net (79,712) (65, 604) (126,914)
Balance December 31,1984 150,000 106,173 169,904 926,738 (9,145) 1,343,670 Financial resources provided by (applied to)
Net income-1985 19°,034 19°,°34net nonearning assets 515,820 29,020 (697, 064)
Exercise ofwarrants and conversion of Increase in financial resources invested inconvertible notes 676 2,660 3,336 earning assets $ 2,4°7,013 $ 1,498.413 $ 2, 067,655
Common stock issued under employeeIncrease (decrease) in earning assets:
benefit and dividend reinvestment plans 1,340 9,483 10,823Equity adjustment from foreign currency
Interest-earning deposits $ 101,883 $ (1,132,773) $ 574,865
translation (net ofincome tax expenseInvestment securities 6°7,527 120,239 364.447
Of$l,303) 2,225 2,225Trading account securities (51,956) 136,293 (51,580)
Common stock repurchased (2,492) (23,857) (26,349)Federal funds sold (185,374) (385.476) 568,800
Net loans 1,934,933 2,760,130 611,123Preferred stock dividends (12,788) (12,788)Common stock dividends (52,991) (52,991) Increase in earning assets $ 2,4°7, 013 $ 1,498,413 $ 2, 067,655
Net change (476) (11,714) 124,255 2,225 11.4,29°
Balance December 31, 1985 $ 150,000 $ 105,697 $ 158,190 $ 1,050,993 $ (6,920) $ 1,457,960
The accompanying notes are an integral part of these statements.
26
The accompanying notes are an integral part of these statements.
27

- - - J.O:.-..- - '. I • •••• -. ' '-.. - -. ,- , ".. i
. . ': ':' • . ,'ivELLSFARoo&COMPANYANDSUBSuiIAiiIESoL. - _= ...- ----1 _ _ • • IWELLS FA~GO& COMPA!'lY ANp SUBSlDIA;lUES _ _ ~ _ _ .. _ ~ ,. • A J
NOTES TO FINANCIAL STATEMENTS
NOTE 1SUMMARY OF SIGNIFICANT ACCOUNTING POLICIES
NOTE 2CASH, LOAN AND DIVIDEND RESTRICTIONS
financial statements are then translated into U.S. dollarsusing the current rate method. Translation adjustments aredisclosed as a separate component of stockholders' equity.Such adjustments are reversed upon sale or upon complete,or substantially complete, liquidation of the investment andrecognized in net income.
Forward exchange contracts that hedge equity investments are revalued monthly at current market rates.The gain or loss, less applicable income taxes from suchrevaluation, is included in the translation adjustment in theseparate component of stockholders' equity. The amortization of the premiums or discounts on these contracts isincluded in income.
Gains or losses from other foreign currency transactions,including foreign exchange trading activities, are recognizedin the current period in noninterest income. Premiums ordiscounts on forward exchange contracts that are associatedwi th the funding of assets from liabilities of a different currency (swap transactions) are deferred and amortized intointerest income or expense over the life of the contract.
INTEREST RATE FUTURES The Company hedges primarily to reduce mismatches in the rate maturity of certainloans and deposit liabilities through the use of interest ratefutures. Gains and losses on these futures contracts aredeferred and amortized over the expected loan or depositliability holding period. This amortization is shown as a separate component of net interest income. Futures contractsobtained for hedging assets in the trading portfolio aremarked to market and gains and losses are included in noninterest income.
NET INCOME PER COMMON SHARE Net income percommon share is computed by dividing net income (afterdeducting dividends on preferred stock) by the averagenumber of common shares outstanding during the year.The impact ofcommon stock equivalents and other potentially dilutive secUlities is not material.
Dividends payable by the Bank to the Parent without theexpress approval of the Office of the Comptroller of the Currency are limited to the Bank's net profits (as defmed) forthe preceding two years plus net profits up to the date ofany dividend declaration. Under this formula, the Bank candeclare additional dividends in 1986 ofapproximately$290 million of its undistributed earnings at December 31,1985 plus net profits for 1986 up to the date of any such dividend declaration.
At December 31,1985, net assets of the Bank that wererestricted as described in the preceding two paragraphswere approximately $1.0 billion.
FOREIGN CURRENCY TRANSLATION The Companyemploys the net investment concept for foreign operations.Under this concept, a functional currency is designated foreach foreign entity based on the currency of the primaryeconomic environment in which the entity operates. Theassets, 1iabilities and operations of an entity denominated inother than its functional currency are initially remeasuredinto its functional currency with the gain or loss recognizedin current period income. For consolidation purposes, the
INCOME TAXES The Company files a consolidated federal income tax return and a combined California franchisetax return. Generally; the tax liabilities are settled betweensubsidiaries as if each had fIled a separate return. Paymentsare made to the Parent by those subsidiaries with net taxliabilities on a separate basis. Subsidiaries with net tax lossesand excess tax credits receive payment for these benefitsfrom the Parent. Taxable income is computed primarilyusing the cash receipts and disbursements method ofaccounting as permitted by the tax statutes.
Deferred income taxes, included in accrued taxes andother expenses, result from timing differences betweenincome as reported in the financial statements and asreported for income tax return purposes.
Federal income taxes are not provided on earnings offoreign subsidiaries or affiliates that are intended to beindefinitely reinvested abroad. Federal income taxes areprovided on the earnings of foreign consolidated subsidiaries and foreign equity investments that may be repatriated to the U.S. under the assumption that all such earningswill be distributed in the future as dividends.
Tax reductions arising from the investment tax credit onproperty purchased and used by the Company are recogruzed as a reduction of tax expense in the current period,Investment tax credit on property purchased for lease tocustomers is deferred and amortized as lease financingincome over the term of the related lease.
Federal Reserve Board regulations require reserve balanceson deposits to be maintained by the Bank with the FederalReserve Bank. The average required reserve balance wasapproximately $530 million and $500 million in 1985 and1984, respectively
The Bank is subject to certain restrictions under the Federal Reserve Act, including restrictions on any extension ofcredit to its affiliates. In particular, the Parent and its nonbank subsidiaries are prohibited from borrowing from theBank unless the loans are secured by specified collateral.Such secured loans and other regulated investments madeby the Bank are limited in amount as to the Parent or to anyof its nonbank subsidiaries to 10 percent of the Bank's capital and surplus and, in the aggregate to all such entities, to20 percent of the Bank's capital and surplus.
LOANS Loans are reported at the principal amount outstanding, net of unearned income. Unearned income onloans is recognized as income primarily on a declining basis(sum-of-the-digits method) over the term of the loan, exceptat certain nonbank subsidiaries where unearned income isamortized using an interest method.
A portion ofloan origination fees intended to offset directOligination costs are recognized as income at the time ofthe loan closing. Any excess fees are amortized to interestincome over the expected loan period using an interestmethod or the straight-line method ifit is not materiallydifferent.
Unearned income from direct lease fmancing transactions is amortized over the lease terms using an interestmethod. Income on leveraged leases is recognized to attaina constant yield on the outstanding investment in the lease,net of related deferred tax liability, in the years in which thenet investment is positive. At the lease inception, WellsFargo Leasing Corporation recognizes a portion of unearnedincome equal to the approximate direct costs ofacquiringleases plus an estimated provision for loss.
Nonaccrualloans Loans, other than 1-4 family residential real estate loans and consumer loans for which no portion of the principal has been charged off, are placed onnonaccrual status when the loan becomes 90 days past dueas to interest or principal, unless both well secured and inthe process of collection, or when the full timely collectionof interest or principal becomes uncertain. When a loan isplaced on nonaccrual status, the accrued and unpaid interest receivable is reversed and the loan is accounted for onthe cash or cost recovery method thereafter, until qualifyingfor return to accrual status.
Allowance for loan losses The allowance for loan lossesis supported by a review and evaluation ofvarious factorswhich affect the collectibility of the loan portfolio. In theevaluation, numerous factors are considered, including, butnot necessarily limited to, general economic conditions,loan portfolio composition, prior loan loss experience andmanagement's estimate oflosses inherent in the loanportfolio.
OTHER REAL ESTATE Other real estate, consistingofreal estate acquired as a result of troubled debt restructurings and excess real estate, is carried at the lower of costor market and is included in other assets. When the property is acquired, any excess of the loan balance over marketvalue of the property is charged to the allowance for loanlosses. Subsequent write-downs, if any; and disposition gainsand losses are recorded in noninterest expense.
The accounting and reporting policies ofWells Fargo &Company and Subsidiaries (Company) conform with generally accepted accounting principles and prevailing practiceswithin the banking industry. Certain amounts in prior years'financial statements have been reclassified to conform withthe current financial statement presentation.
The following is a description of the more significantpolicies.
CONSOLIDATION The consolidated financial statementsof the Company include the accounts ofWells Fargo & Company (Parent), Wells Fargo Bank, N.A. (Bank) and the nonbank subsidiaries of the Parent.
Foreign branches and significant, majority-owned subsidiaries are consolidated on a line-by-line basis. Significantintercompany accounts and transactions are eliminatedin consolidation. Other subsidiaries and affiliates inwhich there is at least 20 percent ownership are generallyaccounted for by the equity method and less than 20 percentowned investments are carried at cost. These investmentsare reported in other assets; income, including dispositiongains and losses, is included in noninterest income.
SECURITIES Trading account securities are carried atmarket value. Realized and unrealized gains or losses arereported in noninterest income.
Debt securities held for investment purposes are carriedat cost, adjusted for amortization of premium and accretionof discount. Gains or losses on the sale of investment seculities are reported using the "identified certificate" method.
Nonmarketable securities acquired for various reasons,such as troubled debt restructurings or distributions, areincluded in other assets.
PREMISES AND EQUIPMENT Premises and equipment are stated at cost less accumulated depreciation andamortization. Capital leases are included in premises andequipment at the capitalized amount less accumulatedamortization.
Depreciation and amortization are computed primarilyusing the straight-line method with appropriate salvage values. Estimated useful lives range up to 40 years for buildings,3-15 years for furniture and equipment and up to the leaseterm for leasehold improvements. Capitalized leased assetsare amortized on a straight-line basis over the lives of therespective leases, which generally range from 20-35 years.
28 29

NOTE 3INVESTMENT SECURITIES
The following table provides the major components of investment securities and a comparison ofbook and market values.
NOTE 4LOANS AND ALLOWANCE FOR LOAN LOSSES
$83.47850 ,064
$ 33.414
$ 31,354143.961326,889
99,967126,901
729,°72275,605
$ 94.88137,112
$ 57.769
1985 1984December 31,
$ 26,496140,889359,258103,275124,726
754,644310,236
Year ended December 31,
$ 91,94835,879
$ 56,069
(in thousands)
LandPremisesFurniture and equipmentLeasehold improvementsPremises leased under capital leases
TotalLess accumulated depreciation and amortization
Net book value
Interest that would have been recordedunder original terms
Gross interest recorded
Foregone interest
NOTE 5PREMISES AND EQUIPMENT
The following table presents comparative data for premisesand equipment:
(in thollsands)
Nonaccrual and restructured loans were $789.8 millionand $734.6 million at December 31,1985 and 1984, respectively. Related commitments to lend additional funds totaledapproximately $30 million and $36 million at December 31,1985 and 1984, respectively.
If interest due on all nonaccrual and restructured loanshad been accrued at the original contract rates, it is estimated that income before income taxes would have beengreater by the amount shown in the following table:
Included in accumulated depreciation and amortizationwas accumulated amortization related to capital leases of$47.5 million and $43.9 million at December 31,1985 and1984, respectively.
Depreciation and amortization expense was $60.3 million, $55.3 million and $49.9 million for the years endedDecember 31, 1985, 1984 and 1983, respectively.
$ 240,226204, 824168.683127.68161.454
121,639
$924,5°7
Year ended December 31,1985 1984 1983
$ 5,981 $ 822 $22,137 5,159 822
~
$ 27,585 $ 5.981 $ 822
(in thousands) Year ended December 31,
1985 1984 1983
Balance. beginning ofyear $ 260,314 $ 199,556 $ 19°,538Provision for loan losses 371,836 194.593 121,109Net loan charge-offs:
Commercial, financial, andagricultural 116,291 88,071 84,954
Real estate construction-related 306 3.571 342Real estate 1-4 family 1,3°8 1.487 1,383Other real estate mortgage loans 7,442 4.498 (145)Monthly payment 6,624 1,949 4.158Credit card and related plans 45.453 9,717 6,148Lease financing 9,352 4,922 6.267Foreign 24,811 19.050 8,834
Total net loan charge-offs(l) 211,587 133, 265 111,941Other deductions 3,043 57° 15°
Balance, end ofyear $ 417,520 $ 260,314 $ 199,556
Allowance as a percentageof total loans 1·7°% 1.14% ·98%
Balance, beginning ofyearProvisionDeductions
Balance, end ofyear
Direct lease receivable installments mature as follows:
(in thousands)
Changes in allocated transfer risk reserves, which areincluded in the allowance for loan losses, were as follows:
(in thousands)
(I) Includes recoveries Of$2S,641 thousand. $27.805 thousand and $23.724 thousand in 1985. 1984 and 1983, respectively.
For financial statement purposes, the Company hadunamortized investment tax credits on property purchasedfor lease to customers of $40.5 million, $25·7 millionand $28.2 million at December 31,1985,1984 and 1983,respectively.
Changes in the allowance for loan losses were as follows:
Year ended December 31,
1986
198719881989199°1991-2000
Total
(in thousands) December 31,1985 1984
Direct lease financing minimum leasepayments receivable $ 924,507 $ 711,837
Direct lease financing unguaranteedresidual value 370,746 287,884
Leveraged leases 83,206 76,316Equipment pending lease placement 14,348 131
Investment in lease financing 1,392,807 1,076,168Unearned income (278,1l2) (220,519)
Investment in lease financing, netof unearned income 1,ll4,695 855.649
Allowance for losses (15,166) (8,480)
Net investment in lease financing $ 1,099,529 $ 847,169
The table at left shows comparative year-end detail of theloan portfolio.
The components oflease financing at December 31,1985and 1984 are as follows:
million in 1985, 1984 and 1983, respectively, is included intaxable income on investment securities in the consolidatedstatement of income.
The book value of investment securities pledged tosecure public deposits and for other purposes as requiredor permitted by law was $268 million and $275 million atDecember 31, 1985 and 1984, respectively.
The income tax expense for 1985, 1984 and 1983included $28.2 million, $1.6 million and $.3 million, respectively, related to investment securities gains.
(in thousands) December 31.1985 1984
DomesticCommercial. financial, and agricultural $ 8.474,897 $ 8,054.968
Real estate construction-related 4,186,230 3,3°3,543
Real estate first mortgage loans securedby 1-4 family residential properties 3,109,595 3.4°0,041
Other real estate mortgage loans 1,5°9,796 1,462,288
lbtal real estate mortgage loans 4,61 9,391 4.862,329
Monthly payment 1,074,730 795,392Credit card 1,298,063 908,647Other revolving credit 310,275 225,206Real estate junior lien mortgage loans
secured by 1-4 family residentialproperties 1,523,760 1,152.787
Total consumer 4,206,828 3,082,032
Lease fi nanci ng 1,114,695 855,649
ForeignGovernments and official institutions 673,374 8°3.742Banks and other financial institutions 457,111 687.433Commercial and industrial(l) 881,647 1,244,174
Total foreign 2,012,132 2,735,349
Total loans (net ofunearnedincome of$416,350 and $386.454) $ 24,614,173 $ 22.893,870
The market value ofu.s. Treasury, other u.s. government securities and certain other securities is determinedbased on current quotations. The market value of obligations ofstates and political subdivisions is determinedbased on current quotations, where available. Where current quotations are not available, market value is determined based on the present value of future cash flows,adjusted for the quality rating of the securities and otherfactors.
Dividend income of$21.2 million, $14-4 million and $4.6
(in thousands) December 31.1985 1984 1983
Book value Market value Book value Market value Book value Market value
U.S. Treasury securities $ 1,134,768 $ 1,147,873 $ 637,659 $ 645,7°4 $ 478.540 $ 475.073Securities ofother U.S. government
agencies and corporations 19,588 18,065 20.993 23,456 100,291 94,14°Obligations ofstates and political subdivisions 135,194 110,873 190.955 157,683 247.185 205.785Other securities 406,520 398,301 238.936 222.143 142,288 143.4°4
lbtal investment securities $ 1,696,070 $ 1,675,112 $ 1.088,543 $ 1.048,986 $ 968,304 $ 918.402
(I) Includes commercial enterprises that are majority-owned by centralgovernments.
Wells Fargo Leasing Corporation recognized $7.5 million,$2.0 million and $1.0 million ofunearned income in 1985,1984 and 1983, respectively, to offset initial direct costs ofacquiring leases.
30 31
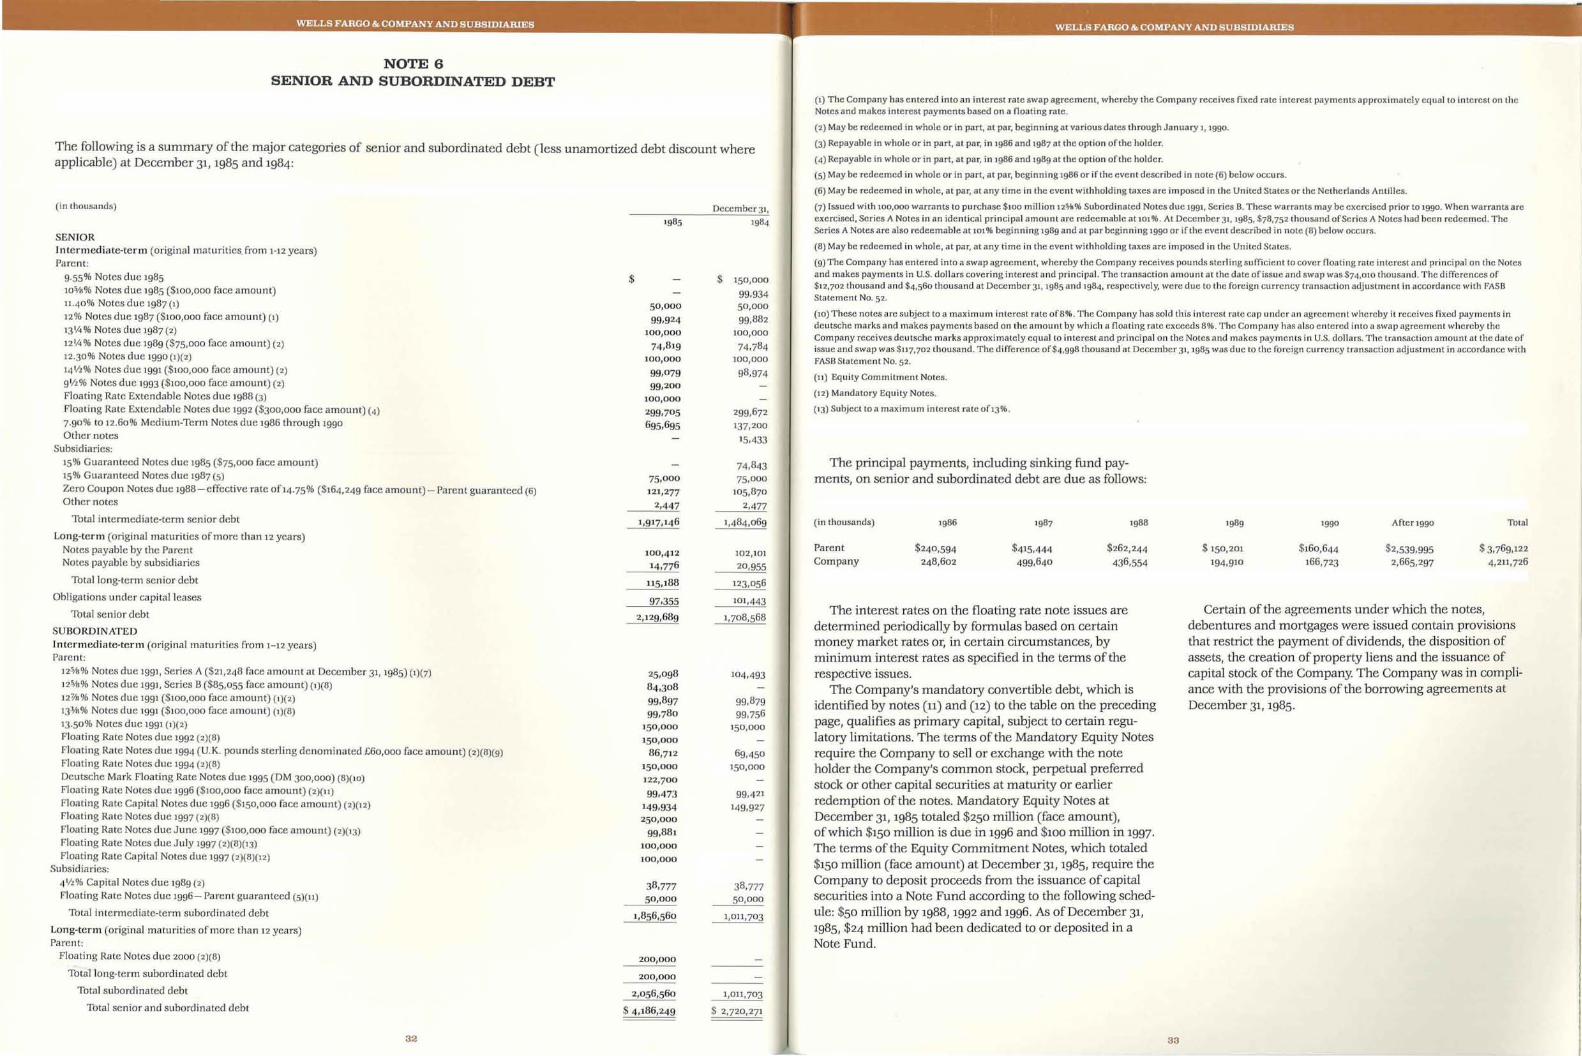
.. .-.-;-.:-.- -- - - . .. .'., .
~=- .., __ ._~ I, _ •
NOTE 6SENIOR AND SUBORDINATED DEBT
The following is a summary of the major categories of senior and subordinated debt (less unamortized debt discount whereapplicable) at December 31,1985 and 1984:
(1) The Company has entered into an interest rate swap agreement, whereby the Company receives fixed rate interest payments approximately equal to interest on theNotes and makes interest payments based on a floating rate.
(2) May be redeemed in whole or in part, at par, beginning at various dates through January 1,1990.
(3) Repayable in whole or in part, at par, in 198G and 1987 at the option of the holder.
(4) Repayable in whole or in part, at par, in 198G and 1989 at the option of the holder.
(5) May be redeemed in whole or in part, at par, beginning 198G or if the event described in note (G) below OCCurS.
(6) May be redeemed in whole, at par, at any time in the event Withholding taxes are imposed in the United States or the Netherlands Antilles.
(7) Issued with 100,000 warrants to purchase $100 million 125A!% Subordinated Notes due 1991, Series B. These warrants may be exercised prior to 1990. When warrants areexercised, Series A Notes in an identical principal amount are redeemable at 101 %. At December 31. '985. $78,752 thousand ofSeries A Notes had been redeemed. TheSeries A Notes are also redeemable at101 % beginning 1989 and at par beginning 1990 or if the event described in note (8) below occurs.
(8) May be redeemed in whole, at par, at any time in the event withholding taxes are imposed in the United States.
(9) The Company has entered into a swap agreement, whereby the Company receives pounds sterling sufficient to cover noating rate interest and principal on the Notesand makes payments in U.S. dollars covering interest and principal. The transaction amount at the date of issue and swap was $74,010 thousand. The differences of$12,702 thousand and $4,560 thousand at December 31,1985 and '984, respectively, were due to the foreign currency transaction adjustment in accordance with FASBStatement No. 52.
(10) These notes are subject to a maximum interest rate of8%. The Company has sold this interest rate cap under an agreement whereby it receives fixed payments indeutsehe marks and makes payments based on the amount by which a floating rate exceeds 8%. The Company has also entered into a swap agreement whereby theCompany receives deutsche marks approximately equal to interest and principal on the Notes and makes payments in U.S. dollars. The transaction amount at the date ofissue and swap was $117,702 thousand. The difference of$4,998 thousand at December 31,1985 was due to the foreign currency transaction adjustment in accordance withFASB Statement No. 52.
(11) Equity Commitment Notes.
(12) Mandatory Equity Notes.
(13) Subject to a maximum interest rate OfI3%.
Total
$ 3,769,1224,211,726
A f'terJ 990
$2,539,9952,665,297
1990
$160,644166,723
1989
$ 15°,201
194,910
Certain of the agreements under which the notes,debentures and mortgages were issued contain provisionsthat restrict the payment of dividends, the disposition ofassets, the creation of property liens and the issuance ofcapital stock of the Company. The Company was in compliance with the provisions of the borrowing agreements atDecember 31,1985.
1988
$262,244
436,554
1986
$240,594248,602
ParentCompany
(in thousands)
The principal payments, including sinking fund payments, on senior and subordinated debt are due as follows:
The interest rates on the floating rate note issues aredetermined periodically by formulas based on certainmoney market rates or, in certain circumstances, byminimum interest rates as specified in the terms of therespective issues.
The Company's mandatory convertible debt, which isidentified by notes (11) and (12) to the table on the precedingpage, qualifies as primary capital, subject to certain regulatory limitations. The terms of the Mandatory Equity Notesrequire the Company to sell or exchange with the noteholder the Company's common stock, perpetual preferredstock or other capital securities at maturity or earlierredemption ofthe notes. Mandatory Equity Notes atDecember 31, 1985 totaled $250 million (face amount),ofwhich $150 million is due in 1996 and $100 million in 1997.The terms of the Equity Commitment Notes, which totaled$150 million (face amount) at December 31, 1985, require theCompany to deposit proceeds from the issuance of capitalsecurities into a Note Fund according to the following schedule: $50 million by 1988,1992 and 1996. As of December 31,1985, $24 million had been dedicated to or deposited in aNote Fund.
104.493
99.421
149,927
99,87999,756
150,000
69,45015°,000
38,7775°,000
1,011,7°3
$ 150,000
99,93450 ,000
99,882100,000
74,784100,000
98,974
299,672137,200
15.433
74,84375,000
105,870
2.477
1,484,069
102,101
20,955
123,056
101,443
1,708,568
December 31,
1,011,703
$ 2,720,271
75,000121,277
2.447
115,188
50 ,000
99,924100,000
74,81 9100,000
99,07999,200
100,000
299,7°5695,695
97,355
25,098
84,3°899,89799,780
150 ,000
150 ,00086,712
15°,000
122,7°0
99,473149,934250,000
99,881100,000100,000
200,000
2,129,689
38,7775°,000
1,856,560
$
200,000
2,056,560
$ 4,186,249
(in thousands)
SENIORIntermediate-term (original maturities. from 1-12 years)Parent:
9·55% Notes due 198510%% Notes due 1985 ($100,000 face amount)11-40% Notes due 1987 (1)12% Notes due 1987 ($100,000 face amount) (1)13'/4 % Notes due 1987 (2)
12114% Notes due 1989 ($75,000 face amount) (2)12.30% Notes due 1990 (1)(2)14'11% Notes due 1991 ($100,000 face amount) (2)9'11% Notes due 1993 ($100,000 face amount) (2)Floating Rate Extendable Notes due 1988 (3)Floating Rate Extendable Notes due 1992 ($300,000 face amount) (4)7.90% to 12.60% Medium-Term Notes due 1986 through 1990Other notes
Subsidiaries:
15% Guaranteed Notes due 1985 ($75,000 face amount)15% Guaranteed Notes due 1987 (5)
Zero Coupon Notes due 1988- effective rate of14· 75% ($164,249 face amount) - Parent guaranteed (G)Other notes
Total intermediate-tenn senior debt
Long-term (original maturities of more than 12 years)Notes payable by the ParentNotes payable by subsidiaries
Total long-term senior debt
Obligations under capital leases
Total senior debt
SUBORDINATED
Intermediate-term (Oliginal maturities from 1-12 years)Parent:
12%% Notes due 1991, Series A ($21,248 face amount at December 31,1985) (1)(7)125/8% Notes due 1991, Series B ($85,055 face amount) (1)(8)127/8% Notes due 1991 ($100,000 face amount) (1)(2)13:Vn% Notes due 1991 ($100,000 face amount) (1) 8)13.50% Notes due 1991 (1)(2)Floating Rate Notes due 1992 (2)(8)
Floating Rate Notes due 1994 (U.K. pounds sterling denominated £60,000 face amount) (2)(8)(9)Floating Rate Notes due 1994 (2)(8)Deutsche Mark Floating Rate Notes due 1995 (OM 300,000) (8)(10)Floating Rate Notes due 1996 ($100,000 face amount) (2)(11)Floating Ratc Capital Notes due 1996 ($150,000 face amount) (2)(12)Floating Rate Notes due 1997 (2)(8)
Floating Rate Notes due Junc 1997 ($100,000 face amount) (2)(13)Floating Rate Notes due July 1997 (2)(8)(13)Floating Rate Capital Notes due 1997 (2)(8)(12)
Subsidiaries:
41fl% Capital Notes due 1989 (2)Floating Rate Notes due 1996 - Parent guaranteed (5)(11)
Total intermediate-tenl1 subordinated debt
Long-term (original mahlrities of more than 12 years)Parent:
Floating Rate Notes due 2000 (2)(8)
Total long-term subordinated debt
Total subordinated debt
Total senior and subordinated debt
32 33

'~F. -;'. :~'. • ~ .' ~ : .• : _:..- ....~~-I~ .. -' .-'. ~'~,--,'" ..-..,.. ":',' .- - -!:.. '-:~'~-:~~ . - . , '. : ... :,r WELLSFARGO&COMPANYANDSUBSID~ES"" 1;"~......iP."-~J ,r----. .' WELLS FARGO &COMPANVANnSUBSiDiARiES·. ...".-i .. _, " .', ~ ,'.:. __ ~~.'~:-I
NOTE 7PREFERRED STOCK
NOTESEMPLOYEE STOCK PLANS AND COMMON STOCK
Number ofsharesEquity Incentive Plan Other Plans
1985 1984 1985 1984
Options outstanding, beginning ofyear 232,860 141,360 125,717 188,100Granted 137,500 146,000Cancelled (6,900) (24,9°°)Forfeited (as defined below) (10,918) (6,428) (50,822) (50 ,712)Exercised (53,868) (23,172) (17,378 ) (11,671)
Options outstanding, end ofyear 298,674 232,860 57,517 125,717
Options exercisable, end ofyear 77,074 54,010 57,517 125,717Shares available for grant, end ofyear 145,131 316,968Price range ofoptions:
Outstanding $18.88-$59.13 $18.88-$36·75 $26.25-$28.13 $24·88-$28.13Forfeited (as defined below) or exercised $18.88-$36·75 $18.88-$18.88 $24·88-$28.13 $20.25-$28.13
1,835,0831,013,846
867,503640,6214°0,000392,317215,058114,79239,22715,9478, 209
5,542,60323,318,086
21,139,311
5°,000,000
Number of shares
Warrants to purchase a total ofu4,792 shares of commonstock of the Company at a price of$24.63 per share,attached to Euro Deutsche Mark Debentures, are currentlydetachable and expire on October 31, 1988.
Under the terms ofmandatory convertible debt, theCompany must exchange with the note holder or sellvarious capital securities of the Company as described innote 6 to the financial statements on page 33.
Tax advantage plqnDividend reinvestment planEmployee stock purchase planEquity incentive planStock option and appreciation planRestricted share rights planStock option planWarrantsEmployee stock ownership plan31;"% convertible capital notesStock bonus plan
Thtal shares reservedShares not reservedShares issued and outstanding
Thtal shares authorized
COMMON STOCK The following table summarizes common stock reserved and authorized as of December 31, 1985:
92,136
(78,193)
Number ofoptions
95,401(3,549)
(Current (Formerplan) plan)
91,85268,580(13,372)
(82,497)
64,563
(Currentplan)
Options outstanding, beginningof year
GrantedCancelledExercised ($34.18 in 1985 and
$3°.56 in 1984)
Options outstanding, end ofyear
Options available for grant, endofyear
NOTE 9EMPLOYEE BENEFITS
stock represented by the fmal share rights held by each person five years after the tentative share rights were granted.
Loans, at the discretion of the Company, may be madeto assist the participants of the ElP and Other Plans in theacquisition of shares under options and share rights. Theamount of expense accrued for the ElP and Other Plans was$8.3 million, $4.9 million and $8.2 million in 1985, 1984 and1983, respectively.
Employee Stock Purchase Plan At the Ig84 annualmeeting, the stockholders approved the current stock purchase plan, effective August I, 1984, to replace the formerplan which expired on July 31, 1984. The current plan isessentially the same as the former plan and options may begranted for up to 950,ooo shares. Under the plan, employeesof the Company with over one year of service, except certain key employees, are eligible to participate. The planprovides for an option price of the lower of market value atgrant date or 85-100 percent (as determined by the Boardof Directors for each option period) of fair market value atthe end ofthe option period, 12 months after the date ofgrant. For the current option period, the Board approved a:closing option price of 85 percent of fair market value. Theplan is noncompensatory and results in no expense to theCompany.
Transactions involving the Employee Stock PurchasePlan are summarized as follows:
issuable under the EIP cannot exceed 750,000 in the aggregate and 250,000 in anyone calendar year. The Board ofDirectors has approved, subject to stockholder approval, anamendment to the EIP which would increase such limits to1,750,000 and 350,000, respectively.
Other Plans In conjunction with the adoption of theElF, the Other Plans have been amended such that no additional awards or grants will be issued. In addition, existingshares in the Other Plans may be converted to incentivestock option status in accordance with current tax laws.
Transactions involving options of the EIP and OtherPlans are summarized as follows:
The dividend rate through the dividend period endingMarch 31, 1984 was 10% per annum. For each quarterlyperiod thereafter, the dividend rate is 2.75% less than thehighest of the three-month Treasury bill discount rate,lO-year constant maturity bond yield or 20-year constantmaturity bond yield, but limited to a minimum of6% and amaximum Of12% per annum. The average dividend ratewas 8.5% during 1985 and 10.1% during 1984.
All preferred shares rank senior to common sharesboth as to dividends and liquidation but have no generalvoting rights.
EMPLOYEE STOCK PLANS In 1982, the Wells Fargo &Company Equity Incentive Plan (EIP) replaced the StockOption Plan, Stock Option and Appreciation Plan and theRestricted Share Rights Plan (Other Plans) as a means forthe future granting ofstock options and restricted sharerights to key employees.
Equity Incentive plan The EIP provides for thegranting to key employees incentive stock options, nonqualified stock options as defined under current tax lawsand restricted share rights. The options may be exercisedfor periods ofup to 10 years, at the fair market value at timeofgrant. The total number ofshares of common stock
In 1983, the Company issued 3,000,000 shares ofAdjustableRate Cumulative Preferred Stock, Series A, with a statedvalue of$50.00 per share. These shares are redeemablebetween April 1, 1988 and March 31, 1993, at the option ofthe Company at a redemption price of$51.50 per share and,thereafter, at $50.00 per share plus accrued and unpaiddividends.
Dividends are cumulative and payable quarterly onMarch 31, June 30, September 30 and December 31 ofeach year.
The provisions for the retirement and profit sharing planswere as follows:
Year ended December 31,
The terms of the EIP and the Other Plans provide that,when the option becomes exercisable, the optionee maysurrender or forfeit the option and receive the appreciationbetween the option price and the fair market value of thestock at date of surrender in the form of cash and commonstock, provided that at least 50 percent of the appreciationbe in shares of the Company's common stock based on themarket price at date of surrender.
As of December 31, 1985, the EIP had 176,205 tentative
share rights and 34,050 final share rights outstanding to 278employees and the Other Plans had 53,315 fmal share rightsoutstanding to 47 employees under the restricted sharerights provisions ofthese plans. The tentative share rightsconvert into final share rights during the second quarter ofthe third year after the rights are granted. The number offinal shares is based on the Company's performance in thethree years following the date ofgrant. The holders of theshare rights are entitled to the number ofshares of common
(in thousands)
Retirement plans
Profit sharing plan
$ 20,897
$ 9,013
$ 9,742
$ 7,93°
$ 16,542
$ 6,886
RETIREMENT PLANS Effective December 31, Ig84, theCompany terminated the noncontributory, defined benefitretirement plan, which covered substantially all employees.Pension costs under that plan were actuarially computedand were funded as accrued. Prior to termination, certainplan benefits were increased to the extent of plan assets.As a result, no gain or loss arose from the termination.However, this former plan was overfunded at mid-lg84;therefore, no retirement plan expense accrual or contribution was necessary for the last halfof!g84·
34 35

· : -- ",.-c:;a.- : .. -:-, -'~ :-'0": ... . '. J -I ".. '.' -:.. ' .-- ':~-J!I~WELLS FARGO & COkANY AND SUBSIDIARiES ' . . " ' .... , . . ~L'LS FARGO & C'oMP~'AND SUBSIDIARIES
"'P;:j__ . .• .oJ-._· ~_, "
NOTE 10INCOME TAXES
The deferred tax provisions are the result of certainitems being accounted for in different time periods forfinancial reporting purposes than for income tax purposes.
The components of the deferred income tax provisionsand the tax effect of each were as follows:
Defen-ed income on lease financing $103,640 $ 63,948 $46,202Lower loan loss deduction for income
tax purposes (86,866) (24,571) (2,J93)Cash basis accounting for tax purposes 19.457 (5,134) 7,206Realization oflosses (gains) on sales of
equity investments (7.423) 24 2 (650)Foreign exchange (2,872) 8,240 (2,692)Other 3,471 ~ 2,080
Total $ 29.407 .'I> 44,135 $49,953
36
Additionally, the Company is subject to indirect taxationbecause it must maintain noninterest-earning reserves withthe Federal Reserve Bank. These reserves generate revenuefor the Federal Reserve which, net of expenses, is turnedover to the U.S. Treasury. The Company has estimated theamount of this indirect tax based upon its average fundsborrowed rate and the average noninterest-earning reservebalances. While no single method ofdetermination canprecisely quantify this additional federal tax burden, theCompany believes the foregoing method is reasonable.
If the effects of tax-exempt financing and reserverequirements had been included in the Company's incomestatement and tax provision, the effective income tax ratewould have been 45% in 1985,1984 and 1983.
Following is a reconciliation of the statutory federalincome tax expense and rate to the effective income taxexpense and rate:
37
(in thousands) Year ended December 31,
1985 1984 1983Amount Percent Amount Percent Amount Percent
Statutory federal income tax expense and rate $ 138,153 46.0% $ 119,107 46.0% $ 105,659 46.0%Increase (decrease) in tax rate resulting from:
(1l,991) (5. 2)Tax exempt income (16,610) (5·5) (14,672) (5.7)State and local taxes on income, net offederal income tax benefit 12,890 4·3 10,819 4. 2 11,268 4·9Capital gain rate difference (7,044) (2.4) (1,806) (.7) (4,252) (1.9)Amortization of investment tax credit (6,601) (2.2) (5,665) (2.2) (7,009) (3.1)Indefinitely reinvested earnings of foreign subsidiaries and
(13,299) (5.8)an affLIiate (6.430) (2.1) (15,948) (6.2)Investment tax credit on furniture and equipment (4,551) (1.5) (3,168) (1.2) (4,655) (2.0)Other 491 .1 996 _-4_ (928) ..J.:JL--
Effective income tax expense and rate $ 110,298 36.7% $ 89,663 34.6% $ 74,793 32.6%
The Company had deferred income taxes payable of$186.2 million, $195.3 mmion and $163.0 million at December 31, 1985, 1984 and 1983, respectively. It had currentincome taxes payable (receivable) of$(6.6) million,$9.5 million and $(1.1) million at the same dates.
The Company has not provided federal taxes on$124.5 million of undistributed earnings ofa foreign subsidiary and an affiliate, because the earnings are indefinitelyreinvested in those companies. If the earnings were distributed to the Parent, federal taxes on them, less credit forforeign taxes, would be provided at that time.
In management's opinion, the effective income tax rate isnot indicative ofthe Company's true economic tax burden.
The Company acts as an intermediary for tax incentivesbetween the U.S. Government and certain recipients identified by Congress. These incentives are primarily intendedto be indirect subsidies to state and local governments aswell as to benefit companies that cannot directly utilizesuch incentives. Because interest income from state andlocal obligations is exempt from federal income tax, theCompany is able to accept lower yields on these obligations,thereby providing lower borrowing costs to the issuers. Hadthese obligations been taxable, the Company would nothave been able to reduce the interest rates to these borrowers and, thus, would have reported additional interestincome and paid additional tax. Similarly, the Company, byutilizing the tax incentives ofownership, is able to offerlower cost lease financing to businesses through the reduction of rental payments from lessees. Such tax incentiveslower the Company's effective income tax rate, but asubstantial portion of the benefit oflower taxes is passedon to the Company's customers and to publicly supportedborrowers.
Amounts for the current year are based upon estimatesand assumptions as ofthe date of this report and could varysignificantly from amounts shown on the tax returns asfiled. Accordingly, the variance from the amounts previously reported for prior years are primarily the result ofadjustments to conform to the tax returns as flied.
Year ended December 31,(in thousands)
decides not to fund the contribution for 1985, this accrualwill be reversed with an offsetting increase to income taxexpense. The decision will be made by the time the Company files its 1985 tax return. For 1984, $1.3 million ofemployee benefit expense was accrued. The credit was notfully utilized in 1984 and is part ofa credit carryforward forsubsequent years. The 1983 plan year's tax credit was notutilized as a reduction of the Company's federal tax liability.Therefore, the $1.4 million of employee benefit expenseaccrued in 1983 was subsequently reversed in 1984.
RETIREE HEALTH AND LIFE INSURANCE In addition to providing pension benefits, the Company providescertain health care and life insurance benefits for retiredemployees. The Company reserves its right to terminatethese plans at any time, but if they continue in effect, substantially all of the Company's salaried employees maybecome eligible for these benefits if they reach retirementage while working for the Company. The health care andsimilar benefits for active and retired employees are selffunded by the Company or provided through federallyqualified Health Maintenance Organizations (HMO'S). TheCompany recognized the cost ofhealth care benefits byexpensing the annual incurred claims and HMO premiumstotaling $20.7 million and $19.2 million in 1985 and 1984,respectively. The life insurance and similar benefits foractive and retired employees are provided through an insurance company whose premiums are based on the benefitspaid during the year. The Company recognizes the costof these benefits by expensing the annual insurance premiums, which were $·9 million in 1985 and $.7 million in1984· The cost of providing health and life insurance benefits for 2,438 retirees is not separable from the cost of providing benefits for approximately 14,400 active employees.
Current and deferred income tax provisions were asfollows:
Effective January 1, 1985, the Company adopted a definedcontribution retirement plan with Company contributionsbased on a percentage of employee compensation. The plancovers employees with one year ofservice and contains avesting schedule graduated from 3-10 years of service.
Also effective January 1, 1985, the Company amendedthe Tax Advantage Plan (TAP) to allow the Company tomake retirement contributions without a requirement foremployee contributions. All salaried employees with oneyear ofservice are eligible to receive these Company contributions, which are immediately vested. The Company alsomakes matching contributions to TAP that are included inprofit sharing plan expense.
PROFIT SHARING PLAN All salaried employees whohave one year of service are eligible to contribute to TAPthrough salary reduction under Section 40l(k) of the Internal Revenue Code. The Company makes matching contributions for those who have three years of service and whoelect salary reduction contributions under the plan. Thecontributions are immediately vested. Company contributions are tax deductible by the Company.
EMPLOYEE STOCK OWNERSHIP PLAN Under theEmployee Stock Ownership Plan (ESOP), the Company isallowed to mal<.e certain reductions in its federal income taxpayments if the savings are passed to the plan. All salariedemployees of participating Wells Fargo companies who haveworked for three continuous years are eligible to participate.
Effective with the 1984 contribution, the ESOP wasamended by the Company to remove the requirement thatthe Company must receive a tax benefit for the contribution. For 1985, approximately $1.5 million ofemployee benefit expense was accrued for the ESOP If the Company
(in thousands) Year ended December 31.
1985 1984 1983
Current:Federal $ 28,258 $ 5,383 $ 1,502State and local 26,150 20,623 9,956Foreign 26,483 19,522 13,382
80,891 45,528 24,840Deferred:
Federal 31,912 45,875 39,599State and local (2,387) (565) 11,166Foreign (n8) (1,175) (812)
29,407 44,135 49,953Total $ 110,298 $ 89,663 $ 74,793
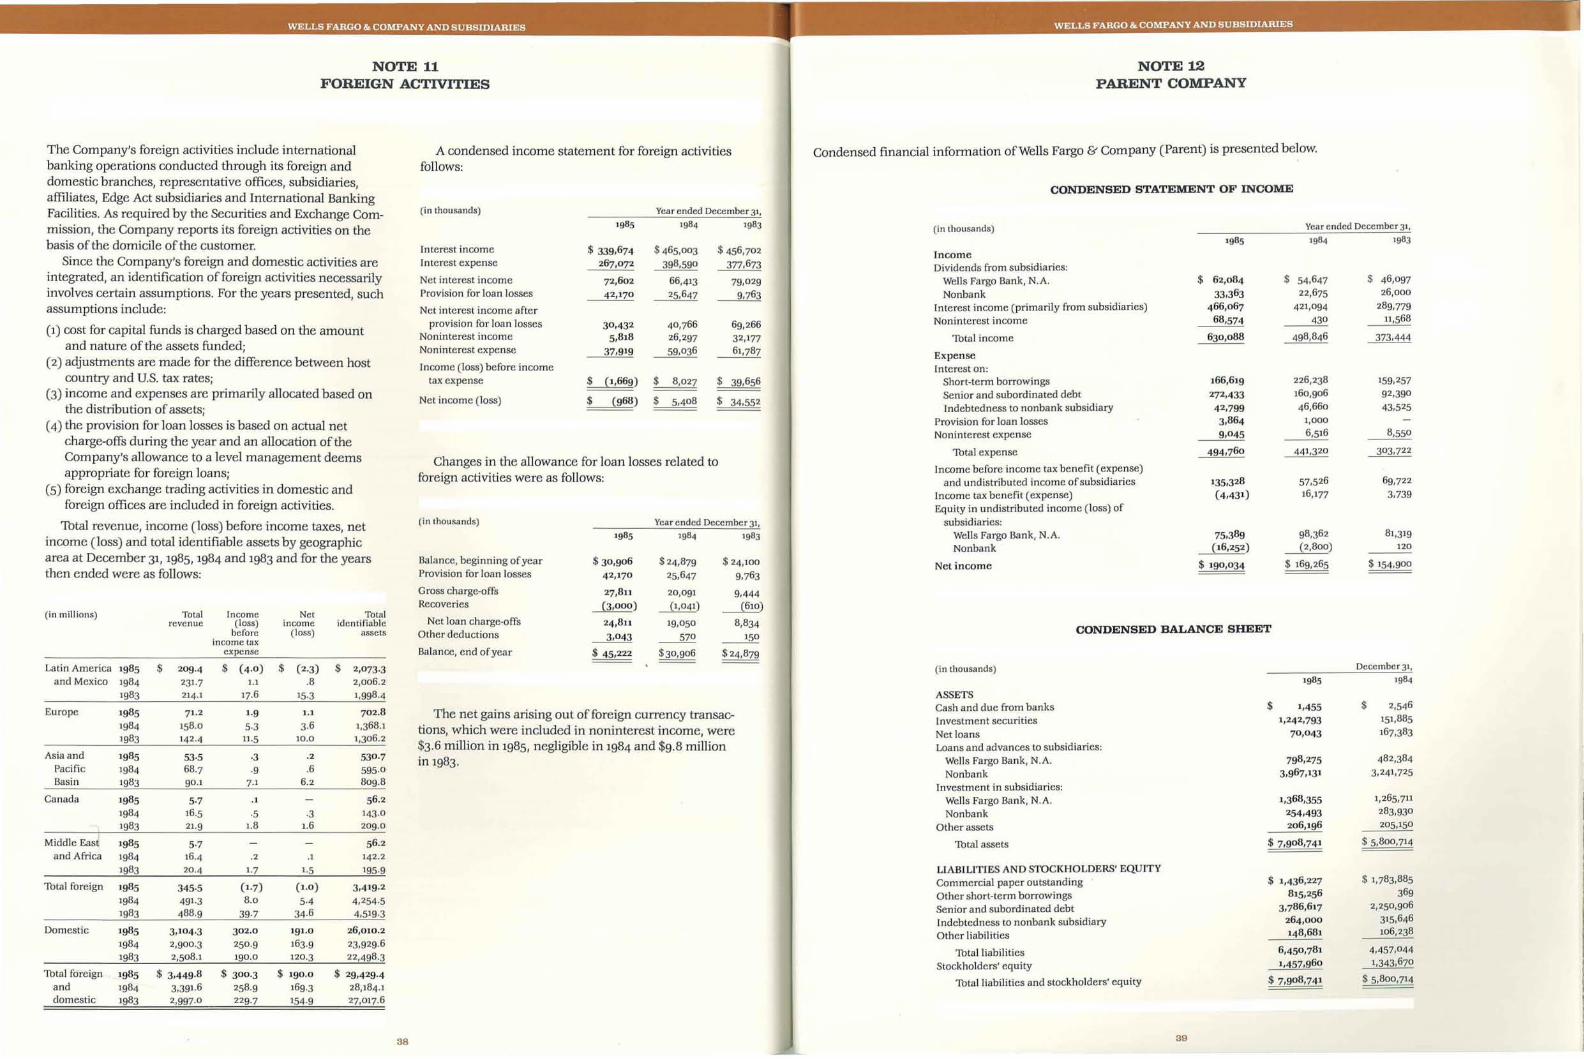
...~ ;;0.- - WELLS FARGO & COMPANY AND SUB~IDIARIES • • _ '. _ '. _-:-...~J-, ., WELL~ FARGO & COMPANY AND SUBSIDIARIES .
NOTE 11FOREIGN ACTIVITIES
NOTE 12PARENT COMPANY
The Company's foreign activities include internationalbanking operations conducted through its foreign anddomestic branches, representative offices, subsidiaries,affiliates, Edge Act subsidiaries and International BankingFacilities. As required by the Securities and Exchange Commission, the Company reports its foreign activities on thebasis of the domicile of the customer.
Since the Company's foreign and domestic activities areintegrated, an identification offoreign activities necessarilyinvolves certain assumptions. For the years presented, suchassumptions include:
(1) cost for capital funds is charged based on the amountand nature of the assets funded;
(2) adjustments are made for the difference between hostcountry and U.S. tax rates;
(3) income and expenses are primarily allocated based onthe distribution of assets;
(4) the provision for loan losses is based on actual netcharge-offs during the year and an allocation of theCompany's allowance to a level management deemsappropriate for foreign loans;
(5) foreign exchange trading activities in domestic andforeign offices are included in foreign activities.
Thtal revenue, income (loss) before income taxes, netincome (loss) and total identifiable assets by geographicarea at December 31, 1985, 1984 and 1983 and for the yearsthen ended were as follows:
CONDENSED BALANCE SHEET
CONDENSED STATEMENT OF INCOME
Condensed financial information ofWells Fargo & Company (Parent) is presented below.
December 31,1985 1984
$ 1.455 $ 2,546
1,242,793 151,885
7°,043 167,383
798,275 482,3843,967,131 3,241,725
1,368,355 1,265,711
254.493 283,930
206,196 205,150
$ 7,9°8,741 $ 5,800,714
$ 1.436,227 $ 1,783,885815,256 369
3,786,617 2,250,906
264,000 315,646148,681 106,238
6.45°,781 4.457,044
1.457,960 1,343,670
$ 7,9°8,741 $ 5,800,714
LIABILITIES AND STOCKHOLDERS' EQUITYCommercial paper outstandingOther short-term borrowingsSenior and subordinated debtIndebtedness to nonbank subsidiaryOther liabilities
ThtalliabilitiesStockholders' equity
Total liabilities and stockholders' equity
39
ASSETSCash and due from banksInvestment securitiesNet loansLoans and advances to subsidiaries:
Wells Fargo Bank, N.A.Nonbank
Investment in subsidiaries:Wells Fargo Bank, N.A.Nonbank
Other assets
Thtal assets
(in thousands)
(in thousands) Year ended December 31,
1985 1984 1983
IncomeDividends from subsidiaries:
Wells Fargo Bank, N.A. $ 62,084 $ 54,647 $ 46,097
Nonbank 33,363 22,675 26,000
Interest income (primarily from subsidiaries) 466,067 421,094 289,779
Noninterest income 68,574 430 11,568
Thtal income 630 ,088 498,846 373,444
ExpenseInterest on:
Short-term borrowings 166,619 226,238 159,257
Senior and subordinated debt 272,433 160,906 92,390
Indebtedness to nonbank subsidiary 42,799 46,660 43,525
Provision for loan losses 3,864 1,000
Noninterest expense 9,045 6,516 8,550
Thtal expense 494,760 441,320 303,722
Income before income tax benefit (expense)and undistributed income of subsidiaries 135,328 57,526 69,722
Income tax benefit (expense) (4,431) 16,177 3,739Equity in undistributed income (loss) of
subsidiaries:Wells Fargo Bank, N.A. 75,389 98,362 81,319
Nonbank (16,252) (2,800) 120
Net income $ 19°,°34 $ 169, 265 $ 154,900
(in thousands) Year ended December 31,1985 1984 1983
Interest income $ 339,674 $ 465,003 $ 456,702Interest expense 267,°72 398,590 377,673
Net interest income 72,602 66.413 79,029Provision for loan losses 42,17° 25,647 9,763
Net interest income afterprovision for loan losses 30,432 40,766 69,266
Noninterest income 5,818 26,297 32,177Noninterest expense 37,919 59,036 61,787
Income (loss) before incometax expense $ (1,669) $ 8,027 $ 39,656
Net income (loss) $ (968) $ 5.408 $ 34.552
A condensed income statement for foreign activitiesfollows:
(in thousands) Year ended December 31,1985 1984 1983
Balance, beginning ofyear $ 30,9°6 $ 24,879 $ 24,100Provision for loan losses 42,170 25,647 9,763
Gross charge-offs 27,811 20,091 9.444Recoveries (3,000) ~ ~)
Net loan charge-offs 24,811 19,°50 8,834Other deductions 3,043 ~ ~Balance, end ofyear $ 45,222 $30,906 $24,879
The net gains arising out of foreign currency transactions, which were included in noninterest income, were$3.6 million in 1985, negligible in 1984 and $9.8 millionin 1983.
Changes in the allowance for loan losses related toforeign activities were as follows:
Total Income Net Totalrevenue (loss) income identifiable
before (loss) assetsincome tax
expense
1985 $ 209.4 $ (4.0) $ (2·3) $ 2,073·31984 231.7 1.1 .8 2,006.21983 214.1 17.6 15·3 1,998-4
1985 71.2 1·9 1.1 702.81984 158.0 5·3 3.6 1,368.11983 142.4 11·5 10.0 1,306.2
1985 53·5 ·3 .2 530.71984 68·7 ·9 .6 595·01983 90.1 7.1 6.2 809.8
1985 5·7 .1 56.2
1984 16·5 ·5 ·3 143·01983 21.9 1.8 1.6 209.0
1985 5·7 56.2
1984 16-4 .2 .1 142.21983 20-4 1.7 1.5 195·9
1985 345·5 (I.7) (1.0) 3.419. 21984 491.3 8.0 5·4 4,254·51983 488·9 39·7 34.6 4,519.3
1985 3,104.3 3°2.0 191.0 26,010.2
1984 2,9°0.3 250.9 163.9 23,929.61983 2,508.1 190.0 120·3 22.498.3
1985 $ 3.449.8 $ 300·3 $ 190 .0 $ 29.429.41984 3,391.6 258.9 169.3 28,184.11983 2,997.0 229·7 154·9 27,017.6
38
Europe
Asia andPacificBasin
Latin Americaand Mexico
Domestic
(in millions)
Middle Eas~and Africa
Canada
Thtal foreign
Thtal foreignanddomestic

. - -. ... - - - --=-...... ~-----
; . -WELLSFAR~&COMPANYAN;~UB;Ii!:..~ES' __ .. _ • p. .- ..
NOTE 14LEASE COMMITMENTS
The Company has lease arrangements primarily for theuse of real property. These leases do not contain restrictiveclauses concerning dividends, debt financing or furtherleasing, nor do they generally involve contingent rentalsor bargain purchase options.
The Company is obligated under a number of noncancelable operating leases for premises and equipmentwith terms ranging from 1-35 years, many ofwhich providefor periodic adjustment ofrentals based on changes invarious economic indicators. Future minimum paymentsunder capital leases and noncancelable operating leaseswith terms in excess of one year as of December 31, 1985are as follows:
$ 17,61 4 $ 43.45517,501 35,09617.400 31,25217,317 26,71717,247 22,6g8
224,273 71,648
311,352 $ 230,866
(51,455)(162,542)
$ 97,355
CONDENSED STATEMENT OF CHANGES IN FINANCIAL POSITION
(in thousands) Year ended December 3'.Ig8S 1984 1983
Financial resources provided by (applied to):Operations:
Net income $ Igo,034 $ 16g. 265 $ 154,gooNoncash charges (credits):
Provision for loan losses 3,864 1,000Defen'ed income tax expense 22,012 20,602 (2,099)Equity in undistributed income
ofsubsidiaries (59,137) (95,562) (81,439)Financial resources provided by operations 156,773 95,3°5 71,362
Cash dividends declared (65.779) (63,138) (58,878)Net financial resources provided by operations 90,994 32,167 12,484Other financing activities:
Short-tenn borrowings 467,229 71,604 224,760Senior and subordinated debt 1,535,711 1,19°,291 15°, 215Indebtedness to nonbank subsidiary (51,646) 3°,273 12,°91Common stock repurchased, net ofissued (12,190) (108,241) 7,528Preferred stock issued, net of issuance costs 146,200
Financial resources provided by other financingactivities 1,939,104 1,183,927 54°,794
Other activities-(increase) decrease in netnonearning assets:
Cash and due from banks 1,Og1 (1,425) (319)Investment in subsidiaries (14,070) (138,7°9) (23,788)Other, net 21,610 (105,32°) 56,86g
Financial resources provided by (applied to)net nonearning assets 8,631 (245,454) 32,762
Increase in financial resources invested inearning assets $ 2,038,729 $ 97°,640 $586,040
Increase (decrease) in earning assets:Investment seclllities $ 1,°9°,9°8 $ 68,352 $ 72,°39Net loans (93,476) 81.457 85,38gLoans and advances to subsidiaries 1,041,2g7 820,831 428,612
Increase in earning assets $ 2,038,729 $ 970,640 $ 586,040
(in thousands)
Year ended December 31,1986198719881989199°Thereafter
Tbtal minimum lease payments
Executory costsAmounts representing interest
Present value ofnet minimumlease payments
Capital leases Operating leases
Net rental expense for all operating leases was $46-4 million, $43-4 million and $47.7 million ~or the years endedDecember 31,.1985, 1984 and 1983, respectively.
The Parent had available lines of credit supporting commercial paper borrowings and similar arrangements withunaffiliated banks totaling $480 million and $680 million at
December 31, 1985 and 1984, respectively. The lines of creditrequire commitment fees or compensating balances, whichwere not significant.
NOTE 15COMMITMENTS AND CONTINGENT LIABILITIES
NOTE 13LOANS TO RELATED PARTIES
Certain directors and executive officers ofthe Company,certain entities to which they are related and their relativeswere loan customers of the Company during 1985 and 1984.Substantially all such loans were made by the Bank in theordinary course ofbusiness at the Bank's normal credit
40
terms, including interest rate and collateralization, andnone represent more than a normal risk ofcollection. Suchloans were $142-4 million at December 31,1985 and $60.7million at December 31, 1984. During 1985. additional loansmade were $1l2.6 million and payments received were$30.9 million.
In the normal course ofbusiness there are various commitments outstanding and contingent liabilities, such as foreignexchange contracts, letters of credit and commitments toextend credit, which are not reflected in the accompanyingfinancial statements. No material losses are anticipated bymanagement as a result of these commitments.
At December 31, 1985, the Company had outstandingcommitments under standby letters of credit and guarantees totaling $1.3 billion. This amount includes $.2 billion ofparticipations purchased and is net Of$.l billion of participations sold.
41
Actions are pending against the Company in which therelief or damages sought are very substantial. In addition,the Company is at all times subject to numerous pendingand threatened legal actions and proceedings arising in thenormal course ofbusiness. After reviewing with counselpending and threatened actions and proceedings, management considers that the outcome of such actions or proceedings will not have a material adverse effect on stockholders' equity of the Company.
· I--~-P- -"T-"'-; " • -.... , I
WELLS FARGO & COMPANY AND SUBSIDIARIES _ ~ -- .".' .w', ! ',;. 'WELLS"F~GO~COMPANYANDSUBSIDIARIES
NOTE 16SUBSEQUENT EVENT ACCOUNTANTS'REPORT
The pro forma net income of $192 million consists of1985net income ofthe Company and Crocker of $190 millionand $38 million, respectively, less a pro forma net expenseof $36 million. The pro forma net expense includes amortization of $11 million relating to an estimated $270 millionexcess purchase price over fair value of Crocker's net assetsacquired (goodwill).
and liabilities at December 31,1985. Such preliminary estimates and assumptions are subject to change as additionalinformation is obtained. Purchase adjustments will be madeon the basis ofestimates, appraisals and evaluations as ofthe date of closing and, therefore, will differ from thosereflected below.
Because the pro forma income statement is based onhistorical data, the Company believes that it is not necessarily indicative of the effects which the proposed acquisition will have on the results of operations of the Companyin the future. The Company believes that such results willbe affected, in particular, by the effects of the sale ofsubstantially all of Crocker's international business and certaindomestic assets to Midland; operating efficiencies and costreductions which may be achieved following the proposedacquisition; the Company's intention to reduce the assetsize of the resulting entity; and certain tax benefits whichmay accrue to the Company. The pro forma income statement does not include the effects of the foregoing factorssince they cannot be estimated as of February 18, 1986.
Following is the unaudited pro forma condensedcombined income statement for 1985 of the Companyand Crocker as though the acquisition had occurred onJanuary 1, 1985:
On February 7,1986, the Company entered into a definitivestock purchase agreement (Purchase Agreement) withMidland Bank pIc (Midland) and certain Midland affiliatesproviding for the acquisition by the Company ofall theissued and outstanding common stock of Crocker NationalCorporation (Crocker). On the basis of assets of $19.2 billionas ofDecember 31, 1985, Crocker was the 25th largest bankholding company in the United States. It is anticipated thatCrocker's wholly·owned subsidiary, Crocker National Bank,will be combined with Wells Fargo Bank, N.A. and operatedunder the Wells Fargo Bank name.
The base purchase price is $1,080 million and is subjectto certain adjustments. Subject to receipt of appropriate regulatory and shareholder approvals, and the fulfillment ofcertain conditions, the acquisition is expected to close in1986. There is no assurance as to when or whether suchapprovals will be obtained and, if obtained, as to what, ifany, conditions or restrictions might be imposed. The Purchase Agreement may be terminated by either party if thetransaction has not closed on or before December 31, 1987and in certain other circumstances,
The purchase price is payable in cash and, at the Company's election, common stock of the Company, providedthat the number of shares issued to Midland may notexceed the greater of (1) 4.9% of the total number of sharesof common stock outstanding at closing of the proposedacquisition (giving effect to the issuance of common stockto Midland) or (2) that number of shares of common stockwhich has an aggregate value of$75 million.
Th meet the requirements for additional primary capitalin connection with the proposed acquisition, the Companyexpects to issue approximately $300 million of commonstock, including the stock that may be issued to Midland,approximately $250-$350 million of preferred stock andup to approximately $500 million ofdebt securities. Theamount of equity and debt securities to be issued maychange depending on specific plans developed for integrating Crocker's assets as well as on market conditions.
The acquisition will be accounted for as a purchase transaction. Accordingly, the results of operations of Crocker willbe included with that of the Company for periods subsequent to the date ofacquisition.
The following unaudited pro forma condensed combinedincome statement shows the pro forma effect of the proposed acquisition of Crocker on the historical incomestatement of the Company. This statement is based on information available to the Company as ofFebruary 18,1986 aswell as on the Securities and Exchange Commission's rulesand regulations.
The unaudited pro forma condensed combined incomestatement is based upon the audited income statements ofthe Company and Crocker for the year ended December 31,1985. Purchase accounting adjustments have been made,based upon preliminary estimates and assumptions, toreflect estimated fair values with respect to Crocker's assets
42
(in millions)
Net interest incomeProvision for loan losses
Net interest income after provision for loan lossesNoninterest incomeNoninterest expenseIncome tax expense
Income before extraordinary itemExtraordinary item - tax benefit of loss carryforward
Net income
Year endedDecember 31,1985
$ 1,879
~1,397
6231,729
108
183__9
$ 192
The Board of Directors and Stockholders ofWells Fargo& Company:
We have examined the consolidated balance sheet ofWellsFargo & Company and Subsidiaries as of December 31,1985and 1984 and the related consolidated statements of income,changes in stockholders' equity and changes in financialposition for each of the years in the three-year period endedDecember 31,1985. Our examinations were made in accordance with generally accepted auditing standards and,accordingly, included such tests ofthe accounting recordsand such other auditing procedures as we considerednecessary in the circumstances.
In our opinion, the aforementioned consolidated fmancialstatements present fairly the financial position ofWellsFargo & Company and Subsidiaries at December 31, 1985and 1984, and the results'of their operations and changes intheir financial position for each of the years in the threeyear period ended December 31, 1985, in conformity withgenerally accepted accounting principles applied on aconsistent basis.
Peat, Marwick, Mitchell & Co.Certified Public Accountants
San Francisco, CaliforniaJanuary 20, 1986, except as to note 16,which is as of February 18,1986
43

- -----=-=---~ ---- - -- .-oJ _.11 • _'. •
~_,--t_ _.
SUPPLEMENTAL QUARTERLY AND ANNUALFINANCIAL DATA
CONDENSED CONSOLIDATED STATEMENT OF QUARTERLY INCOME FINANCIAL REPORTING AND CHANGING PRICES
SUPPLEMENTARY FIVE-YEAR COMPARISON OF SELECTED
FINANCIAL DATA ADJUSTED FOR THE EFFECTS OF CHANGING PRICES
As required by FASB Statement No. 33/ "Financial Reportingand Changing Prices," the Company has provided supplemental information concerning the effects of changingprices on its financial statements.
The following data were calculated by adjusting certainhistorical cost information - premises and equipment and
The principal difference between 1985 net income asdetermined on the historical cost/constant dollar basis($134.0 million) and net income as reported in the financialstatements ($190.0 million) is additional depreciation andamortization expense in the historical cost/constant dollarpresentation ($56.0 million) caused by increasing the valueof premises and equipment before computing depreciationexpense thereon. It should be noted that the accountingprinciples involved do not change under historical cost/constant dollar assumptions; only the unit ofmeasurechanges under this concept. Restatement based on cur-rent cost/constant donal' data has been omitted becausethere is no material difference from historical cost/constantdollar data.
As specified by FASB Statement No. 33, no adjustmentsor allocations ofthe amount of income tax in the primaryfinancial statements were made in the computation ofthesupplemental infOlmation.
The Company believes that comparisons of price leveladjusted data are most meaningful when interpreted interms of trends and relationships among the periods. Man-
monetary assets and liabilities - by the average ConsumerPrice Index for All Urban Consumers (CPI) to reflectchanges in the general purchasing power of the dollar. Thisresults in historical cost/constant dollar amounts, which areintended to eliminate financial statement distortions causedby general inflation.
Year ended December 31,
1983 Ig82 Ig81
$ 857, 204 $ 787,367 $ 789,579II8,955 110,697 125,472
4.47 4. 64 5·39
24,261 23,733 57,251
2,021,573 1,797,293 1,744,929
2.14 2.14 2.27
42 29% 29 1,1,0
298-4 289·1 272-4
2.24
481hJ
311.1
$ 906,102128,286
5·00
28,120
1,956,498
agement believes that the effects of changing prices aremore appropriately measured through careful analysis ofliquidity management and interest-rate sensitivity as discussed in Management's Analysis of Financial Operationson pages 20 and 21. Management does not believe that therestatement of financial data based on changes in the CPIis necessarily indicative of the effects of inflation on fmancial institutions. The nature of the Company's operationsis such that there will always be an excess ofmonetaryassets over monetary liabilities. Therefore, this calculationwill always show a loss of purchasing power in periods ofprice increases.
How wen the Company copes with changing prices andfluctuating interest rates may also be assessed by analyzingits asset and liability structure. This is developed underAsset/Liability Management in Management's Analysis ofFinancial Operations on page 21. Additional insight can beobtained by reference to the rate/yield table on page 10.
The Company believes that such analysis is superior to amechanical restatement as specified by FASB StatementNo. 33.
1985
23,90 52,017,406
$ 848,423
'33,9575.68
Historical cost information adjusted for general inflation
Net interest income (after provision for loan losses) (1)Net incomeNet income per common share (2)Purchasing power loss on net monetary assets held during
the yearNet assets at year endOther information:
Cash dividends declared per common shareMarket price per common share at year endAverage consumer price index
(1) Net interest income is not presented on a taxable-equivalent basis.(2) Computed based on net income applicable to common stock.
(in thousands)(dollars expressed in average 1985 dollars)
(in thousands) 1985 1984Quarter ended Quarter ended
March 31 June30 Sept. 30 Dec. 31 March 31 June 30 Sept. 30 Dec. 31
Interest income $ 753,328 $ 761,882 $ 748 ,185 $ 753,552 $ 723,250 $ 776,IIO $ 808,688 $ 793,499Interest expense 475,599 462,612 448,408 447,294 484,100 509,983 539,363 518,059Amortized gain (loss) on interest rate hedging 9,347 8,229 12,065 7,584 (85) (1, 627) 5,259 15,890
Net interest income 287,°76 3°7,499 311,842 313,842 239,065 264,5°0 274,584 291,330Provision for loan losses 128,614 48,632 89,159 105,431 31,302 48,409 50,552 64,330
Net interest income after provision for loan losses 158,462 258,867 222,683 208,411 207,763 216,091 224,032 227,000
Noninterest income:Service charges on deposit accounts 25,766 27,693 27,205 28,330 23,384 23,632 23, 2°7 25,013Domestic fees and commissions 21, 607 '9,529 23,489 23,551 16,539 20,336 17,396 21,125Investment secUlities gains 3,747 1,750 29,625 20,349 420 416 187 1,999Trust and investment services income '3,'22 '3,371 14.415 14,224 14,890 1l,783 II,944 12,542Sale ofa mortgage banking subsidiary 50,152Other (1) 15,863 (2,504) 3,930 20,45° 9,559 II,619 9,817 14,821
Thtalnoninterest income 130,257 59,839 98,664 106,904 64,792 67,786 62,551 75,500Noninterest expense:
Salaries 104,39' 103,055 105,351 101,648 99,380 99.442 101,761 105,266Employee benefits 25,468 24,153 24,769 25,°78 24,°49 22,413 17,519 19,518Net occupancy 21,016 21,326 22,024 23,422 20,380 20,762 20,208 20,3°4Equipment 18,3
'5 19,348 18,235 20,°42 17,3°3 18,250 18,681 19,955
Other 57,180 7°,1°7 69,845 68,982 51,562 60,231 61,351 68,252
Thtal non interest expense 226,370 237,989 240,224 239,172 212,674 221,098 219,520 233,295Income before income tax expense 62,349 80,7
'7 81,123 76,143 59,881 62,779 67,063 69,205
Income tax expense '7,399 33,234 32,572 27,093 19,855 21,927 23,224 24,657Net income $ 44,950 $ 47,483 $ 48,55'
$ 49,050 $ 40,026 $ 40,852 $ 43,839 $ 44,548
Net income applicable to common stock $ 41,594 $ 43,977 $ 45,644 $ 46,03'
$ 36,276 $ 37,234 $ 39,826 $ 40,835
PER COMMON SHARENet income $ 1·95 $2·°5 $ 2.12 $ 2.18 $ 1.52 $1.63 $ 1.80 $ 1.92
Dividends declared $ .60 $ .60 $ .60 $ .68 $ ·54 $ ·54 $ ·54 $ ·54
(1) Amounts in 1985 include a total 01'$11.6 million in net closing costs associated with restructuring the Company's international activities, ofwhich $9.3 million wasrecognized in the second quarter.
44 45
DIRECTORS
WELLS FARGO & COMPANY
AND ITS PRINCIPAL SUBSIDIARY.WELLS FARGO BANK. N.A.
DIRECTORS EMERITI
WELLS FARGO BANK. N.A. WELLS FARGO & COMPANY
MANAGEMENT
WELLS FARGO BANK, N.A.
William R. Breuner
Retired Chairman of the BoardJohn Breuner Company(retailer ofhome furnishings)
James F. Dickason
Chairman ofthe BoardThe Newhall Land andFarming Company(agricultural, recreational,petroleum and land development)
James K. Dobey
Retired Chairman of the BoardWells Fargo & Company
Paul Hazen
President and Chief Operating Officer
Robert K. Jaedicke
DeanGraduate School of BusinessStanford University
Donald M. Koll
Chairman of the Board andChief Executive OfficerThe Kol1 Company(real estate development)
Mary E. Lanigar
Retired PartnerArthur Young & Company(certified public accountants)
RogerD. Lapham, Jr.
Chairman and Managing DirectorRama Corporation, Ltd.(investment and consulting)
Arjay Miller
Dean EmeritusGraduate School of BusinessStanford University
Paul A. Miller
Chairman of the Board andChief Executive OfficerPacific Lighting Corporation(natural gas holding company)
Robert T. Nahas
President, R.T. Nahas Company(real estate and construction)
Ellen M. Newman
President, Ellen Newman Associates(consumer relations consultants)
B. Regnar Paulsen
Retired Chairman of the BoardRice Growers Associationof California
Atherton Phleger
Partner, Brobeck, Phleger and Harrison,Attorneys at Law
Carl E. Reichardt
Chairman and Chief Executive Officer
Harry O. Reinsch
President, Bechtel Power Corporation(engineering, construction, managementofpower-generating facilities)
Donald B. Rice
President, The Rand Corporation(nonprofit research and analysis firm)
Wilson Riles
President, Wilson Riles & Associates, Inc.(education consultants)
Henry F. Trione
Chairman of the BoardGeyser Peak Winery(wine growers and vintners)
John A. Young
President, Hewlett-Packard Company(electronic equipment manufacturingand marketing)
46
W.P. Fuller III
Retired Vice PresidentWestern Region of PPG Industries(glass, paint and chemicals)
George S. Ishiyama
President, Ishiyama Corporation(raw materials exporting)
Edmund W. Littlefield
Chairman of the Executive CommitteeUtah International Inc.(mining and ocean shipping)
J.W. Mailliard III
Chairman of the Executive CommitteeBromar, Inc.(manufacturers' agents, importers andbrokers of food products)
Chairman and ChiefExecutive Officer
Carl E. Reichardt
President and ChiefOperating Officer
Paul Hazen
Executive Vice Presidents
Thomas H. BougheyR. Thomas DeckerRonald E. EadieGordon S. GroutJohn F. GrundhoferJack L. HancockE. Alan HolroydeRobert L. JossFrankN. NewmanClyde W. OstlerFredrick W. PetriDavid M. PetroneGuy Rounsaville, Jr.Dale R. WalkerWilliam F. Zuendt
ChiefFinancial Officer
Frank N. Newman
General Auditor
Clyde W. Ostler
ChiefCounsel and Secretary
Guy Rounsaville, Jr.
ChiefLoan Examiner
Douglas P. Holloway
Director ofTaxes
Alan C. Gordon
Treasurer
Alan J. Pabst
Controller
Frank A. Moeslein
Director ofInvestor Relations
Eric R. Durant
Director ofCorporate Communications
Lona L. Jupiter
Chairman and ChiefExecutive Officer
Carl E. Reichardt
President and ChiefOperating Officer
Paul Hazen
Commercial Banking Group
Charles M. JohnsonExecutive Vice President
Stephen G. CarpenterExecutive Vice President andSouthern California Division Manager
Consumer Operations andSystems Division
Barry E. YoungExecutive Vice President
Consumer Services Division
Jack KopecExecutive Vice President
Corporate Banking Group
R. Thomas DeckerExecutive Vice President
James C. FloodExecutive Vice President
Credit Policy Group
Gordon S. GroutExecutive Vice President
Finance Group
Frank N. NewmanExecutive Vice President
Funding Group
Thomas H. BougheyExecutive Vice President
International Banldng Group
Robert L. JossExecutive Vice President
47
Operations Group
E. Alan HolroydeExecutive Vice President
Real Estate Industries Group
Dale R. WalkerExecutive Vice President
Retail Banlcing Group
William F. ZuendtExecutive Vice President
Jerry A. GrundhoferExecutive Vice President
Strategy and Systems Group
Jack L. HancockExecutive Vice President
Trust and Investment Group
Robert L. JossExecutive Vice President
WELLS FARGO BANKGLOBAL FACILITIES
Subsidiaries
Wells Fargo Corporate Services, Inc.:
New York, Chicago, Atlanta, Dallas
Wells Fargo International Limited,
Cayman Islands
Branches
Hong KongJapan:'IbkyoKorea: SeoulNassau
Representative Offices
Argentina: Buenos AiresBrazil: Sao PauloMexico: Mexico CitySingaporeVenezuela: Caracas

THE INTERNATIONALADVISORY COUNCIL
, I I
: ,
,
, .
,, .
,,
,, .
,
,
,, :
,
..
.,
The Rt. Hon. Lord Sherfield,G.C.B., G.C.M.G.Retired Chainnan, Wells Fargo LimitedLondon, England
Dr. Saburo Okita
ChairmanInstitute for Domestic andInternational Policy StudiesTokyo, Japan
Roger D. Lapham, Jr.
DirectOl; Wells Fargo & CompanyChairman and Managing DirectorRama Corporation, LimitedParis, France
AdolfK.racht
PartnerBankhaus Merck, Finck and CompanyMunich, West Gennany
Edward Carlson
Chainnan EmeritusUAL, IncorporatedChicago, fllinois
Goran EnnerfeltPresident and ChiefExecutive OfficerA. Johnson & CompanyStockholm, Sweden
Angelo Calmon de Sa
President and ChiefExecutive OfficerBanco Economico, S.A.Salvador, Bahia, Brazil
Chairman:
William I. M. 'furner, Jr.
Chairman and ChiefExecutive OfficerConsolidated-Bathurst LimitedMontreal, Quebec, Canada
The International Advisory Council wasestablished in 1977 to provide adviceand counsel in the international sphereofbusiness ofWells Fargo Bank.
WELLS FARGO & COMPANYNONBANK SUBSIDIARIES
Wells Fargo Ag Credit
Englewood, ColoradoMichael J. Gillfillan, President
Wells Fargo Investment Advisors
San Francisco, CaliforniaFrederick L.A. Grauer, President
Wells Fargo Insurance Services/Central Western Insurance Company
San Francisco, CaliforniaJames G. Jones, President
Wells Fargo Business Credit
Dallas, TexasThomas D. Drennan, President
Wells Fargo Credit Corporation
Scottsdale, ArizonaLarry S. Crawford, President
Wells Fargo Capital Markets, Inc.
San Francisco, CaliforniaCharles A. Greenberg, President
Wells Fargo Leasing Corporation
San Francisco, CaliforniaTheodore J. Rogenski, President
Wells Fargo Realty Advisors
Los Angeles, CaliforniaFredrick W. Petri, President
Sir Campbell Fraser
ChairmanScottish Television P. L. C.London, England
Eugenio Garza-Laguera
Chairman ofthe BoardValores IndustrialesMonterrey, N.L., Mexico
Stock Exchange Listings
New York Stock ExchangeTrading Symbol: WFC
Pacific Stock ExchangeTrading Symbol: WFC
London Stock ExchangeFrankfurter Borse
Wells Fargo Realty Finance
San Francisco, CaliforniaGeorge A. Tillotson, President
Wells Fargo Securities ClearanceCorporation
New York, New YorkBarry X. Lynn, President
George S. Ishiyama
PresidentIshiyama CorporationSan Francisco, California
Ahmed Juffali
Managing DirectorE. A. Juffali & BrothersJedda, Saudi Arabia
The Rt. Hon. Lord Kadoorie, C.B.E., J.P.
Sir Elly Kadoorie and SonsHong Kong
48
Transfer Agent and Registrar of Stock
Manufacturers Hanover TrustCompany of California50 California StreetSan Francisco, California 94111
Co-Transfer Agent and Co-Registrar
Manufacturers Hanover TrustCompany of New YorkP.O. Box 24935, Church Street StationNew York, New York 10249
Notice to Shareholders
The annual meeting ofWells Fargo& Company will be held at 2 p.m.on 'fuesday, April 15, 1986 at 464California Street, San Francisco,California.
WFCo386B