Embed Size (px)
Citation preview

\ \
NREL/TP-432-4986 • UC Category: 350 • DE93000042
1980 Base Case and Feasibility Analysis
NAHB Research Center Upper Marlboro, MD
NREL technical monitor: Nancy Carlisle
�·� ... , •• 1!1=· ¥·,�--National Renewable Energy Laboratory (formerly the Solar Energy Research Institute) 1617 Cole Boulevard Golden, Colorado 80401-3393 A Division of Midwest Research Institute Operated for the U.S. Department of Energy Under Contract No. DE-AC02-83CH10093
Prepared under Subcontract No. HD-1-111 00-1
March 1993

NOTICE
This report was prepared as an account of work sponsored by an agency of the United States government. Neither the United States government nor any agency thereof, nor any of their employees, makes any warranty, express or implied, or assumes any legal liability or responsibility for the accuracy, completeness, or usefulness of any information, apparatus, product, or process disclosed, or represents that its use would not infringe privately owned rights. Reference herein to any specific commercial product, process, or service by trade name, trademark, manufacturer, or otherwise does not necessarily constitute or imply its endorsement, recommendation, or favoring by the United States government or any agency thereof. The views and opinions of authors expressed herein do not necessarily state or reflect those of the United States government or any agency thereof.
Printed in the United States of America Available from:
National Technical Information Service U.S. Department of Commerce
5285 Port Royal Road Springfield, VA 22161
Price: Microfiche A01 Printed Copy A03
Codes are used for pricing all publications. The code is determined by the number of pages in the publication. Information pertaining to the pricing codes can be found in the current issue of the following publications which are generally available in most libraries: Energy Research Abstracts (ERA); Government Reports Announcements and Index ( GRA and I); Scientific and Technical Abstract Reports (STAR); and publication NTIS-PR-360 available from NTIS at the above address.

I. l
l y '·
l I !
}
Table of Contents
1.0 INTRODUCTION 1
2.0 Overview . . . . . . . . . . . . . . . . . . . . . . . . . . . . . . . . . . . . . . . . . . . . . . . . . . . . . . . . . . 1
3.0 Base Case 1980 New Housing Characteristics . . . . . . . . . . . . . . . . . . . . . . . . . . . . . . . . . 3 3.1 General Characteristics . . . . . . . . . . . . . . . . . . . . . . . . . . . . . . . . . . . . . . . . . . . . . 3 3.2 Insulation . . . . . . . . . . . . . . . . . . . . . . . . . . . . . . . . . . . . . . . . . . . . . . . . . . . . . . 4 3.3 Windows . . . . . . . . . . . . . . . . . . . . . . . . . . . . . . . . . . . . . . . . . . . . . . . . . . . . . . 4 3.4 Heating and Cooling Equipment . . . . . . . . . . . . . . . . . . . . . . . . . . . . . . . . . . . . . . 6 3.5 Air Infiltration . . . . . . . . . . . . . . . . . . . . . . . . . . . . . . . . . . . . . . . . . . . . . . . . . . . 7
4.0 Base Case Energy Analysis . . . . . . . . . . . . . . . . . . . . . . . . . . . . . . . . . . . . . . . . . . . . . . 8 4. 1 Estimated Energy Consumption . . . . . . . . . . . . . . . . . . . . . . . . . . . . . . . . . . . . . . . 8 4.2 Estimated Heating Load . . . . . . . . . . . . . . . . . . . . . . . . . . . . . . . . . . . . . . . . . . . . 8
5.0 Potential Approaches to Achieving 50% Energy Savings . . . . . . . . . . . . . . . . . . . . . . . . . 10 5.1 Example: Washington, DC . . . . . . . . . . . . . . . . . . . . . . . . . . . . . . . . . . . . . . . . . . 12
6.0 Trend in Estimated Energy Use . . . . . . . . . . . . . . . . . . . . . . . . . . . . . . . . . . . . . . . . . . . 14
7.0 Conclusions . . . . . . . . . . . . . . . . . . . . . . . . . . . . . . . . . . . . . . . . . . . . . . . . . . . . . . . . 15
8.0 References . . . . . . . . . . . . . . . . . . . . . . . . . . . . . . . . . . . . . . . . . . . . . . . . . . . . . . . . . 16
Appendix . . . . . . . . . . . . . . . . . . . . . . . . . . . . . . . . . . . . . . . . . . . . . . . . . . . . . . . . . . . . . . 17
iii

List of Figures
Figure 1. The four Regions and nine Divisions of the United States . . . . . . . . . . . . . . . . . . . 2
Figure 2. Components' effect on heating energy use for Washington, DC, house, SA region . . . . . . . . . . . . . . . . . . . . . . . . . . . . . . . . . . . . . . . . . . . . . . . . . . . . . 13
Figure 3. Components' effect on cooling energy use for Washington, DC, house, SA region . . . . . . . . . . . . . . . . . . . . . . . . . . . . . . . . . . . . . . . . . . . . . . . . . . . . . 13
Figure 4. National trend in estimated energy use of new homes . . . . . . . . . . . . . . . . . . . . . . 14
Figure 5. Components' effect on heating energy use for Boston house, New England region . . . . . . . . . . . . . . . . . . . . . . . . . . . . . . . . . .. . . . . . . . . . .. 21
Figure 6. Components' effect on cooling energy use for Boston house, New England region 21
Figure 7. Components' effect on heating energy use for Binghamton house, Middle Atlantic region . . . . . . . . . . . . . . . . . . . . . . . . . . . . . . . . . . . . . . . . . . . . 23
Figure 8. Components' effect on cooling energy use for Binghamton house, Middle Atlantic region . . . . . . . . . . . . . . . . . . . . . . . . . . . . . . . . . . . . . . . . . . . . 23
Figure 9. Components' effect on heating energy use for Chicago house, ENC region . . . . . . . . 25
Figure 10. Components' effect on cooling energy use for Chicago house, ENC region . . . . . . . 25
Figure 1 1. Components' effect on heating energy use for Minneapolis house, WNC region 27
Figure 12. Components' effect on cooling energy use for Minneapolis house, WNC region 27
Figure 13. Components' effect on heating energy use for Orlando house, SA region . . . . . . . . . 29
Figure 14. Components' effect on cooling energy use for Orlando house, SA region . . . . . . . . . 29
Figure 15. Components' effect on heating energy use for Birmingham house, ESC region . . . . . 33
Figure 16. Components' effect on cooling energy use for Birmingham house, ESC region . . . . . 33
Figure 17. Components' effect on heating energy use for Dallas house, WSC region . . . . . . . . . 35
Figure 18. Components' effect on cooling energy use for Dallas house, WSC region . . . . . . . . 35
Figure 19. Components' effect on heating energy use for Phoenix house, MTN region . . . . . . . 37
Figure 20. Components' effect on cooling energy use for Phoenix house, MTN region . . . . . . . 37
Figure 21. Components' effect on heating energy use for Denver house, MTN region . . . . . . . . 39
iv
/' ...
tt_;..

·r I
I \ 1.\
I, I
I
i i '!
Figure 22.
Figure 23.
Figure 24.
Figure 25.
Figure 26.
List of Figures (Concluded)
Components' effect on cooling energy use for Denver house, MfN region . . . . . . . . 39
Components' effect on heating energy use for Los Angeles house, PAC region . . . . . 41
Components' effect on cooling energy use for Los Angeles house, PAC region . . . . 41
Components' effect on heating energy use for Eugene house, PAC region . . . . . . . . 43
Components' effect on cooling energy use for Eugene house, PAC region . . . . . . . . 43
v

List of Tables
Table 1. General Characteristics of 1980 Single-Family Detached Housing 4
Table 2. Median Insulation Levels in 1980 Single-Family Detached Housing . . . . . . . . . . . . . 5
Table 3. Window Characteristics of 1980 Single-Family Detached Housing. . . . . . . . . . . . . . 5
Table 4. Typical Heating and Cooling Equipment Installed in 1980 Single-Family Detached Housing . . . . . . . . . . . . . . . . . . . . . . . . . . . . . . . . . . . . . . . . . . . . . . . 6
Table 5. Heating Fuel Use in 1980 Single-Family Detached Housing . . . . . . . . . . . . . . . . . . 7
Table 6. Estimated Heating and Cooling Energy Consumption of 1980 Single-Family Detached Housing . . . . . . . . . . . . . . . . . . . . . . . . . . . . . . . . . . . . . . . . . . . . . . . 9
Table 7. Estimated Heating Load of 1980 Single-Family Detached Housing
Table 8. Base Case and Conservation Paths for Washington, DC, House,
9
South Atlantic Region . . . . . . . . . . . . . . . . . . . . . . . . . . . . . . . . . . . . . . . . . . . . 12
Table 9. Base Case and Conservation Paths for Boston House, New England Region . . . . . . . 20
Table 10. Base Case and Conservation Paths for Binghamton House, Middle Atlantic Region . . 22
Table 11. Base Case and Conservation Paths for Chicago House, East North Central Region 24
Table 12. Base Case and Conservation Paths for Minneapolis House, West North Central Region . . . . . . . . . . . . . . . . . . . . . . . . . . . . . . . . . . . . . . . . . 26
Table 13. Base Case and Conservation Paths for Orlando House, South Atlantic Region 28
Table 14. Base Case and Conservation Paths for Birmingham House, East South Central Region . . '· . . . . . . . . . . . . . . . . . . . . . . . . . . . . . . . . . . . . . . 32
Table 15. Base Case and Conservation Paths for Dallas House, West South Central Region . . . 34
Table 16. Base Case and Conservation Paths for Phoenix House, Mountain Region . . . . . . . . . 36
Table 17. Base Case and Conservation Paths for Denver House, Mountain Region . . . . . . . . . 38
Table 18. Base Case and Conservation Paths for Los Angeles House, Pacific Region . . . . . . . . 40
Table 19. Base Case and Conservation Paths for Eugene House, Pacific Region . . . . . . . . . . . 42
vi

I
J
i I j'
1.0 Introduction
The data analyses presented in this report were conducted by the NAHB Research Center (Research Center) under a contract to the National Renewable Energy Laboratory (NREL), formerly known as the Solar Energy Research Institute, as part of the development of a voluntary national energy efficiency program for new homes.
The Research Center has developed a data base of typical 1980 construction and the estimated energy performance of single-family detached homes in nine geographic regions across the continental United States Historical data from the 1980 Annual Survey of Builder Practices were used together with a well known microcomputer software tool in the analysis. Examples of construction changes that would provide a 50% reduction in total energy use for heating and cooling compared to 1980 practice are given. The feasibility of achieving the technical reductions was assessed for each region. The analysis was not constrained to achieve both a 50% reduction in heating energy and a 50% reduction in cooling energy. It was, therefore, possible for a 50% reduction in total energy to result in a reduction in heating energy greater than 50% and a reduction in cooling energy less than 50%. The analysis under this task did not evaluate all possibilities or methods to reduce energy consumption to the 50% target and has not been extended to evaluate reductions beyond 50%.
All analyses were performed on a regional basis. The regions are the same as the nine census Divisions recognized by the Bureau of the Census and are shown in Figure 1; New England (NE), Middle Atlantic •·•·
(MA), East North Central (ENC), West North Central (WNC), South Atlantic (SA), East South Central (ESC), West South Central (WSC), Mountain (MTN), and Pacific (PAC). This approach was necessary because regional construction practices and housing characteristics are diverse, and it allowed housing data . for predominantly heating climates, cooling climates, and mixed heating and cooling climates to be analyzed individually.
Section 2 of this report provides an overview of the approach taken in this task. Section 3 summarizes the base case 1980 new housing characteristics. Section 4 contains the results of estimated energy consumption in 1980 base case homes. Section 5 contains potential approaches to achieve 50% energy savings and includes an example of three compliance paths for one of the regions. Section 6 discusses a trend in estimated energy use of new homes projected out to 1992. The conclusions are summarized in Section 7. References follow in Section 8.
2.0 Overview
The purpose of this task was to document a "base case" and to perform a feasibility analysis for a national residential energy efficiency program for new homes. The goal of the program by the year 2000 is to reduce heating and cooling energy use in new homes built under the program to one-half of the energy use in typical new homes built in 1980. The principal objective of the task was to estimate the energy consumption of typical homes built in 1980 and then to identify and assess the feasibility of methods to reduce that consumption by 50%. Finally, the task calls for determining whether the program goal should be revised, based on the analysis.
Housing characteristics for 1980 construction were documented using data from the Research Center report, Annual Survey of Builder Practices (1982a). The survey represented the construction of approximately 65,000 single-family detached residences. Data from the builder survey included house type, finished floor area, gross wall area, window area and type, insulation levels, and space conditioning equipment type and fuel. Other necessary data such as equipment efficiencies and average infiltration
1
REGIONS AND CENSUS DIVISIONS OF THE UNITED STATES
Figure 1. The four Regions and nine Divisions of the United States. Source: U.S. Department of Commerce, Bureau of the Census.
rates were determined through a literature review. The Research Center report indicated that the results of the survey had been compared to a nonrespondent survey, and no significant difference was found between the number and size of houses constructed by respondents and nonrespondents. Moreover, the survey was also compared with the Annual Housing Survey conducted by the Bureau of the Census. That comparison concluded that the characteristic data compiled by the builder survey did not differ significantly from the Census survey. The builder survey data were, therefore, considered well representative of single-family detached housing construction in 1980 and suitable for use in this study.
2

r I
'I y
A characteristic data base was compiled into the nine census Divisions recognized by the Bureau of the Census. Sufficient data for analysis on the states of Alaska and Hawaii were not available from the builder survey. Energy consumption and load of typical housing types for one location within each region were determined by a building energy analysis software. Analysis for two locations within a region was performed in three regions where climate and housing characteristics were diverse (the SA, M'IN, and PAC regions). The effect of heating and cooling system efficiency on energy consumption was evaluated. The occupant effects, or operational characteristics of the building, were held constant in each software analysis. The estimated energy consumption and load were normalized to climate and finished floor area (Btu/degree day/:ff) for comparison and to determine averages.
The analysis method used was a software program called PEAR (Program for Energy Analysis of Residences) distributed by the Department of Energy (DOE) and developed at Lawrence Berkeley Laboratory (LBL 1989). PEAR uses a computer-generated data base of predicted energy consumption of "typical" residential houses. The PEAR data base was compiled from multiple simulations using the DOE-2 computer program. This software is fast and easy to use; it has been used extensively in the development of the American Society of Heating, Refrigerating and Air -Conditioning Engineers (ASHRAE) Proposed Standard 90.2P, Energy Efficiency of New Low-Rise Residential Buildings and the DOE Voluntary Standard for New Non-Federal Residential Buildings (still under development). One limitation with PEAR is the way it models passive solar design effects. Because we are also interested in factoring renewable energy technologies into the program, we used the design analysis software BuilderGuide (Balcomb et al. 1990) to evaluate suntempering, direct solar gain, and attached sunspaces in the NE, SA, and MfN regions (Boston, Massachusetts; Washington, D.C.; and Denver, Colorado, areas, respectively). Further details on our evaluation of PEAR may be found in the report on Task 2 of this project.
3.0 Base Case 1980 New Housing Characteristics
3.1 General Characteristics
Data on approximately 65,000 new homes were collected in the 1980 Annual Builder Practices survey. Half of all the survey homes were built slab-on-grade, 64% were one story, and the weighted average floor area of all single-family detached survey homes was 1700 ff. The average floor area for two-story homes was larger than that for one-story homes. Basement homes were common in the NE, MA, ENC, and WNC regions. Areas with significant crawl space construction in 1980 were Oregon, North Carolina, and South Carolina.
Table 1 summarizes the general construction characteristics of "typical" 1980 homes. The "typical" home for each region was generally determined by evaluating median values (e.g., insulation levels) and construction style. For example, if 55% of new single-family detached homes built in a region were one story, and 60% had basements, and if the average finished floor area for one-story homes was 1500 ff, then it was assumed that the typical home built in the region was one story, over a basement with an average finished floor area of 1500 ff. If no housing style was above 50%, then the highest percentage of construction type was used to determine the typical characteristic. The floor areas shown in the table were then determined by weighting the average floor area per housing style for the states in a region by the number of survey homes for the given style. Simple rectangular building footprints were selected to correspond to the construction style and finished floor area.
3

Table 1. General Characteristics of 1980 Single-Family Detached Housing
Floor Area -Region1 Stories Foundation Finished (n2) Wall Area (n2) Wall Perimeter (ft)
NE 2 Basement 2000 2080 130
MA 2 Basement 2200 2160 1 35
ENC 1 Basement 1375 1240 155
WNC 1 Basement 141 0 1251 156
SA (DC) 2 Basement 2335 2234 140
SA (FL) 1 Slab 1500 1 280 160
ESC 1 Slab 1500 1280 160
wsc 1 Slab 1625 1320 165
MTN (AZ) 1 Slab 1500 1 280 160
MTN (CO) 2 Basement 1850 2020 126
PAC (CA) 1 Slab 1600 1313 164
PAC (OR) 1 Crawl· Space 1435 1259 157
1NE =New England, MA =Middle Atlantic, ENC =East North Central, WNC =West North Central, SA= South Atlantic, ESC= East South Central, WSC =West South Central, MfN =Mountain, PAC= Pacific.
3.2 Insulation
The primary framing methods for exterior walls were wood frame (92%) and load-bearing masonry (7%). The only area where we modeled load-bearing masonry walls was Orlando, Florida, in the SA region. We assumed that insulation for that house was placed on the interior. Table 2 shows the estimated median insulation levels for 1980 homes. It shows that the majority of basement walls and slab-on-grade perimeters were not insulated. Insulated sheathing was not prevalent in 1980 construction. The median insulation level of an envelope component for the typical home was determined to be at an R-value at which at least 50% of the total weighted average insulated area was equal to or less than the sum of the average areas for lower R-values up to and including that R-value. Determining the median for exterior wall insulation was straightforward, because the significant majority of insulation was either R -11 or R -13. For example, if the total weighted average insulated wall area for a given region was 1100 tt2 and the weighted average area of R-11 used was 560 ft2, then the median value chosen was R-11. For ceiling and roof components, the median insulation level was less obvious. For example, if for a given region, 45% of the total average insulated ceiling area was R-19 and an additional 10% area was less than R-19, then the median level was assumed to be R-19. If approximately 50% of total insulated ceiling areas were R-26 or less and about 50% were R-30 or better, a "pragmatic" value of R-30 was assumed to be the median.
3.3 Windows
Average window areas including sliding glass doors are shown in Table 3. Most installed windows in 1980 were double glazed, or single glazed with exterior storm windows. Single glazing only was prevalent in the south regions. Window area as a percent of floor area ranged from 7.6% to 12.4% and averaged 10.3%. The largest window area relative to floor area was in the ENC region (12.4%) and the lowest was in the ESC region (7.6% ). Window areas were determined by weighting the average window
4

Table 2. Median Insulation Levels in 1980 Single-Family Detached Housing
l Insulation A-Values
Foundation Region Walls Ceilings or Floor
NE 1 1 1 9 None
I MA 1 1 1 9 None
ENC 13 30 None I
WNC 1 3 30 None
SA (DC) 1 1 19 None
SA (FL) 13 1 9 None
ESC 1 1 19 None
wsc 1 1 1 9 None
MTN (AZ) 13 30 None
MTN (CO) 1 1 19 None
PAC (CA) 1 1 19 None , ,
I PAC (OR) 1 1 30 1 9 )
\ Table 3. Window Characteristics of 1980 Single-Family Detached Housing I
Window Component
/ Region Area (tt2) Glazing Layers Sash Glass Type
NE 228 2 Wood Regular
MA 228 2 Wood Regular
ENC 1 70 2 Wood Regular
WNC 1 70 2 Wood Regular
SA (DC) 204 2 Wood Regular
SA (FL) 144 1 Aluminum Regular
ESC 1 1 4 2 Aluminum Regular
wsc 156 1 Aluminum Regular
MTN (AZ) 135 1 Aluminum Regular
MTN (CO) 1 83 2 Aluminum Regular
PAC (CA) 1 95 1 Aluminum Regular
PAC (OR) 147 2 Aluminum Regular
5

area per floor area of home for each state in a region by the number of homes built. One reason for the low window area per floor area in the ESC is because typical 1980 new homes in that region did not have sliding glass doors.
3.4 Heating and Cooling Equipment
Heating and cooling equipment characteristics for new 1980 homes are shown in Table 4. Heating was provided by forced air systems, except in the NE region which used electric resistance baseboard more frequently than forced air or hydronic systems. Cooling was also typically provided by forced air. Even though in several regions the majority of homes were not provided with cooling equipment, cooling energy use was modeled. The majority of gas furnaces purchased in 1980 had seasonal efficiencies equivalent to an AFUE of about 65 (Gas Appliance Manufacturers Association, personal communication, September 16, 1991; ASHRAE 1983). Typical heat pumps had a heating seasonal performance factor (HSPF) of about 6.5 and a seasonal energy efficiency rating (SEER) of about 7.8, and typical unitary airconditioners had SEERs of about 7.8 (Air-Conditioning & Refrigeration Institute, personal communication, September 16, 1991).
Forced air heating and cooling system efficiencies also are effected by distribution (duct) losses. Researchers have suggested significant impacts on energy use because of duct losses (Modera 1989, Cummings and Tooley 1989). The 1980 Annual Builder Practices survey indicated that more than 90% of the time, forced air distribution. systems were not wrapped or taped. One field study estimated duct losses to average 12% of the heating system efficiency (Robison and Lambert 1989). These duct leakage studies suggest that forced air distribution system effects on energy use are significant However, applying a representative duct leakage "factor" to the heating and cooling system efficiency is difficult. A 10%
Table 4. Typical Heating and Cooling Equipment Installed in 1980 Single-Family Detached Housing
Heating Cooling Distribution
Region Efficiency System Percent Homes Type1 Efficiency Type1 SEER With No Equipment
NE 1 00 ER 100 AC 7.8 92%
MA 90 GF 65 AC 7.8 65
ENC 90 GF 65 AC 7.8 56
WNC 90 GF 65 AC 7.8 37
SA (DC) 90 HP 6.52 HP 7.8 24
SA (FL) 90 EF 1 00 AC 7.8 9
ESC 90 GF 65 AC 7.8 27
wsc 90 GF 65 AC 7.8 4
MTN (AZ) 90 HP 6.52 HP 7.8 9
MTN (CO) 90 GF 65 AC 7.8 90
PAC (CA) 90 GF 65 AC 7.8 43 PAC (OR) 90 GF 65 AC 7.8 83
1ER-Electric baseboard; GF-Gas furnace; EF-Electric furnace; HP-Heat pump, AC-Air condtr. 2HSPF-Heating seasonal performance factor.
6
\ J
reduction in overall efficiency was assumed for the 1980 equipment, a factor slightly less than the Robison and Lambert (1989) estimate. The 10% reduction in overall efficiency was not applied to the NE region, because that region typically had no central distribution system. Further research on duct leakage impacts is needed.
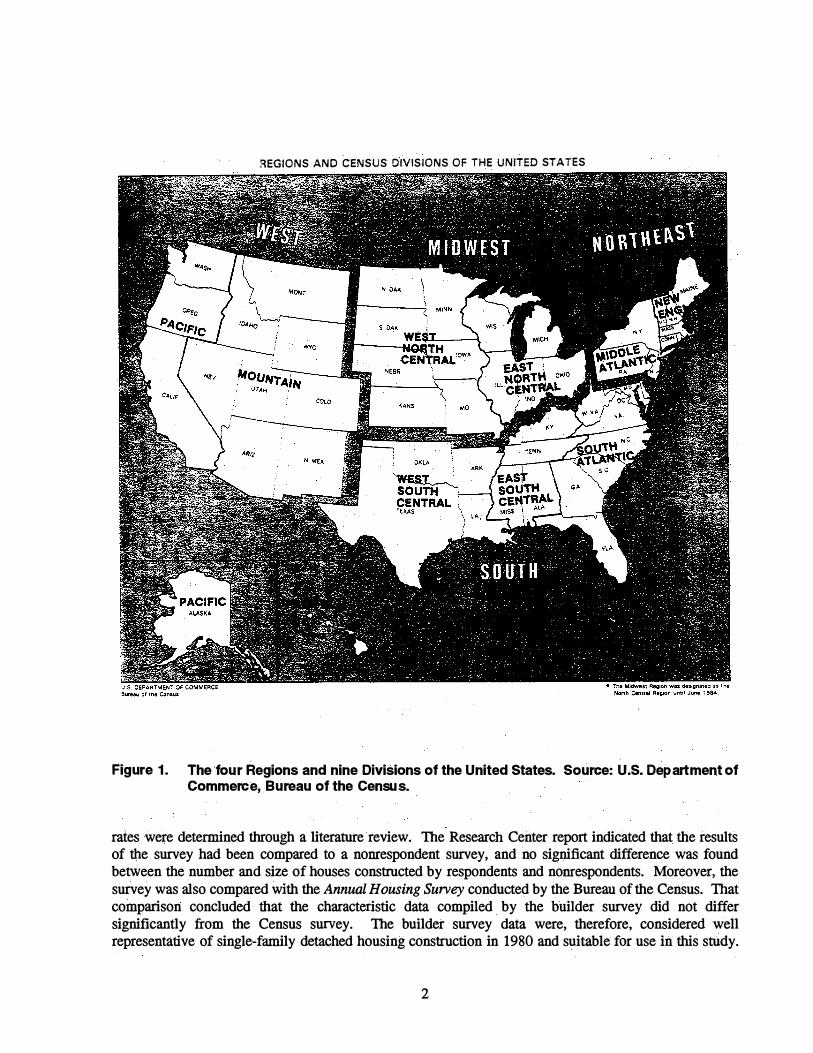
Heating fuels by region are shown in Table 5. Electric use was often split between heat pumps and electric resistance baseboards. If both the percent of heat pump and electric baseboard use was less than the percent of gas fuel use, then gas was chosen as the heating fuel.
3.5 Air Infiltration
Air infiltration rates for 1980 housing were estimated to be 0.6 air changes per hour (Grot and Clark 1979, Research Center 1982b, Grimsrud et al. 1982, Hamilton et al. 1983, Persily and Grot 1984, and ASHRAE 1989). Many of the homes in the above studies were built to be energy-efficient or incorporated passive solar designs. The median measured air infiltration rate of these homes using tracer gas technology was found to be 0.5 air changes per hour (ACH), and the median estimated air infiltration rate by blower door leakage test was found also to be about 0.5 ACH (Hamilton et al. 1983, Persily and Grot 1984). Grimsrud et al. (1982) reported that the median measured infiltration rate of 312 new homes built around 1980, many of which were "energy efficient," was 0.5 ACH. Grot and Clark (1979) reported that the average estimated air infiltration rate for a group of 266 "low-income" homes was 1 ACH. A pilot study conducted by the Research Center (1982b) indicated that the average infiltration rate measured by tracer gas for 16 homes was 0.58 ACH. While none of the above studies represents a random sampling of new homes built in 1980, the median ACH of a typical 1980 home would probably fall within a range of 0.5 to 1.0. A value of 0.6 ACH was used for the analysis based on the presumption that typical homes would have slightly more air leakage than energy-efficient passive solar homes in which an emphasis had been placed on low air leakage.
Table 5. Heating Fuel Use in 1980 Single-Family Detached Housing
Heating Fuel (Percent)
Region Gas Electric Oil
NE 22 55 23
MA 33 55 1 0
ENC 61 34 2
WNC 74 24 0
SA (DC) 1 7 78 5
SA (FL) 2 96 0
ESC 39 61 0
wsc 52 47 0
MTN (AZ) 6 86 0
MTN (CO) 96 4 0
PAC (CA) 93 7 0
PAC (OR) 55 45 0
7

4.0 Base Case Energy Analysis
Energy use may vary from home to home because of differences in insulation levels, window glazings, space-conditioning equipment, the size of the home, and regional weather. To compare energy use between different homes and regions, the differences caused by weather and the size of homes can be minimized for the comparison by normalizing the energy use by those parameters to provide heating and cooling performance indices. The indices are an indicator of the heating or cooling energy performance of a house and include equipment and distribution efficiencies.
Two levels of comparison were used to compare the energy performance of the 1980 base case homes. The first level of comparison uses heating and cooling performance indices based on estimated heating and cooling energy consumption for each home in a given location. The estimates were determined by PEAR analysis, and the data are shown in Tables 1-5. The second level of comparison is based on the heating load index, which allows comparison across regions of building envelope thermal integrity. The load index is independent of heating efficiency and fuel type and is more consistent across regions than the normalized energy consumption. It was estimated with PEAR by modeling the homes with electric resistance baseboard heat, which was assumed to be 100% efficient. A cooling load index was not calculated, because the cooling efficiencies are equivalent and, therefore, are not a factor.
4.1 Estimated Energy Consumption
The estimated heating and cooling energy use for the modeled homes are shown in Table 6. The wide range in the heating performance index (3.2 to 1 1.9) across regions suggests that fuel-burning appliances compared to heat pumps, electric furnaces, and resistance heat have a large effect on energy consumption as measured at the site. The mean heating performance index in the table is 8. 1 . Differences in cooling equipment efficiencies are not a factor in the variability of cooling performance indexes, because all of the equipment was assumed to have an adjusted SEER (SEER multiplied by the distribution efficiency) of 7, with the exception of the NE region, which typically had no central distribution system and, therefore, no distribution losses. The mean cooling performance index shown above is 4.5, with a standard deviation equal to 35% of the average. If only the predominantly cooling climate regions greater than 1000 cooling degree days are considered, the resulting mean would be 4.8, with a standard deviation of 15% of the mean. The remaining variability will be caused by differences in solar gain, the thermal integrity, and the size of each house.
4.2 Estimated Heating Load
The heating load index, calculated by modeling each house with electric resistance baseboard heat at 100% efficiency, is shown in Table 7. The mean is 5.5 with a standard deviation equal to 17% of the average. This variance can be reduced by not including the regions where the heating degree days are less than 2000, i.e., the Orlando, Phoenix, and Los Angeles areas. The average heating load index is then 5.9, with a standard deviation of 10% of the mean. The remaining 10% variation in heating load indices presumably reflects differences in the type of house, floor area, window area, and climate variables other than HDD65. For example, large houses appear more efficient at heating on a square-foot basis than smaller houses because of their reduced surface-to-volume ratio. One-story houses of the same floor area as two-story houses appear less efficient because of their larger surface-to-volume ratio (similarly in cooling, large houses appear more efficient because of their lower internal load intensity, i.e., the larger the home, the lower the internal gains per floor area).
8

Table 6. Estimated Heating and Cooling Energy Consumption of 1980 Single-Family Detached Housing
Heating Cooling
Total Total Region City (MMBtu) HDD65 HPI1 (MMBtu) CDD65 CPI2
NE Boston, MA 64.1 5593 5.7 4.7 699 3.4
r MA Binghamton, NY 154 7344 9.5 2.7 330 3.7
I ENC Chicago, IL 94.6 6455 1 0.7 4.1 740 4.1
WNC Minneapolis, MN 134 8007 1 1 .9 6.6 662 7.2
SA (DC) Washington, DC 31 .1 41 22 3.2 1 2.7 1430 3.8
SA (FL) Orlando, FL 4.1 656 4.2 29.3 3401 5.7
ESC Birmingham, AL 45.2 2943 1 0.2 1 2.8 1891 4.5
wsc Dallas, TX 45.4 2407 1 1 .6 22.0 2809 4.8
MTN (AZ) Phoenix, AZ 8.2 1 442 3.8 29.1 3746 5.2
MTN (CO) Denver, CO 97.7 6014 8.8 3.8 680 3.0
PAC (CA) Los Angeles, CA 21 .4 1595 8.4 1 .9 728 1 .6
PAC (OR) Eugene, OR 63.5 4799 9.2 2.5 261 6.7
1Heating performance index - Btu/Heating Degree-Day/f� 2Cooling performance index - Btu/Cooling Degree-Day�
\
\ Table 7. Estimated Heating Load of 1980 Single-Family Detached Housing ,
Heating
Floor Load Index Region City Total (MMBtu) HDD65 Area (Btu/HDD/tt2)
NE Boston, MA 64.1 5593 2000 5.7
MA Binghamton, NY 90.2 7344 2200 5.6
ENC Chicago, IL 55.3 6455 1375 6.2
WNC Minneapolis, MN 78.38 8007 141 0 6.9
SA (DC) Washington, DC 53.7 4122 2335 5.6
SA (FL) Orlando, FL 3.8 656 1500 3.8
ESC Birmingham, AL 26.4 2943 1500 6.0
wsc Dallas, TX 26.6 2407 1 625 6.8
MTN (AZ) Phoenix, AZ 8.6 1442 1500 4.0
MTN (CO) Denver, CO 57.1 6014 1 850 5.1
PAC (CA) Los Angeles, CA 1 2.6 1595 1600 4.9
PAC (OR) Eugene, OR 37.0 4799 1435 5.4
9
5.0 Potential Approaches to Achieving 50% Energy Savings
Several PEAR analyses were performed for each region to explore the technical feasibility of a 50% reduction in total energy use compared to 1980 practice. Window area was equally distributed on all exterior walls to remove directional bias and to provide randomness to building orientation. Initial analyses focused on individual conservation measures to assess their fractional energy savings. These analyses suggested that the following measures, listed in approximate decreasing order of significance, could contribute to a 50% reduction in total heating and cooling energy (note that unit geometry and fuel type were not variables under any of the analyses, and none of the examples reduce window area to save energy):
• Foundation insulation
• Heating and cooling equipment efficiency
• Heating and cooling distribution efficiency
• Air infiltration
• Window upgrades
• Passive solar energy
• Wall and ceiling insulation.
One of the more significant energy saving measures to the envelope would be the addition of foundation insulation where there had been none before. Estimates of energy savings ranged from 18% to 22% of baseline energy use for slab-on-grade homes (no insulation to R-5 insulation on half of the stem wall) in the ESC, WSC, MTN, and PAC regions. Foundation insulation added to basements resulted in estimated energy savings ranging from 8% to 14% for R-5 placed on the entire wall and 11% to 20% for R-10 placed on the entire wall.
Another significant conservation measure was the upgrade in mechanical and distribution efficiencies. The average furnace installed in 1980 was gas-fired and atmospherically vented with a standing pilot light, and had an AFUE of about 65% (GAMA, personal communication, September 16, 1991). All forced-air systems were modeled with a 10% reduction from equipment efficiency because of distribution losses, e.g., air leakage and conductive heat transfer from ducts in unconditioned spaces. Including an assumed 10% distribution loss reduces the overall system efficiency to 58.5%. In 1980 construction of single family detached residences, about 65% of sheet metal ducts were unwrapped (not insulated) and not taped. If the duct systems were taped and insulated, the 10% efficiency loss could be reduced. Moreover, the 10% loss could be eliminated entirely if duct systems were located within conditioned space.
Table 4 summarized the efficiencies of the heating and cooling equipment assumed for the PEAR analyses. Increases in gas furnace efficiencies to the National Appliance Energy Conservation Act of 1987 (NAECA) minimum requirements of 78% AFUE for equipment manufactured after January 1, 1992 resulted in average predicted heating energy savings of 16%. If duct systems are contained inside conditioned spaces, an additional 10%, or a net close to 25%, in heating energy savings would occur. Savings because of the use of highly efficient direct vent furnaces (e.g., heating system efficiency ofabout 95%) with ducts in the conditioned space results in a predicted energy savings of 40%. Cooling savings
10

I /
1 \
because of an air-conditioning equipment efficiency increase from a SEER adjusted for a distribution efficiency of 7 to 9 were estimated to be on the order of 15% to 20%.
Other savings because of individual energy conservation measures include infiltration reductions by 33% (0.6 ACH to 0.4 ACH), resulting in predicted heating savings from 10% to 25% and averaging 13.8%. We generally evaluated estimated savings because of reductions down only to 0.4 ACH, because that is the minimum input value allowed by PEAR. Upgrades in windows, either from single glazing to double glazing, or from double glazing to triple glazing (roughly equivalent to low-e windows), resulted in predicted savings in heating from 7% to 20% and in cooling from 1% to 5%. Wall and ceiling insulation increases resulted in heating savings ranging from 4% to 10% for increases in wall R-values from R-1 1, or R-13, to R-19 and in ceiling R-values from R-19 to R-30.
Some analysis was also performed for certain energy conservation measures that cannot be evaluated using the PEAR software. These included suntempering, attached sunspaces, cooling with night ventilation, and evaporative cooling equipment. BuilderGuide (Balcomb et al. 1990) was used to evaluate the passive solar design methods. The passive solar evaluations were conducted for the Boston, Denver, and Washington, D.C., areas. Insulation, window, and air tightening upgrades were also included in these analyses. The use of suntempering, which is the addition of south-oriented glazing up to 7% of the floor area, indicated possible heating energy reductions of 5% to 8%, while cooling energy requirements may decrease or increase. Increases in cooling because of suntempering will occur without adequate shading of direct solar gain in the summer. When evaluating passive solar energy, other design criteria should be addressed such as adequate insulation levels and window R-values, and whether increased thermal mass is necessary to absorb the increased solar gain during the winter. Sunspaces can reduce the need for heating energy significantly in some areas. For example, the BuilderGuide analysis suggested that attached sunspaces, along with other energy conserving measures, may provide the 50% reduction target for areas as diverse in climate as Denver and Washington, DC.
The use of evaporative cooling equipment was evaluated with another software program known as CALP AS3 (BSG Software, Berkeley, CA). In arid areas such as Phoenix, an 80%-effective evaporative cooler can reduce cooling energy by a factor of 3 to 4. In semiarid areas, it may be cost effective to "piggy-back" evaporative cooling equipment with conventional or highly efficient air-conditioners. The evaporative coolers could be used for the majority of the cooling season, and the air-conditioners would be used for periods of excess humidity. Even with this arrangement, cooling energy may be reduced by 20% to 30% by using an 80% effective cooler compared to using only conventional air-conditioning equipment.
Low-cost measures to reduce the cooling load include the use of ceiling fans that can produce enough air movement to provide comfort at higher indoor temperatures and relative humidity. Therefore, the energy saved would only occur if the homeowners raised the thermostat setting. Viera and Sheinkopf (1988) stated that each degree the thermostat is raised above 78°F will save about 7% to 8% on electric cooling. They also suggest that shading the air-conditioner compressor/condensing unit is another low-cost way to possibly save up to 5% on cooling energy use. Locating heat-producing appliances in unconditioned spaces and air handlers for forced air systems within conditioned space may also save cooling energy up to 10%.
The example discussed below illustrates that multiple paths are possible to meet the 50% energy reduction target. The example is for a typical home located in the mixed heating and cooling climate of suburban Washington, DC. Examples for all other regions are presented in the Appendix.
1 1

5.1 Example: Washington, DC
The 1980 SA Washington, DC, home is two stories over an unfinished basement with 2,355 tt2 of finished floor area. The base-case data for the 1980 standard home and the three conservation paths that reduce total heating and cooling energy use by 50% are summarized in Table 8. This example illustrates how a 50% reduction in energy consumption might be accomplished through various strategies. The PEAR software was used in the analysis of paths 1 and 2, which deal primarily with insulation and equipment upgrades, and house tightening. Conservation path 3 incorporates passive solar techniques and was analyzed using BuilderGuide.
The measures shown by path 1 resulted in estimated 59% and 34% reductions in heating energy and cooling energy use, respectively, as shown in Figures 2 and 3. In path 2, increases in system efficiencies are necessary to compensate for the smaller increase in exterior wall insulation compared to path 1. In path 3, equipment and distribution efficiencies are not altered, i.e., the reduction is caused entirely by reducing the heating and cooling load of the house and increasing solar gain for heating. The passive solar design included in this path consists of suntempering (the addition of south-oriented glazing up to 7% of the floor area) and window shading. Window area was increased by 38% from 204 ft2 to 281 tt2 with 58% of the total glazing (or 7% of the floor area) oriented south. The north and east oriented window areas were about 2% of the floor area, while the west window area was made up of only 1% of the floor area. Reducing the east and west window apertures will reduce early morning and late afternoon cooling during summer months. Shading consisted of 1.5-ft to 2-ft overhangs on the south and north. The use of ceiling fans was included in the BuilderGuide analysis to decrease the cooling load.
Table 8. Base Case and Conservation Paths for Washington, DC, House, South Atlantic Region
Building Base Case Conservation Paths component, equipment & air 1980 1. 2. 3. infiltration rate Wall insulation R1 1 R19 R13 R13
Ceiling insulation R19 R30 R30 R30
Foundation None R10 full wall R10 full wall R1 1 full wall insulation
Floor insulation None None None None
Windows Double pane, R2 Triple pane or Triple pane or Triple pane or double low-e, R3 double low-e, R3 double low-e, R3
Heating system 5.9 HSPF heat 7 HSPF heat 7.5 HSPF heat 5.9 HSPF heat ·
efficiency and pump pump pump pump type
Cooling SEER x 7 SEERadj heat 9 SEERadj heat 1 0 SEERadj heat 7 SEERad· heat distribution pump pump pump pump an� ceiling efficiency, & type fan
Air infiltration 0. 6ACH 0.4 ACH 0.4 ACH 0.35 ACH
Renewable None None None Suntempering energy sources and overhead
shading
12

Iatiltratjoa
Ia.filtrati oa
Wall
Wjgdows
59%EnergyReduction-12.8MMBtu
Fouadatioa
BaseCaseTolal-31.1 MMBtu
Figure 2. Components' effect on heating energy use for Washington, DC, house, SA region. Heating system efficiency increased from 5.9 HSPF to 7 HSPF.
Wiadows
Wjadows
CoiUag
Wall Iafiltratjoa
Fouadatio a 34% Energy Reduction -8.4 MMBtu
Base Case Total-12. 7 MMBtu
Figure 3. Components' effect on cooling energy use for Washington, DC, house, SA region. Cooling SEER x distribution efficiency increased from 7 to 9.
13

This example and those in the appendix suggest that a 50% reduction in energy use compared to 1980 practice is technically achievable and need not require extraordinary conservation measures. Although substantial changes throughout the building, sometimes costly, are required compared to the 1980 base case, none of the changes are considered technically impractical. In considering feasibility today it also is important to consider changes in building practices since 1980. Improved construction materials, window technology, and equipment efficiency, together with more stringent energy code requirements, have already reduced energy use compared to 1980, and federal appliance efficiency standards for furnaces effective in 1992 will reinforce this trend. The 1980 base-case analysis has, therefore, been supplemented in the following section with a simplified evaluation of these trends, to allow assessing the 50% savings goal based on recent building practice.
6.0 Trend in Estimated Energy Use
Over the last 15 years, new and existing homes have become more energy efficient. Figure 4 shows the trend in estimated energy use based on available builder survey data for the 9 census regions. Base case houses by year (1978, 1985, 1989) were determined using the same methodology as for the 1980 base case. The target 50% reduction (to annual usage of 23,000 Btu!tt2) from the 1980 estimated practice is shown. Even though new homes tend to be larger and use air-conditioning more than in the past, they are using less energy because of advances in window technology, increased ceiling and wall insulation levels, and decreases in air infiltration rates. The 1992 prediction indicates a 30% reduction compared
Average Energy Use (MBtu/sqft} 60 -
50 50 -....- 46
r--
l 42 r-- 39 -
50% r--40 reduction 32 to23
30 - MBtu/sqft. ....-
:---- 1 20 -
10 -
0 I I I
1978 1980 1985 1989 1992 Estimated
Simple, nonweighted averages ofthe 121ocations in the 9 census regions are shown.
Figure 4. National trend in estimated energy use of new homes
14

to 1980 and is based on the 1989 base-case house and an assumption that homes will have space conditioning equipment with minimum NAECA efficiencies. However, pre-1992 inventory will exist for some time and presumably will be installed in new homes until the inventories are depleted. Even so, if all homes did have the NAECA minimum requirements, a further 28% reduction compared to 1992 would still be needed to meet the goal of the program. Furthermore, if energy conservation measures remain market driven and fuel price stagnation occurs, the above trend could diminish after 1992. Under that scenario a 50% reduction may not occur for many years.
7.0 Conclusions
The results of Task 4.1 may be summarized as follows:
• A 50% reduction in energy use compared to 1980 construction practice appears to be technically feasible.
• The target reduction in heating climates is technically less difficult to achieve than in cooling climates.
• The estimated mean heating load index for regions with heating degree days greater than 2000 was 5.9 Btu/HDD-if with a standard deviation equal to 10% of the average.
·
• The estimated mean cooling performance index for regions with cooling degree days greater than 1000 was 4.8 Btu/CDD-if with a standard deviation equal to 15% of the average.
• Adding foundation insulation results in significant energy savings, while increasing wall and ceiling insulation often produces very little energy savings.
• Heating and cooling equipment and distribution system efficiencies offer significant opportunities for energy savings.
• Several prescriptive paths appear possible to achieve the goal of the program.
• Several relatively low-cost measures could contribute significantly to meeting the program reduction target, particularly for homes in cooling climates, but other measures are significantly more costly.
• The predicted percent reduction by 1992 is estimated to be at most 30% compared to 1980 construction standards.
• A 28% reduction from the 1992 estimated level would still be necessary to reach the program target goal.
• The technical feasibility and the projected energy reduction trend suggest that the program goal is realistic.
The illustrative paths necessary to achieve a 50% reduction in energy use compared to 1980 standards include combinations of insulation, window, and equipment upgrades; passive solar design; and low-cost measures such as shading, equipment location, and ceiling fans. Equipment efficiencies and foundation insulation were the two most significant reduction areas in heating climates. Windows appeared to be the most significant envelope component affecting cooling loads. Air infiltration rate reduction also offers
15

significant energy savings, however reducing the ACH below 0.35 may require mechanical ventilation with an associated energy penalty.
The economics of achieving the 50% reduction are more complex. The illustrative compliance paths generally reduce energy consumption well below current practice, indicating that at present private demand forces are insufficient to stimulate this degree of improved energy performance. Detailed cost-benefit analysis is beyond the scope of this report, and no formal attempt to minimize compliance costs was made in developing the alternative paths. However, direct sharing of incremental costs with the affected utility supplying energy remains the most obvious and logical approach to achieving this goal and realizing high market penetration in the near term. Utility incentives would be very helpful for stimulating use of highefficiency equipment and air leakage control. Utility involvement in marketing and customer relations would be valuable in any case. In conclusion, dramatic changes in utility support may be necessary to make the technically achievable goals economically attractive to builders and buyers of new homes on a broad scale.
8.0 References
ASHRAE. 1983. Handbook of equipment. Atlanta, GA: American Society of Heating, Refrigerating, and Air -Conditioning Engineers, Inc.
ASHRAE. 1989. Handbook of fundamentals. Atlanta, GA: American Society of Heating, Refrigerating, and Air -Conditioning Engineers, Inc.
Balcomb, J.D., N. Weaver, A. Lekov, and N. Birkenheuer. 1990. BuilderGuide. Solar Energy Research Institute and Passive Solar Industries Council.
Cummings, J.B., and J.J. Tooley, Jr. 1989. "Infiltration and pressure differences induced by forced air systems in Florida residences." ASHRAE Transactions 95(2).
Grimsrud, D.T., M.H. Sherman, and R.C. Sonderegger. 1982. "Calculating infiltration: implications for a construction quality standard." Proceedings of the ASHRAE-DOE Conference on the Thermal
Peiformance of the Exterior Envelope of Buildings II, Las Vegas, NV. Grot, R.A., and R.E. Clark. 1979. "Air leakage characteristics and weatherization techniques for low
income housing." Proceedings of the ASHRAE-DOE Conference on the Thermal Peiformance of the Exterior Envelope of Buildings, Orlando, FL.
Hamilton, B., B. Sachs, J. Duffy, and A. Persily. 1983. "Measurement-based calculations of infiltration in passive solar performance evaluation." Progress in Passive Solar Energy Systems, Boulder, CO: American Solar Energy Society.
Lawrence Berkeley Laboratory. 1989. Affordable housing through energy conservation. Technical Support Document for PEAR. U.S. Department of Energy contract DE-AC03-76SF-00098. Prepared by Lawrence Berkeley Laboratory.
Modera, M. 1989. "Residential duct system leakage: magnitude, impacts, and potential for reduction." ASHRAE Transactions 95(2).
NAHB Research Center. 1982a. Annual survey of builder practices. Upper Marlboro, MD. NAHB Research Center. 1982b. Pilot study of air infiltration rates in new homes. Report to the National
Association of Home Builders from NAHB Research Foundation, Inc. Persily, A., and R. Grot 1984. "Air infiltration and building tightness measurements in passive solar
residences." Journal of Solar Energy Engineering 106, pp.193-197. American Society of NAHB Mechanical Engineers.
Robison, D.H., and L.A. Lambert 1989. "Field investigation of residential infiltration and heating duct leakage." ASHRAE Transactions 95(2).
Viera, R., and K. Sheinkopf. 1988. Energy-efficient Florida home building. Report No. FSEC-GP-33-88, Cape Canaveral, FL: Florida Solar Energy Center.
16

1 I
Appendix
17

This page intentionally left blank.
18

The following examples suggest three paths for each region that were estimated to lead to a 50% reduction in total energy use. Analyses in most cases were performed with the PEAR software with the exception of a few passive solar analyses that were performed with the BuilderGuide software. An analysis of evaporative coolers for the Phoenix area was performed with the CALPAS3 software.
The first path given for each region is illustrated by the pie figures showing the proportion of building component effect on the heating and cooling energy use. In some cases, certain components are not shown in the pie figure. This occurs when the component heat loss equals its heat gain. In other cases, there are slight gains for a component, e.g., when solar gains through windows during the heating season are larger than the losses through the same windows.
A prevalent conservation measure throughout these examples is the reduction in air infiltration from 0.6 ACH down to 0.4 ACH. Estimated savings were generally evaluated down only to 0.4 ACH because that is the minimum input value allowed by PEAR. Other common conservation measures are foundation insulation, window upgrades to triple pane or double low-e, and equipment efficiency improvements.
19

New England - Boston, MA
The 1980 NE home is two-story over an unfinished basement and 2,000 tt2 of finished floor area. Table 9 lists the base-case characteristics of the 1980 home and three conservation paths to reduce energy use by 50%. The first path includes the use of an oil-fired boiler with hydronic distribution. This is a common way of heating in rural north east United States. Figures 5 and 6 illustrate the overall 50% reduction in heating and cooling energy use through 52% and 23% reductions, respectively, for the first path given. Suntempering in path 3 included the addition of 6% more window area with distribution of window area equivalent to 7% of floor area and overhead shading to the south side.
Table 9. Base Case and Conservation Paths for Boston House, New England Region
Building Base Case Conservation Paths component, equipment & air 1980 1. 2. 3. infiltration rate Wall insulation R1 1 R19 R19 R19
Ceiling insulation R19 R30 R30 R30
Foundation None RS half wall R1 0 full wall R1 1 full wall insulation
Floor insulation None None None None
Windows Double pane, R2 Triple pane or Triple pane or Triple pane or double low-e, R3 double low-e, R3 double low-e, R3
Heating system 1 00% electric 83% oil boiler 1 00% electric 1 00% electric efficiency and resistance, or resistance resistance type 70% oil boiler
Cooling system 7.8 SEER room 1 0 SEER room 7.8 SEER room 7.8 SEER room efficiency and air conditioning air conditioning air conditioning air conditioning type
Air infiltration 0. 6ACH 0.4 ACH 0.4 ACH 0.4 ACH
Renewable None None None Suntempering energy sources and overhead
shading
20

Wall
Wall
Ceiling
Fo u o d ati o n
52% Energy Reduction- 44 MMBtu Foo ndatio n
Base Case Tota l - 96.2 MMBtu
Figure 5. Components' effect on heating energy use for Boston house, New England region. Heating system efficiency was increased from 70% to 83%.
F ou n d t o
Wall 23% Energy Reduction -3.6 MMBtu
Base Case Total- 4.7 MMBtu
Figure 6. Components' effect on cooling energy use for Boston house, New England region. Cooling system efficiency increased from 7.8 SEER to 10 SEER.
21

Middle Atlantic - Binghamton, NY
The 1980 MA home is two stories over an unfinished basement with 2,200 tt2 of finished floor area. Table 10 lists the base-case characteristics of the 1980 home and three conservation paths to reduce energy use by 50%. Figures 7 and 8 illustrate the overall 50% reduction of heating and cooling energy use through 51% and 15% reductions, respectively, for the first path given.
Table 10. Base Case and Conservation Paths for Binghamton House, Middle Atlantic Region
Building Base Case Conservation Paths component, equipment & air 1980 1. 2. 3. infiltration rate Wall insulation R1 1 R13 R19 R13
Ceiling insulation R19 R30 R30 R30
Foundation None R1 0 full wall R5 half wall R5 full wall insulation
Floor insulation None None None None
Windows Double pane, R2 Triple pane or Triple pane or Triple pane or double low-e, R3 double low-e, R3 double low-e, R3
Heating system 58.5% gas 70.2% gas 70.2% gas 78% gas furnace efficiency and furnace furnace furnace type
Cooling SEER x 7 SEERa_di central 9 SEERadj central 9 SEERadj central 10 SEERadj distribution air conditioning air conditioning air conditioning central air efficiency, & type conditioning
Air infiltration 0. 6ACH 0.4 ACH 0.4 ACH 0.4 ACH
22

Wall
Fo und ati o n
Base Case Total - 1 54.2 MMBtu
Ceiling Infiltration
Wall
Windows
Fo u o datio o
51 % Energy Reduction -75.4 MMBtu
Figure 7. Components' effect on heating energy use for Binghamton house, Middle Atlantic region. Heating system efficiency increased from 58.5% to 70.2%.
Wall Wall
Base Case Total-2.6 MMBtu 1 5% EnergyReduction - 2.2 MMBtu
Figure 8. Components' effect on cooling energy use for Binghamton house, Middle Atlantic region. Cooling SEER x distribution efficiency increased from 7 to 9.
23

East North Central - Chicago, IL
The 1980 ENC home is one story over an unfinished basement with 1,375 tt2 of finished floor area. Table l l lists the base-case characteristics of the 1980 home and three conservation paths to reduce energy use by 50%. Figures 9 and 10 illustrate the overall 50% reduction in heating and cooling energy use through 51% and 22% reductions, respectively, for the first path given.
Table 11. Base Case and Conservation Paths for Chicago House, East North Central Region
Building Base Case Conservation Paths component, equipment & air 1980 1. 2. 3. infiltration rate Wall insulation R1 3 R1 3 R19 R19
Ceiling insulation R30 R30 R30 R30
Foundation None R5 full wall R5 full wall R10 full wall insulation
Floor insulation None None None None
Windows Double pane, R2 Double pane, R2 Double pane, R2 Triple pane or double low-e, R3
Heating system 58.5% gas 95% gas furnace 82% gas furnace 70.2% gas efficiency and furnace No duct losses No duct losses furnace type
Cooling SEER x 7 SEERadj central 1 0 SEER central 7.8 SEER central 7 SEEF\_dj central distribution air conditioning air conditioning air conditioning air conditioning efficiency, & type
Air infiltration 0. 6ACH 0.4 ACH 0.4 ACH 0.4 ACH
24

Windows Window s
Wall 51 %EnergyReduction-46.1 M MBtu
Base Case Totai - 94. 6 MM8tu
Figure 9. Components' effect on heating energy use for Chicago house, ENC region. Heating system efficiency increased from 58.5% to 95%.
Wall Wall
Fou ndati o n
F o u n dation
Base Case Total - 4.1 MMBtu 22% Energy Reduction -3.2 MM Btu
Figure 10. Components' effect on cooling energy use for Chicago house, ENC region. Cooling SEER x distribution efficiency increased from 7 to 10.
25

West North Central - Minneapolis, MN
The 1980 WNC home is one story over an unfinished basement with 1,410 tt2 of finished floor area. Table 12 lists the base-case characteristics of the 1980 home and three conservation paths to reduce energy use by 50%. Figures 1 1 and 12 illustrate the overall 50% reduction in heating and cooling energy use through 49% and 27% reductions, respectively, for the first path given.
Table 12. Base Case and Conservation Paths for Minneapolis House, West North Central Region
Building Base Case Conservation Paths component, equipment & air 1980 1 . 2. 3. infiltration rate Wall insulation R1 3 R13 R1 3 R19
Ceiling insulation R30 R30 R30 R3B
Foundation None R1 0 full wall R1 0 full wall R1 0 full wall insulation
Floor insulation None None None None
Windows Double pane, R2 Triple pane or Double pane, R2 Double pane, R2 double low-e, R3
Heating system 58.5% gas 70.2% gas 78% gas furnace 78% gas furnace efficiency and furnace furnace No duct losses No duct losses type
Cooling SEER x 7 SEERadj central 9 SEERadj central 1 0 SEER central 1 0 SEER central distribution air conditioning air conditioning air conditioning air conditioning efficiency, & type
Air infiltration 0.6 ACH 0.4 ACH 0.5 ACH 0.4 ACH
26

Wall l o fl t rto
Windows
Windows
F o u n d ati o n
49%Energy Reduction-67.9 MMBtu Wall
Base CaseTotal - 1 33.9 MMBtu
Figure 11. Components' effect on heating energy use for Minneapolis house, WNC region� Heating system efficiency increased from 58.5% to 70.2%.
I n filtrati o n l o fl trto
Wall F o u n d t n
Wall
Fou n d a ti o n
Base Case Total - 6 .6 MMBtu 27% Energy Reduction -4.8 MMBtu
Figure 12. Components' effect on cooling energy use for Minneapolis house, WNC region. Cooling SEER x distribution efficiency increased from 7 to 9.
27

South Atlantic - Washington, DC (see Section 5.1 )
South Atlantic - Orlando, FL
The 1980 SA home is one story over a slab-on-grade with 1,500 if of finished floor area. Table 13 lists the base-case characteristics of the 1980 home and three conservation paths to reduce energy use by 50%. Figures 13 and 14 illustrate the overall 50% reduction in heating and cooling energy use through 70% and 58% reductions, respectively, for the first path given.
Table 13. Base Case and Conservation Paths for Orlando House, South Atlantic Region
Building Base Case Conservation Paths component, equipment & air 1980 1. 2. 3. infiltration rate Wall insulation R13 R1 3 R13 R1 3
Ceiling insulation R19 R19 R19 R19
Slab insulation None R5 half stem wall R5 full stem wall R5 half stem wall
Windows Single pane, R1 Double pane, R2 Triple pane or Reflective, double double low-e, R3 pane, R2
Heating system 1 00% electric 1 00% electric 9.5 HSPF heat 9.5 HSPF heat efficiency and furnace or 5.9 furnace pump pump type HSPF heat pump
Cooling SEER x 7 SEERadj central 13 SEERadj 9.5 SEEAadj heat 9 SEERadj heat distribution air conditioning central air pump pump efficiency, & type conditioning
Air infiltration 0. 6ACH 0.4 ACH 0.4 ACH 0.5 ACH
Thermal mass outside inside inside inside
28

Infiltration
lnfil trati o a
Slab
70%Energy Reduction - 1 . 1 MMBtu
Ceiliog
Base Case Total - 3 .7 MMBtu
Figure 1 3. Components' effect on heating energy use for Orlando house, SA region. No increase in heating system efficiency.
Windows
Windows
58%EnergyR eduction - 1 2.1 MMBtu Slab
Base Case Totai - 29.2MMBtu
Figure 1 4. Components' effect on cooling energy use for Orlando house, SA region. Cooling SEER x distribution efficiency increased from 7 to 13.5.
29

The most significant contribution to the cooling load for the Orlando house is from windows, which are twice as significant as all the other contributors, while the least is from the ceiling. The low percent load caused by the ceiling is not clearly understood, particularly because we presume radiant heat transfer between the roof surface and the attic insulation would be large. This would increase the temperature of the attic insulation resulting in larger conductive heat gain to the interior ceiling surface. A review of the PEAR documentation (LBL 1989) indicated that the roof-ceiling building component was modeled as a single construction layer, which ignores variations in attic ventilation rates and radiant heat transfer. It is possible that this could introduce errors to the estimate of the cooling load caused by the ceiling for a house in a predominantly cooling climate.
The large window effect is most probably caused by direct solar gain. One simple and relatively low-cost way to reduce the cooling load caused by direct solar gain is to incorporate shading devices. PEAR does not assess shading; however, it is able to significantly limit direct solar gain if the input window type is set to "reflective." In the third example path, the use of reflective glass reduced the estimated cooling energy by about 20%. As a result, the other measures could be relaxed, such as SEER increase to 9 and slab insulation placed only on half of the stem wall. It is also interesting to note that the above reductions were possible without changing insulation levels in the walls or ceiling. Changes to wall and ceili1;1g insulation levels only resulted in marginal cooling energy reductions.
30

This page intentionally left blank.
31

East South Central - Birmingham, AL
The 1980 ESC home is one story over a slab-on-grade with 1,500 if finished floor area. Table 14 lists the base-case characteristics of the 1980 home and three conservation paths to reduce energy use by 50%. Figures 15 and 16 illustrate the overall 50% reduction in heating and cooling energy use through 52% and 37% reductions, respectively, for the frrst path given.
Table 14. Base Case and Conservation Paths for Birmingham House, East South Central Region
Building Base Case Conservation Paths component, equipment & air 1980 1. 2. 3. infiltration rate Wall insulation R1 1 R1 3 R1 9 R13
Ceiling insulation R1 9 R1 9 R30 R30
Slab insulation None R5 full stem wall R5 half stem wall R5 half stem wall
Windows Double pane, R2 Double pane, R2 Double pane, R2 Triple pane or double low-e, R3
Heating system 58.5% gas 70.2% gas 58.5% gas 70.2% gas efficiency and furnace furnace furnace furnace type
Cooling SEER x 7 SEERadj central 9.5 SEERadj 13 SEERadj 9 SEERadj central distribution air conditioning central air central air air conditioning efficiency, & type conditioning conditioning
Air infiltration 0.6 ACH 0.4 ACH 0.4 ACH 0.4 ACH
32

Slab Wall
Windows
52% Energy Reduction-21 .8 MMBtu Wall
Base Case Tota i - 45.2 MMBtu
Figure 15. Components' effect on heating energy use for Birmingham house, ESC region. Heating system efficiency increased from 58.5% to 70.2%.
Windows
Ia filtration lofil trati on
Slab
37%Energy Reduction -8.1 MMBtu
Base Case Total - 1 2.8 MMBtu
Figure 16. Components' effect on cooling energy use for Birmingham house, ESC region. Cooling SEER x distribution efficiency increased from 7 to 9.5.
33

West South Central - Dallas, TX
The 1980 WSC home is one story over a slab-on-grade with 1,625 tt2 of finished floor area. Table 15 lists the base-case characteristics of the 1980 home and three conservation paths to reduce energy use by 50%. Figures 17 and 18 illustrate the overall 50% reduction in heating and cooling energy use through 57% and 39% reductions, respectively, for the first path given.
Table 15. Base Case and Conservation Paths for Dallas House, West South Central Region
Building Base Case Conservation Paths component, equipment & air 1980 1 . 2. 3. infiltration rate Wall insulation R1 1 R13 R13 R1 3
Ceiling insulation R1 9 R1 9 R30 R1 9
Slab insulation None R5 full stem wall R5 half stem wall R5 half stem wall
Windows Single pane, R1 Double pane, R2 Double pane, R2 Triple pane or double low-e, R3
Heating system 58.5% gas 70.2% gas 70.2% gas 70.2% gas efficiency and furnace furnace furnace furnace type
Cooling SEER x 7 SEERadj central 9 SEERadj central 9 SEERadj central 9 SEERadj central distribution air conditioning air conditioning air conditioning air conditioning efficiency, & type
Air infiltration 0.6 ACH 0.4 ACH 0.4 ACH 0.4 ACH
34

Wall
57% Energy Reduction - 1 9.6 M MBtu Windows
Base Case Tota i - 45.4 MM8tu
Figure 17. Components' effect on heating energy use for Dallas house, WSC region. Heating system efficiency increased from 58.5% to 70.2%.
Windows
Windows
Ceiling Ceiling
Slab
Wall
Infiltration 39%EnergyReduction - 1 3 .5 M MBtu
Base Case Total- 22 MMBtu
Figure 18. Components' effect on cooling energy use for Dallas house, WSC region. Cooling SEER x distribution efficiency increased from 7 to 9.
35

Mountain - Phoenix, AZ
The 1980 MTN home in Phoenix is one story over a slab-on-grade with 1,500 tt2 of finished floor area. Table 16 1ists the base-case characteristics of the 1980 home and three conservation paths to reduce energy use by 50%. Figures 19 and 20 illustrate the overall 50% reduction in heating and cooling energy use through 68% and 45% reductions, respectively, for the first path given.
Table 16. Base Case and Conservation Paths for Phoenix House, Mountain Region
Building Base Case Conservation Paths component, equipment & air 1980 1. 2. 3. infiltration rate
Wall insulation R1 3 R13 R1 9 R13
Ceiling insulation R30 R30 R30 R30
Slab insulation None R5 half stem wall R5 half stem wall R5 half stem wall
Windows Single pane, R1 Triple pane or Triple pane or Triple pane or double low-e, R3 double low-e, R3 double low-e, R3
Heating system 5.9 HSPF heat 7 HSPF heat 5.9 HSPF heat 1 00% electric efficiency and pump pump pump resistance type
Cooling SEER x 7 SEEf\dj heat 9 SEERadj heat 7 SEERadj heat 80% effective distr. eff. or pump pump pump evaporative effectiveness, & cooler type
Air infiltration 0.6 ACH 0.4 ACH 0.4 ACH 0.4 ACH
Renewable None None Sunspace with None energy sources overhead shading
36

In filtration
Slab
Ceiliog
Ceiliog
68% Energy Reduction -2.6 MM Btu
Base Case Total- 8.2 MMBtu
Figure 19. Components' effect on heating energy use for Phoenix house, MTN region. ' Heating system efficiency increased from 5.9 HSPF to 7 HSPF.
Windows
Wall
Slab
Ceiliog
Iofil trati o n 45% Energy Reduction - 1 5 .8 MMBtu
Base Case Total- 28.9 MMBtu
Figure 20. Components' effect on cooling energy use for Phoenix house, MTN region. Cooling Seer x distribution efficiency increased from 7 to 9.
37

Mountain - Denver
The 1980 MTN Denver home is two stories over an unfinished basement with 1,850 tt2 of finished floor area. Table 17 lists the base-case characteristics of the 1980 home and three conservation paths to reduce energy use by 50%. Figures 21 and 22 illustrate the overall 50% reduction in heating and cooling energy use through 55% and 26% reductions, respectively, for the first path given.
Table 17. Base Case and Conservation Paths for Denver House, Mountain Region
Building Base Case Conservation Paths component, equipment & air 1980 1. 2. 3. infiltration rate
Wall insulation R1 1 R1 9 R13 R13
Ceiling insulation R1 9 R1 9 R30 R30
Foundation None R1 0 full wall R1 1 full wall R1 1 full wall insulation
Floor insulation None None None None
Windows Double pane, R2 Triple pane or Triple pane or Double pane, R2 double low-e, R3 double low-e, R3
Heating system 58.5% gas 70.2% gas 58.5% gas 58.5% gas efficiency and furnace furnace furnace furnace type
Cooling SEER x 7 SEEf\dj central 9 SEERadj central 7 SEEf\dj central 7 SEERadj central distribution air conditioning air conditioning air conditioning air conditioning efficiency, & type
Air infiltration 0.6 ACH 0.4 ACH 0.4 ACH 0.4 ACH
Renewable None None Suntempering Sunspace and energy sources and shading shading
38

Wall
Wall
Cei!ing
Ceiling
Fou ndati o n 55%Energy Reduction -43.5 M MBtu
Base Case Tolai- 97. 7 MMBtu
Figure 21. Components' effect on heating energy use for Denver house, MTN region. Heating system efficiency increased from 58.5% to 70.2%.
Windows
I n filtrati o n
F o u n dation
Wall
Base Case Tolal - 3.8 MMBtu
Ceiling
Infltrtn
Fou n d atn
26%Energy Reduction - 2.8 MMBtu
Figure 22. Components' effect on cooling energy use for Denver house, MTN region. Cooling SEER x distribution efficiency increased from 7 to 9.
39

Pacific - Los Angeles, CA
The 1980 PAC Los Angeles home is one story over a slab-on-grade with 1,600 :rt2 of finished floor area. Table 18 1ists the base-case characteristics of the 1980 home and three conservation paths to reduce energy use by 50%. Figures 23 and 24 illustrate the overall 50% reduction in heating and cooling energy use through 59% and 16% reductions, respectively, for the first path given.
Table 18. Base Case and Conservation Paths for Los Angeles House, Pacific Region
Building Base Case Conservation Paths component, equipment & air 1980 1. 2. 3. infiltration rate
Wall insulation R1 1 R13 R1 3 R1 1
Ceiling insulation R1 9 R30 R30 R1 9
Slab insulation None None None R5-2
Windows Single pane, R1 Triple pane or Triple pane or Double pane, R2 double low-e, R3 double low-e, R3
Heating system 58.5% gas 70.2% gas 58.5% gas 70.2% gas efficiency and furnace furnace furnace furnace type
Cooling SEER x 7 SEEf\dj central 9. SEERadj central 7 SEERadj central 7 SEERadj central distribution air conditioning air conditioning AC and ceiling air conditioning efficiency, & type fans
Air infiltration 0.6 ACH 0.4 ACH 0.4 ACH 0.4 ACH
Renewable None None Sunspace with None energy sources overhead shading
40

Wall
Wall
Slab
Slab
59%Energy Reduction -8.8 MMBtu Jafi I tratioa
Base Case Totai-21.4MMBtu
Figure 23. Components' effect on heating energy use for Los Angeles house, PAC region:: Heating system efficiency increased from 58.5% to 70.2%.
Ceiling
Base Case Tota.l- 1 .9 MMBtu 1 6% Energy Reduction - 1 .6 MM Btu
Figure 24. Components' effect on cooling energy use for Los Angeles house, PAC region. Cooling SEER x distribution efficiency increased from 7 to 9.
41

Pacific - Eugene
The 1980 PAC Eugene home is one story over a crawl space with 1,435 tt2 of finished floor area. Table 19 lists the base-case characteristics of the 1980 home and three conservation paths to reduce energy use by 50%. Figures 25 and 26 illustrate the overall 50% reduction in heating and cooling energy use through 51% and 16% reductions, respectively, for the first path given.
Table 19. Base Case and Conservation Paths for Eugene House, Pacific Region
Building Base Case Conservation Paths component, equipment & air 1980 1 . 2. 3. infiltration rate
Wall insulation R1 1 R25 R1 9 R1 9
Ceiling insulation R30 R38 R30 R30
Floor insulation R1 9 R1 9 R1 9 R1 9
Windows Double pane, R2 Triple pane or Triple pane or Triple pane or double low-e, R3 double low-e, R3 double pane, R2
Heating system 58.5% gas 70.2% gas 78% gas furnace 95% gas furnace efficiency and furnace furnace No duct losses No duct losses type
Cooling SEER x 7 SEERadj central 9 SEEAadj central 1 0 SEER central 1 0 SEER central distribution air conditioning air conditioning air conditioning air conditioning efficiency, & type No duct losses No duct losses
Air infiltration 0.6 ACH 0.4 ACH 0.5 ACH 0.4 ACH
42

Wall
Wall
Fl oor
In filtration
51 % EnergyReduction-30.8 M MBtu
Base Case Totai- 63. 5 MMBtu
Figure 25. Components' effect on heating energy use for Eugene house, PAC region. Heating system efficiency increased from 58.5% to 70.2%.
Floor floor
CeiJiDg Ceiliog
Windows
Base Case Total- 2.5 MMBtu 1 6% Energy Reduction -2.1 MMBtu
Figure 26. Components' effect on cooling energy use for Eugene house, PAC region. Cooling SEER x distribution efficiency increased from 7 to 9.
43

Document Control Page
1 . N REL Report No.
NREL!fP-432-4986
4. Title and Subtitle
1980 Base Case and Feasibility Analysis
7. Author(s)
NAHB Research Center
9. Performing Organization Name and Address
NAHB Research Center Upper Marlboro, Maryland
1 2. Sponsoring Organization Name and Address National Renewable Energy Laboratory 1 617 Cole Blvd. Golden, CO 80401-3393
1 5. Supplementary Notes NREL technical monitor: N. Carlisle, (303) 231 -1036
1 6. Abstract (Limit: 200 words)
2. NTIS Accession No.
DE93000042
3. Recipient's Accession No.
5. Publication Date March 1993
6.
8. Performing Organization Rept. No.
1 o. Project/Task/Work U nit No. BE213070
1 1 . Contract (C) or Grant (G) No.
(C) HD-1-1 1 100-1
(G)
1 3. Type of Report & Period Covered Technical report
1 4.
This report describes a task of documenting a "base case" and performing a feasibility analysis for a national residential energy efficiency program for new homes. The principal objective of the task was to estimate the energy consumption of typical homes built in 1980 and then to identify and assess the feasibility of methods to reduce that consumption by 50%. The goal of the program by the year 2000 is to reduce heating and cooling energy use in new homes built under the program to one-half of the energy use in typical new homes built in 1980. The task also calls for determining whether the program goal should be revised, based on the analysis.
1 7. Document Analysis a. Descriptors energy consumption ; residential buildings
b. Identifiers/Open-Ended Terms
c. UC Categories 350
1 8. Availability Statement National Technical Information Service U.S. Department of Commerce 5285 Port Royal Road Springfield, VA 22161
Form No. 0069E (6-30-87)
1 9. No. of Pages
50
20. Price
A03