Embed Size (px)
Citation preview

TRANSACTIONS OF SOCIETY OF ACTUARIES 1 9 7 2 REPORTS
II. GROUP I ,ONG-TERM DISABILITY INSURANCE
T HE experience included in this report is predominantly that of employer-employee groups located in the bnited" States and is largely" for plans which appear not to have been the result of
bargaining. Groups which a contributing company" considers atypical or classifies as substandard because of industry hazards are excluded. Plans selected for the study provide occupational as well as nonoccupational coverage, but with benefits integrated with workmen's compensation. Virtually all the cases contributed also provide that gross monthly bene- fits be integrated with some or all of any social security benefits and frequently" with other benefits payable as a result of the disability. Bene- fits are payable only on claims incurred prior to age 65 and generally cease at age 65.
The Committee rccommen(ls that care bc used in the intcrprctati(m of the results and in their application on olher than a broad basis. Since a considerable volume of exposure could not be coded with respect ,~ certain characteristics which may influence the levei of rate of disable- menl or termination, the experience may not be representative of an\ particular group or plan. With the exception of 1970, the experience covers a period of favorable economic conditions and generally high employment.
CONTRIBUTING COMPANIES
Thirteen companies have contributed experience for the investigation covered in this report. The results are the composite experience of varia- tions in company practices and in the underlying administration and claim procedures, as well as of variations in experience among groups.
Aetna Life & Casualty Bankers Life & Casualty Bankers Life Company" Connecticut General Life Insurance Company Continental Assurance Company Continental Casualty Company Equitable Life Assurance Society" John Hancock Mutual Life Insurance Company Metropolitan Life Insurance Company" New York Life Insurance Company Provident Life & Accident Insurance Company Prudential Insurance Company of America Sun Life Assurance Company, of Canada
258
GROUP LONG-TERM DISABILITY 259
ANALYSIS OF RATES OFF DISABLEMENT
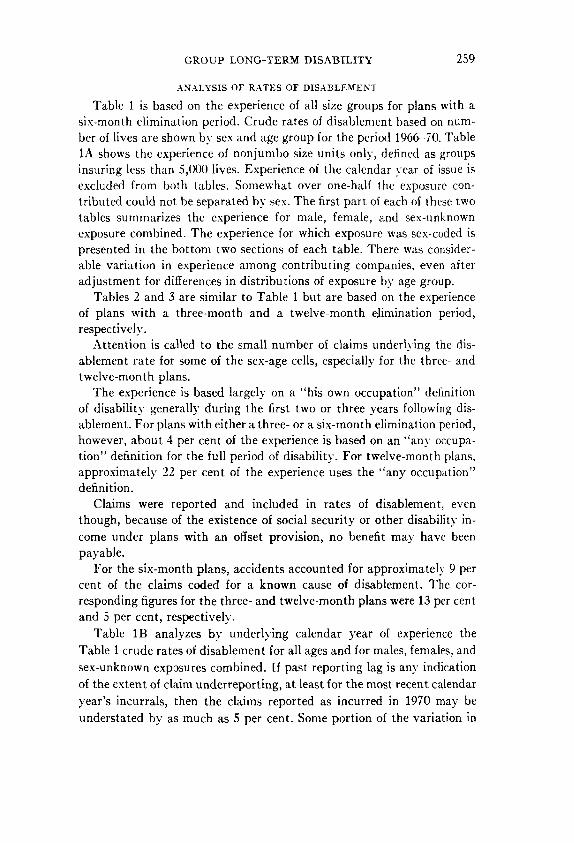
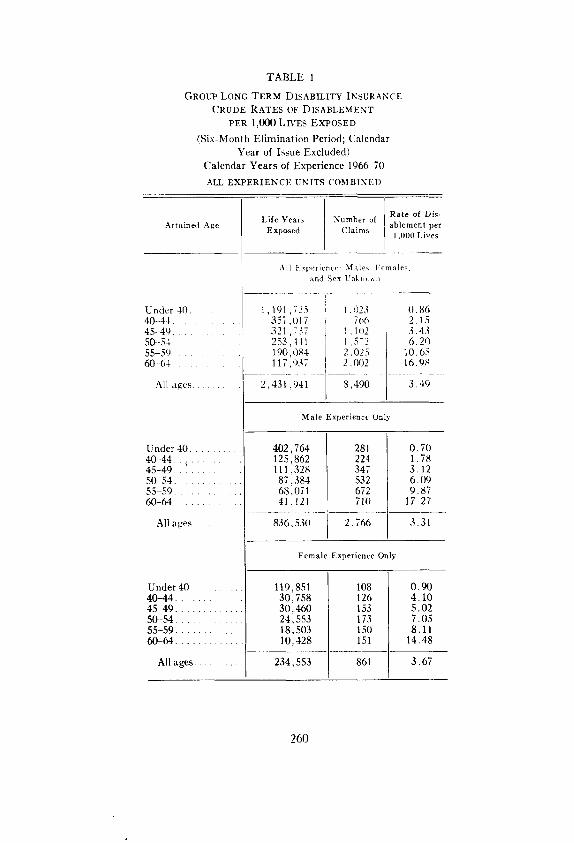
Table 1 is based on the experience of all size groups for plans with a six-month elimination period. Crude rates of disablement based on num- ber of lives are shown by sex and age group for the period 1966-70. Table 1A shows the experience of nonjumbo size units only, defined as groups insuring less than 5,000 lives. Experience of the calendar year of issue is excluded from both tables. Somewhat over one-half the exposure con- tributed could not be separated by sex. The first part of each of these two tables summarizes the experience for male, female, and sex-unknown exposure combined. The experience for which exposure was sex-coded is presented in the bottom two sections of each table. There was consider- able variation in experience among contributing companies, even after adjustment for differences in distributions of exposure by age group.
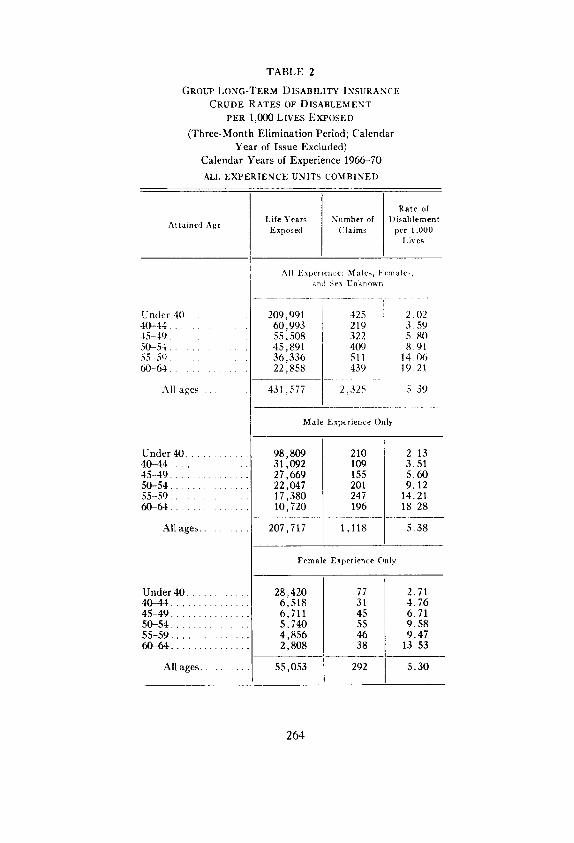
Tables 2 and 3 are similar to Table 1 but are based on the experience of plans with a three-month and a twelve-month elimination period, respectively.
Attention is called to the small number of claims underlying the dis- ablement rate for some of the sex-age cells, especially for the three- and twelve-month plans.
The experience is based largely on a "his own occupation" definition of disability generally during the first two or three years following dis- ablement. For plans with either a three- or a six-month elimination period, however, about 4 per cent of the experience is based on an "any occupa- tion" definition for the full period of disability. For twelve-month plans, approximately 22 per cent of the experience uses the "any occupation" definition.
Claims were reported and included in rates of disablement, even though, because of the existence of social security or other disability in- come under plans with an offset provision, no benefit may have been payable.
For the six-month plans, accidents accounted for approximately 9 per cent of the claims coded for a known cause of disablement. The cor- responding figures for the three- and twelve-month plans were 13 per cent and 5 per cent, respectively.
Table 1B analyzes by underlying calendar year of experience the Table 1 crude rates of disablement for all ages and for males, females, and sex-unknown exposures combined. If past reporting lag is any indication of the extent of claim underreporting, at least for the most recent calendar year's incurrals, then the claims reported as incurred in 1970 may be understated by as much as 5 per cent. Some portion of the variation in
T A B L E 1
GROUP LONG-TERM DISABILITY INSURANCE
CRUDE RATES OF DISABLEMENT
PER 1 ,000 LIVES EXPOSED
( S i x - M o n t h E l i m i n a t i o n Per iod ; C a l e n d a r
Y e a r of I ssue E x c l u d e d )
C a l e n d a r Y e a r s of E x p e r i e n c e 1966--70
ALL EXPERIENCE UNITS COMBINED
Rate of Dis- Life Years Number of
Attained Age Exposed Claims ablement per 1,000 Lives
All Experien¢e: Males, Females, and Sex Unknown
Under 4 0 4 0 - 4 4 . . . . . . . 45.-49 . . . . . . 50--54 . 5 5 - 5 0 . . . . 6 0 - 6 4 .
All ages . . . . . . . . .
U n d e r 40 . . . . . . 4 0 - 4 4 . ; . . . . . . . . 4 5 - 4 9 . . . . . . 5 0 - 5 4 . . . . . . . . . . .
55 59 . . . . . . . . . . . 6 0 - 6 4 . . . . . . . . . . .
All ages . . . .
U n d e r 40 . . . . . . . 40--44 . . . . . . . . . 4 5 4 9 . . . . . . . . . . . . 50--54 . . . . . . . . . .
5 5 - 5 9 . . . . . . . . . . . . 6 0 - 6 4 . . . . . . . . . . . .
A l l a g e s . . . . . . .
1,191 ,725 ] . 0 2 3
3 5 7 , 0 1 7 706 - z v i 1 321 , ,~ , i • , ltL~
253 ,44~ 1 ,572 I 2 . 0 2 5 t 90 ,0 ,q4
2 , 4 3 1 , 9 4 1 8 , 4 9 0
0 . 8 6 2 . 1 5 3 . 4 3 6 . 2 0
1 0 . 6 5 1 6 . 9 8
3 . 4 9
Male Experience Only
4 0 2 , 7 6 4 1 2 5 , 8 6 2 1 1 1 , 3 2 8
8 7 , 3 8 4 68 ,071 41 ,121
8 3 6 . 5 3 0
281 0 . 7 0 224 1 . 7 8 347 3 . 1 2 532 6 . 0 9 672 9 . 8 7 710 1 7 . 2 7
2 , 7 6 6 3 .31
Female Experience Only
119 ,851 108 3 0 , 7 5 8 126 3 0 , 4 6 0 153 2 4 , 5 5 3 173 1 8 , 5 0 3 150 1 0 , 4 2 8 151
2 3 4 , 5 5 3 861
0 % 4 . 1 0 5 . 0 2 7 . 0 5 8 . 1 1
1 4 . 4 8
3 . 6 7
2 6 0
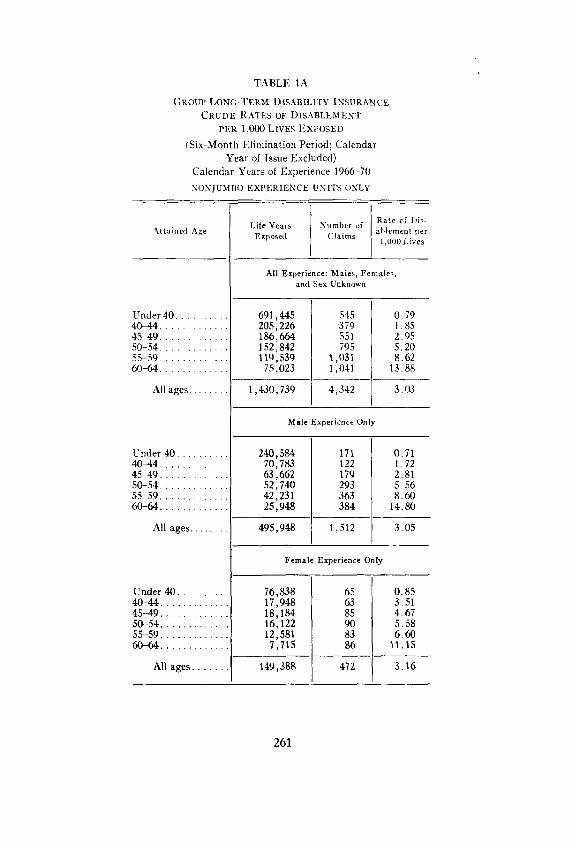
TABLE 1A
GROUP LONG-TERM DISABILITY INSURANCE
CRUDE RATES OF DISABLEMENT
PER 1,000 LIVES EXPOSED
(Six-Month Elimination Period; Calendar
Year of Issue Excluded) Calendar Years of Experience 1966--70
NON JUMBO EXPERIENCE UNITS ONLY
Rate of Dis- Life Years Number of Attained Age ablement per Exposed Claims
1,000 Lives
Under40 . . . . . . . . . 40-44 . . . . . . . . . . . 4 5 4 9 . . . . . . . . . . . 50-54 . . . . . . . . . . . . 55-59 . . . . . . . . . . . . 60-64 . . . . . . . . . . .
Allages . . . . . . .
Under 40 . . . . . . . . . 40-44 . . . . . . . . . . . . 45-49 . . . . . . . . . . . . 50-54 . . . . . . . . . . . 55-59 . . . . . . . . . . . .
60--64 . . . . . . . . . . . .
All ages . . . . . . .
Under 40 . . . . . . . . . 4 0 - 4 4 . . . . . . . . . . . .
45--49 . . . . . . . . . . . . . 50--54 . . . . . . . . . . . . . 55-59 . . . . . . . . . . . . . 6 0 - - 6 4 . . . . . . . . . . . . .
All ages . . . . . . .
All Experience: Males, Females, and Sex Unknown
691,445 205,226 186,664 152,842 119,539
75,023
545 379 551 795
1,031 1,041
0.79 1.85 2.95 5.20 8.62
13.88
1,430,739 4,342 3.03
Male Experience Only
240,584 70,783 63,662 52,740 42,231 25,948
171 122 179 293 363 384
0.71 1.72 2.81 5.56 8.60
14.80
495,948 1,512 3.05
Female Experience Only
76,838 17,948 18,184 16,122 12,581 7,715
149,388
65 0.85 63 3.51 85 4.67 90 5.58 83 6.60 86 11.15
472 3.16
261

262 COMMITTEE ON GROUP LIFE AND HEALTH INSURANCE
the over-all disablement rate from year to year is the result of changes in the distributions of exposed to risk by age groups.
Table 1B also shows ratios of actual claims to tabular claims. Tabular claims for each year were derived by applying to the actual exposures for each age group the corresponding age-disablement rates based on the experience of nonjumbo size groups for males, females, and sex unknown
TABLE IB
GROUP LONG-TERM DISABILITY INSURANCE ANALYSIS OF RATES OF DISABLEMENT
BY CALENDAR YEAR OF INCURRAL (Six Month Elimination Period; Calendar Year of Issue Excluded; All Ages;
Males, Females, and Sex Unknown Combined Calendar Years of Experience 1962-70 ALL E X P E R I E N C E U N I T S C O M B I N E D
CALENDAR YEAR OF
[NCURRAL
1962-65
1966. 1967. 1968. 1969. 1970.
1966-70.
.\'UMBER c~F EX-
PERIEN (TE UNITS
646
555 772
1,038 1,196 1,373
4,934
LIFE YEARS
EXPOSED
361,813
262,037 412,408 529,877 568,123 659,496
NUMBER OF CLAIMS
2,431,941
I
Acci- i T o t a l S ickness i ( Inc l .
den t I Unknown)
81 8 5 7 - i709; -
57 " 696 777 110 ~1,128 1,307 1Sl !1,535 1,766 195 1,686 1,920 270 2,405 2,720
783 7,450 8,490
RATE OF RATIO OF DISABLE- A( TUAL
MENT CLAIMS PElt TO TABU-
1,000 I.Aa LIVES CLAIMS*
3.03 109~i I-
2 . 9 7 111% 3.17 113 3.33 113 3.38 111 4.12 137
3.49 119%
* T a b u l a r c la ims were calculated by app ly ing to the actual age group exposures the crude rates of d isablement shown in Table 1 A for males , females, and sex unknown combined.
combined from Table 1A. The tabulars adjust for age only. No adjust- ment is made for the different proportions of males and females, if an5", or for any other factors which might influence disablement rates.
Table 1C subdivides the Table 1 experience for all ages and for males, females, and sex-unknown exposures combined, by size of experience unit. Note that experience units of less than 100 lives accounted for over 50 per cent of the total number of units. This explains the large number of units (over 65 per cent of the total) which experienced no claims. This table also includes a dispersion analysis of ratios of actual claims to tabular claims. As in Table 1B, the tabulars adjust only for age. Because the experience is not adjusted for sex or for other characteristics which might have a measurable impact on the rate of disablement, such as differences among contributing companies in underwriting and claims

T A B L E 1C
GROUP LONG-TERM DISABILITY INSURANCE RATES OF DISABLEMENT AND RATIOS OF ACTUAL CLAIMS TO TABULAR CLAIMS BY SIZE OF EXPERIENCE UNIT EXPOSED
(Six-Month El iminat ion Period; Calendar Year of Issue Excluded; All Ages; Males, Females, and Sex Unknown Combined) Calendar Years of Experience 1966-70
ALL E X P E R I E N C E U N I T S C O M B I N E D
bo
SIZE OF UNIT
Under 25 l ives . . . 2 5 - 4 9 . . . . . . . . . . 50-99 . . . . . . . . . .
100-249 . . . . . . . . 250-499 . . . . . . . . 500-999 . . . . . . . . 1,000-2,499 . . . . 2 ,500-4 ,999 . . . .
Under 5 ,000.
5 ,000 or m o r e , . .
Total . . . . . . .
NUMBER
oE EX- PERIENCE
UNITS
343 936
1,269 1,156
506 291 248
96
LIFE YEARS EXPOSED
5,449 34,164 88,558
181,701 177,745 210,796 398,015 334,311
4,845 1,430,739
89 1,001,202
4,934 2,4-31,941
NUMBER OF
CLAIMS
15 lOO 242 492 521 670
1,229 1,073
4,342
4,148
8,490
RATE OF
DISABLE-
MENT PEa
1,000 LIVES
2.75 2 . 9 3 2.73 2.71 2.93 3 .18 3 .09 3.21
3.03
4 .14
3 .49
AVERAGE A / T
RATIO*
81% 85 84 88 89
102 106 112
lOO%
148%
119%
NUMBER OF EXPERIENCE UNITS BY RATIO OF ACTUAL TO TABULAR CLAIMS*
0%
334 8 5 0
! ,062 798 251
81 22
5
3,403
1
3,404
| -
50%
0 0 o o 6
32 38 13
89
97
5o- 78%
0 0 o 0
35 30 33 16
114
7
121
75- 1oo%
0 0 o 9
37 29 31 13
119
128
100- IS0%
0 0 o
4o 47 44 58 25
214
22
236
150- 200%
0 0 o
77 45 30 28 lO
190
21
211
200- soo%
0 2
119 184
78 38 34 12
467
19
486
500% or More
9 84 88 48
7 7 4 2
249
2
251
* T a b u l a r c la ims were ca lcula ted by applying to the ac tua l sge group exposures the crude ra tes of d isablement shown in T a b l e IA for males , females , and sex unknown combined.
T A B L E 2
GROUP LONG-TERM DISABILITY INSURANCE
CRUDE RATES OF DISABLEMENT
PER 1,000 lAVES EXPOSED
( T h r e e - M o n t h E l i m i n a t i o n Per iod ; C a l e n d a r
Y e a r of I s sue Exc luded )
C a l e n d a r Y e a r s of E x p e r i e n c e 1 9 6 6 - 7 0
ALL EXPERIENCE UNITS COMBINED
Rate o[ Life Years Number of Di,ablement
Attained Age Exposed Claims per 1,000 Lives
U n d e r 41) . . . . . . . 4 0 - 4 4 . 45--49 . . . . 5 0 - 5 4 . . . . . . . .
5 5 - 5 9 . . . . . . . .
61164 . . . . . . .
All ages
U n d e r 40 . . . . . . . . . . . 4 0 - 4 4 . . . . . . . 45--49 . . . . . . . . . . 5 0 - 5 4 . . . . . . . . . . . . . . 5 5 - 5 9 . . . . . . . . . 6 0 - 6 4 . . . . . . . . .
All ages . . . . . . . . .
U n d e r 40 . . . . . . . . . . . 4 0 - 4 4 . . . . . . . . . . . . . . 4 5 - 4 9 . . . . . . . . . . . . . 5 0 - 5 4 . . . . . . . . . . . . 5 5 - 5 9 . . . . . . . . . . . . . 6 0 - 6 4 . . . . . . . . . . . . . . .
A l l a g e s . . . . . . . . .
All Experience: Males, t:'cmale~, and Sex Unknown
2 0 9 , 9 9 1 425 6 0 , 9 9 3 219 5 5 , 5 0 8 322 4 5 , 8 9 1 409 3 6 , 3 3 6 511 2 2 , 8 5 8 430
4 3 1 , 5 7 7 2 , 3 2 5
2. (12 3 , 5 9 5 . 8 0 8 9 1
14~ 06 19 ,21
I 5 . 3 9
Male Experience Only
9 8 , 8 0 9 3 1 , 0 9 2 2 7 , 6 6 9 2 2 , 0 4 7 1 7 , 3 8 0 1 0 , 7 2 0
210 109 155 201 247 196
2 . 1 3 3 . 5 1 5 . 6 0 9 . 1 2
1 4 . 2 1 1 8 . 2 8
2 0 7 , 7 1 7 1 , 1 1 8 5 . 3 8
Female Experience Only
2 8 , 4 2 0 6 , 5 1 8 6 , 7 1 1 5 , 7 4 0 4 , 8 5 6 2 , 8 0 8
5 5 , 0 5 3
77 31 45 55 46 38
292
2 . 7 1 4 . 7 6 6 . 7 1 9 . 5 8 9 . 4 7
1 3 . 5 3
,5.30
2 6 4
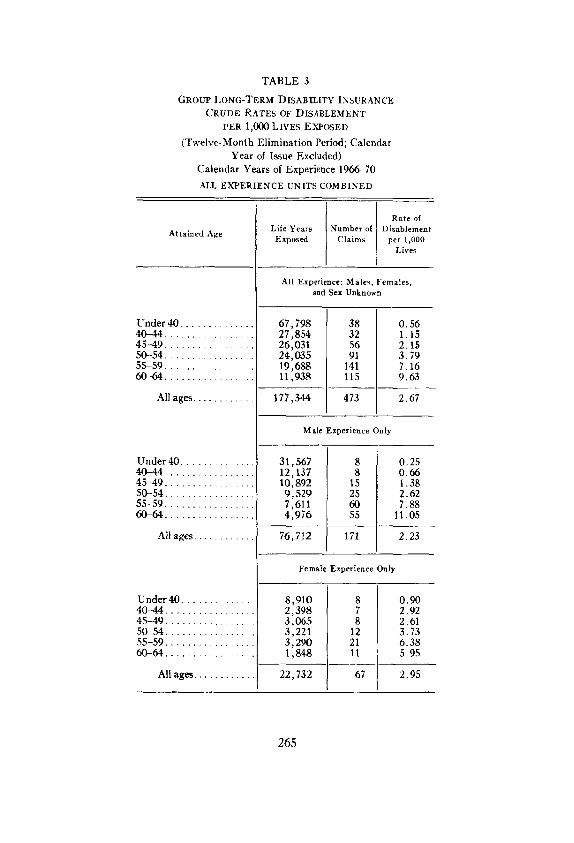
TABLE 3
GROUP LONG-TERM DISABILITY INSURANCE CRUDE RATES OF DISABLEMENT
PER 1,000 LIVES EXPOSED
(Twelve-Month El iminat ion Period; Calendar
Year of Issue Excluded)
Calendar Years of Experience 1966-70
ALL EXPERIENCE UNITS COMBINED
Rate of Attained Age Life Years Number of Disablement
Exposed Claims per 1,000 Lives
Under 40 . . . . . . . . . . . . . . 4 0 - 4 4 . . . . . . . . . . . . . . . . .
45---49 . . . . . . . . . . . . . . . . 50-54 . . . . . . . . . . . . . . . . 55-59 . . . . . . . . . . . . . . . . .
6 0 - - 6 4 . . . . . . . . . . . . . . . . .
All ages . . . . . . . . . . . .
Under 40 . . . . . . . . . . . . . . 4 0 - 4 4 . . . . . . . . . . . . . . . . .
45-49 . . . . . . . . . . . . . . . . . 50-54 . . . . . . . . . . . . . . . . . 55-59 . . . . . . . . . . . . . . . . . 60-64 . . . . . . . . . . . . . . . .
All ages . . . . . . . . . . .
Under 40 . . . . . . . . . . . . . 4 0 . - - 4 4 . . . . . . . . . . . . . . . . .
4,5-49 . . . . . . . . . . . . . . . . 50-54 . . . . . . . . . . . . . . . . 55-59 . . . . . . . . . . . . . . . . . 60--64.
All ages . . . . . . . . . . .
All Experience: Males, Females, and Sex Unknown
67,798 27,854 26,031 24,035 19,688 11,938
177,344
38 32 56 91
141 115
0.56 1.15 2.15 3.79 7.16 9.63
2.67
Male Experience Only
31,567 12,137 10,892 9,529 7,611 4,976
7 6 , 7 1 2
8 8
15
55
0.25 0.66 1.38 2.62 7.88
11.05
2.23
Female Experience Only
8,910 2,398 3,065 3,221 3 ,290 1,848
22,732
8 7 8
12 21
'5-
0.90 2.92 2.61 3.73 6.38 5.95
2.95
265

266 COMMITTEE ON GROUP LIFE AND HEALTH INSURANCE
adminis t ra t ion practices, the extent to which employers use the long- term disabi l i ty plan as an early ret irement vehicle, the proport ions of salary, hourly, and bargained wages, the extent of employer financial par t ic ipat ion, the type of industry, the relationship to take-home pay of the amount of benefit payable under the plan, and so on, the results should be interpreted with some caution.
Table 4 shows exposures, claims, and rates of d isablement by size group for plans with either a three- or a twelve-month el iminat ion period. Tabulars used in this table are based on the combined experience of all size groups. However, since no jumbo groups are included in the experi- ence of the three-month plans, the tabulars for plans with a three-month el imination period are in fact those for nonjumbo groups.
The impact of the 1970 recession on disablement rates is quite evident. II appears that the effect was general, affecting all segments of the ex.. perience- -all plan elimination periods, all size groups, and both sexes. "Fable 1B gives some indication of the magni tude of the impact . I t shows a rate of d isablement in 1970 about 25 per cent higher than for the years immedia le ly preceding.
Table 1A experience was analyzed by contr ibuting company to de- termine what type of dispersion pa t te rn would evolve. The results are summarized in the accompanying tabulat ion. The separa te experiences
Per Cent of Ratio of Company Total Actual to
Exposure Expected
I . . . . . . . . . . . . . II . . . . . . . III . . . . . . . . . IV . . . . . . . . . . . . . V . . . . . . . . . . . . .
VI . . . . . . . . . VII . . . . . . . . . . . . VIII . . . . . . . . . . . IX . . . . . . . . . . . . X . . . . . . . . . . . . . .
XI . . . . . . . . . . . . . . XII . . . . . . . . . . . .
All . . . . . . . . .
< 0. s~;~ 25 35 2 4 3 2 4 9 2 2
12
1009~
71% 108 93
148 104 94 69 92
130 49
112 85
1005~
underlying Tables 1 and 1A, respectively, have been analyzed by em- ployee class and by industry. The results are displayed in Tables 5 and 6.
The port ion of the experience in Table 5 pertaining to nonbargained plans covering salaried employees who are essentially not executives was further examined in order to determine the relat ionships among plan

TABLE 4
G R O U P L O N G - T E R M D I S A B I L I T Y I N S U R A N C E
ANALYSIS OF R A T E S OF D I S A B L E M E N T BY SIZE OF E X P E R I E N C E U N I T E X P O S E D
(Calendar Year of Issue Excluded; All Ages; Males, F e m a l e s , and Sex Unknown C o m b i n e d )
Calendar Years of Experience 196(~70
ALL E X P E R I E N C E U N I T S C O M B I N E D
TffREE-MoNTII ELIMINATION PERIOD PLANS
I rnder 25 lives.. 25-49 . . . . . . . . . .
5 3-99 . . . . . . . . .
190-249 . . . . . . . . 250--499 . . . . . . . . 5 00~999 . . . . . . . . 1 ,000 -2 ,499 . . . . 2,500-4,999 . . . .
Under 5,000..
5.000 or more . . .
Total.
Number of Experience
Uni ts
234 784 680 418 203
92 59 19
Rate of Disable-
ment per 1,000
Lives
2,489
Rat io of Actual
Claims to Tabular Cla ims*
Life Number Years of
Exposed Cla ims
3,458 32 27,992 133 46,884 222 61,108 273 69,963 351 65,456 291 94,825 680 61,891 343
431,577
431,577 2,325
9.25 4.75 4.74 4.47 5.02 4.45 7.17 5.54
2,489 2,325 5.39 i
5.39
164% 88 89 88 98 89
126 94
10o% 296
~00%
Number of Experience
Units
16 46 59 56 42 31 35 1l
6
302
SEE Or UmT
TWELVE-MONq3ft ELIMINATION PERIOO PLANS
Life Years
Exposed
213 1,576 4,066 9,055
14,489 25,507 50,067 34,712
139,685
37,659
177,344
Number of
Claims
2 6
13 18 38 80
105 76
338
135
473
Rate of Disable-
ment per t ,000
Lives
9.39 3.8l 3.20 1.99 2.62 3,14 2.10 2.19
2.42
3.58
2.67
Rat io of Actual
Cla ims to Tabular C l a i m s t
303% 140 130 86
119 129 73 78
91%
134~
1 00%
* Tabular claims were c~lculated by applying to the actual age group exposures the crude rates of disablement shown in Table 2 for males, females, and sex unknown combined. f Tabular claims were calculated by applying to the actual age group exposures the crude rates of disablement shown in Table 3 for males, females, and sex unknown combined.

TABLE 5
GROUP LONG-TERM DISABILITY INSURANCE ANALYSIS OF TABLES 1 AND 1A EXPERIENCE BY EXPLOYEE ('LASS
(Six-Month Elimination Period; Calendar Year of Issue Excluded; All Ages; Males, Females, and Sex Unknown Combined) Calendar Years of Experience 1900-70
EMPLOYEE CODE
1 . . . . . . . . . . . . 2 . . . . . . . . . . .
3 . . . . . . . . . . . 4 . . . . . . . . . . . 9 . . . . . . . . . . .
EMPLOYEE CLASS
Nonbargained--essentially executives only Nonbargained--salaried other than essentially
executives only Bargained--hourly Nonbargained--hourly Other or combinations of the above
T o t a l . . . . . . . . . . . . . . . . . . . . . . . . . . . .
TABLE IA EXPERIENCE" No~Jtrmso UNITS ONLY
Number of Experience
Units
169 2,011
55 105
2,505
4,845
Life Years
Exposed
38,947 657,284
34,545 30,763
669,200
1,430,739
Ratio of Number Actual
of Claims to Claims Tabular
Claims*
135 121% 1.726 87
J 231 109 167 176
2,083 t 02
4,342 t 00'~{
TABLE I EXPERIENCE--ALL UNITS
Number of Experience
Units
174 2,046
55 110
2,549
4,934
Lile Years
Exposed
67,512 956,174
34,545 72,675
1,301,035
2,431,941
Ratio of Actual
Claims to Tabular Claims*
112% 93
199 149 135
119%
* Tabular claims were calculated by apDlying to the actual age group exposures the crude rates of disablement shown in Table IA for males, females, and sex unknown combined.

GROUP LONG-TERM DISABILITY 269
long-term disability benefit schedules before integration with other in- come sources, salary at time of disablement, income provided under employer-sponsored plans prior to qualification for long-term disability benefits, and the presence and nature of the integration provisions of the long-term disability plan. The several classifications are somewhat broad. The various parameters max" not be mutual ly exclusive, especially the interrelationships anaong long-term disability benefit levels, salary, and integration. The analyses are shown in Table 5A, separately for non-
TABLE 5A
GROUP LONG-TERM DISABILITY INSURANCE SUPPLEMENTAL ANALYSIS OF TABLE 5 EXPERIENCE FOR EMPLOYEE CLASS CODE 2
(Six-Month Elimination Period; Calendar Year of Issue Excluded; All Ages; Males, Females, and Sex Unknown Combined)
Calendar Years of Experience 1966--70)
Ratio of gross benefit (before reduction for integration) to salary:
Always less than 50% . . . . . . Generally less than 50% "
Subtotal (less than 50%).
50% (exactly or approxi rnately) . . . . . . . . . . . . . .
Always more than 50% . . . . Generally more than 5lYe..
Subtotal (greater than 5O%) . . . . . . . . . . . . . .
Other, including not deter- minable . . . . . . . . . . . . . . .
Total salaried . . . . . . .
NONy2~BO EX~PERiENC.~ UNITS ONLY
Number of Ex-
perience Units
142 32
174
691
760 301
1,061
Ratio Life I Number I of
ALL ExPmtmr~cE Um~s
Ratio Life of
Years A/T Exposed Claims*
I. Relationship between Long-Term Disability Benefit and Salary
85
2,011
15,886 14,645
30,531
277,104
234,453 92,224
326,677
22,972
657,284
39 29
68
i94
i03 !53
~56
08
1, '26
67% 27,395 73 14,64.5
69% 42,040
84% ;73,724
88 !94,362 94 !11,570
9O% ~05,932
101% 34,478
87~o 156,174
58% 73
62%
98%
9o% 95
92%
91%
93%
* Tabular claims were calculated by applying to the actual age group exposures the crude rates of disablement shown in Table 1A for males, females, and sex unknown combined.
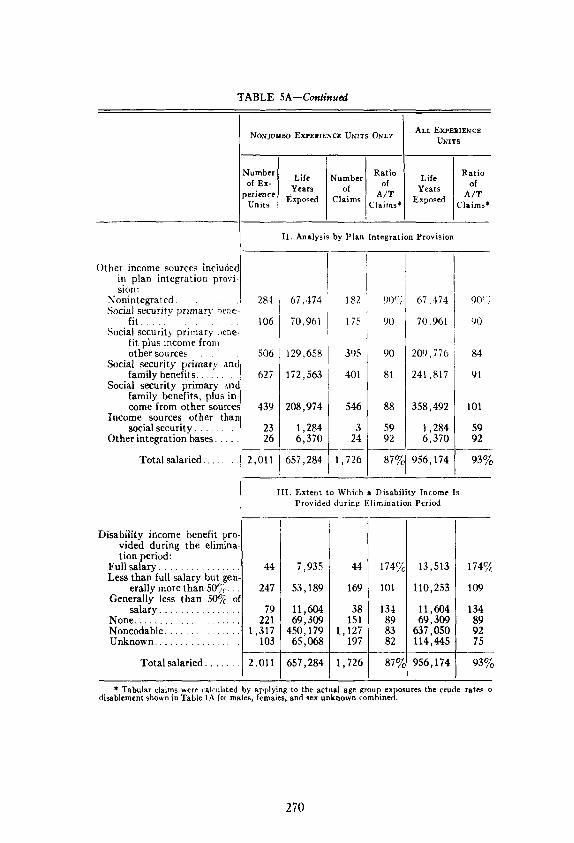
T A B L E 5 A - - C o n t i n u e d
Other income sources includec in plan integration provi- sion:
Nonintegrated . . . . . . . . Social security primary bene
fit . . . . . . . . . . . . . . . . Social security primary bene-
fit plus income from other sources . . . .
Social security primary and family benefits . . . . . .
Social security primary and family benefits, plus in- come from other sources
Income sources other than social security . . . . . . . .
Other integration bases . . . .
Total salaried . . . . . . .
NONJUIJBO EX-PEalENCE UNITS ONLY
Number of Ex-
perience Units
Life Number R a t i o
Years claO/ms A~fT Exposed Claims*
ALL EX~PERIF~ CE UNITS
Ratio
Exposed C a ms*
II. Analysis by Plan Integration Provision
284 67,474
106 70,961
506 129,658
627 172,563
439 208,974
23 1,284 26 6,370
Y O l l -'657,284
182
175
Disability income benefit pro vided during the elimina- tion period:
Full salary . . . . . . . . . . . . . . Less than full salary' " but gen-
erally more than 50~ . . . . Generally less than 50~ ot
salary . . . . . . . . . . . . . . . None . . . . . . . . . . . . . . . . . . . . Noncodable . . . . . . . . . . . . . Unknown . . . . . . . . . . . . . . . .
Total salaried . . . . . .
44
247
79 221
1,317 103
2.011
395
401
546
3 24
1,726
90!!:~ 67,474 90G
90 70,961 90
90 209,776 84
81 241,817 91
88 358,492 101
59 1,284 59 92 6,370 92
8 ~ c 956 ,17 i 93%
III. Extent to Which a Disability Income Is Provided during Elimination Period
44
169
38 151
1,127 197
1,726
89 83 82
87%
13,5131
110,253
11,604 69,309
637,050 114,445
956,174
174~,
109
134 89 92 75
93%
7,935
53,189
11,604 69,309
450,179 65,068
657,284
* Tabular claims were calculated by applying to the actual age group exposures the crude rates o disablement shown in Table IA for males, females, and sex unknown combined.
270
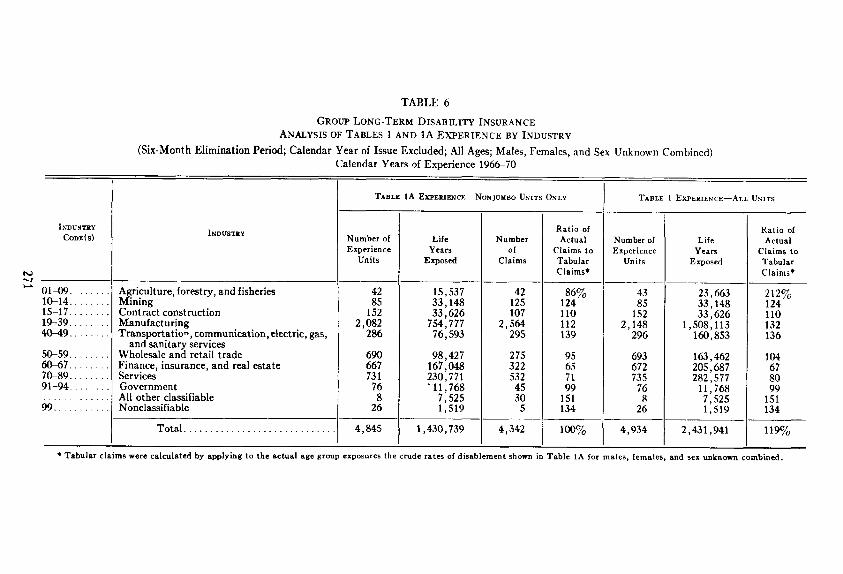
T A B L E 6
GROUP LONG-TERM DISABILITY INSURANCE ANALYSIS OF TABLES 1 AND 1A ~XPERIENCE BY INDUSTRY
(Six-Month El iminat ion Period; Calendar Year of Issue Excluded; All Ages; Males, Females, and Sex Unknown Combined) Calendar Years of Experience 1966-70
bO
I~rvvs~zY Covz(s)
21-09 . . . . 10-14 . . . . 15-17 . . . . 19-39 . . . . 1-0-49 . . . .
50--59 . . . . 50-67 . . . . 10-89 . . . .
1-94 . . . .
~9.
l~rousTmY
Agriculture, forestry, and fisheries Mining Contract construct ion Manufac tu r ing Transpor ta t ion , communicat ion, electric, gas,
and sani tary services Wholesale and retail t rade Finance, insurance, and real estate Services Government All other classifiable Nonclassifiable
Tota l .
TABLE 1A EXPERIENCE--NoN JUMBO UNITS ONLY
Number of Experience
Units
42 85
152 2,082
286
690 667 731
76 8
26
4,845
Life Years
Exposed
15,537 33,148 33,626
754,777 76,593
98,427 167,048 230,771 "11,768
7,525 1,519
1 ,430,739
Number of
Claims
42 125 107
2,564 295
275 322 532
45 30
5
4,342
Ratio of Actual
Claims to Tabular Claims*
86% 124 110 112 139
95 65 71 99
151 134
10e%
TABLE I EXPERIENCE--ALL UNITS
Number of Life Experience Years
Units Exposed
43 23,663 85 33,148
152 33,626 2,148 1,508,113
296 160,853
693 163,462 672 205,687 735 282,577
76 11,768 8 7,525
26 1,519
4,934 2,431,941
Ratio of Actual
Claims to Tabular Claims*
212% 124 110 132 136
104 67 80 99
151 134
119%
* Tabu]ar c la ims were ca lcu la ted by applying to the actua l age group exposures the crude rates of d i sab lement shown in T a b l e tA for males , f emales , and sex unknown combined .
272 COMMITTEE ON GROUP LIFE AND HEALTH INSURANCE
jumbo and for all experience units, respectively. Please note that the tabulars and the actual-to-tabular ratios are consistent with those in Table 5 for Employee Code 2.
ANALYSIS OF RATES OF TERMINATION
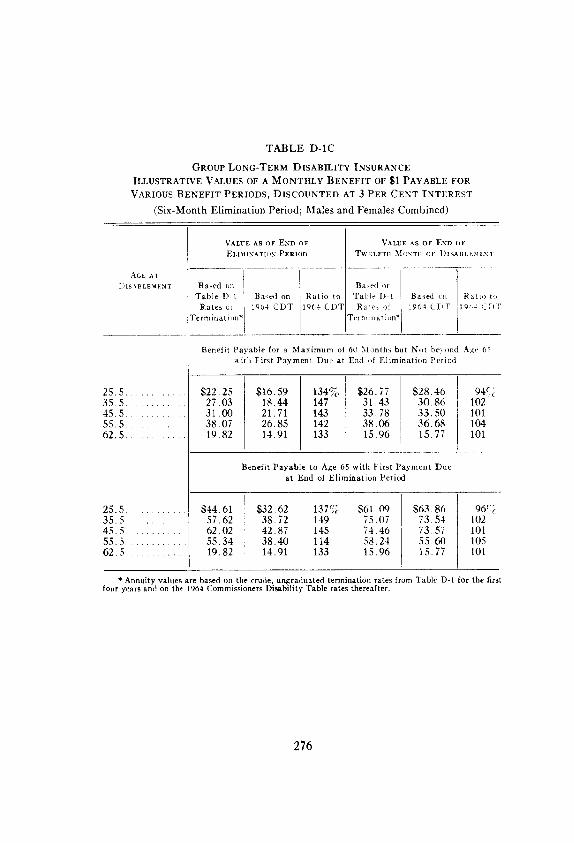
Table D-1 shows, for plans with a six-month elimination period, crude rates of termination from death or recovery based on number of lives, by sex and age groups, for the period 1962-70. Annual rates of termination were not calculated for any experience cell for which there were fewer than ten terminations. Because of the small number of terminations at the later durations, the experience has been truncated at the end of six )Tears of disablement. It should be noted that the termination rates for the first year of disablement relate to the six-month period following the end of the elimination period. There were 18,219 claims exposed to termination, 8,.tql0 of which originated from th(~ 1966 70 and 1,(~)5 from the 1962-65 active ~ives experience (all experience units combined/, with the balance from experience Lmits which were not included in the stud) of rates o i disablement. The actual number of claims which terminated by' death or recover)' is shown in 'Fable I)-IA. Ratios of the actual terminations to the number of terminations that would have been produced by applica- tion of termination rates from the 1964 Commissioners Disability Table to the Table I)-1 exposures are presented in Table D-lB. 'Fable D-l(" compares illustrative values of a monthly benefit of 81 payable for maxi- mum periods of sixty months with such values payable to age 65, calcu- lated on two alternate bases, each discounted at 3 per cent interest. One basis was Tabl¢ D-1 crude termination rates for the first four years, regardless of the actual number of terminations in each duration-age cell, and 1964 Commissioners Disability Table rates thereafter. Reference to Table D d A indicates that there was only one cell, namely, the fourth year of disablement for ages under 30, which had fewer than ten termina- tions. The other basis uses termination rates from the Commissioners Disability Table throughout.
For plans with a six-month elimination period, the Committee sepa- rately analyzed the termination rates for only those claims which were included in the rates of disablement study and found no significant differ- ence from the results shown in Table D-1.
Tables D-2, D-2A, and D-2B analyze the experience of terminations from plans with a three month elimination period and are similar in form and content to the corresponding tables of the D-1 series, except that experience has been truncated at four years. The number of claims exposed to termination was 6,218, of which 2,325 and 94 were included
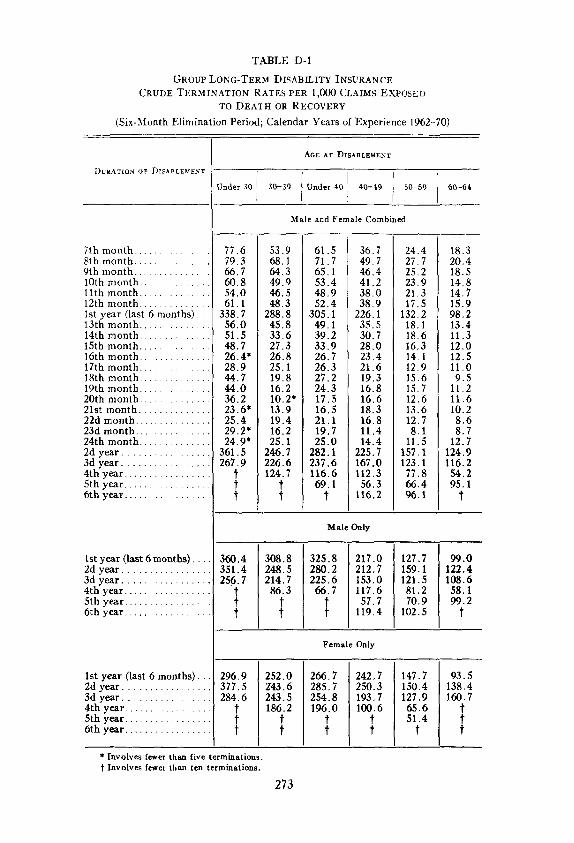
TABLE D-1
GROUP LONG-TERM DISABILITY INSURANCE CRUDE TERMINATION RATES PER 1,000 CLAIMS EXPOSED
TO DEATH OR RECOVERY
(Six-Month Elimination Period; Calendar Years of Experience 1962-70)
DURATION OF DISABLEMENT
7 t h m o n t h . . . . . . . . . . . . .
8 t h m o n t h . . . . . . . . . . . . . .
9 t h m o n t h . . . . . . . . . . . . 10 thmonth . . . . . . . . . . . .
l l t h m o n t h . . . . . . . . . . . . .
12thmonth . . . . . . . . . . . . 1st year (last 6 m o n t h s ) . . 13 thmon th . . . . . . . . . . . . . 14 thmonth . . . . . . . . . . . . . 15 thmonth . . . . . . . . . . . . . 16 thmonth . . . . . . . . . . . . .
17thmonth . . . . . . . . . . . . .
18thrnonth . . . . . . . . . . . . .
19 thmonth . . . . . . . . . . . . .
2 0 t h m o n t h . . . . . . . . . . . . . 21st month . . . . . . . . . . . . . 22d month . . . . . . . . . . . . . . 23d month . . . . . . . . . . . . . . 24th month . . . . . . . . . . . . . 2d year . . . . . . . . . . . . . . . . 3d year . . . . . . . . . . . . . . . . 4th year . . . . . . . . . . . . . . . . 5th year . . . . . . . . . . . . . . . 6th year . . . . . . . . . . . . . . .
1st year (last 6 mon ths ) . . . 2d year . . . . . . . . . . . . . . . . . 3d year . . . . . . . . . . . . . . . . .
4th year . . . . . . . . . . . . . . . . 5th year . . . . . . . . . . . . . . . . 6th year . . . . . . . . . . . . . . . . .
1st year (last 6 months). ,. 2d year . . . . . . . . . . . . . . . . . 3d year . . . . . . . . . . . . . . . . .
4th year . . . . . . . . . . . . . . . .
5th year . . . . . . . . . . . . . . . . . 6th year . . . . . . . . . . . . . . . . .
AGE AT DISABLEMENT
] [ r J U n d e r 30 3 0 - 3 9 U n d e r 40 4 0 - 4 9 5 0 - 5 9
7~ 6 7~ 3 6~ 7 6~ 8 5~ 0 6] 1
33~ 7 5~ 0 5~ 5 4~ 7 2~ 4 2~ 9 4~ 7
0 3~ 2 2, 6 2~ 4 2~ 2 2z 9
36~ 5 26; 9
360.4 351.4 256.7
t t t
296.9 377.5 284.6
t t t
Male and Female Combined
53.9 68.1 64,3 49.0 46.5 48.3
288.8 45.8 33.6 27.3 26.8 25.1 19.8 16.2 10,2" 13.9 19.4 16.2 25.1
246.7 226.6 124.7
t t
I 61.5
I 71.7 65.1 53.4 48.9 52.4
305.1 49,1 39.2 33.9 26.7 26.3 27.2 24.3 17.5 16.5 21.1 19.7 25,0
282.1 237.6 116.6 69.1
t
36,7 49,7 46,4 41.2 38.0 38.9
226.1 35.5 30.7 28.0 23.4 21.6 19,3 16.8 16.6 18,3 16.8 11.4 14.4
225,7 167,0 112.3 56.3
116.2
24.4 27,7 25,2 23,9 21,3 17,5
.32,2 18,1 18,6 16,3 14.1 12,9 15.6 15.7 12.6 13.6 12.7 8.1
11.5 L57.1 .23. l 77.8 66,4 96.1
Male Only
308.8 248.5 214,7 86/3
t
325.8 280.2 225.6
t
217.0 212,7 153.0 117.6 57,7
119.4
127.7 159.1 121.5 81.2 70.9
102.5
Female Only
252,0 243.6 243.5 186~2
t
266.7 285.7 254.8 19~.0
t
242.7 250.3 193.7 10(~, 6
t
147,7 150,4 127.9 65.6
60-64,
18,3 20.4 18.5 14.8 14.7 15.9 98, 2 13.4 11.3 12.0 12.5 11.0 9,5
11.2 11.6 10.2 8.6 8.7
12.7 124.9 116.2 54.2 95.1
t
99.0 122.4 108.6 58.1 99.2
t
93.5 138.4 160.7
t t t
* Involves fewer than five terminstions. t Involves fewer than ten terminations.
273

TABLE D-IA
GROUP LONG-TERM DISABILITY INSURANCE
NUMBER OF CLAIMS TERMINATED BY DEATH OR RECOVERY
(Six-Month El iminat ion Period Calendar Years of Experience 1962-70)
DURATION OF DISABLEMENT
Ist year (last 6 m o n t h s ) 2d year . . . . . . . . . . . 3d year . . . . . . . . . . 4th year . . . . . . . . 5th year . . . . . . . . . .
6th year . . . . . . . .
1st year (last 6 months) . . 2d year . . . . . . . . . . . . . . . 3d year . . . . . . . . . . . . . . . 4th year . . . . . . . . . . . . . . . . 5th year . . . . . . . . . . . . . . . . . 6th year . . . . . . . . . . . . . . . . .
,s t year (last 6 m o n t h s ) . . . 2d year . . . . . . . . . . . . . . . . 3d year . . . . . . . . . . . . . . . . .
4th year . . . . . . . . . . . . . . . . 5th year . . . . . . . . . . . . . . . 6th year . . . . . . . . . . . . . . . .
Under 30
2,8 ,03 34
5
19 0 0 0
g 15
5 2
AGE AT DISABLEMENT
30-39 Under 40 ! 40-49 50-59 i
Male and Female Combined
382
24 8 3
263 112 29
780 428 169 70 18 25
875 675 301 1,2 54 41
Male Only
262
,1 5
411 488 260 102 49 ,4 ,7
654 536
r4 Female Only
36 13 3 2
189
18 5 3
292 168 67 21
4 8
221 139 73 22
17o
60-64
345 254 112 24 17 3
294 211
8 9 22 15 2
51 43 23
2 2 1
274

TABLE D-1B
GROUP LONG-TERM DISABILITY INSURANCE RATIOS OF ACTUAL CLAIMS TERMINATED BY DEATH OR
RECOVERY TO NUMBER OF TERMINATIONS EXPECTED FROM THE 1964 COMMISSIONERS DISABILITY TABLE*
(Six-Month Elimination Period; Calendar Years of Experience 1962-70)
DURATION OF DISAELEMENT
1st year (last 6 months). 2d year . . . . . . . . . . . . . . . 3d year . . . . . . . . . . . . . . . 4th year . . . . . . . . . . . . . . 5th year . . . . . . . . . . . . . . 6th year . . . . . . . . . . . . . .
1st year (last 6 months). 2d year . . . . . . . . . . . . . . . 3d year . . . . . . . . . . . . . . . 4th year . . . . . . . . . . . . . . 5th year . . . . . . . . . . . . . . 6th year . . . . . . . . . . . . . .
1st year (last 6 months). 2d year . . . . . . . . . . . . . . . 3d year . . . . . . . . . . . . . . . 4th year . . . . . . . . . . . . . . 5th year . . . . . . . . . . . . . . 6th year . . . . . . . . . . . . . .
ALL Under
AGES 07 DIS-
ABLE-
MENT
COM- BINED
AGE AT DISABLEMENT
! ,o [ 30-39 !Under 40-49 5 0 - 5 9 60-64 I
Male and Female Combined
41%[93 49%l 29% 115 116 ] 102 [ 92 99 116 97
76 95 73 51 72 62 74 96
115 155
Male Only
39% 67% 62% 47% 34% 29% 92 113 I ~ % 93 110 91 111 109 91 90 75 1 45 76 54
79 100 75 160 126 t 116
Female Only
I 45%[ 55% 49% % 52% 39% 27%
6279[! 8s ~ t t 114 t
* As published by the Health Insurance Association of America, Table B1, Volume III. t Involves fewer thasa ten terminations.
275
T A B L E D-1C
GROUP LONG-TERM DISABILITY INSURANCE
ILLUSTRATIVE VALUES OF A MONTHLY BENEFIT OF $1 PAYABLE FOR
VARIOUS BENEFIT PERIODS, DISCOUNTED AT 3 PER CENT INTEREST
(S ix -Month E l imina t ion Per iod; Males an d Females Combined )
AGE AT
[) I S ~ B LEM EN T
VALUE AS OF END OF
ELIMINATION PERIOD
25 .5 . . . . . . . . . .
3 5 . 5 . . . . . . . . . . 45 .5 . . . . 55 .5 . . . . . . . . . . . 62 ,5 . . . . . . . .
Baaed or~ TaMe D- 1
Rates oi Termination*
B a ~ e d o n
19(14 ( E F T
Ratio t o
1964 ( DT
VALUE AS OF END OF
TWELFTH M o x r J a oF DISAllLEMENT
Ba:<d on Ratb> t<, Table D t I Based on Rate!,, ot i 196:~ l [,T 19~:,4 ',i DI7
Te rr~a [ n a t i on*
Beneiit Payable for a Maximum of 6(I M,:mths but N~t beyond Age 65 with First Payment I)ue at End ,::if Elimination Period
$22 .25 27 .03 31 . 00 38 ,07 19,82
25 .5 . . . . . . . . $44 .61 3 5 . 5 . . . . . 57 .62 4 5 . 5 . . . . . . . . . 62 .02 55 .5 . . . . . . . . . . . 55 ,34 6 2 . 5 . . . . . . . . 19.82
S16.59 18,44 21.71 26 .85 14,91
134% 147 143 142 133
$26 .77 31 .43 33 ,78 3 8 .0 6 15.96
$ 2 8 . 4 6 3 0 8 6 3 3 , 5 0 3 6 , 6 8 15.77
Benefit Payable to Age 65 with First Payment Due at End of Elimination Period
$32 .62 38 .72 42 .87 38 .40 14.91
137% 149 145 114 133
$ 6 1 . ( ~ 75.07 74 ,46 58 .24 15 .96
$ 6 3 . 8 6 7 3 .5 4 73 .57 5 5 , 6 0 15.77
94c~ 102 101 104 101
96,~ 102 101 105 101
* Annuity values are based on tile crude, un~raduated termination rates from Table D-1 for the first four years and on the 1964 Commissioners Disability Table rates thereafter.
2 7 6

T A B L E D-2
GROUP LONG-TERM DISABILITY INSURANCE CRUDE TERMINATION RATES PER 1,000 CLAIMS EXPOSED
TO DEATH OR RECOVERY
(Three-Month Elimination Period; Calendar Years of Experience 1962-70)
DURATION OF DISABLEMENT
4th month . . . . . . . . . . . . . . . 5th month . . . . . . . . . . . . . . 6 th mon th . . . . . . . . . . . . .
7th month . . . . . . . . . . . . . . 8 th month . . . . . . . . . . . . . .
9th month . . . . . . . . . . . . . . . 10th month . . . . . . . . . . . . . l l t h mon th . . . . . . . . . . . . . t2 th mon th . . . . . . . . . . . . . 1st year (last 9 mon ths ) . . 13th mon th . . . . . . . . . . . . . 14th mon th . . . . . . . . . . . . 15th mon th . . . . . . . . . . . . .
16th mon th . . . . . . . . . . . . .
17th month . . . . . . . . . . . . . 18th month . . . . . . . . . . . . 19th mon th . . . . . . . . . . . . .
20th mon th . . . . . . . . . . . . .
21st month . . . . . . . . . . . . . . 22d month . . . . . . . . . . . . . . . 23d month . . . . . . . . . . . . . . 24th mon th . . . . . . . . . . . . . 2d year . . . . . . . . . . . . . . . . . .
3d year . . . . . . . . . . . . . . . 4 th year . . . . . . . . . . . . . . . . .
1st year (last 9 mon ths ) . , 2d year . . . . . . . . . . . . . . . . . 3d year . . . . . . . . . . . . . . . . . 4th year . . . . . . . . . . . . . . . . .
1st year (last 9 months) . ,. 2d year . . . . . . . . . . . . . . . . . 3d year . . . . . . . . . . . . . . . . . 4 th year . . . . . . . . . . . . . . . . .
AGE AT DISABLEMENT
Under 30 ] 30-39 I Under 40 40--49 I 51~,59 [ 60-64
98.8 134.7 145.0 108.2 69.6 60,4 62.8 71.2 65.5
577.2 67,4 60.3 41.0 43.8 37.2 26.5* 17.8" 18.8" 19.5" 20.9* 36.3 43.6*
357.7 206.4
t
Male and Female Combined
99.0 112.5 100.0 96.5 91.8 68.2 54.0 48 .6 42.5
525.8 41.0: 32 .4 28 .4 34 .4 32 .6 22.3 21.7 22.4 16.3 15.4' 8 .0 ' 6 .9 '
248.6 185.9 97.3
81.2 86.6 79.6 69.2 50.0 37.1 31.6 30.5 27.4
399.5 24.7 21.8 19.8 18.7 16.0 12.0
9 . 9
8.4 12.1 14.6 9.3* 5.3*
159,7 109.9 92.7
104.1 141.3 148.0 114.2 80.3 71.3 70.6 74.2 67.3
602.0 70.3 61.5 39.3 37.8 36.3 28.5* 15.8" 22.5 29.6 31.8 38.8 46.2
374. l 205.1
t
114.2 153.8 153.9 126.1 102.3 94.8 87.8 80.8 71,1
649.2 77.2 64.3 3 4 . 9 21 .7 33.3 33.3 10 .2 32.9 61.2 67.0 4 6 . 4 56.3:
4 2 ~ 3
t
51.4 68 .0 61.2 53.1 42 .0 22.3 20 .0 19.3 12.6
301.5 12.5 12.9 14.8 14.7
9 ,6* 10,2 9 ,4* 8 ,8* 6 .5" 8 . 6
17.7 13.8"
131.0 141.7 131.1
Male Only
674, 1 564.4 603.8 523.3 388.0 309.9 391.1 152.2 149.1 415t- 1
383t" 6 216f, 6 ~95i:98 113.9 161.8 t t 94.8 t
Female Only
601.1 594.8 597.8 529.6 432.1
242,3 95.8 42~. 6 312t, 2 34~.5 171t" 4 182.1 t
t t t
267.7 t t t
* Involves fewer than five terminations. t Involves fewer than ten terminations.
277
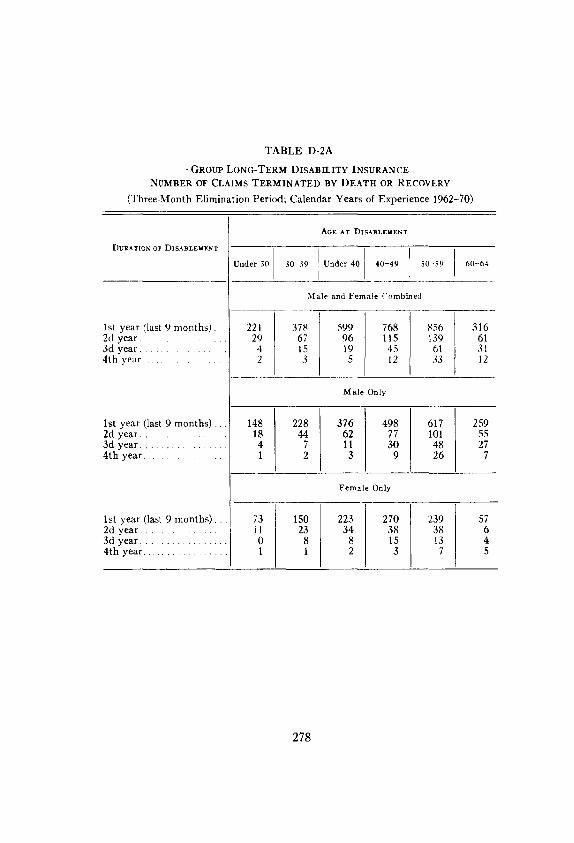
TABLE D-2A
• GROUP LONG-TERM DISABILITY INSURANCE NUMBER OF CLAIMS TERMINATED BY DEATH OR RECOVERY
(Three-Month Elimination Period; Calendar Years of Experience 1962-70)
DURATION OF DISABLEMENT
1st year (last 9 months). 2d year . . . . . . 3d year . . . . . . . . . . . . 4th year . . . . . . . . . . . .
AGE AT DISABLEMENT
Under 30 30-39 ! Under 40 I 40-49 50-59 60-64 I ! I
221 2~
Male and Female Combined
378 67
599 [ 768 96 115 19 45 5 12
856 I39 61 33
,st year (last 9 months) . . 2d year . . . . . . . . . . . . . . . 3d year . . . . . . . . . . . . . . . 4th year . . . . . . . . . . . . . . . .
1st year (last 9 months) . . 2d year . . . . . . . . . . . . .
3d year . . . . . . . . . . . . . . . .
4th year . . . . . . . . . . . . . . . . .
316 61 31 12
Male Only
148 228 376 498 617 259
,4 ~ 44 6 i 77 ,01 s5 , ~ 3~ 4826 "7
Female Only
150 2~
1
223 34 2
270 38 11
239 38
73
1
57 6 4 5
278
T A B L E D - 2 B
GROUP LONG-TERM DISABILITY INSURANCE RATIOS OF ACTUAL CLAIMS TERMINATED BY DEATH OR
RECOVERY TO NUMBERS OF TERMINATIONS EXPECTED FROM THE 1964 COMMISSIONERS DISABILITY TABLE*
( T h r e e - M o n t h E l i m i n a t i o n Pe r iod ; C a l e n d a r Y e a r s of E x p e r i e n c e 1962-70 )
DURATION OF DISABLEMENT
1st y e a r ( last 9 m o n t h s ) . 2 d y e a r . . . . . . . . . . . . . . . 3d y e a r . . . . . . . . . . . . . . . . 4 t h y e a r . . . . . . . . . . . . . . .
1st y e a r ( last 9 m o n t h s ) . 2d y e a r . . . . . . . . . . . . . . . 3 d y e a r . . . . . . . . . . . . . . . 4 t h y e a r . . . . . . . . . . . . . .
1st y e a r ( last 9 m o n t h s ) . 2d y e a r . . . . . . . . . . . . . . . 3 d y e a r . . . . . . . . . . . . . . . 4 t h y e a r . . . . . . . . . . . . . .
ALL
AGES OF ] [ AGE AT DISABLEMENT Dts- I ABLE-
MENT .
= E ~ ,Under 30 30-3° Under 4o 4 o , 9 50~o ~0-o, I i
Male and Female Combined
Male Only
19~15~6% li64% l p % ~ % ~8 % ~8~9 ~85 I~4140~%
Fema|e Only
1 i t 79 t
* As published by the Health Insurance Association of America, Table B1, Volume III. t Involves fewer than ten terminations.
2 7 9
280 COMMITTEE ON GROUP LZFE AND HEALTH INSI.YRANCE
in 1966-70 and 1962-65 portions of the active lives study, respectively. Termination rates for the first year of disablement cover the nine months immediately following the elimination period. Although the volume of claims completing two years of disability is rather limited, there appears to be some indication that much of the effect of selection under the plans with the shorter three-month elimination period has largely disappeared after the second year.
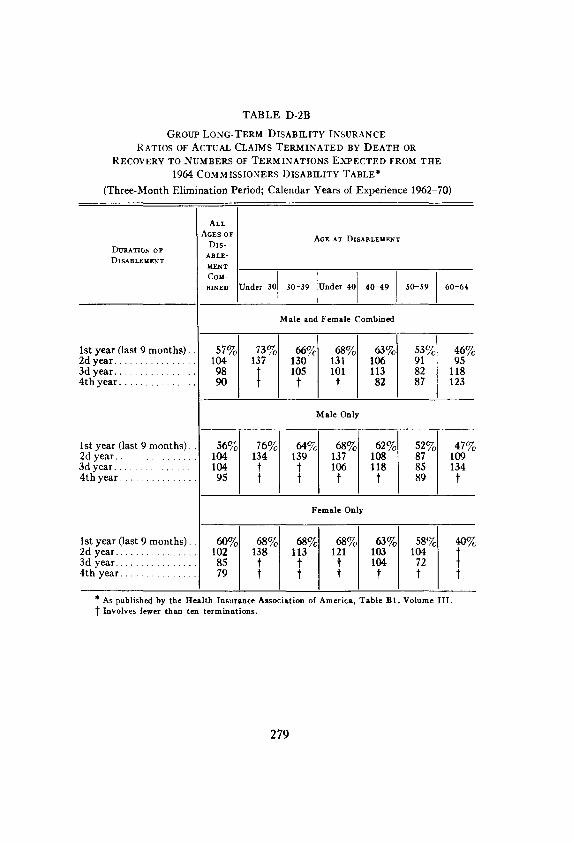
For both the six- and three-month elimination period plans, the low first-year ratios in Tables D-1B and D-2B, respectively, would appear to be due to the shorter elimination periods of the individual health insur- ance experience underlying the first-year termination rates of the 1964 Commissioners Disability Table. Ratios of Table D-1C disabled life annuity values as of the end of the twelfth month of disablement seem to confirm this, at least for plans with a six-month elimination period.
Compared with those in last year's report, which included experience for the period 1962-69, the crude termination rates for the )'ears 1962-70 for both males and females are generally lower for all durations under both the three- and the six-month plans, respectively. The financial consequences of this change are apparent from a comparison of Table D-1C between last )'ear's and this year's reports. As noted under the active lives experience, the 1970 recession may also be impacting in this area.