Embed Size (px)
Citation preview

HEWLETT-PACKARD JOURNAL T E C H N I C A L I N F O R M A T I O N F R O M T H E - h p - L A B O R A T O R I E S
P O R A T E F E B R U A R Y , â € ¢ 1 5 0 1 P A G E M I L L R O A D â € ¢ P A L O A L T O , C A L I F O R N I A 9 4 3 0 4 â € ¢ V O L . 1 7 , N O . 6 F E B R U A R Y , 1 9 6 6
© Copr. 1949-1998 Hewlett-Packard Co.
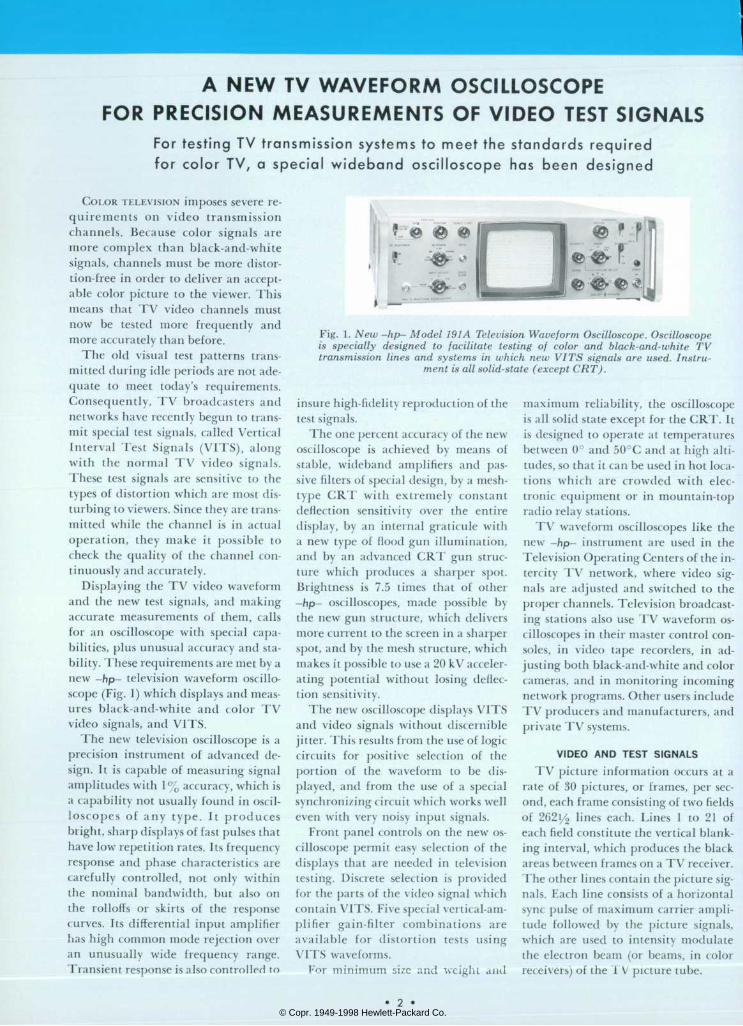
Fig. Oscilloscope New -hp- Model 191 A Television Waveform Oscilloscope. Oscilloscope is specially designed to facilitate testing of color and black-and-white TV transmission lines and systems in which new VITS signals are used. Instru
ment is all solid-state (except CRT).
A N E W T V W A V E F O R M O S C I L L O S C O P E F O R P R E C I S I O N M E A S U R E M E N T S O F V I D E O T E S T S I G N A L S
F o r t e s t i n g T V t r a n s m i s s i o n s y s t e m s t o m e e t t h e s t a n d a r d s r e q u i r e d f o r c o l o r T V , a s p e c i a l w i d e b a n d o s c i l l o s c o p e h a s b e e n d e s i g n e d
COLOR TELEVISION imposes severe re quirements on video transmission channels. Because color signals are more complex than black-and-white signals, channels must be more distor tion-free in order to deliver an accept able color picture to the viewer. This means that TV video channels must now be tested more frequently and more accurately than before.
The old visual test patterns trans mitted during idle periods are not ade quate to meet today's requirements. Consequently, TV broadcasters and networks have recently begun to trans mit special test signals, called Vertical Interval Test Signals (VITS), along with the normal TV video signals. These test signals are sensitive to the types of distortion which are most dis turbing to viewers. Since they are trans mitted while the channel is in actual operation, they make it possible to check the quality of the channel con tinuously and accurately.
Displaying the TV video waveform and the new test signals, and making accurate measurements of them, calls for an oscilloscope with special capa bilities, plus unusual accuracy and sta bility. These requirements are met by a new -hp- television waveform oscillo scope (Fig. 1) which displays and meas ures black-and-white and color TV video signals, and VITS.
The new television oscilloscope is a precision instrument of advanced de sign. It is capable of measuring signal amplitudes with 1% accuracy, which is a capability not usually found in oscil loscopes of any type. It produces bright, sharp displays of fast pulses that have low repetition rates. Its frequency response and phase characteristics are carefully controlled, not only within the nominal bandwidth, but also on the rolloffs or skirts of the response curves. Its differential input amplifier has high common mode rejection over an unusually wide frequency range. Transient response is also controlled to
insure high-fidelity reproduction of the test signals.
The one percent accuracy of the new oscilloscope is achieved by means of stable, wideband amplifiers and pas sive filters of special design, by a mesh- type CRT with extremely constant deflection sensitivity over the entire display, by an internal graticule with a new type of flood gun illumination, and by an advanced CRT gun struc ture which produces a sharper spot. Brightness is 7.5 times that of other -hp- oscilloscopes, made possible by the new gun structure, which delivers more current to the screen in a sharper spot, and by the mesh structure, which makes it possible to use a 20 kV acceler ating potential without losing deflec tion sensitivity.
The new oscilloscope displays VITS and video signals without discernible jitter. This results from the use of logic circuits for positive selection of the portion of the waveform to be dis played, and from the use of a special synchronizing circuit which works well even with very noisy input signals.
Front panel controls on the new os cilloscope permit easy selection of the displays that are needed in television testing. Discrete selection is provided for the parts of the video signal which contain VITS. Five special vertical-am plifier gain-filter combinations are available for distortion tests using VITS waveforms.
For minimum size and weight and
maximum reliability, the oscilloscope is all solid state except for the CRT. It is designed to operate at temperatures between 0° and 50°C and at high alti tudes, so that it can be used in hot loca tions which are crowded with elec tronic equipment or in mountain-top radio relay stations.
TV waveform oscilloscopes like the new -hp- instrument are used in the Television Operating Centers of the in tercity TV network, where video sig nals are adjusted and switched to the proper channels. Television broadcast ing stations also use TV waveform os cilloscopes in their master control con soles, in video tape recorders, in ad justing both black-and-white and color cameras, and in monitoring incoming network programs. Other users include TV producers and manufacturers, and private TV systems.
VIDEO AND TEST SIGNALS TV picture information occurs at a
rate of 30 pictures, or frames, per sec ond, each frame consisting of two fields of 262i/2 lines each. Lines 1 to 21 of each field constitute the vertical blank ing interval, which produces the black areas between frames on a TV receiver. The other lines contain the picture sig nals. Each line consists of a horizontal sync pulse of maximum carrier ampli tude followed by the picture signals, which are used to intensity modulate the electron beam (or beams, in color receivers) of the TV picture tube.
• 2 © Copr. 1949-1998 Hewlett-Packard Co.

Fig. Waveform New TV Waveform Oscilloscope in typical TV control room. Waveform shown is multiburst signal used ¡or checking frequency response of network.
Vertical Interval Test Signals are in serted on lines 18 and 19 of both fields. The three VITS waveforms are:
1 . M u l t i b u r s t ( l i n e 1 8 , f i e l d s 1 a n d 2 ) : W h i t e b a r f o l l o w e d b y b u r s t s o f 0 . 5 M H z ( M c / s ) , 1 . 5 M H z , 2 . 0 M H z , 3 . 0 M H z , 3 . 6 MHz, and 4.2 MHz. This s ignal g ives a quick c h e c k o f t h e a m p l i t u d e v s . f r e q u e n c y r e sponse o f the channe l . The s ix burs ts have equal ampl i tudes i f the response is cor rec t , and v ice versa. To check that the mul t iburs t basel ine is at the same level for each burst , the s ine waves are removed wi th a low pass f i l ter .
2 . S ine -Squared Pu lse and Bar ( l i ne 19 , f ie ld 1) : Pu lse wi th s ine-squared shape and ha l f - amp l i t ude du ra t i on o f e i t he r 0 . 125 / i s (T pulse), 0.0625 ,us (T/2 pulse), or 0.25 ¿¡s ( 2 T p u l s e ) , f o l l o w e d b y b a r w i t h s i n e - squa red l ead ing and t ra i l i ng edges and du ra t ion o f one-ha l f l i ne . A symmet r i ca l s ine - squared pulse ind icates that the phase char acter is t ic o f the channel is correct , and v ice versa. Droop on the top o f the bar ind icates poo r m id - f r equency r esponse . Ove rshoo t s or r ing ing ind ica te poor t rans ient response.
3 . M o d u l a t e d S t a i r s t e p s ( l i n e 1 9 , f i e l d 2) : 10 equa l s teps go ing f rom b lack leve l to whi te level wi th burst of 3.58 MHz s ine wave on each s tep . Th is s igna l i s used fo r check i ng t he channe l f o r d i f f e ren t i a l ga i n ( va r i a t i ons in ga in w i th s igna l amp l i t ude) and d i f f e ren t i a l phase . Low f requency d i f f e ren t i a l g a i n i s c h e c k e d b y f i l t e r i n g o u t t h e 3 . 5 8 MHz s i ne waves w i t h a l ow pass f i l t e r and c h e c k i n g t h e s t e p s f o r e q u a l a m p l i t u d e s . D i f fe ren t ia l ga in a t 3 .58 MHz is checked by f i l ter ing out the steps wi th a band pass f i l ter a n d c h e c k i n g t h e b u r s t s f o r e q u a l a m pl i tudes. VERTICAL AMPLIFIER FILTER RESPONSES
The filters needed for accurate VITS distortion measurements are built into the vertical amplifier of the new -hp- TV waveform oscilloscope.
The FLAT response is used for gen eral observation of the waveforms, for checking the frequency response of the channel by means of the mul t iburs t s igna l , and for checking phase and transient responses by means of the sine-squared pulse and bar.
With the RESPONSE control in the * S e e p . 7 h e r e i n f o r a m o r e c o m p l e t e d i s c u s s i o n o f V I T S .
FLAT position, the vertical amplifier has a frequency response which is flat with in a small fraction of one dB (see speci fications) up to a frequency of 4.5 MHz. The response then decreases monoton- ically, and is down 20 dB at 20 MHz (Fig. 3). The function of this fast roll- off, which is faster than a Gaussian roll- off, is to eliminate high-frequency noise, which can be troublesome in TV waveform observations.
The phase characteristic of the FLAT response is linear, enabling the oscil loscope to produce extremely symmet rical displays of the three sine-squared pulses (the T/2 pulse contains signif icant frequency components up to 16 MHz). The symmetry of the sine- squared pulse is a measure of the free dom of a channel from phase distor tion, so it is important that no assym- metry is introduced by the oscilloscope.
In achieving its excellent amplitude and phase characteristics, the FLAT filter response causes small preshoots and overshoots. However, these are sig nificant only on the T/2 pulse, where they are typically 3% and equal to each other within 1%.
The LOW PASS response is used for filtering out the multiburst frequencies in order to check the baseline of the multiburst waveform for dc compo nents which indicate amplitude non- linearities. It is also used for eliminat ing the 3.58 MHz color subcarrier bursts from the modulated stairstep sig nal in order to check for low-frequency differential gain.
The LOW PASS position of the RE SPONSE control gives the vertical ampli fier a frequency response which is down more than 30 dB near 0.5 MHz and more than 40 dB at all frequencies * S i m i l a r t o l e r a n c e s a p p l y t o t h e s t e p r e s p o n s e . R i s e t i m e i s l e s s t h a n 5 0 n s .
greater than 1.5 MHz, so that the dis plays of the multiburst baseline and unmodulated stairsteps are free of re sidual sine waves. The response is fiat within 2 dB to 150 kHz so that the multiburst baseline, the unmodulated stairsteps and the sync pulses are dis played without appreciable rounding.
A typical multiburst waveform con sists of a white flag followed by about 6.4 jus of 0.5 MHz sine wave and about 4.7 ,us of 1.5, 2.0, 3.0, 3.6, and 4.2 MHz sine waves. The waveform is generated simply by gating the outputs of six oscillators in sequence, without regard to relative phase. Consequently, when the multiburst generator switches from one burst frequency to the next, an abrupt change of voltage may occur in the output waveform. This makes the step response of the oscilloscope's LOW PASS filter critical, for if the transients induced in the oscilloscope do not die out quickly, the baseline of the multi- burst waveform will be obscured. In the new -hp- instrument, the 0-to- 100% rise time of the LOW PASS re sponse is about 2 /¿s, and overshoot is less than 2%. This means that, if an abrupt voltage change does occur in the multiburst waveform when the LOW PASS filter is being used, all transients are reduced to less than 2% of their initial amplitudes within 2 jus, leaving 4.4 or 2.7 ¿is of undisturbed baseline for measurement purposes.
The IRE response of the vertical am plifier is used for attenuating the color signal and any noise that may be pres ent in order to make amplitude meas-
0 . 0 0 1 0 . 0 1 0 . 1 1 . 0 FREQUENCY (MHz )
Fig. 3. Basic FLAT frequency response of oscilloscope is down less than 0.1 dB below 4.5 MHz, less than 1 dB at 8 MHz, 3 dB at 10.5 MHz, then has very fast rolloff and is down 20 dB at 20 MHz. This eliminates high-frequency noise if present on incom ing line. Lower diagram shows ±0.05 dB
flatness below 1 MHz.
• 3 • © Copr. 1949-1998 Hewlett-Packard Co.

Fig. Television Block Diagram of Vertical Amplifier in -hp- Model 191 A Television Waveform Oscilloscope. Passive filters of special design give accurately-shaped responses with high stability. Differential-to-single-ended input amplifier per mits use of more stable single-ended filters, has high common mode rejection
over wide frequency range.
urements on the monochrome signal. The IRE response gives the vertical amplifier a standard rollofl as described in IEEE Standards.1 It is down 20 dB at the color subcarrier frequency of 3.58 MHz.
The CHROMINANCE response is used to remove the stairsteps from the mod ulated stairstep signal in order to check a channel for high-frequency differen tial gain. The filter puts the 10 bursts of 3.58 MHz on the same line to permit easy comparison of their amplitudes. With the RESPONSE control in the CHROMINANCE position, the vertical am plifier has a bandpass response with center frequency of 3.58 MHz, the color subcarrier frequency.
T h e D I F F E R E N T I A L G A I N r e s p o n s e à S
the same as the CHROMINANCE response, except that an additional voltage gain of 5 (14 dB) is provided for making dif ferent ial gain measurements with re spect to 100%.
VERTICAL AMPLIFIER
Fig. 4 is a block diagram of the ver t ical ampli f ier . To permit 1% dis tor tion measurements, the four frequency responses of this amplifier had to be carefully shaped and held within tight tolerances. This kind of requirement is unusual in oscilloscope design; usually- only the 3 dB bandwidth is specified, and the shape of the rolloff is not.
I n o rde r t o ach i eve t he fou r f r e -
T h e I R E f i l t e r m e e t s t h e r e q u i r e m e n t s o f t h e I E E E S t a n d a r d o n T e l e v i s i o n M e a s u r e m e n t o f L u m i n a n c e S i g n a l L e v e l s ( A S A C 1 6 . 3 1 - 1 9 5 9 ) e x c e p t t h a t t h e t o l e r a n c e s a r e t i g h t e r t h a n t h o s e r e q u i r e d b y t h e s e s t a n d a r d s .
quency response characteristics with ac curacy and stability the vertical am plifier is designed to have a wide band width, and passive filters are used to shape the response. This eliminates any possibility that changes in tran sistor characteristics with temperature or age, or differences between transis tors, will change the responses. Each amplifier block has adequate feedback, even at the high frequencies, so that expected component and temperature variations will not affect either the basic response or the overall response.
The input amplifier is a differential- to-single-ended converter, which allows the oscilloscope to accept the normal two-wire TV cables, but permits the use of single-ended filters, which are much less sensitive to component varia tions and stray capacitance. The inter stage amplifier is also simplified by this arrangement.
Common mode rejection of a dif ferential amplifier is the amount by which signals common to both inputs are reduced in the output. In a TV os cilloscope, high common mode rejec tion results in a display which is free of any noise and interference common to both wires of two-wire TV cables. In the new -hp- oscilloscope, the common mode rejection of the input amplifier is greater than 46 dB up to 2 MH/, with a 6 clB-pei -octave rollolf up to 20 MHz. In actual production instru ments the amplifier-filter combinations have overall common mode rejections
Fig. 5. HO1-1S1A version of new TV Waveform Oscilloscope has front and rear teleplwne-alyle input jacks, no WRGti sweep mode.
better than 30 dB up to 20 MHz. To permit video signals to be ob
served without disturbing the wave forms, the input connections to the ver tical amplifier are made by means of 75 ohm and 124 ohm 'loop-through' sys tems. Video signals in operating centers and control rooms are carried either by a coaxial cable with a characteristic im pedance of 75 ohms or by a balanced two-wire cable with a characteristic im pedance of 124 ohms. The input cir cuits of the oscilloscope are designed to look like short sections of 75 ohm and 124 ohm lines, so that the instrument can be inserted into either type of cable without mismatch.
When distortion measurements are to be made, the display of the video signal is adjusted for a standard maxi mum amplitude of 140 IRE units. In the polarity most often used, the sync pulses have a magnitude of — 40 IRE, the blanking level is 0 IRE, black is -4- 7.5 IRE, and white is -f 100 IRE. In standard TV practice, 140 IRE units is equal to 1 volt. The new oscilloscope has a switch-selected gain setting which will display 100 IRE units for an input signal amplitude of 0.714 volt peak-to- peak. A variable gain control permits proper adjustment of the display for other input signal amplitudes. The gain can be switched to the fixed gain position without disturbing the setting of the variable gain control, so that the display can be calibrated quickly with out readjustment. Also provided is a calibrator which supplies to the verti cal amplifier a 30 kHz signal with a peak-to-peak amplitude of 0.714 volt.
Because of the presence of picture in formation in the composite video sig nal, the average value of the signal changes continually. To make the dis play stable, the oscilloscope has a dc restorer which, when the front-panel control is in the ON position, refer ences the display to the blanking level instead of to the average value of the signal. To determine the blanking volt age, the restorer circuit samples the 'back porch,' which is about 5 micro seconds of blanking level following each horizontal sync pulse. The pres ence or absence of the color synchroniz ing burst on the back porch does not affect the restorer.
1 he dc restorer is a soft clamp; that
• 4 • © Copr. 1949-1998 Hewlett-Packard Co.

is, it has a long sampling time constant, so that it takes many samples to estab lish the final reference voltage. This means that if 60 H/ hum is present on the video signal it will appear on the display and be detected. A hard clamp would remove the 60 Hz hum.
HORIZONTAL SWEEP Observa t ions o f ind iv idua l VITS
waveforms require that an oscilloscope be capable of displaying a single line of the TV picture. Because the picture is scanned in two fields, the scope must also be able to dist inguish f ield one from field two. This is not very diffi cult, because the fields differ by one- half line in the position of the vertical sync pulses with respect to the hori- /ontal sync pulses; however, it is diffi cult to make the field selection circuit opera te re l i ab ly in the p resence o f noise and signal fluctuations, or when subjected to power line transients or temperature changes. In the new -hp- oscilloscope, the field to be displayed is selected with a front-panel switch. Internal logic circuits monitor the TV synchronizing waveform and trigger the sweep at the beginning of the de sired field. The sync signal is checked continuously, so that if a noise pulse or other disturbance resets the sweep at the wrong time, the mistake is cor rected automatically. The field selec t ion circuit has large tolerances and requires no adjustment. This positive field selection and insensitivity to dis turbances results in an easily selected, stable display.
Another front-panel control allows the operator to select for display a sin gle l ine of the TV picture . Discrete selection of lines 16 through 21 is pro vided, plus continuously variable selec tion of the other lines. A video ampli fier output supplies both video and a gate signal for causing the selected line to appear br ighter on a picture mon itor.
The oscilloscope is designed to op erate with input signals having peak- to-peak amplitudes between 0.2 V and 2 V. This 10 to 1 range complicates the design of the synchronizing circuit, because a circuit which is designed to operate reliably at low input levels may be completely confused by noise at high input levels . The sync circuit of the new -hp- oscilloscope automatically
Fig. Development, Bernard M. Oliver, -hp- Vice President for Research and Development, reviews design of new TV oscilloscope and CRT with part of initial design team at —hp— Research and Development Laboratories at Palo Alto. Engineers are (1. to P. Edward Heinsen, Richard Monnier, project leader, William P. Kruger,
CRT design leader, Dr. Oliver, and Gregory Justice.
senses the signal level and adjusts the triggering to keep the display jitter-free at all input levels.
F ive sweep modes a r e p rov ided . They are:
1. 2 V, which g ives a sweep length of two f ie lds and a sweep speed wi thout magni f ica t i on o f 0 .175 V /cm (abou t 2 .9 ms /cm) . V i s the durat ion o f one f ie ld , or 1 /60 s .
2 . 2H, wh ich g ives a sweep length o f two l i n e s a n d a s w e e p s p e e d o f 0 . 1 2 5 H / c m ( a b o u t 8 / j s / c m ) . H i s t h e d u r a t i o n o f o n e line, or 63.5 /¡s.
3 . L INE, which a lso g ives a sweep speed o f 0 . 1 2 5 H / c m a n d a l l o w s s e l e c t i o n o f a s ing le l ine fo r d isp lay .
4. FREE RUN, which is used for envelope d isp lay (observa t ion o f en t i re wave fo rm fo r c h e c k i n g m a x i m u m e x c u r s i o n s o f p i c t u r e signal).
5 . W R G B , w h i c h s w i t c h e s t h e s w e e p t o the ex te rna l wh i te - red-green-b lue s ta i rcase s ignal used in ad just ing co lor cameras.
Sweep magnifications of 5 and 25 are available.
C A T H O D E R A Y T U B E
One of the most challenging require ments for the new oscilloscope was that it must display the T/2 pulse, which is a sine-squared pulse with a half-ampli tude duration of 62.5 nanoseconds, oc curring at a repetition rate of only 30 Hz. To give the pulse adequate width for measurement purposes , the hor i zontal sweep speed of the oscilloscope m u s t b e m a g n i f i e d t o 0 . 0 0 5 H / c m (0.3175 us /cm). With older osci l lo scopes, this fast sweep speed and the low repetition rate of the signal would produce a barely visible display. A par tial solution to this problem is simply to increase the accelerating voltage of the CRT. However , t he inc rease in
brightness that can be obtained in this manner is limited, and with older CRT designs the higher voltage causes a loss of deflection sensitivity, which would make i t impossible to drive the CRT with transistor amplifiers. To give the new oscil loscope considerably more brightness while retaining sufficient de flection sensitivity for transistor drive, a new cathode-ray tube had to be de veloped.
The basic design of the new CRT is similar to that introduced in -hp- high frequency oscilloscopes.2 This design uses a t h in , sphe r i ca l , me ta l -mesh shield, to terminate the lines of force of the post-accelerator field. The resulting field configuration eliminates the loss of deflection sensitivity that would oth erwise accompany a high accelerating voltage. Since brightness of the CRT increases with accelerating potential, the new CRT uses the highest practical accelerating voltage. Its 20 kV acceler ating potential gives an improvement in spot brightness of about a factor of two over other -hp- oscilloscopes.
Further increase in brightness was achieved by developing a more efficient CRT gun structure. The new electron gun uses lenses of an improved design to focus the beam, so that it is able to deliver more than three times the cur rent previously attainable. In spite of the higher current density, the spot is sharper than before. The net result of the higher accelerating voltage and the higher current density is an improve- ! F l o y d G . S i e g e l , ' A N e w S O M C O s c i l l o s c o p e B a s e d o n a n A d v a n c e d C R T D e s i g n , ' ' H e w l e t t - P a c k a r d J o u r n a l , ' V o l . 1 3 , N o . 8 , A p r i l 1 9 6 2 .
• 5 • © Copr. 1949-1998 Hewlett-Packard Co.

Fig. 7. Ralph R. Reiser, leader of TV Waveform Oscilloscope project at -hp- Oscilloscope Division, Colorado Springs, discusses new Model 191 A with chief engi neer H. H. Schubarth of station KBTV,
Denver.
ment in brightness of about 7.5 over -hp- high-frequency oscilloscopes, and an easily interpreted T/2 pulse display.
Measurements of Vertical Interval Test Signals (VITS) must often be made to an accuracy of 1 %. This means that an internal graticule is a necessity, because external graticules are subject to parallax errors. The new oscillo scope has an internal graticule in the same plane as the phosphor, which eliminates parallax and permits precise reading of the display from any angle or from a distance. The vertical scale of the internal graticule is marked in IRE units.
Certain VITS measurements call for * T h e f a c t o r o f 7 . 5 i s a m e a s u r e d v a l u e . T h e e y e w o u l d s e e a n i m p r o v e m e n t i n b r i g h t n e s s o f a b o u t t h r e e t i m e s .
external overlay graticules to be used in conjunction with the internal grati cule. An array of external graticules for the new oscilloscope is being pre pared.
Illumination of both internal and external graticules is accomplished by flooding the CRT screen with elec trons. The method for doing this is another new -hp- development. The source of electrons is located behind the mesh structure of the tube, and the mesh helps to distribute the electrons evenly over the tube face. The amount of illumination can be controlled from the front panel.
P31 alumini/.ed phosphor is used in the new CRT.
E N V I R O N M E N T A L D A T A The oscilloscope is designed to oper
ate at temperatures from 0° to 50°C, at altitudes up to 15,000 feet, and under conditions of moderately severe vibration and shock. Because it is all solid state except for the CRT, power requirements are low (70 watts), no cooling fan is needed, and weight is only 34 pounds. The low power dissi pation and ability to operate in high- temperature environments make the new instrument especially suitable for operation in areas like TV control * V i b r a t i o n : 1 5 1 m i n c y c l e s , 1 0 - 5 5 H z , 0 . 0 1 0 " p e a k - t o - p e a k S h o c k : 4 i n . d r o p o f o n e e d g e , a c c e l e r a t i o n o f 6 g f o r 1 1 m s , 3 f t . d r o p o f s h i p p i n g c o n t a i n e r .
rooms, which are already crowded with electronic equipment. High-altitude operation and shock resistance make it capable of operating anywhere, even in mountain-top radio relay stations and mobile operating centers.
A C K N O W L E D G M E N T S
Design and development of the Model 191 A TV Waveform Oscillo scope were joint efforts of several divi sions of the Hewlett-Packard Com pany. The initial design was carried out by the Advanced Research and De velopment Laboratory. The design team was directed by Richard E. Mon- nier and included Edward A. Heinsen, Gregory Justice, Richard A. Marconi, and Philip G. Foster, with technical support from Bernard M. Oliver and Paul E. Stoft. Design and development of the new CRT were the responsi bility of William R Kruger, Domenick J. DeSimone, and James A. Chese- brough, with technical assistance from Bernard M. Oliver. Final design was under the direction of Ralph R. Reiser of the oscilloscope division. The design team included William G. Smith, Carl- ton E. Glitzke, Ed Allen Evel, Wayne O. Budge, George L. LeBaron, Jr., Donald E. Watson, Robert H. Briggs, and Leon Skidmore.
— Richard E. Monnier and Ralph R. Reiser
S P E C I F I C A T I O N S -hp-
M O D E L 1 9 1 A T E L E V I S I O N W A V E F O R M O S C I L L O S C O P E
V E R T I C A L A M P L I F I E R I N P U T C I R C U I T : 7 5 o h m s u n b a l a n c e d t o
g r o u n d , a n d 1 2 4 o h m s b a l a n c e d t o g r o u n d . I N P U T I M P E D A N C E ( o f a m p l i f i e r ) : 1 2 . 5 k
u n b a l a n c e d t o g r o u n d , a n d 2 5 k b a l a n c e d t o g r o u n d . P o w e r o f f - o n t r a n s i e n t l e s s t h a n 1 0 m V . P r o t e c t i o n t o 1 0 0 v o l t s , 1 / i s p u l s e s .
C O M M O N M O D E R E J E C T I O N : - 4 6 d B f r o m 0 t o 2 M H z ; d e c r e a s e s a t 6 d B / o c t f r o m 2 M H z t o 2 0 M H z .
G A I N C O N T R O L : V a r i a b l e c o n t r o l p r o v i d e s 1 4 0 I R E v e r t i c a l d e f l e c t i o n f o r c o m p o s i t e T V v i d e o s i g n a l f r o m . 2 v o l t s t o o v e r 2 v o l t s p e a k - t o - p e a k a m p l i t u d e . S e p a r a t e g a i n s w i t c h s e t s t h e v e r t i c a l d e f l e c t i o n t o d i s p l a y 1 0 0 I R E u n i t s f o r a 0 . 7 1 4 v o l t  ± 1 % p e a k - t o - p e a k i n p u t s i g n a l .
D C R E S T O R E R : " O n " p o s i t i o n r e s t o r e s t o t h e b a c k p o r c h w i t h a t i m e c o n s t a n t g r e a t e r t h a n 0 . 3 s e c o n d . C o l o r b u r s t e f f e c t o n d i s p l a y w i l l b e l e s s t h a n 1 I R E u n i t . " O f f " p o s i t i o n r e s t o r e s t o a v e r a g e v a l u e o f s i g nal .
C A L I B R A T O R : A u t o m a t i c a l l y s w i t c h e s v e r t i c a l c h a n n e l t o " f l a t " p o s i t i o n , h o r i z o n t a l s w e e p t o t h e " 2 H " p o s i t i o n , a n d p r o v i d e s a 3 0 k H z , 0 . 7 1 4 v o l t  ± 1 % s i g n a l t o t h e v e r t i c a l a m p l i f i e r .
F I L T E R R E S P O N S E S " F L A T " P O S I T I O N : Â ± 0 . 0 5 d B f r o m 1 0 0 H z
t o 1 M H z , m o n o t o n i c a l l y d e c r e a s i n g t o
- 0 . 1 0 Â ± 0 . 0 5 d B a t 4 . 5 M H z , - 3 d B a t 1 0 . 5 M H z , a n d - 2 0 d B a t 2 0 M H z . R i s e t i m e l e s s t h a n 5 0 n a n o s e c o n d s . O v e r s h o o t a n d p r e s h o o t s o f t h e T / 2 p u l s e a r e l e s s t h a n 5 % w i t h o v e r s h o o t a n d p r e s h o o t s e q u a l w i t h i n 1 % o f e a c h o t h e r . L e s s t h a n 1 % t i l t o n 6 0 - H z c y c l e s q u a r e w a v e w i t h d c r e s t o r e r o f f .
" I R E " P O S I T I O N : S t a n d a r d r o l l o f f a s d e s c r i b e d o n p a g e 4 8 4 o f 1 9 5 8 I R E P r o c e e d i n g s . 2 0 d B d o w n a t 3 . 5 8 M H z .
" C H R O M I N A N C E " P O S I T I O N : A b a n d - p a s s f i l t e r w i t h a O o f 4 a n d a c e n t e r f r e q u e n c y o f 3 . 5 8 M H z .
" D I F F E R E N T I A L G A I N " P O S I T I O N : S a m e r e s p o n s e a s t h e C h r o m i n a n c e w i t h 1 4 d B o f a d d i t i o n a l g a i n .
" L O W P A S S " P O S I T I O N : D o w n m o r e t h a n 3 0 d B a t 0 . 5 0 0 Â ± 0 . 0 1 5 M H z ; d o w n m o r e t h a n 4 0 d B a t a l l f r e q u e n c i e s 1 . 5 M H z a n d h i g h e r ; d o w n l e s s t h a n 2 d B a t 0 . 1 5 M H z .
H O R I Z O N T A L S W E E P I N T E R N A L S W E E P :
" 2 V " P O S I T I O N ( 0 . 1 7 5 V / c m ) : 5 % f o r X I , X 5 , a n d X 2 5 m a g n i f i c a t i o n .
" 2 H " P O S I T I O N ( 0 . 1 2 5 H / c m ) : 3 % f o r X I , a n d X 5 m a g n i f i c a t i o n . 5 % f o r X 2 5 m a g n i f i c a t i o n .
" L I N E " P O S I T I O N : 0 . 1 2 5 H / c m . D i s c r e t e l i n e s e l e c t i o n f o r l i n e s 1 6 , 1 7 , 1 8 1 9 2 0 , a n d 2 1 . V a r i a b l e l i n e s e l e c t i o n f o r a l l l i n e s i n t h e e n t i r e f i e l d .
" F R E E R U N " P O S I T I O N : E n v e l o p e d i s p l a y f o r f a s t v i d e o s e t u p .
E X T E R N A L I N P U T S : T w o i n p u t s t o s y n c o s c i l l o s c o p e t o e x t e r n a l T V s y n c g e n e r a t o r s . S t a i r c a s e i n p u t t o a c c e p t a 4 s t e p s t a i r c a s e f o r W R G B ( m a y b e m o d i f i e d t o a c c e p t a 3 s t e p s t a i r c a s e ) .
F I E L D S E L E C T : A t w o p o s i t i o n s w i t c h t o p o s i
t i v e s e l e c t t h e d e s i r e d f i e l d . C i r c u i t i s i n s e n s i t i v e t o n o i s e p u l s e s .
B L A N K I N G : D e c o u p l e d t o r e m o v e t r a c e w i t h n o s i g n a l i n p u t .
L I N E A R I T Y : Â ± 0 . 5 % o f f u l l s c a l e .
C R T D I S P L A Y T U B E T Y P E : 2 0 k V , p o s t a c c e l e r a t o r w i t h
h i g h w r i t i n g r a t e f o r v i e w i n g o f T / 2 s i n e 1 p u l s e ; t y p e P 3 1 a l u m i n i z e d p h o s p h o r .
G R A T I C U L E : I n t e r n a l g r a t i c u l e e l i m i n a t e s p a r a l l a x e r r o r . R e c t a n g u l a r 7 c m b y 1 0 c m d i s p l a y ; 1 4 0 I R E â € ” 7 c m . E x t e r n a l g r a t i c u l e s f o r s i n e 2 p u l s e a n d b a r , v i d e o m o d u l a t i o n , e t c . B e a m a l i g n m e n t c o n t r o l .
B E Z E L : P r o v i s i o n f o r e x t e r n a l t r a n s p a r e n t p l a t e w i t h g r a t i c u l e m a r k i n g s . P r o v i s i o n f o r i l l u m i n a t i o n o f b o t h t h e i n t e r n a l a n d t h e e x t e r n a l g r a t i c u l e .
G E N E R A L D E S I G N : A l l s o l i d s t a t e e x c e p t f o r C R T . P O W E R : A p p r o x i m a t e l y 7 0 w a t t s ( n o f a n ) . L I N E : 1 1 5 o r 2 3 0 v o l t s l i n e  ± 1 0 % . 5 0 t o
4 0 0 H z . T E M P E R A T U R E : O p e r a t i n g r a n g e f r o m 0 Â ° C
to 50°C. A L T I T U D E : O p e r a t e s f r o m 0 t o 1 5 , 0 0 0 f e e t
a b o v e s e a l e v e l . D I M E N S I O N S : 1 6 3 / 4 i n c h e s w i d e , 5 V Ã i n c h e s
h i g h a n d 2 1 > / 2 i n c h e s d e e p . ( 4 2 6 m m X 1 3 3 m m X 5 4 6 m m ) .
R A C K M O U N T : R a c k m o u n t k i t s a r e p r o v i d e d f o r a l l i n s t r u m e n t s .
P R I C E : - h p - M o d e l 1 9 1 A $ 1 2 9 5 . P r i c e s f . o . b . f a c t o r y .
D a t a s u h j p r t t o r h a n g o w i t h o u t n o t i c e .
• 6 • © Copr. 1949-1998 Hewlett-Packard Co.

C O N T I N U O U S T V M O N I T O R I N G W I T H V E R T I C A L - I N T E R V A L T E S T S I G N A L S
A b r i e f d e s c r i p t i o n o f t h e s i g n a l s b e i n g t r a n s m i t t e d i n T V c h a n n e l s f o r c o n t i n u o u s l y c h e c k i n g c h a n n e l q u a l i t y .
To PROVIDE a picture acceptable to the average viewer, a television transmis sion system must meet rigorous stand ards. This is especially true for color signals, which are more complex than black-and-white signals and subject to more types of distortion.
Keeping picture distortion within desirable limits requires frequent test ing of the transmission channels which carry TV video signals. Until recent years, this was done during the idle periods when no programs were being transmitted. Now, the increasing pop ularity of color television calls for more frequent checks, but increased use of television has reduced the time avail able for testing. The result has been the development of methods and sig nals for continuous, in-service moni toring of transmission quality.
In 1963, television broadcasters and the Bell System agreed on the general form of test signals which would ac company the normal video signal for continuous checking of the network and associated facilities under actual operating conditions. These signals are now being broadcast. Known as Verti cal-Interval Test Signals (VITS), they are a combination of several test wave forms developed by television broad casters, carriers, and manufacturers in the United States and Europe over a period of many years.
A difficulty of VITS is that they are fast signals which occur at low repeti tion rates (only 30 per second). Hence, viewing them has been difficult in the past. To overcome this problem, a new Television Waveform Oscilloscope has been designed in the -hp- laboratories in Palo Alto and Colorado Springs. The new oscilloscope is designed to perform all of the functions necessary for displaying television video signals and VITS and for detecting and meas uring the various types of distortion.
The oscilloscope has been built to Bell System specifications for TV wave form oscilloscopes in Television Oper ating Centers. TOC's are facilities at which network TV programs are moni-
F i e l d 1 l i n e n u m b e r s , M a x i m u m c a r r i e r
voltageN Blank ing leve lx
Reference black
Vert. E q u a l i z i n g s y n c E q u a l i z i n g
p u l s e p u l s e p u l s e i n t e r v a l i n t e r v a l i n t e r v a l
jumuuu 0 -3H • • 3H—
- H o r i z o n t a l s y n c p u l s e s
e t c . â € ” I - f V W ' l 0 . 5 H â € ” ] - \ nimjüULj l·JULJL
Z e r o c a r r i e r 1 â € ” 4 j ' ' ' ' P i c t u r e â € ” H â € ” â € ¢ V e r t i c a l b l a n k i n g 0 . 0 5 V
Hor izon ta l b lank ing— 1 [— — Bo t tom o f p ic tu re
F i e l d 2 l i n e n u m b e r s
0 . 5 H - - — Sync
S t a r t o f f i e l d 1 T i m e -
1 2 3 . 4 , 18,19,20,21,
†” S ta r t o f f i e l d 2
Fig. black-and-white Video waveform after detection (carrier removed) for black-and-white television. Figure shows portions of video waveform near vertical blanking interval. Each complete picture, or frame, of 525 lines is scanned in 2 inter laced and of 262'/2 lines each. Top waveform shows end of field two and start of field one, and bottom waveform shows end of field one and start of field two. Each line of picture consists of horizontal sync pulse followed by picture in formation which is used to modulate intensity of picture tube beam as it scans across top Vertical blanking intervals of 21 lines produce black area at top of TV in New Vertical-Interval Test Signals are inserted in lines 18 and 19.
tored, adjusted, and routed over the proper transmission channels. The os cilloscope is also intended to be used by local TV stations for monitoring the quality of programs received from the network and of their own transmis sions. If the VITS waveforms indicate trouble, operators in communication with each other by telephone can trace the trouble to its source and initiate correction procedures.
Another major application for the oscilloscope is in video tape recorders to assure that signals being recorded are of acceptable quality.
T H E T E L E V I S I O N V I D E O W A V E F O R M The composite video signal is broad
cast on an amplitude-modulated car rier with minimum carrier amplitude representing white and maximum car rier amplitude representing black. One complete picture is called a 'frame! In the National Television Standards Committee system, there are 30 frames per second, each consisting of 525 lines. To reduce flicker in the picture pre sented to the viewer, each frame is scanned in two fields of 2621/2 lines
each, and the lines of the second field are interlaced between the lines of the first.
Fig. 1 shows the detected video wave form near the beginning of each field. The interval between the last picture line of one field and the first picture line of the next field is called the 'ver tical blanking interval! The 21 lines in this interval do not contain any pic ture information; they produce a black area at the top of the picture which is normally not seen by the viewer. It is during this interval that the new test signals are inserted. Thus the viewer at home can see the effect of these sig nals on two lines of each field if he re duces his picture size or mis-adjusts his vertical hold control to cause his pic ture to roll.
In a correctly-adjusted home re ceiver, however, these lines are hidden behind the mask and do not degrade the picture.
The first several lines of the verti cal blanking interval contain equalizer pulses and vertical sync pulses which return the beam to the top of the
© Copr. 1949-1998 Hewlett-Packard Co.
100
100
0 -
- 4 0 - -
screen. Lines 16 through 20 can safely be used for test signals, but line 21 re mains free of signal as a guard interval before the start of the video signal. Although other arrangements are be ing considered by the television indus try, Vertical-Interval Test Signals are now inserted only in lines 18 and 19 of each field. Lines 16, 17, and 20 are reserved for possible future use.
THE COLOR SIGNAL The video signal for color programs
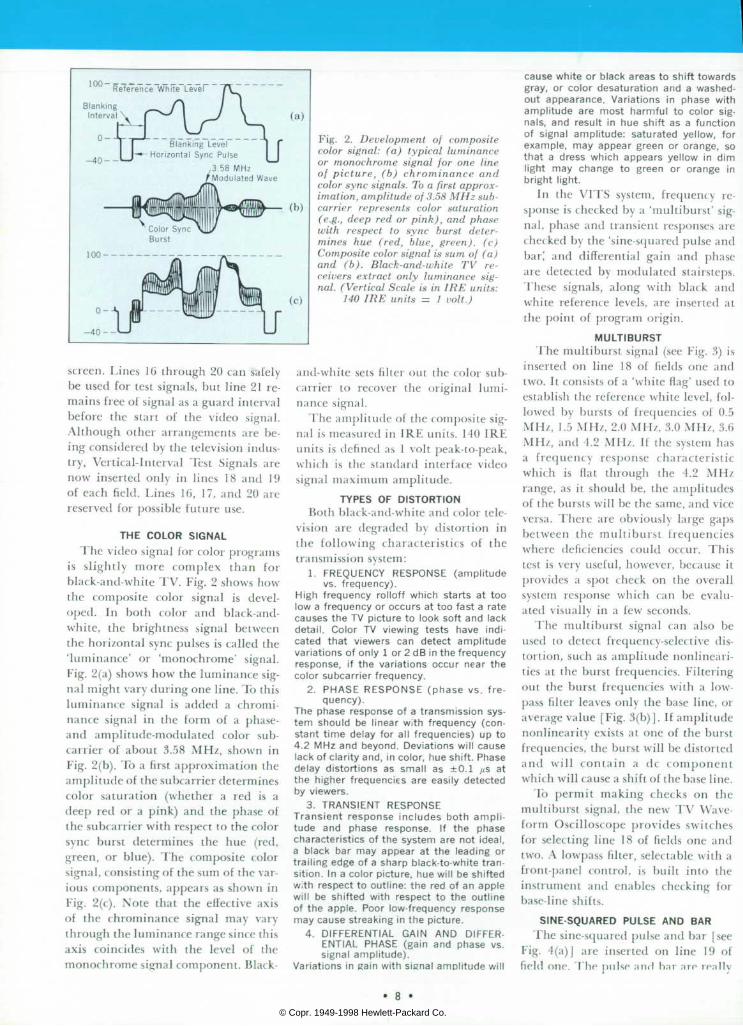
is slightly more complex than for black-and-white TV. Fig. 2 shows how the composite color signal is devel oped. In both color and black-and- white, the brightness signal between the horizontal sync pulses is called the 'luminance' or 'monochrome' signal. Fig. 2(a) shows how the luminance sig nal might vary during one line. To this luminance signal is added a chromi nance signal in the form of a phase- and amplitude-modulated color sub- carrier of about 3.58 MHz, shown in Fig. 2(b). To a first approximation the amplitude of the subcarrier determines color saturation (whether a red is a deep red or a pink) and the phase of the subcarrier with respect to the color sync burst determines the hue (red, green, or blue). The composite color signal, consisting of the sum of the var ious components, appears as shown in Fig. 2(c). Note that the effective axis of the chrominance signal may vary through the luminance range since this axis coincides with the level of the monochrome signal component. Black-
Fig. 2. Development of composite color signal: (a) typical luminance or monochrome signal for one line of picture, (b) chrominance and color sync signals. To a first approx imation, amplitude of 3.58 MHz sub- carrier represents color saturation (e.g., deep red or pink), and phase with respect to sync burst deter mines hue (red, blue, green), (c) Composite color signal is sum of (a) and (b). Black-and-white TV re ceivers extract only luminance sig nal. (Vertical Scale is in IRE units:
140 IRE units = 1 volt.)
ami-white sets filter out the color sub- carrier to recover the original lumi nance signal.
The amplitude of the composite sig nal is measured in IRE units. 140 IRE units is defined as 1 volt peak-to-peak, which is the standard interface video signal maximum amplitude.
T Y P E S O F D I S T O R T I O N Both black-and-white and color tele
vision are degraded by distortion in the following characteristics of the transmission system:
1 . F R E Q U E N C Y R E S P O N S E ( a m p l i t u d e vs . f requency) .
H i g h f r e q u e n c y r o l l o f f w h i c h s t a r t s a t t o o low a f requency or occurs a t too fas t a ra te causes the TV p ic tu re to look so f t and lack d e t a i l . C o l o r T V v i e w i n g t e s t s h a v e i n d i c a t e d t h a t v i e w e r s c a n d e t e c t a m p l i t u d e var ia t ions of on ly 1 or 2 dB in the f requency r e s p o n s e , i f t h e v a r i a t i o n s o c c u r n e a r t h e co lo r subcar r ie r f requency .
2 . P H A S E R E S P O N S E ( p h a s e v s . f r e quency) .
The phase response o f a t r ansm iss ion sys t e m s h o u l d b e l i n e a r w i t h f r e q u e n c y ( c o n s t a n t t i m e d e l a y f o r a l l f r e q u e n c i e s ) u p t o 4 .2 MHz and beyond . Dev ia t ions w i l l cause lack of c lar i ty and, in color , hue shi f t . Phase de lay d is tor t ions as smal l as ±0.1 ¿us at t he h ighe r f r equenc ies a re eas i l y de tec ted by v iewers.
3 . TRANSIENT RESPONSE T r a n s i e n t r e s p o n s e i n c l u d e s b o t h a m p l i t u d e a n d p h a s e r e s p o n s e . I f t h e p h a s e charac te r i s t i cs o f the sys tem are no t idea l , a b l a c k b a r m a y a p p e a r a t t h e l e a d i n g o r t ra i l i ng edge o f a sharp b lack - to -wh i te t ran s i t ion. In a co lor p ic ture, hue wi l l be sh i f ted w . th respec t to ou t l i ne : the red o f an app le w i l l b e s h i f t e d w i t h r e s p e c t t o t h e o u t l i n e o f t he app le . Poor l ow- f requency response may cause s t reak ing in the p ic ture.
4 . D I F F E R E N T I A L G A I N A N D D I F F E R E N T I A L P H A S E ( g a i n a n d p h a s e v s . s igna l ampl i tude) .
Var ia t ions in ga in w i th s igna l ampl i tude w i l l
cause wh i te o r b lack a reas to sh i f t towards g r a y , o r c o l o r d e s a t u r a t i o n a n d a w a s h e d - o u t a p p e a r a n c e . V a r i a t i o n s i n p h a s e w i t h a m p l i t u d e a r e m o s t h a r m f u l t o c o l o r s i g n a l s , a n d r e s u l t i n h u e s h i f t a s a f u n c t i o n o f s i g n a l a m p l i t u d e : s a t u r a t e d y e l l o w , f o r e x a m p l e , m a y a p p e a r g r e e n o r o r a n g e , s o t h a t a d r e s s w h i c h a p p e a r s y e l l o w i n d i m l i g h t m a y c h a n g e t o g r e e n o r o r a n g e i n br ight l ight .
In the VITS system, frequency re sponse is checked by a 'multiburst' sig nal, phase and transient responses are checked by the 'sine-squared pulse and bar; and differential gain and phase are detected by modulated stairsteps. These signals, along with black and white reference levels, are inserted at the point of program origin.
M U L T I B U R S T The multiburst signal (see Fig. 3) is
inserted on line 18 of fields one and two. It consists of a 'white flag' used to establish the reference white level, fol lowed by bursts of frequencies of 0.5 MHz, 1.5 MHz, 2.0 MHz, 3.0 MHz, 3.6 MHz, and 4.2 MHz. If the system has a frequency response characteristic which is flat through the 4.2 MHz range, as it should be, the amplitudes of the bursts will be the same, and vice versa. There are obviously large gaps between the multiburst frequencies where deficiencies could occur. This test is very useful, however, because it provides a spot check on the overall system response which can be evalu ated visually in a few seconds.
The multiburst signal can also be used to detect frequency-selective dis tortion, such as amplitude nonlineari- ties at the burst frequencies. Filtering out the burst frequencies with a low- pass filter leaves only the base line, or average value [Fig. 3(b)]. If amplitude nonlinearity exists at one of the burst frequencies, the burst will be distorted and will contain a dc component which will cause a shift of the base line.
To permit making checks on the multiburst signal, the new TV Wave form Oscilloscope provides switches for selecting line 18 of fields one and two. A lowpass filter, selectable with a front-panel control, is built into the instrument and enables checking for base-line shifts.
S I N E - S Q U A R E D P U L S E A N D B A R The sine-squared pulse and bar [see
Fig. 4(a)] are inserted on line 19 of field one. The pulse and bar are really
© Copr. 1949-1998 Hewlett-Packard Co.

two separate test signals, but they are similar in that they subject the system to the same type of transient signals that are encountered during picture transmission.
When the finite-diameter beam of a camera tube scans across a black-to- white transition, the change in output voltage is not a perfect step, but is more S-shaped, closely resembling a sinusoidal peak-to-peak transition. The frequency of the sinusoid is lim ited by the system bandwidth, which is about 4 MH/. If such a system were tested with a faster-rise impulse or step voltage, overshoot, ringing, and phase shift might occur even in an adequate system because of excessive high-fre quency components in the test signal. The sine-squared pulse is a more real istic test signal; it has accurately con trollable frequency components which can be limited to the band of interest. It also has the advantages of being eas ily generated to an accuracy of 1% or better, and of being mathematically tractable.
The sine-squared pulse is shown in more detail in Fig. 4(1)). This is a 0.125 microsecond (half-amplitude width) pulse, known as a 'T' pulse, which has the shape of one cycle of a 4 MHz sine wave. The frequency spectrum of this pulse is shown in Fig. 4(d). The half- voltage point is at 4 MH/., and there is little energy beyond 8 MH/. Thus, most of the test energy is contained in the frequency range of interest. A '2T'
(a) (b)
Fig. 3. Oscillograms made with ~hp- Model 191 A TV Waveform Oscillo scope displaying Vertical-Interval Test Signals, (a) Multiburst signal consists of 'white flag' and burst of ¡requerides of 0.5 MHz, 1.5 MHz, 2.0 MHz, 3.0 MHz, 3.6 MHz, and 4.2 MHz. If frequency response of chan nel is correct, all bursts are reproduced with same amplitude. Sweep speed is 8 /is/cm. Model 191 A vertical amplifier is in FLAT filter re sponse position, (b) Same signal with Model 191A LOW PASS filter
response, showing base line of multiburst.
pulse, with a half-amplitude width of 0.25 /u.s, is often used for tests where the main interest is in the 0.5 to 2 MH/ range. A 'T/2' pulse is also available for use when wider test bandwidth is desired. Fig. 4(b) shows typical T, 2T, and T/2 pulses.
The sine-squared pulse reveals de ficiencies in the high-frequency tran sient response of the system. Its ampli tude will be reduced if the high fre quency rolloff of the system occurs at too low a frequency. It is also particu larly sensitive to phase distortion, be cause its pliase characteristic is linear to a frequency well above the highest video frequency. Another way of say ing this is that the group delay or en velope delay characteristic of the sine- squared pulse is constant to a high fre-
l a i
Fig. pulse for Oscillogram made with Model 191 A of sine-squared pulse and bar used for testing type response of channel. Sine-squared shape subjects system to same type of transient as is encountered in picture transmission. Pulse tests high-frequency transient response and phase response. Bar tests mid-frequency response. Sweep speed 8 us/cm. FLAT filter response of oscilloscope, (b) Triple exposure showing T/2 pulse (0.0625 ,us sine-squared pulse), T pulse (0.125 p.s), and 2T pulse (025 ¿is,). Sweep speed gives clear ps/cm, repetition rate is 30 Hz. Special CRT in Model I91A gives clear trace Drawing high writing speed and low repetition rate. FLAT response, (c) Drawing of T pulse. T pulse is one cycle of 4 MHz sine wave, (d) Spectrum of T pulse is down by
factor of two at 4 MHz and is zero at 8 MHz.
quency (>16 MHz for the T/2 pulse). Hence, if the system does not delay all frequency components by the same amount, the sine-squared pulse will be distorted; it will no longer be symmet rical, and ripples will appear on its leading or trailing edge. If high fre quencies are delayed less than low fre quencies, for example, a ripple occurs on the leading edge.
The other test waveform on line 19 of field one is the sine-squared bar or 'window! This is a flat-topped pulse with a duration of one-half line. Its leading and trailing edges have a sine- squared shape corresponding to the 2T pulse. The bar is sensitive to distor tions at middle frequencies: droop ap pearing at the top of the bar is related to streaking in the TV picture, and as
- 2 4 - 1 6 - 8 O !
freq (MHz)
(d)
1 6 2 4
• 9 © Copr. 1949-1998 Hewlett-Packard Co.

Fig. 5. Oscillograms of VITS made with Model 191 A. (a) Modulated Stairstep sig nal used for detecting variations in gain and phase with signal amplitude. There are 10 steps, each with 3.58 MHz burst superimposed. FLAT filter response of Model 191A. Sweep speed 8 ¡is/cm, (b) Modulated stairstep. LOW PASS filter re sponse. Sweep speed 8 p.s/cm. (c) Modu lated Stairstep with Model 191A DIF FERENTIAL GAIN filter response. This response provides bandpass filtering cen tered at 3.58 MHz, plus 14 dB amplifica
tion.
little as 2 to 5% droop will indicate streaking that is readily detected by viewers.
The new oscilloscope is specially de signed for improved display of the T/2 sine-squared pulse. For proper evalua tion of the response of the system to this signal, it is often necessary to mag nify the time scale 25 times. This re sults in a fast cathode-ray tube sweep speed of 0.3175 /ts/cm. Since the repeti tion rate of the signal is only 30 Hz (30 times per second), the signal would be barely visible on the usual oscilloscope. The new oscilloscope has a specially- developed CRT with a writing rate
7. 5* times that of conventional high-fre quency oscilloscopes, which produces a clear, usable trace.
M O D U L A T E D S T A I R S T E P The modulated stairstep used in de
tecting differential gain and phase is inserted on line 19 of field two. It con sists of a 10-step stairstep signal going from black to white, with a 3.58 MHz sine wave superimposed on each step [see Fig. 5(a)].
Differential gain is the variation in the gain of a transmisison system as the luminance signal varies between the values for black and for white. In a properly-operating system, changes in luminance voltage should produce no change in either the height of the steps or the amplitude of the sine wave.
Low-frequency differential gain can be detected by removing the sine wave from the modulated stairstep with a low-pass filter and checking the steps for equal height [Fig. 5(b)]. High-fre quency differential gain can be de tected by removing the steps with a band-pass filter centered at 3.58 MHz; this puts the 10 bursts of sine wave on the same line and permits easy compar ison of their amplitudes [Fig. 5(c)].
Differential phase is the variation in the phase characteristic of a system as the luminance level changes from black to white. The modulated stair step can be used in conjunction with a synchronous phase detector to check for this type of distortion. Phase shifts of 1 degree can be detected in this manner.
To facilitate these measurements, the new oscilloscope includes both a low-pass filter for checking low-fre quency differential gain and a band pass filter centered at 3.58 MHz for checking differential gain at the color subcarrier frequency. An additional 14 dB of amplification is available for use with the band-pass filter if needed.
— Richard E. Monnier and
Ralph R. Reiser
O S C I L L O S C O P E D E S I G N L E A D E R S
C O R R E C T I O N I n t h e l a s t i s s u e t h e c o r r e c t p h o t o g r a p h
f o r F i g . 3 i n t h e a r t i c l e ' M e a s u r e m e n t o f L i q u i d L a y e r T h i c k n e s s w i t h T i m e D o m a i n Re f lec tomet ry , ' Vo l . 17 , No . 5 , shou ld show a 6 - c m s t e p , r a t h e r t h a n t h e 5 5 - c m s t e p t ha t appea red . The 6 - cm s tep rep resen t s a r e f l e c t i o n c o e f f i c i e n t ( / i ) o f â € ” 0 . 6 0 w h i c h , w h e n u s e d i n e q u a t i o n 2 , y i e l d s t h e s t a t e d v a l u e o f 1 6 f o r t h e d i e l e c t r i c c o n s t a n t e . S imi lar ly , F ig . 4 should show a 6. 5-cm step, representing a p of —0.65, which then yields the stated value of 22 for e.
p. à ••II
Ralph R. Reiser
Ralph Reiser jo ined Hewlet t -Packard in 1958. As a deve lopment eng ineer in t h e F r e q u e n c y a n d T i m e D i v i s i o n , h e c o n t r i b u t e d t o t h e d e s i g n o f s e v e r a l e l e c t r o n i c c o u n t e r s , a n d w a s p r o j e c t leader fo r the 5280A Revers ib le Count e r . S i n c e 1 9 6 5 , h e h a s b e e n w i t h t h e Osc i l loscope Div is ion as pro jec t leader f o r t h e 1 9 1 A T e l e v i s i o n W a v e f o r m Osci l loscope.
Af ter f i ve years in the U. S. Navy as an av ia t i on mechan ic , Ra lph a t tended t h e U n i v e r s i t y o f K a n s a s a n d g r a d u a t e d w i t h a B S E E d e g r e e i n 1 9 5 8 . A t Kansas, he was e lected to Tau Beta Pi , E t a K a p p a N u , a n d S i g m a T a u . H e o b ta ined h is MSEE degree f rom Stan ford Univers i ty .
^ ^ ^ ^ ^ L Â ·
C Richard E. Monnier
D i c k M o n n i e r j o i n e d H e w l e t t - P a c k a r d i n 1 9 5 8 a s a d e v e l o p m e n t e n g i n e e r . H i s f i r s t a s s i g n m e n t s i n c l u d e d c i r c u i t d e s i g n f o r t h e 1 8 5 A a n d 1 8 5 B S a m p l i n g O s c i l l o s c o p e s . L a t e r , a s G r o u p L e a d e r , h e c o n t r i b u t e d t o t h e d e s i g n o f t h e 1 2 0 B O s c i l l o s c o p e , t h e 1 4 0 A O s c i l l o s c o p e a n d p l u g - i n s , a n d t h e 1 3 2 A D u a l B e a m O s c i l l o s c o p e . I n 1964 he jo ined the Advanced Research a n d D e v e l o p m e n t D i v i s i o n w h e r e h e c o n t r i b u t e d t o t h e d e s i g n o f t h e T e l e v i s i on Wave fo rm Osc i l l oscope as P ro j ec t Leade r be fo re t r ans fe r o f t he p ro j e c t t o t h e C o l o r a d o S p r i n g s D i v i s i o n .
Dick rece ived h is BSEE degree f rom the Univers i ty o f Ca l i fo rn ia a t Berke ley in 1958 and a MSEE degree f rom Stan ford Un ivers i ty in Jan. 1961.
IEEE EXHIBITION A t t h e I E E E E x h i b i t i o n i n N e w Y o r k
C i t y , Hew le t t -Packard w i l l have on d i s p lay for your in terest a large amount of new i ns t r umen ta t i on . I nc l uded w i l l be s u c h n e w i n s t r u m e n t s a s a s a m p l i n g v o l t m e t e r , a p r o g r a m m a b l e o s c i l l o scope, an X-Band p lug- in for f requency coun te rs , and many , many more .
— hp- wi l l be in Aisle 3E on the third f loor o f the Co l iseum.
Be sure to visi t us.
1 0
© Copr. 1949-1998 Hewlett-Packard Co.

' V I T S P R O G R A M (cont 'd f rom back cover) seems to hold the most promise is the use of Vertical-Interval Test Signals (VITS).
VITS are signals generated and trans mitted by equipment provided by the broadcasters. They are keyed into desig nated lines during the vertical blanking interval of the picture. These signals are then transmitted along with the normal picture signal. They may be observed, and/or photographed, at appropriate ex isting monitoring locations by network, Telephone Company, and local station personnel. They can be used for quantita tive measurements. Appropriate compari son or analysis of the test results should facilitate trouble location during actual service. Incidentally, VITS signals may be seen in the picture on a home receiver if the picture is rolled half a frame to expose the vertical interval. They appear as a light horizontal streak in the nor mally dark area between frames.
The Network Transmission Committee has developed a plan and a program for implementing VITS, taking into account the following considerations:
1. In i t ia l l y , the s igna ls shou ld be such that exist ing equipment may be used to ob serve the s ignals . There should be a min i m u m r e q u i r e m e n t f o r n e w o r m o d i f i e d equipment dur ing the ear ly stages.
2. The fo l lowing s ignals should be incor porated in the Vertical-Interval Test Signals:
a . Mu l t iburs t b. Sine-squared signal (pulse and bar) c . Modulated s ta i rs tep d . A co l o r s i gna l ( t o be spec i f i ed a t a
later date) e . Wh i te and b lack re fe rence leve l s ig
na ls , comb ined in to one o r more o f the above
3. D i rec t ives and t ra in ing should be in i t ia ted to insure ear ly e f fec t ive use o f Ver tical-Interval Signals.
4. Ul t imately, a l l the test s ignals should be avai lable s imultaneously for most ef fec tive usage.
5 . Any new equipment be ing developed shou ld be des igned to accommodate u l t i mate requirements.
6 . The tes t s igna l spec i f i ca t ion shou ld be capab le o f modi f ica t ion to incorpora te the benef i ts of exper ience wi th in i t ia l use. Paragraph 3.682 of Part 3 of the FCC
Rules allocates the interval beginning with the last 12 microseconds of line 17 and continuing through line 20 for the transmission of test signals. Line 20 is reserved by the broadcasters for other purposes. The Committee felt it desirable that lines 18 and 19 of both fields contain different test signals. It was agreed, how ever, that most existing oscilloscopes were not adapted to this sophisticated tech nique. In addition, most equipment avail able for keying in these signals was not
Fig. to in-service Vertical-Interval Test Signals (VITS) used to provide in-service trouble diagnosis. VITS are keyed in to lines 18 and 19 of both fields and transmitted along with normal picture signal. They can be seen on home sets as a light horizontal
streak interval). the normally dark area between frames (vertical blanking interval).
capable of meeting this requirement. Because of these considerations, NTC
decided on a program which was divided into two parts: an interim period and an ultimate period. The Vertical-Interval Test Signals specified for the interim pe riod were planned to satisfy the first three considerations listed previously.
O P T I M U M V I T S
The changeover from the interim pe riod will be completed in 19f>6. The plan for the optimum test signals is shown in simplified form in Fig. 2.
This plan proposes a continuous dis play of four test signals, combined with amplitude reference signals, keyed into lines 18 and 19 of both fields. It leaves line 20 of both fields available for other purposes. In this optimum arrangement line 18 of field one has the multiburst, combined with black and white reference levels. Line 19 of field one has a sine- squared pulse, with bar, combined with black and white reference level signals.
Line 18 of field two will contain a color test signal, to be specified at a later date. Again, it will include black and white reference levels. Line 19 of field two contains the modulated stairstep, plus the reference levels as in the other three signals. Thus each frame displays the complete array of four test signals with black and white reference levels in corporated with each.
There are some problems involved in implementing a program which will re sult in Vertical-Interval Signals being use ful . One problem is that of reaching
agreement on signal standards for Verti cal-Interval Signals. This problem is heightened by the fact that so far there is no agreement on standards for full frame test signals which are sent during test and line-up periods on the networks. NTC is working on both of these prob lems concurrently.
A ramification of the problem of deter mining standards for Vertical-Interval Signal observations is that these signals traverse a different path than test signals normally used. In the more usual case of out-of-service testing, the network does not go in and out of any broadcasting stations. While there may be several video sections in tandem, there are no local transmitting loops involved except at the originating point, and no local station facilities are in the transmission path. During actual program transmission, however, the networks utilize various con figurations which include so called "in- and-out" points, where the signal actually is transmitted in and out of a local sta tion. The Vertical-Interval Signals follow the picture. They go in and out at in-and- out points. Since tests are normally not made for this combination of facilities, no standards for evaluating such measure ments are available. Determination of sig nal standards for Vertical-Interval Signals will thus be more complicated than for full frame test signals on an out-of-service basis. The standards will have to apply to a much greater range of network config urations. Considerable effort is being ex erted on this problem, and progress is expected in the near future.
11 © Copr. 1949-1998 Hewlett-Packard Co.

T H E ' V I T S ' P R O G R A M F O R I N T E R C I T Y T E L E V I S I O N N E T W O R K T E S T I N G
S. C. Jenk ins L o n g L i n e s D e p a r t m e n t
A m e r i c a n T e l e p h o n e a n d T e l e g r a p h C o m p a n y
BELL SYSTEM TELEVISION NETWORK ROUTES
Fig. The includes System intercity television network in Jan., 1966. The network includes over are miles of routes, of which only 853 miles or 0.7%, are coaxial cable. Most video rapid are radio relay with 4-MHz bandwidth. This represents a rapid con version to radio relay in 11 years; in 1954, 30% of the 69,000 miles of channels then in
service were coaxial cable.
THE ELECTRICAL SIGNALS that transmit television programs often travel hundreds or thousands of miles in the United States on a vast network of intercity television channels. At the start of 1966 there were over 126,000 miles of video intercity chan nels on about 32,000 miles of intercity routes. This network is shown in Fig. 1.
Over 99% of the network is now on mi crowave radio systems providing channels of at least 4-MHz width. Only 853 miles, or less than 0.7% of the network, is fur nished on coaxial facilities. In 1954, when the intercity video plant contained the maximum mileage of coaxial facilities, 30% of the 69,000 miles of intercity chan nels then in service was furnished on co axial channels, some only 2.7 MH/ wide.
The workhorse of the microwave radio relay systems is called the TD-2 system. It operates in the 1000-megaheru band. The system for future applications in the 1000- megahertz band is coded TD-3. I t be comes available in 1966 and has a nom inal 5-watt output level.
At locations where the intercity net work facilities interconnect with local video faci l i t ies within a ci ty, certain switching and monitoring functions are needed by the broadcasters. This role is performed at facilities known as Televi- sion Operating Centers. The Bell System now provides such Operating Centers at 141 points within the United States. At
these centers the instruments necessary for testing and adjusting the video chan nels are maintained. Monitors and oscil loscopes are provided for the monitoring function.
E N G I N E E R I N G C O O R D I N A T I N G G R O U P S Several years ago two organizations
were formed for coordinating between the Telephone system and the broadcast ers. One organization is the Video Trans mission Engineering Advisory Commit tee, called VITEAC for short from its initials. This group consists of the heads of the Engineering Departments of the three major broadcasting networks and corresponding representatives of the Tele phone Company. The second group is a sub-committee of VITEAC, and is called the Network Transmission Committee (NTC). Its members come from the engi neering and operating departments of the same organizations which form VITEAC. The Network Transmission Committee concerns itself with those problems of op eration and transmission of video and audio networks which become chronic and cannot be. or are not satisfactorily, handled through normal organizational channels.
An activity of VITEAC which is of cur rent interest is the investigation of noise measuring techniques for video channels. Both the broadcasters and the Telephone Company would like to see a standard method adopted.
. 1 2 .
V E R T I C A L - I N T E R V A L T E S T S I G N A L S The Television networks, the individ
ual TV broadcasting stations, and the Telephone Company are all concerned with improving the quality of the picture seen by the viewing public. In the day-to day operation of the television networks, many changes are made in the intercon nection of these transmission facilities. This includes changes in broadcasters' facilities, changes in local Telephone Company fac ilities, and changes in inter- exchange channels. Although designed for long term stable performance, no part of the overal l network is immune to trouble. Since many of these troubles are temporary or transient, it is desirable that they be located quickly, while they are present. This means that trouble location must be done on an in-service basis, rather than by tests made on an out-of-service basis after the program is over.
In addition, it is often difficult either to identify or to diagnose troubles from observation of the normal picture signal. Some more rigorous test signal is needed. The technique which seems to come clos est to meeting these requirements and
(concluded inside on p. 11)
S. C. Jenkins
M r . J e n k i n s i s T r a n s m i s s i o n E n g i n e e r i n t h e E n g i n e e r i n g S t a f f o f t h e A m e r i c a n T e l e p h o n e a n d T e l e g r a p h C o m p a n y , L o n g L i n e s D e p a r t m e n t . A s s u c h h e i s r e s p o n s i b l e f o r t h e t r a n s m i s s i o n m e t h o d s , p r a c t i c e s , a n d d e s i g n s u s e d i n t h e e n g i n e e r i n g , c o n s t r u c t i o n , m a i n t e n a n c e , a n d o p e r a t i o n o f t h e L o n g L i n e s T e l e p h o n e P l a n t .
S o m e o f M r . J e n k i n s ' p r e v i o u s B e l l S y s t e m a s s i g n m e n t s w e r e i n t h e T r a n s m i s s i o n E n g i n e e r i n g s e c t i o n o f A m e r i c a n T e l e p h o n e a n d T e l e g r a p h ' s G e n e r a l E n g i n e e r i n g D e p a r t m e n t , a s T r a n s m i s s i o n E n g i n e e r o f t h e L o n g L i n e s E a s t e r n A r e a , a n d t h e e n g i n e e r i n g d e p a r t m e n t o f t h e W e s t e r n E l e c t r i c C o m p a n y ' s D e f e n s e P r o j e c t s o r g a n i z a t i o n . I n t h e l a t t e r p o s t h e w a s r e s p o n s i b l e f o r e n g i n e e r i n g i m p o r t a n t a s p e c t s o f c o m m u n i c a t i o n s f o r s u c h p r o j e c t s a s B M E W S a n d t h e E a s t e r n E x t e n s i o n o f t h e D E W L i n e .
© Copr. 1949-1998 Hewlett-Packard Co.