Embed Size (px)
Citation preview
STATE OF UTAH
DEPARTMENT OF NATURAL RESOURCES
Technical Publication No. 35
GROUND-WATER CONDITIONS IN THE EAST SHORE AREA,
BOX ELDER, DAVIS, AND WEBER COUNTIES, UTAH
1960-69
by
E. L. Boike and K.M. Waddell
Hydrologists, U.S. Geological Survey
Prepared by the U.S. Geological SurveyIn cooperation with
The Utah Department of Natural ResourcesDivision of Water Rights
1972

CONTENTS
Page
Abstract . . . 1
Introduction . 2
Purpose and scope . 2
Description of the area . 2
Previous studies and acknowledgments . 3
Ground water . . . . . . . . . . . 3
Summary of general conditions . 3
Development of ground water . 7
Well construction ..... . 7
Pumpage from large-diameter wells . 9
Discharge from small-diameter wells .9
Summary of withdrawals . . . . . . 10
The effect of ground-water withdrawals on the aquifers 10
Water-level fluctuations 10
Changes in storage 15
Chemical quality 15
Summary of general conditions. 15
Chemical quality of water from new wells 16
Changes of chemical quality. 18
Suitability for use 21
Conclusions . . 22
References cited 23
Appendix . 25
Well- and spring-numbering system 26
Use of metric units . . . . . . . . 27
Terms describing aquifer characteristics 27
Basic data . . . . . . . . . . . . . . . . . . 29
Publications of the Utah Department of Natural Resources, Division of Water Rights . 54

ILLUSTRATIONS
Page
Plate 1. Map showing areal distribution of wells constructed during 1960-August
1969 and major pumped wells in 1969 in the East Shore area In pocket
2. Map showing change of water levels from March 1960 to March 1969 in the
East Shore area . . . . . . . . . . . . . . . . . . . . . . . . . . . . . . . . .1 n pocket
3. Map and diagrams showing generalized chemical quality of ground water
and chemical and physical relationships for selected ground-water sources in
the East Shore area and Antelope Island . . . . . . . . . . . . . . . ., .1 n pocket
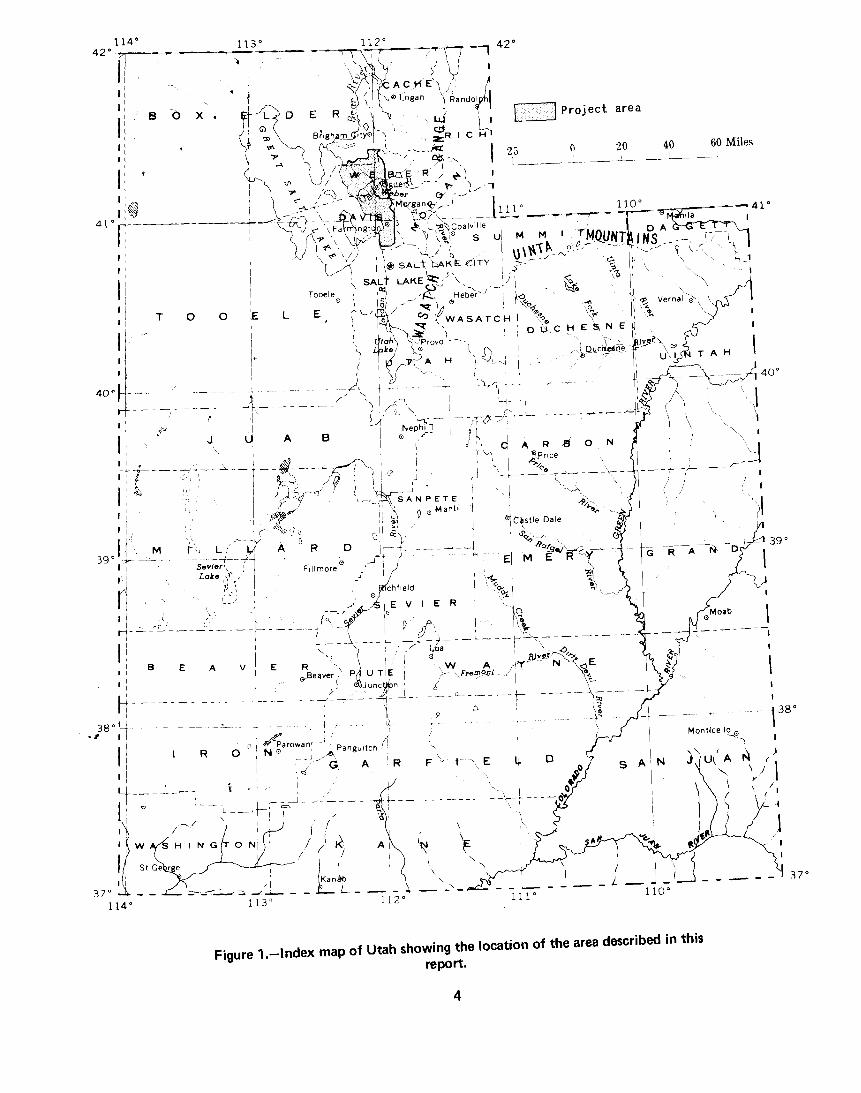
Figure 1. Index map of Utah showing location of the area described in this report 4
2. Graph showing annual pumpage for municipal and industrial supply and
well construction . . . . . . . . . . . . . . . . . . . . . . . . . . . . . . . . . . . 8
3. Graphs showing relation of water levels in selected wells to cumulative
departure from the 1941-69 average annual precipitation at Ogden Pioneer
powerhouse and pumpage for municipal and industrial supply from wells ..... 11
4. Graph showing variation of dissolved-solids content in water from selected
wells, 1943-69 19
5. Diagram showing well- and spring-numbering system in Utah 26
TABLES
Table 1. Records of selected wells in the East Shore area . . . . . . . . . . . . . . . . . . . 31
2. Chemical analyses of water from selected wells and springs in the East
Shore area and Antelope Island 40

GROUND-WATER CONDITIONS IN THE EAST SHORE AREA,
BOX ELDER, DAVIS, AND WEBER COUNTIES, UTAH
1960-69
by
E. L. Boike and K. M. Waddell
Hydrologists, U.S. Geological Survey
ABSTRACT
The East Shore area is in north-central Utah between the east shore of Great Salt Lakeand the Wasatch Range. The climate is semiarid. The growth of industry and agriculture and therelated increase in population has steadily increased the demand for adequate water supplies inthe East Shore area. The population was about 225,000 persons in 1970, an increase of about47,000 since 1960. Annual ground-water withdrawals through large-diameter wells for municipaland industrial supply increased from about 10,000 acre-feet in 1960 to about 21,000 acre-feet in1969. Additional pumpage from large-diameter wells for irrigation and other purposes was about5,500 acre-feet in 1969; most of the water that is used for agriculture is supplied by surface-watersources. Discharge from small-diameter, chiefly flowing, wells is estimated to be 12,000 acre-feetper year.
During 1960-69 water levels rose an average of 5 feet in the Bountiful and Brighamdistricts and declined an average of 10 feet in the Weber Delta district, chiefly as a result ofwithdrawals from wells. The rise of water levels in parts of the Bountiful district was due chieflyto decreased withdrawal from wells brought about by importing water from the Weber Riverbasin, and to additional recharge resulting from use of imported water for lawn irrigation.
During 1962-69 there was no significant change in chemical quality over a large area. Thewater quality has varied locally, but it has generally been a year-to-year fluctuation rather than along-term trend. Most of the water in the East Shore area is suitable for both domestic use andirrigation.
A new well on the Syracuse-Antelope Island causeway penetrated two artesian aquifersthat yielded sodium bicarbonate and sodium chloride type waters, which contained about 330and 661-783 mg/I (milligrams per liter) of dissolved solids, respectively. New wells north of LittleMountain produced a sodium bicarbonate type water generally containing less than 500 mg/I ofdissolved solids. Temperature of the water from those wells is abnormally high. Data from wellsat and near Hill Air Force Base indicate that a sodium bicarbonate type water may exist at depthbelow a more dilute calcium magnesium bicarbonate water.
1
INTRODUCTION
Purpose and scope
This report is one of a series that is prepared by the U.S. Geological Survey incooperation with the Utah Department of Natural Resources, Division of Water Rights, whichdescribes water resources in selected areas in Utah. The period of study on which this report wasbased was from Ju Iy 1968 to March 1970, but the period of record covered by the report is from1960 to 1969. The purposes of this study were to determine changes in ground-waterdevelopment in the East Shore area and to determine the effects of those changes on theground-water system since the area was last studied (Smith and Gates, 1963). The study was alsomade to obtain additional information to guide further development of ground water in the area,in order to meet growing needs for municipal, industrial, and agriculture water supplies.
Detailed description of the hydrologic system in the East Shore area is beyond the scopeof this report. Feth and others (1966) and Thomas and Nelson (1948) previously described partsof the area in detail and pertinent information from those reports is included here. Someground-water information from the vicinity of Antelope Island, which is west of the East Shorearea, is included in this report.
Descri pti on of the area
The East Shore area has been previously defined by Thomas and Nelson (1948, p. 63) asthat area in north-central Utah between the east shore of Great Salt Lake and the Wasatch Rangeand between the mouths of the Jordan and Bear Rivers. Thomas and Nelson divided this area intothree subareas or ground-water districts-Bountiful, Weber Delta, and Brigham. The Bountifuldistrict includes that part of the area south of T. 3 N., the Brigham district includes that part ofthe area north of T. 7 N., and the Weber Delta district includes the central and largest part of theEast Shore area.
The project area for this report is in Davis, Weber, and Box Elder Counties and includesall the Weber Delta and Bountiful districts and the southern part of the Brigham district.Although the project area does not embrace the entire East Shore area as defined by Thomas andNelson (1948, p. 63), for convenience in referring to it in this report, the project area is called theEast Shore area. The southern border of the area is the Davis-Salt Lake County line; the northernborder is the first section line north of Willard. The area is about 40 miles long and ranges inwidth from 3 to 20 mi les (fig. 1); it covers about 450 square miles.
The climate of the East Shore area is controlled largely by dry continental air masses andis semiarid. The recorded extremes of temperature are -30°F (-34°C) and 111°F (44°C); theaverage annual temperature is near 51 ° F (11°C) throughout the area. Average annualprecipitation ranges from about 12 inches near the shore of Great Salt Lake to about 20 inchesnear the base of the Wasatch Range. 1
The project area is one of the more densely popu lated parts of Utah. In 1970 thepopulation was about 227,000. The following table gives the figures (rounded from U.S. Bureauof Census data) for Davis and Weber Counties:
1Climatological data taken from records of the Environmental Science Services Administration, U.S. Department of Commerce.
2

1950 1960 1970
City of Bountiful 6,000 17,000 28,000Davis County (total) 31,000 65,000 99,000
City of Ogden 57,000 70,000 69,000Weber County (total) 83,000 111,000 126,000
About 2,000 persons reside in that part of Box Elder County covered by this report. In 1960about 80 percent of the population was in urban areas.
Previous studies and acknowledgments
Previous investigations in the East Shore area include detailed studies in the Bountifuldistrict by Thomas and Nelson (1948) and in the Weber Delta district by Feth and others (1966).A study of water-level and quality-of-water data collected during 1953-61 in the southern andcentral parts of the East Shore area was made by Smith and Gates (1963). The East Shore areahas also been included in a series of annual reports on ground-water conditions in Utah. Thelatest in the series is by Sumsion and others (1970) and includes references to previous reports inthe series. Other investigations have been summarized in the report by Feth and others (1966).
The cooperation of the many landowners in the East Shore area who gave permission fordata acquisition from their property is gratefully acknowledged. The cooperation of the variousofficials of State and municipal governments in supplying information is also appreciated. Specialthanks are extended to officials and personnel of the Great Salt Lake Minerals and ChemicalsCorp., the Weber Basin Water Conservancy District, the U.S. Bureau of Reclamation, and theUtah State Parks and Recreation Division for their cooperation and assistance.
GROUND WATER
Summary of general conditions
The ground-water reservoir in the East Shore area consists of unconsolidated andsemiconsolidated deposits, which range in grain size from clay to boulders. At the base of theWasatch Range the deposits consist chiefly of coarse-grained delta, alluvial-fan, and slope-washdeposits; they grade westward into fine-grained but well-sorted lacustrine deposits. The principalaquifers consist of gravel or gravel and sand in the east half of the area and of sand in the westhalf.
The major sources of recharge to the ground-water reservoir in the East Shore area aresubsurface flow from the Wasatch Range, direct infiltration from precipitation, and seepage fromthe Weber and Ogden Rivers, mountain front streams, and irrigated areas. Subsurface flow from
3
, I\
- - - -
60 MilesI
40I
...110 0
20I
()
Project area'------'
11 1 0---"-
l~
\\
"112 0
AI
113 0
o
R
x •
oT
B
::
II'III
37"114 0
Figure 1.-lndex map of Utah showing the location of the area described in thisreport.
4

the Wasatch Range accounts for nearly half of the natural recharge to the reservoir. Feth andothers (1966, p. 39) estimated annual natural recharge in the Weber Delta district to be 70,000acre-feet and attributed 30,000 acre-feet to subsurface flow from the mountain front.
The conclusion that considerable quantities of water enter the area in the subsurface fromthe mountain front is supported to some extent by local conditions at well (A-2-1 )20ddb-1, eastof Bountiful. This well is in the vicinity of a major fault zone in an area where the ground waterwas believed to be under water-table conditions. When this well was completed, however, it wasreported to have an artesian head of 51 feet above land surface and to flow about 1,000 gpm(gallons per minute). From examination of the drill cuttings, it is inferred that the well tapscoarse unconsolidated deposits or perhaps underlying brecciated bedrock. Water probably entersthe aquifer from the nearby mountain block and is confined beneath poorly sorted, poorlypermeable mud-rock flow deposits. The flow of the well must be derived solely from rechargefrom the mountain block because the confining mud-rock flow would prevent any local recharge.Similar conditions may exist locally elsewhere along the mountain front.
Ground water in the East Shore area occurs chiefly under artesian conditions in amultiaquifer reservoir. Water-table and perched conditions occur locally in the stream deltas andalong the mountain front. Some wells are finished in water-table aquifers; however, the majorityof wells in the area are finished in artesian aquifers and this report deals mainly with the artesianaquifers.
In the Bountiful district, Thomas and Nelson (1948) defined three separate artesianaquifers-the shallow, intermediate, and deep aquifers. Local differences in lithology occur withinthe district, and frequently it is not possible to distinguish among the aquifers. Depths to the topsof the aquifers below land surface range from 60 to 250 feet, from 250 to 500 feet, and morethan 500 feet for the shallow, intermediate, and deep aquifers, respectively. Each aquifer variesconsiderably in thickness.
For most of the Weber Delta district, Feth and others (1966, p. 36-37) have delineatedtwo major artesian aquifers. The more productive and areally extensive is the Delta aquifer, thetop of which is from 500 to 700 feet below land surface and which generally is from 50 to 150feet thick. The Sunset aquifer is shallower, but it is not as productive nor as extensive as the Deltaaquifer. The top of the Sunset aquifer in most places is from 250 to 400 feet below land surface,and the aquifer is from 50 to 250 feet thick. Artesian aquifers exist above the Sunset aquifer inmany parts of the area, but they are generally less productive and are limited in areal extent. TheDelta and Sunset aquifers do not extend to the area south of Kaysville because of a bedrock highnear Kaysville. (See Feth and others, 1966, p. 36.) In the area of Ogden-Plain City-North Ogdenthe two aquifers are not recognizable as separate units.
Ground water moves generally westward from the areas of recharge toward Great SaltLake. Feth and others (1966, p. 54-56) estimated that 40,000 acre-feet of water flows annuallythrough a section of ground-water reservoir about 13 miles long and 1,300 feet thick in theWeber Delta district. Some water is intercepted and discharged by wells; some moves upwardthrough the confining beds and is discharged by springs, seeps, and evapotranspiration in thelowlands near Great Salt Lake; and some continues through the aquifers westward under the lake.
The movement of water in aquifers beneath Great Salt Lake has been traced almost as faras Antelope Island. In 1968 a test well-(B-4-3)19acc-1-was drilled on the causeway fromSyracuse to Antelope Island about three-quarters of a mile northeast of the northern tip of the
5

island. The well was 127 feet deep, and a flow of about 10 gpm of fresh water was reported from97 feet. In 1969 well (B-4-3) 19caa-3 was drilled on the causeway about a quarter of a mile westof well (B-4-3) 19acc-1. Lithologic samples taken from well (B-4-3) 19caa-3, while not whollydependable, indicate that the well penetrated alternating layers of clay and sand or sand in a claymatrix. The samples show an increase of grain size of the sand with depth from very fine near thesurface to very coarse at 481 feet, where the driller reported consolidated rock. The well casing isperforated in fine to coarse sand at intervals from 423 to 475 feet; and when completed the wellflowed about 280 gpm with a static head of about 54 feet above the causeway. Although the wellnow produces only from 423 to 475 feet, it also yielded water during drilling from a depth ofabout 150 to 170 feet with an artesian head of about 30 feet above the causeway.
The aquifers in the East Shore area extend beneath Great Salt Lake, and the generalmovement of ground water in these aquifers is from east to west. However, the chemical qualityof some of the water obtained from the deeper aquifer by one of the wells on the causewaysuggests the possibility that some of the water may be derived from precipitation on AntelopeIsland. (See p. 17. ) Additional test wells are needed in this area for better evaluation of thismatter.
Extension of the delineation of the aquifers in the Weber Delta district as described byFeth and others (1966) was made possible by the drilling of 15 test wells during 1967-69 in secs.31 and 32, T. 7 N., R. 3 W., near Little Mountain. The depths and diameters of the test wellsrange from 412 to 920 feet and from 2 to 4 inches, respectively. One well has 65 feet of screen atvarious depths from 656 to 920 feet; each of the other wells has a 10- or 20-foot screened sectionat the bottom. Heads at the wells range from about 25 feet above land surface in the shallowestzone to about 55 feet in the deepest zone, and flows range from about 35 gpm in a shallow well(10 ft of screen) to 180 gpm in the deepest well (65 ft of screen). The most productive wells, perfoot of screen length, are the wells finished in sand and gravel (as reported by the driller) at aboutthe 700-foot depth.
Tests of aquifer performance, ranging from 24 to 97 hours, were conducted on the wellsnear Little Mountain in 1969. The tests indicated that the wells were producing water from fourseparate zones (see fig. 6). During the test period little or no vertical leakage between zones wasindicated. The calculated hydraulic conductivity (a measure of the ability of the rocks totransmit water) (see appendix) of the 700-foot zone is about 80 ft3/day/ft2 (cubic feet per dayper square foot) that of the 600-foot zone about 50 ft3/day/ft2; and that of the 400-foot zoneabout 160 ft3/day/ft2. The performance of the deepest zone was not tested. The calculatedvalues of storage coefficient ranged from 0.00003 to 0.00014 for all zones tested, but longer testswould probably have resulted in larger values.
For an area of 140 square miles in the Weber Delta district, Feth and others (1966, p. 47)estimated that 80,000-100,000 acre-feet of water could be removed from active storage1 with adecline in water level of 150 feet. In the same area, 300,000-600,000 acre-feet of additionalwater would be available by dewatering the upper 50 feet of the artesian aquifers. No estimate ofactive storage for other parts of the East Shore area was made, but Feth and others (1966, p. 49)calculated that an additional 730,000 acre-feet of water could be obtained by dewatering thetopmost 50 feet of the aquifers in an additional 189 square miles in the Weber Delta district.
1 Feth and others (1966, p. 46) used the term "active storage" to describe "water that can be readily developed and manipulatedwithout dewatering the artesian aquifers,"
6
Ground water is discharged from the area by wells and springs, by seepage into drains,lakes, and swamps, by subsurface flow, and by evapotranspiration. In 1939 the Utah StateEngineer, in cooperation with the Works Progress Administration (Utah State Engineer, 1940,p. 33-41), estimated that 26,000 acre-feet of water was discharged by wells in the project area forthis report. In 1946 Thomas and Nelson (1948, p. 195) estimated 14,000 acre-feet as the totalannual draft upon the ground-water reservoir in the Bountiful district by wells, springs, anddrains. In 1954 Feth and others (1966, p. 50) estimated that about 25,000 acre-feet wasdischarged annually by wells in the Weber Delta district. In 1959 Smith and Gates (1963)estimated that about 53,000 acre-feet was discharged annually by wells in the East Shore area.Springs account for a very small part of the total discharge of ground water. Feth and others(1966, p. 57) estimated that 20,000-70,000 acre-feet of water leaves the Weber Delta district assubsurface flow to Great Salt Lake.
Development of ground water
Well construction
The total number of wells constructed in the East Shore area during 1960-69 is shown infigure 2, and the wells constructed from 1960 through August 1969 are shown on plate 1 andtabulated in table 1. More than 75 percent of all the wells constructed are domestic and stockwells that are less than 6 inches in diameter, and most of these are flowing wells.
Most wells in the Bountiful district and in the southern part of the Weber Delta districtnear the mountain front are finished at depths of less than 400 feet, either because sufficientwater was obtained above that depth or because consolidated rock was encountered. In thesouthwestern part of the Weber Delta district, the predominance of wells drilled to depths greaterthan 400 feet indicates that the best aquifer in this area is more than 400 feet deep. In thewest-central part of the Weber Delta district, it appears that adequate supplies are being obtainedfrom nearly all depths, but most wells in the area west and north of Roy are less than 400 feetdeep. Wells in the east-central part of the Weber Delta district are mainly large-diameterpublic-supply wells more than 400 feet deep. In the northwest part of the Weber Delta district,most new water supplies are obtained from wells more than 400 feet in depth. In other parts ofthe project area the number of deep (more than 400 feet) wells constructed during 1960-69 isabout the same as the number of shallow (less than 400 feet) wells constructed during the sameperiod.
The number of wells constructed annually declined from 1964 to 1969, and the numberof wells drilled for replacement of inoperative wells was less than 2 percent of the total numberof new wells completed. This decrease in well construction coincides with the increaseddistribution of water through the facilities of water conservancy districts.
The total number of wells abandoned or unused in the project area is not known.However, the number of small-diameter wells abandoned or unused was estimated on the basis ofa detailed inventory made in September 1969 in five land sections that were believed to berepresentative of the entire area (sec. 26, T. 2 N., R. 1 W.; sec. 14, T. 3 N., R. 1 W.; sec. 16,T. 4 N., R. 2 W.; sec. 19, T. 5 N., R. 2 W.; and sec. 16, T. 6 N., R. 2 W.). The inventory showedthat 119 small-diameter wells were in use in the five sections. According to records of the UtahState Engineer, however, 173 small-diameter wells had been constructed in these five sections asof September 1969. Thus, about 30 percent of the total small-diameter wells on record wereeither abandoned or unused. Applying this percentage to the approximate number of 4,500small-diameter wells in the project area (based on fig. 2 and Arnow and others, 1964, p. 16 and20) indicates that about 1,400 small-diameter wells have either been abandoned or are unused,and about 3,100 such wells were in use in 1969.
7

80 -[<Iwells constructed- during year
c-- Wells 6 inches orlarger in diameter
60 - ,.-en ---'--'
'" ,.-• -...
400c--
'" -'"a>::E
~:::>z 20
~
f=--,..,. ~ ~
c-- ~~ ~
25
en
~ 20...en:::>o:J:......z~15- ...,.'"
"''''toe..>....a.. 10::E'":::>0a..
--'..:::>zz..
,22-
~~ --I..L
,---l.LNUMBER OF WELL S ---.-!!..L.
---2.L ---E..L
~
~
1960 1961 1 962 1963 1964 1 965 1966 1 967 1968 1969
Figure 2.-Annual pumpage for municipal and industrial supply and wellconstruction by years. (Pumpage data were supplied partly by U.S.Bureau of Reclamation and Utah State Engineer; well constructionrecords were obtained from files of the Utah State Engineer.)
8

Pumpage from large-diameter wells
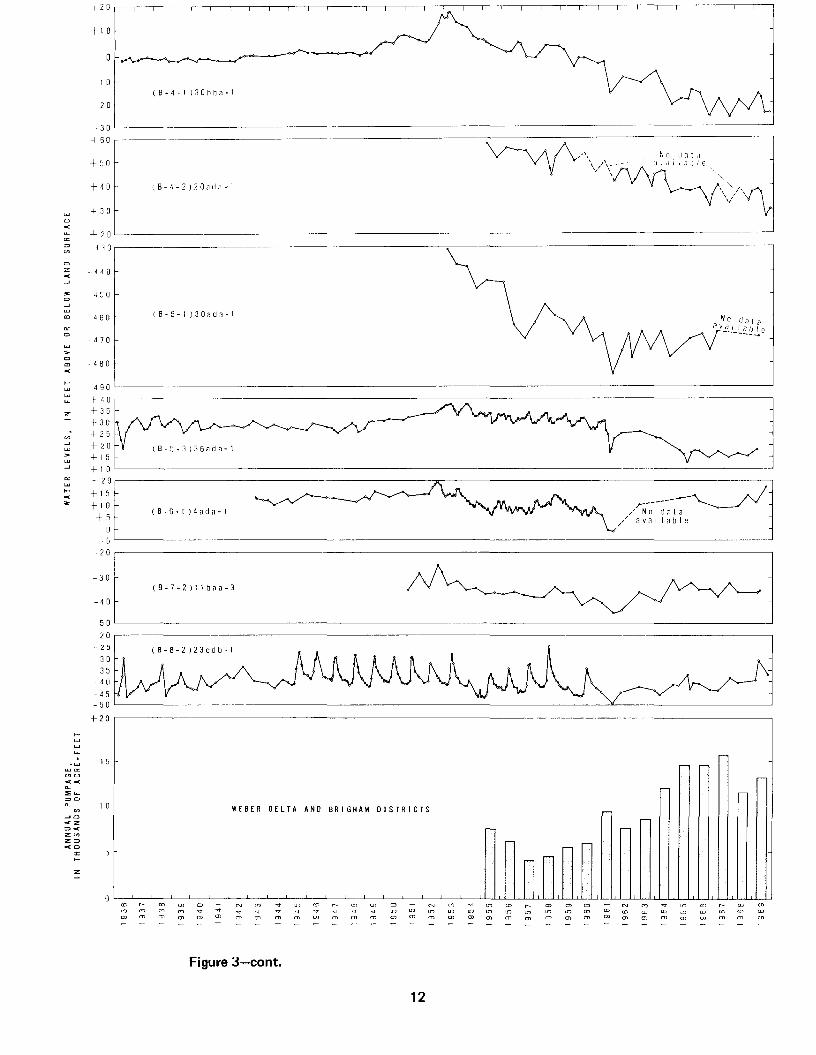
Most of the water pumped from the ground-water reservoir through large-diameter (6inches or larger) wells is used for municipal or industrial supply, including military use. Annualpumpage from wells for these uses in the East Shore area for 1960-69 is shown in figure 2. In1969, 75 wells were pumped to supply water for municipal and industrial use, and their locationsare shown on plate 1. Of these 75 wells, 38 were constructed during 1960-August 1969. Annualpumpage by ground-water district for 1955-69 is shown in figure 3. The general increase inpumpage during 1960-69 was the result of increased industrial activity and related populationgrowth. Minor deviations from the general trend probably reflect variations in demand caused byfluctuations of annual precipitation and variations in the available surface-water supplies, whichare the main source of water for irrigation.
About 80 other large-diameter (mostly 6 inches) wells, in addition to those pumped formu nicipal and industrial supply, were constructed from 1960 to August 1969. These aremu Itiple-use wells, which may provide water for domestic, stock, industrial, and irrigation uses;and pumping rates or flowing rates of these wells range from less than 10 to 1,000 gpm. The totaldischarge in 1969 from all mu Itiple-use large-diameter wells was estimated to be 5,500 acre-feet.
Discharge from small-diameter wells
Water from small-diameter (less than 6 inches) wells is used for domestic, stock,irrigation, and industrial supplies, but use by industry is minor. Most of the wells flow and areused for more than one purpose. More wells are used for domestic and stock purposes than forirrigation, but the quantity of water discharged by wells for irrigation is greater than that fordomestic and stock uses.
Various estimates have been made for the total discharge by small-diameter wells in theEast Shore area. From a comprehensive inventory made in 1938-39 by the Utah State Engineer(1940, p. 37-38), it was estimated that the annual discharge by all wells (at that time nearly allwere small-diameter wells) in the area for this report was about 26,000 acre-feet. Thomas andNelson (1948, p. 190) estimated that the annual discharge from the artesian reservoir in 1946 inthe Bountiful district was about 12,000 acre-feet. Feth and others (1966, p. 50) estimated thatabout 18,000 acre-feet was discharged in 1954 from the Weber Delta district by small-diameterflowing wells, Smith and Gates (1963, p. 16) reported that about 40,000 acre-feet was dischargedin 1955 and 1959 from the southern and central parts of the East Shore area by flowing wellsand small-diameter wells pumped for domestic use.
In this report, an estimate of discharge from small-diameter wells is made as follows: In1939 about 4,400 small-diameter wells discharged about 26,000 acre-feet of water (about 5.9acre-ft per year per well) in the project area (Nelson, 1951). In 1969 about 3,100 small-diameterwells were in use in the project area. Pumped wells comprise about 25 percent of all thesesmall-diameter wells, and their discharge would not be substantially affected by change inpressure. Therefore, about 800 (0.25 x 3,100) small-diameter pumped wells discharged about4,700 (800 x 5.9) acre-feet of water. The flowing wells comprise the remaining 2,300 wells.Based on discharge measurements of all flowing wells in the five representative land sectionslisted earlier, it was estimated that flowing wells have decreased in discharge since 1939 by about30 percent in the Bountiful district and by 60-75 percent in the Weber Delta district. Using anaverage decrease of 50 percent for the entire area results in an estimated discharge of about 6,800(2,300 x 5.9 x 0.50) acre-feet. Combining this with the discharge from the pumped wells yieldsabout 12,000 acre-feet from all small-diameter wells in 1969. Because of the inherent errors inthis type of calculation, the amount of 12,000 acre-feet should be considered as only a roughestimate.
9

The discharge of wells for irrigation and domestic and stock use in the project area hasalso been estimated on the basis of annual changes since 1959 in discharge of selected observationwells distributed throughout the area. By 1968 this discharge was estimated as about 27,000acre-feet (Baker and others, 1969, pAl. That estimate included about 5,000 acre-feet of waterfrom large-diameter wells, so only about 22,000 acre-feet was attributed to small-diameter wells.Decreasing this quantity by 30 percent to allow for unused and abandoned wells leaves a total ofabout 15,000 acre-feet, which is in reasonable agreement with the 12,000 acre-feet estimated inthis study. A more accurate estimate could be obtained only by a detailed inventory of the entirearea. The decrease in discharge by small-diameter wells from 1939 to 1969 is due in part tonormal well deterioration with time, in part to a decrease in pressure in the artesian system and inpart to a decrease in the number of small-diameter wells in use, owing to the increased availabilityof water from public supplies in many rural and suburban areas.
Summary of withdrawals
The following table lists ground-water withdrawals, in acre-feet, by wells for 1960 and1969 in the project area:
1960
Large-diameter wells used for municipal andindustrial supply (fig. 2)
Large-diameter wells used for irrigationSmall-diameter multiple-use wells
Total (rounded)
1969
Large-diameter wells used for municipal andindustrial supply (fig. 2)
Large-diameter multiple-use wellsSmall-diameter multiple-use wells
Total (rounded)
10,5001001
40,0001
51,000
21,0005,500
12,00038,000
1Reported by Smith and Gates (1963, p. 16-17) in 1959 and was assumed to be the samefor 1960.
The effect of ground-water withdrawals on the aquifers
Water-level fluctuations
Water-level changes in the project area from March 1960 to March 1969 are shown onplate 2. Water levels rose an average of 5 feet in both the Bountiful and Brigham districts; thusindicating that the net recharge to the aquifers was in excess of withdrawals for this period. Inmost of the Weber Delta district, however, water levels declined during 1960-69. The decline forthe district averaged about 10 feet, thus indicating that withdrawals from the aquifers were inexcess of recharge for the period.
Hydrographs of water levels in selected wells in the project area are shown in figure 3,together with the cumulative departure from average annual precipitation at Ogden Pioneerpowerhouse and the annual pumpage for municipal and industrial supply in the various
. 10

Arrow denotes effect of pump age at
(B-2-1 )26aa(l-t
(B-2-1 )133ab 1
(A·2-1 )18abll-12
(A-2-1 )19'Jbc-l
~-----
r-
,..,.EQUNTIFUL DISTRICT r-
o+3 0,----------------------------------------------~-------__,
+3 5 ,..---,-------,--,--,----,---,--,----,---,--,----,---,--,--,------,-,-----,--,--,--,--,----,,.--,--,----,-,--,--,-,--,--,-,--,--,
+3 a+25+2 a+15+10
+5OL- -----.J
-55,----------------------------------------------------,
60-65
7 a75
8085
9095-I a0 L- =-- ---'
+5 0,----------------------------------------------------,
+45+ 4 a+ 3 5+ 3 a+2 5+2 a+1 5 L- ---'
+5 5 ,-------------------------------------------------------,
+ 50
+ 4 5+40+35+ 30+ 2 5+ 2 a+15+1 a L- ---'
+++3
2
4
0
0
"f \:1[ ".,., "",.., .J+10 -----------------------------------------------
1a
z
'"ow>omc(
0>
'"o0>
'"'"m
OGDEN PIONEER POWERHOUSE
1 D L--'-_-'-_L--'-_-'-_L--1_-'-_-'---'_-'--_-"----.J_-'--_..L.---.JL--'--_..L._L--'-__--'-_L--'-__"-_L--1_-'-_-'---'_-'--_-"-----JL--'-----.J
Figure 3.-Relation of water levels in selected wells to cumulative departurefrom the 1941-69 average annual precipitation at Ogden Pioneerpowerhouse and municipal and industrial withdrawals from wells.
11
1 0
20
(B-4-2 )208[18·1
30 L ----'
+60 ,----------------------------;-------:;-------------1
~"" No Jilt"
\/\~------ J. ,; i, ill) I e,."~,,, "\1\\ / '.'/
+" 0
+ 20 L.- -'
4:J 0,----------------------------.:-------------------------~
~,.o'" 4 8 0<
<-'
'"C>
-'~
'"'"C>
44 0
450
460
470
(B-5·1 )30ada·1
~------~/ No [J (l t a
// (l val I (l b I e(B-6-1 )4ada·1
4 90 L ..J
~ ~ ~ 1}30
+- 2 5
t~~ (B5-3)36ada·1
+10---~--- -------------------
+ 20r--------------------------:~-----------------------~
+15
+10-+5
oSL.---------------------------------------------------'
"'-'~,.~
-'
-_-_::::~ 1t (B·7-2)1Ibaa.3 j
,-
,-
,-,-
WEBER DEL TA AND BR I GHAM DISTRICTSr-
r-
I I I I I I I I
n~
~! 1-50
+20
>-~
~
~. 15-~
~'"'-"'-'«"-::E~
=> 0"- 1 0
"'-' 0<z=> <z "'z=><0
:I:>-
Z
rocom
mcom
C>.,.m
N.,.m
ro.,.m
m.,.m
o
"'m "'m
N
"'m
co
"'m
.,."'m
"'"'m
CD
"'m
..."'m
'""'m
m
"'m
C><Dm
N
CD
m"'wm
wwm
roillm
m<Dm
Figure J-cont.
12

ground-water districts in the project area. Ogden Pioneer powerhouse is near the mouth of OgdenCanyon, and it was selected because fluctuations of precipitation at this station were assu med tobe representative of regional fluctuations of precipitation. Note that the withdrawals bysmall-diameter wells and by large-diameter wells for multiple-use purposes were not combined ona year-to-year basis in figure 3 with annual pumpage for municipal and industrial supply.However, withdrawals from these wells for 1960 and 1969 are given in the above table; and in thefollowing discussion, water-level fluctuations are related to total withdrawals from wells.
In the Bountifu I district, water levels in 1969 showed a general recovery from the lowlevels reached in 1961 (see hydrographs of wells (A-2-1)19dbc-1, (B-2-1)13aab-1, (B-2-1)26aad-1,and (A-2-1) 18abd-121. Water levels declined nearly 40 feet from the early 1950's to 1961 in partsof the district, but they have recovered about 30 feet since that low period. Large fluctuations inwater levels are characteristic of the areas in the Bountiful district where withdrawals from wellsare greatest. The rapid rate of recovery in the first half of tile decade was due to decreasedpumping, which in turn was due to the importation of water by aqueduct from the Weber River.The rate of recovery was slower during the latter part of the decade, because the pumping againincreased to about the same level as that prior to 1960. The water level in well (B-2-1)26aad-1probably best reflects this increased pumping.
Note that the low water levels in 1961 occurred after a long period of below averageprecipitation as well as after a period of heavy withdrawal from 1957 to 1959. In 1969, after 3years of withdrawal about equal in amount to that for 1957-59, and the curve for cumulativedeparture from average annual precipitation showing only a slight upward trend, water levelsremained considerably above the 1961 levels. This is due in part to urbanization in the rechargezone of the aquifers in the eastern part of the Bountiful district. Urbanization has resulted in alarge amount of lawn watering, predominantly with surface water brought in from outside thearea. This has resulted in a significant increase in the amount of recharge from the surfacebecause the area previously was not irrigated, and the only source of surface recharge was fromprecipitation directly on the area. Elsewhere in the district, water-level fluctuations coincidemore closely with changes in precipitation as is indicated by the hydrograph of well(B-3-1 )25dab-1.
During 1950-63, water was diverted from Centerville Creek into a nearby spreading basineast of Centerville along the mountain front. The diversions generally were from April throughAugust, during the period of maximum runoff when excess water was available for diversion. Theaverage annual diversion was 230 acre-feet, and the largest annual diversion was 548 acre-feet in1957. The amount of water diverted was small when compared to recharge by natural processes.The hydrograph of well (A-2-1) 18abd-12, which is a shallow well (90 ft deep) about 1 mile westof the spreading basin, shows similar fluctuations of water levels both before and during theperiod of diversion. Therefore, it is inferred that water spreading has not appreciably affectedwater levels in the shallow zone in this area.
Throughout the Weber Delta district, with the exceptions of the bench areas near NorthOgden and the extreme northern and southern parts of the district, water levels decl ined from1960 through 1969. The declines ranged from 0 to 20 feet in the district. Hydrographs of wells(B-4-1)30bba-1, (B-4-2)20ada-1, (B-5-1)30ada-1, and (B-5-3)36ada-1 (fig. 3) show water-levelfluctuations that are, in general, characteristic of most of the district.
13

The largest part of the water-level decline in the Weber Delta district occurred during theearly to middle part of the decade 1960-69 and was due mainly to the effects of the drought thatbegan in 1952, although pumping contributed to the declines. Water levels began declining almostcontinuously from 1952 until after the beginning of the period of above-average precipitation,1963-69 (indicated by the graph of cumulative departure from the average annual precipitation,shown in fig. 3). With the onset of above-average precipitation, the rate of decline subsequentlyslowed, or nearly stopped.
The changes in water level shown on plate 2 are the summation of year-to-year changes(Sumsion and others, 1970; and earlier reports in that series), most of which are quite different inareal distribution from the net changes shown on plate 2. The year-to-year changes show mainlythe localized effects of changes in rate of withdrawal from wells, whereas, the net change showsmainly a residual effect of the drought combined with continuing ground-water withdrawal at alower rate.
The net water-level changes for 1960-69 as shown on plate 2 are due to a complex set offactors that are partly mutually reinforcing and partly opposing in effect on the water levels. The11-year drought during 1952-62 resulted in a lower rate of recharge along the front of theWasatch Range. Concurrently the drought created a larger demand for supplementary water thatwas provided from wells, and the natural discharge from phreatophytic vegetation increased. Alsoconcurrently, the Great Salt Lake receded to an alltime low in 1963, which caused an additionalincrease in natural discharge to the lake. Some large pumped wells were installed. The largestdeclines occurred in the most heavily pumped areas such as that around Clearfield. The factorsthat combined to cause the decline were partly offset by the lessening of discharge from themany flowing wells as artesian pressures declined and as some of these wells were taken out ofservice.
Following the drought, withdrawal of ground water from wells did not cease; it continuedat a somewhat lower rate. The water withdrawn must have come from one or more of threesources: (1) an increase in recharge, (2) a decrease in natural discharge, and (3) a decline instorage in the aqu ifer system. It is not probable that appreciable additional recharge from themountain area was induced by lowering water levels; salvage of natural discharge was not greatlyincreased-it cannot be until water levels in the discharge area are greatly lowered; thus, most ofthe net dec line duri ng 1960-69 resu Ited from decrease in storage in the aqu ifer system.
Decrease in storage coupled with the finite time required for water to· pass from therecharge area to the discharge area thus combined to produce a water-level decline during aperiod when recharge apparently increased and discharge from wells decreased. The distributionof the water-level changes in the Weber Delta district, as shown on plate 2, appear to bear out theconclusion that an appreciable part of the net decline is a residual effect of the precedingdrought. The net declines during the study period were least near the mountains and greatestwest of North Ogden and near the shore of Farmington Bay. Neither of the latter two areas iswhere the largest withdrawals of ground water occur. The most heavily pumped area, nearClearfield, experienced only moderate net declines in water level. In addition, water levels rose inareas closest to recharge sources and where withdrawals are small, such as in the bench areas nearNorth Ogden and near Willard and Farmington. (See hydrographs of wells (B-6-1 )4ada-1,(B-7-2)11baa-3, and (B-3-1 )25dab-U
14

Water levels in the Brigham district rose during most of 1960-69 (see hydrograph of well(B-8-2)23cdb-1), and water levels in 1969 were about 5 feet higher than they were in 1960. Waterlevels in the Brigham district have not been greatly affected by withdrawals, because withdrawalsin this area are not as heavy as in parts of the Weber Delta district.
Changes in storage
Changes in storage in the East Shore area for 1960-69 were computed by using water-levelchanges for the period (pI. 2) together with storage factors estimated by Feth and others (1966,p. 46-47). For 130 square miles of artesian aquifers in the Weber Delta district, Feth and othersestimated that lowering the pressure 1 foot resulted in a release of water from storage of 60acre-feet; and for 10 square miles of water-table aquifer, they estimated that an average of about560 acre-feet could be released per foot of decline. The Weber Delta district comprises about 300square miles, excluding the extreme northern and southern parts of the district. Assuming thatwater-table conditions prevail in 20 square miles, then artesian conditions prevail in about 280square mi les of the district. Thus the decrease in storage in the artesian aqu ifer caused by anaverage 10-foot decline in pressure during 1960-69 is about 1.300 acre-feet; the decrease instorage in the water-table aquifer for the 10-foot decline is about 11,200 acre-feet; and the totaldecrease is about 12,500 acre-feet.
In the Bountiful district, about 40 square miles is underlain by artesian aquifers andabout 10 square miles by water-table aquifers. An average 5-foot increase in pressure for thedistrict during 1960-69 amounts to an increase of about 3,000 acre-feet in storage. The increasein the Brigham district is probably 1,000 acre-feet or less for the same period. The net change instorage for the entire project area, then, is a decrease of about 8,000 acre-feet.
Chemical quality
Summary of general conditions
Smith and Gates (1963, p. 30) reported that three major types of water were found in theEast Shore area-calcium magnesium bicarbonate, sodium bicarbonate, and sodium chloride.Some parts of the area contain mixtures of some or all the major types of water. The calciummagnesium bicarbonate type is predominant in aquifers extending along the mountain front andin a large area extending from the mountain front to west of Hooper. The calcium magnesiumbicarbonate type is generally the water containing the lowest dissolved-solids content. This is thetype of water found in all the mountain front streams and in the Ogden and Weber Rivers. Thesodium bicarbonate type waters generally occur downgradient from the calcium magnesiumbicarbonate type waters. Sodium bicarbonate type waters have been attributed to cationexchange (Feth and others, 1966, p. 60); that is, calcium and magnesiu m ions are exchanged forsodium as the water moves through the sediments. Most of the sodium chloride type water is inan area extending northwest from Ogden to Plain City and is the type generally associated withwater containing the highest dissolved-solids content. Sparse data suggest that similar water mayunderli.e much, or all, of the project area at depths exceeding those tapped by all but a few wells.
Plate 3 shows the dissolved-solids content and chemical type of the ground water in theEast Shore area. The map is modified from a similar map of Smith and Gates (1963, fig. 8),which showed conditions in 1961, on the basis of data collected since 1961 and the use ofslightly different criteria. The major difference between plate 3 and the map prepared by Smithand Gates is that water types and dissolved-solids content are depicted independently, and thatwater-type boundaries have been extended on the basis of new information. Comparison of the
. 15
two maps shows no major areal change of either dissolved-solids content or of water type. Bothmaps indicate areas where the chemical quality of the water varies with depth; but in most of theEast Shore area variation was too small to be delineated at the map scale used, or the availabledata were insufficient for such delineation.
Chemical quality of water from new wells
The chemical-quality data obtained for the East Shore area from 1960 to 1969 arereported in table 2, which also includes most of the chemical-quality data reported by Smith(1961). Data collected in four areas are considered significant enough to warrant furtherdiscussion in the paragraphs that follow.
The chemical and physical properties of the ground water and the hydraulic properties ofthe aquifers north of Little Mountain suggest that the ground-water reservoir in that area containsat least four distinct water-bearing zones. The zones (pI. 3) were delineated on the basis ofdrillers' logs and water-quality, water-temperature, and water-level data obtained from 12 wellsperforated at various depths. The presence of the zones was also supported by the results ofaquifer tests (see p. 6 ).
The water in all four zones is of the sodium bicarbonate type, and the dissolved-solidscontent increases with depth from an average of 350 mg/I (milligrams per liter) in zone 1 to 500mg/I in zone 4. Water from the deepest well, however, contained 980 mg/I of dissolved solids.The well casing is perforated in the upper part of zone 4 and in zone 3 as well as directly abovebedrock, which was encountered at a depth of 920 feet. Thus the dissolved-solids content of thewater in that part of the aquifer directly above bedrock may be much greater than 980 mg/I,because the composite sample obtained from the well may be diluted by water entering the wellthrough perforations in the upper part of zone 4 and in zone 3.
Temperatures of water from wells north of Little Mountain are considerably higher thanthose of ground water in the adjacent area to the southeast. The water temperatures observed inthe wells north of Little Mountain range from 25°C (77° F) in zone 1 to 39°C (102° F) in zone 4.The water temperature increases with depth, and the water in each zone has temperatures thatare 4-5°C (7-9°F) higher than those in the overlying zone. In the adjacent area about 1-3 miles tothe southeast, water temperature ranges from about 20°C to 22°C (68°-72°F) for depths similarto zones 1 to 3 (see pI. 3).
The source of heat causing the abnormally high ground-water temperatures north ofLittle Mountain is unknown, but it may be an underlying hot body or warm water that is movingupward along a fault. Feth and others (1966, p. 22) suggested that a major north-south fault maytrend just east of Little Mountain and that warm saline ground water might be issuing in a line ofseeps along the inferred fault southeast of Little Mountain. The water in zones 1, 2, 3, and in theupper part of zone 4 north of Little Mountain is not saline; thus the higher than normaltemperatures probably result from conductive vertical heat transfer rather than from mixing withwarm saline water.
In an effort to determine if zones 1-3 were continuous over a larger area, thedissolved-solids content of water and the water levels in wells finished in zones 1-3 werecompared with similar data from three wells 1-3 miles to the southeast (pI. 3). Although thedissolved-solids content of the water and the water levels in the three wells follow a patternsimilar to that of water from zones 1-3 (see pI. 3), the data are inadequate for definite correlationbetween the two areas.
. 16

Well (B-7-3)31aac-2 is perforated in several zones, and the available data indicate that thedeeper part of zone 4 may contain highly mineralized water. The water in zone 4 is under greaterartesian pressure than the water in the overlying zones, and it could contaminate the overlyingzones by means of a well perforated in several zones, such as well (B-7-3)31acc-2.
The dissolved-solids content of the ground water increases with depth west of WoodsCross in an area where the water is of the sodium chloride type. The water from well(B-2-1 )26cdd-4 was sampled during construction at several depths from 84 to 205 feet, and waterfrom well (B-2-1 )26cdd-3 was sampled at depths from 211 to 385 feet. The dissolved-solidscontent of the water was estimated from the specific conductance of the samples. The estimateddissolved-solids content ranged from about 500 to 700 mg/I in the 84 to 205 foot zone and fromabout 1,780 to 3,300 mg/I in the 211 to 385 foot zone (pI. 3). Sodium and chloride were thepredominant ions in all samples, and all samples contained moderate amounts of calcium andmagnesium. Measurements of the relative velocity of water within well (B-2-1 )26cdd-3, inconjunction with the chemical-quality data, indicated that most of the water containing morethan 1,000 mg/I came from a depth below 300 feet (R.H. Langford, written commun., 1962).
Data collected prior to and since 1963 near Hill Air Force Base indicate that a sodiumbicarbonate water may exist below a more dilute calcium magnesium bicarbonate water in thatarea. Well (B-5-1)33baa-2, drilled in 1963 to a depth of 1,187 feet, is screened at intervals from438 to 1,187 feet below land surface. Analyses of four water samples obtained during a 1-monthperiod indicate that the water type varied from a calcium magnesium bicarbonate to a sodiumbicarbonate type (table 2). The dissolved-solids content of the sodium bicarbonate type waterranged from 360 to 392 mg/I and that the calcium magnesium bicarbonate type water rangedfrom 228 to 246 mg/1. A similar water-quality change has been observed for well (B-5-1 )30add-l(pI. 3), and the reasons for the changes are discussed in the section on changes of chemicalquality.
The dissolved-solids content in the deep sodium bicarbonate type water in wells(B-5-1)30add-1 and (B-5-1)33baa-2 near Hill Air Force Base is higher than that in the sodiumbicarbonate type water found in the Delta aquifer northwest of the Weber delta (pI. 3). Becauseit has a higher dissolved-solids content, the sodium bicarbonate water found at depth in the Deltaaquifer near Hill Air Force Base probably is not the source of the sodium bicarbonate type waterin the Delta aquifer northwest of the Weber delta. Both bodies of sodium bicarbonate type water,however, may have resulted from similar processes of cation exchange as the water movedthrough fine-grained deposits (Feth and others, 1966, p. 63).
Chemical-quality data were obtained from a well on the Syracuse-Antelope Islandcauseway, which tapped aquifers beneath Great Salt Lake west of the East Shore area. (See p.5 .) Samples of water from well (B-4-3) 19caa-3, which were obtained from an artesian aquifer atdepths between 423 and 475 feet, contained from 661 to 783 mg/I of dissolved solids; and thewater was of the sodium chloride type. During the drilling of the well, a shallower artesianaquifer, which was eventually sealed off, was penetrated at a depth of 150 to 170 feet. Thisaquifer yielded a sodium bicarbonate type water containing about 330 mg/I of dissolved solids.
Comparison of the chemical analyses of water from the deeper aquifer with analyses ofwater from three springs near the north end of Antelope Island shows certain similarities. Thesprings are in sees. 30 and 33, T. 4 N., R 3 W., about 1%-2 miles south of the well. Thedissolved-solids content of water from the springs ranges from 837 to 2,710 mg/1. Water from allthree springs is of the sodium chloride type, and the higher the dissolved-solids content of thewater, the higher is the relative concentration of sodium and chloride.
17
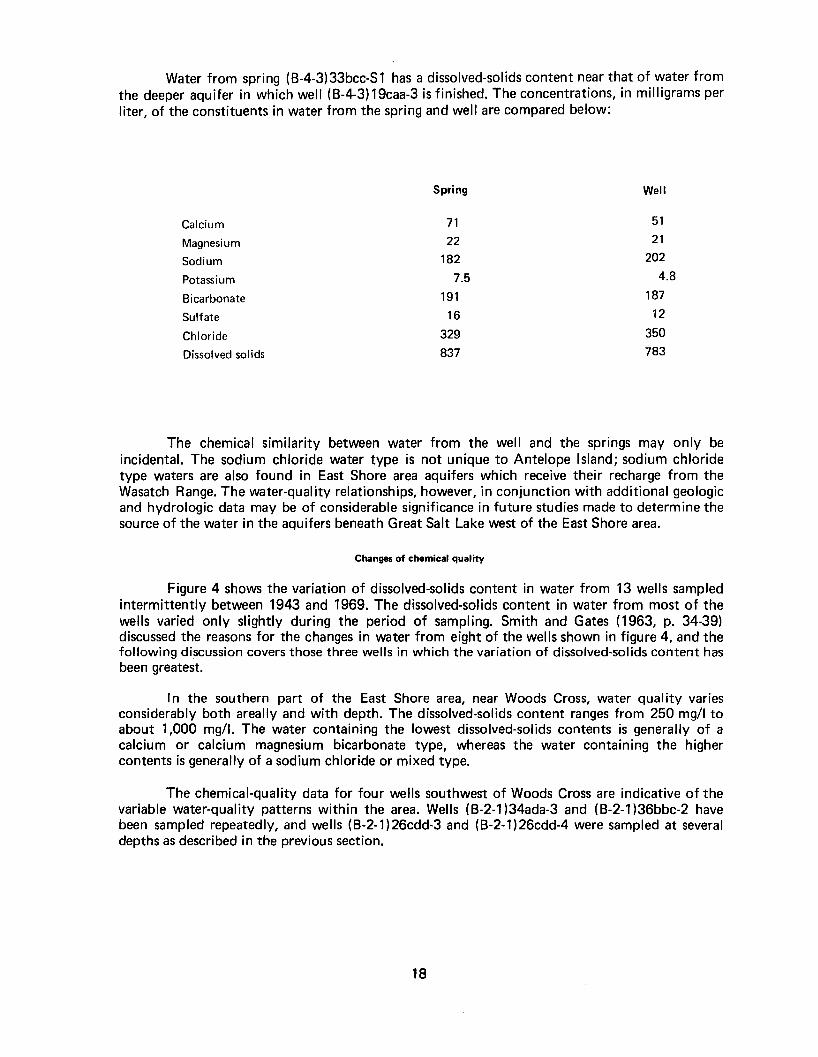
Water from spring (B-4-3)33bcc-S1 has a dissolved-solids content near that of water fromthe deeper aquifer in which well (B-4-3) 19caa-3 is finished. The concentrations, in milligrams perliter, of the constituents in water from the spring and well are compared below:
Spring Well
Calcium 71 51
Magnesium 22 21
Sodium 182 202
Potassium 7.5 4.8
Bicarbonate 191 187
Sulfate 16 12
Chloride 329 350
Dissolved solids 837 783
The chemical similarity between water from the well and the springs may only beincidental. The sodium chloride water type is not unique to Antelope Island; sodium chloridetype waters are also found in East Shore area aquifers which receive their recharge from theWasatch Range. The water-quality relationships, however, in conjunction with additional geologicand hydrologic data may be of considerable significance in future studies made to determine thesource of the water in the aquifers beneath Great Salt Lake west of the East Shore area.
Changes of chemical quality
Figure 4 shows the variation of dissolved-solids content in water from 13 wells sampledintermittently between 1943 and 1969. The dissolved-solids content in water from most of thewells varied only slightly during the period of sampling. Smith and Gates (1963, p. 34-39)discussed the reasons for the changes in water from eight of the wells shown in figure 4, and thefollowing discussion covers those three wells in which the variation of dissolved-solids content hasbeen greatest.
In the southern part of the East Shore area, near Woods Cross, water quality variesconsiderably both areally and with depth. The dissolved-solids content ranges from 250 mg/I toabout 1,000 mg/1. The water containing the lowest dissolved-solids contents is generally of acalcium or calcium magnesium bicarbonate type, whereas the water containing the highercontents is generally of a sodium chloride or mixed type.
The chemical-quality data for four wells southwest of Woods Cross are indicative of thevariable water-quality patterns within the area. Wells (B-2-1 )34ada-3 and (B-2-1)36bbc-2 havebeen sampled repeatedly, and wells (B-2-1)26cdd-3 and (B-2-1)26cdd-4 were sampled at severaldepths as described in the previous section.
18

1 0 0 0 ,-"---.,---.---.,---.,---.,---.,---.,---.,---.,---.,---.,-"---.,-"-"-"-"-"-"-"'I
900K
Y
420r '"'"'I3 0 0 -
I I I I I I I I I I I I I I I I I
( 8 - 2 - 1 ) 34 a d a - 3 C2 70; -](8-7-3 )33edd-1 [399;-]
(8-6-2)1 Idad-I [285;27~
J
(8-6-2)27ded-2 [625; 615-625JK K
[900;-]
(8-6-1 )6eaa-1 [640;-J
(8-5-1 )33eda-1 [730; 584-623, 678-716J
400
200 l------
400~be-1[220;
300~--------------------'
300
400[~,., ":",.,
300
5 00 r----------------------------,
200
(8-4-1 )6ded-) [805; 610-]
( 8 - 2 - I ) 3 6 b be- 2 [5 0 1; 2 5 0 - 5 0 1]
(8 - 2 - 1 ) 1 3 a a b - I [264; -]
( 8 - 5 - 1. ) 3 0 add - ) [900; 654 - 695, 820 - 888]
( A- 2 - 1 ) 7 a b a - 4 [450; -]
200
800'"w>--
'"WD- 700
'"::E..'"'"........::E 600
>--zw>--z 5000
'-'
'"C>
....0
'" 400C>w>....C>
'"'"300
I 0 0 L...J--.l--.l-----'------'--L---'---L.....L......L.--L..L...J_...L-...L--"---.L....L..L....L....J--.l 1 0 0 l-L.J-----l---l-----'------'----'---L-L-L-L.....L.---L..L...L...L-...L--"---.L.....L....L..L-L...J--.l.....J~ m M ~ ~ m M ~ ~ m M ~ ~ m M ~ ~ m M ~ ~ en~ ~ ~ ~ ~ ~ ~ ~ m m ~ v ~ ~ ~ ~ ~ ~ m m m mOl en en en
EXPLANATION654-695,820-888J
Depth of finishland surface
[900 ;
Depth of we I IIn feet below
KDissolved-sol ids content estimated
from specific conductance
Figure 4.-Variation of dissolved-solids content in water from selected wells,1943-69.
19

The dissolved-solids content in water from wells (B-2-1l34ada-3 and (B-2-1l36bbc-2 haveranged from 552 to 944 mg/I and 578 to 750 mg/I, respectively, during the period of sampling(fig. 4). The increase of dissolved-solids content in water from well (B-2-1 )34ada-3 is dueprincipally to increases of sodium and chloride, whereas the increase in water from well(B-2-1 )36bbc-2 is due principally to increases of sodium, bicarbonate, and sulfate. Well(B-2-1 )34ada-3 is 270 feet deep and is either screened near the bottom or has an open end. Well(B-2-1 )36bbc-2 is 501 feet deep and is perforated at intervals from 250 to 501 feet.
Although the dissolved-solids contents have fluctuated during the period of sampling, thelowest observed content in each well was found in the initial sampling. The increases andsubsequent fluctuations in dissolved-solids content in water from wells (B-2-1 )34ada-3 and(B-2-1 )36bbc-2, together with water-quality variation with depth in wells (B-2-1 l26cdd-3 and(B-2-1 l26cdd-4, suggest that the fluctuations may be due to upward movement of water with ahigher dissolved-solids content. The movement may have resulted from localized pumping orfrom the overall withdrawal of ground water within the general area.
The chemical composition of water from well (B-5-1 )30add-1 at Hill Air Force Base hasfluctuated significantly during the period 1943-69 (fig. 4). The dissolved-solids content has variedfrom about 325 to 600 mg/I, and the chemical type has varied from a calcium bicarbonate typeto a sodium bicarbonate type (pI. 3). The well is 900 feet deep, and the casing is perforated atdepths of 654-695 and 820-888 feet in layers of clay, sand, and gravel. The well is generallypumped at a discharge of 800-900 gpm.
The variation of chemical quality is apparently due to different proportions of waterbeing contributed by two different zones within the Delta aquifer. During periods of largewithdrawals, a relatively larger amount of water is apparently contributed by the deeper zone.
The data on plate 3 indicate that well (B-5-1 )30add-1 yields a mixture of water of twodifferent chemical compositions. The extreme ends of the curves for each constituent probablyapproach the chemical compositions of the waters from the two zones; the extreme left-hand sideof the curve represents primarily water from the upper zone, and the extreme right-hand side ofthe curve represents primarily water from the deeper zone. Samples obtained at different depthsfrom nearby well (B-5-1)30ada-1 during April 1969, and data from nearby wells finished only inthe shallower zone, also suggest that water of different chemical types occurs at different depths,with the dissolved-solids content generally increasing with depth.
The calcium bicarbonate type water is typical of the water from the Wasatch Range thatrecharges the ground-water reservoir, whereas the sodium bicarbonate type water is the productof complex chemical changes that have taken place as the water moved through the ground-waterreservoir. The concentration of bicarbonate may have increased because of the increased carboncontent made available by the oxidation of organic materials in the water-bearing sediments.Increased concentrations of bicarbonate in water are sometimes associated with processes causingsulfate reduction, and the almost complete absence of sulfate from the sodium bicarbonate typewater probably is a reflection of this process. The reducing environment may result from organicdecomposition in the sediments; and the sulfate is reduced to sulfide, which is a gas under naturalconditions. The water from many flowing wells in the area has an odor of hydrogen sulfide, thussuggesting the existence of such a reducing environment.
20

Feth and others (1966, p. 63) have suggested that the increase in concentration of sodiumin other parts of the East Shore area may be caused by cation exchange as the water movesthrough clays. The clays have a limited exchange capacity, however, and water probably has beenmoving through them for many hundreds of years. Once the cation exchange capacity isexceeded, cation exchange cannot continue. In order to provide the information necessary formore complete understanding of the geochemical relationships involved, additional data areneeded regarding types of clays present, mineral chemistry, exchange capacities and exchangeableions of the clays, and physical and chemical properties of the water within the ground-waterreservoir.
Suitability for use
The suitability of water for irrigation depends upon the characteristics of the soil wherethe water is to be applied as well as upon the dissolved-solids content and chemical type of thewater. Because of variable irrigation management practices and soil characteristics, determiningthe suitability of water for irrigation on the basis of water-quality criteria alone can be onlyapproximate.
In general, for a given dissolved-solids content, a calcium bicarbonate or calciummagnesium bicarbonate type water is more suitable for irrigation than a sodium type water; andfor any water type, the lower the dissolved-solids content, the more suitable the water is forirrigation, within reasonable limits.
In the East Shore area north of T. 5 N. and south of T. 4 N., ground water that is of asodium chloride or a sodium bicarbonate type and contains more than 500 mg/I of dissolvedsolids is of poor quality for irrigation (pI. 3). Unless the drainage characteristics of the soils andthe irrigation-management practices are good, use of this water could impair the productivity ofcrops.
In Tps. 4 and 5 N., most of the ground water is of a calcium magnesium bicarbonate orcalcium bicarbonate type containing less than 500 mg/I of dissolved solids and is of suitablequality for irrigation.
The inorganic chemical-quality factors that affect the suitability of water for domesticand public supply are hardness and the quantities of dissolved constituents. Most of the water inthe East Shore area contains more than 180 mg/I of hardness as calcium carbonate (CaC03) andis classed as very hard. Such hard water would generally be considered undesirable unlesssoftened. The sodium bicarbonate type water (pI. 3) generally has lower hardness than the otherwater types.
The U.S. Public Health Service (1962) has established quality standards for drinkingwater which, although applying only to interstate carriers and others subject to Federalquarantine regulations, have been adopted by several states. The recommended maximum limitsfor some of the inorganic chemical constituents, in milligrams per liter, are listed on the followingpage:
21
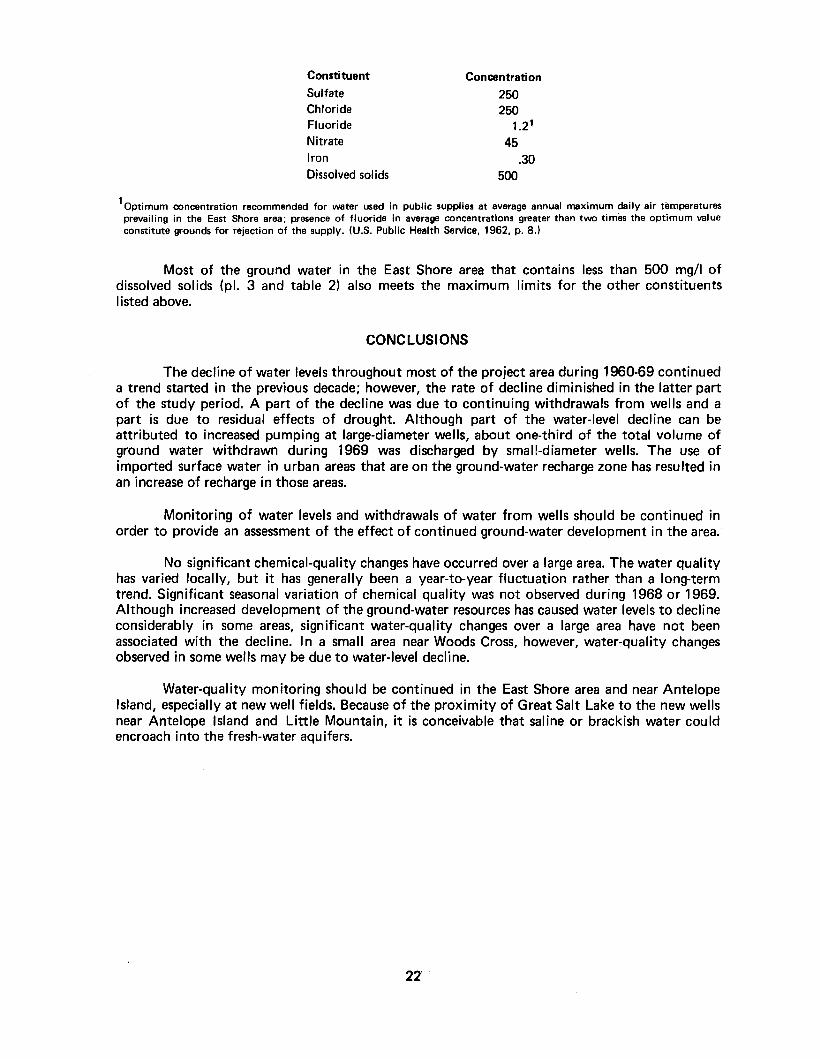
Constituent
SulfateChlorideFluorideNitrateIronDissolved solids
Concentration
250250
1.21
45.30
500
10ptimum concentration recommended for water used in public supplies at average annual maximum daily air temperaturesprevailing in the East Shore area; presence of fluoride in average concentrations greater than two times the optimum valueconstitute grounds for rejection of the supply. (U.S. Public Health Service, 1962, p. 8,)
Most of the ground water in the East Shore area that contains less than 500 mg/I ofdissolved solids (pI. 3 and table 2) also meets the maximum limits for the other constituentsIisted above.
CONCLUSIONS
The decline of water levels throughout most of the project area during 1960-69 continueda trend started in the previous decade; however, the rate of decline diminished in the latter partof the study period. A part of the decline was due to continuing withdrawals from wells and apart is due to residual effects of drought. Although part of the water-level decline can beattributed to increased pumping at large-diameter wells, about one-third of the total volume ofground water withdrawn during 1969 was discharged by small-diameter wells. The use ofimported surface water in urban areas that are on the ground-water recharge zone has resulted inan increase of recharge in those areas.
Monitoring of water levels and withdrawals of water from wells should be continued inorder to provide an assessment of the effect of continued ground-water development in the area.
No significant chemical-quality changes have occurred over a large area. The water qualityhas varied locally, but it has generally been a year-to-year fluctuation rather than a long-termtrend. Significant seasonal variation of chemical quality was not observed during 1968 or 1969.Although increased development of the ground-water resources has caused water levels to declineconsiderably in some areas, significant water-quality changes over a large area have not beenassociated with the decline. In a small area near Woods Cross, however, water-quality changesobserved in some wells may be due to water-level decline.
Water-quality monitoring should be continued in the East Shore area and near AntelopeIsland, especially at new well fields. Because of the proximity of Great Salt Lake to the new wellsnear Antelope Island and Little Mountain, it is conceivable that saline or brackish water couldencroach into the fresh-water aquifers.
22'
REFERENCES CITED
Arnow,Ted, and others, 1964, Ground-water conditions in Utah, spring of 1964: Utah Water andPower Board Coop. Inv. Rept. 2, 104 p.
Baker, C.H., Jr., and others, 1969, Ground-water conditions in Utah, spring of 1969: Utah Div.Water Resources Coop. Inv. Rept. 7,61 p.
Feth, J.H., Barker, D.A., Moore, L.G., Brown, R.J., and Veirs, C.E., 1966, LakeBonneville: Geology and hydrology of the Weber Delta district, including Ogden,Utah: U.S. Geol. Survey Prof. Paper 518,76 p.
Nelson, W.B., 1951, Discharge of wells in the East Shore area, Utah: U.S. Geol. Survey open-filerept., 8 p.
Smith, R.E., 1961, Records and water-level measurements of selected wells and chemical analysesof ground water, East Shore area, Qlvis, Weber, and Box Elder Counties, Utah: U.S.Geol. Survey open-file rept. (duplicated as Utah Basic-Data Rept. 1),35 p.
Smith, R.E., and Gates, J.S., 1963, Ground-water conditions in the southern and central parts ofthe East Shore area, Utah, 1953-1961: Utah Geol. and Mineralog. SurveyWater-Resources Bull. 2, 48 p.
Sumsion, C.T., and others, 1970, Ground-water conditions in Utah, spring of 1970: Utah Div.Water Resources Coop. Inv. Rept. 8, 71 p.
Thomas, H.E., and Nelson, W.B., 1948, Ground water in the East Shore area, Utah, Part 1,Bountiful district, Davis County, Utah: Utah State Engineer 26th Bienn. Rept., p.53-206.
Utah State Engineer, 1940, Twenty-second biennial report of the State Engineer: Utah StateEngineer, 226 p.
U.S. Public Health Service, 1962, Drinking water standards: U.S. Public Health Service Pub. 956,61 p.
23


APPENDIX
25
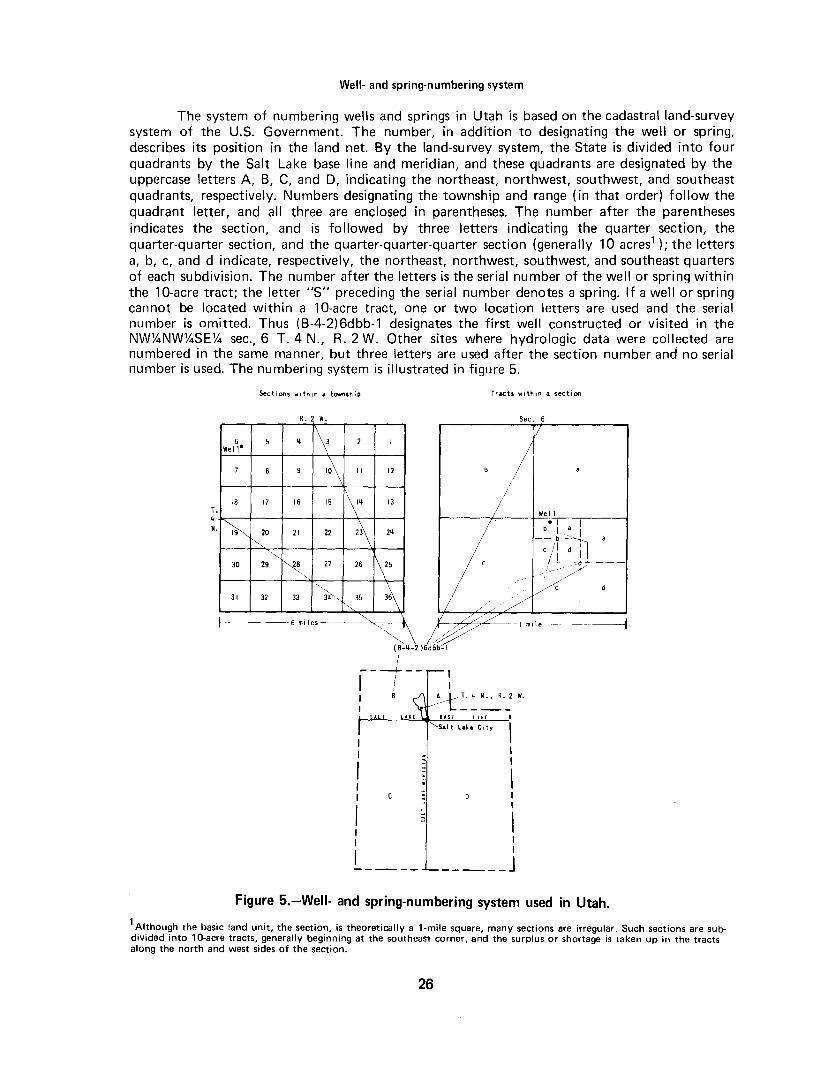
Well- and spring-numbering system
The system of numbering wells and springs in Utah is based on the cadastral land-surveysystem of the U.S. Government. The number, in addition to designating the well or spring,describes its position in the land net. By the land-su rvey system, the State is divided into fourquadrants by the Salt Lake base line and meridian, and these quadrants are designated by theuppercase letters A, B, C, and D, indicating the northeast, northwest, southwest, and southeastquadrants, respectively. Numbers designating the township and range (in that order) follow thequadrant letter, and all three are enclosed in parentheses. The number after the parenthesesindicates the section, and is followed by three letters indicating the quarter section, thequarter-quarter section, and the quarter-quarter-quarter section (generally 10 acres1 ); the lettersa, b, c, and d indicate, respectively, the northeast, northwest, southwest, and southeast quartersof each subdivision. The number after the letters is the serial number of the well or spring withinthe 10-acre tract; the letter "5" preceding the serial number denotes a spring. If a well or springcannot be located within a 10-acre tract, one or two location letters are used and the serialnumber is omitted. Thus (B-4-2)6dbb-l designates the first well constructed or visited in theNW%NW%SE% sec., 6 T. 4 N., R. 2 W. Other sites where hydrologic data were collected arenumbered in the same manner, but three letters are used after the section number and no serialnumber is used. The numbering system is illustrated in figure 5.
Sections wltt'lln a township Tracts within a section
Well
1. ~ N•• R. 2 W.
l-----T'~.-L-~-I mil e - ..._~~~--t
r-'''-'-'----''-'-'-'......:-'-'Cl.L---!~---''
III
III
III
- J
II
III
I
R 2 W
6 5 ~\3 2 I
Well"
7 8 9 I~ II 12
18 17 16 15 ,~~ 13
.~ 20 21 222\
2~
i',
"".~,30 29 27 26 \25
'"3\
31 32 33 3L1'", 35
~
~-"~--~~~6 miles ~
~'
T~
N
Figure 5.-Well- and spring-numbering system used in Utah.
1Although the basic land unit, the section, is theoretically a 1-mile square, many sections are irregular. Such sections are subdivided into 10-acre tracts, generally beginning at the southeast corner, and the surplus or shortage is taken up in the tractsalong the north and west sides of the section.
26
Use of metric units
The results of chemical analyses and temperature measurements are given in this report inmetric units, rather than the more familiar English units. Temperatures are given in degreesCelsius, and concentrations are reported in milligrams per liter or milliequivalents per liter.
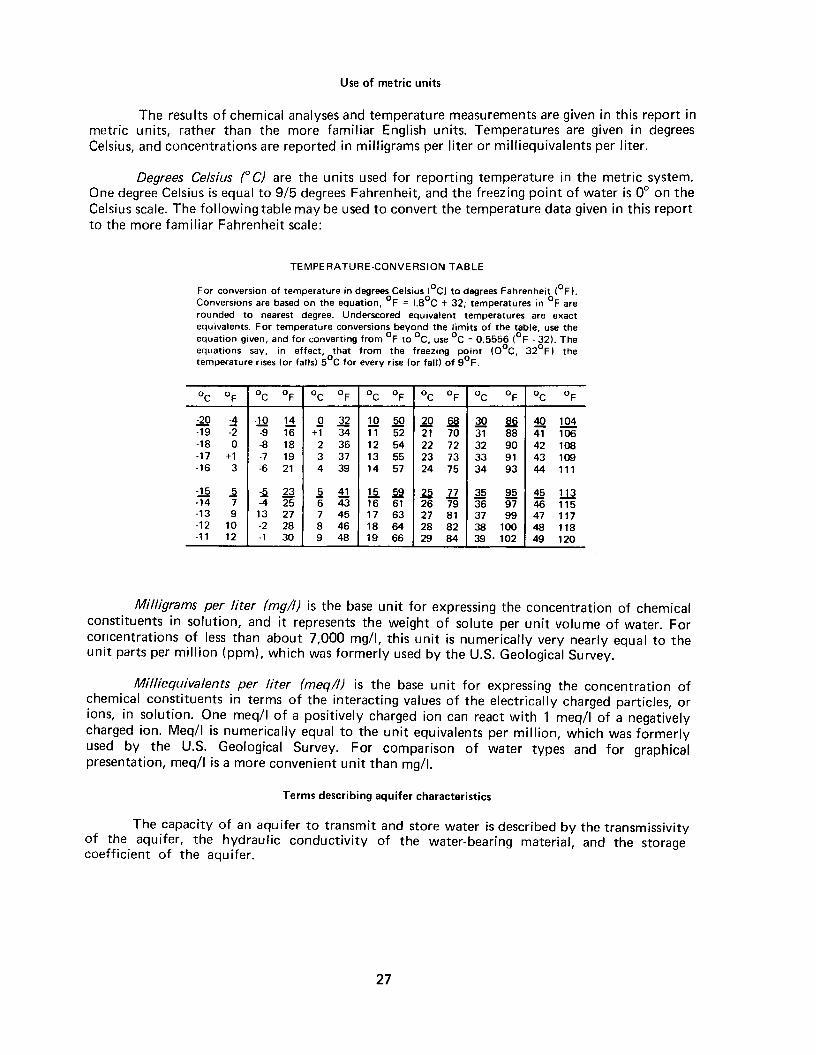
Degrees Celsius (0 C) are the units used for reporting temperature in the metric system.One degree Celsius is equal to 9/5 degrees Fahrenheit, and the freezing point of water is 0° on theCelsius scale. The following table may be used to convert the temperature data given in this reportto the more familiar Fahrenheit scale:
TEMPE RATURE·CONVERSION TABLE
For conversion of temperature in degrees Celsius (oCl to degrees Fahrenheit (oF).Conversions are based on the equation, of ~ !.8oC + 32; temperatures in of arerounded to nearest degree. Underscored equivalent temperatures are exactequivalents. For temperature conversions beyond the limits of the table, use theequation given, and for converting from of to °c, use °c ~ 0.5556 (oF - 32). Theequations say, in effect, othat from the freezing pgint (OoC, 320 Fl thetemperature rises (or falls) 5 C for every rise (or fall) of 9 F.
°c of °c of °c of °c of °c of °c of °c of
~ ~ -lQ li .Q ~ 12 ~ lQ ~ ~ ~ ~ !Qi-19 -2 -9 16 +1 34 11 52 21 70 31 88 41 106-18 0 ·8 18 2 36 12 54 22 72 32 90 42 108-17 +1 -7 19 3 37 13 55 23 73 33 91 43 109-16 3 -6 21 4 39 14 57 24 75 34 93 44 111
-15 ~ 2 23 ~ ~ 15 ~ ~ 11. ~ 95 45 W-14 7 -4 25 6 43 16 61 26 79 36 97 46 115-13 9 13 27 7 45 17 63 27 81 37 99 47 117-12 10 -2 28 8 46 18 64 28 82 38 100 48 118-11 12 -1 30 9 48 19 66 29 84 39 102 49 120
Milligrams per liter (mg/I) is the base unit for expressing the concentration of chemicalconstituents in solution, and it represents the weight of solute per unit volume of water. Forconcentrations of less than about 7,000 mg/I, this unit is numerically very nearly equal to theunit parts per million (ppm), which was formerly used by the U.S. Geological Survey.
Mi/liequivalents per liter (meq!l) is the base unit for expressing the concentration ofchemical constituents in terms of the interacting values of the electrically charged particles, orions, in solution. One meq/I of a positively charged ion can react with 1 meq/I of a negativelycharged ion. Meq/I is numerically equal to the unit equivalents per million, which was formerlyused by the U.S. Geological Survey. For comparison of water types and for graphicalpresentation, meq/I is a more convenient unit than mg/1.
Terms describing aquifer characteristics
The capacity of an aqu ifer to transmit and store water is described by the transmissivityof the aquifer, the hydraulic conductivity of the water-bearing material, and the storagecoefficient of the aqu ifer.
27

Transmissivity (T) is the rate at which water is transmitted through a unit width of theaquifer under a unit hydraulic gradient. The units for T are cubic feet per day per foot(ft3/day/ft), which reduces to ft2/day. The term transmissivity replaces the term coefficient oftransmissibility, which was formerly used by the U.S. Geological Survey and which was reportedin units of gallons per day per foot. To convert a value for coefficient of transmissibility to theequivalent value of transmissivity, mu Itiply by 0.134; to convert from transmissivity tocoefficient of transmissibility, multiply by 7.48.
The hydraulic conductivity (K) of a water-bearing material is the volume of water thatwill move through a unit cross section of the material in unit time under a unit hydraulicgradient. The units for K are cubic feet per day per square foot (ft3/day/ft2), which reduces toft/day. The term hydraulic conductivity replaces the term field coefficient of permeability, whichwas formerly used by the U.S. Geological Survey and which was reported in units of gallons perday per square foot. To convert a value for field coefficient of permeability to the equivalentvalue of hydraulic conductivity, multiply by 0.134; to convert from hydraulic conductivity tocoefficient of permeability, multiply by 7.48.
The storage coefficient ($) of an aquifer is the volume of water it releases from or takesinto storage per unit surface area of the aquifer per unit change in head. $ is a dimensionlessnumber. Under confined conditions, $ is typically small, generally between 0.001 and 0.00001.Under unconfined conditions, $ is much larger, typically from 0.05 to 0.30.
28

BASIC DATA
29


Table 1.-Records of selected wells in the East Shore area
WELL NUMBER: SEE APPENDIX FOR EXPlANATION.OWNER: SOME NAMES ABBREVIATED OWING TO SPACE LIMITATIONS OF AUTOMATIC DATA PROCESSING.DATE: YEAR IN WHICH WELL WAS COMPLETED. WHERE THE YEAR IS NOT KNOWN, THE PRIORITY DATE OF THE WATER RIGHT IS GIVEN IN PARENTHESES OR l1iE MOST RECENT DATE OF D/':F:PENING IS INDICATED BY AN ASTERISK (*).METIIOD OF COOSTRUCTION: C, CABLE TOOL; J, JETTED; H, HYDRAULIC ROTARY; V, DRIVEN,CASING DEPTH: DEPTH SHOWN IS DEPrH TO THE BOTTOM OF CASING, DEPTII TO TOP OF THE SCREEN, OR DEPTH TO FIRST PERFORATlOO, WHICHEVER IS APPLICAELE.FINISH: 0, OPEN-END CASING; P, PERFORATED CASING; 5, SCREEN.ALTITUDE OF LSD: LSD, LAND-SURFACE DATUM. SURVEYED ALTITUDES INDICATED BY Ai OTHER ALTITIJDES INTERPOLATED FROM U.S. GEOLOGICAL SURVEY 7~-MINUTE TOPOGRAPHIC MAPS.WATER LEVEL: STATIC WATER LEVEL; "+", INDICATES A POTENTIOMETRIC HEAD ABOVE LAND SURFACE: F, WELL FLOWING, BUT NO WATER-LEVEL MEASUREMENT AVAILABLE. METHOD OF MF..ASUREMENT INDICATED BY: A, STEEL TAPE;
C, AIRLINE GAGE; D, REPORTED BY DRILLER; F, PRESSURE GAGE; I, MANOMETER.YIELD: RATE - GPM, GALLONS PER MINUTE; REPORTED UNLESS NOTED BY M, MEASURED BY U.S. GEOLOGICAL SURVEY. WHERE BOTH RATE AND DRAWOOW'N ARE GIVEN AND WHERE WATER LEVEL IS "+", niE RATE IS THE PUMPING RATE;
B, INDICATES RATE OF LESS THAN 1 GEM. DATE - MONTH AND YEAR OF WATER-LEVEL AND YIELD DATA.WATER USE: USE SHOWN IS llIE PRINCIPAL USE. H, DOMESTIC; I, IRRIGATION: N, INDUSTRIAL; P, PUBLIC SUPPLY; S, STOCK; U, NOT USED.WELL USE: 0, U.S. GEOLOGICAL SURVEY OBSERVATION WELL; T, TEST HOLE; U, NOT USED; W, WITHDRAWAL OF WATER; Z, DESTROYED.LOG: AVAILABLE IN THE FILES OF UTAH DEPARTMENT OF NATURAL RESOORCES, DIVISION OF WATER RIGHTS, OR IN THE FILES OF U.S. GEOLOGICAL SURVEY. D, DRILLER'S; E, ELECTRIC; J, GAMMA RAY; N, NEUTRON;
Y, ELECTRIC, RADIATIC1N, AND SAMPLE (OR DRILLER I S); 6, RADIA TIOO, TEMPERATURE, AND FLUID COOIJUCTIVITY; 7, RADIATICl'l, TEMPERA11JRE, FLUID CONDUCTIVITY, AND SAMPLE (OR DRILLER'S).ontER DATA AVAILABLE: C, CHEMICAL ANALYSIS, OR K, SPECIFIC CONDUCTANCE, IN TABLE 2.
WELLNUMBER
1.0-1-11 f,AAA(A-2-11 hARR(A-2-11 AACC(A-2-11 hAC[)(A-2-1 I '<'P,RA-
fA-2-11 MIP,O-10IA-2-11 6UCC- 2(A-2-11 f,IJC[)- 2(A-2-1) 7AAC- 7(1.-2-1 I 7ABA- 4
OWNER
sn DAVIS IMPfllSE C N~WMMI
I{ r, FOROK HESSL l JF-NSEN
H W CURTISJ \oj REI f)
lION AID socPINEAE r.RFENHSF.J AR ADSHAW
DATE
1961lq67
( 1924)19691961
19651964
(1900 )1964
( 1930)
METHODOF CON
STRUCTION
WELLDEPTH(FT)
.20101
59122
80
A4196
60361450
DIAMETER(IN. )
206366
CASING
DEPTH(n)
3R'<'90
105
b"'0
176
27A
FINISH
p
pnp
n
ALTl~
TUDEOF LSD
(FT)
4810430042An43754222
429042664291 A431'54280 A
WATERLEVEL(FT)
23HIl
F212"
+1)
+l+IO
F+1t'! I
YIELD
DRAWMRATE DOWN(GPM) (FT)
10 4')01~ 1"]'; M
i:''J I"20 10
1075M
ISO
DATE
A-hl11-67
B-hBA-fl92-hl
':>-h51-643-f,99-64
10-A8
WATERUSE
PH
IHH
WELLUSE
••II
••
LOG
on
OTHERDATA
AVAILABLE
IA-2-1 I 7f~AR- 4IA-2-1) 7F~nc- 2I A-2-1) 17CCC- 3(A-2-111HARP,- 2IA-2-111AARD-12
IA-2-111AAf}A-15tA-2-111RCAA- 7I A-2-111f1CAP,-18(A-2-1) lRCAR-19CA.-2-1' 1RCBA.- 1
CA-2-111ACOA.- 6(A-2-11190RC- 1(/1.-2-1 120DnR- 1IA-2-1129RCD- 2I A-2-1130Acn- 1
(A-2-1131AO,ft,- 1I A-2-1I31 Af)O- 2IA-2-1H1CCA- 1IA-2-1)31CDD- 5(A-2-1 H2CCA- 1
(A-3-111ACAC{A-3-1118CCA(A-3-111ACDR{A-3-1 I 19CCC(A-:i-l119CDA-
IA-3-1119COI'\- 1(A-3-1)19COC- 2IA-3-1119cnc- 3(A-3-1130BRR- 2IA-3-1130RRC- 2
(A-3-1130B8C- 3I A-3-1130AFIf)- 1(A-3-1130EWO- 1(1I-3-1130CIIll,- 2(A-1-1nOCA.A.- 3
1/1.-1-1 130CAR- 5I A-3-1 131CAO- 3(A-3-1131(AO- 4I A-3-11 :'\ICDA- 2IA-3-1131DFlR- 1
R NIELSIJNCENTERVILLE ClyBOUNTIFlJL CITvCENTERVILLE CTYT Q WILLIAMS
F JONFSA JONESJ CHAPMANJOHNSONPETERSON
ROUNT I FIlL C lTVFlOUNT 1 FUL C I TVBQUNTIFIJL w r: [)G S ORlJMENTIAOUNTIFUL CITY
R N SCHLUTERR N SCHLUTERSO flAVIS IMP!)ISSO nAviS IMPDISROlJNTIFIJL CITY
N GROSSFAR.MINGTON C TTYH ERIKSSOND K SWANERFARMIN(;TON CfTY
J AlLFNB ANn [) ORTON[) WILCOCKW LEAVITTG ANDERSON
PR I TCHETTLEAVITTF STODDARO
L S RIeFFARMINGTOl\1 CITY
/'II MANNINGR f:: PFTTYP SCHWARTZFARMINGTON C tTvR SHARP
1965196619611961
( 1935)
19601961196219h5 *196R
19631934196719611950
(1946 )1961.
( 1934)1967
( 1947)
196419631966196519t->7
19641967196f~.
19611965
19691966196419611964
196f,1967196119641969
ccCHC
cccCH
85478500563
90
69116129190168
760380591170374
195;?45?I6500412
3R5223135180300
61200356228114
142125228234233
110129146165135
36
2016
2
161216
6IS
4
"81610
816
66
12
4
"684
666
812
466
126
85440140430
90
126
110
350170401157318
180
280
85110120105157
55102350IF1596
10880
10426
156
104102132140101
ppp
"p
31
42354245438042724289
4305428242hA427042h3
429543t'!FI A474045504440
4f,3A4710449846RO4A30
44004315437':>4?h'54315
43054297429A42MJ4250
425042554:\5043154325
42t'!54300430043004:i20
+'+12
+15 I
2+\
FF
+S 0
lA
8"+51120
130 A9n 0
137 AlA7 D
20 039 0
100 0+11 0
40 0
+?9
+7F
+25 f)
+15+20
602330
+10 D
'" 0
30 n
5100
1400400
3945
'017AO
1 ~
50900
525
4
70
1."
60'060
18060
2
"15
15">
74
72'S
98
160SA
o
75
15
123
2070
12
4-f,510-f,h
3-69
12-AO1-61
11-624-f,33-/,8
4-f,312-59
8-61f,-Al
12-594-1'>13-h94-'<'7
6-h46-A35-hhfl-AI)4-67
H-644-h79-'<'R
II-AI4-A5
1-'<'92-AA3-643-696-h4
7-60fl,-h7
11-67
l-A9
HHMH
p
pPHP
HHHHH
HHHPH
•[)
••w
ooof)
o
DoOJo
oDIJ[)
f)
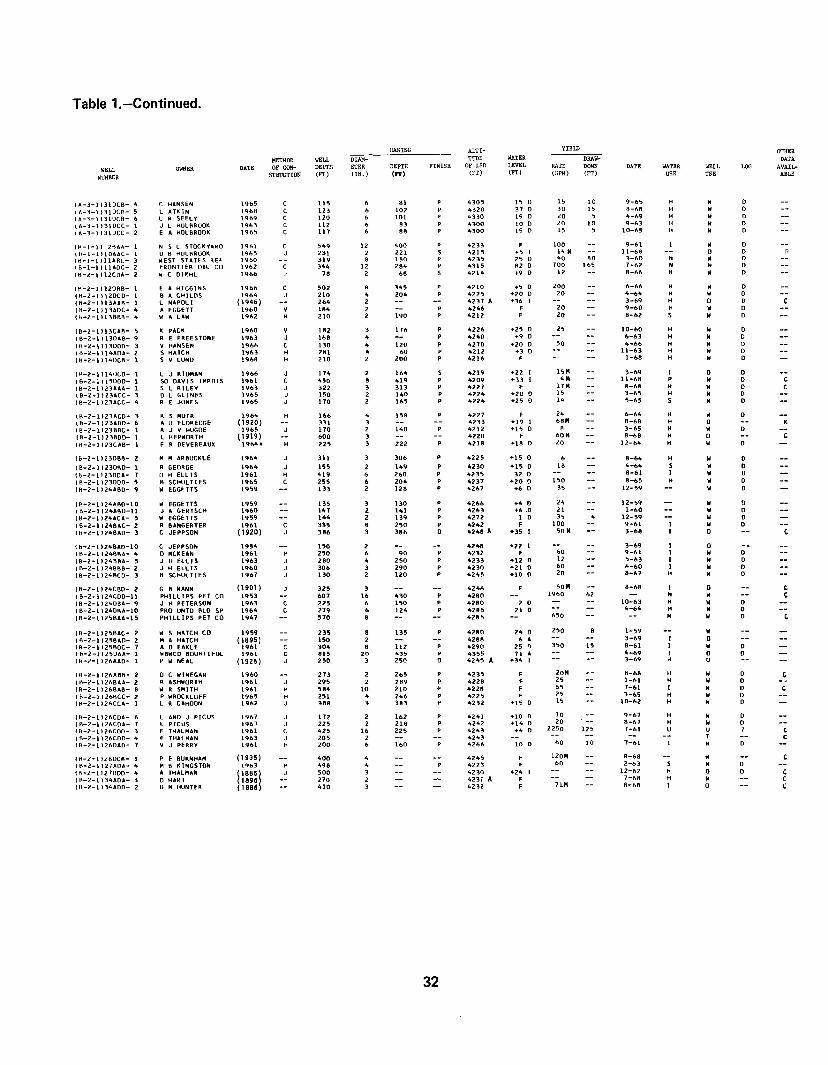
Table 1.-Continued.
CASING ALTI- YIEU>"'HER
METHOD WELL DIAM- TOOE WAtER DRAW~ DATA
WELL OWNER DATE OF CON- DEPTH ETER DEPIH FINISH OF LSD LEVEL RATE DOWN DATE WATER WELL LOG AVAIL-
NUMBER STRUCTlON (FT) (IN.) (rr) (FT) (FT) (GPM) (FT) DSE DSE ABLE
I A-3-11310C8- .. HANSEN 1965 115 • 81 4305 15 15 10 9-65 H W 0
(/1-3-1) 31DCp,- 5 AlK IN 1968 123 • 102 4320 31 3D 15 A-b8 H W 0
IA-3-1l310CB- b R SEELY 19b9 120 • 101 4330 19 20 5 4-b9 H W 0
I A-3-1 )310C(- 1 L HOLBROOK 1963 112 • 83 4300 10 20 10 9-63 H W 0
CA-)-1131DCC- 2 A HOLBROOK 1965 111 • 88 4300 15 15 5 10-65 H W 0
tt\-l-l) 2BAA- I N , L STOCKVARD 1961 C 549 12 400 4233 F 100 9-bl W 0
IB-I-lIIOAAC- I o 8 HOLBROOK 1965 J 231 2 221 4215 +5 14 M 11-68 0 0
(B-I-L111ARC- 3 WEST STATES REF 1960 319 8 150 4235 25 40 80 3-60 N W 0(B-I-1111AOC- 2 FRONTIER Oil CD 1962 344 12 284 4315 A2 0 100 I" 1-62 N W 0
(8-2-1I12CoA- 2 W C DIEHL 1966 18 2 .8 4214 +9 0 12 8-66 H W 0
IB-2-111'20Af\- 1 E A HIGGINS 1966 C 502 A 345 4210 +5 0 200 6-66 H W 0
t B-2-1 )120(0- 1 8 A CHILDS 1964 J 210 • 204 4225 +20 0 20 4-64 H W 0
(8-2-1 H3AAA- I L NAPOLI ( 1946) 2M 2 4231 A +,. I 3-69 H 0 0
18-2-1I13AOC- 4 4 EGGETT 1960 18. 2 • 4246 F 20 9-60 H W 0
IK-2-1)13BBB- 4 W A lAW 1962 210 2 190 • 4212 F 20 8-62 S W 0
(8-2-111"48- 5 PACK 1960 V 182 3 11. 4226 +25 0 25 10-60 H W 018-2-1 )130A8- 9 E FREESTONE 1963 J I.. 4 4240 +9 0 6-63 H W 0
tR-2-1)13000- 3 v HANSEN Pl66 C 130 • 120 4210 +20 D 50 4-66 H W 0
18-2-1 )14AOA- 2 S HATCH 1963 H 281 • '0 4212 +3 0 11-63 H W 0
1~-2-1)140C8- 1 S V lUND 1968 H 210 2 200 4216 F 1-68 H W 0
I A-2-1 ) 140CO- L J KIDMAN 1966 J 114 2 1•• , 42 PI +22 15M 3-69 J 0 01B-2-111 ~)QOO- SO DAVIS IMPOIS 1961 C .50 8 419 • ..209 +33 'M 11-68 • W 0 CtB-2-1 )23AA.&,- S l RILEY 1963 J 322 3 313 • ..221 F 11M 8-68 H W 0 C18-2-1)23ACC- '3 o l GLINES 1965 J 150 2 1.0 • 4224 +20 0 15 3-65 H W 01B-2-U23ACC- 4 R E JONES 1965 J 110 2 IbS • 4224 +25 0 I. 5-65 S W 0
18-2-1 )23ACO- 3 • S "'UIR 196.. 1•• • 15A 4221 F,. 6-64 H W 0
t 8-2-1123AOO- 6 4 u ELDREDGE ( 1920) 331 3 4233 +19 '8M 8-68 H 018-2-112388C- I A J Y HUGOE 1965 110 2 1.0 4212 +15 A 3-65 H W 018-2-U]3800- 1 L HEPWORTH ( Iglg) bOO 3 4220 F 'oM 8-68 H 0IB-2-1123CA8- 1 F R DEVEREAUX 1964. 225 3 222 4218 +18 0 20 12-64 H W
(8-2-1 )23088- 2 M ,.. ARBUCKLE 1964 J 311 3 30' 4225 +15 0 • 8-64 H W 018-2-11230BO- I • GEORGE 1964 J 155 2 149 4230 +15 0 18 4-b4 , W 01B-2-112300A- 1 o H ELLIS 19b1 H 41" • 2.0 4235 32 0 8-bI J w 0
18-2-1123000- 5 8 SCHUL TI ES 1965 C 255 • 204 4231 +20 0 150 8-65 H W 018-2-1I24A80- 9 W EGGETTS 1959 IH 2 128 4261 •• 0 35 12-59 W 0
IfI-Z-1124A80-10 W EGGETTS 1959 135 3 130 • 4266 +4 0 ,. 12-59 W 018-2-1124A80-11 J A GERTSCH 1960 141 2 141 • 4263 +. ,0 21 1-60 W 018-2-11244C4- 5 W EGGETTS 1959 144 2 139 • 4212 I 0 35 12-59 W 018-2-1) 248AC- 2 R BANGERTER 1961 335 8 250 • 4242 F 100 9-61 W 0CB-2-1 )248AD- 3 C JEPPSON ( 1920) 38. 3 38' 0 4248 A +35 J 50 M 3-68 0
18-2-1 )248AO-I0 C JEPPSON 1954 150 2 421t8 +22 1 3-69 J 0(8-2-1I2488A- 4 o MCKEAN 19.1 H 250 • 90 • "232 F '0 9-61 I W 018-2-1I2488A- 5 J HELL 1S 1963 J 280 • 250 • ..233 +12 0 12 5-63 I W 0IB-2-1124888- 2 J H ELLIS 1960 J 30. 3 290 • 1t230 +21 0 '0 6-60 I W 0(B-2-11248(D- 3 A SCHUL TIES 1'~61 J 130 2 120 • 42.5 +10 0 20 8-61 H W 0
18-2-1) 2.1tCBO- 2 G 8 MANN (1901) 325 3 42.6 60M 8-68 I 0(8-2-1 ) 24COO-11 PHI III PS pET CO 1953 '07 I' 430 1t280 1960 b2 N W18-2-1)240BA- 9 J H PETERSON 1963 225 • 150 1t280 2 0 10-63 H W 0tB-2-1 )2.1tDBA-I0 PRO UNTO ALO SP 1964 279 • 12' 4285 21 0 1t-64 H W 018-2-11258AA-15 PHILLIPS PET CO 191t1 570 8 4285 bSO N W 0
(8-2-1)258AC- 2 W S HATCH CO 1959 235 8 135 1t280 24 0 250 I-59 W
18-2-11258AO- 2 M A HATCH ( 1895) 150 2 4288 • 4 3-69 018-2-112'i80C- 1 A 0 EAKLE 19b1 304 8 112 • 4290 25 n 350 15 8-'1 W 018-2-1I250.&.A- 1 WBNCO BOUNTI FUL 1'161 Al' 20 435 • 4355 11 4 "-69 0 0lfoI-l-1126AAD- 1 P W NEAL (1925) 250 3 250 0 421t5 A +34 I 3-6'1 0
(R-2-1126AB8- 2 o C WINEGAR 1960 273 2 2bS • ,.235 F 20M 8-68 H W 0 CIB-2-U26BAA- 2 R ASHWORTH 1961 J 295 2 2A9 • 4228 F 25 1-61 H W 0 --IB-2-11268A9- 8 W R SMlTH 1961 H 58. 10 210 • 1t228 F b5 7-61 J W 0 C18-2-1I26BCC- 2 P WROCKLOFF 1965 H 251 • ,.. • "225 F 25 3-1>5 H w 0IH-2-1126CCA- I L R CAHOON 1962 J 3AA 3 3.3 • 4232 +15 0 15 10-62 H W 0
IB-2-1126CoA- 6 L AND J PICUS 1961 J 112 2 162 42""1 +10 0 10 9-61 H W 0I B-2-1126(.OA- 7 L PICUS 1961 J 225 2 21A 4242 +14 0 20 8-67 H W 0(B-2-1)26COO- 3 F THALMAN 1961 C 425 I' 225 4243 +4 0 2250 125 7-61 U u 7 tIA-2-1)26COO- It F THALMAN 1963 J 205 2 4243 T CCA-2-1)260AD- 1 V J PERRY 1961 H 200 • 1.0 4266 10 0 '0 10 1-61 W
(8-2-1 )260C8- 1 • E 8URNHAM ( 1935) 400 4 4245 F 120M 8-68 W16-2-1)27AOA- 4 " 8 KINGSTON L963 .98 • 4223 F '0 2-63 S W 018-2-1121000- It A THALMAN r885
j500 3 4230 +24 I 12-62 H 0 0
t B-2-1134AOA- 3 o HART 1896 210 2 423i A F 1-68 H WCB-2-1134AOO- 2 o M HUNTER 1886 '10 3 423i. F 7tM A-68 I 0
32
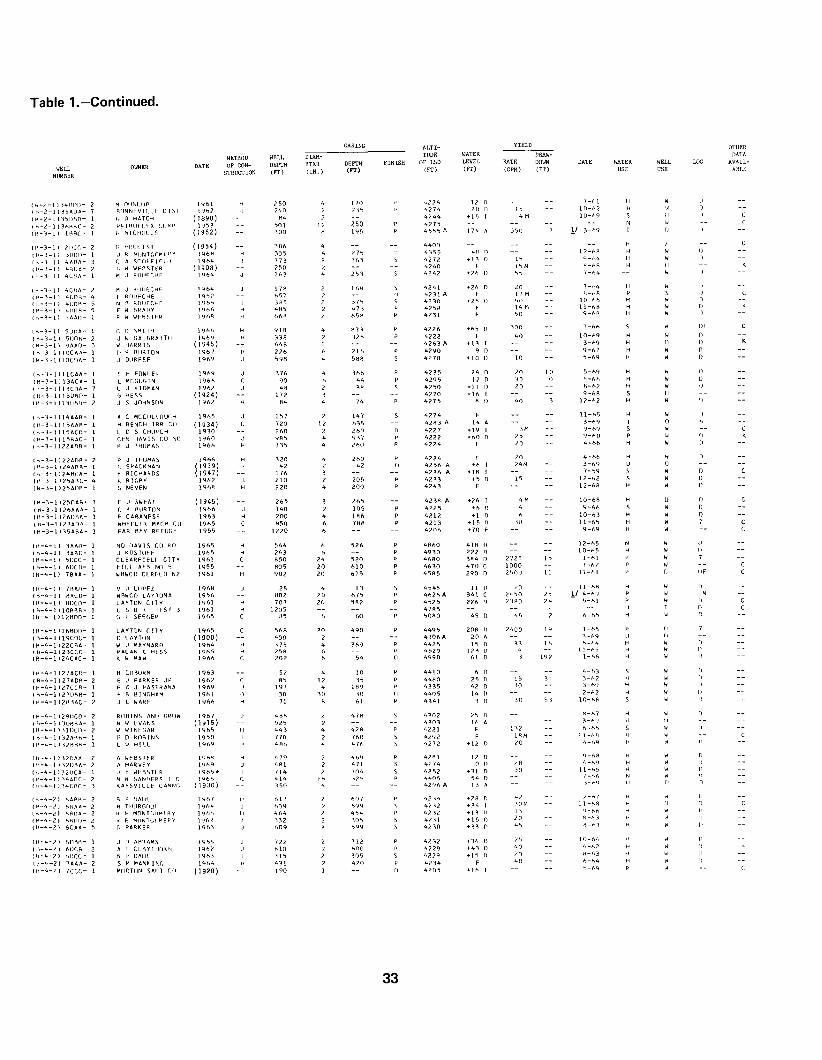
Table 1.-Continued.
CASING ALTI- YIELD OTHER
METHOD WELL DIAM- TUDE WATER DRAW- DATA
OWNER DATE OF CON- DEPTH ETER DEPTH FINISH OF LSD LEVEL RATE DOWN DATE WATER WELL LOG AVAIL-WELL (FT) (IN. ) (FT) (FT) (FT) (GPM) (FT) USE USE ABLE
NUMBERSTRUCTION
(1-\-2-1) i4f1[)I)- M ()IJNt.!lP 1961 250 4 170 42?A 17 n 7-01 H
1,",,-2-113~b,[)"'- P.[)NNF:VILLf' 01 ST 1967 240 ? lV' 4214 20 0 lC lO-f.Z H
(K-2-1) V'dlfH)- (; ° HATCH (1890 ) A4 ? 4244 +j; I 4M IO-fl9 ,( 1-'-2-1l3hRR(- PHRUFU-X C[]!<.p 1953 '01 1;.' 250 4275 N
(1'1-3-1 ) II'lRC- F NICH[lUS (1952 ) ~~oo A 1'15 4'l55 A 174 A j')O !I 3-69 I
(1\-3-1 ) 21)((- II Hrlll I Sl ( 1954) 3f\" 4 4400
( h-3-11 31JOn- .1 R MflNTGnlo'fPY 146R 305 4 2" 4355 40 1 ?-hR
(1<-3-1 J 4ARA- [ A scnFF, ELI) 1904 773 2 71,' 4272 +1 ~ I' 9-04
{1'-3-11 4HCA- (; W WFIlSH'R ( 1908) 250 2 4240 , I'M R-hR
(H-::l-l) 4C!lA- M J RlHIFCHF 1964 263 4 2" 4242 +2A 0 " (-04
(fi-1-1) 4CfIA- 2 M J RlllJf:CHf' 1YM 17A 16A S 4241 +20 n '0 7-1',4
ll-\-~-11 4{.n~- 4 L RrlUfCHE 19')? A57 <l 4231 A F '7 M f-I-hH
(1,-1-1 ) 4CQA- 5 N B R(lUECHE 19bh 3A5 375 S 4230 +2"\ n or, 10-hh
l ~-~-11 411[lP.- 5 F W fiRMlY 196h 4A5 4n , 47.'lf\ F 14 M 11-I'.A
(t,-3-1 ) ':>AAI)- 1 , W WFHSTF:-R 196f\ 668 h5A P 4231 , 50 9-6A
{"'-3-1 J ')IJl)A- r. Il SMITH 1 Y6h " "18 4 An 42?h +h5 0 300 7-hh S flF
( f'l-3-11 ":ilJnA- J w GAlI=!Rfo I TH 191'.9 H 33A ? 12" 4222 F 40 10-AQ H n
( H-3-11 9AAO- W HARR I S ( 1945) 648 2 4263 A +13 3-AC;1 H 0
{1"\-3-1110Cr.,,o',,- II K BIIR l(1N 1967 216 A 211'. 4290 9 q-A7 H Il
(H-~-1110CflA- J DliRFEF 1969 S98 4 5HH 4270 +'0 10 ~-1'.9 H 0
{11-3-1) 11CAA- , H FOWLER 19bY 376 4 31'.h 4235 24 0 20 10 5-'<'9
(fi-3-1 J 13ACA- L MCGlJG I N 196h 90 6 44 4295 " 0 :1Cl 0 R-An
11-l-3-1113cnA- L J K lOMAN 19h2 48 2 3' 4?'lO +11 Il 20 H-f,2
(11-1-1) 1:1DAI1- G HESS ( 1924) 172 3 4270 +lA I 9-hB
{fI-3-1113fJA!l- .J S JOHNSON 19h,? 84 4 74 427'5 A 0 40 12-h2
(1"\-:1-1) 14AAB- A C MCCIJunU(;H 1965 157 2 141 4?74 F 11-h5
1',-3-111 "AAB- H RENCH IAA Cf) ( 1934) 720 \2 hV:i 42f\3 A \4 3-1'>9
{11-3-1 J 15ACD- L 0 5 CHURCH 1930 760 2 260 4227 +19 3M 9-1'>9
(11-3-111 ')AAC- CoN IlAV I S [0 ')0 1960 'JR5 4 937 4222 +60 25 9-"'0
( f'\-3-1122Af)B- P J THOMAS 196'" 335 4 2"'0 4224 F 20 4-66
11-l-3-1122ADA- , J THOMAS 196h 320 2hO , 4224 F ;.00 4-hA H
IK-3-1)24Af~f\- (; SPACK,.,AN ( 1939) 42 42 (J 425h A +6 24M 3-1'.9 U
111-3-112 4 ACA- 1 F RICHARDS ( 1947) 116 4236 A +18 7-')9 S(t\-3-1125Af\C- 4 R R IGRY 1962 210 205 42~3 +5 " 12-h2 5
(1-1-3-1 )2')AIlA- 1 S NEVEN 19M1 220 200 4743 F 12-hf1 H
(1-I-3-1125flAR- J SWtAT ( 1945) 765 765 423R A +2'" 4M 10-68 0
( H-3-1126AAA- K fWRTON 1'166 \40 105 4225 +6 4 9-(.,6 W
(1-1-3-1 )?h[l"A- F CABANFSS 1963 700 186 4?l? +1 A 10-63 w(1-I-:~-II21A[ll\- WHEfLER MACH (,0 1965 A50 ?HA 4213 +15 'jg II-AS W
(1-1-1-1 )'l')Af',A- F'AR AAY RFFUf;t: 195~ 1720 420A +70 9-h9 W
(H-4-1) 3AAO- NO (lAVI S CO l{f) 1965 H 544 , 526 4R,.,O 41A 0 12-1'.5 N W
I H-4-11 3ARC- J KOS TUFF 196') H ?43 6 4930 222 " 10-"'5 H w( H-4-11 scec- CL EARF I E'LD CITY 19b1 C A50 24 520 4o')RO 3A4 0 2-."'2'1 " I-hI P W
( 11-4-11 6DC[)- HILL AF9 NO 5 1955 A05 20 610 4630 470 C 10DO 7-h2 p w(H-4-1) 7Bb,A- wAWCD CLRF-lO N7 1961 902 20 615 45f\5 290 0 2'">00 Ll 11-hl P 0 IIf
( K-4-11 7AA/J- v .1 lllPFl 19hR 2" 4 13 454A 11 70 ll-hA II
I f:\-4-11 AACD- ..,RweD LA YT UN"'" 1951'> 802 20 h7; 4h2'" A 341 24')0 20 11 4-h9 .IN
11-'\-4-11 8DCO- LAYTON CITy 1961 H 701 20 SA? 4525 2?h 7WO 24 ':I-hI II
I A-4-1110ARR- U S B R TES T 3 1961 H 1205 47R'5 0
(H-4-1)IZROO- r, p SF£r,ER 196'5 C 8S 00 50RO 45 0 45 A-A') "( 1-\-4-111hAOf)- LAYTON C lTY 19b5 56A 7O 490 4495 20A 2400 14 1-h') "( R-4-1119CDC- C LAYTON ( 1900) 400 2 430h A 20 3-h9 "111-4-1 )22CAA- w J MAyNARD 19h4 H 375 4 309 4425 15 -n 16 "'-h4 W
(Fi-4-1) 23CCC- MALAN r. Hf-SS 19b'l " 258 6 .. 520 \1' II-h5 W
II1-4-1124CAC- K W MAw 19M C 702 A 54 4990 hi 197 I-An w
IH-4-1127ACO- 1 crll'lURN 19b3 52 4 '0 4410 6 4-h3 S
(H-4-1127ADA- 2 J P ..... RKER J' 196? B5 12 35 44f!Cl 7S " 30 3-h2 H
(11-4-11 nCCR- \ " J I-'AS1RANA 1909 \97 4 189 4335 47 30 3-A9 "111-4-1 12W!')R- \ R B !NGHflM 1961 30 30 30 4405 14 2-A2 H
IH-4-112A3 ..... C- 2 L WARE 196n 71 A 6\ 4341 3 30 " 10-hfJ S
(fI-4-1129IlCO- ~nA INS ANll GROW 1967 4AI'l 478 4~O2 25 f-\-h-'
(ti-4-1) 30RPoA- w W fVANS (1915 ) 025 4301 lh :-\-h9
(~-4-1131IlCf)- w WI NE(;AR 19b5 443 47A 4221 F 132 A-,.,S
I ~-4-II32ARP;- P D RnR INS 1950 170 760 4292 , 'AM Il-f,F\
(f-I-4-1 )3?Ar~R- L w HILL 19,.,9 4Ah 470 4272 +12 0 10 '+-A9
11'1-4-1 )~2nflA- WEBSTER 191'>R H 419 2 46') 42R 1 12: 4-AA W
I H-4-113?fJRA- HARVFY 1969 J 4Al 7 471 4274 0 ,e 4-"'9 w(1\-4-1132DCA- 0 WFASTl-R 196')* .J 114 7 1Cl4 4252 +:'l1 30 I1-h~ W
I f"I-4-1) 34A1lC- N W SANDFRS I [ 1961'. C 414 16 37' 440') 54 -{-Ah W
/r;-4-1 )--\4[8(- KAYSVILLF CANNG ( 1930) 150 4 429h A 13 1-hY "( "-4-11 hAf!I-I- R P D.... HL 1'1,.,7 AI7 hfj7 4214 +?A rJ 47 ?-h-r
"{1-I-4-1 J hHAA- " THlJRGrtUll 1464 A09 <;99 4nZ +34 30M 11-hfl n( H-4-21 "'1'11) ..... - 2 R H MfmTr;IIME;'RY lybh 464 4'54 4212 +11 1-'\ y-f,f, Il
l f-I-4-21 hA(II)- 2 R F MflNTGllMFYY 19td 332 305 4231 +15 20 A-A) Il
{ 1-1-4-21 6CU- 5 C PARKER 1963 609 599 4230 +03 ., .'i-h3"
11\-4-21 h[\Rf-\- I J IJ AARAMS 19h4 722 "liZ 47,2 -oA " Ifj-h4 H
( fl-4-2l "'OeA- 2 A E CLt'lYTH(lRI\.J 19h? AlO 600 4229 +43 40 4-f,2 H
(k-4-2) I',IJCC- 1 A i' DAHL 19h3 315 305 4729 +15 70 f-I-f,3 H
( 1-<,-4-21 7AAA- 2 , p "'AN~tlNr, 1964 431 470 4214 F 40 "'-h4 H
(B-4-2 ) 7CCC- , MORTON SAt 1 en ( 1920) 190 420') +IA I "'-f,q P
33
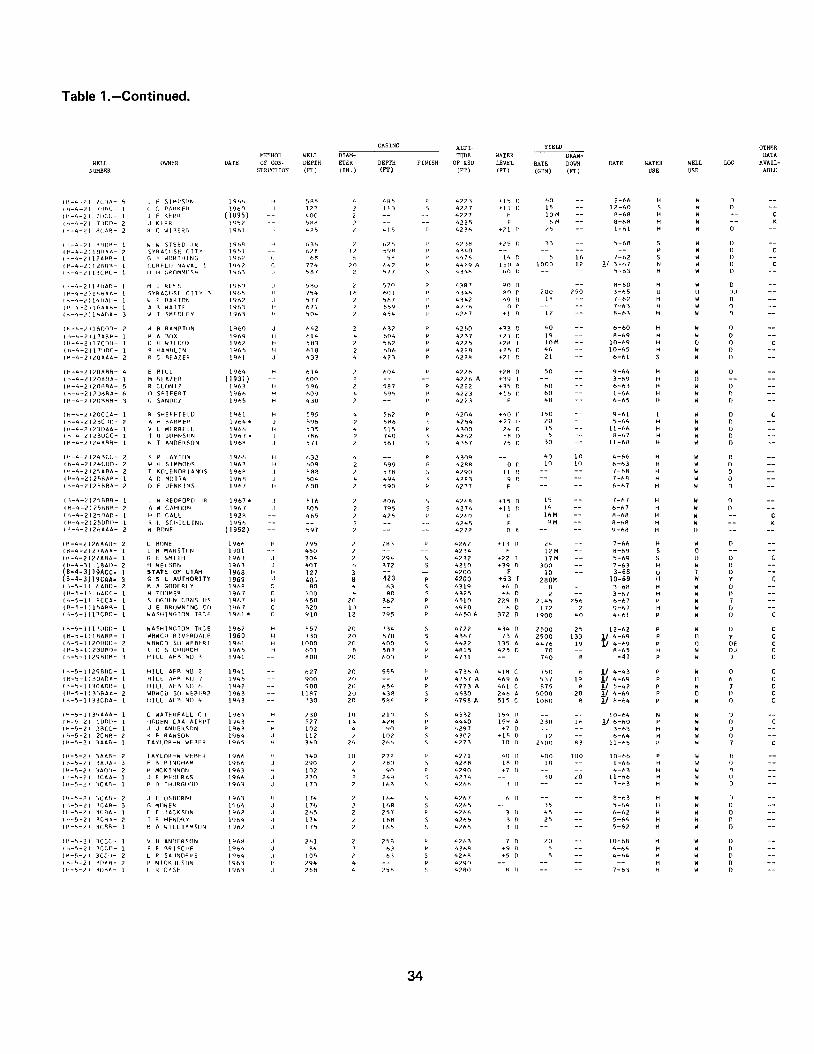
Table 1.-Continued.
CASING ALTI- YIELD OTHERMETHOD WELL DIAM- TUDE WATER DRAW~ DATA
WELL OWNER DATE OF CON- DEPTH EIER DEPTH FINISH OF LSD LEVEL RATE DOWN DATE WATER WELL I1lG AVAIL-NUMBER STRUCTION (FT) (IN. ) (FT) (FT) (FT) (GPM) (Ft) USE USE ABLE
( "1-4-2 J 7C[lA- F 51 MI-'SflJ'll 1901-, <.oR5 4H'l 4n·~ +l' hO 2-h6 H
(",,-4-2 ) fl}RC- C PA~K F~ 1960 l?1 I" 4727 + II I' 12-60 S
(f' -4-~ I 7I)cr.- E KERR ( 1895) 400 4227 F 10 M R-b8 H
(1-'>-4-2 l -r!lCf)- K ~RR 1452 ')1'18 4225 F oM 8-6A H
(H-4-2 ) RCII.P,- C WI HERr, 1961 425 415 423h +?1 Cl " I-hi H
(11-4-7 I RfJPR- W W STEE:D -'" I9nR h3h , f,ZA 471fl +?5 0 33 5-68 StK-4-21101IAfI- SYRA(IISF (ITY 1951 h2B \2 "9R 4~40 P(H-4-2) l?ARR- G F WfiRTHING 196? oR 0 ':if! 447f, 14 ; lh 7-62 S( t<-4-2112HP,P,- CLRF-Lil NAVAL \ 1947 774 70 047 44?9 A 150 1000 l? 11 3-h7 N
(1-<-4-2Jl:1CAC- " " {;~nMMr SH 1<H:d: SAl , ':>77 4,41'1 hO 5-63 H
(1-<-4-211 :1IlAn- M -' Rff:S 19hr) .1 ;RO , 570 43A7 90 H-60 H W 01f'.-4-l:'}14l:\6h- SYR6CUSF- CITY 3 1Y6"> H -'54 In 001 '+341'. '0 200 250 3-fl5 U (J 0.)
r "-4-2) 1'.1111.11- W E RAKTON t 9 .... 7 .) '77 2 '07 4342 49 lR 7-62 H w 0(tl-4-211 hJ\,A~- h " WA I TE 1'-11'.3 H 071 7 1'.54 4771'1 0 7-63 H w 0(fl-4-? 11hA[)A- w T SMfnLFy 19h3 H 504 7 4,4 421,7 +1 12 8-63 H w 0
(~,-4-211t',onrJ- " RAMPHJN 19M) 042 h':\? 421)0 +':\3 40 6-hO H W 0(1~-4-2) 17Af\R- h RDX 191'.9 hl4 004 4237 +?l 19 8-h9 H W 0(11-4-2117CDU- II W'LCOX 196? 5A3 51'.7 4275 +2' 10M 10-h9 H (j 0( fl-4-2117IHK- HAMRL I N 196"l 01" hOh 42?~ +25 40 10-f)5 H w 0(1-1-4-2 Jl.OA!lA- C REAlH 19td 433 473 4??R +71 21 6-61 S w 0
(j-<-4-2120ARR- RILL 1964 hl4 004 472h +2' SO 9-64 Ht r<-4-2120ADA- RFA1ER (1931 ) bOO 4226 A +39 3-h9 H11-I-4-2120ARA- CLrJNTl 1963 S9b 587 4222 +3"i 00 6-63 H(t\-4-21 ?O~AA- SF-I FERT 1961'. hQ9 ":>9') 4?23 +15 00 1-60 Hl J-I-4-2 120RAR- r, SANfHll 19b5 430 4223 f 48 6-65 H
(1-1-4-;.' 120CCA- SHEFFfEUl 1961 '95 56? 4204 +40 150 9-61 I(1-I-4-21230m- H RARAE~ 1964 * 0:,96 586 4254 +77 20 5-64 HI K-4-2123DAA- l MERRELL lY61'> 535 515 4300 74 IS ll-b6 H(1-1-4-2) 23DCC- 0 ,J(1HNsrlN 1967 .. 7A6 740 421'>2 +R S A-67 Hll-l-4-2124ARA- T ANOERSON lYbR 571 S61 4~57 7' 30 I1-h8 H
(1-<-4-2124RCC- P LAYTON 19M 632 4 4309 40 10 4-66 H Dt li-4-2124CnO- H SIMMONS 1963 h09 2 '99 42RR 0 10 \0 h-h3 H 0(\-1-4-2) 25ARA- KOLENDR I ANOS 196R <jAA 2 578 4290 11 7-bfl H 011-<-4-212'iRAP'- 0 MOTTA 196R ">04 4 4~4 42A3 9 7-68 H 0(1-1-4-2 I 2 "i!-\AA- E JENKI'-IS 1967 hOO 2 590 4777 F h-h1 H 0
(i-"\-4-;.'J2'iRR~- .1 W ~EDFOPD .1. 1967 * Al6 AOo 42 .... A +15 15 7-h7 Hl t'I-4-2 I 75Kfl,fl,- h W CAHOON 1967 R05 Fl5 4274 +1 \ 14 6-h7 H11-I-4-212')nA[)- H 0 CAll 192H 405 425 421i0 F 10M R-hR H( 1-1-4-212<ionp- • L SCH!LLIN(, 195h 424') F 9M 8-hA H( H-4-212hAAtl- W AONF ( 1952) ;97 4277 0 h 9-hR H
( H-4-212hAAO- l RnNE 196f, 795 2 7fi::l 47.h2 +11 0 24 7-66 H W(1"\-4-2127AAA- l " MARSTfIN 1901 450 2 4234 F 12M A-69 S (l
Itl-4-2Jt:'7AAA.- r, E SM I TH 19h3 ,I 304 2 294 4232 +72 17 M 5-b9 S II D(1-1-4-3 ) IBAf)- H NELSON 1963 .) 407 0 377 4210 +39 30n 7-63 H W 0(B-4- 3 l19ACC- STATE OF UTAH 196B H 127 3 4200 F 10 3-68 u 7 D(B-4-3 19CAA- G s l AUTHOR I TY 1969 H 481 8 423 4200 +53 I 280M 10-69 H w y111-')-11 hARD- M A GODFRrY 19M1 C "0 4 h3 4319 +0 0 R 3-6A H W D(1-1-5-1 ) hACC- M TOOMER 1967 C lOa 4 RO 4325 +0 D 2 3-h7 H w IlI 1i-5-11 RCCA- S (J(;OEN CUNS liS 1967 H 450 70 362 4510 229 0 2145 756 h-f,7 P w 7( R-5-1115AAll,- .) E ElRfJWN I NG r::O 14h7 C 120 III 49AO 0 0 172 2 9-1)7 H w (l
(1-I-5-1117CRC- WASHINGTON TRr.E 1961 * C 910 12 795 4050 to. 372 0 1900 40 4-01 P w 0
I fl-5-1 '1 7!l[)[)- WASHINr,TOf'1 TRCE 1967 '57 20 134 4722 4,4 2500 7' 12-62 011:\-')-111 AARA- 1oI1l,"'CD R I VfRDALE 1960 730 20 070 43h7 73 2500 133 11 4-h9 Y(f',-5-1120Don- WAWCD SU WEBER 1 1961 11100 20 400 4422 135 4476 19 11 4-(.,9 DE(1-1-5-1) 23DRf)- '- 0 , CHURCH 19h5 1>01 A '" 4R15 42S 70 R-h5 0.)(11-5-1IZ9IWA- HI LL AFR '0 3 1941 ROO 20 000 4731 740 -41 "Ik-5-11Z9IHlC- HILL AFfI. '"
, 1941 027 20 555 473fJ A 41A 750 0 11 4-43 0IH-5-1 )30AOA- HILL "" '-if) -, 1945 900 20 4757 A 409 '),7 19 1/ 4-69 0(1-\-')-1 ) ~OAnn- HILL hFA NO h 1947 900 20 ",4 4773 A 401 R75 A 1/ 5c-42 7(1-I-5-1133f\AA- WBWCD S(1 IoJf:RFf.l.? 1963 11A7 2(J 43A 4')30 246 5000 20 1/ 4-69 IlIk-5-1133CflA- HILL AFA NO 4 F-:l43 730 20 5A4 4798 A 515 10HO R 1/ fl-/14 0
( f.l-5-113 ... AAA- C wAHRFALL (II 1964 730 10 210 4,)~2 154 10-(.,4 W11"1-">-21 1 [)f)[)- OGDEN (hA AI kPT 1943 5n 14 47A 4440 IS~ 2:30 10 !I 6-60 W{1-1-')-21 2RCC- .I .) AN()FI~';f1N 1963 102 4 90 4297 +7 3-h3 WI H-5-2) 2CAfI- K f RAWSON 1464 112 2 107 4302 +lS 12 6-h4 W(f~-')-2 ) 3AAA- T AYLOI-l.-W WERFR 196') 340 24 261'> 4273 10 2400 R3 II-hI) W
(1-\-5-2 ) 3AAR- T AYLOR-W WERfl{ 1961'. 340 10 277 4271 40 400 \ 00 10-66 0( ~-1)-21 -:SAnA- F A A INf;H.A~ l':1hh 290 7 7HO 42A8 IR 10 1-66 0(1-1-')-2 ) 'HOll- e MCKINNON 1963 102 4 90 4290 +7 4-h3 "(I-'-~-" I KAA- .) E MHllJRA!'i 1966 770 7 749 4274 30 20 I1-h6 "(I'-"',-L I 1CAR- P 0 THlJRGnOn !963 17:3 2 163 421,A , 0 7-h3 0
(1-\-')-1 ) 3LJ\R- .) E oSBORNE 1963 174 lh4 47.h7 h [] A-(.,3 H w 0(H-~-21 3CA~- r, MllWEI{ 1964 176 \he 4265 35 5-64 H W 0(1->-')-2 ) 3CRA- f f JACKSflN lYh? 205 25-' 42(.,6 4S 6-62 H w 0I f<-5-l) 3CRA- T • HfNDR Y 1964 174 lOR 42h5 2' 5-h4 H W 0I f~-"l-2 I "KAA- 8 A WILL I AMSllN 196? 175 I", 4?"(., 5-62 H W 0
(1-1-')-2 J 3CCC- ANIlf:RSON 146H ?hI 753 42h3 7 20 10-hA H 0( 1"\-')-21 -iCCO- RR 1 ';CIIF 1964 R4 t,3 41hR +9 , 4-t,4 H "( ",-"i-II 3CCll- " SAl/NOFR S 1964 105 h1 421'>A +' 5 4-64 H 0(f<.-':>-2 J :~rl~ ~- 2 N TCKIJLSIIf\J 1963 294 4?yn H []
(f--r.,-? ) 311AA- \ R C,\51' 1463 ?oA 758 4?AO R 0 7-63 H 0
34

Table 1.-Continued.
CASING ALTI- YIELD OTHER
METHOD WELL DIAM- TUDE WATER DRAW~ DATA
WELL OWNER DATE OF CON- DEPTH ETER DEPTH FINISH OF LSD LEVEL RATE DOWN DATE WATER WELL LOG AVAIL-
NUMBER STRUCTION (FT) (IN. ) (FT) (FT) (IT) (GPM) (FT) USE USE ABLE
( 1:\-5-21 30BB- 1 C CAMPBFlL 1962 213 2 26~ P 4275 60 6-62 H W
18-5-2 ) 4(00- 2 D S CHURCH 1962 290 4 250 P 4257 100 7-62 H W
( A-5-21 4DDC- 4 GENE TT I 1967 259 ? 249 S 4263 H W
(8-5-2 ) 5AAA- 2 FAVERO 1965 272 2 253 S 4253 ., 5-h5 H W
(H-5-2 I 5ACR- 2 C HAWKES 914 2 S 4250 +22 30 M 8-hH H W
,H-5-2 ) SACC- I J W PETERSON 1960 b20 blO 4249 +30 n 35 4-60 H
I B-5-2' 5ADD- 2 H W GREEN 1955 424R F 16M 8-flR H
111-5-2 , 6.&.00- 3 ENGLAND BlO SlJP 1965 b53 643 4232 +2 ~i 40 9-65 H
11:\-5-2 ) 6BOO- 1 J V STooDARD 1942 304 213 4222 A '14 )-flB H
111-5-21 6BOO- 3 J V STODDARD 1944 609 4221 '26 25M B-h8 H
I A-S-2 I 6BOO- 4 J STODDARD 1944 303 3 4220 ,'6 70 M 8-68 I 0
I B-5-2 J 6CAC- 3 L HOWElL 1960 362 2 352 4217 '16 ;0 6-60 H W
tR-S-21 6CCR- 1 R E AVI S 1963 360 2 350 4219 +23 0 30 10-63 H W
( B-0;-21 bece- 1 B W LAMB 19M· 370 2 360 4220 +20 0 35 11-64 H W
(8-5-2 , 6COO- 3 o C BAILEy 1960 605 2 595 4230 +30 n 50 9-60 H W
( B-5-21 7AAA- R F RAWSON 1965 J 206 4 196 4245 , 0 8-65 H 0
( 8-5-21 7(04- C H HOOPER 1962 H 240 16 96 4241 ,1 0 7-62 I 0
I ~-5-21 1DAA- L J PENMAN 1966 H 693 2 681 4241 F 36 12-66 H 0
18-5-2 ) 10A8- E PENMAN 1968 J 1005 2 995 4246 '24 I 17M A-b8 H 0 C
11-\-5-21 7DCB- F FOWERS ( 1945) 688 2 4240 A F bM 9-68 H 0 C
IB-5-21 7008- 5 B JEx 1961 59B 5B8 4236 ,27 0 25 12-61 H W 0
18-5-21 BBRB- 2 HARTMAN 1966 693 b83 4247 F 40 6-hb H W 0
f 8-5-21 8BCB- 2 W L PETERSON 1962 659 649 4247 ." I) 4-h2 H W I)
18-5-21 9AAD- 1 R WOOD 1965 200 lQO 4263 20 0 12-65 H W I)
18-5-21 98AA- 2 L MAYBERRY 1942 546 4259 A .5 I 3-69 I 0 0
C8-5-21 9BBA- 4 J F GUTIERREZ 1963 251 241 4251 5 7-63 H I)
18-5-21 9CAC- I H A PETERSEN 1960· ;94 584 4249 '25 35 10-60 H 0
I ~-5-2) 108AO- 3 W E SlATE~ 1960 118 lOb 42914 .8 B 4-60 H 0
18-5-211 aCAA- 1 W S PARKER 1968 120 105 430R ,5 3 9-"'8 H 0
11"-5-2 J10C.6A- 2 H G CHRISTENSEN 1969 105 B4 430A .4 5 6-flq H 0
I A-5-2110CAA- G opp 1969 126 2 105 4305 ,4 3 6-69 H W [)
I ~-5-2' 100l~C- V PETERSON (1946 ) 120 2 4312 '2 10 11-54 S W D
18-5-211200A- K A ALLEN 1964 H 275 4 90 p 4410 35 0 20 25 3-64 H W 0
(B-5-Zf4BDC- ROY CITY 1965 H 1004 16 953 S 4228 228 0 1550 290 8-65 r W 0
1B-5-2 15BAC- B W HART 1964 H 42 2 32 P 4310 4 0 9·64 s W 0
B-5-2 15BBA- E CARNEY 1967 H 110 4 98 P 4305 F 4 4·67 H W 0IB-S-2115B8C- J 0 SOOENKAMP 1966 H 93 2 83 p 42A 1 .2 b 9-66 H W [)
18-5-21158CB- C F WARD 1960 J 104 2 97 P 429A ,11 2 6-60 H W [)
18-5-21158CC- G FAVERO 1960 J 354 2 344 P 4299 '16 25 7-1\0 H W [)
I B-5-2115000- 1 F E CALL 1963 H 152 4 105 P 4396 H W [)
1H-5-2 I 15000- 2 J R HAM8ELEN 1963 H 278 b 255 P 4394 80 D 30 58 4-63 I W D
I B-S-2116AAO- 3 w E SLATER 1962 B3 2 72 42A3 '11 0 8 11-62 S W 0
IB-S-2'16AAO- 4 P OBIN 1965 90 2 79 42A6 +10 0 3 11-6S H W n1B-S-2116CAA- Z C J MANNING 1962 716 2 706 4264 ,27 [) 45 4-h2 H W 018-5-2)160CO- 1 USB R NO 5A ( 1955) 810 6 42A6 A 5 • 3-69 U [) 018-5-2)1600A- 2 HOOPER IMPOIS 1968 807 16 247 4291\ 20 [) 6-bA P W 7
I B-5-ZI11AAD- 1 L W KASTING 1965 121 III S 4246 .8 12 1-65 H [)
16-5-2111UD- Z T E DICKAMORE 1965 I1b 106 S 4247 ,9 18 A-65 H [)
18-5-2117ABA- I 8 H OLSON 1966 773 763 p 4246 F 16 6-66 H 01R-5-2117AI\C- 2 • J FOWERS 1964 656 646 S 4246 ,25 40 1-64 H 016-5-2117AOO- 3 W J VENSTRA 1967 117 107 S 4245 .7 18 9-67 H D
18-5-21171UO- 1 R V PONTIlJS 1964 705 2 695 4246 +23 0 45 7-64 H W [)
18-5-2117BAR- 1 R & R MAR IGON) 1969 335 2 325 4238 'b 0 12 6-69 H W 018-5-21178C8- 3 L TODD 1960 636 2 626 4240 '33 0 45 6-60 H W 018-5-2) 17CCA- 2 T H SI-MPsnN 1962 596 2 586 4242 ,27 I) 40 11-62 H W D18-5-2117CoA- 1 V l COOK 1962 257 2 235 4242 '10 0 20 9-62 H W 0
(B-5-211RAB8- 2 S C.... ENEY 1966 508 498 4237 F lQ 3-66 H [)
18-5-2 H8ADA- 2 F HANCOCK 1963 706 b96 42311 +29 0 7-h3 H 01H-5-2 118AOO- 4 ZI NIE 1966 484 474 4241 F 14 5-66 H 0IB-S-2118BAA- 1 E AVI S 1963 619 609 4238 ,25 45 3-63 H [)
1B-S-2118CCA- I J ClINN I NG TON 1962 570 560 4240 .25 25 4-62 H [)
Its-S-211BCCA- T N RICHINS 19b5 324 4 312 S 4]40 .7 n 15 9-65 H W 0(B-5-2) 1RCCC- e G PAAKER 1965 545 2 535 S 4239 "8 0 30 9-65 H W 01A-S-2) I RCOA- J T MARTIN JR 19M 651 2 641 P 4241 '31 0 45 3-h1 H W n4 A-5-2 I 1 BOCB- FORO FINANCE CO 1965 336 2 326 S 4241 ,5 0 10 9-6S H W 0I R-S-2) IBDOA- L T CHR I STENSEN 1960 604 2 594 P 4242 .30 [) 35 lO-hO H W [)
C£'\-5-2119008- E R KENDRICK lQ60 175 165 423,<, '15 IS 12-bO H I)
I B-S-2) 190DC- T J WATKINS 1964 675 b65 4236 +28 40 10-64 H 0
1B-5-2 )20RCC- 1 T B AUSTIN 19b4 343 333 4235 .3 16 9-1.4 S 0
I B-5-2121 AOO- 4 D P SHlOOARD lQbO 74 63 4302 ,11 8 9-60 H I)
18-S-212180C- I N L REDFORD 1964 550 540 42112 .5 8-64 H [)
IH-S-21210CD- M C STEWART 1962 85 2 73 4304 '18 20 11-62 H W
I B-5-2 t 21000- G E BEllS (1931) 110 2 110 n 4317 ,10 12 M ll-f'lfl I 0If:1-5-2122AAR- A CHILD 1960 104 2 93 P 4370 .3 3 6-60 H W I)
CB-S-11228AR- L RODGERS 196R 116 4 108 P 4328 F 2 5-68 H W n(B-S-2122BRA- o PEACOCK 1961 101 2 91 S 4320 ,7 0 12-hl H W n
I R-5-2 J228BA- CHRISTENSEN 1967 249 4 235 4320 21 [) 6-62 H W
(B-S-2121RAA- STANGER 1966 120 4 110 4319 F 5M 10-6fl H W
I R-5-2122DOO- F PATTERSON 1961 850 16 810 4395 90 2400 ;0 7-61 [ W
1B-S-2 llbDAA- SUNSET CITY 1962 H 920 Ib 880 4543 250 DOD 70 7-62 P W
(fl,-S-21280RA- a NIELSON 1966 H 93 2 4319 '12 1-h6 I W
35

Table 1.-Continued.
CASING ALTI- YIELD OTHERMETHOD WELL DlAM- TlIDE WATER DRAW- DATA
WELL OWNER DATE OF CON- DEPTH ~:TER DEPTH FINISH OF LSD LEVEL RATE DOWN DATE WATER WELL LOG AVAIL-
NUMBER STRUCTION (Fr) (IN o )(Pr) (FT) (FT) (GPM) (Fr) USE USE ABLE
(1-1-':>-2 J29ACA- FLJ NDf:'R 196h " " 42!'lA _5 n 1 q-Ml S 0l 1-'-">-2) 24CCrJ- FLINT 1961 70h h90 4265 F 103 11-61 H 0! 1-\-'1-2) 30~AD- V IW5S 19l::d 7h 66 4235 F 20 4-63 S 0I H-':>-21 :-SOU\l~,- p R I N(,HhM 1963 609 044 4235 +36 220 11-63 S 0(f-\-0,-21 '11 AIIh- M HlJNT 191->'\ OR" 42b') ''0 :-so 9-63 H 0
(I-I-Ij-213IACf\- .J M(]~AN lYhh 220 200 4236 " n 2 1-66 H 0(h-"-21:iIACC- IJ J EkR 1(;11 19fd 733 7?1 4237 +37 n 50 S-n3 H 0lt1-5-('IHRC(- J L R!-:NKy 1967 5R4 ,)J4 4227 F 10-67 H 0lH-')-2131CA(1- • T I-IINGHAM 1964. N~5 tdR 4236 +30 200 A-fib S 011-I-')-2)31LC(- ·C UAHL 19h7 h93 hR3 4226 +32 4R 7-h7 H 0
(i-I-S-ZI31cnA- • M JOHNS TUN 1962 J 003 ,)9~ 4235 +36 45 11-62 H W(fi-,)-I 131(OD- r. DAHL 19/11 J 6lb b06 42V'i _79 40 6-(:,7 H W(11-"'-2131IlAA- " FfNN 1967 H 349 338 4236 F 10-67 H W(11-5-21310RC- • L FENN 196R H 59R 5RR 4236 _IR 0 32 1-68 H W(f-I-5-21311H'\(- , MflREN(I 196R H 325 313 4236 F 11 6-68 H W
Ik-')-lI31fJCA- H , DRAPER 1966 626 7 bIb 423b +23 42 b-6b H W 0(H-')-21310[C- R W CARHR 1467 019 7 hDQ 4235 _71 20 6-67 H W 0lti-S-?131DCC- R L CLEI'lENTS 196R 630 2 b20 4236 +20 30 6-b8 H W 0I l'I-';-2) 32IHl[)- WES T VOl NT TOWN 19')') R71 12 rS') 4315 20 950 40 12-55 P w 0( 1'-')-2 I 'BDOC- wEST POINT TflWN ( 1934) ROR 17 4343 A 70 3-69 P 0 0
I t'o-s-2 I :14(;CD- WEST POINT TOWN 1960 R65 16 R02 4312 RO 1400 .- 11-60 0I l:<o-'5-2134COC- C MENnENHALL 1967 2R2 4 273 4376 100 4-61 0(H-s-2) 368(C- WAWCO CLRFLO '1 1961 995 20 910 4566 2R3 3-69 DEI H-".o-3) 1 lOAD- H J BYINGTON 196h * 525 2 515 4220 -" 4M 5-69 Hf H-S-3 I 12BOD- T S lllWF 196] * 3" 2 363 4223 -17 30 10-b3 H
( 1-\-')-311211011.- JOHN M RELNAP 1963 ,83 573 4235 +21 40 2-63 H w 0(11-5-3) 13ADA- r, L I'll TCHI-LL 1961 375 33fl 4236 +R 45 9-61 S w 0( 1-1-')-3 I I-H\CA- 0 TREASE 196R 062 052 4230 +23 " 10-6B H W 0(1-\-')-3 I 13AOR- 1 C n PAULSEN 1961 723 21n 4232 0 '1-61 M W 0(H-,)-·3113(AA- 3 M ,I RfJPELATO 1960 .. 727 717 47~4 +21 30 1-60 H W 0
( 1:\-'j-3113CAA- 4 L GARNER 1964 hOO 2 590 4233 +17 22 10-64 H 0I ~-5-:i 113CCA- 4 L JUNES 1961 707 4 697 473fl +29 29 5-1)1 H 0( 1-\-'5-3113CIJA- 4 J RnRINSON 1961 h09 2 599 4231 _21 35 4-61 H 0( H-5-3113COP.- 1 M R(lR I NSIIN 1961 569 2 559 4236 _17 35 6-63 H 0( H-';-3113CI10- 3 L RUMSEv 1901 701 2 697 4236 -" 35 6-t.2 H 0
( !-\-')-:1) 131)AO- W W RDEHMF 1qbO 320 310 4240 + 7 n 10 10-60 H W 0I H-')-3113DCR- 0 • Gl1R~IER 1964 560 550 423'" _10 0 15 9-67 H w 0(8-')-:1) DODA- R SIMMONS 1963 715 70' 4239 _23 0 30 6-63 H W 011'l-5-3113DOR- C T KIl T5 1464 RR7 863 4239 _30 n 40 7-64 H " 011-l-':i-.:S1130nc- • HI PWELL ( 1919) 615 595 4743 A +12 1 4M q-6R H 0 0
11:\-5-3113DDD- TREASE 19f:11 707 697 4239 _29 29 4-61 H w 0( 1-I-')-3114/1C/I- 0 F(]WFRS 1962 580 570 4228 _7R 50 4-n2 H W 0ll-\-5-~) 14RAII- V W MOORE 1962 480 470 4222 +21 40 4-62 ~ w 0I tI-5-3114AOfo- S .I MOORE 196? 329 319 4221 +15 20 4-62 H W 0(1:\-5-'1114AOA- V W M(JORE: 19i12 330 320 422h _17 25 4-62 S w 0
I H-IJ- :11 14CDI1- HUNTER 1963 030 620 4231 -29 50 3-63 H w 0( t-\-5-3114DOA- NhlSBlTT 19f1l 228 205 4232 2 60 9-61 S w 011-\-5-3115AAA- fJARKEIol 1962 057 647 4216 F 40 4-62 H W 01f'-,)-3 )1"iIH),",,- RHEAO (1935 ) '49 4234 A +21 1 26M "-69 H (J n
( 1-I-'j-31/4,ARA- , JACKS(JN 196"> 302 290 4231 +5 5 10-65 HI f1-':l-3I 24ARFI- M PAGE 1963 H4 754 4235 -" 40 9-63 H(1-I-5-3124AAC- R FREW 11,16·1 009 597 4234 -" 6-63 HI H-':>-3) <'4ACP.- C HIGLEY 1962 iT3 4234 F 12-62 S11:!-1i-31?4AOA- W ANOf-RSON 1962 5R2 572 4237 +19 0 2'5 A-62 H
(t-\-'::i-3124AllC- WilliAMSON 1965 320 310 4234 +7 H 4-65 H 0IH-5-3124AAA- M ClJTTLE 1960 640 630 4235 +24 40 6-60 H 0(H-')-'3124Cf1()- L AENtJETT 1960 653 h23 4230 +36 " 7-60 H 0f I-I-')-j 12,Anc- J J FREW 1964 hlh 60h 4226 +21 5-69 H 0(~\-,)-3)2'::inCIl- UNKNOWN (1902 ) 520 4220 -)7 lLM 5-69 I
1K-')-"j )2'::illDU- 0 J KIRKMAN 19h3 326 789 4221 F 27 "-63 HI H-'j-313hADA- M E STfJOO/lRD ( 1934) 460 3" 4227 A _15 1 hOM 9-hR H(11-')-1) 3hADC- H W STUDDARD 1963 019 0;94 4225 _40 0 75 11-63 HI H-5-313/JAflD- ° S FtlRlJ 196? 519 509 4227 +34 " " 5-62 H( H-<;-:313hA[1f)- H W STODDARD 1966 ?Ib 200 -'+226 +10 0 20 9-66 1
(K-I)- 313h(JA[)- C W STOOOARD 19b3 7R5 614 4226 Hh 1 200M 5-h9 H( 1'\-'::i-313,<,llllfl- , H ROSS 1'164 303 293 4723 F 22 4-b4 H(fj-5-~ 121 80(- .I D R fCHAROS 1965 250 lOn 4220 +76 n 200 2D 1-115 S(K-5-4121CAH- H RICHARDS ( 1928) 140 140 4230 F 2 11-64 S(H-'::i-41?ICAf-I- H RICHARDS 1961 172 4230 F 2 11-64 S
II'-h-11 4AllA- • M GARNER ( 1900) 69 2 4441 A +11 I'jM 3-M S n CI k-h-l1 4I-1RO- WAWCO "I lIGOFN 1961 lIB " 702 43,<,2 " 7,0 '0 8-h8 P 0 0 C( f<-f.-l1 '::i(11R- H H PARKE!I 1961', 1000 12 330 430fl R 400M R-hB 1 W OE Ct l'\-h-l1 hAAR- R H TRACY 196'S ')40 2 530 4300 + 15 75 5-65 H W 0I ~\-II- 1 ) h(llA- M HAI{R I S (1909 ) 040 7 4290 A +29 3-69 H n
P-<-h-l) "'1')/\/1- M JENSEN 1961 763 2 2"D S 430Fl R 25 7-bl H 0(I-'-h-l ) hOAI1- M r,nflCH 1964 033 7 h21 n 4302 +32 ':J5 1-64 H °(1'-6-1 ) lUAfl- MFDINA 196') 408 2 39" S 421'12 -" 4'M 10-68 H 0( H-h-ll HHllA- I{IISSELL 1963 61 4 21 P 4300 lh 20 12-"'3 H 0(K-I'->-l) IhfJflC- IMN(F 19hQ 45R 2 44" S 4445 +h 40 5-60 H 0
36
Table 1.-Continued.
CASING ALTI- YIELD mHER
METHOD WELL DIAM- TUDE WATER DRAW~ DATA
WELL OWNER DATE OF CON- DEPTH ETER DEPTH FINISH OF LSD LEVEL RATE DOWN DATE WATER WELL LOG AVAIL-
NUMBER STRUCTION (FT) (IN.) (PT) (FT) (FT) (GFM) (FT) USE USE ABLE
(R-6-1120BCO- W T PI EIl:CF- 19&5 126 4 100 4279 +1 , 30 3-6'; W
Itl-6-1129(P,P,- lJTAH HY PRUDUCT 1960 A42 A ADO 4i'AO +'0 300 12-hO W
(1:\-6-} )30BOO- E E JONES 1968 145 4 115 42R2 F I-hfl W
(1:1-6-1) 3QCCA- CAL IF PACI< CORP ( 1929) 731 10 224 431h A 31 1>00 1/ 2-f,9 (J
11:I-6-1)358(R- (J P RAILROAD 1965 520 12 395 4A61 339 900 11 2-h5 W
111-6-11351\((- U P RAIlRflAD 1965 C 510 12 ,:\,,(> 4f\f,5 343 ,"0 37 2-65
( 1:l-6-21 lACO- RONA VISTA WTRD 1963 H 1002 li> A15 4276 +2A 14':>0 197 9-"3
IH-6-21 1 BAA- J 0 BROWN ( 1941) J 617 2 4277 A +14 3-h9
(H-6-2 I ZACA- H 0 WHITE 1964 J 193 , 172 4243 '" 6 R-f>4
I H-6-2) 4BOO- G R MOSS 1965 J 294 2 273 4'?2h +11> 20 10-h5
lli-b-21 4CRA- 1 W 5 FREESTONf 1962 B4 " 4225 +14 D 4 4-"2 5 " 0
I H-6-2 I '>6,CR- 2 T KN 1GHT (1951 ) B50 795 4240 A +li> 1 12M 9-68 H [J 0
(1-1-6-21 ')AC[)- 1 E M COOK }965 323 303 4232 +10 '0 3 4-h5 H " 0
I EI-6-21 flRRR- 5 L W SKHN 1960 354 4217 +IA 0 25 "J-60 H W 0
(R-6-2 I 6RCR- 2 • 0 EAST 1960 350 340 4219 +5 0 13 A-flO H W 0
f H-h-21 flCAO- 3 K HOGGE 1966 777 735 421 ~ +10 0 10 4-flh 0
I R-6-2) 6[)RR- 2" R
WADE 1961 360 350 4219 +11 0 11 ';-61 0
f K-6-2 t 7BBD- 3 F EAST 1961 560 550 4225 +5 0 6 6-hl 0
( (-\-6-21 "lRCR- 3 • PALL Y 1964 504 4A4 421H +7 D 10 6-64 0
(H-6-2110CoA- 1 L J DERO 1964 147 126 422S +10 0 12 6-h4 0
(1-\-6-2) 10D60- M o HALVERSON 196A 2lA 2 200 42':\0 +A 0 3 2-6A H W
I b-6-211106.0- J WHEELER ( 1924) 2B5 2 775 4242 A +IA 1 8M 3-h9 S "(tl-6-ZI12AAC- H E BnWNS 1962 242 2 228 4241 +19 0 30 h-h2 S w
II1-6-Z112AAO- R S WOOD 1960 232 2 222 4240 +22 0 40 11-60 H W
lH-6-2112ABB- W A STOCKDALE 1963 336 4 313 4238 +21 0 150 ~-h3 5 W
( 11-6-2114CCC- 0 R TUBAS 1962 2BB 21>7 4235 +IA 0 10 4-62 H n
I P>-b-211bAAC- o E CHARL TON 19bO 424 414 4Z32 +21 D 30 7-hO H [)
IK-6-ZI16AAC- HIPWEll 1961 430 420 4232 +71 0 35 4-61 H [)
( A-6-2116CC6.- H MCLEAN 1960 30B 29A 4235 +7 0 15 II-flO H 0
111-6-2116COO- ADAMS JR 1963 322 312 4235 +9 0 15 12-63 H 0
I H-6-2) 160AR- l 8 VENSTRA 1964 344 334 4230 +14 25 7-fl4 H 0
( A-6-2 11 bOOO- G FARR 1963 222 212 4230 +10 20 5-63 H [)
(11-6-2111ABC- 3 l R HANCOCK 1961 692 i>A2 423A +21 25 5-63 H 0
I B-6-2117ACA- 4 COFFMAN-PENMAN 19b1 871 A61 4231 +32 35 3-hl H D
18-6-2117A.00- 2 • BORALHE 19b4 504 494 4230 +22 30 4-64 H 0
I H-b-2 11 1(AO- 3 • R BLANCH 19b2. ,,0 540 4234 +9 15 5-1,2 H W D
(H-b-Z II 7CAO- 4 A BLANCH 19b3 430 420 4234 +11 lA 6-63 H W 0
I l1-b-2) 19A.A.0- 3 • C HESLOP 1964 507 497 423~ +14 20 4-(,4 H W 0
I H-b-2 t 190CR- 1 R J WIGHT 19b9 539 525 4211 +25 00 h-h9 H W 0
IA-b-2120ACO- 4 A OEGIORGtO 1960 666 !>SI> 4237 +79 ~-hO H W 0
II'\-b-2120BBO- RAUZ I 1961 525 515 4235 +15 15 5-hl H w1f\-6-2120CDO- SEGNA 1959 540 530 4225 ":21 4M 11-h8 H [}
I H-6-2121ACA- SURRAGE 19b2 329 30A 4239 F 19 5-62 , W
I A-6-2 1216,00- SURRAGE SR 19b8. 4B3 473 4236 +15 30 5-68 H W11:1-6-2121606,1\- 0 S CHURCH 19b3 51>2 552 4236 +21 30 8-63 H w
ft:l-b-2121000- l FLINDERS 1963 225 2 215 423A +n n 20 3-h3 H W
I 8-b-2 122AAO- M LARSEN 19b2 47B 2 46A 4255 +15 n lA A-tl2 H wCB-6-2 122B8A- P fliNDERS 1960 336 2 326 4240 +15 11 20 11-60 H WI B-b-2125CCC- 1 G E STRA TFORO ( 1919l 690 6 4294 A +A 1 4-48 S wI B-6-2125CCC- 3 G E STRATFORD ( 1934 302 2 4295 21 0 -34 H w
I B-6-2126AOA- 1 AMALGAMATED SUG 1934 595 16 400 4275 A n • 3-h9 N (] 0
I B-b-21278RA- 2 o LUC IA 1949 536 2 4251 A +1> 1 AM 9-h9 S " 0(6-6-2127CCC- 2 H SHERROD 1964 265 2 265 0 4248 +A 11 9-64 H W D
I H-b-2127CCO- 1 C E BAILEY 1964 255 2 255 0 4250 ., n 3 2-h4 H W f)
I H-b-2 127COO- 1 l 0 DALllNGS 19b2 535 3 525 5 4253 +71 11 40 8-h2 H W 0
(A-6-21270CO- 2 l OEFFlIES 1949 625 2 615 4255 A 7-68IB-6-2)28BAA- 2 8 ROPELATO 19b1 340 6 330 4234(l:I-b-2128COO- 1 J H BUCK 19bO .. 91>1 2 4260 +30 30 7-60I H-b-2 129ARR- Z W 0 HAMMER 19b2 553 2 543 4232 +2' S-f.2I H-b-212980A- 1 0 E CLARKE 1962 507 2 497 4229 +ll 40 5-62
11:I-6-21308AA- SUG I MOTO 19b1 J 532 2 510 4215 F 9M Il-nA N nIH-b-2131AAA- M HtlNT 1963 H I>B9 4 665 4211 +35 30 9-63 H [)
( 8-6-213288A- 2 J WIGHT 1961 J 594 2 5A4 4222 +33 " 5-hl S 0I H-b-2132B80- 2 J WIGHT 1961 J 524 2 513 4227 +33 i>5 3-hl H [)
II:I-b-21320AA- 1 R GREEN 19bO J 663 2 653 4258 +13 lA 6-60 H D
1l-I-b-2 13306,AO- l N WElSH 19b1 1>40 630 4249 +30 3-hl H w1B-b-2133COO- o M HADLEY 1964 252 242 4245 +4 I1-t.4 H W
18-6-2133DDC- PREVEOEl 1955 A82 425h +10 ~-69 S U
I B-b-2133000- A HADLEY 1960 956 940 4255 +34 25 12-(,0 H w11-\-6-2134DBA- MOSS 19b4 261 250 42hA 4 3-h4 H W
1l-I-b-2 1340CC- l F lET 1964 270 21>2 42"" A 7 AO 9-64 H 0( H-6-2134DCD- S PARKER 19b1 777 767 4211 +37 .- 4-hl H [)
(Fl-b-2135CCD- K BYINGTON 1961 333 305 428A 19 11-61 H D
I tI-6-31 16,OA- F STEWART 19bO 354 344 421b +7 12 ll-IiO H 11II1-b-3) 40AI\- J WAYMENT 19bb 540 5~0 421S +1. oM 10-Mi S 1),1
( R-6-31 seec- R M JACOB 1960. 510 500 4711 F AM ~-A9
I A-6-3 1 6CCA- r. , l Mf.C " 1 1967 115 105 4220 F 10 10-f.7(1-\-6-3) 6cnA- r. S l M&C N 2 1967 244 234 4210 +14 , 5-A7
I H-6-31 10BO- R M JACOB 19bO 2B3 273 4715 +19 20 4-60IH-6-311006,AC- A M JACOR 1967 4A3 477 471 <j F 4-(-,7
37
Table 1.-Continued.
WELLNUMBER
( K-b-jllOACR, l-'-h-3112~CC(l-'.-h--3) 13RC(( 11-f,-3114AO[l(H-6-3114nAA-
(H-h-.i) 141lCC- 2
(l~-h-3) IIlC(D- 2(r<-6--1) 1 'icnfl- 1{f>-6-311,)IlDC- 1(1-l-6-3117AAA- 1
( tI-6-3117DflA(H-6-3 11 RAR(
I f'\-/l-3119Ufl,( H-6-3119J\,flC(1"-"-3) 19ABC-
(i-lo-h-3) 20RAAIH-6-31211)[)(( H-h-3112AAAI fi-A-3123BAA( H-I)-312:1ACC-
OWNER
R M JAcm~
WARREN r.E~fTf'R,Y
MlJIRBR[J[}K F-MMSJ H MEIROSG H MEtROS
fJ 5 CHURCHH1GGSo VAur,HNDAVISM JACOB
R M JACOBR M JACOBMA!l:oljARDT ACFTMAROUARDT AC FTMAIHlUARDT ACFT
V H SLATERR M ,JACURJ E fURROWK W BARRUWK F BARROW
DATE
196719')H146')19621961
194CJ1969196019631960
1960 ..19601957
( 1944)1957
19611960..,.
( 1943)19631967
METHODOF CON
STRUCTION
WELLDEPTH(FT)
-r525')0532550H70
b04483290325542
455150229220?95
4\2535300272A07
DIAMETER(IN. )
22222
CASING
DEPTH(FT)
74253R522540860
4112AO315532
4451401501BH17A
402525290251597
ALTITUDE
FINISH OF LSD(FT)
421542lb422242254224
422042114)17421A421 '5
4215421A42}l~
421A A4219
421542164220 A42204220
WATERLEVEL(FT)
+38+\2
+9+13+31
FF
+14+1\+3\
+20+\2+14
+8F
+22 0+35 0
+5 I+5 0
+15 0
YIELDDRAW-
RATE DOWN(GPM) (FT)
14 M
172035
8M
\91030
150I
25
2030
220
DATE
5-695-698-655-h2
11-61
8-6B4-693-603-634-60
4-bO4-604-575-545-51
4-614-bO9-683-"'3
10-61
WATERUSE
SISHH
sSNNN
HSHH
H
WELLUSE
w
"www
wwwww
LOG
onooo
ooDoo
ooooo
ooooo
OfHERDATA
AVAILABLE
(l-I-h-3123cnA(1">-6-3) 24AAf',Ih-h-3126ACO( H-6-312MH~R(R-7-111ltARR-
A BARROW5 T KNlr,HTA BARROWo \oj ILSONI) R CURTIS
196319641963
( 1930)196~
497790257512ll6
22238
4H77.0247
\00
4219422142174219 A4flA5
+\7+27+15+\6
20
302520
8M22 20
9-638-649-63
11-681-68
ooo
Ih-7-1IzonDCI fI-1-1) 27CACIH-1-112RCOC(H-7-11291l[)CIH-7-1IZ90DC-
BEN lOMOND INVNO OGOEN CITyl () S CHLWCHC M BARKERNfl OGOEN C 1 TV
196119601960
( 1930)1961
360sal265245944
1616
84
24
ll7295250
388
41404630448043Afl4395
56 092 0
+19 0F
730
350 130408 250
55126 H125 161
2-614-605-608-698-61
Hp
Twwow
ooo
occ
BM35M
101 100
IH-7-1 nOACO(H-1-11'lOROC(H-7-1130Rrm(1-\-7-1130(C1l(R-7-1)30CCA-
(H-7-!liOll(A- 1(~-7-1l3lARC- 1(1-\-1-1I'HACR- 9(k-7-1HIRAC- 1(K-7-1131PoAC- 2
lfi-7-1131RORlH-7-11~Hp,DC
(rI-7-1)31CAAIR-7-11-HCCO- 1(H-1-1)31CnA- 2
(f-)--f-l1 :32And(1:I-1-1112CAOIH-1-1132cnA(K-7-l ) 32CDP.(1-1-1-1 ) ~{2Cf)n-
(H-7-1) ~2I)CA
(1-I-7-1132DCAIh-7-11-12DIlR- 6t li-7-1) 33f,AA- 5(k-7-1133[)Af)- 2
(1"-7-1 )34CAA- 1(A-7-21 2A,CA- 2I H-7-21 2CAD- 1(~-1-2) 2CRA- 5(1'\-7-21 lCRR- 3
I H-1-2) 2CBn(1-I-7-21211RC11-1-1-21 31lAnI H-7-21 9AAA(1"1-7-21 9CIlA-
II1-7-2) 10DA[)1t-'-7-2111RAAI H-7-2) 11CRAI B-7-2) 1 '5RAAIH-7-2)lbUA-
( H-7-211fl((~A(11-7-211flDAA( "-7-2 I l",DAf)11'\-7-211 flDC[)r 11-7-21201),o.A-
(H-I-2)/IAll{J1r<-7-:t)21CAIl(1-I-7-212111(C(H-1-1'1231lP.f)(H-I-71231l(A-
IJLEASANT VI Ew CH L MClAN!:'L J HARRISP lURKERK P BARKfIl
C r. A RROWNE S TRnMAERr,N FLL I 5R ANDEf.l 501\1M Ron ANCf
RANCH INNA VEL! SL ~EQRATT
l H CRANEG ( FARRELL
J FULKMANJ K MONTGIlt<lERYH R SHINNEYS H FOSTERV S BERRETT
G ClL 5ENf\ HUNTOGDEN (ANNI N(;
J P SPACKMAN
NO OGDEN C I Tv
P l TAGGER Tt LEMONso wIlLARO wTenG M SMITHo COOK
wE5TERN FR T PCK( C COOKr, 5M I THJ W LARKINIJ 5 R R WRW 2
wELI~S & lARKINJ .... HI TEE WARDK WARRENtJ S B R WRW 1
UNKNOWNl [) S (HURCHL [1 S CHURCHR r, PENH)I\'J MAW
T MAWD BINGHAMMA"H(IUC,HII AlICTHlN5 Ie
19161963*196419621961
( 1946)196219621968196A
( 1900)19631',162""19621960
}C~61
1960196f\
( 1934)1461
19671961196119641460
196R1963
( 1932)19691964
1961( 1930)
196119611964
1961195CJIg6R
( 1900)
1960196 "f
( 1936)1961'\146-1
C.I.IH
.I
HJHJC
ccC.IC
CH
HH
\908BB4
3\0294
\804304754\6322
482547589504
49
60329253252442
117247226126636
\873323A5142321
330186100225
1206
7823653905\5
1092
78010211176
150
/30A30
315336
\62242
32344
62A2
"6
\0\0
410
\0622A
\A10\2
24
24222
757463
264286
420469392301
526569494
45
60317252236432
\042372\2126436
15095
200330230
200
21510a2
5103A5326505
10R2
752100G1166
29412",
P55p
o
o5o,5
p,p
op
p
op,5
38
43454325433043084308
43184315431543004305
4302 A4305430842934304
4364 A4335433243254330
43354340434544Rq A4399
46RO4310432042414245
416043254221\ A42154211\
42294331 A477042304225
42184227422f'l42274719 A
422'"422h422A425042'50
+B 0+10 0+15 0+20 0
+1'"+13
+7+23
F
+3+16
F
2 D
+4+41+39
+9+12
+8+ll
F+1'1
14
110 017 A32 0
+40 I.18 0
+24 I31 0
+20 I+9 I
+52 0
F37 A35 0
+25 0+49 n
F+31+34
+"+10
+\ ,+4+4
+19 I+?l 0
15416704520
13M151"AD
4M1260
20
7M1820
1"20
482542
900
"014M
150
35M
943
"702562
5M98
42 M6M
BM20 M50
27
\0
140
6-6610-649-644-644-64
8-684-638-647-h28-f:l7
10-688-628-62
5-68
8-686-67
11-629-625-60
12-615-608-683-69
11 3-69
1-611/\\-A8
1-619-698-60
B-683-633-695-699-64
9-613-691-61
10-61B-64
4-6010-h7
1-11910-688-63
PMHHH
SHHHH
HN
IHHHH
HHN\p
NHSHP
SH5H5
HH5HH
wwWww
o
"wW
"ow
owwww
w
"Woo
ww
""Ww
"o""wowww
""woo
""ouw
ooooo
oooo
ooooo
oooo
ooo
ooooo
oOJ
oDo
ooo
c
ccc
Table 1.-Continued.
CASING ALI 1-YIELD
OTIlERMETHOD WELL DIAM- TUDE WATER DRAW- DATA
WELL OWNER DATE OF CON- DEPTH ETER DEPTH FINISH OF LSD LEVEL RATR DOWN DATE WATER WRLL LOG AVAIL-NUMBER STRUCTION (FT) (IN. ) (rr) (IT) (FT) (GPH) (IT) USE USE ABLE
(H-7-2) 2AACf)- c, DAVI S 1964 004 5H4 4250 .20 0 5 11-"4 H W 0Ih-'l-2126KA .... - E ~AKI-R 1967 34B 321 4246 .ZO 0 36 4-62 H W 0(1-I-7-21?!)CAO- " RANDALL 1960 37R 36R 4239 .30 0 " 11-60 H W 0I r'-7-?12hIJAA- RnCHEll 1962 507 ,"3 4255 ·Z7 0 ZO 9-62 H w 0I f<-1-2126I1Ah- L R()CHFtL 1965 505 4R5 4255 ." 0 to 8-65 H W 0
(t"-7-?12hflAC- W RANOALl ( 1905) 510 500 4259 A ." 3-"6 H(fi-7-1121Ufl.- IolENOENHALL 1<:162 336 315 4239 .ZO 75 II-h2 H(11-7-717AIIR.R- .AW 4227 F 6M 9-"8 SIH-7-~12f\P,A[)- L JACKSON 1965 ROZ 760 4223 ·17 0 1, 12-65 H(H-7-2130illlrJ- n WHI TE 1961 438 4Z0 4210 +10 0 ZO 9-hl S
(k-7-213ltIAC- C HAOlfY ( 1940) 5Z4 4219 A +7 I 12-59 H WIk-7-/lj2RRR- E 0 TAYlO~ 1961 546 525 4214 +10 I RM 11-6A H [J
(h-7-2 112RfI~- L 0 S CHUPCH lqb3 "40 RI9 4714 +10 0 4 9-"3 5 W(h-1-7' 3211CR- R A 5 I ,",PS[IN 19b2 "7 .-. 4215 +" 0 , 10-62 H w1t\-1-2'"i2DRC- E [) TAYlOP lq64 RI9 111 42~5 ·IZ 0 IZ I1-f'l4 H W
1K-1-2' DAAR- L H ENr,LANO 1961 4B3 Z 46Z 4238 +9 0 A h-tIl H w 0(t'-7-2134AAA- " ENGLAND 19bR lIO Z ZOO 4238 +6 0 ,
5-h~ H W 0(H-7-21~i4RAR- " ENGLAND 1963 756 Z 114 423q +IR 0 30 1-1.3 H W 0i h-1-2134f.\RA- [) J CHRISHNSI:N 1961 060 Z 650 4738 +4Z 0 55 9-61 H W 0{t\-7-21 j4RAA- L KEYE'S 1'~6t., 517 Z 507 4238 +IA I ZOM 5-69 H W D
( 11-1-7134111\11- • J \JANWOWRKEN 1Qf.,4 J 756 Z 715 4239 ·Z4 35 7-b4 0Itl-7-3131AAC- r, 5 L ~f:C C N14 lY6R J H06 Z 786 4207 .54 56H Y lZ-69 OJ C(h-7-31~lAAC- C, 5 L Mf,C C "'5 1q69 H 9Z0 10 656 4207 +SZ lAOM 12-b9 y C(1<-7-)13lAOC- G 5 L Mf.C C Nil 196A J l1Z 3 692 4207 F 53 H Y lZ-69 0 •IK-7-3 )311l44- " 5 L "'f.C C N 3 1967 J 41Z 2 400 4207 +28 I Z9 M Y lZ-69 D •ltl-7-311111U- r, Mf.C N 4 1961 415 405 4201 +Zh 30 M ~ 12-69 C(l-'-7-3)31DAA- G Mf.C N 5 1967 575 565 4207 +41 40M Y 12-69 •, p,-1-3IHnAA- G ,",f.C Nl? 1Y68 117 601 4207 +4Z 69 M ~ 12-69 C1,",-7-3131PAR- G "'f.C N "
1967 590 580 4207 .., 29 H ~12-69 C(H-1-31~IIlh.A- c, 1'lf.C N 7 1967 no 690 4207 +45 7Z M Y lZ-69 •'\-.-7-'IHIlAA- r, 5 MF.C ",0 1968 70S 3 MIS 4207 .4Z 65 M M12-(,9 " 0 •jH-7-3131PAC- G 5 "1f.C N R 1967 6Z1 Z 611 4201 +43 ZR M 12-69 N 0 •{H-7-313!nDA- G 5 folr.C N 9 1967 597 Z 5B7 4201 +38 ZAM Y 5-69 N OJ •(H-7-31~{2CRR- G S L Mf.C N13 196H 117 3 601 4201 +42 90M Y lZ-69 " 0 C(h-1-3j-nCOf)- G EAST NO 399 2 4211 A +lR 15 M 5-69 S C
(;.1- 1-3 13'lnAA- L ST AN(;fR 192~ 145 ? 145 0 4215 A +11 3M 3-69 0fH-H-2J21AAA- \oj lLLARf) Sl< IN SA 1965 567 Z 546 5 4705 +71 lZ 9-/'5 Wfo<-,P,-217KAR- • e FftCFR 1961_ 225 10 90 p 4125 43 650 10 4-61 W( t;-H-2Il~{LI)R- Wllll\~D wATERr:O ( 1934) 255 IZ 97 P 4328 A 40 900 7 AI 3-6q (I
(K-H-2)2~IHlA- wILLARO (TTY I q6? 460 16 zoo P 4525 Z46 1650 70 12-62 W
I H-~-2 126RCA- R r. lFMMW" 1'161 327 10 ZBO 42AA Inoo 50 2-61 W 0(~-8-2 12h1\(0- [) F HARDING ( 1934) 118 4 4270 F 7M 9-69 (I 0(H-R-21?hCAC- G L ARAE:Gr,ER Iq2q Z35 3 100 4255 +21 I 3-59 0 0
!! DATE APPLIES TO WATER LEVEL ONLY. YIELD AND DRAWDOWN FIGURES REPRESENT WELL~TEST DATA TAKEN SHORTLY AFTER COMPLETION OF THE WELL.
Y DISCHARGE MEASURED IN AUGUST 1969.
39
Table 2.-Chemical analyses of water from selected wells and springs in the East Shorearea and Antelope Island.
SPECIFIC CONDUCTANCE: IN MICROMHOS/CM AT 25°C, F, FIELD MEASUREMENT.
SOURCE OF DATA: 1, U. S. GEOLOGICAL SURVEY; 3, UTAH STATE DEPARTMENT OF HEALTH; 8, U.S. Bureau of Reclamation.
SODIUM01 SS- MAG- PO- PLUS
DEPTH DLVED CAL- NE- TAS- POTAS- 8ICAR- CAR-
DATE OF TEMP- SILICA IRON CIUM SlUM SODIUM SlUM SlUM 80NATE 80NA TELOCAL NUMBER OF WELL ERATURE IS 102 1 1FE 1 ICAI IMGI INAI IKI (NA+K) IHcn31 lCO~1
SAMPLE 1FT. I 10EG CI I MG/l) I ~G/Ll 1MG/Ll 1MG/L, 1MG/LI 1MG/LI 1MG/LI I MG/L 1 IMGIL 1
WELLS1A-2-1I 6ACC- 2 8-21-68 59 13IA-2-11 7 ABA- 4 9- 8-47 450 17 23 30 7.9 23 140
IA-2-11 1A8A- 4 12-12-58 450 17 21 17 1.3 32 131 0
1A-2-11 7ABA- 4 Il-Hi-S9 450 16 19 11 1.1 31 126 0
I A-2-1 1 1A8A- 4 10-15-64 450 18 20 16 1.9 31 129 0
IA-2-11 7A8A- 4 9- 8-61 450 17 120 0
IA-2-11 7 ABA- 4 10- 1-68 450 16 126 0
( A-2-l) 7ABA- 4 Q- 8-69 450 11 126 0
1A-2-1I 1BOC- 2 11-12-6B 418 15I A-2-1118ABB- 2 1-11-61 563 6.0 2.1 68 .8 143
1A-2-1 120008- 9-26-61 591 17 35 13 24 3.0 154 1
I A-2-1130ACO- 12- B-58 314 II 13 0 61 11 23 250 0
f A-2-1130ACO- 11- 6-59 374 II II 52 22 26 254 0
IA-2-1130ACO- 11-16-60 314 II 14 63 16 23 .5 24B 0
I A-2-1130ACO- 2-24-65 314 12 14 69 11 36 280 0
(A-2-1 ) 3UOA- 8- 8-41 195 14 15 22 22 296 0(A-2-1I31AOA- 10-10-511 195 15 19 18 26 296 0
IA-2-1131AOA- 12- 6-60 195 15 0 18 19 21 1.6 288 0
f A-2-1 132CCB- 5-13-51 412 16 70 10 24 42 2761A-2-1 132CC8- 2- 6-59 412 12 18 71 23 31 322
1A-2-1132CCB- 11- 6-59 412 13 16 63 24 33 316I A-2-1 132CCB- 11-16-60 412 13 14 0 15 20 2B 1.6 3001B-1-1 110AAC- 12-20-65 231 16 50 51 11 517 4291B-l-1110AAC- 2- 1-66 231 16 48 36 13 360 292(8-1-1) tOAAe- 11-13-68 231 16 48 45 20 510 433
1B-2-1I13AAB- 5- 9-47 264 23 12 3.5 80 191 1I B-2-1113AAB- 10-10-5B 264 16 21 9.6 2.9 80 192 01B-2-1113AAB- 3-25-59 264 14 20 10 1.9 80 194 0
(8-2-1' 13AA8- ;-14-59 264 16 21 10 2.2 80 186 0(B-2-1 I 13AAB- 5- 5-69 264 15 19 9.6 1.9 80 193 0
I B-2-1 115000- 11-12-68 450 13 .4 3.2 14 115 45 5018-2-1I23AAA- 8-20-68 322 14 12 63 21 41 1.3 225 0
18-2-1I23AOO- 8-20-68 331 1718-2-1123BOO- 8-29-68 600 18 220 12(B-2-1 1248AO- 8-20-68 386 16 186 5
I B-2-1I24CBO- 2 8-21-68 325 15 196 018-2-1)24COO-11 12-12-58 601 15 17 48 14 35 192 018-2-1124COO-1I 11- 6-59 607 15 15 46 16 39 197 018-2-1) 258M-15 12-12-58 510 16 15 55 16 34 208 0IB-2-1I25BM-15 11- 6-59 510 13 13 56 16 31 222 0
18-2-1126A88- 8-21-68 273 19 15 18 6.3 113 216 0(8-2-1126BAB- 4-17-62 584 16 23 1.7 119 2.0 145 II1B-2-1I26COO- 7-12-61 425 192 60 446 8.2 121 8(0-2-1I26COI)- 8-15-61 425 195 10 455 7.8 73 0IB-2-1126COO- B-22-61 425 20 194 61 451 7.8 144 0
IB-2-1126COO- 9-26-61 425 173 58 414 1.0 156 018-2-1) 26COO- 1-25-62 220 11 17 14 181 60 402 158 018-2-1I26COO- 1-25-62 260f' 17 454 136 0I B-2-1I26COO- 1-25-62 300~ 17 493 122 01B-2-1I26COO- 1-25-62 38511 16 507 120 0
( e-2-1Il6COD- 5- 7-63 2UI! 464 124 018-2-1I26COO- 5- 7-63 232 1 414 120 010-2-1126COO- 5- 7-63 254rl H4 124 010-2-1 I 26COO- 5- 7-63 275f' 501 114 018-2-1126COO- e- 7-63 300I! 19 548 102 0
18-2-1I26COO- 5- 7-63 320~ 526 102 0(8-2-1 )26COO- 5- 7-63 340 1 558 98 018-2-1126COO- 5- 7-63 360f' 556 100 018-2-1126COO- 5- 7-63 3801 573 92 0IB-2-1126COO- 5- 1-63 84Y 16 13 292 0
18-2-1I26COO- 4 5- 7-63 105 21 16 82 2AO 01B-2-1126COO- 4 5- 7-63 126~1 15 82 310 0I B-2-1 126COO- 4 5- 7-63 147~1 15 93 286 01B-2-1 126COO- 4 5- 7-63 189~1 16 81 290 010-2-1I26COO- 4 5- 7-63 200!! 17 88 282 0
18-2-1I26COO- 4 5-13-63 205 96 284 018-2-1I260C8- 1 8-20-68 400 11 222 0IB-2-1I21000- 4 2-21-62 500 2018-2-1134AOA- 3 5- 9-41 210 16 8.9 36 10 161 264 01 B-2-1134AOA- 3 10-10-58 270 17 16 14 21 241 212 0
«R-2-1 )34AOA- 11- 6-')9 210 17 15 73 22 251 204 0(B-2-1)34ADA- 4- 8-60 210 17 18 59 31 247 203 0I B-2-1134AOA- 6- 9-bO 210 15 16 20 244 199 018-2-1134AOA- 11-10-60 270 17 13 74 72 238 3.4 20B 0(8-2-1) 34AOA- 10-16-64 210 17 11 42 27 242 213 0
(8-2-1J34ADA- 3 9- 6-61 210 11 204 0(8-2-1134ADA- 3 1-25-68 210 16 218 01B-2-1) 34AOO- 2 8-20-68 410 19 15 143 47 456 136 018-2-1134AOO- 2 9- 8-69 410 19 140 018-2-11350BO- 1 8-20-68 84 13 260 0
40
01 SS- OISS- NON- SPECI-OlVEO OlVEO CAR- FIC SODIUM
CHlO- FlUO- SOLI OS SOLI OS HARO- BONATE CONo- AD-
SUlFAIE RIDE RIDE NITRATE BORON I RES 1- ISUM OF NESS HARD- UCTANCE SORP- SOURCE
IS04) I ClI IF) IN031 (B) OUF AT CON STI- (CA,MC) NESS I MICRO- PH T ION OF
( HG/lI ( MG/LI I HG/LI I MG/LI I~G/LI 180 C) TUENTS) I HG/LI ( MG/LI MHOS) RATIO DATA
WELLS243
16 18 2.1 189 106 0 336 1.0
II 14 3.1 169 72 0 271 7.6 1.6
13 13 2.6 165 71 0 271 7.6 1.6
12 14 2.3 162 72 0 264 7.4 1.6
15 70 0 272 7.6
17 60 0 272 7.5
17 74 0 272 7.4348
16 21 40 205 24 0 337 8.4 6.1
22 31 .1 .0 70 230 140 370 B.O
24 25 .3 6.2 292 222 17 511 7.6 .7
27 25 8.1 296 220 12 515 7.4 .8
28 27 .1 6.3 300 224 21 506 7.9 .7
35 29 14 341 240 10 569 7.5 1.0
37 30 1.9 348 278 35 588 7.6 .6
37 28 6.6 356 270 27 597 7.6 .7
33 26 .1 6.7 342 272 36 57B 7.9 .6
24 38 .4 27 396 276 50 1.1
25 31 6.4 363 271 7 622 7.8 .8
23 27 7.4 348 256 0 612 8.2 .9
29 31 .1 7.3 358 270 II 593 8.3 .7
1.2 778 1.3 1720 197 0 3080 7.7 18
1.9 485 1.7 1090 144 0 1980 8.2 13
6.2 760 .7 1700 194 0 2920 8.0 18
15 30 1.7 260 44 0 381 5.2
9.5 30 .5 248 36 0 395 7.8 5.8
9.2 28 .1 244 34 0 393 6.1 6.0
II 30 .8 246 34 0 411 7.9 5.9
8.7 28 .2 236 32 0 393 7.7 6.2
.8 138 .3 349 66 0 657 9.1 6.262 55 .2 13 10 196 244 60 652 8.0 1.1
46448 75 0 522 6.532 76 0 415 8.4
59 260 99 661 7.932 40 6.9 287 177 20 498 7.8 1.139 42 7.4 301 182 20 507 8.1 1.338 42 7.2 309 201 30 542 7.6 1.038 41 8.2 318 206 53 550 7.9 1.1
32 72 5.7 373 12 0 622 8.1 5.8 1
62 103 70 388 90 0 696 8.9 5.4 8
122 1040 0 2160 72B 615 3690 7.2 8
183 1080 2150 774 715 3570 8.0 7.1 8
112 1060 310 2200 736 618 3640 7.9 7.2 8
111 946 1990 669 541 3320 8.1 6.947 985 .2 8.0 280 1780 700 570 n90 7.4 6.637 1160 .1 270 800 688 37BO 7.3 1.032 1300 .2 210 895 795 4080 7.3 7.228 1340 .2 .3 915 817 4200 7.3 7.3
33 1190 805 703 3980 7.0 7.1H 1210 820 722 4040 7.0 7.249 1200 815 713 4020 7.0 7.235 1290 860 166 4280 7.0 7.428 1470 995 911 4740 7.0 7.6
25 1400 940 856 4550 7.0 7.523 1520 1040 955 4B50 6.9 7.520 1510 1020 943 4850 7.0 7.517 1600 1100 1030 5110 6.9 7.549 72 234 0 753 7.5 2.1
35 64 178 0 679 1.6 2.7106 101 328 74 982 7.6 2.0
92 111 284 49 971 7.5 2.4147 126 378 140 1110 7.4 1.9147 131 378 147 1120 7.4 2.0
150 146 386 153 1160 7.3 2.1121 112 0 820 7.9
375 66155 141 10 552 131 0 958 6.163 390 9.0 9)8 272 98 1610 7.7 6.4
67 410 6.3 944 274 107 1730 7.9 6.654 412 6.6 928 273 106 1710 7.7 6.558 410 3.7 925 274 111 1710 7.9 6.468 384 .3 6.7 912 276 105 1660 B.O 6.288 334 5.3 859 215 40 1510 7.B 7.0
360 282 115 1560 6.0276 97 1600 7.5
36 9B8 .3 1910 552 440 3130 7.7 8.4925 570 455 3100 7.9106 352 139 926 7.9
41
Table 2.-Continued.
SODIuM01 ss- MAG- PO- PLUS
DEPTH OLVEO CAl- NE- T.AS- P[)TAS- 8 I CAR- CAR-DATE OF TEMP- SILICA IRON CIUM SI UM SODIUM SlUM SlUM 80NATE 80NA TE
LOCAL NUMBfR OF wELL ERATURE ISID21 I FE I lCAI I MGI 1 NAI I KI INA+K) IHC031 IC031SAMPLE 1FT .1 10EG C I I "GILl I~G/ll I MG/Ll 1MG/Ll I MG/Ll IMG/LI 1MGI Ll I MG/LI I MG/LI
18-2-11368PC- 10-11-54 'i01 19 10 33 68 3.9 234
18-2-113688C- 10-10-58 501 16 11 93 21 96 314 0(8-2-1136BHC- ~-25-5q 501 16 15 83 31 101 316 0(R-;>-l) 36BiK- 7- 8-'59 501 15 16 79 36 111 332 0(8-2-1) 36811(- 11- 6-"9 'iOI 15 13 82 33 110 313 0
(P,-2-1 ) 36811C- 4- 8-60 ~o 1 15 18 44 52 109 3111t'-2-1)36ARC- 11-10-60 SOl IS 15 81 29 105 3.3 31018-2-11368HC- 10-16-64 SOl 15 15 55 41 160 3B{B-2-1)36BHC- 7-25-68 50 I 13 158( R-3-11 20CC- 7- 9-')4 386 21 39 16 35 2.3 219
I A-3-11 lDCC- 2- 6-')9 386 12 17 37 19 36 225 0I R-3-l) 20((- 11-18-5q 386 12 15 30 37 18 B 221 0IB-3-1' 4ACh- 8-20-68 250 "(f\-"'S-l) 4COB- 8-70-68 657 20 19 27 6.8 46 19218-3-11 400B- 11-14-6H 485 18
I B-3-11 500A- 11-14-6B °IB 24 30 25 1.3 32 161IB-3-1I 9AAD- 9- 8-69 64B 20IB-3-1115ACO- 9-11-69 260 16 41 36 18 68 320 0IB-3-1115BAC- 11-14-68 985 22( 8-3-1115BA(- 9- 9-69 085 24 26 30 3.4 60 232
1B-3-11248CA- 1- 9-54 116 25 62 13 119 2.1 49918-3-1124BCA- 10-10-58 116 16 21 67 15 120 51018-3-1124BCA- li- b-59 116 14 11 63 16 133 508IR-3-11248CA- 11- 9-60 176 12 20 20 ::\0 14 123 1.3 3801P-3-1 1250M- 9-20-68 26') IB 20 65 11 117 2.3 215
(8-}-1127AOA- 12-11-68 850 21 26 20 3.9 111 301 0113-3-1) 3SABA- la-la-58 1220 33 36 30 1.0 256 88 0«R-3-1) 35ABA- li- b-59 1220 31 26 27 .5 256 88 01 B-3-1135A8A- 11-28-60 1220 29 32 480 26 4.4 250 2.1 19 018-4-11 60CO- 1- 4-56 805 11 21 1100 43 15 33 6.1 274 0
IB-4-11 60CO- 5-22-58 805 11 18 80 43 14 37 5.4 275 018-4-11 60CO- 4-29-59 B05 13 19 1200 44 15 33 1.1 283 018-4-11 60CO- 5-10-60 805 13 18 350 45 14 36 6.0 277 0I B-4-1I 60CO- 7-13-62 B05 13 19 49 13 40 274 018-4-1} 60CO- 1-11-63 805 14 17 42 13 41 263 0
18-4-1 I 60CO- 1-14-64 R05 11 40 14 43 268 018-4-11 60CO- 6-24-65 805 14 18 42 14 35 251 01R-4-1} 60CO- 7-21-66 R05 22 16 30 39 16 33 260 0( B-4-1I 60CO- 7-10-61 B05 1B 11 40 48 11 40 264 01B-4-11 60CO- 7-16-68 805 21 18 120 35 20 36 26, 0
18-4-11 60CD- 7-22-69 805 22 18 41 17 36 269 0I B-4-11 7BAA- 12- 2-61 902 69 17 19 2.1 2B6 I(fl,-4-1) 7BAA- 12- 4-61 902 56 IB 19 2.3 252 2I B-4-1I 80eo- 9- 6-61 707 47 12 17 1.6 19R 0( B-4-1110BEl~- 9- 8-61 1205 15 43 9.4 23 1.2 183 0
(f',-4-1) J2AAR- 11-14-68 170 17 194 0IB-4-21 6RAA- 11-14-68 609 IS 13 51 14 18 1.9 221 0IB-4-21 68AA- 9- H-69 609 16 233 018-4-21 1CCC- 11- 2-64 190 14 19 280 35 15 5B 266 0I B-4-21 1CCC- 5-14-69 190 14 19 33 14 44 5.2 256 0
IB-4-21 10CC- 8-28-68 400 15 19 42 15 29 234 0IB-4-21 10CO- 8-21-68 588 1418-4-2 I 10UAA- 10- 1-6R 628 5.6 51 16 15 2.8 2~4
(R-4-2Il2BAA- 8-28-68 174 14 I" 58 21 23 28018-4-2111C00- 8-21-68 583 16 222
(8-4-2)20(CI\- I 11-11:1-68 595 15 21 34 13 30 211(R-4-2)250A.D- I 8-70-68 465 14 16 32 1.3 15 146(R-4-2 )75000- I 8-20-68 1318-4-2127A8A- I 5- 5-fl9 304 15 30 14 4.4 130 5.4 32418-4-2127A8A- I 9- 1i-69 304 15 330
IR-4-3)!9Cfl/I.- 31/ 7-3D-fl9 481 4 / 24 35 340 51 21 202 4.B IB7 018-4-3)19CI\I\- 3 A- 1-69
~~:!I23 216 0
I K-4-3) 19CflJ\- l 8- 2-69 21 2?1 0I B-4-3119CAA- 3 8- 2-69V 481 24 18"7 0(A-4-3119CAA- 3 8- 2-69Y 481 IB8 0
(8-4- 3119CAA- 3 8- 4-69 481 24 34 46 25 159 4.4 190(8-4-3) 19(I\A- 3 7 / 8-20-69 481 24 166IB-4-3119CAA-
~!I9- 2-69 481 24 110
( B-4-3119CAA- 9- 5-6'1 4BI 24 250I B-4-3119CAA- 3 9- 8-69 481 24
18-4-3119CAA- 32.1 '1-15-69 481 24 70( R-4-3119CAA- 3 9-11-69 481 24IB-5-1)17Cl'\(- I 4-20-61 910 21 53 14 16 2.0 202(1".\-5-1) 17([\(- I 4-21-61 9\0 22 57 14 16 1.6 205(8-5-111 mOD- I 12-19-62 8;] 54 11 19 2.7 240
fB-S-lI18ABH- ll-lS-60!Qj 730 21 47 10 44 2.0 173 7(B-5-1I18AB~- 11-1S-6Olli 730 21 41 II 35 1.6 179 51 B-5-1118ABR- 11-15-60-3 130 21 48 11 32 1.6 tA2 51B-5-1I18 A8B- 11-15-6011/ 730 21 47 12 29 1.6 114 911"-5-1) IBAB8- 17-16-60 130 22 51 12 19 2.0 200 2
42
01 SS- 01 SS- NON- SPECI-OLVED Ot VrD CAR- F IC SOOIUM
CHlO- FlUO- SOL lOS SOllOS HARO- 80NATE CONO- AD-
SULFATE RIDE R I DE NITRATE BORON ( RESI- (SUM OF NESS HARO- UCTANCE SORP- SOURCE
( S04) (CLI (F) (N03 ) (8 I DUE AT CONSTI- ICA.MG) NE SS (MICRO- PH TlON OF
(MGI LI ( MGILI (MGI LI ( ~G/LI ("GILl 180 C I TUENTS I ( MGlll C MGILI MHOSI RAT 10 DATA
84 136 .0 10 578 312 120 952 1.7
86 140 II 624 344 86 1010 7.5 2.3
85 142 II 623 336 77 1070 7.8 2.4
97 144 10 656 342 70 1090 7.7 2.6
106 141 14 653 338 81 1090 7.8 2.6
85 150 8.5 620 326 71 1090 7.5 2.6 I91 152 .1 II 645 334 80 1100 8.0 2.5 I
151 133 15 750 330 8 1180 7.9 3.8 I360 230 1080 7.1 I
24 33 .3 l66 162 0 482 1.2 8
19 30 .2 269 169 0 465 8.1 1.2
20 26 .2 258 167 0 464 7.7 1.1341
1.2 23 6.4 222 96 0 368 7.8 2.0332
3.2 Ie ., 195 92 301 7.8 1.4350
.5 33 1 .. 8 349 162 0 571 1.4 2.3400
.5 20 .2 267 88 394 1.9 2.8
51 509 209 0 881 3.62.3 48 .5 525 228 0 812 7.6 3.4
22 49 .4 550 220 0 865 8.0 3.92.1 48 .2 .3 434 132 0 711 8.3 4.11.0 Jl5 .3 5.1 120 149 232 56 1320 8.0 5.1
2.0 40 3.2 354 66 0 570 7.8 5.926 380 .9 113 80 8 1400 7.9 1226 312 3.4 154 10 0 1400 8.1 1322 370 4.4 1.2 752 84 19 1390 1.6 12
1.5 21 .2 .0 218 167 0 470 7.4 1.1
1.0 20 .4 .8 215 166 0 489 1.9 1.21.0 17 .1 .9 219 112 0 461 1.5 1.12.1 20 .2 .4 218 168 0 473 1.1 1.25.8 21 .3 .3 258 115 0 482 7.1 1.31.4 22 .1 .3 265 160 0 466 7.5 1.4
2.9 20 .2 .6 261 158 0 451 7.1 1.51.8 18 .1 1.8 258 164 0 451 7.3 1.21.2 14 .1 .2 254 163 0 450 7.6 1.12.0 22 .2 .2 260 164 0 451 1.5 1.31.5 21 .1 5.2 264 112 0 455 1.4 1.2
1.0 21 .2 .5 212 113 0 460 1.2 1.2 121 20 0 298 242 6 528 .5 818 19 0 273 212 2 488 .6 821 15 0 225 166 4 385 8.1 .6 815 23 30 221 141 0 377 8.1 .8 8
31 126 0 345 1.716 20 .2 .4 40 250 184 0 427 8.1 .6
20 186 0 428 1.89.1 32 .5 .0 308 14e 0 445 8.1 2.1.8 24 .2 .2 110 264 140 0 442 8.0 1.6
2.5 24 .1 252 165 0 411 8.0 1.0454
36 22 .3 .1 30 280 208 24 464 8.1 .419 22 2.2 297 232 2 506 8.0 .7
22 160 0 385 8.2
1.5 19 4.1 241 140 0 315 7.8 1.16 • ., 12 .1 151 110 0 261 7.1 .6
2591.5 48 .4 .8 110 410 52 0 631 1.8 1.9
47 50 0 634 8.0
12 350 .5 .6 160 783 216 63 1360 1.6 6.061 516 1.153 509 1.6
290 1210 1.8295 1220 7.5
8.8 290 .5 .4 110 661 220 64 1180 7.6 4.7342 1110 7.1295 .4 741 192 1250 7.9315 .4 758 192 1260 8.0320 .5 757 204 1210 8.0
12201200
25 19 100 259 191 17 429 .530 20 269 198 23 429 .520 24 238 205 8 474 7.9 .6
54 35 287 161 8 478 8.3 1.5 842 30 211 165 10 452 8.3 1.2 835 29 262 165 8 436 8.3 1.1 833 28 251 166 9 428 8.3 1.0 826 19 223 118 11 409 .6 8
43
Table 2.-Continued.
SDOIUM01 SS- MAG- PO- PLUS
DEPTH OLVEO CAL- NE- TAS- POTAS- BICAR- CAR-DATE OF TEMP- SILICA IRON CIUM SI UM SODIUM SlUM SlUM BONATE BONATE
LOCAL NUMBER OF WELL ERATURE I SI021 1 FE I ICA) I MG) INAI IKI INA+KI IHC031 lC031SAMPLE 1FT .1 10EG CI IMG/LI I ~G/Ll 1MG/Ll I MG/Ll I MG/ll IMG/ll I MG/Ll IMG/L I IMG/Ll
I B-5-111BA88- 12-18-60 730 23 50 12 19 2.0 201 218-5-1120000- 1- 3-62 1000 15 80 16 17 1.2 245 018-5-1123080- 10- I-b8 601 15 15 46 10 18 1.3 205 0
18-5-1129808- 4- 9-43 BOO 14 20 70 19 21 2.1 288 018-'-1129808- ,-13-48 800 14 14 20 74 16 20 288 0
IR-5-1JZ9fWA- 11-19-'51 800 IB 13 30 71 18 18 2.4 27B 018-'-1129808- 4-14-52 800 12 12 30 73 19 20 1.7 296 018-5-1129808- 8- 7-'2 BOO 12 16 60 62 17 50 5.7 346 018-'-112980B- 8-l4-5~ 800 17 12 60 72 18 21 1.7 280 018-5-1) 29808- 8-31-54 800 12 13 '0 74 20 16 1.3 27B 0
(8-5-1) 2980A- 4- 5-56 ROO 11 0 73 19 19 1.7 290 018-5-1)29808- 5- 7-51 800 13 11 0 73 17 1B 1.6 280 018-5-1129808- 5-22-58 800 14 11 60 71 17 19 1.' 283 018-'-1129808- 4-29-59 BOO 14 12 0 71 17 18 1.8 287 018-'-1129808- ,- 9-60 800 12 13 0 74 16 19 1.8 281 0
18-'-1129808- 7-12-62 800 18 12 10 76 l' 18 276 018-'-1129808- 7-10-63 800 11 30 71 16 22 275 018-'-1 )29808- 7-13-64 800 18 11 60 70 17 21 276 018-5-1129808- 6-30-65 800 17 12 30 72 18 16 272 018-5-1129808- 7-15-66 800 19 10 20 68 21 14 274 0
18-5-1129808- 7-13-67 BOO 19 10 74 16 21 280 0/8-5-1129808- 7-15-68 800 18 11 67 22 20 284 018-5-1129808- 7-24-69 800 16 11 71 27 2.' 286 018-'-1I2980C- '-13-48 627 13 14 30 79 20 21 310 018-5-112980C- , 9- 1-49 627 12 13 30 79 21 20 312 0
18-'-1I2980C- 4- 1.4-52 627 12 14 20 76 20 24 2.6 320 018-5-1I2980C- 8- 7-'2 627 13 12 '0 78 20 22 2.3 317 018-'-1I2980C- 8-14-'3 627 17 12 70 78 20 21 1.8 312 018-'-1I2980C- 8-31-54 627 12 12 ,0 78 21 20 2.0 305 018-5-1129BOC- 4-22-55 627 12 12 50 77 19 21 1.7 303 0
/ B-5-1129BOC- 5- 7-57 627 l' 12 0 7' 18 22 2.0 300 0I B-5-1129BOC- 5-22-58 627 17 11 70 73 IB 19 1.7 293 018-5-1I29BOC- 4-29-'9 627 15 12 0 74 18 19 1.8 299 018-'-1I2980C- 5- 9-60 627 12 11 0 75 18 20 2.' 295 0IB-5-1I2980C- 7-12-62 627 16 12 81 17 20 296 0
I B-'-112980C- 7-10-63 627 19 12 75 17 22 294 0IB-5-1I2980C- 7-13-64 627 14 11 75 18 22 29' 018-5-1I2980C- 6-30-65 627 17 12 79 19 18 298 018-'-1I2980C- 7-15-66 627 20 11 30 75 21 15 296 018-5-1I2980C- 7-12-67 627 16 11 0 77 20 21 312 0
18-5-112980C- 7-12-68 627 19 11 10 73 23 21 309 0IB-5-112980C- 7-25-69 627 18 11 77 21 18 321 018-5-1I30AOA- 9-14-48 900 11 13 150 73 19 26 312 018-5-1I30AOA- 6-19-50 900 12 12 40 75 19 23 1.3 318 018-'-1I30AOA- 5- 2-51 900 11 12 3D 77 19 23 '.3 326 0
(R-5-1 J30ADA- 1-16-52 900 12 11 30 7' 19 24 2.4 311 018-5-1130AOA- 9- 9-53 900 12 12 30 76 20 23 2.0 31' 018-'-1I30AOA- 9- 9-54 900 12 10 40 7' 20 23 2.0 315 018-5-1I30AOA- 4-25-5' 900 12 11 60 78 20 24 2.0 318 018-5-1130AOA- 4- 5-56 900 12 20 77 20 32 2.2 339 0
18-5-1130AOA- 5- 7-'7 900 12 11 40 78 19 28 2.1 330 0( B-'j-1130AOA- 5-22-58 900 11 11 70 77 18 24 1.8 318 018-'-1130AOA- 4-29-59 900 11 12 60 76 19 30 2.3 335 018-'-1130AOA- 5-10-60 900 12 9.6 10 78 18 23 2.1 314 018-5-1I30AOA- 9-21-62 900 12 11 71 18 24 292 0
18-'-1130AOA- 7-12-63 900 13 11 73 17 29 300 018-5-1130AOA- 7-21-66 900 14 9.9 10 69 21 IS 282 018-'-1130AOA- 7-14-67 900 14 11 10 69 18 26 288 018-5-1)30AOA- 7-18-68 900 14 11 10 65 22 22 287 0(8-5-1) 'lOADA,- It- 1-69 SOo!!! 12 56 193 0
18-5-1I30AOA- 4- 1-69 600!!l 12(6-5-1) 30ADA- 4- 1-69 800!!! 12 40 316 0(6-5-1» 30ADO- 4- 9-43 900 11 64 19 40 296 14«8-'5-1) 30AOO- 4-22-46 900 15 60 72 21 41 356 01B-5-1 1 30AOO- 9-14-48 900 11 34 250 74 24 72 438 0
18-'-1I30AOO- 6-19-50 900 12 14 20 73 19 20 '.8 308 018-'-1I30AOO- 5- 2-51 900 12 14 50 74 20 25 4.6 323 0I B-'-1I30AOO- 7-16-52 900 11 13 30 74 19 23 2.4 304 018-5-1I30AOO- 9- 9-53 900 11 13 20 74 19 21 1.6 296 018-5-1I30AOO- 9- 9-54 900 12 12 30 71 20 21 2.0 298 0
18-5-1130AOO- 4-25-55 900 12 25 100 B4 26 80 6.8 504 018-5-1130AOO- 4- 5-56 900 23 20 79 24 66 6.B 44B 0I B-5-1130AOO- 5- 7-57 900 12 20 50 79 21 59 6.0 416 018-5-1130AOO- 5-22-58 900 11 13 70 76 18 27 2.0 316 018-'-1130AOO- 5-10-60 900 12 12 10 B3 IB 26 2.1 338 0
1B-5-1130AOO- 7-11-62 900 11 12 84 18 29 338 0(8-5-1) 30AOO- 7-12-63 900 13 11 79 19 30 335 018-5-1l30AOO- 7-21-64 900 11 11 75 19 29 332 0IB-5-1l30AOO- 7-22-66 900 13 20 50 76 25 75 450 0IB-'-1130AOO- 7-19-67 900 12 11 20 7' 20 35 348 0
44

01 SS- 01 SS- NON- SPECI-DLVED OLVED CAR- F IC SODIUM
CHLD- FLUD- SOLIDS SOLIDS HARD- BONATE COND- AD-
SULFA TE RI DE RIDE NITRATE BORON fRESI- 1 SUM OF NESS HARO- UCTANCE SORP- SOURCE
IS041 fCLl I F I (N031 fBI DUE AT CONSTI- (CA,MG) NESS ( MICRO- PH TlON OF
I MG/Ll f MG/LI I MGI Ll I MG/ll (~GIL I IBo C I TUENTSI (MG/LI 1MG/Ll MHOS) RATIO DATA
24 19 225 117 9 411 .6
21 18 274 266 66 4B4 8.0 .5
1.5 20 .3 .1 30 216 156 0 368 8.0 .6
28 21 .1 3.3 321 252 16 520 7.8 .6
35 19 .1 302 325 258 22 552 7.6 .5
32 18 .1 4.7 314 251 23 521 7.7 .5
30 18 .1 2.2 322 260 17 556 7.5 .5
25 20 .2 4.8 371 2H 0 620 7.6 1.4
31 18 .4 5.0 317 254 24 536 7.7 .634 18 .1 4.3 318 266 38 533 7.5 .4
36 17 .1 2.6 322 260 22 545 7.4 .531 17 .1 2.8 310 252 22 526 7.4 .5
26 17 .1 2.4 304 247 15 557 8.0 .5
34 14 .1 2.8 312 248 13 512 7.5 .5
37 16 .1 2.2 317 250 20 H3 7.5 .5
34 17 .1 4.7 293 250 24 532 7.4 .532 19 .0 3.4 300 241 15 529 7.8 .6
33 18 .0 3.7 299 244 18 524 7.7 .638 17 .1 1.8 300 254 31 526 7.8 .4
33 17 .2 2.9 305 256 31 525 7.8 .4
31 21 .2 2.4 309 248 IB 526 7.6 .634 19 .2 4.1 308 255 22 535 7.7 .631 20 .3 .4 314 291 56 535 7.7 .137 20 .1 4.2 348 279 25 587 7.4 .539 18 .1 4.8 349 284 28 593 7.5 .5
36 20 .2 4.3 355 272 10 597 7.4 .637 19 .1 4.3 351 276 16 589 7.4 .638 18 .1 2.9 346 276 20 606 7.4 .641 19 .1 401 347 281 31 577 7.4 .537 17 .1 2.2 336 270 22 574 7.4 .6
34 16 .1 2.2 329 261 15 555 7.2 .63B 16 .1 3.2 324 258 1B 562 7.9 .536 14 .1 2.9 325 260 15 541 7.5 .536 17 .2 2.8 328 260 18 553 7.5 .540 18 .1 2.9 317 270 27 570 7.4 .5
36 19 .0 2.6 324 259 IB 569 7.3 .636 18 .1 3.3 323 260 18 569 7.6 .644 16 .1 1.6 331 276 32 572 7.8 .538 17 .2 2.5 325 275 32 564 7.6 .436 20 .2 101 345 276 20 566 7.8 .6
36 20 .2 3.0 332 276 23 577 7.7 .534 12 .4 .1 342 278 15 577 7.7 .531 19 .4 .8 336 260 4 576 7.7 .733 20 .1 .5 341 265 4 585 7.5 .633 20 .1 .6 351 270 3 584 7.5 .6
32 20 .1 .7 337 265 10 5B2 7.5 .633 20 .1 .9 342 272 14 579 7.B .634 19 .0 .9 339 269 11 5B3 7.4 .634 21 .1 .5 348 276 15 596 7.4 .635 22 .1 1.4 369 274 0 623 7.4 .8
31 20 .1 .8 353 273 2 600 7.2 .736 19 .1 1.6 345 269 8 599 801 .635 18 .1 1.5 359 266 0 586 7.4 .836 18 .2 .2 339 269 12 577 7.6 .636 18 1.1 319 252 13 551 7.B .7
34 20 .7 326 252 6 581 7.4 .831 17 .2 203 307 257 26 537 7.6 .432 20 .2 2.0 309 244 8 530 7.7 .732 IB .1 3.8 319 250 15 537 7.7 .6
74 180 22 614 1.8
73 190 60420 236 0 5B7 1.1
20 24 .2 2.7 330 238 0 564 1.117 30 .1 4.2 376 266 0 653 7.3 1.112 46 .4 1.1 480 283 0 178 7.6 1.8
28 20 .3 3.0 335 260 0 560 7.4 .524 24 .1 3.7 349 266 0 589 7.5 .728 24 .1 6.1 339 262 0 576 7.5 .629 21 .1 5.1 330 262 19 565 7.8 .629 20 .0 6.4 328 259 15 569 7.5 .6
5.4 55 .2 .4 531 316 0 89B 7.4 2.015 44 .1 5.5 484 296 0 809 7.4 1.714 39 .1 3.3 446 286 0 744 7.8 1.531 22 .1 5.1 349 266 7 600 8.0 .732 21 .1 .4 361 280 3 609 7.6 .7
35 20 .5 366 283 6 623 7.5 .731 22 .1 .6 358 273 0 609 7.6 .829 20 .0 1.3 348 268 0 581 7.7 .828 36 1.4 484 291 0 804 7.7 1.928 23 .4 01 364 272 0 608 7.8 .9
45
Table 2.-Continued.
SODIUMDI ss- MAG- PD- PLUS
DEPTH llLVED CAL- NE- TAS- POTAS- BICAR- CAR-
OAT F OF TEMP- S IUCA IRON GlUM STUM SODIUM SlUM SlUM 80NAT E BONATE
LOCal NUMBER CF WELL ERA1URF 1 S 1021 1 FE I 1CA I 1MGI 1NA I IKI INA+K 1 IHC031 IC031
SA~PlE 1FT. I 10EG C I 1MG/LI (~G/L ) 1MG III 1MG III 1MGI Ll 1MG/Ll IMG/LI I MG/l I I MGIL I
18-S-1130AOO- 7-22-68 qOO 13 28 20 14 28 122 SBO 0
1E\-S-1130ADD- 7-31-69 qOO IS II 75 21 20 304 0
18-S-lI31BAA- 4- -64 IUl7 46 3.6 B6 3.1 24q 21
18-S-lIBBAA- 4- -64 II U7 48 S.6 76 2.3 2S2 16
(R-Cj-l) ~3BAA- 4-25-64 liB 7 45 16 16 1.6 171 7
IA-S-lI33AAA- 4-28-64 1187 52 18 16 1.6 187 q
18-S-I)31COA- q- 1-49 730 12 24 100 49 15 37 282 0
I B-5-1 1 33CDA- 10- 4-51 730 11 22 160 51 16 36 8.2 298 0
1A-5-II31COA- 4-14-52 730 12 22 20 50 17 33 5.6 292 0
IA-5-1I33COA- 8-14-'13 730 13 22 80 54 18 35 6.6 303 0
18-5-1133COA- 8-31-54 730 12 12 70 55 Iq 36 5.8 301 0
16-5-1) 33COA- 4- 5-'56 130 23 30 55 18 35 6.4 2q7 0
1B-5-1133COA- 5- 7-57 730 12 21 130 58 16 37 6.4 308 0
IB-5-1)33CCA- 5-22-58 730 12 22 qO 55 IA 35 5.6 307 0
tR-5-1l33CDA- 4-29-59 130 23 30 57 Iq 35 7.6 322 0
IR-5-1)33CDA- 5-12-60 730 12 23 40 60 18 36 7.1 327 0
I B-S-lI33CDA- 7-11-6l 730 II 22 69 17 41 332 0
IB-5-1133COA- 7-11-63 730 14 22 62 19 42 328 0
1B-5-11 BCOA- 7-14-64 730 19 21 61 19 38 334 0
I B-<j-lI33CCA- 6-29-65 730 16 22 63 21 35 325 3
1A-5-I)BCOA- 7-20-66 730 18 20 40 62 22 39 340
1B-5-1)31COA- 7-11-67 730 13 19 10 64 18 42 336
IB-5-1133COA- 7-12-68 730 18 21 10 53 24 42 336
IB-5-1133CDA- 7-23-6q 730 19 22 60 22 38 348
IA-5-21 1000- 4- 2-43 527 18 20 50 17 30 3.7 213
(fl,-5-2) 1000- 9-11-50 527 21 230 49 15 31 8.0 272
IA-5-21 1000- 5-27-52 527 18 60 54 17 30 5.3 278
I f\-"t-21 IOCD- 10- 8-58 527 15 10 66 15 20 234 0
IA-5-21 1000- 11-17-59 527 10 8.2 75 21 28 274 0
IA-5-21 1000- 6-0B-60 527 14 8.3 67 17 20 218 10
18-5-21 1000- 11-16-60 527 10 7.9 82 19 28 2.3 280 0( 6-")-2) JAAB- 11- 5-65 340 45 13 26 3.9 232 0
18-5-2) 5ACB- 8-;s0-68 ql4 22 24 46 2.4 139 7.6 190 0
(8-5-2) 5800- 8-29-68 15 192 0(6-5-2) 6800- 3- 5-54 304 32 37 14 36 8.2 254
IB-S-21 6BOO- 1Z-tO-58 304 16 33 2BO 38 16 45 282 0
IB-S-21 6BOO- 11-17-59 304 16 25 38 15 42 274 0
IB-5-21 6800- 11-16-60 304 16 29 40 38 15 3. 6.7 268 0
18-5-21 6800- 8-29-68 609 19 16 36 9.7 23 3.1 190 0
18-5-21 6BOO- 9- 9-69 609 19 192 0
IB-5-21 6BDD- 4 8-Z9-68 303 16 254IB-5-21 6BOO- 4 9- 9-69 303 16 26218-5-2) 70A8- 3 8-29-6B 1005 22 18 12 3.9 74 1.5 20818-5-21 7DCA- I 3- 5-54 688 20 38 II 19 2.7 190IB-5-2) 70CA- 1 1-12- 59 oBB 19 20 41 12 22 196 0
18-5-21 70C8- 11-IB-59 688 16 40 12 22 191 0I B-5-2) 70CB- CJ- 4-68 688 17 190 0(A-5-2 I 100RC- li- S-54 120 3B 29 55 92 25 470 44I B-5-211 008C- 1-12-59 120 14 36 35 65 96 5BO 0IB-5-2)100BC- 3-25-59 120 13 31 34 65 9q 580 0
IB-5-2)lODAC- 7- 8-'59 120 13 35 33 63 76 472 0(B-5-Z)lOOBC- 9-ZQ-66 120 13 5. ~6B 0IB-5-2121000- 11-18-6B 110 12 31 46 49 130 524 0IB-5-212288A- 10- 1-68 120 13 33 10 57 107 21 536 0I B-5-213200[)- 3-16-'56 B7I 15 27 24 51 23B
18-5-2 I 32000- 1-12-5q 871 16 17 49 14 21 224 0IB-5-2132000- 11-18-5q 871 16 16 47 13 21 216 0IB-5-21320CD- 1- 5-61 B7I 15 18 48 13 19 1.7 215 0IB-5-31110AO- S-14-M 525 20 18 39 II 21 2.0 193 0IB-5-3)15AAA- 5-14-69 657 24 133 0
(8-5-3) 1 SODA- 5-14-69 649 24 163 0(8-5-3125AOC- '5-14-69 616 16 15 45 14 16 1.7 203 0IB-5-31250CO- 5-14-69 520 15 126 0IB-'5-3136ADA- 8-30-6B 460 14 18 38 14 24 2.0 218 018-'5-3)36DAD- 5-05-6Q 785 17 Iq 40 12 21 2.3 202 0
(Po-')-4121CBO- 11- ~-64 140 19 12 184 80 1140 60 112 0(Po-5-4)21CBB- 11- 2-64 172 20 7.8 146 68 990 56 132 0(11-6-1 ) 4AOA- 9-10-69 69 II 12 57 25 13 271 01 B-6-11 48AO- 6- 5-67 1133 29 12 10 1.6 145 0IB-6-11 4BBD- 6- 6-61 1133 29 II 10 1.2 143 0
( P,-6-11 4BAO- 6-21-67 11 33 23 9.5 30 1.6 129 131B-6-11 4AAD- 9-19-67 liB 15 9.4 4.6 25 6.6 75 518-6-1 I 4880- 11-20-67 1133 28 8.8 12 1.2 144 018-6-11 48eo- 11-21-67 1133 29 7.4 14 1.2 146 018-6-11 4BBD- 11-22-67 1133 28 8.0 14 1.2 141 2
IB-6-11 4BOO- 11-23-67 1133 30 6.1 14 1.2 142 21B-6-11 4880- 11-24-67 1133 28 6.8 14 1.2 146 0
IB-6-11 4BAO- 8-26-68!2!1133 16 148 018-6-1) 4B80- B-26-6B~/1I33 161B-6-11 4BBO- B-27-68 1133 16
46

01 SS- 01 SS- NON- S PEC 1-oLVED oLVEo CAR- FIC SODIUM
CHLO- FLUo- SOLlOS SOLIDS HARO- BONATE CONO- AO-
SULFATE RI DE RI DE NITRATE BORON I RES 1- ISUM OF NESS HARo- UCTANCE SORP- SOURCE
IS041 1Cll 1F' I N031 ( BI DuE AT CONSTI- (CA,MG) NE SS IMICRO- PH TlON OF
IMG/lI 1MG/lI ( MG/lI 1~G/LI luG/L' IBO C I TUENTSI I MG/lI I MG/lI MHOS) RAT 10 DATA
3.8 54 .4 7.4 604 298 a 9B7 7.8 3.1
34 20 .5 333 271 22 565 7.B .5
51 21 392 131 a 568 8.5 3.3
44 22 360 142 0 538 B.4 2.B
36 18 228 177 25 406 8.3 .5
46 18 246 203 35 439 B.4 .5
.9 22 .4 .1 287 184 a 4B1 7.5 1.2
1.6 22 .1 .1 304 193 a 500 1.6 101
2.2 24 .2 1.1 300 195 0 509 1.4 1.0
3.4 24 .2 2.2 315 208 0 532 7.5 1.0
6.4 26 .1 5.0 324 215 a 531 101 1.1
5.8 24 .1 5.5 319 211 a 536 7.3 1.0
6.0 24 .1 .5 319 206 a 539 7.1 1.\
9.0 24 .1 .9 321 212 a 571 8.0 1.0
8.3 22 .1 .9 333 220 a 547 7.5 1.0
1.4 25 .2 .3 338 224 a 566 1.1 1.0
19 24 .1 6.3 342 243 a 602 7.6 101
13 25 .0 6.2 345 232 a 604 7.3 1.2
II 19 .2 1.1 336 231 0 572 7.7 1.1
15 22 .1 5.\ 348 246 a 586 8.4 1.0
8.2 24 .3 6.1 345 243 a 600 7.5 1.\
1.5 26 .2 4.5 345 232 a 519 7.6 1.2
4.5 26 .2 7.5 340 232 a 579 1.6 1.2
2.2 26 .2 .8 347 242 a 586 1.7 1.1
7.4 23 .1 .1 276 195 a 412 .9
7.7 23 .2 .0 279 184 a 479 1.0
13 20 .1 .4 297 204 a 510 .9
42 24 .5 292 226 34 510 7.6 .6
55 34 1.2 351 271 46 631 7.8 .7
48 23 .2 300 235 40 503 B.5 .3
62 3B .2 01 37B 2B4 54 62B 7.9 .1
10 19 225 167 a 427 1.9 .9
1.5 205 .4 .5 240 509 126 a 939 7.7 5.4
II 125 a 366 7.B20 .0 .B 276 14B a 459 1.3
.0 IB .2 289 159 a 411 7.8 1.5
.8 16 .2 212 156 a 465 7.6 1.5
2.7 19 .3 .2 219 159 a 452 7.9 1.2
8.2 18 .3 .8 40 206 130 a 359 B. I .9
17 134 a 362 1.8
20 154 a 445 7.818 144 a 444 7.8
1.5 26 .3 .2 lOa 238 46 a 391 8.0 4.13.8 18 203 141 a 382 .1
17 16 .2 224 154 a 378 1.8 .8
18 16 .\ 218 151 a 377 1.9 .820 162 6 372 7.9
1.4 85 .3 .6 564 296 a 1050 2.3.0 63 .4 580 356 a 1020 7.6 2.2
1.0 65 01 582 352 a 1020 1.1 2.3
4.1 64 31 539 342 0 963 1.9 1.81.4 72 311 0 1020 1.2 '.3I.B '05 23 643 316 a 1090 B.O 3.21.0 12 .5 .4 320 552 260 a 981 8.0 2.9
55 16 .3 .9 290 166 a 1.1
13 19 .6 244 118 a 419 1.8 .113 18 .6 235 171 a 411 1.7 .112 18 .2 .1 236 113 a 403 1.8 .6
II 16 .2 .2 60 216 142 a 360 8.0 .830 16 a 391 7.5
29 84 a 382 1.111 18 .2 .4 50 240 168 2 389 8.0 .5
22 136 33 363 1.31.2 18 .1 2.0 50 222 152 a 382 8.0 .88.5 18 .2 .4 50 228 150 a 371 8.0 .1
.0 2240 .1 11 4360 790 698 6810 1.5 18 I
.0 1930 1.1 801 3600 645 531 5110 1.4 11 132 13 1.2 286 246 24 486 1.8 .4 I17 1. B 136 123 4 249 8.0 .4 811 6.4 134 120 3 249 8.1 .4 8
24 7.8 202 96 a 269 8.1 1.419 12 138 42 0 194 8.5 1.16.2 7.1 137 106 12 245 8.2 .54.8 1.4 141 102 0 248 8.0 .65.3 1.8 140 104 15 246 8.3 .6
4.8 1.1 141 101 247 8.3 .61.0 7.1 141 98 247 8.2 .6
10 112 243 7.8244243
47

Table 2.-Continued.
LOCAL NUMBER
IB-6-11 4BBOI B-6-1 I 5CGBI B-6-1) 60A1B-6-1) 6CAAIB-6-11 6CAA-
IB-6-11 60AIB-6-11 60A16-6-11 6CAAI B-6-11 6CAA16-6-11 70AO-
16-6-1129C66t 6-6-2) 5ACBI B-6-21 5 ACBe8-6-2) 5AeB16-6-21 5ACB-
«8-6-2) 5ACB16-6-21 5 ACBIB-6-21110AO16-6-21110AOIB-6-2)110AO-
I B-6-2111 OAO18-6-2) 11 DADI B-6-2) 20COOI B-6-2 120COO16-6-2 I 25CCC-
16-6-2 I 25CCC16-6-2 I 25CCCIB-6-2125CCCt B-6-2125CCCIB-6-2127BBA-
16-6-212766A16-6-2127B6A16-6-212766A16-6-212766AIB-6-2)270CO-
16-6-21270CO16-6-2 I 210CO(6-6-2 I 270CO16-6-2 1210CO16-6-2) 270CO-
IB-6-2)270CO16-6-21306AA16-6-2) 3300C16-6-31 40A618-6-3) 5CCC-
16-6-3110AC616-6-31128CCt 6-6-31140CC16-6-3119AA6(8-6-3119AA6-
( 6-6-31 19A46C8-6-3) 19ABC16-6-3119A6C(8-6-3)1948C16-6-3119A6C-
16-6-3) 19A8C16-6-3) 19A8C(6-6-3119A8C16-6-3119A8C18-6-3119ABC-
(6-6-3) 19A8C18-6-3119A8CIB-6-3)22AAA18-6-3126888IB-1-112qOOC-
I B-1-1 12900C- 4(8-7-1)300(A- 1(B-1-1)31808- 118-7-113160B- 1IB-1-1131BOB- 1
(8-7-l)31BOB- 118-1-1131B08- 1I B-7-1132AOA- 416-7-1)330BO- 218-7-1133080- 2
16-7-11330BOI B-7-21 2CBA16-7-21 2C8A18-7-21 2C6D16-7-21 3DAD-
DATEOF
SAMPLE
B-2B-6B8-30-6B4-14-432-24-56
10- B-5B
11-17-5910-16-64
B-16-657-25-68
10- 2-68
12-27-603- 4-54
10- 9-5811- 4-5910-19-64
q-29-667-26-6B1-13-55
10- 8-5B11- 4-59
11- 8-6010- 2-6811-21-683-12-105-13-43
11- 4-5811-18-5q5-14-43
11- 4-581-14-55
11- 4-5811-18-5911-28-609- 9-69
10- 1-54
11- 4-5811-18-5q10-21-648-13-65q-2q-66
7-25-6811-21-685- 7-69
10- 9-685-14-69
5-14-6q5-14-698-28-68
12-10-5811- 5-5q
11-16-607-26-55
11- 3-5510- 9-5811- 5-5q
11-16-6010-21-648-13-65q-2q-66
10- q-58
11- 5-5q11-16-6010- q-688-28-688-27-68
8- 7-618- ..... 7-683- 2-54
10- 1-5811- 3-5q
11- 8-6010- 2-688-27-68
11-30-6012- 1-60
12-22-6011-20-689- 9-698-n-68
10- B-58
DEPTHOF
WELL1 FT.I
11331000640640640
640640640640408
842850850850850
850850285285285
2852855405406qO
6qO6qO302302536
536536536536625
625625625625625
625532682540510
75255060422922q
22q220220220220
220220220220295
2952q5300512245
944180482482482
482482
60636636
636342342330100
TEMPERATURE10EG C)
1618
16
1615171516
24
11161q
2018
13
131316
22
2020
16
17111719
2020182122
2018202125
2218111722
19
1918
1816lq1819
1818
1812
15
1613
131612
77
1213141213
SILICA1510211MGILI
16
20
181q
20
24202022
1716
18
21
2218
2021
24211q
22
21lq2119
1725
1920194035
34
172320
2124
32
29332118
211916
18
131215
48
DISSOLVED
IRON1FE)
I"G/Ll
60
20
10
10
20
10
10
CALCIUMI CA I
I MGILI
30323234
3231
29
q6111q1q17
151514
15
33
118
181180
343695
959596
40
40423q41
424.0
8.01420
104q6
1037.4.0
9.68.8
8.87.0
42
4041151q
44
354140
39
332q
33
113240
MAGNE
51 UMIMGl
I MGILI
1110108.5
8.89.1
11
315.24.q5.86.1
3.12.42.q
8.3
43
4442111121
222322
12101211
123.4
2.95.8q.2
1118
184.0
113.93.4
5.44.q
7.8
7.89.29.29.2
8.9
8.16.86.8
8.8
1211
12
3.96.87.8
SODIUM1NA)
1MGILl
11
62
47690
134
142
94
q)
37
197
15q79
336114
III
201
47
15
11
10
9.011
6.4
POlASSlUMIKI
I MGILI
2.3
17
412.3
30
28
15
14
3.q
4.8
2.73.4
8.29.0
6.6
5.5
3.0
1.2
.8
1.5
2.02.0
.8
SODIUMPLUS
POTASSIUM
INA+K IIMG/LI
14
13
141511
n8qq4
156161
36
233
232231
6568
105104
Jq
413q42
20
41332340
125123117
114116
210
226
63
1111
321021
BICARBONATEI HC031IMG/ll
166146156159
161161158160206
150271270212276
2662742q5308313
3023021q5202112
16716332233618q
19318q182200111
1961q3InlqO193
1qa
In502lq6
324240lqa146146
1572792qO284283
282285272212182
1801122181qO191
154193162164165
168161203152145
154
142132181
CARBONATEIC031IMG/ll
o12
ooooo
ooo
oo
oo
oooo
oooo
oooo
11
ooooo
o
ooo
ooooo
3oo
ooooo
oooooqo
ooooo
ooo

01 SS- 01 SS- NON- SPfCI-oLVEo OLVEo CAR- FIC SODIUM
CHLO- FLUo- SOLIDS SOLIDS HARo- 80NA TE CONo- AO-
SULFA TE RI DE RI DE NITRATE RORON IRESI- (SUM OF NESS HARO- UCTONCE SORP- SOURCE
IS041 ICLl IF 1 ( N031 181 OUE AT CONST!- (CA,MG) NESS IMICRO- PH TIoN OF
I MG/Ll I MG/Ll I MGI Ll I MG/LI I~G/L I 180 C 1 TUENTS) I MG/LI I MG/Ll MHOS) RAT 10 OATO
242
6.5 8.5 .1 .T 30 154 122 265 7.9 .4
4.0 6.0 .2 .3 121 262 .6
5.8 9.6 175 121 275 .4
6.0 7.5 .6 168 119 269 7.8 .5
6.0 5.5 .5 164 116 0 272 7.9 .6
5.4 6.6 .0 156 115 0 266 1.7 .64.9 5.3 167 118 0 269 7.8 .4
119 0 269 7.61.2 81 .3 .2 110 315 118 0 582 7.9 2.5
8.2 897 1760 367 236 3150 111.4 30 .4 1.5 306 65 0 507 4.82.7 30 .3 302 68 0 492 7.9 4.82.3 28 1.5 300 72 0 493 8.1 4.63.1 30 .2 292 68 0 477 8.1 5.0
29 69 0 495 7.86" 0 49~ 7.6
16 87 .5 ~42 51 0 754 8.22.9 93 .6 438 48 0 163 7.7 9.82.7 96 1.0 44" 46 0 774 7.7 10
2.1 99 .7 1.6 459 50 771 7.9 8.7100 62 776 8.0
3.2 21 1.0 215 116 352 7.9 1.421 359 8.0
.0 700 .2 1240 621 480 2400 4.0
.2 710 .5 1270 634 497 H40 7.5 4.03.7 100 .3 1260 622 ~88 2440 7.3 4.0.0 22 .2 .I 297 155 0 533 2.3.6 24 .3 331 162 0 558 7.7 2.3
1.9 276 682 325 110 1110 2.3
3.3 278 3.4 626 328 110 1180 7.6 2.56.2 280 .2 622 330 175 1200 7.3 2.53.1 215 .1 3.1 612 332 183 11 70 7.9 2.2
215 316 152 1190 7.86.7 49 .0 .1 260 137 0 453 1.4
7.6 48 .8 264 151 0 455 7.9 1.49.1 48 .4 266 147 0 459 7.8 1.58.0 44 .3 248 148 0 428 8.0 1.49.1 51 .1 245 146 0 446 8.0 1.5
44 152 0 451 7.4
148 H6 7.5355
9.5 18 .0 216 154 0 377 7.7 .74.2 28 2.0 .9 100 531 24 0 816 8.0 11
44 46 0 648 7.7
1.2 84 .6 .4 400 453 32 0 141 8.0 121.8 28 .3 .3 210 275 60 0 446 7.9 4.4
.2 20 .1 220 88 0 351 7.9 2.2
.0 660 .4 1.5 1230 330 210 2330 7.3 7.918 645 10 1230 316 196 2290 7.5 8.3
2.3 650 .6 .9 1230 328 199 2290 7.4 8.0 16.6 41 .0 337 3' 0 574 8.4 8
14 39 .8 1.0 348 38 0 8.8 31.4 52 .4 353 40 0 588 7.8 8.5 12.3 37 4.5 332 36 0 551 7.8 8.5 1
1.6 38 .6 4.3 337 44 0 538 8.2 7.3.4 35 3.0 321 38 0 517 7.7 8.1
7.0 42 371 37 0 562 7.7 8.343 38 0 565 1.5
3.7 310 1.9 696 136 0 1270 7.5 7.8
23 318 4.2 737 132 0 1290 1.7 8.63.3 310 .7 5.1 700 140 0 1270 7.5 7.63.2 20 3.4 240 16 0 386 1.6 3.1.8 22 .4 .4 110 210 86 0 354 7.8 2.2
9.0 156 0 311 7.7
18 13 212 146 5 327 8.5 .512 156 0 322 7.8
4." 9.6 .0 1.3 177 105 0 296 .57.6 8.0 1.3 176 130 0 288 7.8 .43.9 7.2 1.2 167 127 0 281 7.5 .4
7.6 7.5 .1 1.9 177 134 0 283 7.6 .~
12 126 0 272 7.610 161 0 340 7.7
16 8.5 160 132 7 267 .213 8.5 155 118 0 258 .3
10 6.0 132 132 272 .2239
.5 7.2 .0 157 58 0 234 7.6 1.88.2 9.0 .8 124 108 0 219 7.8 .47.0 12 4.3 196 131 0 323 7.4 .8
49
Table 2.-Continued.
SODIUMDISS- MAG- PO- PLUS
DEPTH OLVED CAL- NE- TAS- POTAS- 8ICAR- CAR-
DATE OF TEMP- SILICA IRON CIUM SlUM SODIUM SlUM SlUM 80NATE 80NATE
LOCAL NUM8ER OF WELL ERATURE ISI021 IFEI ICAI IMGI INAI IKI INA+KI IHC031 IC031
SAMPLE IFT.I 10EG CI IMG/L I I~G/LI 1MGILI IMG/LI IMG/LI 1MG/LI 1MGILI IMG/LI 1MGILI
18-7-21 30AO- 11- 3-59 100 12 12 41 7.8 17 180 018-7-21 30AO- 11-16-60 100 12 13 90 42 8.0 12 5.0 182 018-7-21 30AO- 8-29-68 100 1618-7-21 9AA8- 5- 7-69 225 15 18 9.6 4.9 140 14 311 018-7-2110080- 11-20-68 782 24 16 15 10 216 169 0
18-7-2116C88- 5- 6-69 16 34 19 10 840 452 018-1-21160AO- 5- 7-69 1021 24 61 18 1.5 90 219 0
18-7-21160CO- 5- 7-69 1176 25 28 21 4.4 49 6.8 193 0
18-7-21 160CD- 9- 9-69 1176 25 201 0
18-7-21200AA- 3- 4-54 150 13 22 480 12 9.6 238 34 418
18-7-21200AA- 10- 9-58 150 14 21 11 6.8 268 416 0
18-1-21200AA- 11- 4-59 150 13 24 10 1.8 265 412 0
18-7-21200AA- 10-19-64 150 13 25 10 9.1 269 416 0
18-1-21200AA- 8-16-65 150 13 258 333 32
18-7-2)200AA- 7-26-68 150 11 408 0
18-7-2121CAO- 10- 9-68 630 33 240 71 621 150 0( 8-7-2123080- 10- 2-68 315 17 22 34 10 35 4.5 193 0
18-7-21260AC- 10-19-64 510 18 50 30 7.9 52 248 0
18-7-21260AC- 8-12-65 510 18 51 35 1.1 45 242 0«B-7-2» 260AC- 9-29-66 510 18 249 0
18-1-2)28A88- 1 9-16-68 1618-7-21310AC- 2 4-11-50 524 27 96 '02 203 12418-7-21310AC- 2 5-21-504 524 32 97 39 193 15 15118-7-21310AC- 2 10- 9-58 524 17 28 99 38 208 158 018-7-21310AC- 2 11- 4-59 524 14 28 93 '" 201 158 0
18-1-2132888- 1 11-20-68 546 18 28 66 45 335 128 0(8-7-2132888- 1 9- 9-69 5'06 19 136 018-1-2) 32888- 2 11-20-68 840 1618-7-2134888- 1 9-20-61 660 37 13 126 4.1 176 1418-7-2134888- 2 10- 2-68 511 19 18 89 31 161 4.7 200 0
18-7-2134888- 5- 7-69 517 19 21 87 30 114 5.0 200 018-7-2134888- 9- 9-69 517 I. 192 018-7-3131AAC- 9-27-68 806 39 24 15 4.4 148 9.4 305 018-7-3131AAC- 5- 7-69 806 30 15 3.4 148 10 282 018-7-3131AAC- 9-10-69 920 38 67 27 5.4 323 571 0
18-7-3131A0C- 9- 5-68 712 34C8-1-3J31ADC- 5- 7-69 712 3418-7-3131AOC- 8-20-69 712 3518-7-3)310AA- 9- 5-68 412 2518-7-31310AA- 8-20-69 '012 25
18-7-31310AA- 2 9- 5-68 415 2518-7-31310AA- 2 8-20-69 415 2518-7-31310AA- 2 12-17-69 415 2 23 5.2 2.2 111 7.618-7-31310AA- 3 9- 5-68 575 3018-1-31310AA- 3 5- 7-69 575 30
18-7-31310AA- 3 8-20-69 575 3018-7-31310AA- 4 9- 5-68 717 3418-7-31310AA- 4 5- 7-69 717 3418-7-31310AA- 4 8-20-69 717 3418-7-3)310AA- 4 12-17-69 717 35 10 1.2 165 5.7 394
18-7-31310A8- 1 9- 5-68 590 3018-1-3)310AB- 1 5- 1-69 59018-7-31310A8- 1 8-20-69 590 3018-7-313IOA8- 1 12-17-69 590 44 14 1.9 151 7.6 33918-7-31310A8- 2 9- 5-68 710 34
18-1-313IOA8- 5- 7-69 710 34(8-7-3 J31DAB- 8-20-69 710 3'018-1-31310A8- 9- 5-68 105 3418-7-31310A8- 5- 1-69 705 3418-1-31310A8- 8-20-69 705 34
18-7-31310AC- 9- 5-68 621 3018-1-3)3IOAC- 5- 1-69 621 2918-7-31310AC- 8-20-69 621 3018-1-313100A- 9- 5-68 591 3018-7-313100A- 5- 7-69 597
18-7-313100A- 8-20-69 597 3018-7-313100A- 9-10-69 597 29 33 14 8.8 147 310 018-7-3132C88- 9- 5-68 717 3418-7-3132C88- 9- 4-68 711 34 36 8.0 5.8 145 6.5 308 018-1-3132C88- 8-20-69 711 34
(8-7-3) 32C88- 5- 7-69 711 H 38 20 3.9 181 316 018-7-3133COO- 5-26-5'0 399 27 6.8 2.9 139 9.0 37818-1-3133COO- 10- 9-58 399 19 26 10 3.9 83 232 018-1-3133COO- 11- 4-59 399 20 23 11 3.2 84 234 018-1-3133COO- 12- 2-60 399 20 24 50 10 3.9 76 8.0 228 0
18-7-3133COO- 5-14-69 399 20 25 9.6 4.4 75 8.2 225 018-8-21268CO- 9- 9-69 118 13 12 59 '" 13 232 018-8-2) 26CAC- 10- 8-58 235 14 15 31 7.3 26 152 018-8-2126CAC- 11-17-59 235 14 14 30 7.3 23 14. 018-8-2126C4C- 11- 9-60 235 13 11 10 31 8.8 19 3.4 152 0
50

O[SS- 01 SS- NON- SPEC[-OLVEO OLVEO CAR- F[C SODIUM
CHLO- FLUO- SOLIDS SOLIDS HARO- BONATE CONO- AO-SULFATE RIOE RIOE NITRATE BORON fRES[- (SUM OF NESS HARD- UCTANCE SORP- SOURCE
(S04) (CLI (F I (N031 IBI DUE AT CONSTI- (CA,MGl NESS ( M[CRO- PH TlON OF( MG/LI IMG/LI (MG/LI (MG/lI (~G/L I 180 C I TUENTSI (MG/L) ( MG/LI MHOS) RAT 10 DATA
6.4 9.B 2.8 186 134 0 323 7.5 .68.2 9.0 .1 2.8 189 137 0 314 8.0 .4
326
1.0 80 .3 .4 160 431 44 0 713 8.0 9.2
8.5 390 .3 B66 228 89 1480 7.9 6.2
B.2 1090 .7 2220 90 0 3900 7.6 39
.8 12 .2 327 52 0 460 7.8 5.4
4.5 10 .5 .2 BO 221 70 0 333 7.B 2.59.0 66 0 329 7.6
1.2 205 .9 1.0 739 70 0 1290
3.7 20B 1.4 725 56 0 12BO 7.B 16.0 210 1.2 721 58 0 1270 7.5 15
1.6 217 .5 720 65 0 1240 7.9 141.0 204 712 55 0 1280 9.0 15
60 D 1270 7.5
.2 1500 .3 2860 890 767 4610 7.7 9.022 24 .5 .I 30 245 126 0 404 8.0 1.4
5.1 8.2 .3 256 108 0 379 8.0 2.26.4 7.3 .1 262 117 0 384 8.0 1.8
8.0 116 0 396 7.6
4670.3 534 .0 .1 1040 415 313 4.3
B.6 518 .4 1120 403 274 1940 4.25.8 510 1.4 968 404 274 1850 7.5 4.5.0 510 .B 958 400 270 IB60 7.5 4.5
1.5 6BO 13 1440 348 243 2360 7.5 7.8690 352 240 2350 7.8
129016 170 150 474 144 0 865 8.3 4.6
.5 398 .3 .1 130 914 34B 184 1560 7.9 3.9
.0 395 .3 .3 140 94B 340 176 1570 7.7 4.1407 366 209 1570
1.0 104 .7 .3 200 462 52 0 785 8.1 B.6.2 106 .6 .6 260 473 52 0 775 7.8 B.9.5 230 .2 980 90 0 1490 8.2 15
650625610580550
500480
24 1.0 .4 370 335 22 519 8.5 10725700
680650660660
.2 60 1.3 .2 340 4B8 31 751 7.7 13
710690660
.0 89 .9 .2 190 491 43 0 772 7.7 10690
7006706806BO630
7507506BO925660
760.8 96 .0 478 72 0 750 7.9 7.5
7001.2 87 .8 .3 60 458 44 0 713 7.8 9.5
810
.8 142 .2 539 66 0 914 7.9 9.74.3 31 .2 .1 413 29 0 653 II1.6 21 .3 260 42 0 421 7.8 5.5.0 21 .3 25B 40 0 424 7.7 5.7
1.4 23 .4 .3 259 42 0 409 7.5 5.1
I.B 22 .4 .3 210 263 42 0 416 8.0 5.033 7.7 .0 250 207 17 419 7.9 .418 13 2.8 188 108 0 298 7.8 1.116 10 2.1 175 104 0 301 7.6 1.018 12 .1 .5 179 114 0 297 7.B .8
51
Table 2.-Continued.
$1J[) Ill""DI ss- Mt\G- PtJ- PLUS
OEP TH OLVE'D Chl- ,,- TAS- POT A$- BICAR- eAR-OAT E OF TEMP- S Il leA I RliN CIUM SlUM SOD I UM SlUM SlUM RONA Tf BONATE
lOCAL ~U~Af:R OF \oIFLL ERAlURE IS IU2 I IFU I LA) I MG I INA) I KJ t NA+K) (HC03 J ( cn3)SAMPLE IF I • I IDEG C I (MG/l) IvG/l I I MGILI I MG III (MGI LI (/'lG/LI I MGI Ll (MG/ll IMG/l)
SPR I NGS
(B-4-3) 30DCD- slll/ 11-10-64 13 15 192 23 659 25 161 0(B-4-3) 33BCC- Sl18/ 11-10-64 17 25 71 22 182 7.5 191 0(8-4-3) 33BCC- S2!!! 11-10-64 17 31 143 24 332 11 168 0
1/'X/,./4/':"/r;/.,/~/§"/
1ll"/IT/IT/n/IT/IS/IT/IT/
lli
DEPTH OF SAMPLE COLLECTION; DEPTH OF WELL 425 FT"DEPTH OF SAMPLE COLLECTION ~ DEPTH OF WELL 205FT.ANALYSIS INCLUDES 0.03 MG/L ARSENIC.COLLECTED FROM SHALLOW AQUIFER AT A DEPTH OF 150-170 FT.COLLECTED AT 1700 HOURS.COLLECTED AT 1830 HOURS •ANALYSIS INCLUDES 0.00 MG/L ARSENIC AND 0.01 MG/L SELENIUM.ANALYSIS INCLUDES 0.01 MG/L ARSENIC AND D.Ol MG/L SELENIUM.ANALYSIS INCLUDES 0.00 MG/L ARSENIC AND 0.02 MG/L SELENIUM.CDLLECTED AT 1350 HOURS.COLLECTED AT 1420 HOURS.COLLECTED AT 1450 HOURS.COLLECTED AT 1520 HOURS.DEPTH OF SAMPLE COLLECTION, DEPTH OF WELL 900 FT.COLLECTED AT 0930 HOURS.COLLECTED AT 1440 HOURS.LADYFINGER SPRINGS; SAMPLE COLLECTED FROM POOL j DISCHARGE 1 GPM.DISCHARGE 4 GPM.ABOUT 200 FT SOUTH OF SPRING (B-4-3) 33BCC-Sl, DISCHARGE 5 GPM.
52

[) 1 ss- o [SS- NON- SPE::C 1-nl VF[1 Ul VFD CAR- FIC SODIUM
CHlC- fLUO- SOL IDS SOLIDS H.... RD- BONATE CCJND- AD-SUl F Arr- R [DE RIDE ~ ITR 1\ Tr ACR(lN {RF S J- (SUM OF NE SS HARO- UCTANCE SORP- SOURC E
{S041 I CLl IFl { 1\031 I AI DUE.: AT CONSTI- I CA, MG I NE SS (MI CRO- PH T IOfl.l DF(MG/LI I "GIL) I"CI Ll I"G/LI I ~G/ll 180 C I TUE"nS) I MGIl) I MG/ll MHOS) RflT In DAT A
SPR INGS
65 1280 .7 5.7 .16 2710 575 443 4200 7.6 1216 329 .4 2.5 .10 837 268 111 1350 7.6 4.837 708 .5 .8 .15 1600 456 318 2490 7.6 6.8
53

PUBLICATIONS OF THE UTAH DEPARTMENT OF NATURAL RESOURCES,
DIVISION OF WATER RIGHTS
(*)-Out of Print
TECHNICAL PUBLICATIONS
No. 1.
No. 2.
*No. 3.
*No. 4.
*No. 5.
Underground leakage from artesian wells in the Flowell area, near Fillmore, Utah, byPenn Livingston and G. B. Maxey, U. S. Geological Survey, 1944.
The Ogden Valley artesian reservoir, Weber County, Utah, by H. E. Thomas, U. S.Geological Survey, 1945.
Ground water in Pavant Valley, Millard County, Utah, by P. E. Dennis, G. B. Maxey,and H. E. Thomas, U. S. Geological Survey, 1946.
Ground water in Tooele Valley, Tooele County, Utah, by H. E. Thomas, U. S.Geological Survey, in Utah State Eng. 25th Bienn. Rept., p. 91-238, pis. 1-6, 1946.
Ground water in the East Shore area, Utah: Part I, Bountiful District, Davis County,Utah, by H. E. Thomas and W. B. Nelson, U. S. Geological Survey, in Utah State Eng.26th Bienn. Rept., p. 53-206, pis. 1-2, 1948.
*No. 6. Ground water in the Escalante Valley, Beaver, Iron, and Washington Counties, Utah,by P. F. Fix, W. B. Nelson, B. E. Lofgren, and R. G. Butler, U. S. Geological Survey, inUtah State Eng. 27th Bienn. Rept., p. 107-210, pis. 1-10, 1950.
No. 7.
*No. 8.
No. 8.
No. 9.
*No. 10.
*No. 11.
Status of development of selected ground-water basins in Utah, by H. E. Thomas,W. B. Nelson, B. E. Lofgren, and R. G. Butler, U. S. Geological Survey, 1952.
Consumptive use of water and irrigation requirements of crops in Utah, by C. O.Roskelly and Wayne D. Criddle, 1952.
(Revised) Consumptive use and water requirements for Utah, by W. D. Criddle, K.Harris, and L. S. Willardson, 1962.
Progress report on selected ground water basins in Utah, by H. A. Waite, W. B. Nelson,and others, U. S. Geological Survey, 1954.
A compilation of chemical quality data for ground and surface waters in Utah, by J. G.Connor, C. G. Mitchell, and others, U. S. Geological Survey, 1958.
Ground water in northern Utah Valley, Utah: A progress report for the period1948-63, by R. M. Cordova and Seymour Subitzky, U. S. Geological Survey, 1965.
No. 12. Reevaluation of the ground-water resources of Tooele Valley, Utah, by Joseph S.Gates, U. S. Geological Survey, 1965.
54

*No. 13. Ground-water resources of selected basins in southwestern Utah, by G. W. Sandberg,U. S. Geological Survey, 1966.
*No. 14. Water-resources appraisal of the Snake Valley area, Utah and Nevada, by J. W. Hoodand F. E. Rush, U. S. Geological Survey, 1966.
*No. 15. Water from bedrock in the Colorado Plateau of Utah, by R. D. Feltis, U. S. GeologicalSurvey, 1966.
No. 16. Ground-water conditions in Cedar Valley, Utah County, Utah, by R. D. Feltis, U. S.Geological Survey, 1967.
*No. 17. Ground-water resources of northern Juab Valley, Utah, by L. J. Bjorklund, U. S.Geological Su rvey, 1968.
No. 18. Hydrologic reconnaissance of Skull Valley, Tooele County, Utah, by J. W. Hood andK. M. Waddell, U. S. Geological Survey, 1968.
No. 19. An appraisal of the quality of surface water in the Sevier Lake basin, Utah, by D. C.Hahl and J. C. Mundorff, U. S. Geological Survey, 1968.
No. 20. Extensions of streamflow records in Utah, by J. K. Reid, L. E. Carroon, and G. E.Pyper, U. S. Geological Survey, 1969.
No. 21. Summary of maximum discharges in Utah streams, by G. L. Whitaker, U. S. GeologicalSurvey, 1969.
No. 22. Reconnaissance of the ground-water resources of the upper Fremont River valley,Wayne County, Utah, by L. J. Bjorklund, U. S. Geological Survey, 1969.
No. 23. Hydrologic reconnaissance of Rush Valley, Tooele County, Utah, by J. W. Hood, DonPrice, and K. M. Waddell, U. S. Geological Survey, 1969.
No. 24. Hydrologic reconnaissance of Deep Creek valley, Tooele and Juab Counties, Utah, andElko and White Pine Counties, Nevada, by J. W. Hood and K. M. Waddell, U. S.Geological Survey, 1969.
No. 25. Hydrologic reconnaissance of Curlew Valley, Utah and Idaho, by E. L. Boike and DonPrice, U. S. Geological Survey, 1969.
No. 26. Hydrologic reconnaissance of the Sink Valley area, Tooele and Box Elder Counties,Utah, by Don Price and E. L. Boike, U. S. Geological Survey, 1969.
No. 27. Water resources of the Heber-Kamas-Park City area, north-central Utah, by C. H.Baker, Jr., U. S. Geological Survey, 1970.
No. 28. Ground-water conditions in southern Utah Valley and Goshen Valley, Utah, by R.M.Cordova, U.S. Geological Survey, 1970.
55
No. 29. Hydrologic reconnaissance of Grouse Creek valley, Box Elder County, Utah, by J.W.Hood and Don Price, U.S. Geological Survey, 1970.
No. 30. Hydrologic reconnaissance of the Park Valley area, Box Elder County, Utah, by J.W.Hood, U.S. Geological Survey, 1971.
No. 31. Water resources of Salt Lake County, Utah, by Allen G. Hely, R.W. Mower, and C.Albert Harr, U.S. Geological Survey, 1971.
No. 32. Geology and water resources of the Spanish Valley area, Grand and San Juan Counties,Utah, by C.T. Sumsion, U.S. Geological Survey, 1971.
No. 33. Hydrologic reconnaissance of Hansel Valley and northern Rozel Flat, Box ElderCounty, Utah, by J.W. Hood, U.S. Geological Survey, 1971.
No. 34. Summary of water resources of Salt Lake County, Utah, by Allen G. Hely, R.w.Mower, and C. Albert Harr, U.S. Geological Survey, 1971.
WATER CIRCULARS
No.1. Ground water in the Jordan Valley, Salt Lake County, Utah, by Ted Arnow, U. S.Geological Survey, 1965.
No.2. Ground water in Tooele Valley, Utah, by J. S. Gates and O. A. Keller, U. S. GeologicalSurvey, 1970.
BASIC-DATA REPORTS
*No. 1. Records and water-level measurements of selected wells and chemical analyses ofground water, East Shore area, Davis, Weber, and Box Elder Counties, Utah, by R. E.Smith, U. S. Geological Survey, 1961.
*No. 2. Records of selected wells and springs, selected drillers' logs of wells, and chemicalanalyses of ground and surface waters, northern Utah Valley, Utah County, Utah, bySeymour Subitzky, U. S. Geological Survey, 1962.
*No. 3. Ground water data, central Sevier Valley, parts of Sanpete, Sevier, and Piute Counties,Utah, by C. H. Carpenter and R. A. Young, U. S. Geological Survey, 1963.
*No. 4. Selected hydrologic data, Jordan Valley, Salt Lake County, Utah, by I. W. Marine andDon Price, U. S. Geological Survey, 1963.
*No. 5. Selected hydrologic data, Pavant Valley, Millard County, Utah, by R. W. Mower, U. S.Geological Survey, 1963.
56
*No. 6. Ground-water data, parts of Washington, Iron, Beaver, and Millard Counties, Utah, byG. W. Sandberg, U. S. Geological Survey, 1963.
No.7. Selected hydrologic data, Tooele Valley, Tooele County, Utah, by J. S. Gates, U. S.Geological Survey, 1963.
No. 8. Selected hydrologic data, upper Sevier River basin, Utah, by C. H. Carpenter, G. B.Robinson, Jr., and L. J. Bjorklund, U. S. Geological Survey, 1964.
No.9. Ground-water data, Sevier Desert, Utah, by R. W. Mower and R. D. Feltis, U. S.Geological Survey, 1964.
* No. 10. Quality of surface water in the Sevier Lake basin, Utah, by D. C. Hahl and R. E.Cabell, U. S. Geological Survey, 1965.
*No. 11. Hydrologic and climatologic data, collected through 1964, Salt Lake County, Utah byW. V. lorns, R. W. Mower, and C. A. Horr, U. S. Geological Survey, 1966.
No. 12. Hydrologic and climatologic data, 1965, Salt Lake County, Utah, by W. V. lorns,R. W. Mower, and C. A. Horr, U. S. Geological Survey, 1966.
No. 13. Hydrologic and climatologic data, 1966, Salt Lake County, Utah, by A. G. Hely, R. W.Mower, and C. A. Horr, U. S. Geological Survey, 1967.
No. 14. Selected hydrologic data, San Pitch River drainage basin, Utah, by G. B. Robinson, Jr.,U. S. Geological Survey, 1968.
No. 15. Hydrologic and climatologic data, 1967, Salt Lake County, Utah, by A. G. Hely, R. W.Mower, and C. A. Horr, U. S. Geological Survey, 1968.
No. 16. Selected hydrologic data, southern Utah and Goshen Valleys, Utah, by R. M. Cordova,U. S. Geological Survey, 1969.
No. 17. Hydrologic and climatologic data, 1968, Salt Lake County, Utah, by A. G. Hely,R. W. Mower, and C. A. Horr, U. S. Geological Survey, 1969.
No. 18. Quality of surface water in the Bear River basin, Utah, Wyoming, and Idaho, by K. M.Waddell, U. S. Geological Survey, 1970.
No. 19. Daily water-temperature records for Utah streams, 1944-68, by G. L. Whitaker, U. S.Geological Survey, 1970.
No. 20. Water quality data for the Flaming Gorge area, Utah and Wyoming, R.J. Madison, U.S.Geological Survey, 1970.
No. 21. Selected hydrologic data, Cache Valley, Utah and Idaho, L.J. McGreevy and L.J.Bjorklund, U.S. Geological Survey, 1970.
57

INFORMATION BULLETINS
*No. 1. Plan of work for the Sevier River Basin (Sec. 6, P. L. 566), U. S. Department ofAgriculture, 1960.
*No. 2. Water production from oil wells in Utah, by Jerry Tuttle, Utah State Engineer's Office,1960.
*No. 3. Ground-water areas and well logs, central Sevier Valley, Utah, by R. A. Young, U. S.Geological Survey, 1960.
*No. 4. Ground-water investigations in Utah in 1960 and reports published by the U. S.Geological Surveyor the Utah State Engineer prior to 1960, by H. D. Goode, U. S.Geological Survey, 1960.
Relation of the deep and shallow artesian aquifers near Lynndyl, Utah, by R. W.Mower, U. S. Geological Survey, 1961.
Work outline and report outline for Sevier River basin survey, (Sec. 6, P.L. 566), U. S.Department of Agriculture, 1961.
Projected 1975 municipal water-use requirements, Weber County, Utah, by Utah StateEngineer's Office, 1962.
Developing ground water in the central Sevier Valley, Utah, by R. A. Young and C. H.Carpenter, U. S. Geological Survey, 1961.
Projected 1975 municipal water-use requirements, Davis County, Utah, by Utah StateEngineer's Office, 1962.
*No. 5.
*No. 6.
No. 7.
*No. 8.
No. 9.
*No. 10. Effects on the shallow artesian aquifer of withdrawing water from the deep artesianaquifer near Sugarville, Millard County, Utah, by R. W. Mower, U. S. GeologicalSu rvey, 1963.
No. 11. Amendments to plan of work and work outline for the Sevier River basin (Sec. 6, P.L.566), U. S. Department of Agricu Iture, 1964.
*No. 12. Test drilling in the upper Sevier River drainage basin, Garfield and Piute Counties,Utah, by R. D. Feltis and G. B. Robinson, Jr., U. S. Geological Survey, 1963.
*No. 13. Water requirements of lower Jordan River, Utah, by Karl Harris, Irrigation Engineer,Agricultural Research Service, Phoenix, Arizona, prepared under informal cooperationapproved by Mr. William W. Donnan, Chief, Southwest Branch (Riverside, California)Soil and Water Conservation Research Division, Agricultural Research Service,U.S.D.A., and by Wayne D. Criddle, State Engineer, State of Utah, Salt Lake City,Utah, 1964.
58

*No. 14. Consumptive use of water by native vegetation and irrigated crops in the Virgin Riverarea of Utah, by Wayne D. Criddle, Jay M. Bagley, R. Keith Higginson, and David W.Hendricks, through cooperation of Utah Agricultural Experiment Station, AgriculturalResearch Service, Soil and Water Conservation Branch, Western Soil and WaterManagement Section, Utah Water and Power Board, and Utah State Engineer, SaltLake City, Utah, 1964.
*No. 15. Ground-water conditions and related water-administration problems in Cedar CityValley, Iron County, Utah, February, 1966, by Jack A. Barnett and Francis T. Mayo,Utah State Engineer's Office.
*No. 16. Summary of water well drilling activities in Utah, 1960 through 1965, compiled byUtah State Engineer's Office, 1966.
No. 17. Bibliography of U. S. Geological Survey Water Resources Reports for Utah, compiledby Olive A. Keller, U. S. Geological Survey, 1966.
No. 18. The effect of pumping large-discharge wells on the ground-water reservoir in southernUtah Valley, Utah County, Utah, by R. M. Cordova and R. W. Mower, U. S. GeologicalSurvey 1967.
No. 19. Ground-water hydrology of southern Cache Valley, Utah, by L. P. Beer, 1967.
No. 20. Fluvial sediment in Utah, 1905-65, A data compilation by J. C. Mundorff, U. S.Geological Survey, 1968.
59