Embed Size (px)
Citation preview

THE PENSION STRUCTURE
Daniel M. Holland, associate professor of economics, School of Commerce, New York University1
I ntroduction
I t is only within the last generation that pensions have emerged as an important economic institution. Currently, annual payments on the order of $13 billion are being made to over 16.5 million beneficiaries (closer to something like 14.5 million, if account is taken of those receiving payments under more than one program ); in the aggregate, pension funds are growing at about $6 billion a year. These are substantial magnitudes, but even more impressive is the size pension programs appear likely to reach in the future.
For purposes of this paper, a broad definition of “pensions” is used. More specifically, the old-age retirement, disability, and survivorship features of the following programs are taken to be the components of what will be referred to as the pension structure: 2 Old-age, survivors, and disability insurance; railroad retirement; public assistance; Federal pensions and disability payments to veterans; retirement programs for governmental employees; and private pension plans.3 In 1940, less than $1.5 billion of payments were associated with these programs as compared with $12.6 billions in 1956. The growth in pension benefits has outstripped the growth in income. In 1940 they represented 1.7 percent of personal income; by 1956, the percentage was 3.9. Over this same period, a fivefold growth occurred in the number of people to whom (or for whom) benefits were paid, from about 3.3 million to 16.5 million. But some duplication is involved in these figures, because some individuals received payments under more than one program. A rough correction on this score would put the 1956 figure at about 14.5 million. Thus, it appears that by 1956 about 1 in 12 of our population was receiving benefit pay-
1 T h is p a p e r d ra w s on m a te r ia ls co llected fo r th e e x p lo ra to ry su rv ey o f th e econom ic effects o f p en sio n s u n d e r ta k e n by th e N a tio n a l B u re au o f E conom ic R esearch . I t is, how ever, a p u re ly p e rso n a l s ta te m e n t, s ince i t h a s n o t been su b jec ted to th e N a tio n a l B u re a u ’s u s u a l rev iew p ro ced u re . In p re p a r in g th is p a p e r I h a v e benefited fro m th e com m en ts o f J o h n J . C arro ll, C. H a r ry K ah n , R o b ert L am p m a n , a n d G lad y s W ebbink.
2 B y s tru c tu re , we do n o t m ean to su g g es t a s e t o f p ro g ram s consc iously a n d c a re fu lly fram e d in r e la t io n to one a n o th e r , b u t m ere ly th o se p ro g ram s th a t , w ho lly o r in good p a r t , a re a d d re sse d to th e sam e ty p e of need.
8 T h is d e fin itio n is b ro a d e r , p a r t ic u la r ly in i t s in c lu s io n o f som e ty p e s o f p u b lic a ss is tan c e , th a n w h a t is u su a lly co n sid e red to fa ll u n d e r th e ca teg o ry o f p ensions . T h e specific item s t h a t go in to th e to ta ls u sed h e re a n d in th e r e s t of th is p a p e r a re d e lin e a te d in th e n o te s to ta b le 1.
N e ith e r c o n ce p tu a lly n o r s ta t is t ic a l ly can a lin e be p rec ise ly d ra w n b e tw een p en sio n s a n d p a y m e n ts to m e e t o th e r k in d s of needs, since som e p ro g ram s t h a t p ro v id e re tir e m e n t ben efits a lso p ro v id e d is a b ility an d s u rv iv o rsh ip p ay m en ts, a n d in o th e rs th e d is a b ility p a y m e n ts a re c losely a k in to o ld-age benefits. F o r th e p u rp o se s a t h a n d h ere , no f u r th e r re fin e m en t in d e fin itio n is nece ssa ry .
O f th e p a y m e n ts m ade in 1956, u n d e r w h a t is considered to be th e p en sio n s t ru c tu re fo r p u rp o se s o f th is p a p e r a n d is su m m arized in ta b le 1 below , a b o u t 66 p e rc en t w e n t fo r o ld age, 18 p e rc e n t fo r su rv iv o rs , 16 p e rc e n t fo r d isab ility . B u t v e te ra n s ’ n onserv ice - co n n ec ted d isa b ility p a y m e n ts cou ld re a lly be consid e red to h av e a h eavy o ld-age com ponen t, an d t r a n s fe r r in g th em to th e o ld-age ca teg o ry w ould m ake th e p a y m e n ts fo r s u p p o r t in o ld age com prise a lm o s t 70 p e rc e n t o f th e to ta l .
985Digitized for FRASER http://fraser.stlouisfed.org/ Federal Reserve Bank of St. Louis

986 ECONOMIC GROWTH AND STABILITY
ments from at least one of the programs that make up what is here designated as the pension structure.
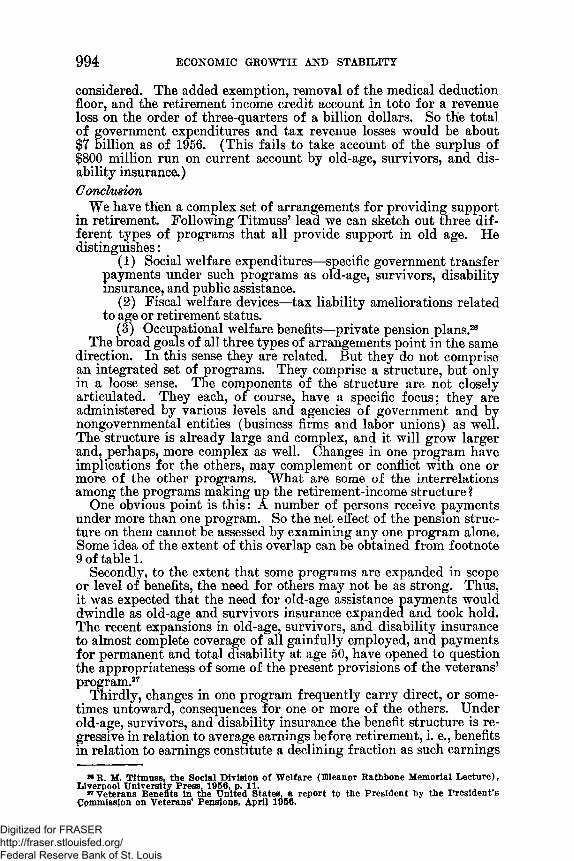
Not all the programs that make up this structure involve the accumulation of reserves, but, for those that do—private plans, old-age, survivors, and disability insurance, railroad retirement, and governmental employee pension plans—a very rapid increase in fund assets has occurred, from around $6 billion in 1940 to over $73 billion by 1956. During 1956 alone, reserves increased by $6.3 billion and represented about 28 percent of personal saving.4
The nature and current scale of pension-plan operations and their growth have been responsible for increasing interest in the effects pensions might have on such important economic variables as savings, investment, productivity and resource mobility, and the level of income and its distribution.
Only a few of the problems posed by pension are treated in this paper. More specifically, after a brief description of the pension structure, there will be a discussion o f :
(a) The effect of pension plans on saving.(b) The future size and burden of pensions.
A B r ie f V ie w of P e n s io n s a n d R elated P rograms
The pension structureWhile numerous specific factors help to explain the origin and
growth of each particular pension program, the development of all of them has been strongly influenced by two broad trends. One is demographic—on absolute and relative growth in the population age 65 or over, which increased from 3.1 million in 1900 to 14.1 million m 1955, from 4.1 percent of the population to 8.6 percent. By 1975, it is estimated that this age group will number 20.7 million and will constitute 9.3 percent of the population.5 More directly related to the need for income in retirement is the sharp increase over time in the average number of years spent in retirement due to the rise in life expectancy and the decline in the number of years that older persons, on average, spend in the labor force. In 1900, a 60-year-old working male had a life expectancy of 14.3 years and a labor force expectancy of 11.5 years, leaving 2.8 years in retirement. By 1955, the life expectancy had increased to 16.1 years and the number of additional years he could be expected to spend in the labor force had declined to 9.2, therefore, an expected duration of retirement of 6.9 years.6
The declining importance of agriculture and the growth of urbanization are additional demographic factors leading to an increased need for formal arrangements for providing support in nonworking old age.
The other trend referred to is the increase in the scope and functions of government. This can, of course, be traced back to 1900 or earlier,7
* Personal saving, as estimated by SEC and adjusted for comparability with the personal- saving Item of the Commerce Department’s National Income Accounts, and with the addition of Government insurance and pension reserves (Survey of Current Business, July 1957, p. 12).
* Bureau of Labor Statistics, Employment and Economic Status of Older Men and Women, Bulletin No. 1213, pp. 2, 3.
* Ibid., p. 34.7 Solomon Fabricant, assisted by Robert E. Upsey, The Trend of Government Activity
in the United States Since 1900, National Bureau of Economic Research, Inc., 1952, p. 140.
Digitized for FRASER http://fraser.stlouisfed.org/ Federal Reserve Bank of St. Louis

but the experience of the great depression accelerated the trend and heightened the community’s desire for income security.
The most important component of our pension structure—old-age, survivors, and disability insurance—was instituted in 1935.8 Continual extensions of old-age, survivors, and disability insurance have expanded the program to a point where a little more than 90 percent of the gainfully employed are covered or eligible for coverage. In1956 some 8.5 million persons received old-age, survivors, and disability benefits aggregating $5.7 billion.8 While not designed to accumulate an actuarial reserve, old-age, survivors, and disability insurance has over the past built up a reserve fund and is expected to continue to do so in the future. Investments by the fund are limited by law to Federal securities or securities guaranteed both as to principal and interest by the Federal Government. A t the end of 1956, the fund totaled $22.5 billion, having grown over the year by $850 million.10
The railroad retirement program, restricted to workers in the transportation industry was also instituted in 1935. In 1956 payments of $638 million were made to 649,000 recipients. Its reserve fund stood at $3.6 billion having grown by $79 million over the year.
While the history of private pension plans can be traced back to 1875, only recently have they become an important economic institution. A significant speeding up of their growth began with World W ar I I and has continued since. During the war some unions turned their attention to instituting or increasing existing private pensions (and other fringe benefits), since, among other reasons, direct wage increases were limited under the stabilization policy then in force. In many cases, moreover, employers looked on pensions as a device for attracting scarce workers and holding their labor supply. Quite likely, additional contributing factors were the high rates of corporate tax, and the provision introduced in the Internal Revenue Code of 1942 that the employer’s contributions to pension plans would be considered a deductible business expense only if the plans did not discriminate in favor of officers or certain selected personnel. High personal rates, too, made the postponement of tax liabilities associated with the pension alternative to cash wage increase desirable. (As a matter of fact, in a tax context pensions are most saliently viewed as a means of ironing out the lifetime earnings stream, pulling some income from high tax rate earning periods over to periods when lower rates would apply. In explaining the growth of pensions, this personal tax averaging may be more important than the deductibility of pensions from taxable income for corporate tax. For this latter fact alone does not explain a preference for pensions over cash wage increase which would also be deductible.) Later events—the inclusion of a pension program as part of the coal strike settlement in 1946, the Inland Steel case decision by the National Labor Relations Board in
ECONOMIC GROWTH AND STABILITY 987
8 Old-age insurance was introduced in 1935 ; provision for survivors were added in 1939; payments for permanent and total disability after age 50 were made part of the program in 1956, effective July 1, 1957.
& Not all of these payments were for retirement, however. About $4.4 billion, 77 percent of the total, went for old age ; the rest to survivors.
10 Over the 5 preceding years, annual fund accumulations were larger, typically near $2 billion. Over the next several years the fund may decline slightly as outpayments under the program exceed inpayments and fund earnings. But with the contribution rate for both employers and employees schedule to rise by one-half of 1 percent in I960, the fund can be expected to grow again.
Digitized for FRASER http://fraser.stlouisfed.org/ Federal Reserve Bank of St. Louis

1948 (confirmed by the Supreme Court in 1949) to the effect that pensions are a bargamable issue, and the Steel Industry Fact Finding Board’s recommendation in 1949 in favor of a pension program supported solely by employer contributions—all tended to accelerate this trend. As a consequence, private pensions have grown very rapidly particularly in the last decade.
Rough estimates prepared by Mrs. Weltha Van Eenam of the Social Security Administration for 1956 show 14 million workers covered by private plans, the number of beneficiaries (annuitants or equivalent) at 1,200,000, and benefit payments of $725 million. In 1940 only 3.7 million workers were covered. Another indication of the rapid growth of private pension programs is the fourfold increase in their reserve funds between 1947 and 1956—from about $7 billion to just under $29 billion. Between 1955 and 1956 alone, assets in private pensions funds increased by $3.6 billion.
The Federal Government’s participation together with the States in the public-assistance programs began in 1935. While no contractual relationship is involved, old-age assistance payments, aid to the blind, and to the permanently and totally disabled (instituted in 1950) are included in the pension total because they meet the same general sets of needs as pensions in the strict sense.11 In 1940 the major component of the pension structure, by 1956 these assistance payments had fallen substantially behind old-age, survivors, and disability insurance and somewhat below the veterans’ programs in size of benefits. While they have grown over most of the period since 1940, both payments and beneficiaries have changed only slightly over the last several years.12 In 1956 payments totaling $1.9 billion went to 2.9 million receipients. About 87 percent of these payments went for old age, the rest for payments to the blind and disabled.
Veterans pensions and related programs have a long history, but their present size is almost completely a direct outgrowth of the two World Wars. These benefits, too, have grown rapidly in the last 15 years, and further growth can be expected because of the large number of veterans who will be eligible for such payments in the future.13 Of the several types of payments made to veterans, those for disability 14 and survivors are considered to fall in the category of pensions as broadly defined in this paper. Between 1940 and 1956 the total of such payments grew from $339 million to $2.1 billion; while the number of recipients grew from 651,000 to 2.3 million.
The remaining major category of the pension structure—the various retirement programs for the employees of Federal, State, and local governments—originated earlier than most of the other components, but it, too, has shown rapid growth in the last decade and a half. Benefit payments under these plans increased from $300 million in
988 ECONOMIC GROWTH AND STABILITY
u Excluded from the pension structure as the term is used here, however, are general assistance and aid to dependent children, the latter because most of the cases are due to broken homes rather than death or disability.
12 For old-age assistance alone, the number of beneficiaries reached its peak in 1950 and has been dropping slowly since. But payments have continued upward since that date at a moderate rate.
13 As of June 1956 there were over 22 million veterans (Statistical Summary of VA Activities, June 1956). For their growth potential see reference and discussion in a later section of this paper.
14 Includes compensation payments for service-connected disability of 50 percent or more and pension payments for non-service-connected disability to veterans whose annual income did not exceed $1,400 if they had no dependents or $2,700 if they had a wife or minor child. We chose 50 percent disability arbitrarily in service-connected cases as the dividing line between those able to work and those who are de facto pensioners.
Digitized for FRASER http://fraser.stlouisfed.org/ Federal Reserve Bank of St. Louis

ECONOMIC GROWTH AND STABILITY 989
1940 to $1.6 billion by 1956, and the number of beneficiaries almost quadrupled, from a quarter of a million to just under 1 million over the same period. Even more rapid has been the growth of the funds established under the governmental employee retirement plans. For the Federal civil-service retirement system, reserves in 1940 stood at $600 million, and in 1956 at $7.3 billion; again between these two dates the funds established under the State and local employees plans increased from $1.6 billion to $11.3 billion. Between 1955 and 1956, the annual increase in reserves for the Federal system was $800 million; for the State and local systems $1.4 billion. A t present over 5i/2 million persons are covered by the Government employee retirement systems.
T a b le 1.— T ota l paym ents and num ber o f beneficiaries, a ll p en sion program s, 191,0 ,19J/7,1955, and 1956
Program
Paym ents (in billions) Beneficiaries or recipients (in thousands)
1940 1947 1955 1956 1940 1947 1955 1956
Old-age and survivors insurance 1__Railroad re tirem en t3-- . . . . . .Public service employee re tirem en t4.V eterans5 . . . ..................................Public assistance6........................ .........Private plans 7.................. .....................
T o tal___ ______ ____________
(2)$0.1
.3
.3
.5(8)
$0.5.2.5
1.51.0
(8)
$5.0.6
1.42.11.8.6
$5.7 .6
1.6 2.11.9.7
113 144 249 651
2,139 (8)
1,836 239 419
1, 596 2,413 (8)
7,540 613 904
2,153 2, 902
970
8,473 649 976
2, 288 2,890 1,200
1.2 3.7 11.5 12.6 » 3, 296 9 6, 503 915,082 816, 476
1 Paym ents include old-age retirem ent and survivorship (monthly and lum p sum). Beneficiaries include all of these except lum p sum.
2 Less than $0.05 billion.3 Paym ents include old-age retirem ent, survivorship (monthly and lum p sum ), and perm anent and to tal
disability; beneficiaries, all these except lum p sum.4 Paym ents include Federal civil-service old-age retirement, survivorship (m onthly and lum p sum),
and disability; other Federal contributory old-age retirement, survivorship (lump sum ), and disability Federal noncontributory old-age retirement and disability; State and local government retirem ent old-age retirem ent, survivorship (monthly and lum p sum), and disability. Beneficiaries include all of these except lum p sum.
s Paym ents and beneficiaries include old-age retirement, survivorship (m onthly), non-service-connected disability, and service-connected disability where disability is 50 percent or more. In this last category, the 1956 entry is as of the end of the fiscal year.
s Paym ents and beneficiaries include old-age assistance, aid to the blind, and, for 1955 and 1956, aid to the perm anently and totally disabled.
7 Hough estimates by M rs. W eltha Van Eenam of the Social Security Administration.R N ot available. Estim ated a t $70 million for 1946. (Challis A. Hall, R etirem ent Contributions, the
Spending Stream, and Growth, in Federal Tax Policy for Economic Growth and Stability, papers subm itted by panelists appearing before the Subcommittee on Tax Policy, Jo in t Committee on the Economic Report, W ashington, D. C., Government Printing Office, 1955, p. 788.)
8 Because a num ber of individuals receive paym ents under more than 1 program there is some overlap in these figures. For 1955 the data perm it a rough estimate. In that year about one-fifth of old-age assistance recipients (around 500,000) were also receiving old-age and survivors insurance benefits. Almost all of those getting private pensions were probably old-age and survivors insurance beneficiaries too. W ith the help of Lenore Epstein of the D epartm ent of Health, Education, and Welfare, it has been estimated on the basis of data from a num ber of special studies that somewhere between 390,000 and 420,000 of the old-age and survivors insurance beneficiaries (not in receipt of old-age assistance) were receiving benefits under a program for veterans, Government employees, or railroad workers. All in all, then, about 1.8 million of double counting is involved in the 1955 figures. There was virtually no overlap in 1940, a relatively slight am ount in 1947, and about the same degree of overlap in 1956 as in 1955.
Source: Social Security Bulletin, September 1953, table 4, and Annual Statistical Supplement 1955, tables 5 and 78; Veterans’ Benefits Administered by Departm ents and Agencies of the Federal Governm ent, Digest of Laws and Basic Statistics, Staff Report No. II , President’s Commission on Veterans’ Pensions, 84th Cong., 2d sess., House Committee P rin t No. 262, tables 45-49; 1956 data from the Social Security A dm inistration and annual report of the A dm inistrator of Veterans’ Affairs for 1956.
97735—57------64Digitized for FRASER http://fraser.stlouisfed.org/ Federal Reserve Bank of St. Louis

990 ECONOMIC GROWTH AND STABILITY
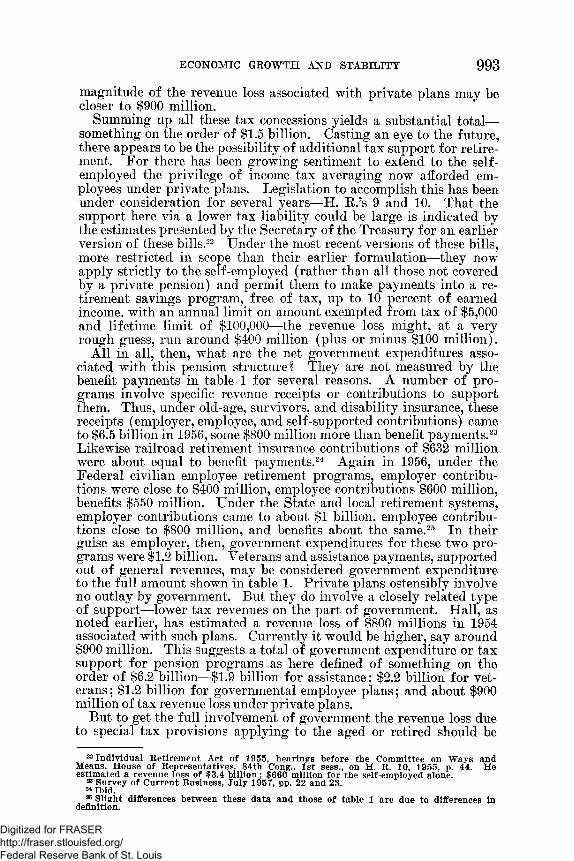
Tables 1 and 2 summarize and give the source of the data used in this glance at the pension structure. Table 1 contains the information on payments and recipients; table 2 covers the size of reserves.
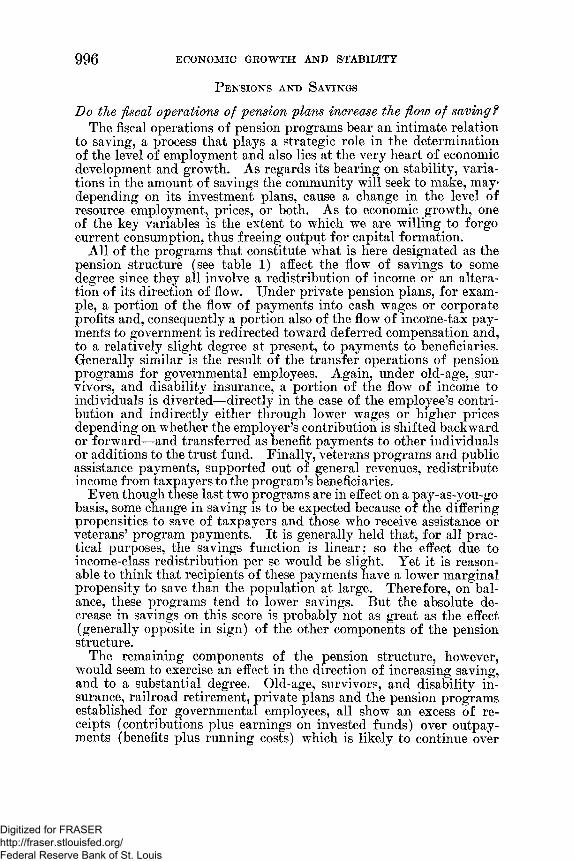
Not merely rapid growth of pensions, but also their increased importance as a source of income for those over 65, is indicated by the data of table 3, which is reproduced from an article by Lenore A. Epstein.15 Over this 7-year period, with the population over 65 growing by 22 percent, those in this age group with income from earnings increased by 5 percent, but the number of old-age and survivors insurance beneficiaries more than trebled, while the beneficiaries of other social-insurance programs increased by almost 60 percent. On the other hand, recipients of public assistance not receiving social- insurance benefits fell somewhat, and the number of persons with no money income or income solely from other sources was more than halved.
T a b l e 2.— Total assets of pension funds, 1940,1947,1954,1955, and 1956[In billions]
Pension programValue of assets in fund, Dec. 311 Increase in
assets during—
1940 1947 1954 1955 1956 1955 1956
Old age, survivors, and disability insurance., $2.0.1
$9.41.4
$20.63.4
$21.73.6
$22.53.6
$1.1.2
$0.8*1
Civil-service retirement and disability (Fed-.6 2.7 6.0 6.5 7.3 .5 .8
1.6 3.3 8.7 9.9 11.3 1.2 1.4Private plans:
(8>1.1*4.0 9.8 11.1 12.3 1.3 1.2
3.3 12.2 14.2 16.2 2.0 2.05.4 24.1 60.7 67.0 73.2 6.3 6.3
1 For State and local employee retirement, date is Kid of fiscal year falling in calendar year.2 Computed from unrounded data.* Not available.* Rough estimate for 1948.Source: Social Security Bulletin, annual statistical supplement, 1955; Tally of Life Insurance Statistics,
April 1957; Securities and Exchange Commission, Corporate Pension Funds 1956, statistical release series. No. 1474, pp. 25-26; Raymond W. Goldsmith, A Study of Savins in the United States, vol. I, Princeton University Press, 1955, p. 1073; Bureau of the Census, Summary of Governmental Finances in 1956, p. 34.
15 Lenore A. Epstein, Money Income Position of the Aged, 1948-55, Social Security Bulletin, April 1956.
Digitized for FRASER http://fraser.stlouisfed.org/ Federal Reserve Bank of St. Louis

ECONOMIC GROWTH AND STABILITY 991
T a b le 3.— 'Number and percentage distribution of persons aged 65 and over, by source of money income, June 19Jfi and June 19551
Number (in thousands)
Percentage
change,Percentage
distribution2
1948 19551955 from
1948 1948 1955
Total, aged 65 and over.................................. 11,550 14,100 +22 100.0 100.0Persons with earnings and/or social-insurance bene
fits..................................................................... 5,900 10,550 +79 51.2 74.6Earners and earners’ wives not themselves
employed..................................................... 3,850 1,450
4,050 +5 33.4 28.6Old-age and survivors insurance beneficiaries__ 5,850 +303 12.6 41.4
Not receiving old-age assistance............ ....... 1,300150
5,350 +312 11.4 38.0Receiving old-age assistance....................... 500 +233 1.2 3.4
Beneficiaries of other social insurance programs, no 1 receiving old-age and survivors insurance benefits 3. . _ ......................................... 850 1,350 +59 7.5 9.7
Less persons with both earnings and social- insurance benefits................. -....................... 250 700 +180 2.3 5.1
Public-assistance recipients not receiving social- insurance benefits.......................................... 2,250 2,050 -9 19.5 14.4
Persons with no money income or income solely from other sources.......................................... 3,400 1,550 -54 29.3 11.0
1 Persons with income from sources specified may also have received money income from other sources, such as returns on investments, private pensions, or annuities, or cash contributions from relatives.
2 Calculated from unrounded estimates.3 Railroad retirement, Govemment-employee retirement, and veterans’ compensation and pension pro
grams; includes beneficiaries’ wives not in direct receipt of benefits.Source: Estimated in the Division of Research and Statistics on the basis of published and unpublished
data from the Bureau of the Census and agencies administering income-maintenance programs.
But the relative importance of pensions grew more than this recital of the number of recipients alone would indicate, because there was
also a very substantial rise in the average amount paid out under the various programs. Over the 7 years ending in June 1955, Epstein’s data show a 144 percent increase in average monthly payments to retired-worker beneficiaries under old-age and survivors insurance (from $25 to $61), an increase of 33 percent in average Federal civil- service benefits (from $89 to $118), and a rise of 37 percent in average monthly old-age assistance payments (from $38 to $52). In contrast, the earnings of those over 65 changed only slightly. Over the period 1948 to 1953 Epstein reports the median annual earnings of men over 65 in covered employment up 16 percent to $2,275; the median earnings of women fell 12 percent to $950.
Very briefly, then, these are the magnitudes of the pension structure. As even this cursory review has shown, payments and asset accumulations of significant size are involved m the current operations of pension programs. Moreover, all signs point to larger flows in the future.Fiscal aid to the aged
But this by no means exhausts the Federal Government’s provision for the aged. For there are a number of income-tax relief measures which are directed to the same function as pensions—viz, income support of the aged. For some purposes the difference between tax
Digitized for FRASER http://fraser.stlouisfed.org/ Federal Reserve Bank of St. Louis
relief and income payments is purely formal. An income payment or tax amelioration of the same size has a similar effect on the disposable income of the individual, and on the Government’s surplus or deficit.
Since 1948 an additional exemption of $600 has been permitted taxpayers over 65.18 In addition, since 1951, persons 65 or over are not subject to the percentage exclusion (the lower limit) on the medical expense deduction that applies for all other taxpayers.17 The 1954 code provided for the aged a special credit which boils down to a credit against personal income tax equal to 20 percent of the first $1,200 of most of the income received in retirement exclusive of social security, railroad retirement benefits, military retirement pensions or other nontaxable pension receipts.18
These fiscal concessions are not insignificant. Kahn has estimated on the basis of 1952 data that the extra exemption lowered the tax liability of the aged by about $500 million, and their more liberal medical deduction led to an additional $100 million decline in tax liability.19 Currently, of course, the tax saving would be somewhat larger. In 1954 the retirement income credit was used on about300,000 taxable returns, lowering their tax liability by $50 million; some 175,000 nontaxable returns claimed $21 million of credit on this score, only a portion of which, however, can be considered an effective tax saving.20 An additional revenue loss arises in connection with the tax treatment of private pension plans. Unlike cash wage payments or interest receipts, employer contributions to private pension funds and accumulated earnings on these funds are not taxed to the employee when made or earned on his behalf, but are taxable usually at lower rates (or perhaps not at all) when received by the employee in retirement. Hall has estimated, admittedly roughly, “* * * that the net revenue loss from retirement plans alone in 1954 was about $800 million.” 21 (It is not appropriate to consider the reduction in corporate tax liability that follows from the deductibility of the employers’ contribution to pension funds, because the presumed alternative to such contributions—cash wage payments—would also have been a deductible expense.) W ith both employer contributions and earnings on pension funds higher now than in 1954, the current
992 ECONOMIC GROWTH AND STABILITY
18 Two additional exemptions can be taken on joint returns if both are over 65.17 Taxpayers under 65 can deduct only those medical expenditures (other than drugs)
in excess of 3 percent of adjusted gross income, and drug expenditures that exceed 1 percent of adjusted gross income. These lower limits do not apply to persons over 65. (The ceiling on medical expense deductions applies to all taxpayers.)
18 Pechman, in an interesting discussion of the retirement income credit as well as the more general matter of special tax provisions for the aged, notes that the retirement income credit was designed to give others the same de facto tax exemption that occurs under old-age and survivors’ insurance, with contributions taxable and benefits exempt, for individuals whose contributions fall short of their later benefit reueipts. He summarizes its provisions as follows: “The method chosen was to allow a tax credit at the first bracket rate of 20 percent on the first $1,200 of ‘retirement income.’ The amount of retirement income subject to the credit is to be reduced by (a) any social security or railroad retirement benefits, military retirement pensions, or other nontaxable retirement pensions, and (b) any amount of earned income, including income from self-employment, in excess of $900 received by persons under 75 years of age. Retirement income is defined to include pensions and annuities, interest, rents, and dividends. Property incomes, as well as pensions and annuities, were included in retirement income to avoid discriminating against those who save and invest their own funds for retirement purposes.” (Joseph A. Pechman, Individual Income Tax Provisions of the 1954 Code, National Tax Journal, March 1955, p. 124. Footnotes omitted.*)
19 Estimates provided by C. Harry Kahn of the National Bureau of Economic Research.20 Statistics of Income. 1954 (preliminary), p. 16.21 Challis A. Hall, Retirement Contributions, the Spending Stream, and Growth, in
Federal Tax Policy for Economic Growth and Stability, Papers Submitted by Panelists Appearing Before the Subcommittee on Tax Policy, Joint Committee on the EconomicReport, Washington, D. C., GPO, 1955, p. 796.
Digitized for FRASER http://fraser.stlouisfed.org/ Federal Reserve Bank of St. Louis
ECONOMIC GROWTH AND STABILITY 993
magnitude of the revenue loss associated with private plans may be closer to $900 million.
Summing up all these tax concessions yields a substantial total— something on the order of $1.5 billion. Casting an eye to the future, there appears to be the possibility of additional tax support for retirement. For there has been growing sentiment to extend to the selfemployed the privilege of income tax averaging now afforded employees under private plans. Legislation to accomplish this has been under consideration for several years—H. R.’s 9 and 10. That the support here via a lower tax liability could be large is indicated by the estimates presented by the Secretary of the Treasury for an earlier version of these bills.22 Under the most recent versions of these bills, more restricted in scope than their earlier formulation—they now apply strictly to the self-employed (rather than all those not covered by a private pension) and permit them to make payments into a retirement savings program, free of tax, up to 10 percent of earned income, with an annual limit on amount exempted from tax of $5,000 and lifetime limit of $100,000—the revenue loss might, at a very rough guess, run around $400 million (plus or minus $100 million).
All in all, then, what are the net government expenditures associated with this pension structure? They are not measured by the benefit payments in table 1 for several reasons. A number of programs involve specific revenue receipts or contributions to support them. Thus, under old-age, survivors, and disability insurance, these receipts (employer, employee, and self-supported contributions) came to $6.5 billion in 1956, some $800 million more than benefit payments.23 Likewise railroad retirement insurance contributions of $632 million were about equal to benefit payments.24 Again in 1956, under the Federal civilian employee retirement programs, employer contributions were close to $400 million, employee contributions $600 million, benefits $550 million. Under the State and local retirement systems, employer contributions came to about $1 billion, employee contributions close to $800 million, and benefits about the same.25 In their guise as employer, then, government expenditures for these two programs were $1.2 billion. Veterans and assistance payments, supported out of general revenues, may be considered government expenditure to the full amount shown in table 1. Private plans ostensibly involve no outlay by government. But they do involve a closely related type of support—lower tax revenues on the part of government. Hall, as noted earlier, has estimated a revenue loss of $800 millions in 1954 associated with such plans. Currently it would be higher, say around $900 million. This suggests a total of government expenditure or tax support for pension programs as here defined of something on the order of $6.2 billion—$1.9 billion for assistance; $2.2 billion for veterans; $1.2 billion for governmental employee plans; and about $900 million of tax revenue loss under private plans.
But to get the full involvement of government the revenue loss due to special tax provisions applying to the aged or retired should be
23 Individual Retirement Act of J 955, hearings before the Committee on Ways and Means, House of Representatives, 84th Cong., 1st sess., on H. R. 10, 1955, p. 44. He estimated a revenue loss of $3.4 b illion : $660 million for the self-employed alone.
23 Survey of Current Business, July 1957, pp. 22 and 23.24 Ibid.25 Slight differences between these data and those o f table 1 are due to differences in
definition.
Digitized for FRASER http://fraser.stlouisfed.org/ Federal Reserve Bank of St. Louis
994 ECONOMIC GROWTH AND STABILITY
considered. The added exemption, removal of the medical deduction floor, and the retirement income credit account in toto for a revenue loss on the order of three-quarters of a billion dollars. So the total of government expenditures and tax revenue losses would be about $7 billion as of 1956. (This fails to take account of the surplus of $800 million run on current account by old-age, survivors, and disability insurance.)Conclusion
We have then a complex set of arrangements for providing support in retirement. Following Titmuss’ lead we can sketch out three different types of programs that all provide support in old age. He distinguishes:
(1) Social welfare expenditures—specific government transfer payments under such programs as old-age, survivors, disability insurance, and public assistance.
(2) Fiscal welfare devices—tax liability ameliorations related to age or retirement status.
(3) Occupational welfare benefits—private pension plans.28The oroad goals of all three types of arrangements point in the same
direction. In this sense they are related. But they do not comprise an integrated set of programs. They comprise a structure, but only in a loose sense. The components of the structure are not closely articulated. They each, of course, have a specific focus; they are administered by various levels and agencies of government and by nongovernmental entities (business firms and labor unions) as well. The structure is already large and complex, and it will grow larger and, perhaps, more complex as well. Changes in one program have implications for the others, may complement or conflict with one or more of the other programs. W hat are some of the interrelations among the programs making up the retirement-income structure ?
One obvious point is th is : A number of persons receive payments under more than one program. So the net effect of the pension structure on them cannot be assessed by examining any one program alone. Some idea of the extent of this overlap can be obtained from footnote 9 of table 1.
Secondly, to the extent that some programs are expanded in scope or level of benefits, the need for others may not be as strong. Thus, it was expected that the need for old-age assistance payments would dwindle as old-age and survivors insurance expanded and took hold. The recent expansions in old-age, survivors, and disability insurance to almost complete coverage of all gainfully employed, and payments for permanent and total disability at age 50, have opened to question the appropriateness of some of the present provisions of the veterans’ program.27
Thirdly, changes in one program frequently carry direct, or sometimes untoward, consequences for one or more of the others. Under old-age, survivors, and disability insurance the benefit structure is regressive in relation to average earnings before retirement, i. e., benefits in relation to earnings constitute a declining fraction as such earnings
™ R. M. Titmuss, the Social D ivision of W elfare (Eleanor Rathbone Memorial Lecture), Liverpool University Press, 1956, p. 11.
* Veterans Benefits In the United States, a report to the President by the President s Commission op Veterans’ Pensions, April 1856.
Digitized for FRASER http://fraser.stlouisfed.org/ Federal Reserve Bank of St. Louis

rise. This effect is particularly pronounced at the top of the earnings range. Under the majority of private plans, however, the benefit structure is progressive in relation to previous earnings; the ratio of benefits to previous earnings rises with earnings.28 The net result for those who will receive both old-age, survivors, and disability insurance and payments from a private plan of this type is a benefit structure roughly proportional or, rather, only slightly regressive in relation to average previous earnings.29 The development of private plans substantially changed the benefit pattern as initially established by another program. (I t is obvious that changes in benefit levels are also involved.) As another example, take two recent changes in old-age, survivors, and disability insurance. The introduction of optional retirement for women at 62 under old-age, survivors, and disability insurance could affect the retirement age set for women in private plans, which had been tending to approach that for men. In many private plans that had provided payments for permanent and total disability, it was stipulated that such payments would be adjusted downward to take account of any disability payments subseqently established under a Federal program. Under these conditions, old-age, survivors, and disability insurance’s disability payments tend to be centered out by a decline in private disability payments.
Fourthly, conflicting influences tending to work at crosspurposes may be set up by the various programs that an individual is covered by. During working life, under private plans, changing employers is penalized if the employer’s contributions are not vested—and vesting usually occurs only after considerable service or when the worker is well along in age. Old-age, survivors, and disability insurance benefit rights, however, are not affected by job changes. On the other hand, in retirement old-age, survivors, and disability insurance penalizes participation in the labor force; private plans do not. (Under old-age, survivors, and disability insurance, for retired workers under 72, 1 month’s benefit payment will be lost for each unit of $80 or fraction thereof, by which earnings exceed $1,200.)
ECONOMIC GROWTH AND STABILITY 995
28 Thus, for the "conventional” (as distinguished from the collectively bargained “pattern” ) plans in the most recent Bankers Trust survey of private pension plans, benefits (under the plan alone and exclusive of social security) as a percent of earnings runs like t h i s :
Median benefit ranges exclusive of social
security as a percentAverage annual compensation during credited service : of compensation
$3,000____________________________________________________________________ 26-30$4,200____________________________________________________________________26-30$7,200____________________________________________________________________36-40$20,000___________________________________________________________________41-45
(Bankers Trust Co., A Study of Industrial Retirement Plans, 1956 edition, p. 19. This is for plans in which benefits are based on compensation during the entire period of credited service.)
20 Zisman gives the follow ing figures which are to be compared w ith the data of the immediately preceding foo tn o te:
Median benefit ranges inclusive of social
Average annual compensation during credited serv ice: of compensation$4,200____________________________________________________________________57-61$7,200____________________________________________________________________52-56$20,000___________________________________________________________________47-51
(Joseph Zisman, Private Employee— Benefit P lans Today, Social Security Bulletin, January 1957, p. 18.)
Digitized for FRASER http://fraser.stlouisfed.org/ Federal Reserve Bank of St. Louis
996 ECONOMIC GROWTH AND STABILITY
P e n s i o n s a n d S a v in g s
Do the fiscal operations of pension plans increase the flow of saving?The fiscal operations of pension programs bear an intimate relation
to saving, a process that plays a strategic role in the determination of the level of employment and also lies at the very heart of economic development and growth. As regards its bearing on stability, variations in the amount of savings the community will seek to make, may- depending on its investment plans, cause a change in the level of resource employment, prices, or both. As to economic growth, one of the key variables is the extent to which we are willing to forgo current consumption, thus freeing output for capital formation.
All of the programs that constitute what is here designated as the pension structure (see table 1) affect the flow of savings to some degree since they all involve a redistribution of income or an alteration of its direction of flow. Under private pension plans, for example, a portion of the flow of payments into cash wages or corporate profits and, consequently a portion also of the flow of income-tax payments to government is redirected toward deferred compensation and, to a relatively slight degree at present, to payments to beneficiaries. Generally similar is the result of the transfer operations of pension programs for governmental employees. Again, under old-age, survivors, and disability insurance, a portion of the flow of income to individuals is diverted—directly in the case of the employee’s contribution and indirectly either through lower wages or higher prices depending on whether the employer’s contribution is shifted backward or forward—and transferred as benefit payments to other individuals or additions to the trust fund. Finally, veterans programs and public assistance payments, supported out of general revenues, redistribute income from taxpayers to the program’s beneficiaries.
Even though these last two programs are in effect on a pay-as-you-go basis, some change in saving is to be expected because of the differing propensities to save of taxpayers and those who receive assistance or veterans’ program payments. I t is generally held that, for all practical purposes, the savings function is linear; so the effect due to income-class redistribution per se would be slight. Yet it is reasonable to think that recipients of these payments have a lower marginal propensity to save than the population at large. Therefore, on balance, these programs tend to lower savings. But the absolute decrease in savings on this score is probably not as great as the effect (generally opposite in sign) of the other components of the pension structure.
The remaining components of the pension structure, however, would seem to exercise an effect in the direction of increasing saving, and to a substantial degree. Old-age, survivors, and disability insurance, railroad retirement, private plans and the pension programs established for governmental employees, all show an excess of receipts (contributions plus earnings on invested funds) over outpayments (benefits plus running costs) which is likely to continue over
Digitized for FRASER http://fraser.stlouisfed.org/ Federal Reserve Bank of St. Louis

the next several decades at least.30 The annual additions to their reserves are substantial. For all these programs it came to $6.3 billion in both 1955 and 1956. (See table 2 above for details and sources.) Ten years from now annual fund accumulations may well run on the order of $9 billions. Such magnitudes are impressive, especially when related to the aggregate of saving. In 1955, for example, pension- fund asset growth accounted for 30 percent of total personal saving, while the pension-fund sector’s accumulation represented 28 percent of the total in 1956.31
But these are nominal savings. There are reasons to believe that the net accretion to the flow of saving falls short of the net change in reserves. This is the conclusion reached by several of the more thorough investigations of the problem, which estimate the change in saving as the net result of the change in saving (or consumption) brought about because o f : contributions (either of employees, employers, or the groups that bear them on various assumptions of shifting and incidence), benefit payments, fund earnings, and, where appropriate, government-tax revenues. Among the factors that explain this result are the following:
(a) Some workers may consider pension-fund accumulations a substitute for savings they otherwise would have made.
(h) Government saving will be lower (or dissaving greater), that is, Government’s surplus will be smaller or its deficit larger because under private plans what would have taken the form of taxable wages or dividends and interest shows up as currently nontaxable deferred compensation and fund earnings. (Unless, of course, taxes are raised or expenditures lowered to compensate.)
(c ) The income-class distribution and savings propensities of contributors (or taxpayers) and beneficiaries differ in such a way that transfers from the one to the other tend to increase consumption (i. e., lower saving). (An additional influence, not taken account of in the studies cited below, and one that it would be very difficult, if not impossible, to measure is th is : insofar as formal pension-plan payments displace informal intrafamily or charitable retirement support arrangements, there is a release of funds that might, in part at least, be saved.)
In connection with old-age and survivors insurance, for example, Carroll has estimated that in 1951, when the fund accumulation came to $1.7 billion, after taking account of the income transfers connected with old-age and survivors insurance fiscal operations, savings were higher by $1.2 billions, only 70 percent of the increase in the fund’s assets. Nor is this finding for 1951 an atypical result. For, extrapolating the then existing old-age and survivors insurance structure to
ECONOMIC GROWTH AND STABILITY 997
30 Recently great publicity has been given to the probable tailing off of old-age, survivors, and disability insurance’s asset accumulation in 1957 to virtually nothing, the possibility of a slight decline in the fund in 1958, and the likelihood of a further decline in assets in 1959. This result, caused by a higher level of claims than originally expected in response to changes in coverage and eligibility introduced in 1954 and 1956. is a short-run phenomenon. The longer run picture is substantially unchanged. With the scheduled rate increase in 1960, annual additions to the fund will, probably, once again take place, but at an uneven rate, tending to fa ll off before the rate increases of one-half percent in both employer and employee contributions scheduled for 1960, 1965, 1970, and 1975. Long-run estim ates (intermediate-cost) show the fund growing over the rest of this century. (See pp. 25 and 26 of Federal Old-Age and Survivors Insurance and Disability Insurance Trust Funds, letter from Board of Trustees of the Federal Old-Age and Survivors Insurance and D isability Insurance Trust Funds, H. Doc. 180, 85th Cong., 1st sess.)
31 Aggregate personal saving is as estimated by the SEC adjusted for comparability with the personal saving item of the Department of Commerce national income accounts, and with the addition of the Government insurance and pension reserves. (See Survey of Current Business, July 1947, p. 12, table 6.)Digitized for FRASER
http://fraser.stlouisfed.org/ Federal Reserve Bank of St. Louis
1953, 1955, and 1957 he obtained net saving increments equal to 65, 68, and 65 percent of fund accumulations respectively.32
(The growth in old-age, survivors, and disability insurance benefit payments relative to contributions over the last several years—due both to the normal increase in previously covered workers now retiring and recent expansions in coverage and liberalization of benefits—together with the upward movement of wage levels have changed the picture. Carroll’s revised estimates show a net increase in consumption (a net decrease in saving) because of old-age, survivors, and disability insurance’s fiscal operations in 1956, and a similar, but more pronounced result, for 1957. The net decline in saving caused by income transfers from contributors (and those who bear the shifted portion of the contributions) to beneficiaries outweighs the net addition to saving represented by that portion of the program’s receipts, if any, allocated to the fund.)
For the aggregate of private pension plans in 1954, Hall estimates the net saving effect at no higher than 60 percent and possibly as low as 7 percent of the growth in reserves, depending on the assumptions made about the effect of the growth in equity in a pension fund on other saving of those covered, and the response of government fiscal policy to the loss of revenue traceable to these plans. I f it is assumed that the Government does not seek to recoup the revenue loss, the net addition to saving would be within the range of 7 to 30 percent of the growth in reserves; with the Government’s revenue loss compensated for by lowering expenditures by a commensurate amount, the increase in net saving would range from 35 to 60 percent of the increase in reserves; with the revenue loss recovered by an across-the- board increase in personal income tax rates, the relevant net saving percentage would fall in the range 27 to 52.33
As Both Carroll and Hall have noted, estimates of this sort are subject to numerous qualifications. They do point, however, to a substantial gap between the nominal savings of pension funds and the net accretion to savings due to the entire set of fiscal operations associated with pension programs.
Not all students of this problem would agree with this conclusion, however. Dearing, for example, was of the opinion that net new saving would come to almost as much as net asset accumulation.34 On the other hand, Murray looks for very little additional saving from private pension plans.35 And Friedman holds that it is really not pos
998 ECONOMIC GROWTH AND STABILITY
62 John J. Carroll, F iscal Aspects of Social Security Programs, Ph. D. D issertation, University of Michigan, 1953.
33 Challis A. Hall, Retirement Contributions, the Spending Stream, and Growth, in Federal Tax Policy for Economic Growth and Stability, Joint Committee on the Economic Report, 84th Cong., 1st sess., p. 796.
& “In summary, it appears that the bulk of annual contributions for the support of industrial pensions w ill represent net additions to the supply of individual money savings * * *” (Charles L. Dearing, Industrial Pensions, the Brookings Institution, 1954, p. 175). Dear- ing’s argument is phrased in terms of contributions, but this is equivalent to talking about pension fund asset growth, because over the last several years fund earnings and benefit payments have run about the same level.
fe “* • * on balance, it seems to me that private retirement plans tend to increase the flow of institutional savings and may represent a modest net addition to personal savings” (Roger Murray, The Effect of Retirement and Pension Funds on Saving, in Savings in the Modern Economy, edited by W alter W. Heller, Francis M. Boddy, and Carl L. Nelson, University of Minnesota Press, 1953, p. 192). The increase in institutional savings that Murray refers to connotes a change in the composition of savings, i. e., the relative importance of various media, not an increase in the amount of savings.
Digitized for FRASER http://fraser.stlouisfed.org/ Federal Reserve Bank of St. Louis

sible, without much more work than has been done, to decide whether pension plans augment or decrease the flow of savings.36
Understandably, empirical evidence bearing on the problem at hand is sparse and inconclusive. W hat material there is suggests that pension and other savings are largely noncompetitive, and, therefore, pension plans add to savings. A finding, pointing in this direction, has been cited by Katona.
* * * I t is argued that social security and private pension and retirement plans make it now less necessary to save for old age than even a few years ago. Do collective security arrangements obviate the need for independent saving ? * * *
This problem could and should be studied empirically. A t
Eresent we have only a small bit of evidence which has a earing on it. In a study recently completed by the Survey
Research Center and soon to be published by the Institute of Life Insurance, the relationship between ownership of individually purchased life insurance and membership in collective insurance plans was analyzed. This relationship is crucial since individually purchased life insurance is probably the closest substitute for the collective insurance programs. I t appeared that people who are covered by social security or private pension plans have larger life-insurance policies than people with similar incomes who are not covered. Apparently, the will to save and the perceived need for savings have not been impaired by collective security arrangements.37
That a finding related to only one other form of saving does not settle the question needs no elaboration, especially since the savings response to pension coverage may cumulate over time with growing awareness of their pension rights on the part of those covered.
Thus there is the additional complication that the effect, whatever it may be, depends on how much people know about their pension coverage. For it is not their existence, per se, but employees’ awareness of these provisions that will affect behavior. Awareness is something that can be expected to increase over time. That some people do not know the facts of their private pension coverage, at least, is indicated by the results of two surveys of pension plan coverage made in 1953 and early 1954 by the Pennsylvania Joint State Government Commission. One asked the information of individuals; the other sought it from employers. The survey of individuals showed
ECONOMIC GROWTH AND STABILITY 999
3s “* * * a dollar in the form of a reserve held by the Government and available to the individual only under narrowly specified circumstances is worth less to him than a dollar in privately held reserves that he can dispose of at w il l ; in consequence, each dollar increase in government held reserve would tend to produce less than a dollar decrease in private savings. In fact, however, social security obligations are not fu lly funded ; the increase in accumulated benefits exceeds the increase in government pension and retirement funds. It may well be, therefore, that the increase in these funds has been less than the decrease in private savings that the existence of the corresponding benefit programs has produced. The conclusion is that, without much more detailed analysis, i t is not possible to say whether the net effect of governmental social security and other programs has been to increase or to decrease recorded savings as a fraction of income, let alone by how much” (Milton Friedman, A Theory of the Consumption Function, Princeton University Press for the National Bureau of Economic Research, 1957, p. 123). The first part of his argument applies to private plans also, and is strengthened by the general lack of really effective vesting provisions in these plans.
37 George Katona, Attitudes Toward Saving and Borrowing, in Board of Governors, Federal Reserve System, Consumer Instalm ent Credit, pt. II, vol. 1, Conference on Regulation, National Bureau of Economic Research, 1957, pp. 453-454. For the data referred to by Katona, see pp. 55 of the Life Insurance Public, Institute of Life Insurance, 19&7. Similar results were obtained in a British savings survey. (See L. R. Klein, Patterns of Savings: The Surveys of 1953 and 1954, Bulletin of the Oxford Institute of Statistics, May 1953, p. 206.)Digitized for FRASER
http://fraser.stlouisfed.org/ Federal Reserve Bank of St. Louis

1000 ECONOMIC GROWTH AND STABILITY
842,000 Pennsylvanians covered by pension plans; the employer survey put the figure at 1,194,000.38 While definitional differences between the two surveys may help to explain this discrepancy, it nonetheless appears that some employees are unaware of their inclusion in a private pension plan and, undoubtedly, many of those who know they are covered know little about the provisions of the plan. Greater awareness of the provisions of the pension plans in which they are participating might, however, cause employees to discount more heavily the degree to which a given buildup of their “equity” in a pension fund represents real saving. Because labor turnover is high and the extent of vesting relatively slight, McGill has estimated that “Certainly no more than 50 percent of employes presently covered under private pension plans will ever receive a cash benefit from the plan.” 39
In brief summary, while it appears that there is no definitive answer to the question whether and to what extent the various types of pension programs augment the flow of savings, we may conclude that on net balance the fiscal operations of the pension structure tend to increase the flow of saving, but by considerably less than the amount of annual pension fund asset growth would suggest.What is the significance of the 'probable acceleration or saving caused
by pension programs?Should we view with alarm or regard as salutary the fact that, on
net balance, total savings are probably higher than they would be in the absence of pension programs ? This question, of course, cannot be answered unequivocally. The answer depends both on one’s judgment on how high aggregate demand for output will be, and one’s preferences as regards the composition of output, i. e., its division between consumption goods and capital formation. Earlier discussions of this problem framed with reference to the economic experience of the thirties tended to emphasize the deflationary potential of adding to the stream of savings the community would seek to make. In this context it was held that pension fund accumulations would lower consumption and have little or no effect on investment; thus aggregate demand, output, and employment would be lowered. More recently, reflecting the changed economic environment, increased attention has been devoted to the effect of trust fund accumulation on the supply of investment-seeking funds and the consequent increase in capital formation. In contrast to the earlier argument that led to the conclusion of a net decline in output, more recent analyses lead to the conclusion that the primary effect of pension fund growth is on the composition of output, weighing it more heavily with investment than would otherwise have been the case. Thus, in a recent analysis of the pertinent functional relations, Gilmore concluded:
Under conditions of high business confidence and moderately high interest rates * * * trust fund accumulation increases real saving and investment, and because of the increase in the stock of capital, also increases output in the long run.
* * * * *
38 Selected Employee Benefit P lans, a report of the Joint State Government Commission to the General Assembly of the Commonwealth of Pennsylvania, session of 1955, pp. 15 and 39.
“ Dan M. McGill (ed .), Pension: Problems and Trends, Richard D. Irwin, Inc., 1955, p. 40.Digitized for FRASER
http://fraser.stlouisfed.org/ Federal Reserve Bank of St. Louis
ECONOMIC GROWTH AND STABILITY 1001
I f these views are correct, the most important conclusion of this analysis is that it is now economically possible for a generation by saving to provide for its own future retirement needs.40
To go one step further, if over the longer pull, as many hold likely, the general outlook is for oversufficient aggregate demand with consequent inflationary pressures, the increase in saving due to pension programs will tend to dampen the rise in prices. Under these conditions, pension plan operations would leave total output unaffected, would cause a larger fraction of it to be devoted to capital formation, and would tend to moderate price increases, thus helping to insure the adequacy of the benefits to be paid out under the plans. That pension funds would, therefore, be playing a salutary role need not be belabored.Pensions as stabilisers
Nor is this conclusion invalidated by the consideration of cyclical fluctuations around a full employment (with or without inflation) trend, for the deflationary pressures of pension plans can be expected to vary in intensity in a countercyclical way. Pensions are one of the class of devices whose fiscal operations tend to buttress spending and, thus, to moderate variations in the level of income and employment. In periods of declining economic activity, contributions tend to fall while benefit payments remain steady at the very least, or rise somewhat. So when aggregate income is falling, the operations of pension programs tend to moderate the decline on balance, making it less severe than it would have been. Similarly, a rise in the level of income would be moderated by the tendency for contributions to increase and benefit payments to remain steady (or, allowing for their trend, to rise more slowly than they would have).
Thus Merriam has estimated for a hypotetical recession commencing in 1955 and reaching a low in 1957 (the estimates were prepared prior to 1955) that under old-age and survivors’ insurance as it stood in 1953—
* * * total contributions in 1957 would have been about $1.9 billion more than aggregate benefit payments if economic conditions were good, but only about $5.5 billion more under conditions in which 10 percent of the labor force were unemployed.41
These figures, derived from a hypothetical model, should not be taken to describe actual events but rather to illustrate the offsetting effect under a set of specific assumptions as to the nature of the recession and the provisions of the old-age and survivors’ insurance program. The introduction starting in July 1957 of payments after age 50 for total and permanent disability will tend to increase the cyclical flexibility of the program, for, as Merriam remarks:
40 Curry W. Gillmore, Trust Funds and National Output, Southern Economic Journal, July 1957, pp. 52-53.
41 Ida C. Merriam, Social Security Programs and Economic Stability, in Policies to Combat Depression. A Conference of the Universities— National Bureau Committee for Economic Research, Princeton University Press, 1956, p. 228. The rest of this section draws heavily on Merriam’s paper.
Digitized for FRASER http://fraser.stlouisfed.org/ Federal Reserve Bank of St. Louis

1002 ECONOMIC GROWTH AND STABILITY
Such benefits are generally more sensitive than old-age retirement benefits to fluctuations in economic conditions and employment levels.42
Railroad retirement and the programs for governmental employees would respond in a similar fashion but not as vigorously.43 Assistance payments, too, would show an “appropriate” response but probably not a very strong one.44 Veterans’ compensation and pensions should increase in absolute amount in a period of economic adversity, and, presuming no increase in tax collections to finance them, this too would shore up spending. The response here is liable to be relatively strong, because income ceilings apply to eligibility for such payments. W ith declining aggregate income and employment more veterans would fall below these limits.45
Finally, as regards private plans there are these considerations that suggest that they will operate countercyclically: In a contraction, for example, contributions will tend downward as wages fall. Benefits, if anything will increase; so fund accumulation will decline, As already noted this will probably mean a relative decline in saving. Some measure of flexibility is permitted employers as regards their annual contributions both for current and past service credit, and this will impart additional cyclical flexibility to contributions, causing them to fall relatively more when profits are low and rise relatively more when profits are high. Moreover there has been a rapid growth in provision of pensions through profit-sharing plans under which the rate of fund accumulation increases in expansion and falls off in contraction.
These conclusions on private plans apparently run counter to considerations raised by Congressman Mills during the tax hearings of this committee several years ago. He noted several points “sometimes made in this connection,” particularly that—
the tax provisions serve to remove sizable amounts of highly cyclically sensitive income, employer contributions on behalf of covered employees, from the tax base so that changes in the amount of this element of employees’ compensation are not reflected in taxable income and, * * * [also] * * * employers’ deductions increase with increases in levels of economic activity and decrease during recessions, offsetting tax revenues perversely.46
But as Hall notes in his discussion of these points, although the built-in flexibility of the tax structure is impaired (but only slightly), this is more than offset because the effect on personal saving is greater than (and opposite in sign to) the effect on government saving; therefore, on balance the probable effect is a relative increase in savings during expansion and the reverse in contraction.47
All in all, then, the pension structure’s effect on aggregate demand is appropriately countercyclical. While it probably should not be counted among the major stabilizers, it is a force in the right direction.
« Ibid., p. 227.43 Merriam explains that they are more mature system s than OASI.** Ibid., p. 232.“ Merriam, op. cit., p. 230.4e Federal Tax Policy for Economic Growth and Stability, hearings before the Subcom
m ittee on Tax Policy of the Joint Committee on the Economic Report, 84th Cong., 1st sess., p. 652.
« Ibid., p. 653.
Digitized for FRASER http://fraser.stlouisfed.org/ Federal Reserve Bank of St. Louis

ECONOMIC GROWTH AND STABILITY 1003
Only the most tentative conclusions can be drawn on the effect of pension programs on savings. This is an area where much work remains to be done. Subject to reservations already noted, it may be said that—
(1) On net balance, the fiscal operations of the pension structure probably add to the net flow of savings in the community, but by less than what a look at annual fund accumulations would lead one to believe.
(2) Given the general economic complexion of our times, this increase in saving is, on the whole, desirable.
(3) Moreover, pension-fund savings tend to vary in an appropriate direction in the course of cyclical fluctuations, helping to moderate both expansions and contractions.
T h e F u t u r e S i z e o f P e n s i o n s
The pension structure over the next 30 yearsTo many peoples’ way of thinking one of the key problems raised
by increasing numbers of persons over 65 and the burgeoning structure of pension arrangements for their support in retirement is simply th is : Can we afford it ? Thus a British Royal commission that investigated the economic and financial problems of the provision for old age summarized what it judged to be one of the major issues with this question: “W hat can a future generation afford to do for the elderly out of its own resources without undue strain?” 48 Or, again, Ball in his study of the effect of pensions on the economy, observed:
Probably the most fundamental economic question connected with the growth of the aged population is whether the flow of goods and services going to the retired aged will be so great in the future that the gainfully employed will find it difficult to produce enough for the aged and at the same time have enough for themselves, their children, and their wives.49
As a first and, as will be seen, very rough approximation, whether the transfer of purchasing power from the working to the retired population that is brought about by pension plans will constitute a heavy “burden” apparently depends on two things that can be measured or estimated—the size of the transfer and the flow of output it will be bid against.50 To get some idea of how important this transfer of purchasing power may become, we need to know what benefit payments and national income will be in the future. But because such a comparison obscures some of the basic issues involved and its interpretation must be qualified, a further discussion of the concept of “burden” appears later in this section.
There are available recent projections of the size of benefit payments in 1965, 1975, and 1985, under all public pension programs, and of national income at the same dates which were published in the report of the President’s Commission on Veterans’ Pensions—Veterans’ Bene
48 Report of the Committee on the Economic and Financial Problems of the Provision for Old Age, Cmd. 9333, 1954, p. 35.
49 Pensions in the United States, a study prepared for the Joint Committee on the Economic Report by the National Planning Association, Robert M. Ball, staff director, Washington, 1952, p. 39.
60 While the word “burden” is commonly used, it has a number of different meanings and is subject to numerous qualifications. That is why quotation marks appear around it in what follows.
Digitized for FRASER http://fraser.stlouisfed.org/ Federal Reserve Bank of St. Louis

fits in the United States (further details of these estimates appear in the Commission’s staff report No. X. They were prepared by the Department of Health, Education, and Welfare and the Commission staff. That there are pitfalls in projecting economic variables over a period as long as 30 years requires no elaboration. But the projections serve a useful illustrative function; they suggest some of the possibilities as to the magnitude of pension benefits over the next three decades.51
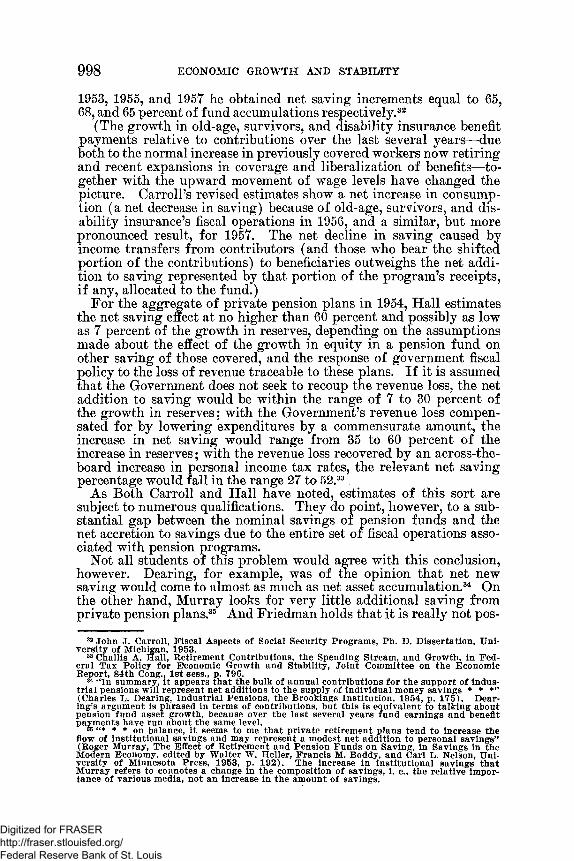
Two sets of projected values are set forth in table 4—one based on the assumption that present (1955) laws and benefit rates for all programs remain unchanged with the exception of the introduction of cash disability payments under old-age and survivors’ insurance commencing at age 50 as in H. K,. 7225, 84th Congress (one of the amendments passed in 1956), and the other assuming that benefit rates would increase at half the rate of increase in productivity per man-hour posited in the national income projection (that is, at one-half of 2.5 percent annually), and, in addition, veterans’ payments 52 would be changed to include general service pensions assumed as follows: pensions of $100 a month to all present wartime veterans after age 65 and a liberalization of service pensions to surviving widows from $50.40 to $65 per month, as well as a 30-percent increase in payments to minor children. (Note that since these estimates were prepared, changes that will cause an increase in benefit payments were made in most of the public programs.)53What do the projections show?
In 1955 total public pension benefit payments of $11.5 billion equaled 3.6 percent of national income. Even with no change in existing laws and benefit structures, pension payments are expected to grow (especially those made under old-age, survivors, and disability insurance) to an estimated annual rate of $19.5 billion, or 4.7 percent of national income by 1956.51
While further growth in benefit payments is looked for over the ensuing two decades, a more rapid relative increase in national income is projected. The estimates put benefits at 4.3 percent of national income in 1975, and 4.0 percent by 1985. This latter figure is not much higher than the actual percentage for 1955.
1004 ECONOMIC GROWTH AND STABILITY
81 What has been put in the category of pensions for the purpose a t hand differs in some respects from the definition used in preparing table 1, although the 1955 total of payments conies to $11.5 billion in both cases. But the veterans program entry in table £ below is $0.5 higher than table l ’s which excludes payments for service-connected disabilities where the degree of disability is under 50 percent. Also table 1 includes private pension benefits; table 4 does not.
52 This category includes payments made for service-connected disability and death benefits and non-service-connected pensions to veterans and dependents.
53 The estim ates exclude private plans. Had they been included, larger benefit paymentswould have been indicated— in 1955 about $600 million m ore; in 1965 under assumption(a) perhaps something on the order of $1.8 billion (see Hall, op. cit., p. 788).
61 This growth w ill be due both to an increase in the number of the aged and the factthat more of them w ill be eligible for pension benefits, particularly under old-age, survivors,and disability insurance.
Digitized for FRASER http://fraser.stlouisfed.org/ Federal Reserve Bank of St. Louis

ECONOMIC GROWTH A3STD STABILITY 1005Table 4.—Public pension benefit payments and national income: Actual, 1940-55,
and estimated, 1965, 1915,1985[Dollar figures in billions]
Change in rate of
Benefit payments Change in rate of
Change in bene
Year
N ational income
national income
over decade 1
AmountAs percent of
national income
benefit payments
over decade 1
fits as percent of change in national income
0) (2) (4) (5) (6)
Actual:1940 ............................... ................. $81.6 $1.9 2.31945 - ............................. 181.2 2.5 1.41950..___ _____________________1955 . ............................. ...........
240.0322.2
$158.4141.0
a. 5 11.5
2.73.6
$4.69.0
2.96.4
Estimated:(a) Assuming no change in existing
law and benefit rates:2 1965 ___________________ 414.0 91.8 19.5 4.7 8.0 8.71975 ___________ ________ 571.0 157.0 24.8 4.3 5.3 3.41985 _ ........................ 756.0 185.0 30.6 4.0 5.7 3.1
(6) Assuming benefit rates to increase at half the rate of increase in national productivity assumed in projecting national income and liberalization of veterans’ payments as described in text:3
1965 ................ ....................... 414.0 91.8 25.6 6.2 14.1 15.41957 _________________________ 571.0 157.0 37.9 6.6 12.3 7.81985______________ ________ - - - 756.0 185.0 56.9 7.5 19.1 10.3
1 The 1950 entry, for example, is the difference between the 1950 and 1940 values.2 Except introduction of disability payments at age 50 in old-age and survivors insurance. (See text.)3 Estimated by applying to all programs on p. 118 of Veterans’ Benefits in the United States—except
the workmen’s compensation and unemployment compensation entries—the rate of increase computed from the table on p. 124.
Source: Veterans’ Benefits in the United States, pp. 117-118,124; Survey of Current Business, July 1955; Social Security Bulletin, September 1953.
But the history of pension growth suggests that the assumption of maintenance of existing benefit structure probably constitutes the lower limit of the range of conjectures that might be made about the development of pension program benefit provisions in the future. For one thing it takes no account of the growth potential of veterans’ non-service-connected pensions. For another, with real wage levels rising as productivity increases, it implies a decline in the ratio of pension benefits to average working life earnings.
“Reasonable” possibilities in both respects are legion. Two of them are incorporated in the data under (b) in table 4.
These projections assume general service pensions, etc., for the veterans’ program (as noted above) as well as an upward adjustment of the benefit provisions of all the pension programs including this one. The specific assumption incorporated in these data is an increase in benefits at the rate of 1.25 percent per annum (one-half the rate of increase in productivity assumed in projecting national income.55 Under these assumptions public pension benefits would, of course, grow much more rapidly. By 1985, it is estimated they would be close to $57 billions, some 7.5 of projected national income. Their share of income would be over twice as large as it was in 1955.
These projections suggest that: (1) the next 30 years will witness a rapid rise in public pension benefits. However, should present laws
65 If real wages kept pace with productivity, this assumption implies a lag of pension benefits in relation to real wages.
97735—57------65Digitized for FRASER http://fraser.stlouisfed.org/ Federal Reserve Bank of St. Louis

1006 ECONOMIC GROWTH AND STABILITY
and benefit provisions remain unchanged, national income would increase in step with pensions. I f the veterans’ program were expanded and if in addition to this benefit provisions were changed so that real benefits tended to rise, although not as rapidly as productivity (and, quite possibly, wages), public pension benefits would grow more rapidly. Their pace would outstrip national income, and the fraction they would constitute of national income could, conceivably, more than double.
(2) No matter which assumption is made about benefit provisions over the next 30 years, the growth of pension payments is likely to be particularly marked over the early part of the period. That is to say, the time pattern of benefit payment growth shows a pronounced bulge over the period 1955-65. Note the percentages in column (6) of table 4 which relate the change in pension benefits to the change in national income. Between 1945 and 1955 the increase in the annual rate of benefit payments came to 6.4 percent of the increase in the anual rate of national income. Between 1955 and 1965, with no change in benefit provisions, the projected growth in the rate of benefit payments equals 8.T percent of the projected increase in the rate of national income. Much lower values are estimated for the relative change between 1965 and 1975 and that between 1975 and 1985. Under the other assumption an even higher ratio of benefit increment to national income increment is estimated. The change between 1955 and 1965 would, again, be more pronounced than between the two later decades.
(3) Under existing laws and benefit provisions, the major portion of estimated total benefit growth will be accounted for by OASDI— $6.2 billion of the total $8 billion increase between 1955 and 1965; $14.5 billion of the $19.1 billion increase in projected total benefits between 1955 and 1985. But another pension program has substantial possibilities of growth that may or may not materialize. Should general service pensions for veterans be enacted, the veterans’ program would increase by an estimated $4 billion by 1965, and over the 30-year period the annual rate of veterans’ pensions would increase by $8.4 billion, or almost one-third of the increase in the rate of total benefit payments.66
These data, of course, just set out the contours of the problem. No easy conclusions follow from them about the “burden” of pensions. Whether pensions will account for too “high” or too “low” a share of income cannot be concluded simply by reference to them. In part this is because pension transfers can only be evaluated within the context of all the uses to which the community desires to devote increases in its output—more schools, more roads, more medical expenditures, more research and developmental expenditures, etc. I t is easy to discount extension of any selected program as involving allocation of a small percent of expected increments in output. I t is not easy to discount the total all these programs will add up to. And then there is the question of just what is implied by a calculation that sets pension benefits against income. Is it correct, as this procedure seems to imply, to consider pension benefits a “burden” to the full amount of the monetary transfers involved ?
M For these data see source note of table 4.
Digitized for FRASER http://fraser.stlouisfed.org/ Federal Reserve Bank of St. Louis

ECONOMIC GROWTH AND STABILITY 1007
Some observations on “burden”Pension payments together with private charitable contributions
and intrafamily contributions constitute the body of transfer payments to the nonworking aged. But it would not be correct to count all pension benefits as a “burden.” For to the extent that pension transfers had their origin in previous saving (and accumulated interest thereon) they represent no more of a “burden” than personally provided annuities. The interest and dividend component of pension payments is a reward for permitting the use of capital; the return of capital component permits drawing against output to a greater extent than current participation in production alone would permit, but only to the amount of capital formation that previous saving made possible.
In other words, while it is true that the flow of output over any given period is the result of the effort expended by those working at, that time, and it is also true that pension transfers enable nonworkers to claim some of this output, in assessing the “burden” of pensions— i. .e, how much of a transfer of goods and services from workers to nonworkers is effectuated by pension benefits—we need to know to what extent the generation now working is helped in its task because, due to pension programs, the now-retired generation set free some of the output it engendered at an earlier date for capital formation. I f the retired generation failed to exercise claims to the output it produced over working life to an amount sufficient (with accumulated interest) to match its pension receipts, and if this resulted in a commensurate amount of capital formation, and if there had been no change in price levels over the whole of their working and retired life, the working generation would, after meeting the claims of pensioners against output, be just as well off as it would have been in the absence of pension programs. Viewed in this way, pension programs that meet the stated assumptions merely involve a rearrangement of the pattern of lifetime consumption possibilities—consumption less than the income due to participation in production during work life, balanced by more consumption in retirement.
The ifs of the preceding paragraph are important qualifications. Insofar as pension program operations do not result in forgone consumption or the savings 57 made under their auspices are not matched by investment, pension retirement benefits will, indeed, deprive the working population of some of the output that is due solely to its efforts, for the retired generation will not have “put any output in the bank” during its working life to set off against the claims to output that it will receive via pension benefits. On the other hand, should prices rise over time and pension payments remain unchanged, then the retired generation will, in effect, be able to take out only a fraction of the output their pension-program-induced abstinence set aside in working life. There will be a transfer of output from the retired generation to the working generation. The prospect or, rather, the likelihood of inflation is something to keep in mind in any discussion of the “burden” of pensions. Inflation will always ameliorate a “burden” by lowering the real value of any monetary promise that one generation makes to another.
57 Note that here the discussion relates to the saving associated with contributions (in payments) and fund earnings of pension programs, whereas the discussion in the section on savings, considered the net result of this and the savings effects associated with benefit payments, and changes in Government revenue (where appropriate).
Digitized for FRASER http://fraser.stlouisfed.org/ Federal Reserve Bank of St. Louis

1008 ECONOMIC GROWTH AND STABILITY
W hat follows, however, assumes investment to the full amount of consumption forgone in working life due to participation in a pension plan, and no change in price levels. Then it could be said that a “burden”—a net deprivation of real goods and services—will be imposed by a pension program on the working generation if in the aggregate pension transfers to retired persons exceed the amount of forgone possible consumption due to the retired generation’s participation in a pension plan when they were working. For then they will be consuming more over their lifetime than their lifetime earnings (including property income, receipts) alone would permit. This excess of consumption over income can only come about by drawing on the output engendered by the working population. In this case pension transfers have a real counterpart in a flow of output from workers to nonworkers. This net transfer of output from one generation to another is the concept implicit in a literal reading of comparisons of the type that appear in table 4.
Can we, then, with reference to this concept of “burden” say that funded plans are “burdenless,” that de facto pay-as-you-go programs (old-age assistance and payments to veterans) are “burdensome” to the full amount of the transfers made under them, and that OASDI falls somewhere in between? Not without qualification. On the one hand, while programs are approaching maturity, due to funding for past service credits under private plans, and because of the nature of OASDI's benefit eligibility requirements, the retired generation will recoup more from the program in retirement than it contributed to it in working life. But they will, of course, have forgone current use of income engendered in production to some extent, and over time each generation’s income forgone during working life will approach closer to its retirement benefits.
Even where pension payments have no basis in previous saving, the net “burden” would be less than the amount of such payments, because the existence of such a pension program makes for a lower total of private charitable and intrafamily contributions than would otherwise have been the case.
So far the discussion has run in terms of the generation of retired persons in the aggregate. In this context “burden” is related to transfers of output between generations. Break up this aggregate into the individuals comprising it and an additional concept of “burden” emerges, a “burden” that is related to transfers of output among individuals. Even if a generation as a whole gave up potential consumption just equal to the amount of consumption its pension receipts in retirement would permit, an individual member of that generation may be “burdened,” “benefited,” or left unaffected, depending on whether the forgone current expenditure of income associated with his participation in a pension program during working life falls short of, exceeds, or just equals his pension receipts in retirement. This “burden” is, of course, if measured in terms of differential claims against output, matched by a commensurate “benefit” for someone else in the same generation, consisting of a redistribution of claims to output from some members of a given generation to others.
Under old-age, survivors, and disability insurance, for example, a lack of congruence between contributions and receipts arises from the difference between the contribution formula and the benefit formula,
Digitized for FRASER http://fraser.stlouisfed.org/ Federal Reserve Bank of St. Louis

ECONOMIC GROWTH AND STABILITY 1009
as well as from the possibility that some or all of the employers’ contribution comes out of the community at large in proportion to consumption expenditures (or wages). rather than in proportion to future benefits. Under private plans, too, there are reasons to expect benefit expectancies and contributions (forgone possible consumption) to diverge. To some extent the employer's contribution may come out of lower profits or higher prices and, hence, be supported by others than the ultimate beneficiaries. This same result follows from the tax treatment of private plans for, as already noted, they lead to lower personal tax liabilities and if Federal revenues are maintained, the rest of the community will have a heavier tax load. An additional reason for expecting a lack of correspondence between current income forgone and pension benefits in the future under private plans is th is : with labor mobile and employers' contributions not vested until after long period of service, it is entirely likely that a substantial fraction of those now under a plan will not receive any benefits from it.
Still another kind of “burden,” a psychological “burden"’ may be noted.
Even if his forgone consumption potential during working life were just to equal his retirement benefits, a “burden"’ may be imposed 011 an individual if his participation in a pension program was not wholly voluntary. For he may have wished to arrange the use of his income over time in a pattern different from that necessitated by the pension program. He may have had in mind a different interest rate from that obtainable under the plan. That is to say, to him the sacrifice involved in f o r e g o in g current consumption may have been greater than the interest reward provided by the plan.
In summary, these observations on “burden"’ suggest that the pension structure is less “burdensome" in the sense of permitting one generation to draw against the output of another than a mere reading of the figures in table ± would indicate. But they also serve to point up the fact that, connected with pension programs, there are other “burdens” or “benefits" related to the individual that are not covered by the data of the table. Two final cautions:
(1) This section's discussion has run in terms of “burden" in a situation with a pension program as against one without it. But, accepting a certain level of support in old age as having been decided on, a more salient view of “burden" would be that associated with one particular program compared with the “burden" associated with alternative possibilities.
(2) Many other economic effects, not discussed in this paper, are associated with pensions. The evaluation of all these effects and, hence, the net effect of pensions on the economy goes far beyond the narrower considerations of “burden" raised here.
Digitized for FRASER http://fraser.stlouisfed.org/ Federal Reserve Bank of St. Louis