Embed Size (px)
Citation preview
1
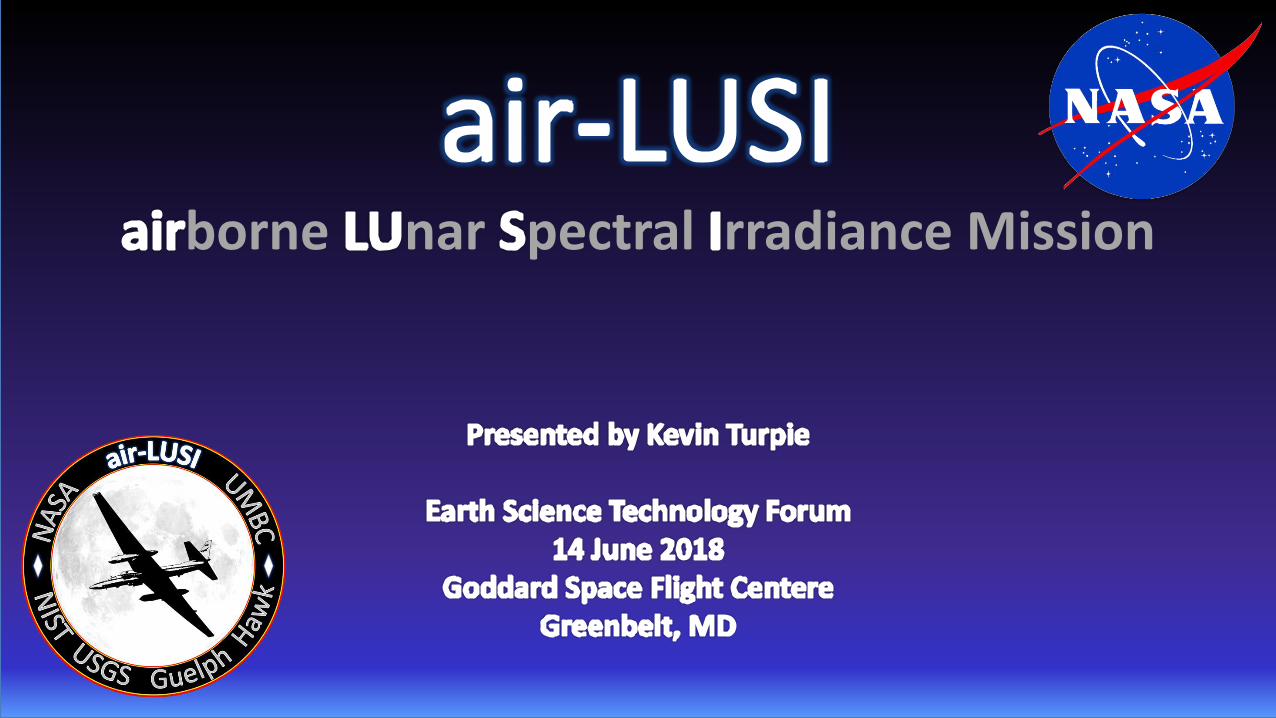
-borne nar pectral rradiance Mission
2
3
1956 - 2016 1947 - 2015 1940 - 2018
4
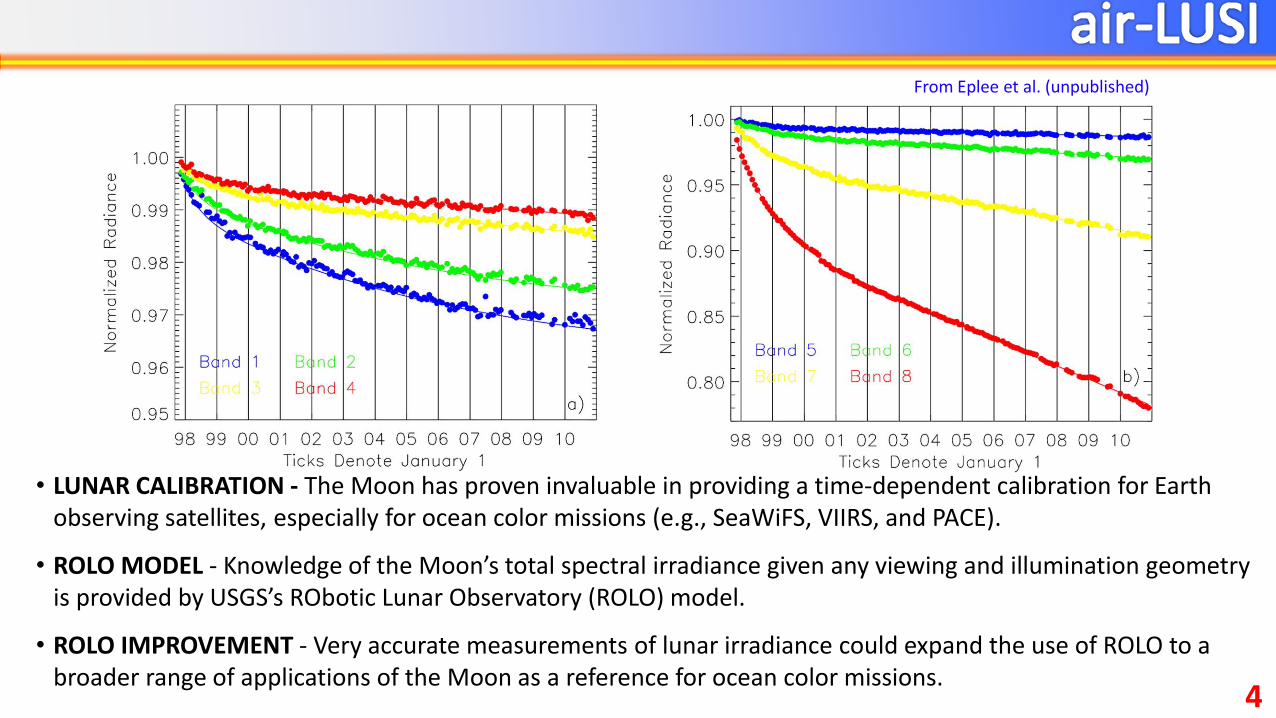
• LUNAR CALIBRATION - The Moon has proven invaluable in providing a time-dependent calibration for Earth observing satellites, especially for ocean color missions (e.g., SeaWiFS, VIIRS, and PACE).
• ROLO MODEL - Knowledge of the Moon’s total spectral irradiance given any viewing and illumination geometry is provided by USGS’s RObotic Lunar Observatory (ROLO) model.
• ROLO IMPROVEMENT - Very accurate measurements of lunar irradiance could expand the use of ROLO to a broader range of applications of the Moon as a reference for ocean color missions.
From Eplee et al. (unpublished)
4
55
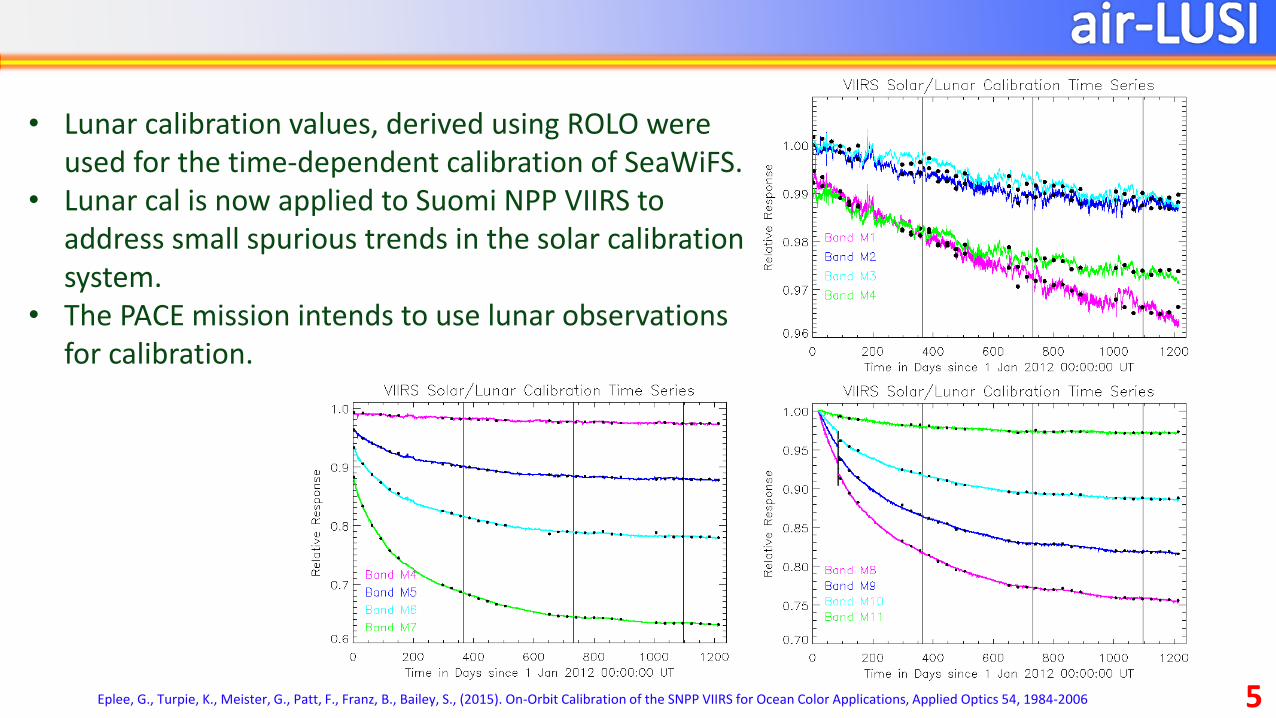
• Lunar calibration values, derived using ROLO were used for the time-dependent calibration of SeaWiFS.
• Lunar cal is now applied to Suomi NPP VIIRS to address small spurious trends in the solar calibration system.
• The PACE mission intends to use lunar observations for calibration.
Eplee, G., Turpie, K., Meister, G., Patt, F., Franz, B., Bailey, S., (2015). On-Orbit Calibration of the SNPP VIIRS for Ocean Color Applications, Applied Optics 54, 1984-2006
6S. Lachérade — CNES
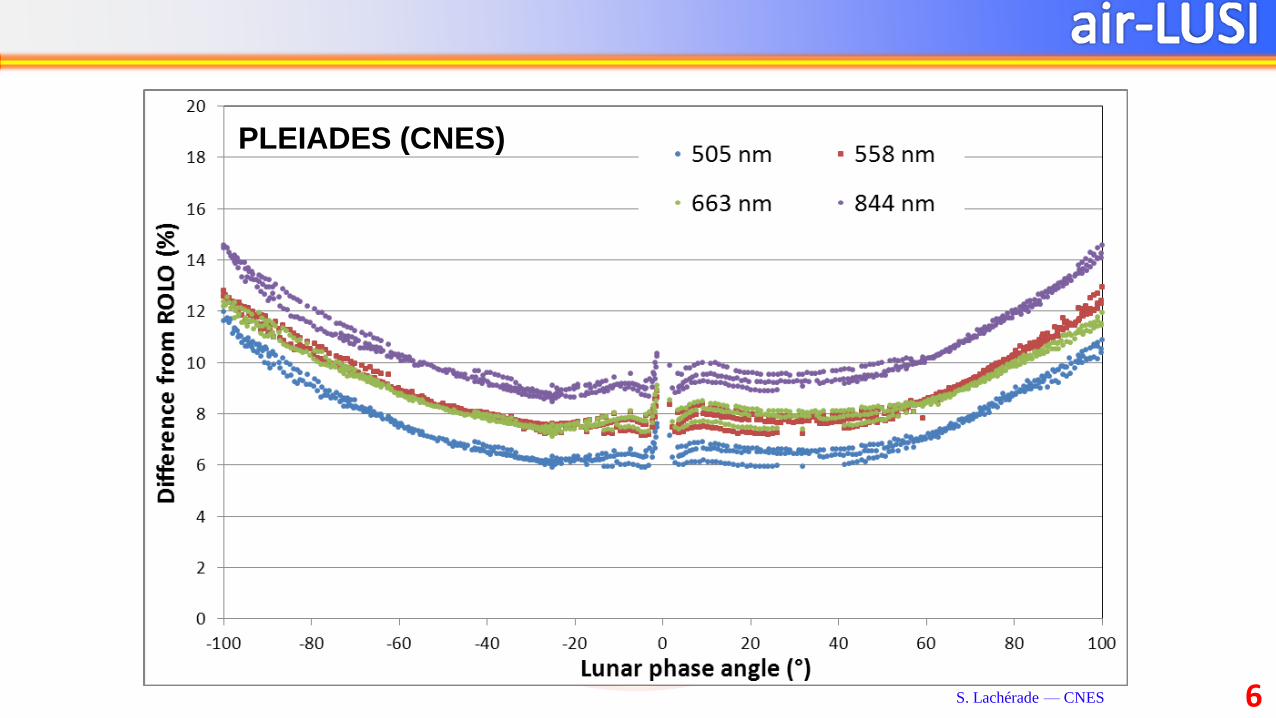
PLEIADES (CNES)
7From Tom Stone, CEOS WGCV IVOS-29 Meeting 15 Mar 2017
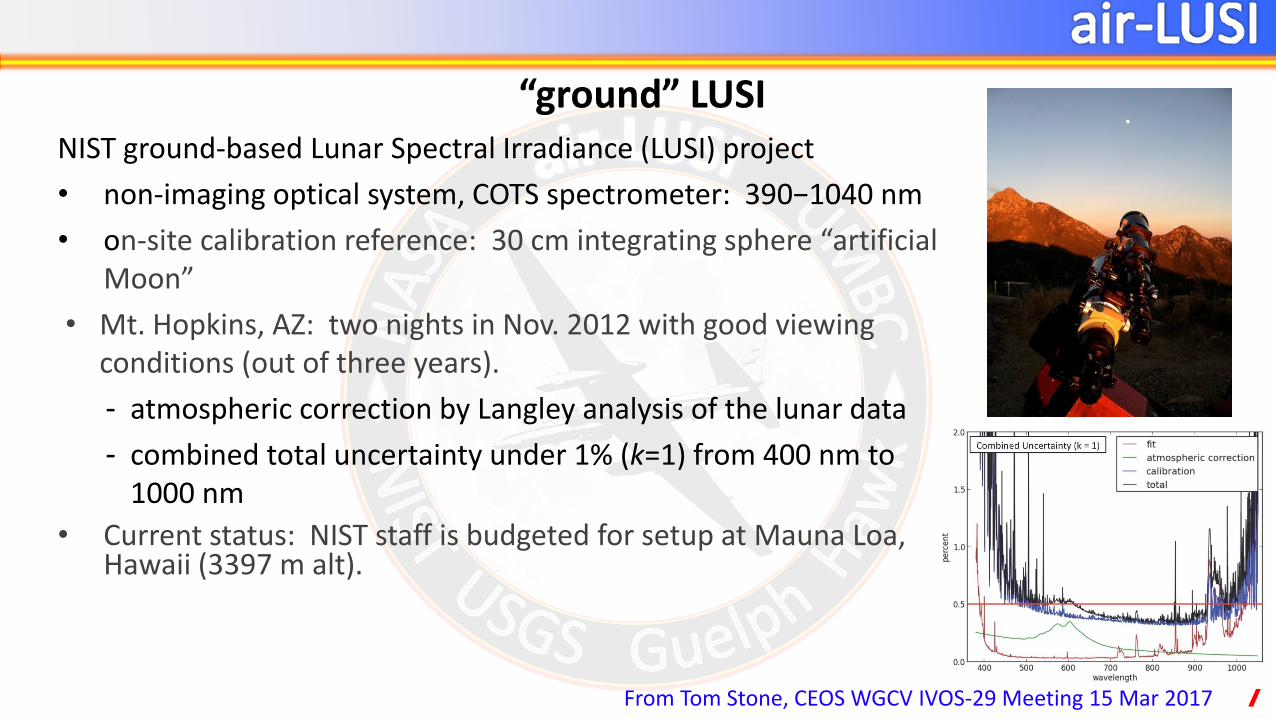
“ground” LUSINIST ground-based Lunar Spectral Irradiance (LUSI) project
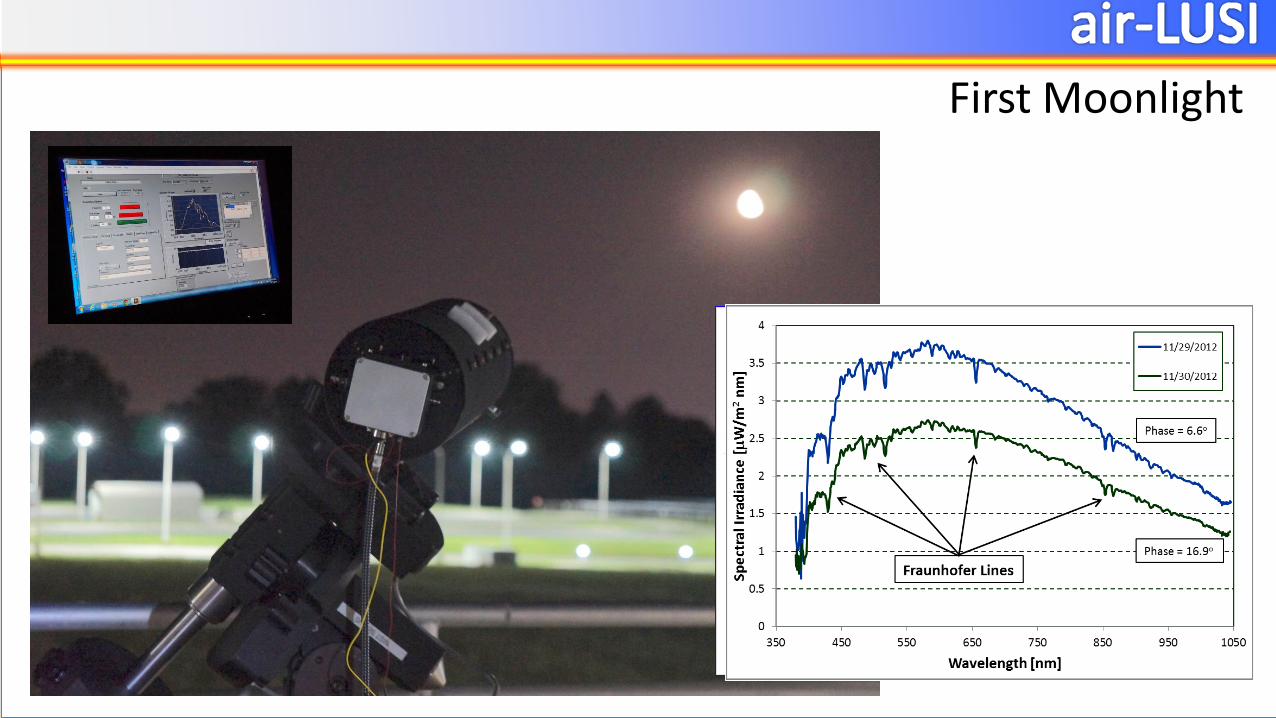
• non-imaging optical system, COTS spectrometer: 390−1040 nm
• on-site calibration reference: 30 cm integrating sphere “artificial Moon”
• Mt. Hopkins, AZ: two nights in Nov. 2012 with good viewing conditions (out of three years).
- atmospheric correction by Langley analysis of the lunar data
- combined total uncertainty under 1% (k=1) from 400 nm to 1000 nm
• Current status: NIST staff is budgeted for setup at Mauna Loa, Hawaii (3397 m alt).
8
• Advance the ground-based LUSI instrument system to fly on an ER-2 aircraft to measure lunar spectral irradiance ultimately to an unprecedented level of accuracy (<0.3% k=1 uncertainty) by flying above 90% of the Earth's atmosphere.
• Provide a capability to operationally acquire SI-traceable extraterrestrial lunar spectral irradiance over a broad range of viewing angles, lunar phases, and libration angles.
Impact: air-LUSI measurements can be used to enhance the Robotic Lunar Observatory (ROLO) model of exo-atmospheric lunar spectral irradiance, thus providing a highly accurate, stable calibration reference for Earth-observing satellite instruments over long time periods from the past into the future.
This is of particular value for space-based ocean color measurements, such as those from SeaWiFS, MODIS, VIIRS and PACE.
Objective air-LUSI
9
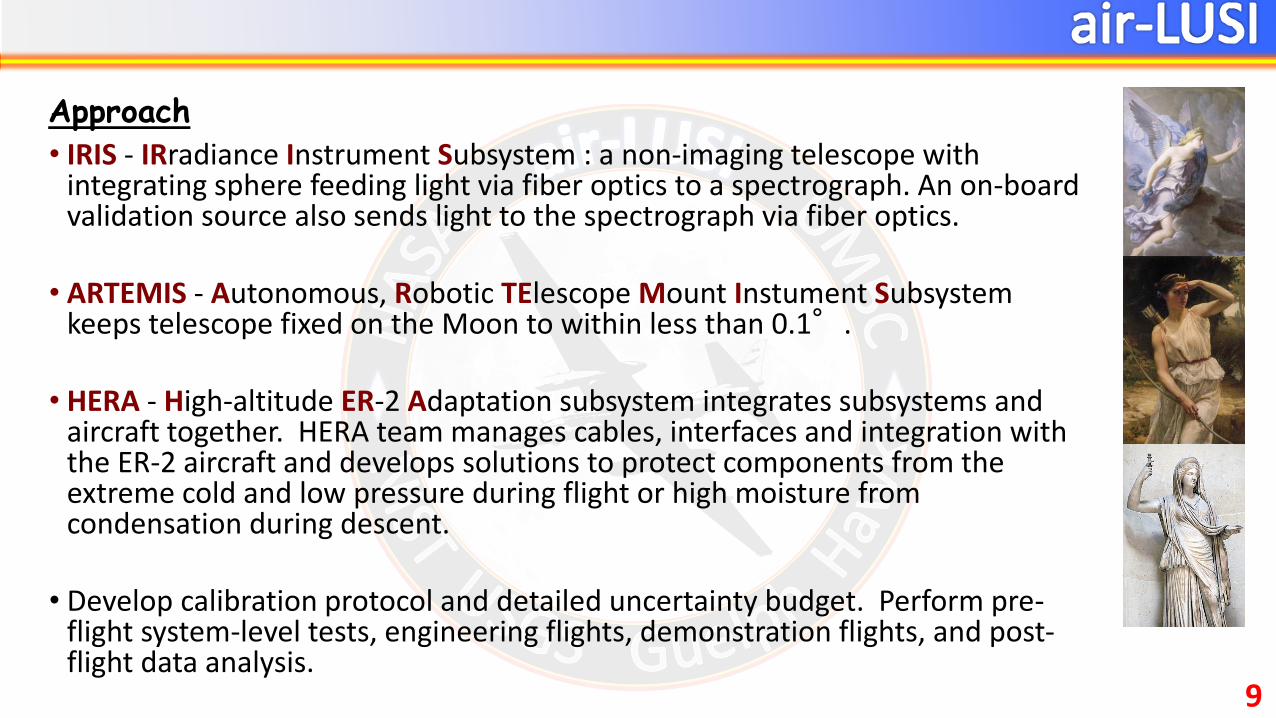
• IRIS - IRradiance Instrument Subsystem : a non-imaging telescope with integrating sphere feeding light via fiber optics to a spectrograph. An on-board validation source also sends light to the spectrograph via fiber optics.
• ARTEMIS - Autonomous, Robotic TElescope Mount Instument Subsystem keeps telescope fixed on the Moon to within less than 0.1°.
• HERA - High-altitude ER-2 Adaptation subsystem integrates subsystems and aircraft together. HERA team manages cables, interfaces and integration with the ER-2 aircraft and develops solutions to protect components from the extreme cold and low pressure during flight or high moisture from condensation during descent.
• Develop calibration protocol and detailed uncertainty budget. Perform pre-flight system-level tests, engineering flights, demonstration flights, and post-flight data analysis.
Approach
1010
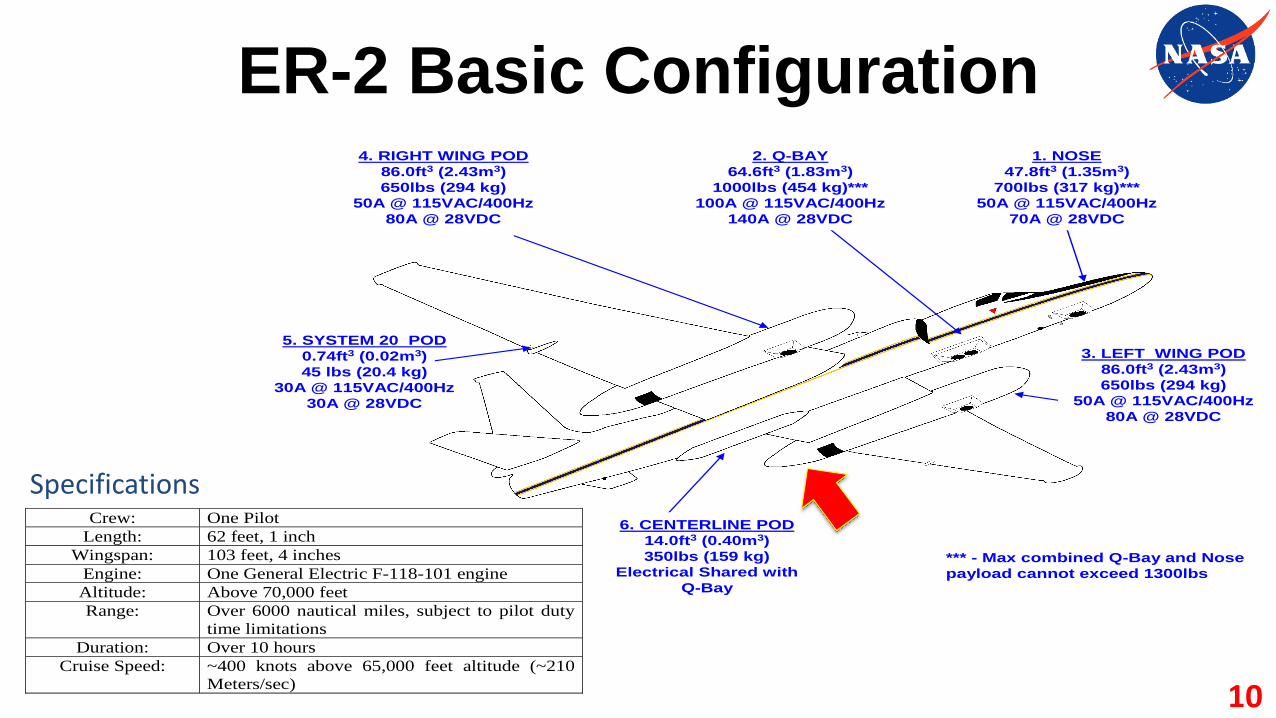
ER-2 Basic Configuration4. RIGHT WING POD
86.0ft3 (2.43m3)
650lbs (294 kg)
50A @ 115VAC/400Hz
80A @ 28VDC
3. LEFT WING POD
86.0ft3 (2.43m3)
650lbs (294 kg)
50A @ 115VAC/400Hz
80A @ 28VDC
1. NOSE
47.8ft3 (1.35m3)
700lbs (317 kg)***
50A @ 115VAC/400Hz
70A @ 28VDC
2. Q-BAY
64.6ft3 (1.83m3)
1000lbs (454 kg)***
100A @ 115VAC/400Hz
140A @ 28VDC
6. CENTERLINE POD
14.0ft3 (0.40m3)
350lbs (159 kg)
Electrical Shared with
Q-Bay
*** - Max combined Q-Bay and Nose
payload cannot exceed 1300lbs
5. SYSTEM 20 POD
0.74ft3 (0.02m3)
45 lbs (20.4 kg)
30A @ 115VAC/400Hz
30A @ 28VDC
Crew: One Pilot
Length: 62 feet, 1 inch
Wingspan: 103 feet, 4 inches
Engine: One General Electric F-118-101 engine
Altitude: Above 70,000 feet
Range: Over 6000 nautical miles, subject to pilot duty
time limitations
Duration: Over 10 hours
Cruise Speed: ~400 knots above 65,000 feet altitude (~210
Meters/sec)
Specifications
11
Autonomic Robotic TElescope Mount Instrument Subsystem
(ARTEMIS)
12
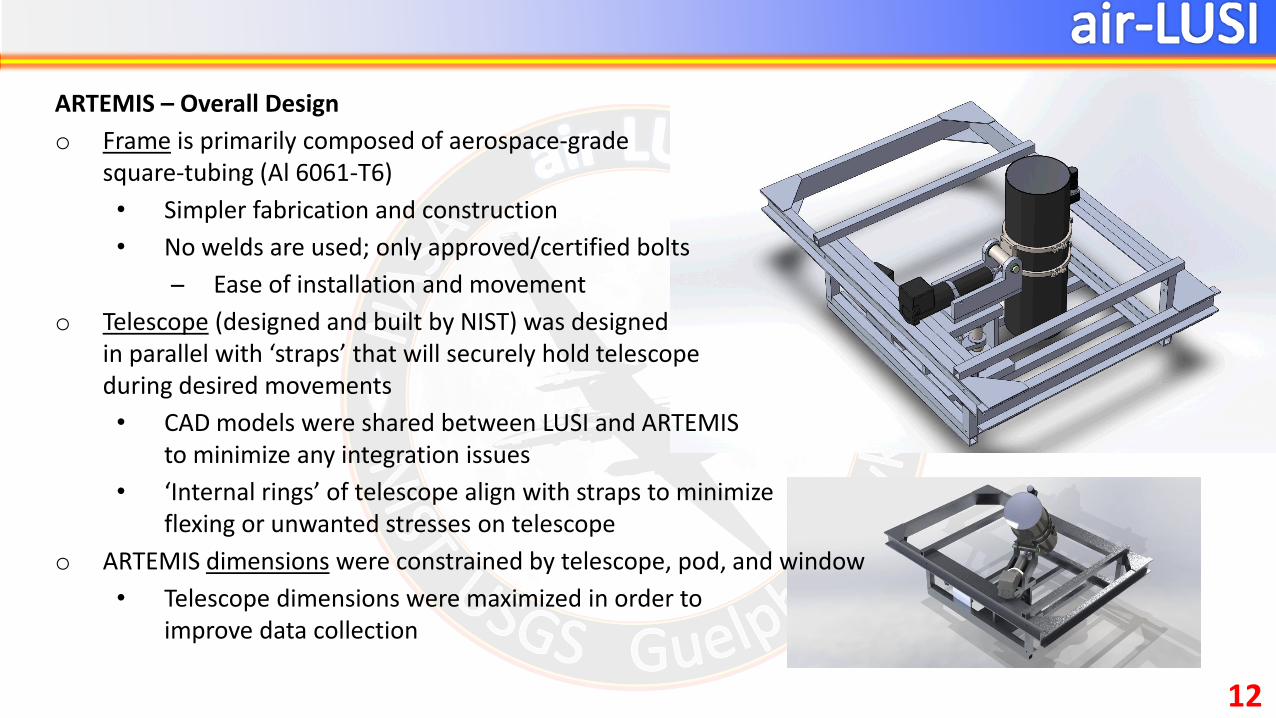
ARTEMIS – Overall Design
o Frame is primarily composed of aerospace-gradesquare-tubing (Al 6061-T6)
• Simpler fabrication and construction
• No welds are used; only approved/certified bolts
Ease of installation and movement
o Telescope (designed and built by NIST) was designedin parallel with ‘straps’ that will securely hold telescopeduring desired movements
• CAD models were shared between LUSI and ARTEMISto minimize any integration issues
• ‘Internal rings’ of telescope align with straps to minimizeflexing or unwanted stresses on telescope
o ARTEMIS dimensions were constrained by telescope, pod, and window
• Telescope dimensions were maximized in order to improve data collection
13
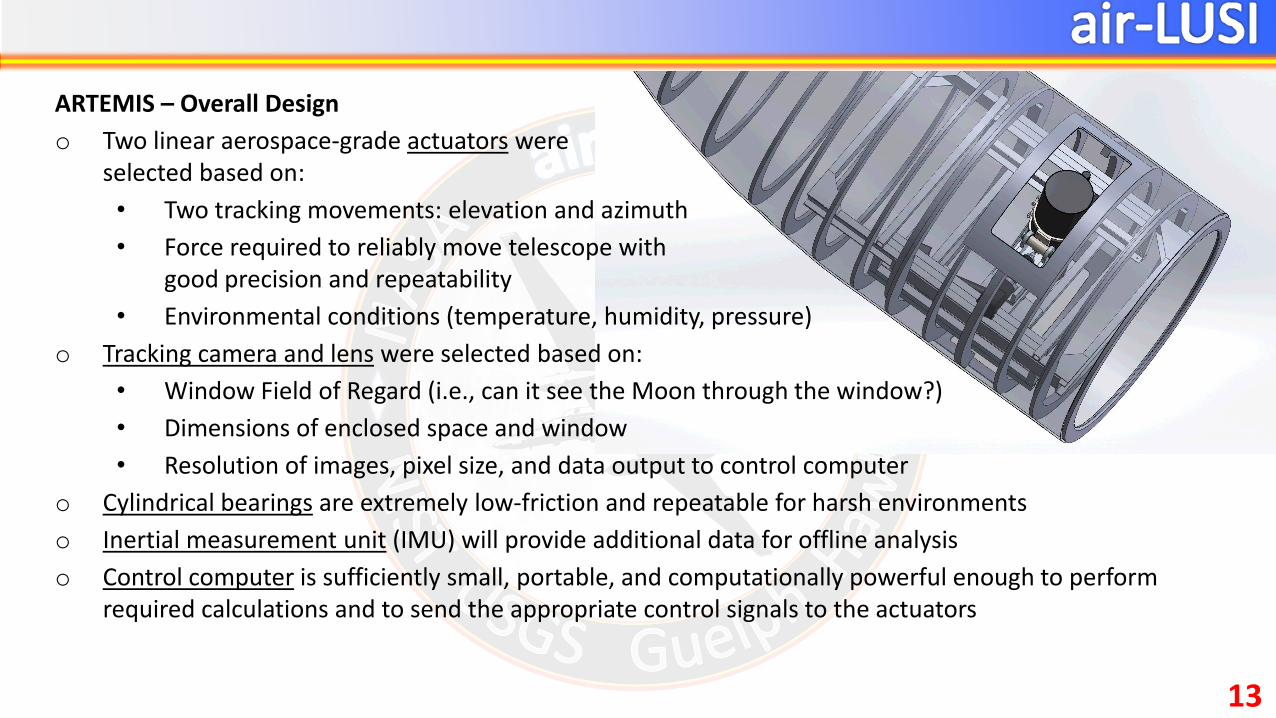
ARTEMIS – Overall Design
o Two linear aerospace-grade actuators were selected based on:
• Two tracking movements: elevation and azimuth
• Force required to reliably move telescope withgood precision and repeatability
• Environmental conditions (temperature, humidity, pressure)
o Tracking camera and lens were selected based on:
• Window Field of Regard (i.e., can it see the Moon through the window?)
• Dimensions of enclosed space and window
• Resolution of images, pixel size, and data output to control computer
o Cylindrical bearings are extremely low-friction and repeatable for harsh environments
o Inertial measurement unit (IMU) will provide additional data for offline analysis
o Control computer is sufficiently small, portable, and computationally powerful enough to perform required calculations and to send the appropriate control signals to the actuators
14
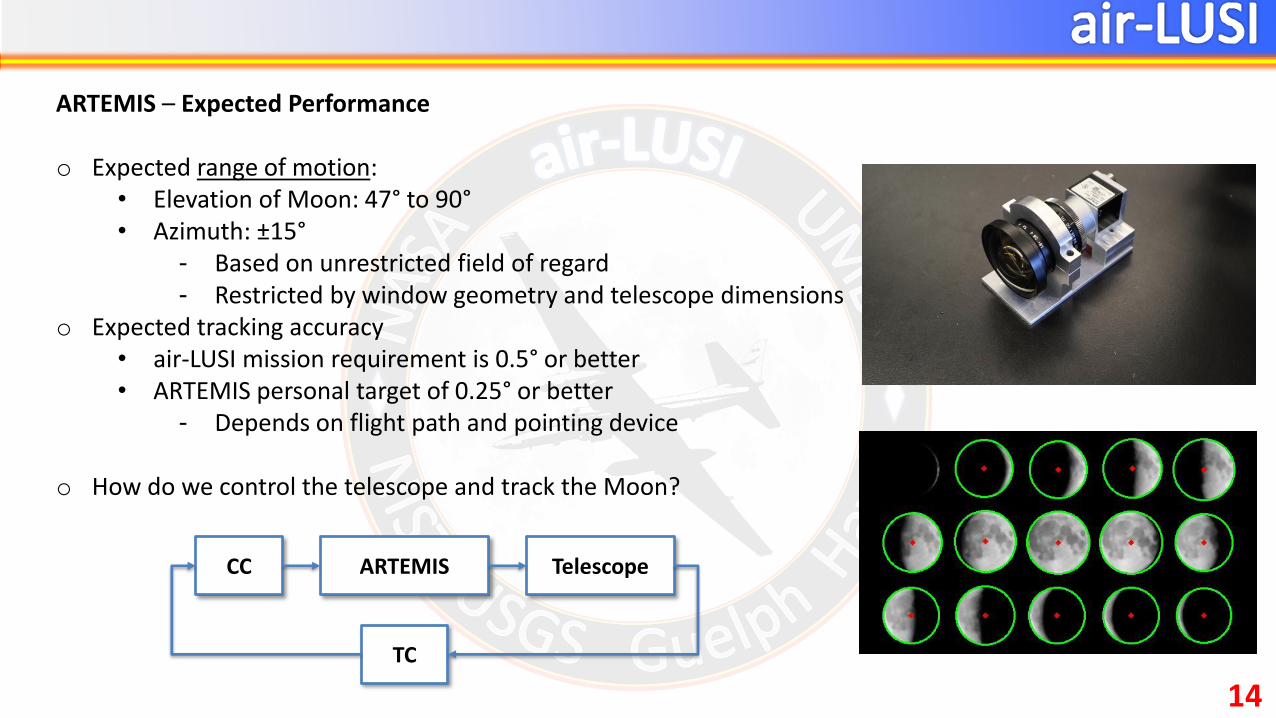
CC ARTEMIS Telescope
TC
ARTEMIS – Expected Performance
o Expected range of motion:• Elevation of Moon: 47° to 90°• Azimuth: ±15°
- Based on unrestricted field of regard- Restricted by window geometry and telescope dimensions
o Expected tracking accuracy• air-LUSI mission requirement is 0.5° or better• ARTEMIS personal target of 0.25° or better
- Depends on flight path and pointing device
o How do we control the telescope and track the Moon?
15
IRradiance Instrument Subsystem(IRIS)
16
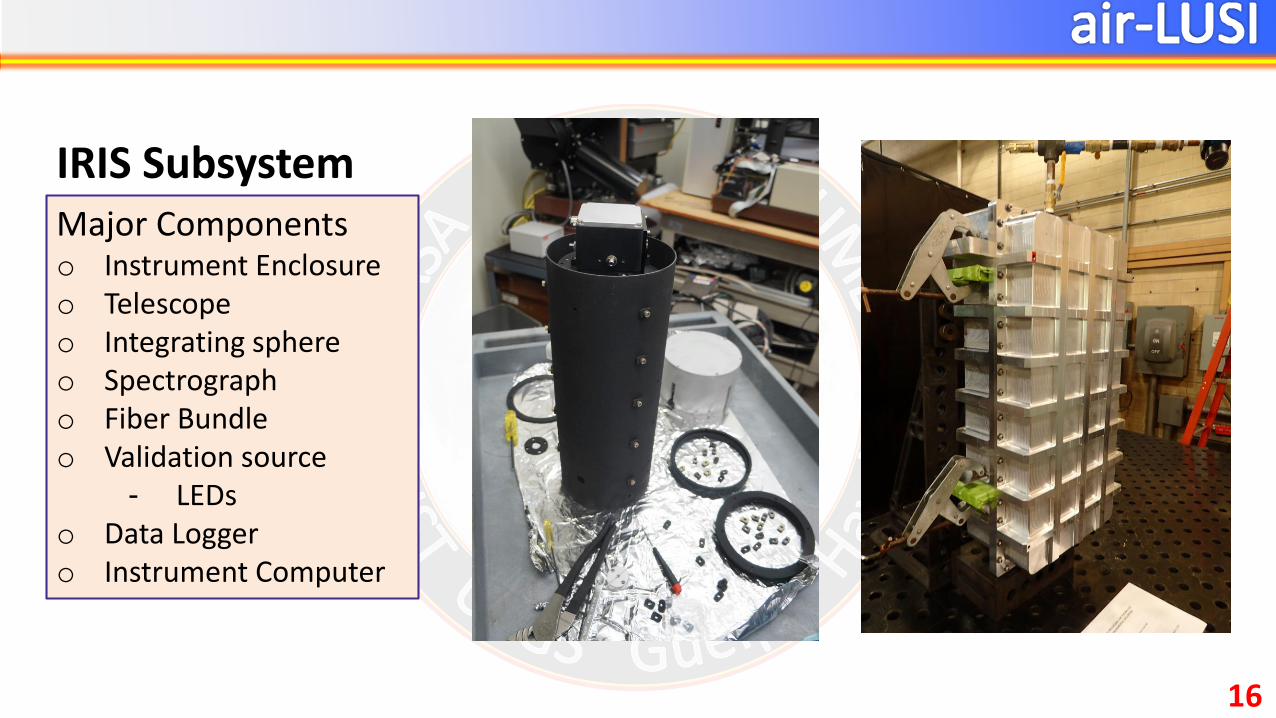
Major Componentso Instrument Enclosureo Telescopeo Integrating sphereo Spectrographo Fiber Bundleo Validation source
- LEDso Data Loggero Instrument Computer
IRIS Subsystem
17
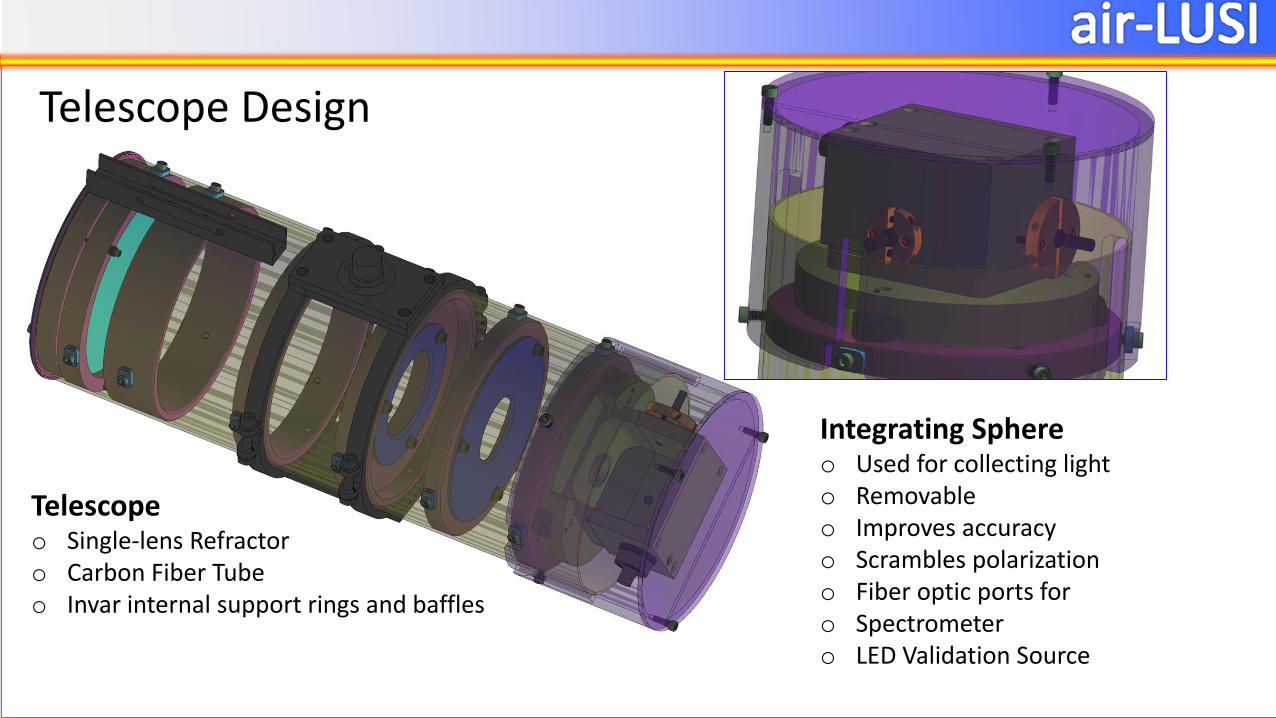
Telescope Design
Integrating Sphereo Used for collecting lighto Removableo Improves accuracyo Scrambles polarizationo Fiber optic ports foro Spectrometero LED Validation Source
Telescopeo Single-lens Refractoro Carbon Fiber Tubeo Invar internal support rings and baffles
18
First Moonlight
19
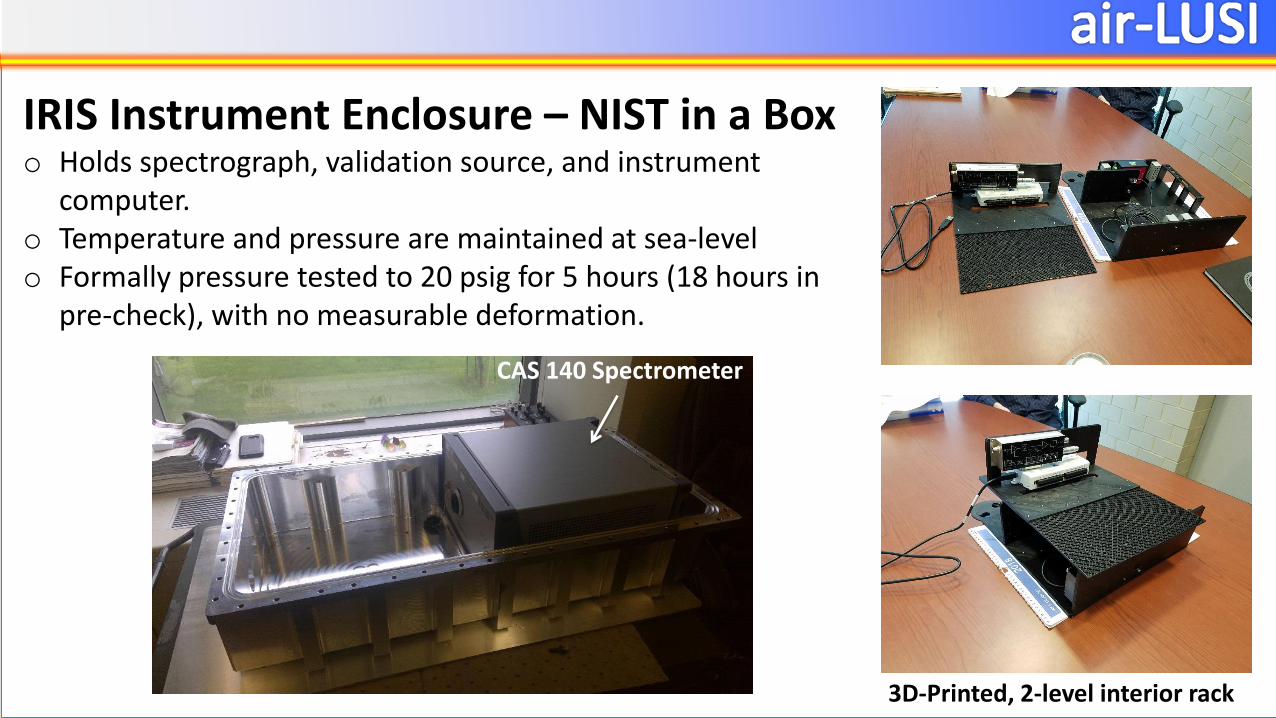
IRIS Instrument Enclosure – NIST in a Boxo Holds spectrograph, validation source, and instrument
computer.o Temperature and pressure are maintained at sea-levelo Formally pressure tested to 20 psig for 5 hours (18 hours in
pre-check), with no measurable deformation.
CAS 140 Spectrometer
3D-Printed, 2-level interior rack
20
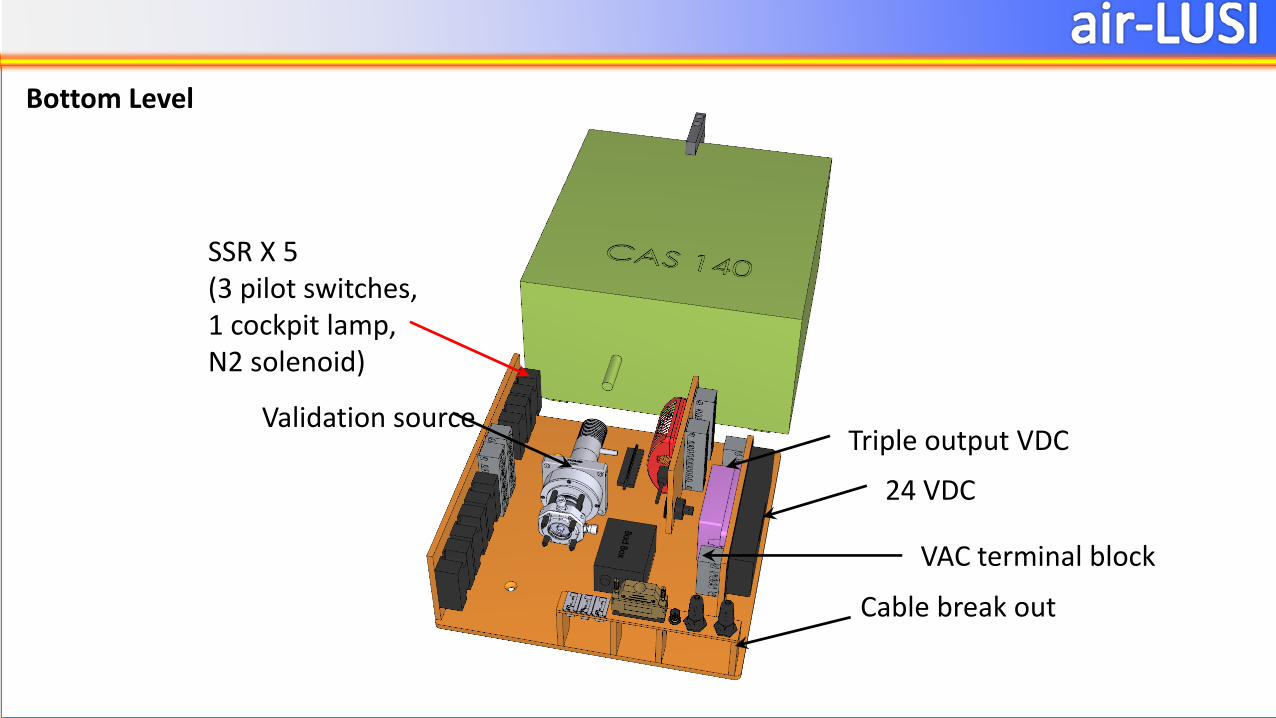
Bottom Level
Cable break out
24 VDC
Triple output VDC
VAC terminal block
Validation source
SSR X 5(3 pilot switches, 1 cockpit lamp, N2 solenoid)
21
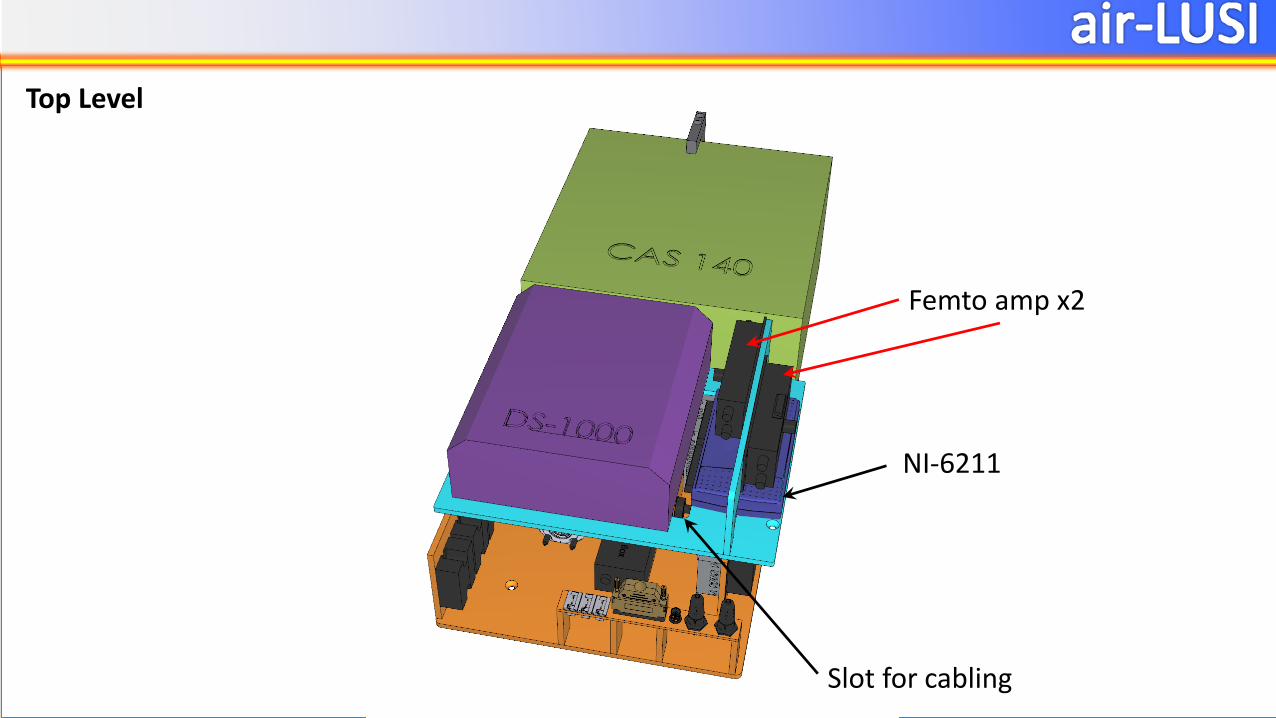
Top Level
Slot for cabling
Femto amp x2
NI-6211
22
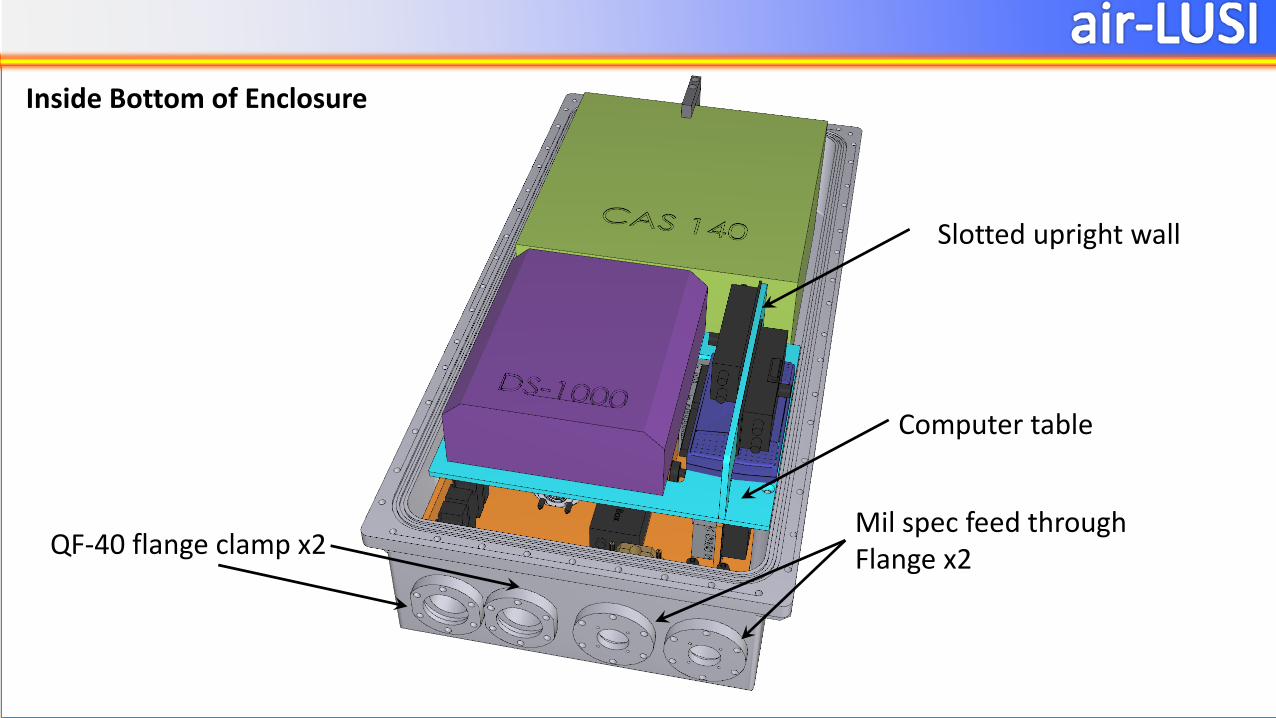
CAS 140 Spectrometer
QF-40 flange clamp x2Mil spec feed through Flange x2
Computer table
Inside Bottom of Enclosure
Slotted upright wall
23
o Engineering flights are scheduled for data collects at 0400 Aug 1 & 2.
o ARTEMIS is being moved from U of Guelph to NIST today and integration begins.
o Parts for Thermal Management System (HERA) are already at NIST.
o Cables are being prepared for integration (HERA).
o IRIS Enclosure will be populated in the next week.
o Several tests are planned for subsystems and systems before shipping to AFRC.
• Thermal Tests (T/VAC & Environmental Chamber)
• Alignment Calibration for ARTEMIS
• “Pick-Up” test – Full system mobile, tracking the Moon (late June).
o Shipping is schedule for 13 July 2018, with arrival on 16 July 2018
o Team mobilizes and arrives at AFRC on 16 July to begin aircraft integration work.
o Current Priorities: Thermal Management System functionality, Cable development, and meeting all airworthiness targets.
PREPARATION BEFORE MAIDEN FLIGHTS
24
THANK YOU
25
BACKUP SLIDES
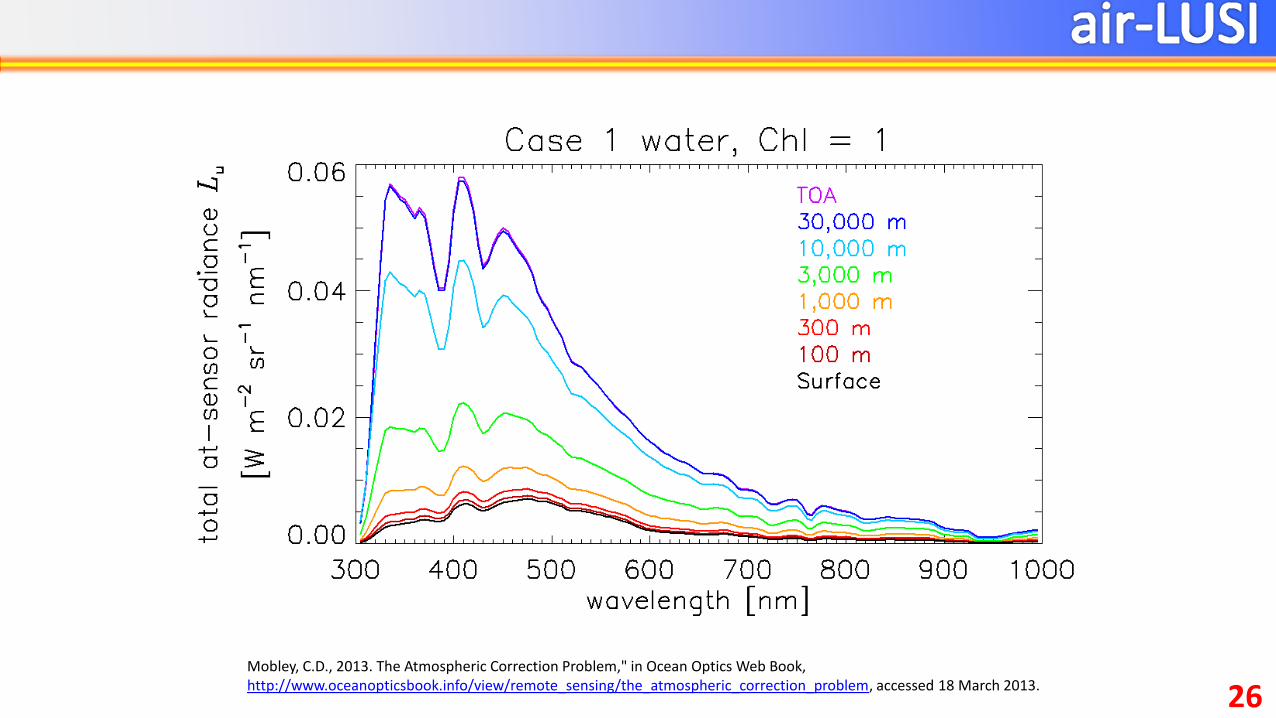
26Mobley, C.D., 2013. The Atmospheric Correction Problem," in Ocean Optics Web Book, http://www.oceanopticsbook.info/view/remote_sensing/the_atmospheric_correction_problem, accessed 18 March 2013. 26
27
It was also observed that radiometric errors in the NIR bands affected all nLw values at a
level comparable to the responses to single band radiometric errors, as shown in Figures
4b, 4c, 4e, and 4f. The role of the 748nm and 869nm bands in the aerosol component of
the atmospheric correction algorithm causes the response in these bands to have opposite
sign. Thus, radiometric errors that are correlated between these bands, although still
significant, tend to cancel, while anti-correlated radiometric errors would increase the
response substantially. When the NIR bands were perturbed independently from each
other, the visible nLw values showed sensitivity to the input errors in the 748nm band
similar in magnitude to sensitivity to errors in visible bands, but with an opposite sign
(see Figures 4b and 4e). This is probably because this channel has a relatively strong
effect on the slope for the extrapolated optical depth in the visible bands. It is worth
noting however, that despite the extrapolation in the blue direction, the sensitivity of the
nLw at 670nm is greatest, and for perturbation of the 748nm band, the sensitivity
continues to decrease for increasingly smaller wavelength nLw values. This is likely the
9
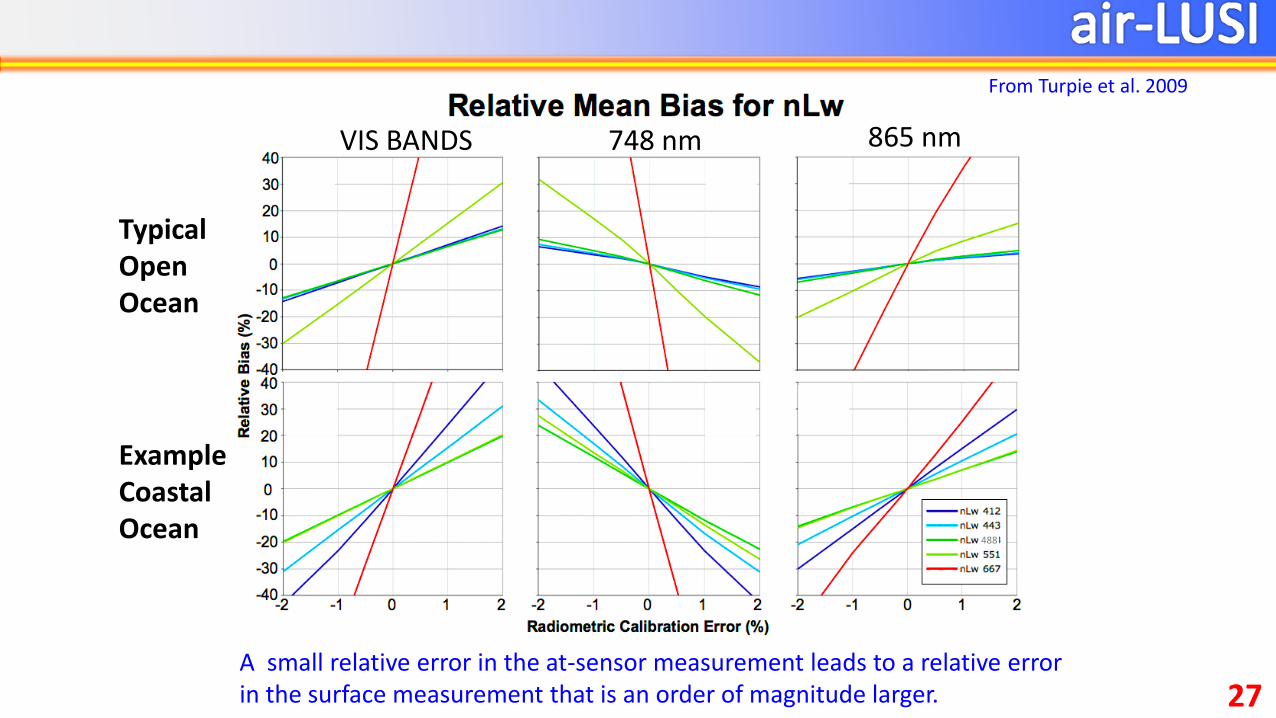
Figure 4 - A radiometric calibration error was applied to individual bands to observe
the affect on the normalized water-leaving radiance (nLw) for the visible bands.
Shown is the resulting relative mean bias in nLw, which is the ratio of the mean nLw
error to the scene average, as a function of input radiometric calibration error in the
corresponding visible bands (a for the open ocean scene and d for the coastal water
scene), the 748nm band (b for the open ocean scene and e for the coastal water
scene), and the 869nm band (c for the open ocean scene and f for the coastal water
scene). Note that for d and f, the lines for the 488nm band (green) and 552nm band
(yellow-green) tend to overlap.
VIS BANDS 748 nm 865 nm
TypicalOpenOcean
ExampleCoastalOcean
488
A small relative error in the at-sensor measurement leads to a relative error in the surface measurement that is an order of magnitude larger.
From Turpie et al. 2009
28
single band perturbations, nLw for 667nm is the most affected. There was less data loss
nLw for 412, 443, and 488nm over the open ocean, but nearly all of the data for all nLw
values exceeded the error threshold of 5% for the coastal scene.
The standard NASA chlorophyll a concentration algorithm is a function of certain nLw
ratios; however, opposite-signed errors in the NIR TOA radiance can have an effect.
Unlike nLw, such an effect is mitigated by the fact that the resulting nLw errors are like-
14
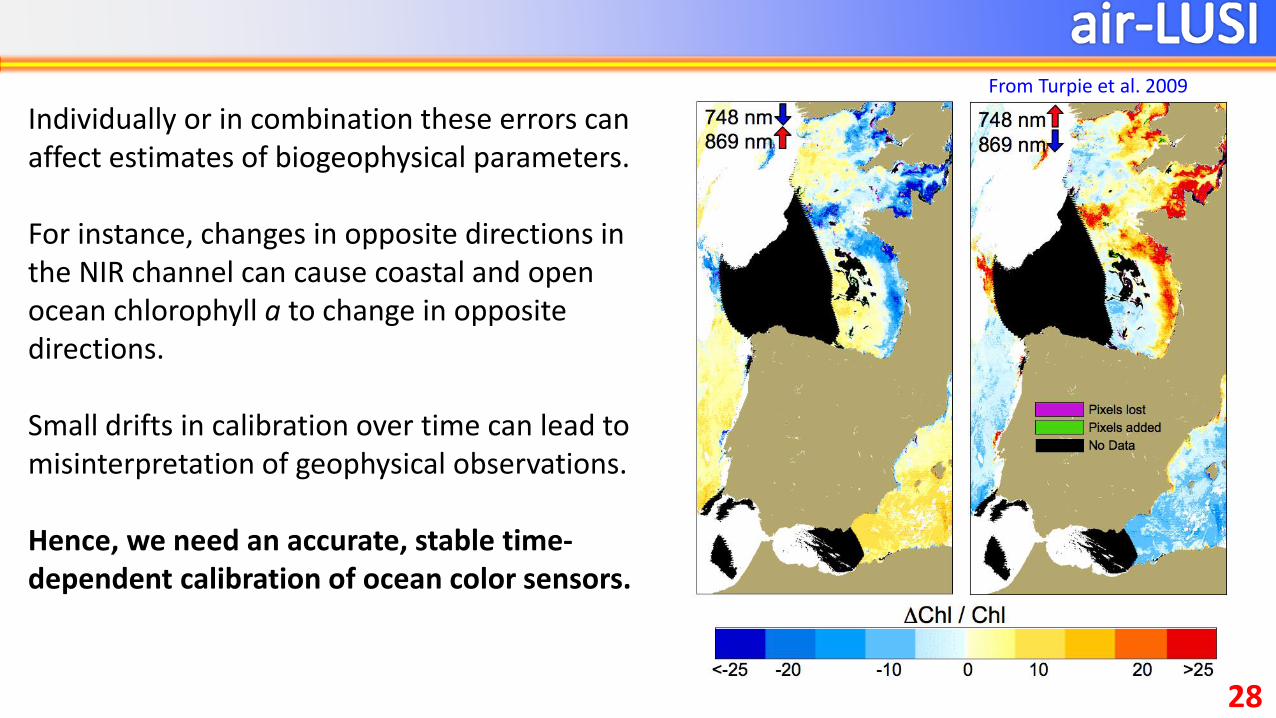
Figure 8 - Shown are the effects of 0.3% opposite-signed errors across the NIR
band pair on chlorophyll for Scene 2. The errors are also mostly within accuracy
and precision specs; however, the effects change sign across the scene, causing a
steeper spatial gradient in Chl.
Individually or in combination these errors can affect estimates of biogeophysical parameters.
For instance, changes in opposite directions in the NIR channel can cause coastal and open ocean chlorophyll a to change in opposite directions.
Small drifts in calibration over time can lead to misinterpretation of geophysical observations.
Hence, we need an accurate, stable time-dependent calibration of ocean color sensors.
From Turpie et al. 2009
28
29
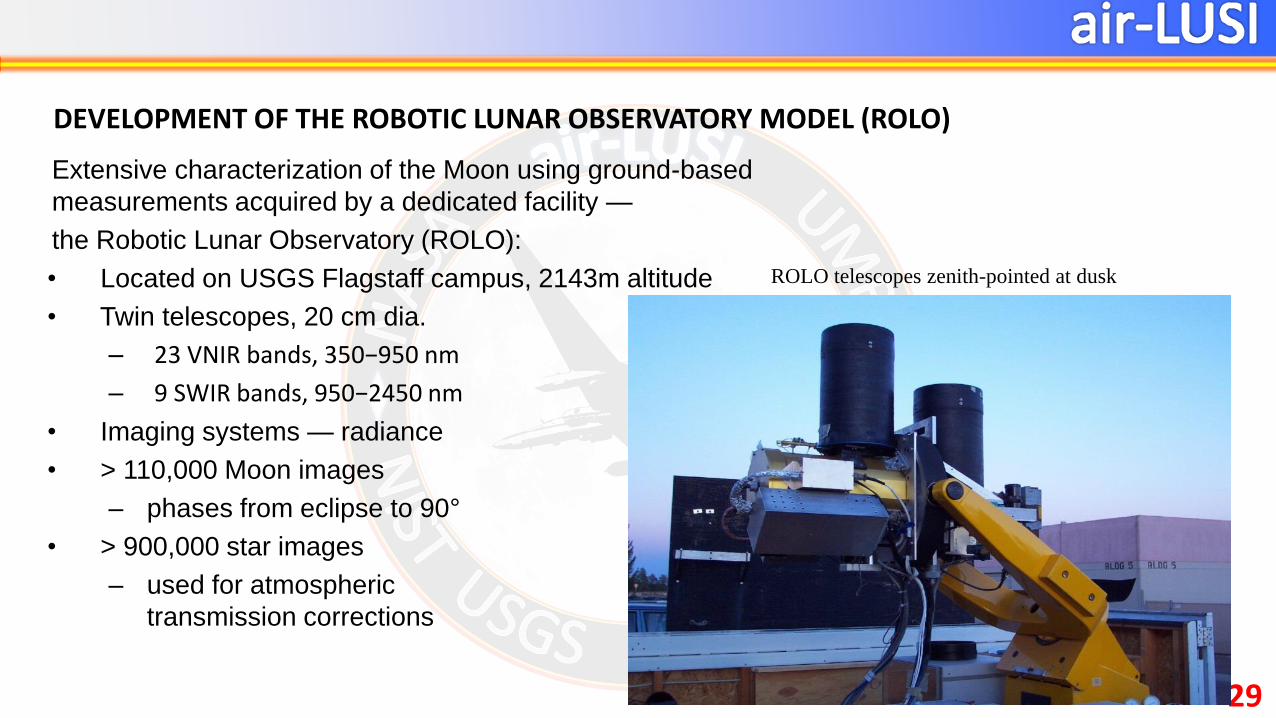
Extensive characterization of the Moon using ground-based
measurements acquired by a dedicated facility —
the Robotic Lunar Observatory (ROLO):
• Located on USGS Flagstaff campus, 2143m altitude
• Twin telescopes, 20 cm dia.
– 23 VNIR bands, 350−950 nm
– 9 SWIR bands, 950−2450 nm
• Imaging systems — radiance
• > 110,000 Moon images
– phases from eclipse to 90°
• > 900,000 star images
– used for atmospheric
transmission corrections
DEVELOPMENT OF THE ROBOTIC LUNAR OBSERVATORY MODEL (ROLO)
ROLO telescopes zenith-pointed at dusk
30
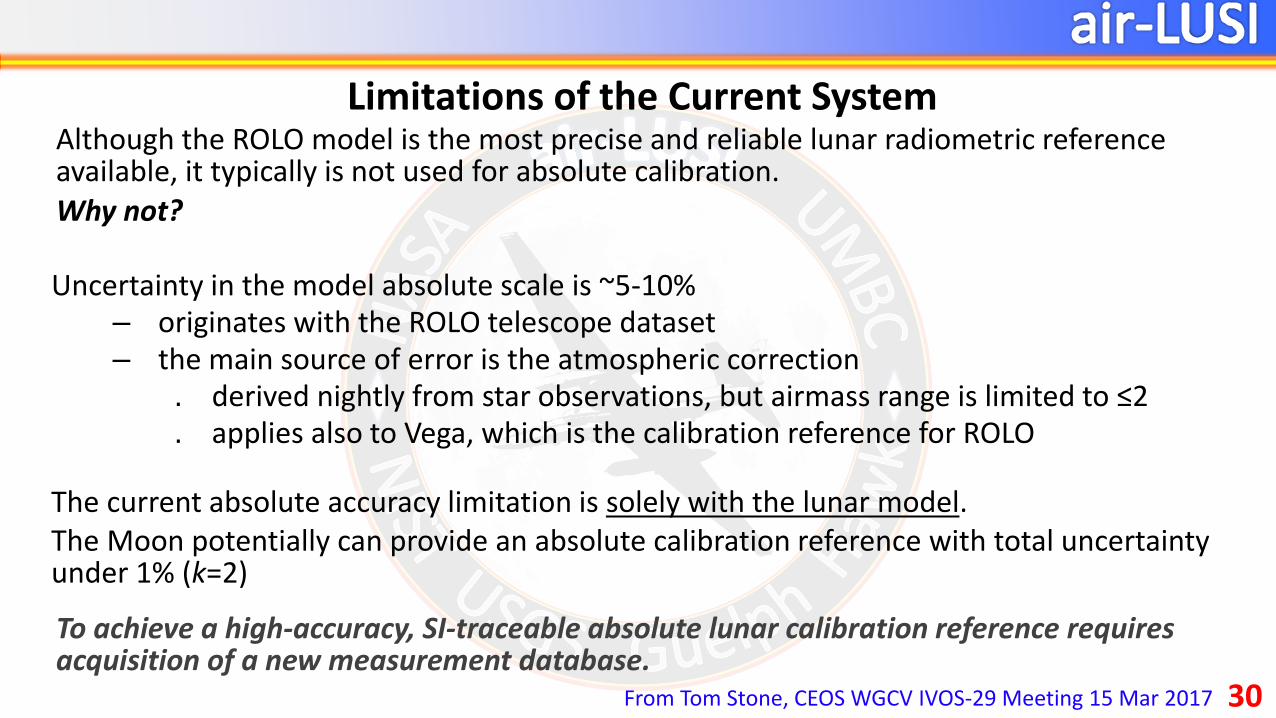
Although the ROLO model is the most precise and reliable lunar radiometric reference available, it typically is not used for absolute calibration.Why not?
Uncertainty in the model absolute scale is ~5-10%– originates with the ROLO telescope dataset– the main source of error is the atmospheric correction
. derived nightly from star observations, but airmass range is limited to ≤2
. applies also to Vega, which is the calibration reference for ROLO
The current absolute accuracy limitation is solely with the lunar model.The Moon potentially can provide an absolute calibration reference with total uncertainty under 1% (k=2)
To achieve a high-accuracy, SI-traceable absolute lunar calibration reference requires acquisition of a new measurement database.
From Tom Stone, CEOS WGCV IVOS-29 Meeting 15 Mar 2017
Limitations of the Current System
31
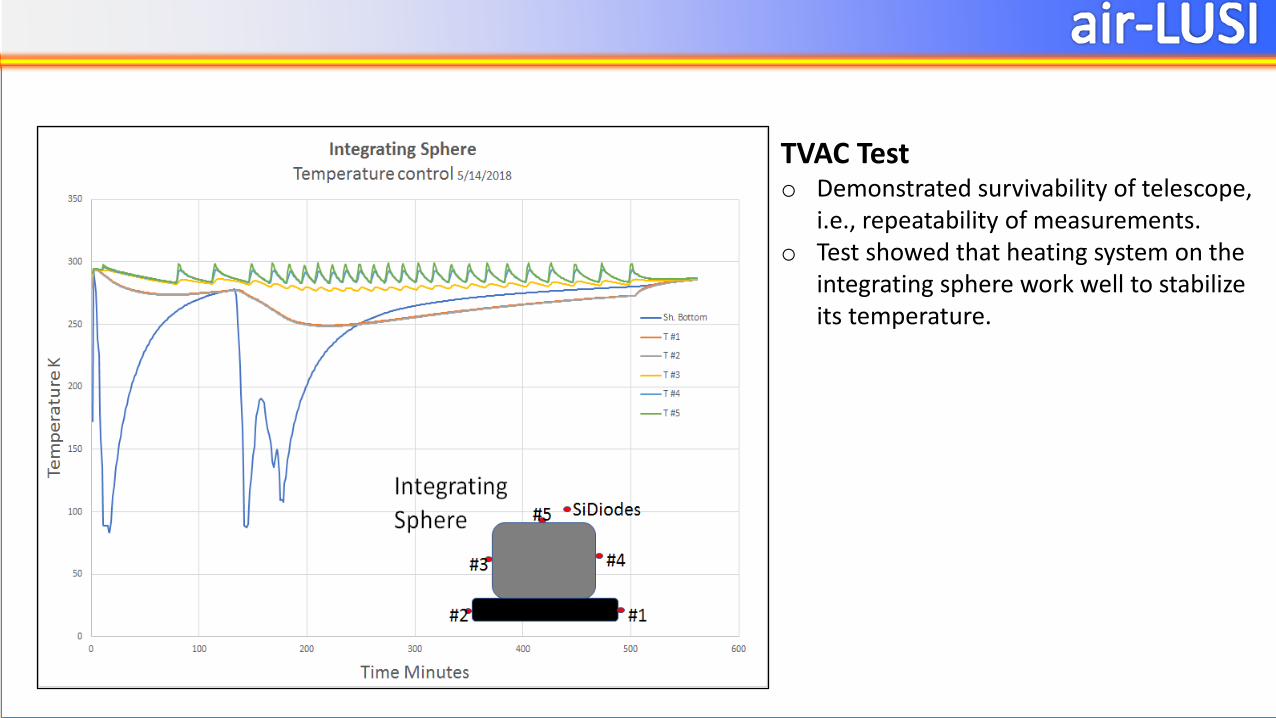
TVAC Testo Demonstrated survivability of telescope,
i.e., repeatability of measurements.o Test showed that heating system on the
integrating sphere work well to stabilize its temperature.
32
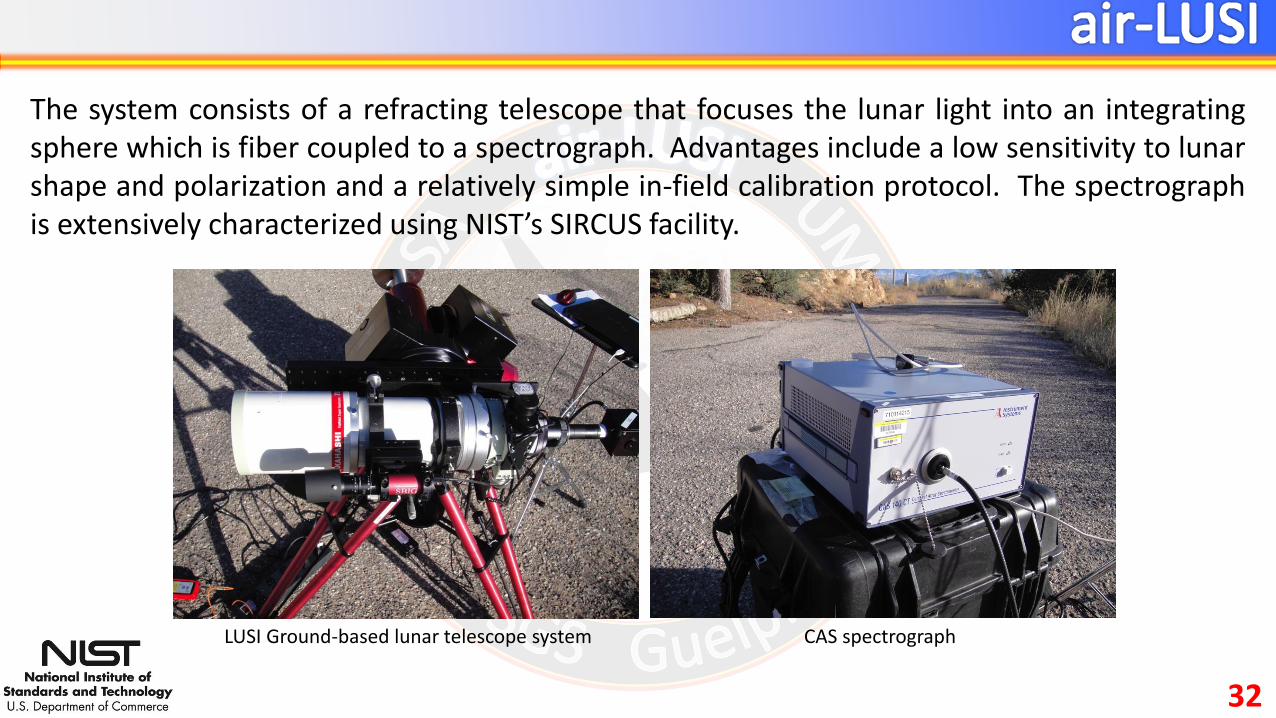
The system consists of a refracting telescope that focuses the lunar light into an integratingsphere which is fiber coupled to a spectrograph. Advantages include a low sensitivity to lunarshape and polarization and a relatively simple in-field calibration protocol. The spectrographis extensively characterized using NIST’s SIRCUS facility.
LUSI Ground-based lunar telescope system CAS spectrograph
33
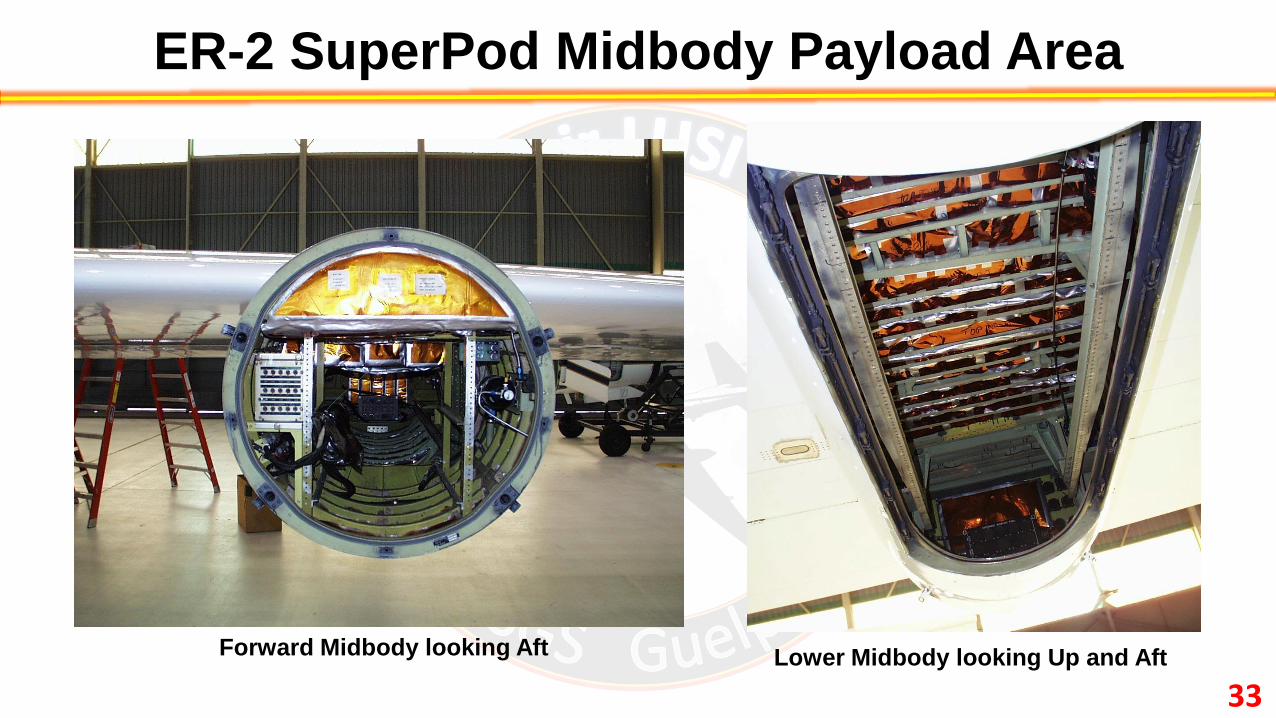
Forward Midbody looking Aft Lower Midbody looking Up and Aft
ER-2 SuperPod Midbody Payload Area
34
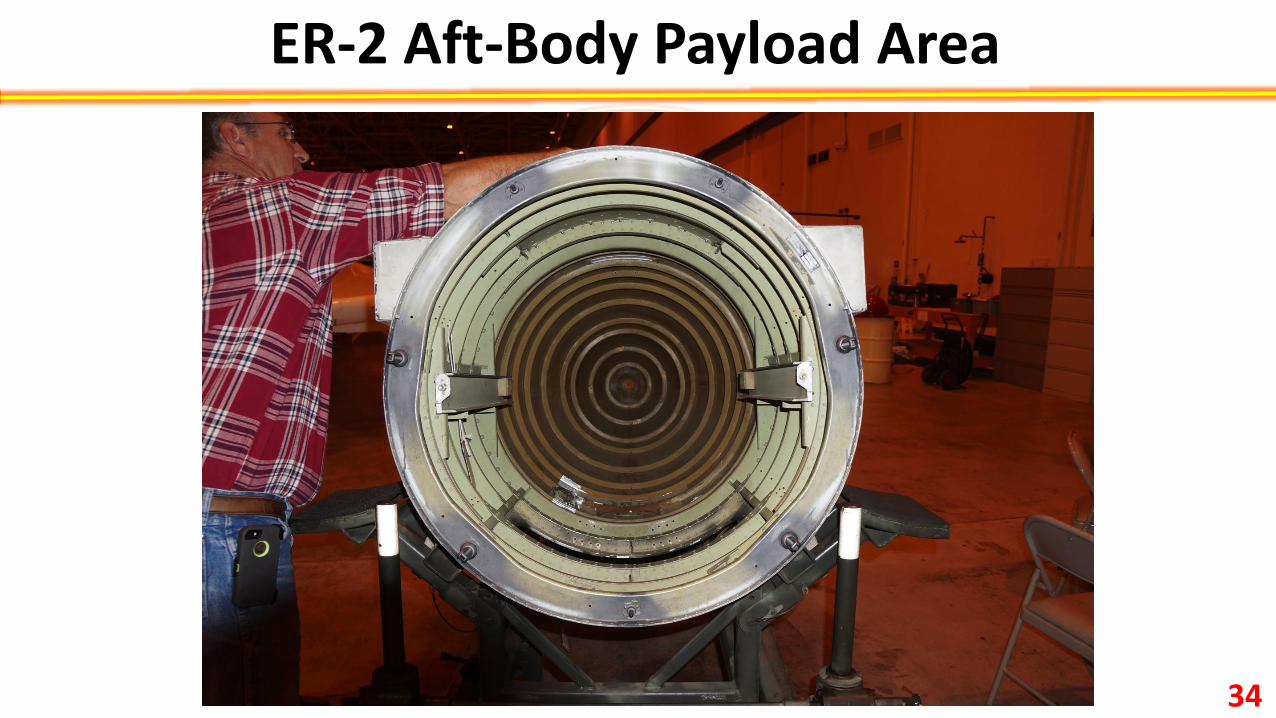
ER-2 Aft-Body Payload Area
35
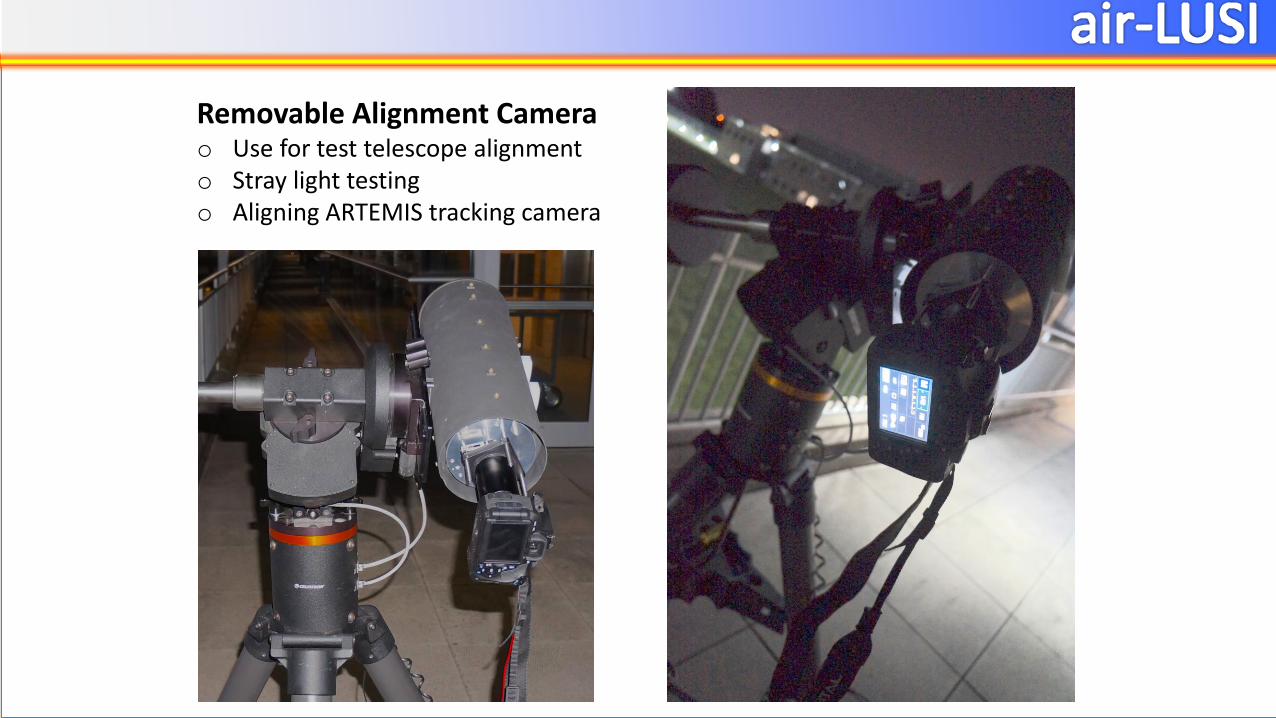
Removable Alignment Camerao Use for test telescope alignmento Stray light testingo Aligning ARTEMIS tracking camera
36
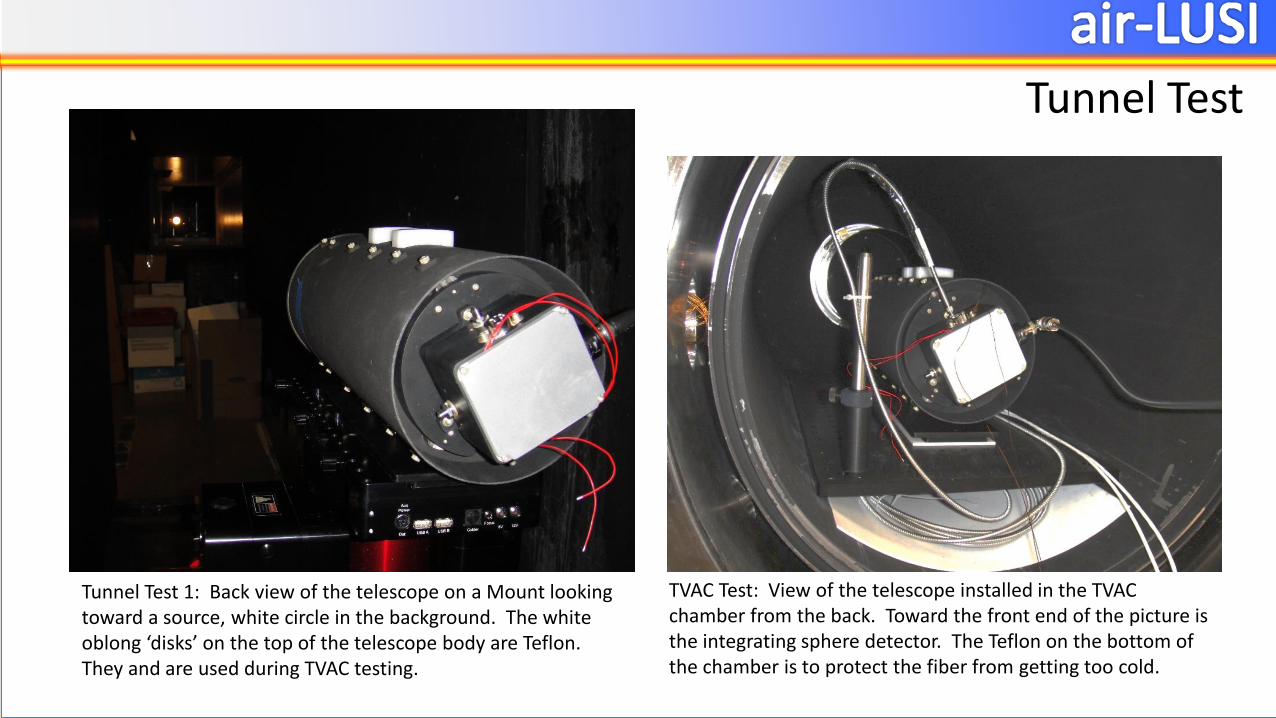
Tunnel Test
Tunnel Test 1: Back view of the telescope on a Mount looking toward a source, white circle in the background. The white oblong ‘disks’ on the top of the telescope body are Teflon. They and are used during TVAC testing.
TVAC Test: View of the telescope installed in the TVAC chamber from the back. Toward the front end of the picture is the integrating sphere detector. The Teflon on the bottom of the chamber is to protect the fiber from getting too cold.


![Monostatic Calibration of both TanDEM-X Satellites€¦ · Monostatic Calibration of both TanDEM-X Satellites ... Delta Range [m] Tests 2007 Mean 2007 ... Abs Cal Factor](https://img.pdfslide.us/doc/110x75/5ac35de27f8b9aa0518c3a72/monostatic-calibration-of-both-tandem-x-monostatic-calibration-of-both-tandem-x.jpg)