Embed Size (px)
Citation preview
Pairwise Statistical Significance of LocalSequence Alignment Using Sequence-Specific
and Position-Specific Substitution MatricesAnkit Agrawal and Xiaoqiu Huang
Abstract—Pairwise sequence alignment is a central problem in bioinformatics, which forms the basis of various other applications.
Two related sequences are expected to have a high alignment score, but relatedness is usually judged by statistical significance rather
than by alignment score. Recently, it was shown that pairwise statistical significance gives promising results as an alternative to
database statistical significance for getting individual significance estimates of pairwise alignment scores. The improvement was
mainly attributed to making the statistical significance estimation process more sequence-specific and database-independent. In this
paper, we use sequence-specific and position-specific substitution matrices to derive the estimates of pairwise statistical significance,
which is expected to use more sequence-specific information in estimating pairwise statistical significance. Experiments on a
benchmark database with sequence-specific substitution matrices at different levels of sequence-specific contribution were conducted,
and results confirm that using sequence-specific substitution matrices for estimating pairwise statistical significance is significantly
better than using a standard matrix like BLOSUM62, and than database statistical significance estimates reported by popular database
search programs like BLAST, PSI-BLAST (without pretrained PSSMs), and SSEARCH on a benchmark database, but with pretrained
PSSMs, PSI-BLAST results are significantly better. Further, using position-specific substitution matrices for estimating pairwise
statistical significance gives significantly better results even than PSI-BLAST using pretrained PSSMs.
Index Terms—Database statistical significance, homologs, pairwise statistical significance, position-specific scoring matrices
(PSSMs), sequence alignment, substitution matrices.
Ç
1 INTRODUCTION
SEQUENCE alignment is an underlying application in theanalysis and comparison of DNA and protein sequences
[1], [2], [3]. Although a computational problem, its primaryapplication in bioinformatics is homology detection, i.e.,identifying sequences evolved from a common ancestor,generally known as homologs or related sequences.Homology detection further forms the key step of manyother bioinformatics applications making various high levelinferences about the DNA and protein sequences likefinding protein function, protein structure, decipheringevolutionary relationships, etc. There exist several pro-grams for sequence alignment that use popular algorithms[4], [5], [6] , or their heuristic versions [7], [3], [8], [9], [10]. Alot of enhancements in alignment program features are alsoavailable [11], [12], [13] using difference blocks and multiplescoring matrices, in an attempt to capture some morebiological features in the alignment algorithm.
1.1 Why Statistical Significance?
Sequence alignment programs invariably report alignment
scores for the alignments constructed, and related (homo-
logous) sequences will have higher alignment scores. But the
threshold score above which the score can be considered
high depends on the alignment score distribution, andhence, estimating statistical significance of an alignmentscore is very useful in sequence comparison. An alignmentscore is considered statistically significant if it has a lowprobability of occurring by chance. The alignment scoredistribution depends on various factors like alignmentprogram, scoring scheme, sequence lengths, and sequencecompositions [14]. This implies that it is possible to havetwo scores x and y with x < y, but x more statisticallysignificant than y. For instance, two sequences of length 50may produce a highly statistically significant score of 75,whereas another two sequences each of length 250 mayhave an optimal alignment score of 100, which may not bestatistically significant. Therefore, instead of using thealignment score alone as the metric for homology, it is acommon practice to estimate the statistical significance of analignment score to comment on the relatedness of the twosequences being aligned. Of course, it is important to notehere that although statistical significance may be a goodpreliminary indicator of biological significance, it does notnecessarily imply biological significance [14], [15].
The knowledge of accurate statistics for score distribu-tion of ungapped alignments is available [16]. However,there is no rigorous statistical theory for the gappedalignment score distribution yet and for score distributionsfrom enhanced alignment programs using additionalfeatures like difference blocks [12] or multiple parametersets [13]. Accurate estimation of statistical significance ofgapped sequence alignment has attracted a lot of attentionin the recent years [17], [18], [19], [20], [21], [22], [23], [24],[25], [26], [27], [28], [29]. There exist a couple of good
194 IEEE/ACM TRANSACTIONS ON COMPUTATIONAL BIOLOGY AND BIOINFORMATICS, VOL. 8, NO. 1, JANUARY/FEBRUARY 2011
. The authors are with the Department of Computer Science, Iowa StateUniversity, 226 Atanasoff Hall, Ames, IA 50011-1041.E-mail: {ankitag, xqhuang}@iastate.edu.
Manuscript received 29 Sept. 2008; revised 1 July 2009; accepted 9 Aug. 2009;published online 25 Sept. 2009.For information on obtaining reprints of this article, please send e-mail to:[email protected], and reference IEEECS Log Number TCBB-2008-09-0171.Digital Object Identifier no. 10.1109/TCBB.2009.69.
1545-5963/11/$26.00 � 2011 IEEE Published by the IEEE CS, CI, and EMB Societies & the ACM
starting points for statistically describing gapped alignmentscore distributions for simple scoring schemes [30], [31], buta complete mathematical description of the optimal scoredistribution remains far from reach [31]. There exist manyexcellent reviews on statistical significance in sequencecomparison in the literature [32], [33], [14], [34].
1.2 Database Statistical Significance versusPairwise Statistical Significance
The hits reported by common database search programslike BLAST, FASTA, SSEARCH, and PSI-BLAST areevaluated by database statistical significance, which is ingeneral dependent on the size and composition of thedatabase being searched. In the last few years, there havebeen considerable improvements to the BLAST and PSI-BLAST programs [24], [35], [27], which have been shown toimprove retrieval accuracy of database searches by usingcomposition-based statistics and other enhancements.
An alternative method to estimate statistical significanceof a pairwise alignment is to estimate pairwise statisticalsignificance, which is database-independent and sequence-specific. Recently, a study of pairwise statistical significanceand its comparison with database statistical significancewas conducted [28] wherein various approaches to estimatepairwise statistical significance like ARIADNE [21], PRSS[8], censored-maximum-likelihood fitting [36], and linearregression fitting [13] were compared to find that maximumlikelihood fitting with censoring left of peak (described astype-I censoring in [36]) is the most accurate method forestimating pairwise statistical significance. Further, thismethod was compared with database statistical significancein a homology detection experiment to find that pairwisestatistical significance performs better than database statis-tical significance using BLAST and PSI-BLAST (withoutpretrained PSSMs) on a benchmark database and compar-able to SSEARCH, but PSI-BLAST gives significantly betterresults by using pretrained PSSMs (position-specific scoringmatrices). In another related work [29], a simple extensionof pairwise statistical significance was shown to be betterthan ordinary pairwise statistical significance, where theconcept of nonconservative pairwise statistical significancewas introduced. Pairwise statistical significance usingmultiple parameter sets [37] and sequence-pair-specificdistanced substitution matrices [38] has also been explored,which, in some cases, give slightly better results thanoriginal pairwise statistical significance, but not comparableto the methods described in this paper. The brief back-ground of the relevant details on pairwise statisticalsignificance is presented in the next section.
1.3 Relevance
It is a well-known fact that almost everything in bioinfor-matics depends on the interrelationship between sequence,structure, and function (all encapsulated in the term“relatedness”), which is far from being well-understood.With sequencing becoming more and more easy andaffordable, there is an increasing deluge of sequence datain the public domain, for the analysis of which, computa-tional sequence comparison techniques would have to playa key role. In the progressive march toward this goal,accurate statistical significance estimates for pairwisealignments can be very useful to comment on the related-ness of a pair of sequences independent of any database,
which, in turn, can be very useful in any application, whichemploys sequence alignment for examining the relatednessof sequence pairs. As pointed out earlier, rigorous statisticaltheory for alignment score distribution is available only forungapped alignment, and not even for its simplest exten-sion, i.e., alignment with gaps. Accurate statistics of thealignment score distribution from more sophisticatedalignment programs, therefore, is not expected to bestraightforward. For comparing the performance of neweralignment programs, which try to incorporate morebiological aspects of sequence alignment, accurate estimatesof pairwise statistical significance can be extremely useful.With the all-pervasive use of sequence alignment methodsin bioinformatics making use of ever-increasing sequencedata, and with development of more and more sophisti-cated alignment methods with unknown statistics, webelieve that computational and statistical approaches foraccurate estimation of statistical significance of pairwisealignment scores would prove to be very useful forcomputational biologists and bioinformatics community.
1.4 Contributions
Earlier work on pairwise statistical significance has shown itto be a promising alternative to database statisticalsignificance when used with standard substitution matricesowing to it being more specific to the sequence-pair beingaligned. In this paper, we attempt to make the sequencecomparison more sequence-specific by using sequence-specific and position-specific substitution matrices (SSSMsand PSSMs). To construct an SSSM for a given sequence, weused a simple intuitive method aimed at constructingsubstitution matrices with some sequence-specific contribu-tion, since we could not find any such related program in thepublic domain. To construct a PSSM for a given sequence,we used the popularly used database search program PSI-BLAST to search the given sequence against a large database(nr protein database provided by BLAST), which naturallyconstructs a PSSM for the query sequence. To effectivelyseparate the influence of pairwise statistical significance andSSSMs/PSSMs, we also conducted homology detectionexperiments with SSSMs/PSSMs using both pairwisestatistical significance and database statistical significanceas reported by popular database search programs BLAST,PSI-BLAST, and SSEARCH. Results provide clear empiricalevidence that as sequence comparison is made more andmore sequence-specific by using SSSMs and PSSMs, pair-wise statistical significance provides significantly betterestimates of statistical significance as compared to databasestatistical significance for the biologically relevant andpractical application of homology detection, which can bemeasured in terms of retrieval accuracy.
Although the comparison results in this paper show thatthe proposed methods outperform the traditional databasesearch programs like BLAST, PSI-BLAST (pairwise statisticalsignificance with SSSMs performs better than PSI-BLASTused directly on benchmark test database (a subset of CATHdatabase first used in [39]) with default parameters (e-valuethreshold of 10 and maximum five rounds), but withpretrained PSI-BLAST PSSMs (obtained from databasesearch on a larger database (nr)), PSI-BLAST performssignificantly better; pairwise statistical significance withsame PSSMs performs significantly better than PSI-BLAST
AGRAWAL AND HUANG: PAIRWISE STATISTICAL SIGNIFICANCE OF LOCAL SEQUENCE ALIGNMENT USING SEQUENCE-SPECIFIC AND... 195
with pretrained PSSMs), and SSEARCH, the proposedmethods, nevertheless, are currently much computationallyexpensive to be directly used in a large database search, sinceit involves generation of sequence-specific empirical scoredistributions and subsequent curve-fitting. The intendedgoal of this work was to make sequence comparison moreeffective by making it more sequence-specific; and the centralquestion in sequence comparison is—“How closely the giventwo sequences are evolutionary related?.” The proposedmethod, as of now, can be used for any application requiringan examination of relatedness of a few sequence pairs, likesmall database searches, refining the results of databasesearches, creating distance matrices for phylogenetic treeconstruction, etc. Since the essential quality of a goodsequence comparison strategy in all such applications wouldbe its ability to order the sequence pairs according tobiological significance (relatedness), we chose to evaluatethe proposed method in terms of retrieval accuracy, whichtargets biological significance and not just statistical preci-sion. As far as statistical significance accuracy is concerned,we here use the same method (censored maximum likelihoodfitting) to get statistical parameters from score distributions,which was earlier found to be the best in terms of statisticalsignificance accuracy [28], and hence do not evaluate theproposed method again in terms of statistical precision.
The rest of the paper is organized as follows: In Section 2,an introduction to the extreme value distribution in thecontext of estimating statistical significance for gapped andungapped alignments is presented, along with a briefdescription of relevant details on pairwise statisticalsignificance. Section 3 presents the methods used to createsequence-specific substitution matrices and estimatingpairwise statistical significance using sequence-specificand position-specific substitution matrices. Experimentsand results are reported in Section 4, and finally, theconclusion and future work are presented in Section 5.
2 BACKGROUND
2.1 The Extreme Value Distribution for Ungappedand Gapped Alignments
It is a well-known fact that the distribution of the sum of alarge number of independent identically distributed (i.i.d)random variables tends to a normal distribution (centrallimit theorem). Similarly, the distribution of the maximumof a large number of i.i.d. random variables tends to anextreme value distribution (EVD) [40]. The distribution ofSmith-Waterman local alignment score between random,unrelated sequences is known to follow a Gumbel-typeEVD [16]. In the limit of sufficiently large sequence lengthsm and n, the statistics of HSP (High-scoring Segment Pairs,which correspond to ungapped local alignment) scores ischaracterized by two parameters, K and �. The probabilitythat the optimal local alignment score S exceeds x is givenby the P-value, which is defined as:
PrðS � xÞ � 1� e�E;
where E is the E-value and is given by
E ¼ Kmne��x:
For E-values less than 0.01, both E-value and P-values arevery close to each other. The above formulas are valid forungapped alignments [16], and the parameters K and � canbe computed analytically from the substitution scores andsequence compositions. For the gapped alignment, norigorous statistical theory has yet been developed, althoughthere exist some good starting points for the problem asmentioned before [30], [31]. Recently, researchers have alsolooked closely at the low probability tail distribution, andthe work in [41] applied a rare-event sampling techniqueearlier used in [42] and suggested a Gaussian correction tothe Gumbel distribution to better describe the rare-eventtail, resulting in a considerable change in the reportedsignificance values. However, for most practical purposes,the original Gumbel distribution has been widely used todescribe gapped alignment score distribution [17], [18], [19],[21], [43], [44], [13], [28], [29].
2.2 Pairwise Statistical Significance
The pairwise statistical significance described in [28] can beunderstood to be obtainable by the following function:PairwiseStatSigðSeq1; Seq2; SC;NÞ, where Seq1 is the firstsequence, Seq2 is the second sequence, SC is the scoringscheme (substitution matrix, gap opening penalty, and gapextension penalty), and N is the number of shuffles. Thefunction PairwiseStatSig, therefore, generates a scoredistribution by aligning Seq1 with N shuffled versions ofSeq2, fits the distribution to an extreme value distributionusing censored maximum likelihood fitting to obtain thestatistical parameters K and �, and returns the pairwisestatistical significance estimate of the pairwise alignmentscore between Seq1 and Seq2 using the parameters K and �.A simple extension of the PairwiseStatSig function waspresented in [29], wherein the function was used two timeswith different ordering of sequence inputs, and nonconser-vative pairwise statistical significance was introduced. Let
S1 ¼ PairwiseStatSigðSeq1; Seq2; SC;NÞ;S2 ¼ PairwiseStatSigðSeq2; Seq1; SC;NÞ:
Then, nonconservative pairwise statistical significance isdefined as minfS1; S2g.
3 METHODS
3.1 Creating Sequence-Specific Substitution Matrixfor a Given Sequence
In this section, we outline a simple method for constructinga sequence-specific substitution matrix for a given se-quence. The entries of a typical substitution matrix likeBLOSUM62 are essentially log-odds scores. The score sða; bÞfor aligning two residues a and b is:
sða; bÞ ¼ c� log2
pða; bÞ�ðaÞ�ðbÞ ;
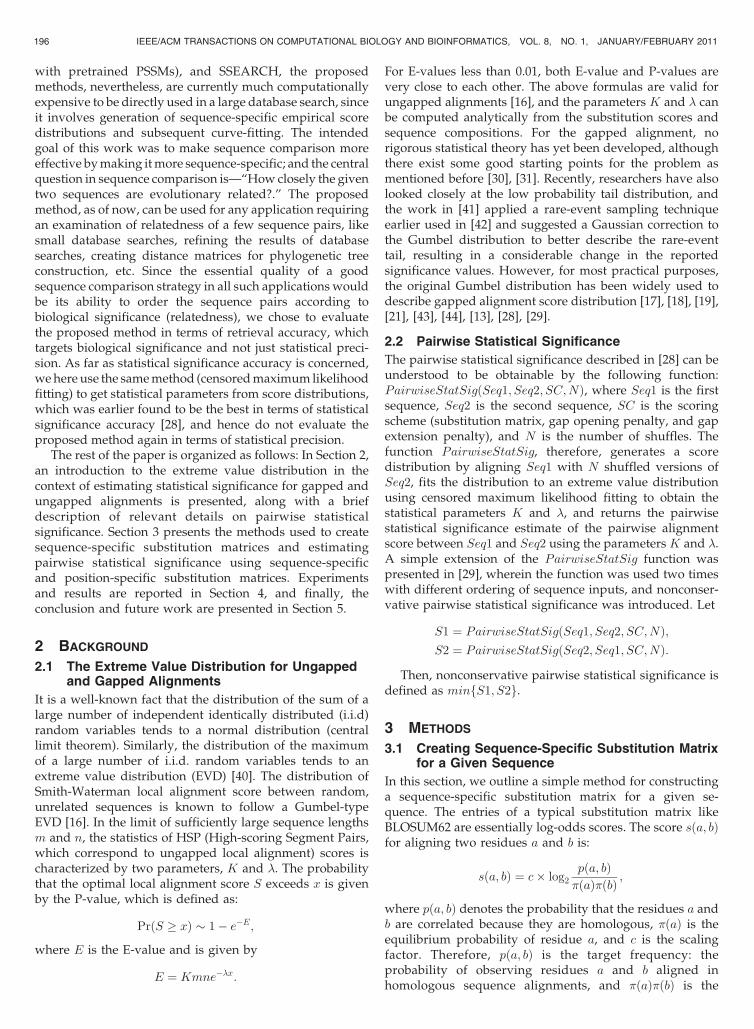
where pða; bÞ denotes the probability that the residues a andb are correlated because they are homologous, �ðaÞ is theequilibrium probability of residue a, and c is the scalingfactor. Therefore, pða; bÞ is the target frequency: theprobability of observing residues a and b aligned inhomologous sequence alignments, and �ðaÞ�ðbÞ is the
196 IEEE/ACM TRANSACTIONS ON COMPUTATIONAL BIOLOGY AND BIOINFORMATICS, VOL. 8, NO. 1, JANUARY/FEBRUARY 2011
probability that the two residues are uncorrelated andunrelated, occurring independently. The resulting substitu-tion matrix is said to be in 1=c bit units. An excellentintroduction to fundamental concepts of substitutionmatrices is provided in [45].
Further, the probabilities pða; bÞ and �ðaÞ can be easilyestimated from a count matrix C, where the entry Cða; bÞgives the count of the number of times residue a was seenaligned to b in a set of alignments (both pairwise or multiplesequence alignments) of homologous sequences. Usually,the count matrix is added to its transpose to ensuresymmetry, and hence, Cða; bÞ ¼ Cðb; aÞ. Then,
pða; bÞ ¼ Cða; bÞP
c
Pd Cðc; dÞ
;
�ðaÞ ¼P
b Cða; bÞPc
Pd Cðc; dÞ
:
Therefore, the task of generating sequence-specific sub-stitution matrices reduces to obtaining sequence-specificcount matrices. For a given sequence S, a sequence-specificcount matrix can be obtained using the simple procedure asfollows: Run BLAST program with S as the query sequenceagainst a large database (nr database used in our experi-ments) with a relatively high e-value threshold (1,000 used inour experiments) so that enough alignments can be obtainedto fill up the count matrix. The entries of the sequence-specific count matrix CS can be obtained by counting thenumber of times residue a is aligned with b. Subsequently,CSis added to its transpose to ensure symmetry.
Just as a count matrix can be used to get the substitutionmatrix, one can also back-calculate the count matrix for agiven substitution matrix and equilibrium frequencies.Calculating the probabilities pða; bÞ from scores sða; bÞ andequilibrium frequencies �ðaÞ involves solving for anonzero � in
Pab �ðaÞ�ðbÞe�sða;bÞ ¼ 1, and a C implementa-
tion of this procedure is available in the supplementarynotes of [45]. Subsequently, these probabilities can bemultiplied by a suitably large integer to get a representativecount matrix C. Let the count matrix thus obtained for theBLOSUM62 matrix be CBL62.
This can be used to derive sequence-specific substitutionmatrices with different levels of sequence-specific contribu-tion. We define � 2 ½0; 1� as the sequence-specific contribu-tion. Both CS and CBL62 are individually normalized to havea constant matrix sum (1,000,000 used in our experiments),so that they are compatible for addition. Then, for a givensequence S, sequence-specific count matrix with sequence-specific contribution � can be obtained as follows:
CS;� ¼ �CS þ ð1� �ÞCBL62;
which can be subsequently used to obtain a sequence-specific substitution matrix for sequence S at sequence-specific contribution � using the procedure describedearlier in this section.
The simple method described above is one of the manypossible approaches to get a sequence-specific substitutionmatrix. Although simple, it currently has several short-comings, some of which are as follows: A general criticism ofthe method is that this approach assumes that the pða; bÞ arethe probabilities of amino acids a and b being aligned within
correct alignments of homologous sequences. Even thoughwe use a large database (nr) for the BLAST search to fill upthe count matrix, we are not guaranteed to always havecorrect homologous alignments, not only because BLAST isnot optimal search method, but also because of the high e-value threshold (1,000), which may return a large number offalse positives. We would still like to use a relatively high e-value threshold to collect sufficient alignments to fill up thecount matrix (we got as low as 5 hits for a query (1dp5B0)even with an e-value threshold of 1,000 in our experiments).At the same time, we would not like to raise the e-valuecutoff too much, since it would add to the BLAST searchtime. Hence, with the proposed method, we can expectBLAST to return of the order of 1,000 false positives,although it would rarely happen, since we collect only top1,000 alignments from the BLAST search to fill up the countmatrix (details presented in the Results section). Of course,to the extent that the assumed statistical model of [16] isapplicable to gapped alignments, the resulting pða; bÞ fromthe false positives will converge on the pða; bÞ implicit in thesubstitution matrix used, i.e., BLOSUM62; so this simplyadds additional weight to the default matrix. Nevertheless,the procedure clearly gives much greater weight to thedefault matrix for queries with fewer homologs in thedatabase than to sequences with more homologs. Anotheraspect of the uneven distribution of hits returned by BLASTin this method is that for some “popular” query sequences,most hits would be its close homologs, which wouldoverwhelm the amino-acid pair counts. Again, the provisionof having contributions from both sequence-specific countmatrix CS and the default count matrix CBL62 allows forcontrolled sequence-specific contribution, but the issue ofover-representation from very similar sequences can possi-bly be addressed using several techniques as will bediscussed later in Section 5. These issues are not addressedhere since the goal here was not to design a very effectivemethod for constructing SSSMs, but to construct substitutionmatrices with some sequence-specific contribution forexperimentation with pairwise statistical significance toinvestigate for any performance enhancement in the absenceof an easily available program in the public domain to do so.Experiments were conducted using the resulting SSSMswith both pairwise statistical significance and databasestatistical significance, and our strategy for constructingSSSMs, even though not free from defects, is expected toinfluence both methods of estimating statistical significancein a similar way. The comparison results presented in thenext section demonstrate the potential of the approach.However, addressing the potential problems discussedabove can possibly result in an improved performance,both for pairwise statistical significance and for databasestatistical significance.
3.2 Pairwise Statistical Significance UsingSequence-Specific and Position-SpecificSubstitution Matrices
As described in the earlier section, pairwise statisticalsignificance can be understood to be obtainable by thefollowing function: PairwiseStatSigðSeq1; Seq2; SC;NÞ,where Seq1 is the first sequence, Seq2 is the secondsequence, SC is the scoring scheme (substitution matrix,
AGRAWAL AND HUANG: PAIRWISE STATISTICAL SIGNIFICANCE OF LOCAL SEQUENCE ALIGNMENT USING SEQUENCE-SPECIFIC AND... 197
gap opening penalty, gap extension penalty), and N is thenumber of shuffles. Since only Seq2 is shuffled duringthe significance estimation procedure, it is possible to easilyuse a scoring scheme specific to Seq1 to estimate pairwisestatistical significance. Therefore, pairwise statistical sig-nificance of a pairwise alignment using sequence-specific/position-specific substitution matrix for one of the twosequences (let that be Seq1) can be estimated by using it inSC. Let the sequence-specific/position-specific scoringscheme specific to Seq1 be thus denoted by SC1. Then,PairwiseStatSigðSeq1; Seq2; SC1; NÞ would denote thepairwise statistical significance estimate using sequence-specific/position-specific substitution matrix, depending onwhether SC1 is sequence-specific or position-specific.
If, however, sequence-specific/position-specific substitu-tion matrices are available for both the sequences beingcompared, we can use the concept of nonconservativepairwise statistical significance to make the estimationprocess more specific to the sequences being aligned
S1 ¼ PairwiseStatSigðSeq1; Seq2; SC1; NÞ;S2 ¼ PairwiseStatSigðSeq2; Seq1; SC2; NÞ:
SC1 and SC2 represents a scoring scheme specific to Seq1and Seq2, respectively, which can be sequence-specific orposition-specific depending on the substitution matrix.Nonconservative pairwise statistical significance usingsequence-specific/position-specific substitution matrix isthus given by minfS1; S2g.
4 EXPERIMENTS AND RESULTS
To evaluate the proposed approach, we used the sameexperiment setup as used in [39], and later in [28], [29]. Anonredundant subset of the CATH 2.3 database (Class,Architecture, Topology, and Hierarchy, [46]) available atftp://ftp.ebi.ac.uk/pub/software/unix/fasta/prot_sci_04/was selected in [39] to evaluate seven structure comparisonprograms and two sequence comparison programs. Thisdata set consists of 2,771 domain sequences and includes86 query sequences, and is considered as a valid benchmarkfor testing protein comparison algorithms [47].
Following [39], [28], [29], Error per Query (EPQ) versusCoverage plots were used to visualize and compare theresults. To create these plots, the list of pairwise compar-isons was sorted, based on decreasing statistical significance(increasing P-values). While traversing the sorted list fromtop to bottom, the coverage count is increased by one if thetwo sequences of the pair are homologs, else the error countis increased by one. At any given point in the list, EPQ is thetotal number of errors incurred so far, divided by thenumber of queries; and coverage is the fraction of totalhomolog pairs so far detected. The ideal curve would gofrom 0 to 100 percent coverage, without incurring any errors,which would correspond to a straight line on the x-axis.Therefore, a better curve is one which is more to the right.
4.1 Pairwise Statistical Significance Using SSSMs
Sequence-specific substitution matrices were obtained foreach of the 2,771 sequences in the database using the methoddescribed in the previous section. We used the BLAST
program (version 2.2.17) to query the 2,771 sequencesagainst the nonredundant protein database (nr) providedwith BLAST programs with a relatively high e-valuethreshold of 1,000 (�e 1000) so that we can collect enoughalignments for filling the count matrix. Further, to view1,000 best alignments in the output, the “�b 1000” optionwas used. The BLAST alignments were used to generate thecount matrix, and subsequently the substitution matrix fordifferent values of sequence-specific contribution �. Thescaling factor c was chosen to be 3, and hence, allsubstitution matrices were generated in 1/3-bit scale. Thenumber of shuffles to generate the empirical distributionwas set to 1,000. The gap opening and gap extensionpenalties were set to 10 and 2, respectively, which are thedefault in FASTA and SSEARCH programs, that also usesubstitution matrices in 1/3-bit scale.
4.1.1 Using SSSMs at Different Levels
of Sequence-Specific Contribution
We experimented with sequence-specific substitution ma-trices at different levels of sequence-specific contribution.Here, we used nonconservative pairwise statistical signifi-cance, which has been shown to be more effective comparedto other variants of pairwise statistical significance [29],since SSSMs for all the sequences were available.
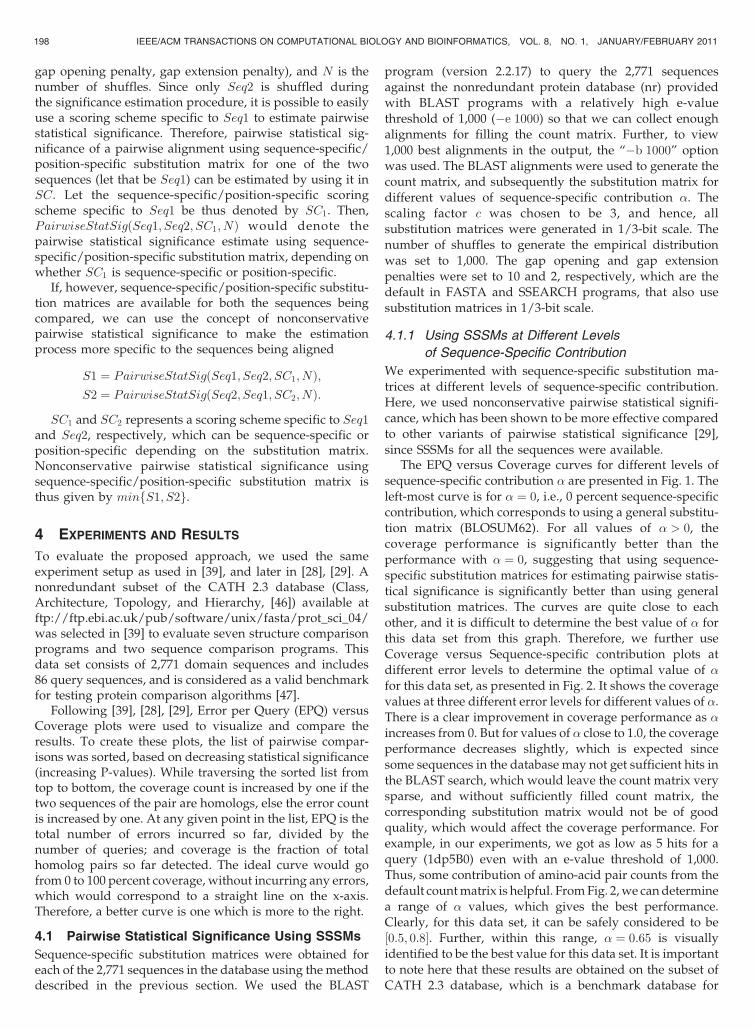
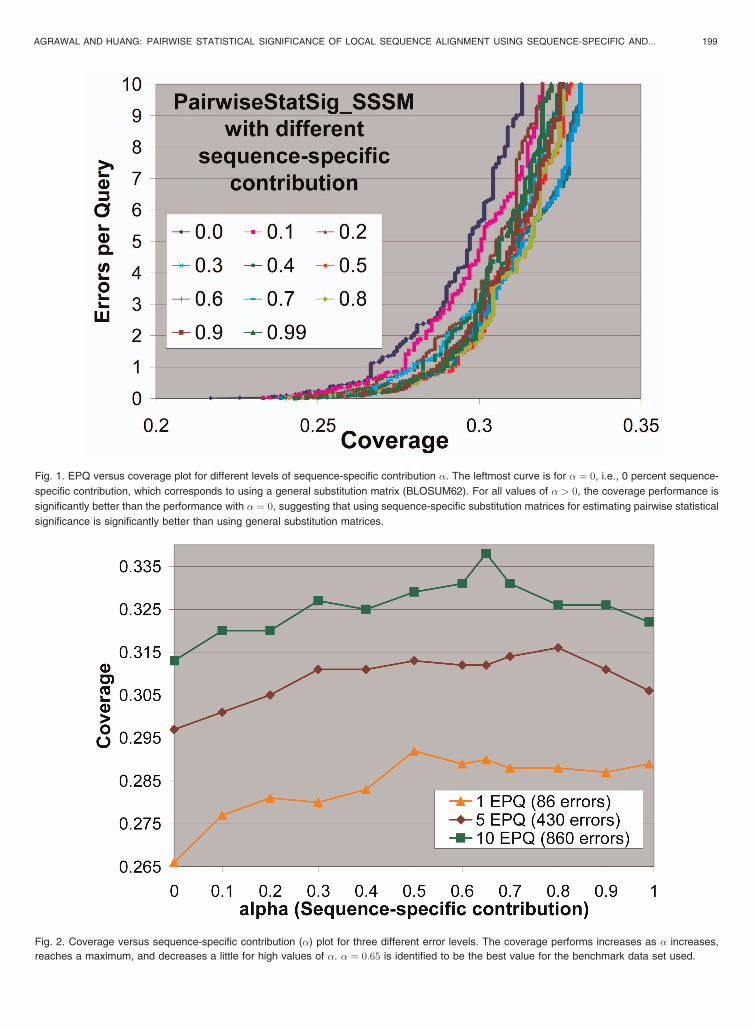
The EPQ versus Coverage curves for different levels ofsequence-specific contribution � are presented in Fig. 1. Theleft-most curve is for � ¼ 0, i.e., 0 percent sequence-specificcontribution, which corresponds to using a general substitu-tion matrix (BLOSUM62). For all values of � > 0, thecoverage performance is significantly better than theperformance with � ¼ 0, suggesting that using sequence-specific substitution matrices for estimating pairwise statis-tical significance is significantly better than using generalsubstitution matrices. The curves are quite close to eachother, and it is difficult to determine the best value of � forthis data set from this graph. Therefore, we further useCoverage versus Sequence-specific contribution plots atdifferent error levels to determine the optimal value of �for this data set, as presented in Fig. 2. It shows the coveragevalues at three different error levels for different values of �.There is a clear improvement in coverage performance as �increases from 0. But for values of � close to 1.0, the coverageperformance decreases slightly, which is expected sincesome sequences in the database may not get sufficient hits inthe BLAST search, which would leave the count matrix verysparse, and without sufficiently filled count matrix, thecorresponding substitution matrix would not be of goodquality, which would affect the coverage performance. Forexample, in our experiments, we got as low as 5 hits for aquery (1dp5B0) even with an e-value threshold of 1,000.Thus, some contribution of amino-acid pair counts from thedefault count matrix is helpful. From Fig. 2, we can determinea range of � values, which gives the best performance.Clearly, for this data set, it can be safely considered to be½0:5; 0:8�. Further, within this range, � ¼ 0:65 is visuallyidentified to be the best value for this data set. It is importantto note here that these results are obtained on the subset ofCATH 2.3 database, which is a benchmark database for
198 IEEE/ACM TRANSACTIONS ON COMPUTATIONAL BIOLOGY AND BIOINFORMATICS, VOL. 8, NO. 1, JANUARY/FEBRUARY 2011
AGRAWAL AND HUANG: PAIRWISE STATISTICAL SIGNIFICANCE OF LOCAL SEQUENCE ALIGNMENT USING SEQUENCE-SPECIFIC AND... 199
Fig. 1. EPQ versus coverage plot for different levels of sequence-specific contribution �. The leftmost curve is for � ¼ 0, i.e., 0 percent sequence-
specific contribution, which corresponds to using a general substitution matrix (BLOSUM62). For all values of � > 0, the coverage performance is
significantly better than the performance with � ¼ 0, suggesting that using sequence-specific substitution matrices for estimating pairwise statistical
significance is significantly better than using general substitution matrices.
Fig. 2. Coverage versus sequence-specific contribution (�) plot for three different error levels. The coverage performs increases as � increases,
reaches a maximum, and decreases a little for high values of �. � ¼ 0:65 is identified to be the best value for the benchmark data set used.
protein comparison, but the results and best value of � maynot be generalized to all databases.
4.1.2 Comparison with Database Statistical Significance
We compare the results of using pairwise statisticalsignificance with that of using database statistical signifi-cance (as reported by popular database search programslike BLAST, PSI-BLAST, and SSEARCH), both with andwithout using SSSMs. Here, the PSI-BLAST results areobtained by directly running it on the test database withdefault parameters without using pretrained PSSMs, andare presented just to make the analysis more “complete.”This, of course, is not the best use of PSI-BLAST, and a moreproper use of PSI-BLAST using pretrained PSSMs ispresented in the next section to compare it with pairwisestatistical significance using PSSMs.
For estimating pairwise statistical significance usingSSSMs, SSSMs can be used for either or both of the sequencesbeing compared, and here we report the experimental resultsfor all three cases: 1) using SSSMs for query sequences only;2) using SSSMs for database sequences only; and 3) usingSSSMs for both query and database sequences (usingnonconservative pairwise statistical significance). Further,to effectively isolate the influence of pairwise statisticalsignificance and the use of SSSMs, we also report the results ofpairwise statistical significance using standard substitutionmatrix (BLOSUM 62). For the same reason, we also conductedexperiments with BLAST, PSI-BLAST, and FASTA with the
SSSMs that were used for experiments with pairwisestatistical significance. BLAST/PSI-BLAST use a 1/2-bitscaling of substitution matrices instead of 1/3-bit scaling,and hence, the SSSMs were appropriately rescaled for usewith BLAST/PSI-BLAST.
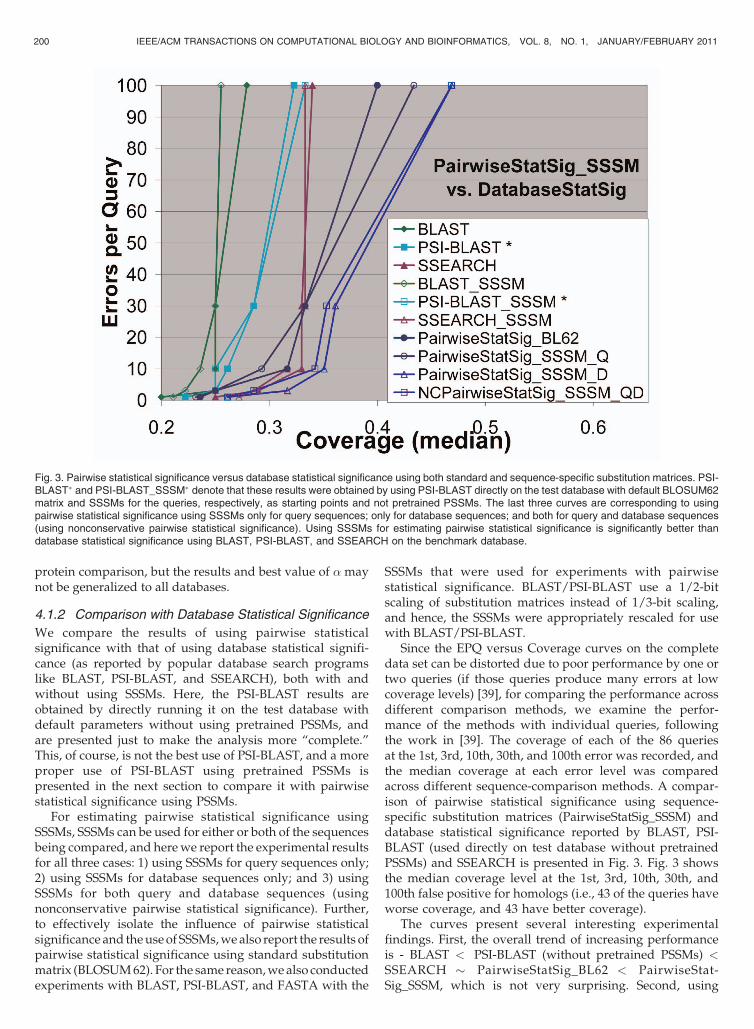
Since the EPQ versus Coverage curves on the completedata set can be distorted due to poor performance by one ortwo queries (if those queries produce many errors at lowcoverage levels) [39], for comparing the performance acrossdifferent comparison methods, we examine the perfor-mance of the methods with individual queries, followingthe work in [39]. The coverage of each of the 86 queriesat the 1st, 3rd, 10th, 30th, and 100th error was recorded, andthe median coverage at each error level was comparedacross different sequence-comparison methods. A compar-ison of pairwise statistical significance using sequence-specific substitution matrices (PairwiseStatSig_SSSM) anddatabase statistical significance reported by BLAST, PSI-BLAST (used directly on test database without pretrainedPSSMs) and SSEARCH is presented in Fig. 3. Fig. 3 showsthe median coverage level at the 1st, 3rd, 10th, 30th, and100th false positive for homologs (i.e., 43 of the queries haveworse coverage, and 43 have better coverage).
The curves present several interesting experimentalfindings. First, the overall trend of increasing performanceis - BLAST < PSI-BLAST (without pretrained PSSMs) <SSEARCH � PairwiseStatSig_BL62 < PairwiseStat-Sig_SSSM, which is not very surprising. Second, using
200 IEEE/ACM TRANSACTIONS ON COMPUTATIONAL BIOLOGY AND BIOINFORMATICS, VOL. 8, NO. 1, JANUARY/FEBRUARY 2011
Fig. 3. Pairwise statistical significance versus database statistical significance using both standard and sequence-specific substitution matrices. PSI-BLAST� and PSI-BLAST_SSSM� denote that these results were obtained by using PSI-BLAST directly on the test database with default BLOSUM62matrix and SSSMs for the queries, respectively, as starting points and not pretrained PSSMs. The last three curves are corresponding to usingpairwise statistical significance using SSSMs only for query sequences; only for database sequences; and both for query and database sequences(using nonconservative pairwise statistical significance). Using SSSMs for estimating pairwise statistical significance is significantly better thandatabase statistical significance using BLAST, PSI-BLAST, and SSEARCH on the benchmark database.
SSSMs with BLAST, PSI-BLAST, and SSEARCH does notsignificantly affect their performance. Although little sur-prising, it may be justified on grounds that our SSSMs maynot be good enough, which is also reflected in the fact thatwhen SSSMs are used only for the queries, even pairwisestatistical significance shows only marginal improvementover using standard substitution matrices. However, themost surprising observation is that using SSSMs only fordatabase sequences gives very similar performance tononconservative pairwise statistical significance, whichuses SSSMs for both query and database sequences.Although this does not provide a definitive proof of thesuperiority of using SSSMs, but gives some empiricalevidence of the fact that using more sequence-specificinformation improves the performance of sequence compar-ison. A further implication of these results is that if thismethod were to be used for a database search application,we would only need SSSMs for the database sequences,which can be precomputed, and save the search time by notconstructing SSSMs for the query sequences. On the otherhand, the obvious drawback is that it would require muchprecomputation. A final important point about the use ofSSSMs with BLAST, PSI-BLAST, and SSEARCH is that thesemethods do not currently support the use of SSSMs for thedatabase sequences and, hence, in their experiments,only the SSSMs for queries were used. Specifically, forBLAST/PSI-BLAST, using SSSMs for different databasesequences is not possible because it treats the entiredatabase as one big sequence and scores the hits using asingle substitution matrix. Although SSEARCH comparesthe query sequence with each database sequence indepen-dently, it still does not support using different substitutionmatrices for each database sequence, since it creates anempirical distribution from the scores obtained by compar-ing the query sequence with the database sequences, and ifdifferent substitution matrices are used for comparison withdifferent database sequences, the Karlin-Altschul statistics[16] would not be applicable to estimate the statisticalsignificance of the hits.
4.2 Pairwise Statistical Significance Using PSSMs
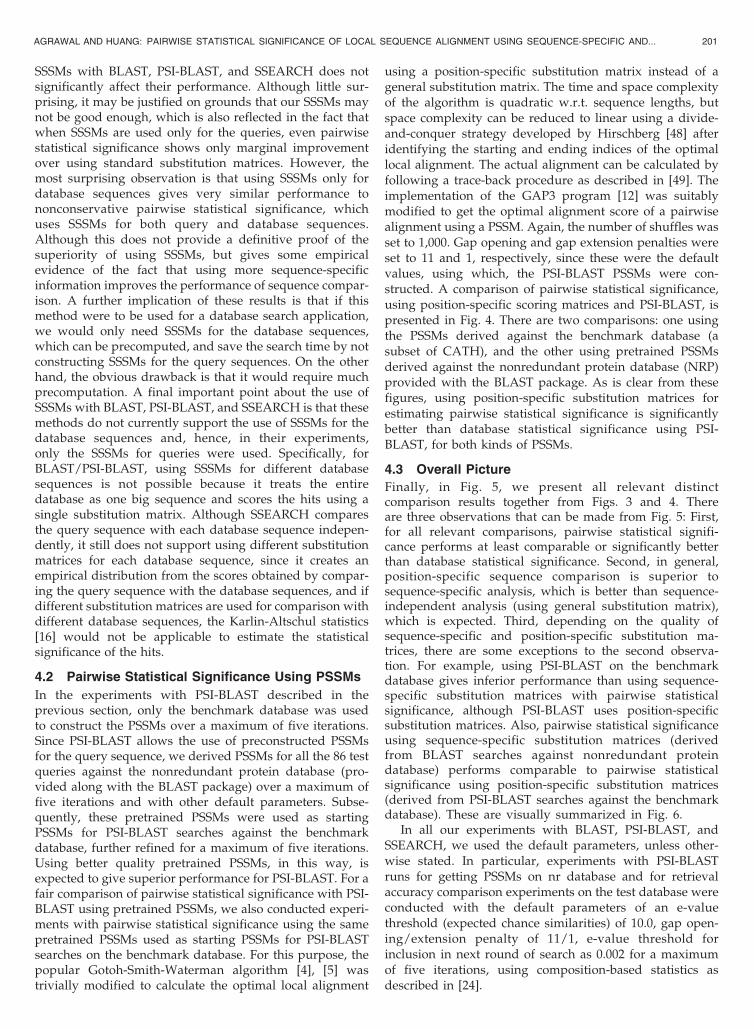
In the experiments with PSI-BLAST described in theprevious section, only the benchmark database was usedto construct the PSSMs over a maximum of five iterations.Since PSI-BLAST allows the use of preconstructed PSSMsfor the query sequence, we derived PSSMs for all the 86 testqueries against the nonredundant protein database (pro-vided along with the BLAST package) over a maximum offive iterations and with other default parameters. Subse-quently, these pretrained PSSMs were used as startingPSSMs for PSI-BLAST searches against the benchmarkdatabase, further refined for a maximum of five iterations.Using better quality pretrained PSSMs, in this way, isexpected to give superior performance for PSI-BLAST. For afair comparison of pairwise statistical significance with PSI-BLAST using pretrained PSSMs, we also conducted experi-ments with pairwise statistical significance using the samepretrained PSSMs used as starting PSSMs for PSI-BLASTsearches on the benchmark database. For this purpose, thepopular Gotoh-Smith-Waterman algorithm [4], [5] wastrivially modified to calculate the optimal local alignment
using a position-specific substitution matrix instead of ageneral substitution matrix. The time and space complexityof the algorithm is quadratic w.r.t. sequence lengths, butspace complexity can be reduced to linear using a divide-and-conquer strategy developed by Hirschberg [48] afteridentifying the starting and ending indices of the optimallocal alignment. The actual alignment can be calculated byfollowing a trace-back procedure as described in [49]. Theimplementation of the GAP3 program [12] was suitablymodified to get the optimal alignment score of a pairwisealignment using a PSSM. Again, the number of shuffles wasset to 1,000. Gap opening and gap extension penalties wereset to 11 and 1, respectively, since these were the defaultvalues, using which, the PSI-BLAST PSSMs were con-structed. A comparison of pairwise statistical significance,using position-specific scoring matrices and PSI-BLAST, ispresented in Fig. 4. There are two comparisons: one usingthe PSSMs derived against the benchmark database (asubset of CATH), and the other using pretrained PSSMsderived against the nonredundant protein database (NRP)provided with the BLAST package. As is clear from thesefigures, using position-specific substitution matrices forestimating pairwise statistical significance is significantlybetter than database statistical significance using PSI-BLAST, for both kinds of PSSMs.
4.3 Overall Picture
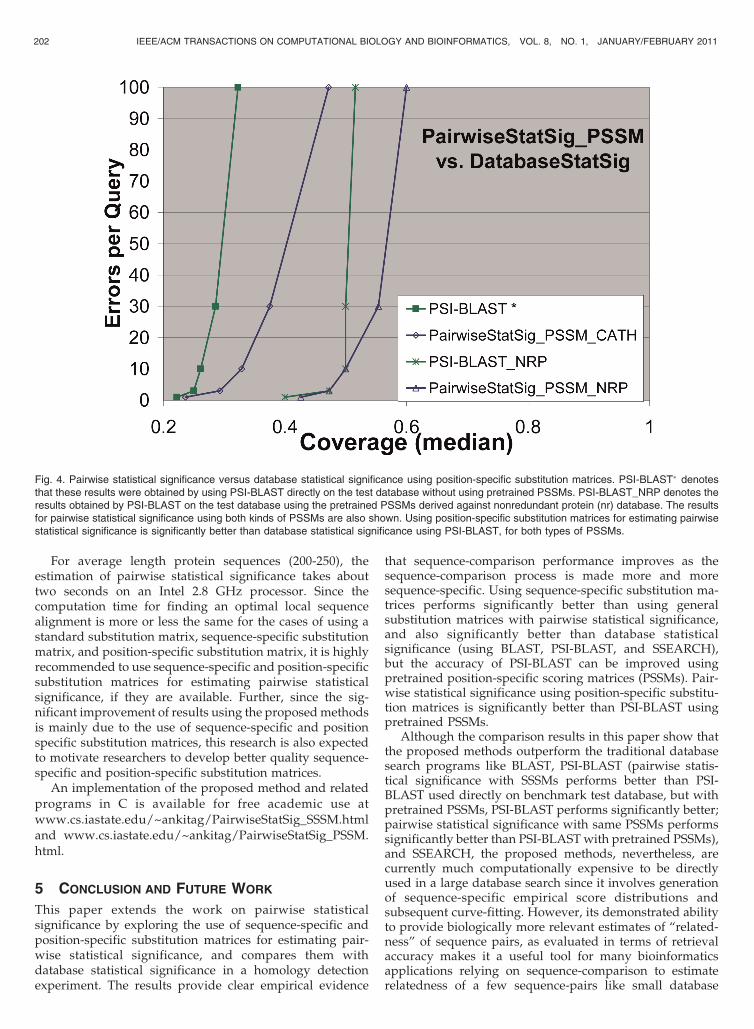
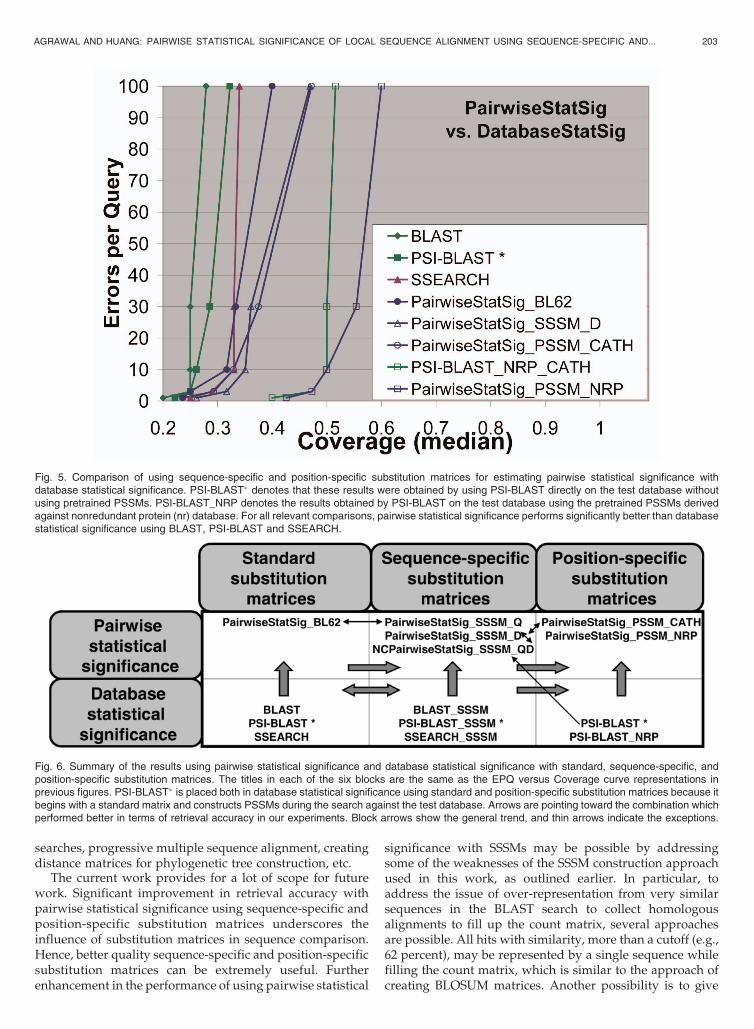
Finally, in Fig. 5, we present all relevant distinctcomparison results together from Figs. 3 and 4. Thereare three observations that can be made from Fig. 5: First,for all relevant comparisons, pairwise statistical signifi-cance performs at least comparable or significantly betterthan database statistical significance. Second, in general,position-specific sequence comparison is superior tosequence-specific analysis, which is better than sequence-independent analysis (using general substitution matrix),which is expected. Third, depending on the quality ofsequence-specific and position-specific substitution ma-trices, there are some exceptions to the second observa-tion. For example, using PSI-BLAST on the benchmarkdatabase gives inferior performance than using sequence-specific substitution matrices with pairwise statisticalsignificance, although PSI-BLAST uses position-specificsubstitution matrices. Also, pairwise statistical significanceusing sequence-specific substitution matrices (derivedfrom BLAST searches against nonredundant proteindatabase) performs comparable to pairwise statisticalsignificance using position-specific substitution matrices(derived from PSI-BLAST searches against the benchmarkdatabase). These are visually summarized in Fig. 6.
In all our experiments with BLAST, PSI-BLAST, andSSEARCH, we used the default parameters, unless other-wise stated. In particular, experiments with PSI-BLASTruns for getting PSSMs on nr database and for retrievalaccuracy comparison experiments on the test database wereconducted with the default parameters of an e-valuethreshold (expected chance similarities) of 10.0, gap open-ing/extension penalty of 11/1, e-value threshold forinclusion in next round of search as 0.002 for a maximumof five iterations, using composition-based statistics asdescribed in [24].
AGRAWAL AND HUANG: PAIRWISE STATISTICAL SIGNIFICANCE OF LOCAL SEQUENCE ALIGNMENT USING SEQUENCE-SPECIFIC AND... 201
For average length protein sequences (200-250), theestimation of pairwise statistical significance takes abouttwo seconds on an Intel 2.8 GHz processor. Since thecomputation time for finding an optimal local sequencealignment is more or less the same for the cases of using astandard substitution matrix, sequence-specific substitutionmatrix, and position-specific substitution matrix, it is highlyrecommended to use sequence-specific and position-specificsubstitution matrices for estimating pairwise statisticalsignificance, if they are available. Further, since the sig-nificant improvement of results using the proposed methodsis mainly due to the use of sequence-specific and positionspecific substitution matrices, this research is also expectedto motivate researchers to develop better quality sequence-specific and position-specific substitution matrices.
An implementation of the proposed method and relatedprograms in C is available for free academic use atwww.cs.iastate.edu/~ankitag/PairwiseStatSig_SSSM.htmland www.cs.iastate.edu/~ankitag/PairwiseStatSig_PSSM.html.
5 CONCLUSION AND FUTURE WORK
This paper extends the work on pairwise statisticalsignificance by exploring the use of sequence-specific andposition-specific substitution matrices for estimating pair-wise statistical significance, and compares them withdatabase statistical significance in a homology detectionexperiment. The results provide clear empirical evidence
that sequence-comparison performance improves as thesequence-comparison process is made more and moresequence-specific. Using sequence-specific substitution ma-trices performs significantly better than using generalsubstitution matrices with pairwise statistical significance,and also significantly better than database statisticalsignificance (using BLAST, PSI-BLAST, and SSEARCH),but the accuracy of PSI-BLAST can be improved usingpretrained position-specific scoring matrices (PSSMs). Pair-wise statistical significance using position-specific substitu-tion matrices is significantly better than PSI-BLAST usingpretrained PSSMs.
Although the comparison results in this paper show thatthe proposed methods outperform the traditional databasesearch programs like BLAST, PSI-BLAST (pairwise statis-tical significance with SSSMs performs better than PSI-BLAST used directly on benchmark test database, but withpretrained PSSMs, PSI-BLAST performs significantly better;pairwise statistical significance with same PSSMs performssignificantly better than PSI-BLAST with pretrained PSSMs),and SSEARCH, the proposed methods, nevertheless, arecurrently much computationally expensive to be directlyused in a large database search since it involves generationof sequence-specific empirical score distributions andsubsequent curve-fitting. However, its demonstrated abilityto provide biologically more relevant estimates of “related-ness” of sequence pairs, as evaluated in terms of retrievalaccuracy makes it a useful tool for many bioinformaticsapplications relying on sequence-comparison to estimaterelatedness of a few sequence-pairs like small database
202 IEEE/ACM TRANSACTIONS ON COMPUTATIONAL BIOLOGY AND BIOINFORMATICS, VOL. 8, NO. 1, JANUARY/FEBRUARY 2011
Fig. 4. Pairwise statistical significance versus database statistical significance using position-specific substitution matrices. PSI-BLAST� denotesthat these results were obtained by using PSI-BLAST directly on the test database without using pretrained PSSMs. PSI-BLAST_NRP denotes theresults obtained by PSI-BLAST on the test database using the pretrained PSSMs derived against nonredundant protein (nr) database. The resultsfor pairwise statistical significance using both kinds of PSSMs are also shown. Using position-specific substitution matrices for estimating pairwisestatistical significance is significantly better than database statistical significance using PSI-BLAST, for both types of PSSMs.
searches, progressive multiple sequence alignment, creatingdistance matrices for phylogenetic tree construction, etc.
The current work provides for a lot of scope for futurework. Significant improvement in retrieval accuracy withpairwise statistical significance using sequence-specific andposition-specific substitution matrices underscores theinfluence of substitution matrices in sequence comparison.Hence, better quality sequence-specific and position-specificsubstitution matrices can be extremely useful. Furtherenhancement in the performance of using pairwise statistical
significance with SSSMs may be possible by addressingsome of the weaknesses of the SSSM construction approachused in this work, as outlined earlier. In particular, toaddress the issue of over-representation from very similarsequences in the BLAST search to collect homologousalignments to fill up the count matrix, several approachesare possible. All hits with similarity, more than a cutoff (e.g.,62 percent), may be represented by a single sequence whilefilling the count matrix, which is similar to the approach ofcreating BLOSUM matrices. Another possibility is to give
AGRAWAL AND HUANG: PAIRWISE STATISTICAL SIGNIFICANCE OF LOCAL SEQUENCE ALIGNMENT USING SEQUENCE-SPECIFIC AND... 203
Fig. 6. Summary of the results using pairwise statistical significance and database statistical significance with standard, sequence-specific, andposition-specific substitution matrices. The titles in each of the six blocks are the same as the EPQ versus Coverage curve representations inprevious figures. PSI-BLAST� is placed both in database statistical significance using standard and position-specific substitution matrices because itbegins with a standard matrix and constructs PSSMs during the search against the test database. Arrows are pointing toward the combination whichperformed better in terms of retrieval accuracy in our experiments. Block arrows show the general trend, and thin arrows indicate the exceptions.
Fig. 5. Comparison of using sequence-specific and position-specific substitution matrices for estimating pairwise statistical significance withdatabase statistical significance. PSI-BLAST� denotes that these results were obtained by using PSI-BLAST directly on the test database withoutusing pretrained PSSMs. PSI-BLAST_NRP denotes the results obtained by PSI-BLAST on the test database using the pretrained PSSMs derivedagainst nonredundant protein (nr) database. For all relevant comparisons, pairwise statistical significance performs significantly better than databasestatistical significance using BLAST, PSI-BLAST and SSEARCH.
weights to each hit while constructing the count matrices,which is something like what PSI-BLAST uses to constructPSSMs. Combining information from known sequencefamilies may also be helpful in constructing better qualitySSSMs/PSSMs.
In this work, we have used PSSMs for only one sequence
(query sequences) to estimate pairwise statistical signifi-
cance. Using PSSMs for database sequences also is expected
to further improve retrieval accuracy, as found in the case of
SSSMs. Another very important aspect of future work is to
develop faster methods to estimate pairwise statistical
significance without sacrificing much on the front of
retrieval accuracy.
ACKNOWLEDGMENTS
The authors thank Dr. Sean Eddy for making the
C routines of censored maximum likelihood fitting avail-
able online, Dr. William R. Pearson for making the
benchmark protein comparison database available online,
and Dr. Volker Brendel for helpful discussions and
providing links to the data. Special thanks are due to the
anonymous reviewers, whose insightful comments made
this manuscript stronger.
REFERENCES
[1] W.R. Pearson and D.J. Lipman, “Improved Tools for BiologicalSequence Comparison,” Proc. Nat’l Academy of Sciences USAvol. 85, no. 8, pp. 2444-2448, http://www.pnas.org/cgi/con-tent/abstract/85/8/2444, 1988.
[2] S.F. Altschul, W. Gish, W. Miller, E.W. Myers, and D.J. Lipman,“Basic Local Alignment Search Tool.,” J. Molecular Biology,vol. 215, no. 3, pp. 403-410, http://dx.doi.org/10.1006/jmbi.1990.9999, 1990.
[3] S.F. Altschul, T.L. Madden, A.A. Schaffer, J. Zhang, Z. Zhang, W.Miller, and D.J. Lipman, “Gapped BLAST PSI-BLAST: A NewGeneration of Protein Database Search Programs,” Nucleic AcidsResearch, vol. 25, no. 17, pp. 3389-3402, http://dx.doi.org/10.1093/nar/25.17.3389, 1997.
[4] T.F. Smith and M.S. Waterman, “Identification of CommonMolecular Subsequences,” J. Molecular Biology, vol. 147, no. 1,pp. 195-197, http://view.ncbi.nlm.nih.gov/pubmed/7265238,1981.
[5] O. Gotoh, “An Improved Algorithm for Matching BiologicalSequences,” J. Molecular Biology, vol. 162, no. 3, pp. 705-708, Dec.1982.
[6] P.H. Sellers, “Pattern Recognition in Genetic Sequences byMismatch Density,” Bull. of Math. Biology, vol. 46, no. 4, pp. 501-514, http://www.springerlink.com/content/2v4477481102w030,1984.
[7] W.R. Pearson, “Effective Protein Sequence Comparison,” Methodsin Enzymology, vol. 266, pp. 227-259, 1996.
[8] W.R. Pearson, “Flexible Sequence Similarity Searching with theFASTA3 Program Package,” Methods in Molecular Biology, vol. 132,pp. 185-219, 2000.
[9] B. Ma, J. Tromp, and M. Li, “PatternHunter: Faster and MoreSensitive Homology Search,” Bioinformatics, vol. 18, no. 3, pp. 440-445, 2002.
[10] M. Li, B. Ma, D. Kisman, and J. Tromp, “PatternHunter II: HighlySensitive and Fast Homology Search,” J. Bioinformatics andComputational Biology, vol. 2, no. 3, pp. 417-439, 2004.
[11] K.-M. Chao, “Calign: Aligning Sequences with Restricted AffineGap Penalties,” Bioinformatics, vol. 15, no. 4, pp. 298-304, 1999.
[12] X. Huang and K.-M. Chao, “A Generalized Global AlignmentAlgorithm,” Bioinformatics, vol. 19, no. 2, pp. 228-233, 2003.
[13] X. Huang and D.L. Brutlag, “Dynamic Use of MultipleParameter Sets in Sequence Alignment,” Nucleic Acids Research,vol. 35, no. 2, pp. 678-686, http://nar.oxfordjournals.org/cgi/content/abstract/35/2/678, 2007.
[14] R. Mott, “Alignment: Statistical Significance,” Encyclopedia ofLife Science, http://mrw.interscience.wiley.com/emrw/9780470015902/els/article/a0005264/current/abstract, 2005.
[15] S.F. Altschul, M.S. Boguski, W. Gish, and J.C. Wootton, “Issues inSearching Molecular Sequence Databases,” Nature Genetics, vol. 6,no. 2, pp. 119-129, 1994.
[16] S. Karlin and S.F. Altschul, “Methods for Assessing the StatisticalSignificance of Molecular Sequence Features by Using GeneralScoring Schemes,” Proc. Nat’l Academy of Sciences USA, vol. 87,no. 6, pp. 2264-2268, http://www.pnas.org/cgi/content/abstract/87/6/2264, 1990.
[17] M.S. Waterman and M. Vingron, “Rapid, Accurate Estimatesof Statistical Significance for Sequence Database Searches,”Proc. Nat’l Academy of Sciences USA, vol. 91, no. 11, pp. 4625-4628, http://www.pnas.org/cgi/content/abstract/91/11/4625,1994.
[18] S.F. Altschul and W. Gish, “Local Alignment Statistics,” Methods inEnzymology, vol. 266, pp. 460-80, 1996.
[19] W.R. Pearson, “Empirical Statistical Estimates for SequenceSimilarity Searches,” J. Molecular Biology, vol. 276, pp. 71-84, 1998.
[20] R. Mott and R. Tribe, “Approximate Statistics of GappedAlignments,” J. Computational Biology, vol. 6, no. 1, pp. 91-112,1999.
[21] R. Mott, “Accurate Formula for P-Values of Gapped LocalSequence and Profile Alignments,” J. Molecular Biology, vol. 300,pp. 649-659, 2000.
[22] R. Bundschuh, “Rapid Significance Estimation in Local SequenceAlignment with Gaps,” Proc. Fifth Ann. Int’l Conf. Research inComputational Molecular Biology (RECOMB ’01), pp. 77-85, 2001.
[23] S.F. Altschul, R. Bundschuh, R. Olsen, and T. Hwa, “TheEstimation of Statistical Parameters for Local Alignment ScoreDistributions,” Nucleic Acids Research, vol. 29, no. 2, pp. 351-361,2001.
[24] A.A. Schaffer, L. Aravind, T.L. Madden, S. Shavirin, J.L. Spouge,Y.I. Wolf, E.V. Koonin, and S.F. Altschul, “Improving theAccuracy of PSI-BLAST Protein Database Searches with Composi-tion-Based Statistics and Other Refinements,” Nucleic AcidsResearch, vol. 29, no. 14, pp. 2994-3005, 2001.
[25] S. Sheetlin, Y. Park, and J.L. Spouge, “The Gumbel Pre-Factor k forGapped Local Alignment Can Be Estimated from Simulations ofGlobal Alignment,” Nucleic Acids Research, vol. 33, no. 15, pp. 4987-4994, 2005.
[26] A. Poleksic, J.F. Danzer, K. Hambly, and D.A. Debe, “ConvergentIsland Statistics: A Fast Method for Determining Local AlignmentScore Significance,” Bioinformatics, vol. 21, no. 12, pp. 2827-2831,2005.
[27] Y.-K. Yu, E.M. Gertz, R. Agarwala, A.A. Schaffer, and S.F.Altschul, “Retrieval Accuracy, Statistical Significance and Com-positional Similarity in Protein Sequence Database Searches,”Nucleic Acids Research, vol. 34, no. 20, pp. 5966-5973, 2006.
[28] A. Agrawal, V.P. Brendel, and X. Huang, “Pairwise StatisticalSignificance and Empirical Determination of Effective Gap Open-ing Penalties for Protein Local Sequence Alignment,” Int’l J.Computational Biology and Drug Design, vol. 1, no. 4, pp. 347-367,2008.
[29] A. Agrawal and X. Huang, “Conservative, Non-Conservative andAverage Pairwise Statistical Significance of Local SequenceAlignment,” Proc. IEEE Int’l Conf. Bioinformatics and Biomedicine,pp. 433-436, 2008.
[30] M. Kschischo, M. Lassig, and Y.-K. Yu, “Toward an AccurateStatistics of Gapped Alignments,” Bull. of Math. Biology, vol. 67,pp. 169-191, 2004.
[31] S. Grossmann and B. Yakir, “Large Deviations for Global Maximaof Independent Superadditive Processes with Negative Drift andan Application to Optimal Sequence Alignments,” Bernoulli,vol. 10, no. 5, pp. 829-845, 2004.
[32] M. Pagni and C.V. Jongeneel, “Making Sense of Score Statistics forSequence Alignments,” Briefings in Bioinformatics, vol. 2, no. 1,pp. 51-67, 2001.
[33] W.R. Pearson and T.C. Wood, “Statistical Significance in Biologi-cal Sequence Comparison,” Handbook of Statistical Genetics,D. J. Balding, M. Bishop, and C. Cannings, eds., pp. 39-66, Wiley,2001.
[34] A.Y. Mitrophanov and M. Borodovsky, “Statistical Significance inBiological Sequence Analysis,” Briefings in Bioinformatics, vol. 7,no. 1, pp. 2-24, 2006.
204 IEEE/ACM TRANSACTIONS ON COMPUTATIONAL BIOLOGY AND BIOINFORMATICS, VOL. 8, NO. 1, JANUARY/FEBRUARY 2011
[35] Y.-K. Yu and S.F. Altschul, “The Construction of Amino AcidSubstitution Matrices for the Comparison of Proteins with Non-Standard Compositions,” Bioinformatics, vol. 21, no. 7 pp. 902-911,2005.
[36] S.R. Eddy, “Maximum Likelihood Fitting of Extreme ValueDistributions,” unpublished work, citeseer.ist.psu.edu/370503.html, 1997.
[37] A. Agrawal and X. Huang, “Pairwise Statistical Significance ofLocal Sequence Alignment Using Multiple Parameter Sets andEmpirical Justification of Parameter Set Change Penalty,” BMCBioinformatics, vol. 10, suppl. 3, p. S1, 2009.
[38] A. Agrawal and X. Huang, “Pairwise Statistical Significance ofLocal Sequence Alignment Using Substitution Matrices withSequence-Pair-Specific Distance,” Proc. Int’l Conf. InformationTechnology, (ICIT ’08), pp. 94-99, 2008.
[39] M.L. Sierk and W.R. Pearson, “Sensitivity and Selectivity inProtein Structure Comparison,” Protein Science, vol. 13, no. 3,pp. 773-785, 2004.
[40] S. Kotz and S. Nadarajah, Extreme Value Distributions: Theory andApplications, ch. 1, pp. 3-4. Imperial College Press, 2000.
[41] S. Wolfsheimer, B. Burghardt, and A.K. Hartmann, “LocalSequence Alignments Statistics: Deviations from Gumbel Statisticsin the Rare-Event Tail,” Algorithms for Molecular Biology, vol. 2,p. 9, 2007.
[42] A.K. Hartmann, “Sampling Rare Events: Statistics of LocalSequence Alignments,” Physical Rev. E, vol. 65, no. 5, p. 056102,2002.
[43] R. Olsen, R. Bundschuh, and T. Hwa, “Rapid Assessment ofExtremal Statistics for Gapped Local Alignment,” Proc. SeventhInt’l Conf. Intelligent Systems for Molecular Biology, pp. 211-222,1999.
[44] R.F. Mott, “Maximum-Likelihood Estimation of the StatisticalDistribution of Smith Waterman Local Sequence SimilarityScores,” Bull. of Math. Biology, vol. 54, pp. 59-75, 1992.
[45] S.R. Eddy, “Where did the Blosum62 Alignment Score MatrixCome from?,” Nature Biotechnology, vol. 22, no. 8, pp. 1035-1036,Aug. 2004.
[46] C.A. Orengo, A.D. Michie, S. Jones, D.T. Jones, M.B. Swindells,and J.M. Thornton, “CATH—A Hierarchic Classification ofProtein Domain Structures,” Structure, vol. 28, no. 1, pp. 1093-1108, 1997.
[47] J. Rocha, F. Rossello, and J. Segura, “Compression Ratios Based onthe Universal Similarity Metric Still Yield Protein Distances Farfrom CATH Distances,” CoRR, vol. abs/q-bio/0603007, 2006.
[48] D.S. Hirschberg, “A Linear Space Algorithm for ComputingMaximal Common Subsequences,” Comm. ACM, vol. 18, no. 6,pp. 341-343, 1975.
[49] S. Altschul and B. Erickson, “Optimal Sequence Alignment UsingAffine Gap Costs,” Bull. of Math. Biology, vol. 48, no. 5, pp. 603-616,Sept. 1986.
Ankit Agrawal received the BTech degree incomputer science and engineering from theIndian Institute of Technology, Roorkee. Hewas the graduating topper of his batch. Atpresent, he is working toward the PhD degreein computer science at Iowa State University.His research interests include bioinformatics,fuzzy logic, data mining, and signal processing.
Xiaoqiu Huang received the PhD degree incomputer science from Pennsylvania StateUniversity in 1990. He is a professor in theDepartment of Computer Science at Iowa StateUniversity. He is the author of a widely usedCAP3 assembly program. His research interestsare in bioinformatics. He and his collaboratorshave recently developed a whole-genome as-sembly program, named PCAP. PCAP has beenused by Washington University Genome Center
in chimpanzee and chicken genome projects.
. For more information on this or any other computing topic,please visit our Digital Library at www.computer.org/publications/dlib.
AGRAWAL AND HUANG: PAIRWISE STATISTICAL SIGNIFICANCE OF LOCAL SEQUENCE ALIGNMENT USING SEQUENCE-SPECIFIC AND... 205