Embed Size (px)
Citation preview

J
193600-1-F
Final Report
IMAGE SENSOR DATA BASE FOR THE DARPA ALV PROGRAM
oo
< i
D <
CD. MILLER Sensor Systems Division OCTOBER 1986
Approved for Public Release Distribution Unlimited
Prepared for: Defence Advanced Research Projects Agency 1400 Wilson Boulevard Arlington, VA 22209 DARPA Order 4670 Contract DAAE 07-86-C-RO19, Issued by: US Army Tank Automotive Command Warren, Ml 48909
i» -•»
ELECTE MAR 1 9 1987
RIM P.O. Box 8618 Ann Arbor, Ml 48107-8618
87 3 18 017

t
Unclassified SECURITY CLASSIFICATION OF THiS PAGE
REPORT DOCUMENTATION PAGE
la REPORT SECURITY CLASSIFICATION
Unclassified 2a SECURITY CLASSIFICATION AUTHORITY
2b DECLASSIFICATION/DOWNGRADING SCHEDULE
lb güm 7H. 4 PERFORMING ORGANIZATION REPORT NUMBERS(S)
19JD00-1-F
6a NAME OF PERFORMING ORGANIZATION
Environmental Research Institute of Michigan
6b OFFICE SYMBOL (it applicable)
6c ADDRESS (City, Stale, and ZIP Code)
P.O. Box 8618 Ann Arbor, MI 48107
8a NAME OF FUNDING/SPONSORING ORGANIZATION
DARPA
8b OFFICE SYMBOL (H applicable)
8c ADDRESS (City, State and ZIP Code)
1400 Wilson Blvd. Arlington, VA 22209
3, DISTRIBUTION/AVAILABILITY OF REPORT
Approved for Public Release Distribution Unlimited
5. MONITORING ORGANIZATION REPORT NUMBER(S)
7a NAME OF MONITORING ORGANIZATION
USA TACOM, AMSTA-ZSS (Tibor F. Czako)
7b ADDRESS (City, State, and ZIP Code)
Warren, MI 48090
9 PROCUREMENT INSTRUMENT IDENTIFICATION NUMBER
DARPA Order 4670
10 SOURCE OF FUNDING NUMBERS
PROGRAM ELEMENT NO
±
PROJECT NO
11 TITLE (Include Secruity Classification)
Image Sensor Data Base for the DARPA ALV Program (U)
TASK NO
WORK UNIT ACCESSION NO
12 PERSONAL AUTHOR(S)
C. Miller 13a TYPE OF REPORT
Final 13b TIME COVERED ^9/1/84^ 9/30/86
14 DATE OF REPORT (Year, Month, Day) October 1986
16 SirpLEMENTARY NOTATION
15 PAGE COUNT
17 COSATI CODES
FIELD
IL 15
GROUP SUB-GROUP
18 SUBJECT TERMS (Continue on reverse it necessary and identity by block number)
ALV Data Base, Multispectral Sensor, 3-D Sensor, Vision Sensors, Laser Radar
f
19 ABSTRACT (Continue on reverse it necessary and identity by block number)
This report describes the acquisition of imaging sensor data for the DARPA Autonomous Land Vehicle (ALV) Program. Data were acquired during four seasonal measurement periods from September 1984 through June 1986 at the Martin Marietta ALV Test Site near Denver Colorado. Passive Multispectral, 3-D Imaging, and color TV sensors were installed on an instrumented van and operated over road networks and various fixed locations at the Martin site. The report presents the specifications for the sensors and describes each measurement period including site locations on map overlays. Data format for the sensors is described and field logs are included as appendices. A ,-
20 DISTRIBUTION/AVAILABILITY OF ABSTRACT
D UNCLASSIFIED/UNLIMITED H SAME AS RPT DTIC USERS
22a NAME Or RESPONSIBLE INDIVIDUAL
21 ABSTRACT SECURITY CLASSIFICATION
22b TELEPHONE (Include Area Code) 22c OFFICE SYMBOL
OD FORM 1473. 84 MAR Unclassified SECURITY CLASSIFICATION OF THIS PAGE

2PL
(THIS PAGE INTENTIONALLY LEFT BLANK)
I i
n

2PL
^
TABLE OF CONTENTS
SECTION pAGE
List of Illustrations >v
List of Tables #vi1
1. Introductloi. j 1.1 Background j
1.2 Plan for the Program 1
2. Instrumentation 5
2.1 ASV Sensor >5
2.2 ALV Sensor #11
2.3 Multlspectral Sensor t12
2.4 Ancillary Instrumentation 14
2.5 Calibration Panels #14
3. Data Acquisition - ALV Test Site .17
3.1 September 1984 Measurements 17
3.2 July 1985 Measurements 19
3.3 September 1985 Measurements .22
I 3.4 May 1986 Measurements 22
4. Data Format 29
4.1 3D Sensor Data t29
4.2 Scan Line Header Format 30
4.3 MSS Data 32
4.4 INS Data 35
5. Distribution of Data Base .39
5.1 Data Anomolles #39
5.2 Computer Tape Distribution .39
111
■ . ■ :■■- ■-. .,..■ . .;■
■

N
Jm TABLE OF CONTENTS (con't)
SECTION PAGE
Appendix A - Data Collection Log, Septembe»- 1984 4f
Appendix B - Data Collection Log, July 1985 47
Appendix C - Data Collection Log, September 1985 53
Appendix D - Data Collection Log, May 1986 57
Accession For
NT-IS GRA&I DTIC TAB Unannounced Justiflcatioru
I D
By — Distribution/
Availability Codes_
HA vail and/or Dist Special
m
iv

» ■
Jm_
FIGURE
LIST OF ILLUSTRATIONS
TITLE PAGE
1-1 Sensor-Solar Geometry for Psuedo-Actlve Data 2
2-1 ERIM's Instrumented Van 6
2-2 3D and MS Sensors on Instrument Platform 7
2-3 Block Diagram of 3D Sensor 9
2-4 ALV Optical System 10
2-5 Optical Configuration for the Multispectral Sensor 13
2-6 SWIR Bands Added to the MSS 15
2-7 Spectral Reflectance of Calibration Panels 16
3-1 Aerial Photograph of the Martin Marietta Denver Complex...18
3-2 Measurement Test Sites - September 1984 20
3-3 Measurement Test Sites - July 1985 21
3-4 Photograph of Ground Scene Near ETL Site #89 23
3-5 ETL Site #89 with Calibration Panels.., 23
3-6 Measurement Test Sites - September 1985 24
3-7 Measurement Test Sites - May 1986 25
4-1 Reformatted MSS Data 33
4-2 Multispectral Image, 3 July 1985, Run 12, Band 2 34
4-3 Coordinate System for Navigation 37
.. ■■■■ ■■■ ■ ■

JIM
(THIS PAGE INTENTIONALLY LEFT BLANK)
vi

2p! LIST OF TABLES
PAGE TABLE TITLE
8 2-1 ASV Sensor Parameters ^
2-2 ALV Sensor Parameters 2-3 Spectral Bands for the Multispectral Sensor
3-1 Scenarios for May 1986 Measurements.
4_1 Header Format.
vn
12
,26
31
5-1 Summary of July 1985 Data Disseminated [[[[.AZ
5-2 ALV Data Recipients * ^
5_3 May 1986 Reformatted Data...

S|
2FRJM
(THIS PAGE INTENTIONALLY LEFT BLANK)
vm

2p. SECTION I
INTRODUCTION
1.1 Background
The Environmental Research Institute of Michigan (ERIM) was
awarded a contract in July 1984 to provide 3D sensor support and data
base for the DARPA Autonomous Land Vehicle (ALV) program. This
program also provided for delivery of a follow-on "Vision" sensor
which would provide cross-country autonomous navigation capability via
multispectral reflectance data on terrain or objects in front of the
vehicle. The sensor, which is scheduled for integration into the ALV
in 1987, has active spectral bands selected on the basis of models and
from measured data from downward-looking sensors, i.e., satellite and
aircraft data. A multispectral data base was therefore required not
only to verify the proper band selection, but also for developing
algorithms applicable to processing the multispectral data,
classifying the terrain and navigating the vehicle.
ERIM proposed acquiring "Pouedo-Active" multispectral data via
modifying a passive airborne scanning system, installing it in an
instrumented van and acquiring the data at the Martin Marietta ALV
test site near Denver Colorado. The simulated active data would be
obtained by operating the sensor at selected times, i.e., early
morning or late evening, when the instrument could be positioned to
achieve small bistatic angles with the sun positioned behind the
sensor. See Figure 1-1.
1.2 Plan for The Program
The original ALV contract provided for acquisition of 3D sensor
data at the Martin-Denver test site. This program was implemented in
September 1984 utilizing the 3D sensor originally delivered to Ohio
State University (OSU) for use on their adaptive suspension vehicle
(ASV). ' The plan was to Integrate the passive multispectral
■1-

Jm
1 w'i i /i
i < 6
^^ 5 < er-S s i s« ?1 a E Ö =«
c
3 as

f
^TRJM measurements with additional 3D sensor measurements at the Denver
site. A schedule was adopted providing for three data acquisition
periods coinciding with the Spring, Summer and Fall vegetation growth
seasons. The first measurement period was scheduled for July 1985
with follow-on measurements during September 1985 and May 1986.*
Although winter data were desirable, measurements were not considered
feasible due to the uncertain weather conditions and the
trafficability of the terrain at the Martin site during the winter
months. The July 1985 measurements were coordinated with the U.S.
Army Engineering Topographic Laboratories who made spectral
reflectance measurements and acquired extensive ground photography 3
during the period.
This report describes the sensors used on the measurement
programs, summarizes the data acquired during the measurement periods
at the Martin-Denver ALV test site and discusses the data reformatting
and distribution to the ALV vision contractors.
The original DARPA/TACOM Contract (DAAE07-84-K-R003) provided for two sets of measurements with the 3D sensor at the Martin-Denver test site and a separate contract (DAAE07-86-C-R019) was negotiated for two additional measurement periods with the passive Multispectral Sensor (MSS). The MSS was. in fact, employed for the latter three measurement periods and a discussion of .11 measurements, i.e., four periods is included in this report for completeness.
3-

TERIM
(THIS PAGE INTENTIONALLY LEFT BLANK)
-4-
1

^TRJM
SECTION 2
INSTRHENTATION
The imaging sensors were installed on ERIM's instrumented van ir. a
configuration similar to that shown in Figures 2-1 and 2-2. The van
currently has self-sufficient power generators installed; however,
during the first two measurement periods, instrument power was
obtained from a power cart towed behind the vehicle. Arrangements
wen» made by Martin Marietta for loan of the power cart from the Air
National Guard in Denver. Arrangements could not be made with the
guard for the September 1985 measurements, however, and hence ERIM
purchased and installed new prime power (115 VAC, 60 Hz) and secondary
power (115 VAC, 400 Hz and 28 VDC) for the May 1986 measurement
period.
Sensor data is recorded in the van on 14-track high-density
digital tape. The recorders are designed primarily for airborne
operations and hence the requirement for 400 Hz and 28 VDC power. The
recorders and all control instrumentation are installed in vertical
racks in the interior of the van. A color TV system (Figure 2-2) is bore-sighted with the 3D and
Multispectral sensors. TV data is recorded on analog tape (3/4-in.
U-Matic VCR). A wide-angle lens (FL=8 mm) is used on the camera
providing a field of view approximately equal to that of the scanning
sensors.
2.1 ASV Sensor
As indicated in Section I, the ASV Sensor provided to Ohio State
University was utilized for the initial set of measurements at the
Denver test site. This sensor was the initial 3D imaging sensor
fabricated by ERIM for tha DARPA program and has operating parameters
somewhat different than the ALV sensor used for the later
measurements.
■.
-5-
. .

2JpL
c Ed
>
UJ
3
-6-
Jm
E u a EL
E 3
s ■a c
a
3
-7-
. .....
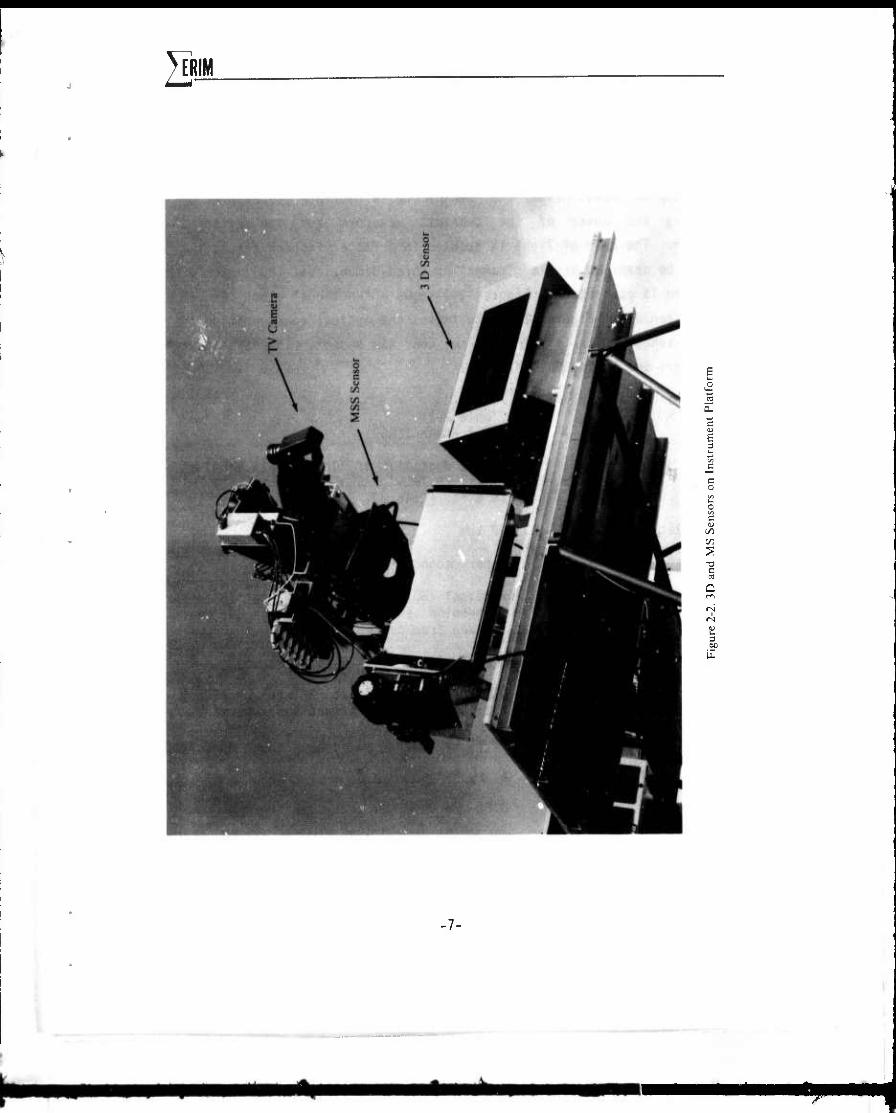
2jp. The principle of operation of the two sensors is the same.
Radiation from a laser diode, emitting at 0.82 micrometers, is
modulated by a sinusoid waveform. The transit time required for the
light beam to travel from the sensor to a surface is measured by
comparing the phase of the transmit waveform and the reflected
waveform. The beam of light is scanned in a raster fashion across the
area to be examined and a "range" or three-dimensional (3D) image of
the scene is generated. Figure 2-3 shows a functional block diagram
of a 3D sensor. Figure 2-4 illustrates the optical configuration of
the ALV sensor which is similar to the ASV sensor. The ASV sensor
parameters are listed in Table 2-1.
IFOV:
Sample Rate:
Frame Rate:
Scan Range:
Range Resolution:
Range Noise:
Ambiguity Interval:
Scanner Output Format:
Wavelength:
Volume:
Weight:
Power:
Table 2-1 ASV SENSOR PARAMETERS
1 deg; footprint of 0.5 ft. (15.2 cm) at 32 ft. [9.75 m], and 0.14 ft. [4.27 cm] at 8 ft. [2.44 m]
92 kHz
2 per second
Vertical 60 deg, 15 deg to 75 deg depression angle; horizontal 80 deg, ±40 deg from center line
8 bits, 1 bit = 0.125 ft [3.81 cm]
0.2 ft [6.10 cm] at 32 ft [9.75 cm] reflectance = 10%, bright sunlight
32 ft (9.7 m)
9, (p , Range
0.82 pm
2 ft3 [0.566 m3]
85 lb.
480 W, 24v DC

2p.
u
Q
OQ
S c cd c -c ca
-9-
■;.; 1 ■. - ■■■:■ ■■ .

2PL
CO
15 o S. o > -J <
B 3 50
-10-

Jm 2.2 ALV Sensor
The ALV sensor Is a second generation 3D sensor, four of which
were built by ERIM. ERIM retains one; two were delivered to DARPA ALV
contractors, Martin-Marietta and Carnegie-Mellon University and the
fourth was delivered to a government agency. The Martin sensor is
currently installed on the Autonomous Land Vehicle.
The operating principle of the ALV sensor is the same as the ASV
sensor (Section 2-1); however, several specifications have been
changed. Table 2-2 lists the ALV sensor parameters.
TABLE 2-2
ALV SENSOR PARAMETERS
TFOV
Horizontal 80°
Vertical 30°
IFOV 0.5°
Beam Size 0.44 ft. (at 50 ft.)
Horizontal Pixels 256
Vertical Lines 64
Ambiguity Interval 64 ft.
Frame Rate 2 Hz
Data Rate 92160 Hz
Laser Power 100 MW
Wavelength 0.82 ym
Range Noise 0.4 ft. (at 50 ft, 10% refl.)
Output Signal analog-Logarithmic
Sensor Dimensions
Height 14 in.
Width 29 in.
Depth 22 in.
Weight 85 lbs.
Power 24 VDC, 450 W
-11-

2PL 2.3 Multispectral Sensor
The Multlspectral Sensor (MSS) was designed In the early lS70's
by the Bendix Corporation as a downward-looking, passive airborne
device. The system is a line scan instrument whereby the second
dimension of an image is normally generated by the forward motion of
an aircraft. Solar radiation reflected from terrain is collected and
focused on the entrance aperture of a spectrometer which divides the
spectrum into ten bands ranging in wavelength from 0.38 ym to 1.06 ym.
An additional band to image thermal radiation, i.e., emitted radiation
(8-14ym) is also available by using a dlchroic beamsplitter to
separate the long wavelength portion of the spectrum. The optical
configuration for the sensor is illustrated In Figure 2-5.
ERIM modified the airborne system for installation on its van in
a forward-looking mode. The modification was accomplished by placing
a nodding mirror beneath the sensor scan aperture to generate a
vertical scan, thereby providing a two-dimensional image. A second
major modification was removing the chermal detector and replacing it
with a unique 3-element detector which provided data in the short wave
Infrared (SWIR) portion of the spectrum. These bands were desired to
provide additional data relating to soil type, soil moisture and
vegetative cover. Table 2-3 lists the spectral bands for which the
sensor was reconfigured.
TABLE 2-3
SPECTRAL BANDS FOR THE MULliSPECTRAL SENSOR
CHANNEL (Band)
WAVELENGTH (Micrometers)
CHANNEL (Band)
WAVELENGTH (Micrometers)
1 0.44 - 0.49 7 0.70 - .74 2 .49 - .54 8 .77 - .86 3 .54 - .58 9 .97 - 1.06 4 .58 - .62 10 1,04 - 1.4 5 .62 - .66 11 1.5 - 1.8 6 .66 - .70 12 2.0 - 2.6
■12-

2™.
Re-imaging Lens
Visible Channels
Array
^
/// ///
Adapter Optics
Aperture —"
I I
A. ' / i
• i i i i i i i
<^- i i i i
11 ii ii
T ii
Diffraction ^ Grating
Collimating Lens
h Spectrometer Section
Dichroic
-A\—i
I ' ' Lit i Scan Mirror
Dall-Kirkham Telescope
Folding Mirror
Incoming Radiation
Figure 2-5. Optical Configuration for the Multi Spectral Sensor
Thermal Detector
Filter (Optional)
Folding Mirror
-13-

2PL The modified sensor utilized the existing dichroic mirror to reflect
the SWIR radiation onto the three element detector. This provided a
minimum 20 percent reflection at 1.0 ym and approximately 64 percent
reflection at 2.6 ym. See Figure 2-6. The detector chips each have a
narrow band interference filter mounted inside the detector dewar to
restrict the radiation to the given bands.
2.4 Ancillary Instrumentation
Ancillary instrumentation included a Litton LTN-51 inertial
navigation system (INS). This unit was mounted on the same platform
as the sensor heads and outputed three-axis acceleration data. The
data are integrated into the "header" information recorded on digital
tape with each scan line from the 3D sensor. This information may be
used to correct image distortions caused by the roll or pitch of the
vehicle.
O^.her instrumentation included a time code generator, the output
of which was recorded on an audio track of the VCR used for recording
the color TV.
2.5 Calibration Panels
ERIM provided calibration panels, 4-ft. square, for placement in
various scenes as reflectance control points. Four panels were
prepared with special reflective paints; however, usually only two
panels were used during the measurements. Four-inch square samples
were also prepared and run on ERIM's spectrometer for calibration
purposes. Spectral reflectance curves for the painted panels are
shown in Figure 2-7.
-14-
^^M^a^ü

2JP-
o
o d
o
S IM 0
z: 3 •g
OJ EM
3 3
o fn
rvl
o 0
a ■o n OJ |M T3 u T3
s < c ■3
c c 3 ao CQ
q c
s at
.-a ■Si
90 ^ t a 3 00
c o
= 0
E C | i OJ HaJ
•15-
MMMA

2PL c O
e u ad
3 S 3 I
o
1
'
— ^2
s a. gj Q
Ov o
a s Ü o («H
u 0
s 8 ,—' 5 xs
o c c u
u oi > fl CO
^ u
I c~- o
d
d
d
I
•16-
äAi

2PL SECTION 3
DATA ACQUISITION - AL' TEST SITE
ERIM acquired sensor data on four different occasions at the
Martin-Denver ALV test site:
1) September 1984 3) September 1985
2) June 1985 4) May 1986
ERIM's instrumented van was on site for approximately five days for
each mission.
An aerial photograph of the Martin Marietta Denver Complex is
shown in Figure 3-1. Map overlays shown in subsequent sections
indicate the areas where the various measurements were made.
Appendix's A through D contain the data collection logs provided by
ERIM's field engineer for each measurement period.
3.1 September 1984 Measurements
The September 1984 measurements were an initial attempt to obtain
3D sensor data over the ALV road following course at the Denver test
site. The only sensor available at the time was the ASV-84, a 3D
sensor fabricated by ERIM for use on the Adaptive Suspension Vehicle
being constructed at Ohio State University (OSU). Arrangements were
made with DARPA and OSU to use the sensor for the initial measurements
on the ALV program.
The September 1984 measurements went exceedingly well considering
it was the initial period and many logistics had to be worked out with
the site contractor, Martin Marietta. Martin made the necessary
arrangements for loan of a power cart from the Air National Guard.
ERIM's van was housed in the ALV garage when not actually making
measurements. The test plan provided for 3D data collection over road
areas designated for the 1985 and 1986 ALV road-following
demonstrations. The sensors were ope'-uefl over all paved roads
-17-
,.-.- .. ■M'TTIT-'T -"-'- - < .—' .<

Jim
Figure 3-1. Aerial Photograph of the Martin Marietta Denver Complex
M^^BMA -

Jm selected for the scenarios; a few dirt roads were also traversed. See
Figure 3-2. Data was gathered at speeds ranging from 5 to 10 miles
per hour. Note, the DARPA/Martin test plan for the ALV called for
demonstrations during 1985 of both 5 and 10 km/hr. The van was driven
both on road centerline and the right hand lane in order to get
representative data. Some data was acquired with the van weaving from
side to side.
3.2 July 1985 Measurements
The test plan for the July 1985 measurements was designed to
acquire both 3D road following data and MSS data of "typical scenes".
Four days were spent on site; the first day was devoted to sensor
installation and check-out. The ALV road networks, both paved and
cross country, were run on Day-2 utilizing the 3D sensor and TV.
Traverses were made in both directions over the roadways. The 3D
sensor was set to nominally scan an area from -1° to -31° below the
horizon. Additional data was also acquired at a depression angle
of -16° to -46° at the request of Martin who wanted to analize data
close in to the vehicle.
The MSS data cannot be acquired with the van moving since it
takes approximately 10 seconds to acquire a frame of data and movement
would cause unacceptable distortions in an image. Sites were selected
such that the sun would be behind the van. Measurements were made
usually in a sequence of 4 or 5 frames (positions) at each location.
The initial frame would be taken and then the van with sensors moved
ahead 30-50 feet and the process repeated. The 3D sensor and TV
system were also operated simultaneously with the MSS. Seven
locations were imaged in two days of operation, resulting in 42 runs
of MSS data. It was not possible to operate during evening hours due
to cloud build-up over the site. As can be seen from the data logs in
Appendix B, morning data acquisition was performed from approximately
06:30 until 09:30. Figure 3-3 indicates the locations of the road
networks and the selected MSS sites over which data was taken.
-19-
-A

2™.
^
r ■ . ■ W ■
\ ■%
«^f ' • ^ ;
■ ■;^
/■";■■ t—.
i
.#*■■
%'
-;" y ^ ilBr^t ■'■
i ^1 1 (
A^^^.. ö
M^l.| ^%^^ v .■■
S ^AiMr"^*^^ .! J Figure 3-2. Measurement Test Sites September 1984
■ ■mi Indicates Road Areas Traversed
■20-
■ id

Jm_
Figure 3-3. Measurement Test Sites July 1985
■ mil Indicates Road Areas Traversed Q Indicates MSS Sites
-21-
_ä . ^^

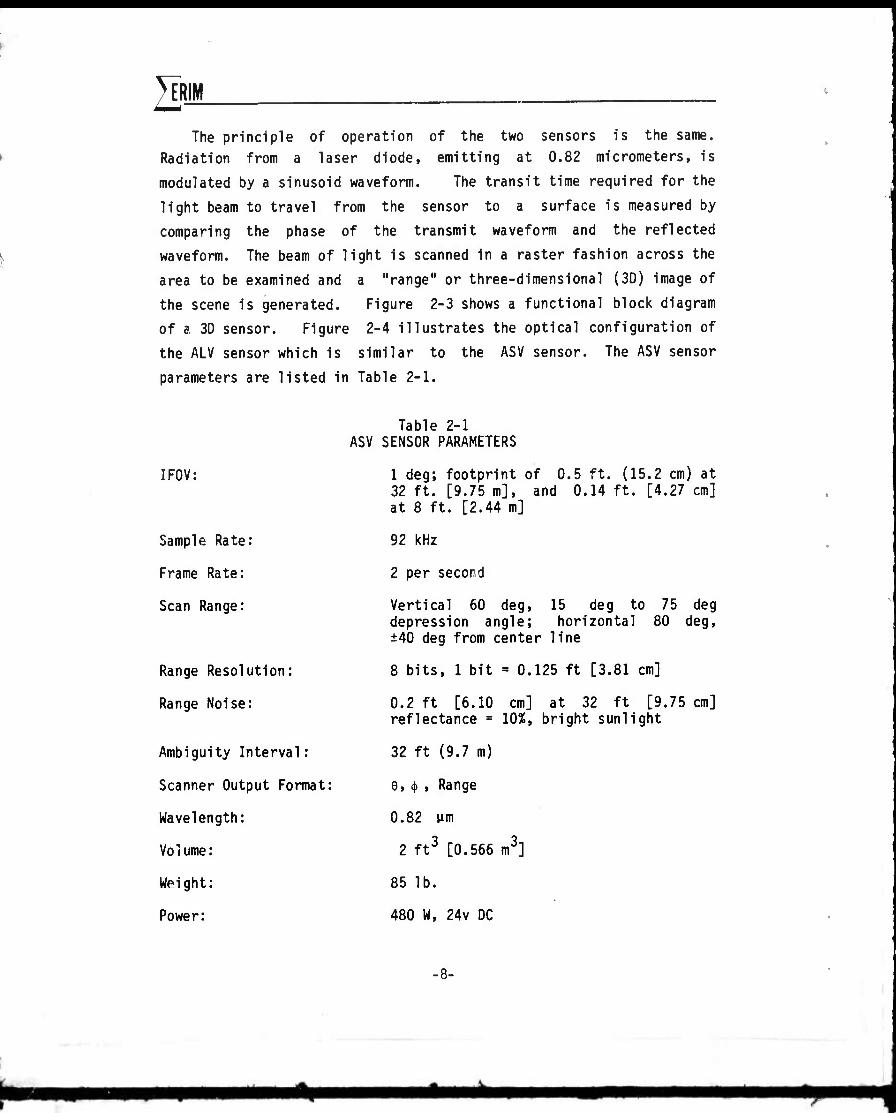
2PL A typical scene for MSS data is shown in Figures 3-4 and 3-5.
This location was chosen near ETL Site #89 and was selected not only
for solar aspect but for the diverse types of background components in
the scene. Note the various vegetation types, dirt road with puddle
of water, rocks, etc. The photographs were taken from the sensor
platform. Note the shadow of the sensor and photographer in the
foreground of Figure 3-5 which indicates the sun is directly behind
the sensor thereby achieving a small bistatic angle between the sun,
sensor, and target area.
3.3 September 1985 Measurements
A measurement scenario similar to that which occurred in July
1985 was planned for September 1985. The van deployed to the Denver
site on schedule; however, after departure, it was learned that
arrangements could not be made with the Denver Air National Guard for
the loan of a mobile power unit. Many alternate sources were
investigated but none could be arranged in a timely manner. Since the
primary purpose of the measurements was for passive multispectral
data, the MSS system was rewired at the Martin-Denver facility to
operate from the van's auxiliary power unit and a 28 VDC power supply
furnished by Martin.
Measurements were made at a total of ten different sites with a
total of 42 data runs. See the data log in Appendix C. Figure 3-6
shows the Denver site overlay with the measurement sites indicated.
3.4 May 1986 Measurements
Prior to the May 1986 measurements, ERIM acquired a new van and
reconfigured it with self-contained power units. All sensors were re-
installed on a platform over the cab as in ths original installation.
The emphasis during the May measurements was on specific
calibration sequences laid out by Martin. Eight scenarios were
programmed to provide animated collection of data simulating speeds
over various roads, terrain, etc. See Table 3-1 for a listing of the
scenarios. Site locations are indicated Ui Figure 3-7.
■22-
IP-
Figure 3-4. Photograph of Ground Scene Near ETI, Site #89
Figure 3-5. ETL Measurement Site #89 with Calibration Panels
-23-

2PL
Figure }-6. Measurement Test Sites September 1985
□ Indicates MSS Sites
-24-

2PL
Figure 3-7. Measurement Test Sites May 1986
■ ■•■■ Indicates Road Areas Traversed [~| Indicates Scenario and MSS Site
-25-

TERIM
Table 3-1
SCENARIOS FOR MAY 1986 MEASUREMENTS
A 10 1.39 20
C 10 5.55 10
D 10 5.55 10
B 10 5.55 10
B 10 5.55 10
B 10 5.55 10
E 10 5.55 20
F 5 2.77 10
Speed Data
(KPH- Interval Total
Site simulated) (Meters) Images
1 Asphalt road, no obstacles
2 Curving road
3 Intersection approach
4 Obstacle requiring maneuver
5 Obstacle requiring a stop
6 Multiple obstacles requiring maneuver
7 Dirt road (both straight and curved)
8 Straight path in open terrain
Prior to the measurement scenarios the depression angle of the 3-D
sensor was set for a nominal 21.5 degrees; i.e., -6.5° to -36.5° below
the horizon, and a series of calibration sequences were performed near
a concrete revetment site where known ranges and angles could be
measured. The MSS sensor was also operated at this site; however,
measurements were made near noon local time and the sky was almost
entirely overcast, hence, the MSS data were only useful in determining
the sensor scanning geometry.
The scenarios were run only with the 3-D and TV sensors. Martin
personnel had previously staked out all of the sites. After initial
trial run the measurements procedures became routine. A plumb was
attached to the front of the van and, with the aid of a guide
assisting the van driver, the vehicle was positioned within an inch of
the indicator on the roadway. The 3D sensor and tape recorder were
run continuously throughout each scenario. Approximately 10 seconds
of data were acquired at each location, the van was then advanced to
the next position, the sensor line count was reinitiated, and the next
10 seconds of data recorded, etc, etc.
■ 26-

V
2PL Additional continuous 3D data was acquired over the ALV road
networks throughout the Martin test site. One of the staked sites.
Site F, was located In open terrain; continuous 3D data were acquired
enroute to this site and In the Immediate vicinity. See Figure 3-7.
The procedure at Site F was also somewhat different; although It was
near noon when the measurements were made, MSS data were also acquired
at each location at this site and. Instead of running the tape
recording systems continuously as at the other scenario locations, new
runs were made at each position.
A series of MSS data was acquired on 30 May during the early
morning hours. Specific sites were ci,cf«>n considering solar aspect
and types of terrain. Unfortunately, the van could not enter the dirt
road complex at Martin where previous MSS data had been acquired due
to extreme muddy conditions. On 1 June, when the van could enter the
area, the sky was overcast which prohibited acquisition of meaningful data.
■27-
. ..: .,.. '
2PL
(THIS PAGE INTENTIONALLY LEFT BLANK)
-28-

2pL SECTION 4
DATA FORMAT
The Image sensors on ERIM's instrumented van may all be operated
simultaneously, however, there was no attempt made to achieve pixel by
pixel registration of the data from any combination of the sensors.
The two channels, ie, range and reflectance, from the 3D sensor are in
registration, as are the 12 channels from the MS sensor. All three
sensors are nominally boresighted with oth? another.
Sensor data are all recorded on magnetic tape in the van. Three
separate recorders are used. The color TV is recorded directly on
3/4-inch video cassettes with 60-minute time duration. Data from the
3D and MS sensors are recorded separately on 14-track digital tape
recording systems. Transfer of the data to computer tapes is
accomplished at ERIM's Ann Arbor facility.
4.1 3D Sensor Data
Single frame formatted data for the 3D sensor are provided as
"labeled tapes" and are mounted as "VAX tape, 1600 bpi" and "VAX/VMS
copy utility". These tapes will have range and reflectance files it it
which are labeleo by either gn####.img or fn####.img and a run
number, nssrun number. The range and reflectance files each contain 64
"active" scan lines. The "back scan" lines are usually deleted when
reformatting the data; however, the May 1986 tapes which were
distributed contain an additional 16 lines of "backscan" starting with
the first scan line at the top of the frame.
The range data contain header pixel values on each scan line, so
that these scan lines are 30+256 pixels in length. See Section 4.2.
The reflectance files contain 256 pixels with no header. In both
cases, each tape record contains 512 bytes of packed data (i.e., no
pad zeros).
*#### = 4 digit. Image number with leading zeros.
-29-

Jm There is also a text file, On.txt, which contains file
descriptions which include:
N = run number and
test files describing the run.
The image files are organized as follows:
first record (top of image) to last record (bottom of image)
first pixel(left side of image) to last pixel(right side of image)
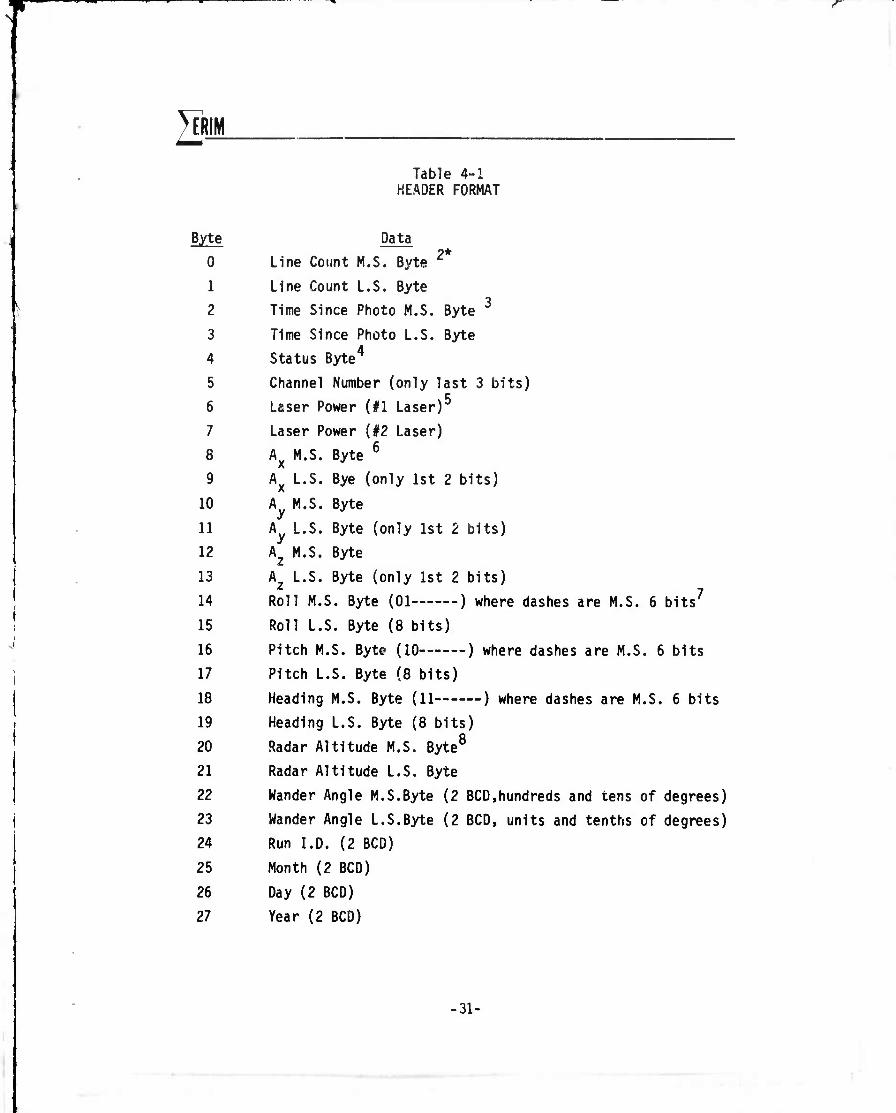
4.2 Scan Line Header Format
The scan line header format implemented on the tape recording
system is described below. The data sequence, starting immediately
after the non-roll-stabilized line sync, is listed in Table 4-1; see
notes below.
(1) The recorded header data is identical for each ..ack, and is
recorded immediately preceding each scan line. The scan-line
data is different for each track.
(2) Line Count (Byte n-mbers 0 and 1 in Table 4-1) is a 16-bit
binary number, and will be displayed on the control panel as a
four-place hexadecimal number.
(3) Time since photo is the time, in milliseconds, since the last
time the metric camera shutter was tripped. It also is a 16-
bit binary number.
(4) The status byte Is recorded as Byte No.4 in the table. It
shows the radar polarization and the 3D scanner ambiguity
interval for the scan line data which follows the header in
which the byte occurs. It also shows the crystal clock
frequency for the recording system. The coding is as follows.
(The MSB bit 7 occurs first)
MSB \_7_ 1 LSB
/ / \ t Radar Ambiguity Clock Unused
Polarization Interval Frequency (Set at 0)
-30-
■.■.,.■.■...■: I!= ,.■■..
2PL Table 4-1
HEADER FORMAT
Byte Data
0 Line Count M.S. Byte 2
1 Line Count L.S. Byte
2 Time Since Photo M.S. Byte
3 Time Since Photo L.S. Byte
4 Status Byte
5 Channel Number (only last 3 bits)
6 Laser Power (#1 Laser)
7 Laser Power (#2 Laser)
8 Ax M.S. Byte 6
9 Ax L.S. Bye (only 1st 2 bits)
10 A M.S. Byte
11 A L.S. Byte (only 1st 2 bits)
12 A2 M.S. Byte
13 Az L.S. Byte (only 1st 2 bits)
14 Roll M.S. Byte (01 ) where dashes are M.S. 6 bits7
15 Roll L.S. Byte (8 bits)
16 Pitch M.S. Byte (10 ) where dashes are M.S. 6 bits
17 Pitch L.S. Byte (8 bits)
18 Heading M.S. Byte (11 ) where dashes are M.S. 6 bits
19 Heading L.S. Byte (8 bits)
20 Radar Altitude M.S. Byte8
21 Radar Altitude L.S. Byte
22 Wander Angle M.S.Byte (2 BCD,hundreds and tens of degrees)
23 Wander Angle L.S.Byte (2 BCD, units and tenths of degrees)
24 Run I.D. (2 BCD)
25 Month (2 BCD)
26 Day (2 BCD)
27 Year (2 BCD)
•31-

KIM i
28 No. of pixels per scan line per channel M.S. Byte (2 BCD,
thousands and hundreds)
29 No. of pixels per scan line per channel L.S. Byte (2 BCD,
tens and hundreds)
30 First Byte of Line Scan Data
4.3 MSS Data The multispectral system scans horizontally ±50° with an
instantaneous field of view (IFOV) and sampling rate such that 803
pixels are generated across the field of view (FOV). See Figure 4-1.
The vertical scan is manually controlled by an operator switching the
nodding mirror beneath the sensor. The vertical scan is at a constant
angular rate and is set to provide proportionate horizontal and
vertical scale, ie, the correct perspective of the imaged scene.
Vertical scans are typically made ±45° with respect to the horizon,
resulting in approximately 800-900 scan lines for a given frame. When
reformatting the dat., each scene was viewed on a display and only 512
lines of data selected with the top of the frame positioned such that
a portion of the sky was contained in each image, the horizontal FOV
was also reduced by extracting only 512 pixels from the center of tne
image. The resulting frame, therefore, consists of 512 scan lines
with 512 pixels per line. Note, the near-field image, i.e., that
portion of the terrain close to the van. is out of focus as the MS
sensor is designed for airborne use and has the focus preset to
infinity. See Figure 4-2 for a typical MSS image at the Denver ALV
test site. Note the shadow of the van and defocused image in the
foreground. The MSS data are reformatted to computer tape without header
information. File names are identified xmuU1##.1mg. where x is the
run number and ## is the channel number within the frame.
-32-

Jm
90° (Typical) (800-900 Lines)
512 x 512 Pixels ~ 64° x 64° FOV
803 Pixels
100° Sensor FOV
Figure 4-1. Reformatted MSS Data
33-
■

2PL
■
Figure 4-2. Multi Spectral Image, July 1985, Run 12, Band 2
-34-

E im 4.4 INS Data
The following is a brief discussion on the use of the INS data
recorded in the header information for the 3D sensor. Header bytes 8
thru 29 (except 20 and 11) are relevant to the task of navigation.
See Table 4-1.
The framing rate for the 3D sensor is 2 frames/second, the scan
rate is 6.25 msec/scan; and the duty cycle is 80X (i.e. there are 64
active scan lines and 16 back-scan lines).
The translation data Ax, Ay, Az are represented in 10 bit unsigned
binary format corresponding to +/- acceleration due to gravity g.
0 units > 2**10 units
-g > +9
The coordinate system is based on an 'intertial space' in which the x-
axis is offset from true north (determined by earth rate) by the
'wander angle'. The wander angle varies from run to run; but, is
fixed throughout any particular run (it is set manually by thumb-
wheels after the INS system self-calibrates and settles, i.e.,
approximately 15 minutes after it is switched on).
Roll is recorded in 14-bit unsigned binary format corresponding to
0 to 360 degrees, where 0 and 360 degrees represents 'no roll'.
Angles are measured clockwise looking in the direction forward travel
of the vehicle.
0 units > 2**14 units
0 degrees > 360 degrees
Roll is therefore in units of 1/2**14 of 360 degrees with:
0 degrees (no roll) as 0 or 2**14 units
180 degrees as 2**13 units, (roll over time!!)
There is a wrap around at 2**13 s.t. 2**13 to 2**14 should be
viewed as a counterclockwise roll.
i.e. Roll ■ (measured roll) - 2**14
2**14 or 0 units
3*(2**12) units 1-_-2**12 units
2**13 units
■35-

2p Pitch is recorded in 14-bit unsigned binary format corresponding to 0
to 360 degrees, where 0 and 360 degrees represents 'no pitch1 and in
the direction of forward travel. Angles are measured counterclockwise
with angles increasing as the nose of the vehicle pitches up.
0 units > 2**14 units
0 degrees > 360 degrees.
Pitch is therefore in units of 1/2**14 of 360 degrees
0 degrees as 0 or 2**14 units (in the horizontal tangent
plane)
180 degrees as 2**13 units (Note, vehicle is on its back!)
Angles above 2**13 should be interpreted as 'pitch down'.
i.e. Pitch = (measured pitch) - 2**14
2**12 units
2**13 units ; 0 or 2**14 units (vehicle heading)
3*(2**12) units
Heading is recorded in 14-bit unsigned binary format corresponding to
0 to 360 degrees.
0 units > 2**14 units
0 degrees > 360 degree
Htading is therefore in units of 1/2**14 of 360 degrees and is
.neasured clockwise from the x-axis of the inertial platform or space.
true heading = measured heading + wander angle
The coordinate system with the wander angle and heading is shown in
Figure 4-3.
•36-

2PL
Figure 4-3. Coordinate System for Navigation
■ 37-

TERIM
(THIS PAGE INTENTIONALLY LEFT BLANK)
-38-

Jm SECTION 5
DISTRIBUTION OF DATA BASE
This report has summarized the image-sensor data collection
program conducted by ERIM for the DARPA ALV program. Extensive
amounts of data were recorded during all four measurement periods.
Only a very small percentage of the data has been transferred to
computer tapes to date. Primary emphasis was placed on the July 1985
and May 1986 data since these periods had all sensors operating.
5.1 Data Anomolies
The sensor data were not without anomolies. For example, Channel
9 of the MSS was inoperable during the July 85 mission. This mission
was also the first time ERIM's ALV 3D sensor was used and the
reflectance data channel had a defect which resulted in the "most
significant bit" folding over into the remaining bit levels, rendering
the reflectance data ambiguous. The sensors were operated over very
rough terrain at the Martin Denver site; on occasion sensor vibration
caused dropouts or digital count levels to increase from a few pixels
to an entire scan line. During both the July 1985 and May 1986
collection periods, the 3D sensor had heat build-up problems causing
thermal cut-outs within the sensor. This latter problem does not
manifest itself in the data, however, as data was not recorded during
these periods.
5.2 Computer Tape Distribution
Duplicate video tapes, i.e., color TV VCR cassettes of all the
runs were delivered to Martin Marietta after each mission. In general,
these tapes were used to select areas or scenes which were desired for
reformatting sensor data to computer tape.
39-

I!' EO There were few requests from the ALV community for data from the
September 1984 mission as the 3D sensor was somewhat unique to the ASV
program. Computer tapes of specific areas were provided to OSU,
Martin, Hughes and SRI, however.
Selected areas of the July 1985 data were reformatted and
duplicated in twelve copies for the ALV community. A single composite
TV tape was duplicated as were one 3D data tape and 2 MS data tapes.
Table 5-1 lists the details of the July 1985 data which was
distributed. A list of the recipients of the data is provided in
Table 5-2.
As indicated in Section 3.3, only the multispectral sensor was
operated during the September 1985 mission. None of this data has
been reviewed or reformatted to date.
The May 1986 measurement period provided the most extensive and
potentially useful set of data. Complete duplicates of the video
cassettes have been sent to Martin and SRI. Selected segments of both
the 3D and MSS data as indicated in Table 5-3, have also been sent to
Martin Marietta.
•40-

2ERJM Table 5-1
SUMMARY OF JULY 1985 DATA DISSEMINATED
TV DATA (1 Tape)
Composite Tape from July 85 Data Containing:
6 Runs, 11 Sec, 3D Road Data *
5 Runs, 11 Sec, 3D Cross Country Data *
13 Scenes, 10 Sec, MS Data **
1 Run, 24 Min, 3D Road Data (Solar Lab to ALV Lab)
1 Run, 20 Min, 3D Cross Country
1 Run, 10 Min, 3D Cross Country (Reverse)
■
*3D DATA (1-CCT, 1600 BPI)
11 Segments @ 11 Sec./Segment 22 Frames/Segment (ie, 2 Frames/Second)
2 Images/Scene (Range and Reflectance)
484 Image Files Total
64 Scan Lines/Image
256 Pixels/Scan Line
**MS DATA (2-CCT, 1600 BPI) 12 SCENES ONLY
6 Scenes/CCT 14 Images/Scene (12 MS, Range, Reflectance)
84 Image Files/CCT
168 Image Files Total
512 Scan Lines/Image
512 Pixels/Scan Line
■ 41-

^ERJM
Table 5-2
ALV DATA RECIPIENTS
Stanford Research Institute (SRI)
333 Ravenswood Avenue
Menlo Park, CA 94025
Attn: Dr. Steve Barnard (Robert Bolles) 415-859-4620
AI & DS
201 San Antonio Circle
Mountain View, CA 94040
Attn: Dr. Ted Linden 415-941-3912
Hughes
Artificial Intelligence Center
23901 Calabasas Road
Calabasas, CA 91302
Attn: Dr. David Tseng (Kann 01 in) 818-702-5276
Carnegie-Mellon University (CMU)
Schenely Park
Pittsburgh, PA 15213
Attn: Dr. Chuck Thorpe 412-678-3612
University of Maryland
Center of Automation Research
College Park, MD 20742
Attn: Prof. Larry Davis 301-454-4526
Martin Marietta
Denver Aerospace
P.O. Box 179
Denver, CO 80201
Attn: James Allison, MS T0572, 303-977-5461
■ 42-

2JpL
Massachusetts Institute of Technology
545 Technology Square
Cambridge, MA 02139
Attn: Jim Little 617-253-5230
Honeywell Systems and Research Center
2600 Ridgway Parkway NE
Minneapolis, MN 55413
Attn: Durga P. PanHa 612-378-5058
University of Southern California
Towel 1 Hall, Rm. 232
Los Angeles, CA 90089-0273
Attn: Dr. Nevatia 213-743-5516
University of Massachusetts
Amherst, MA 01003
Attn: Prof. Ed Riseman 413-545-2746
University of Rochester
Rochester, NY 14627
Attn: Prof. Chris Brown 716-275-7852
U.S. Army
Engineering Topographical Laboratories (ETL)
Ft. Belvoir, VA 22060-5546
Attn: Ms. Rose Holecheck 202-355-2679
-43-
■
mmmmmmmmtmmt^mmmmmämmimmmmmmmmmmmmmmam

2PL Table 5-3
MAY 1986 REFORMATTED DATA
3D Sensor (selected segments only)
5/28 Runs #1, 2
5/29 Runs #1-7
5/30 Runs #1-15, 17, 18, 22
MSS Sensor
5/29 Runs 1, 2, 12. 13
5/30 Runs 1, 2, 4, 5, 7, 11
■ 44-
m*aamm*mm*mmmammmmmmmammmm

2Tiü.
APPENDIX A
DATA COLLECTION LOG
SEPTEMBER 1984
• 45-

2ERJM
APPENDIX A
DATA LOG
ASV SENSOR - DENVER DATA COLLECTION
9/25/84 Weather: Overcast
RUN TIME SITE COMMENTS
1 14:34 Road Site Middle of Road, 7 KTS
2 — Road Site Middle of Road
3 15:08 Road Site Weaving, 8-9 KTS
4 15:21 Road Site Weaving, 5-6 KTS
5 15:35 Road Site Right Side of Road
6 15:44 Rord Site Middle and Right Side
9/26/84 Weather: Overcast
1 10:40 Road Site Aborted due to bad VCR
2 11:12 Road Site
3 11:48 Road Site Reverse of Run #2
(Cars both directions)
4 15:33 Road Site 6 KTS
5 16:45 Road Site
6 17:30 Road S^ e
9/27/84 Weather: Partly Cloudy
1 16:12 Road Site Changed to wide angle lens
on TV
2 17:13 Dirt Road
3 17:40 Dirt Road
■46-
i
*

2PL
APPLNDIX B
DATA COLLECTION LOG
JULY 1985
-47-
*

2p. APPENDIX B
DATA LOG 7/2/85
ALV-MMS DENVER DATA COLLECTION
Litton Wander Angle
ALV HDDT
Video
Audio
3328
ALV Tape #2
Video Tape #2
Audio Tape #1, Side B
Audio Tape #2, Side A
ALV Run Number Time
11:09:30 11:33:20
Video Tape Count
013
Comments
Run #1 originated at Solar Lab (013A2), destination ALV drive entrance (462A2)
Changed Audio Tape: Audio Tape #2, Side A
11:51:20 12:14:00
462 Run #2 originated at ALV •737 Building at road junction
(462B2), destination Solar Lab (737B2)
12:23:00 •12:35:35
737 Run #3 originated at Solar Lab (73702), destination road junction (857C2)
Run #3 was the optional Martin Marietta data taken with the ALV set at 16° to 46° depression angle.
■48-

2p!. DATA LOG 7/2/85
ALV-MMS DENVER DATA COLLECTION (con't)
Litton Wander Angle
ALV HDDT
Video
Audio
2080
ALV Tape #3
Video Tape #3
Audio Tape #2, Side B
ALV Run Number
1
Time
16:08:00 ■16:28:15
16:43:00 -16:56:00
Video Tape Count
012 -406
406 -587
Comments
Recorder start 16:07:45 Cross-country road ALV Data
Recorder start 16:42:50
Emergency stop -- Power unit oscillation
Run #1 originated at entrance road junction (012A3), destination road junction past ETL area (406A3)
Run #2 was the reverse of Run #1. (406B3)-(597B3)
49-

2pL DATA LOG 7/3/85
ALV-MMS DENVER DATA COLLECTION
No Litton Data
ALV HDDT ! ALV Tape #4
MMS HDDT MMS Tape #1
Video ; Video Tape #4
Aud io Audio Tape #3, Side A
Run MMS
Number ALV
Time Video Tape Count (Reset) (Start)
Location Position
1 1 6:54:20 013 1 ETL Site #89
2 2 6:58:00 024 1
3 3 7:03:25 035 2
4 4 7:06:50 047 3
5 5 7:16:40 059 4
6
7
6
7
7:2120
7:53:10
069
084 2
5
1 Dirt Road Site
3 8 7:55:10 094 2 1
9 9 7:58:40 100 2 2
10 10 8:02:10 110 2 3
11 11 8:05:30 120 2 4
12 12 8:07:40 129 2 5
13
14
13
14
8:10:10
8:28:00
138
148
2
3
6
1 Curve/Hill Site
15 15 8:30:50 157 3 2
16 16 8:33:00 166 3 3
17 17 8:35:40 175 3 4
18 18 8:38:00 183 3 5
'
Note: Recorders were started 10-15 seconds before reset time.
-50-
* II

2PL DATA LOG 7/4/85
ALV-MMS DENVER DATA COLLECTION
No Litton Data
ALV HDDT ; ALV Tape #4
MMS HDDT MMS Tape #1
Video Video Tape #4
Audio : Audio Tape #4 , Side A
Run MMS
Numbei ALV
Time Video Tape Count (Reset) (Start) Location Position
19
20
21
19
20
21
6:42:00
6:46:30
6:52:50
192
201
210
1 w/Panels Grass Site
1 w/Panels Grass Site
2 w/o Panels Grass Site
22 22 6:55:50 218 3
23 23 6:57:20 226 3
24 24 6:59:30 234 3
25
26
25
26
7:03:10
7:21:20
24?
250 5 4 1 Grass Site
27 27 7:26:30 258 5 2
28 28 7:28:50 266 5 3
29 29 7:31:40 273 5 4
30
31
30
31
7:34:00
8:09:20
281
288
5
6
5 1 Road Site (Dirt)
32 32 8:11:30 296 6 2
33 33 8:15:00 303 6 3
34 34 8:17:20 310 6 4
35 35 8:18:50 317 6 4
36
37
36
37
8:21:20
9:32:30
325
332
5 1 Asphalt Road by
Contractor Area
38 38 9:35:00 339 2
39 39 9:38:00 346 3
40 40 9:40:20 352 4
41 41 9:42:20 359 5
42 42 9:44:50 366 6
-51-
mmmtmA A

Jm_
(THIS PAGE INTENTIONALLY LEFT BLANK)
-52-
rii^M^^^^MBHnMlftMM^
I

2PL
APPENDIX C
DATA COLLEvflON LOG
SEPTEMBER 1985
-53-
^—^—A.

^—— APPENDIX C
DATA LOG 9/25/85
MSS DENVER DATA COLLECTION
Run No. Time Site Position/Comments
1 08:33:40 A Hill Top Site
2 08:38:17 A w/Cal Panels
3 *09:02 (15:23:25) B Access Road (Right)
4 *09:05 (15:26 .:15) B w/Cal Panels
5 09:36:15 C ETL Site #89
6 09:41:00 C
7 09:43:50 c 8 09:48:00 C
9 09:51:45 C
10 09:56:10 C
11 09:59:45 C
12 10:03:53 C 8
13 10:07:30 C 8 w/Cal Panels
14 10:17:38 C 9 Looking Up Road
15 10:26:45 0 1 Roadside (L0C#2, 7/85)
16 10:58:05 E 1 Snowberry by Ravine
17 14:43:17 F 1 Road Site (CC)
18 14:46:05 F 2
19 14:49:10 F 3
20 14:51:50 F 4
21 14:54:40 F 5
22 15:04:30 F 5 w/Cal Panels
23 15:42:35 G 1 Rock Site w/Cal Panels
24 15:43:60 G 1
25 15:47:55 G 2
26 15:51:10 G 3
27 15:55:15 G 4
*Time Counter Reset Incorrectly
■54-
i

^TRJM DATA LOG 9/26/85
MSS DENVER DATA COLLECTION
Run No.
28
Z9
30
31
32
33
34
35
36
37
38
39
40
41
42
Time
08:47:42
08:55:00
08:58:12
09:00:25
09:02:30
09:06:10
09:10:55
09:14:05
09:17:40
09:21:05
09:23:15
09:36:50
09:39:00
09:40:30
09:41:55
Site
H
H
H
H
H
H
Position/Comments
K
K
K
K
1
1
2
3
4
5
1
2
3
4
5
1
2
3
Road Site (Tar) w/Panel
New Tar Road Site
w/Panel
Road Site (Propane Tank)
-55-
.

Jm
(THIS PAGE INTENTIONALLY LEFT BLANK)
-56-

N
Jm
APPENDIX D
DATA COLLECTION LOG
MAY 1986
■57-

>
2ERI ■ APPENDIX D
DATA LOG 5/28/86 ALV-MSS DENVER DATA COLLECTION
RUN TIME START TIMESTOP 3D/MS LOCATION/POSITION
! 14:59:40 15:06:24 Y/N ^enroute fro. "T"
REMARKS
15:08:03 16:16:34 Y/N Rev.rs. of RUr#l JJ JJ3^",«1'
23 ft. apart
-58-
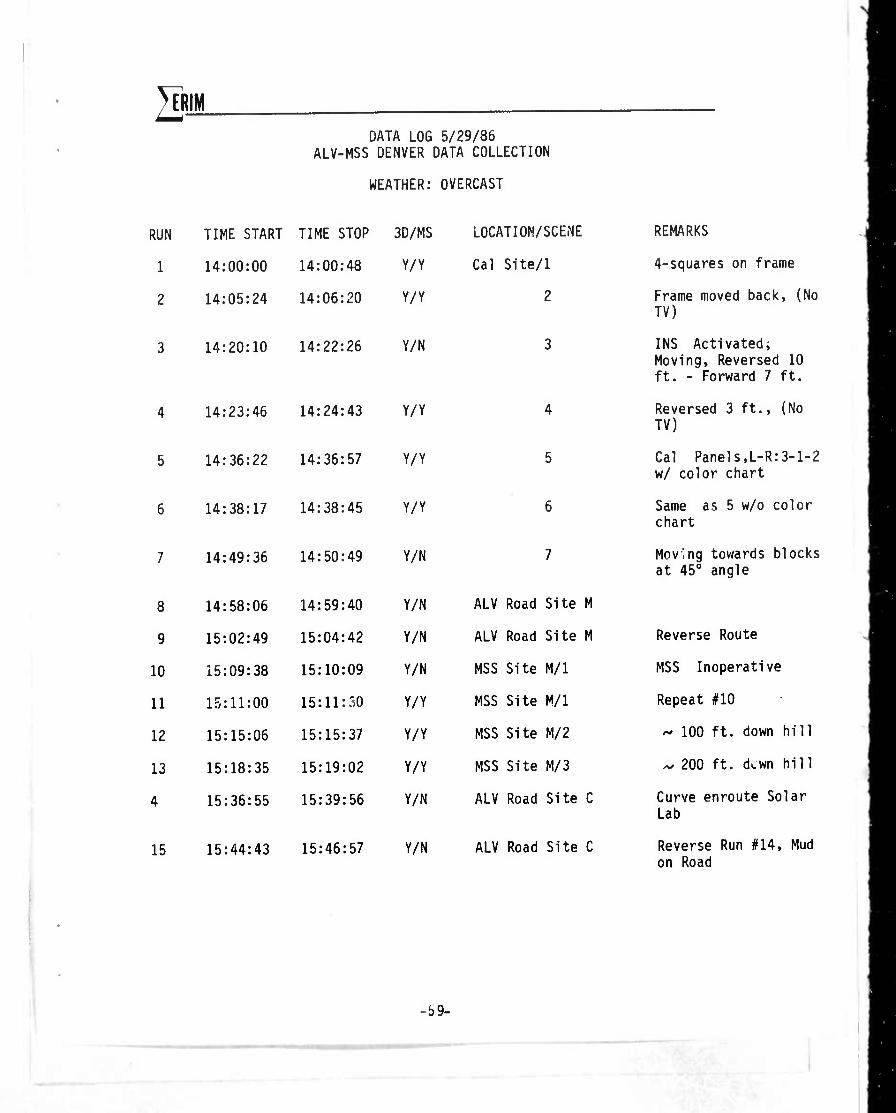
2JERJM DATA LOG 5/29/86
ALV-MSS DENVER DATA COLLECTION
WEATHER: OVERCAST
RUN TIME START TIME STOP 3D/MS
1 14:00:00 14:00:48 Y/Y
2 14:05:24 14:06:20 Y/Y
3 14:20:10 14:22:26 Y/N
4 14:23:46 14:24:43 Y/Y
5 14:36:22 14:36:57 Y/Y
LOCATION/SCENE
Cal Site/1
2
REMARKS
4-squares on frame
Frame moved back, (No TV)
INS Activated; Moving, Reversed 10 ft. - Forward 7 ft.
Reversed 3 ft., (No TV)
Cal Panels,L-R:3-l-2 w/ color chart
6 14:38:17 14:38:45 Y/Y 6 Same as 5 w/o color chart
7 14:49:36 14:50:49 Y/N 7 Moving towards blocks at 45° angle
8 14:58:06 14:59:40 Y/N ALV Road Site M
9 15:02:49 15:04:42 Y/N ALV Road Site M Reverse Route
10 15:09:38 15:10:09 Y/N MSS Site M/l MSS Inoperative
11 15:11:00 15:11:30 Y/Y MSS Site M/l Repeat #10
12 15:15:06 15:15:37 Y/Y MSS Site M/2 ^ 100 ft. down hill
13 15:18:35 15:19:02 Y/Y MSS Site M/3 ~ 200 ft. dcwn hill
4 15:36:55 15:39:56 Y/N ALV Road Site C Curve enroute Solar Lab
15 15:44:43 15:46:57 Y/N ALV Road Site C Reverse Run #14, Mud on Road
•59-

2PL DATA LOG 5/30/86
ALV-MSS DENVER DATA COLLECTION
WEATHER: CLEAR
RUN TIME START
1 06:34:03
2 06:35:32
3 06:37:52
4 06:45:55
5 07:17:32
6 07:18:50
7 07:22:47
8 07:37:34
9 07:38:32
10 07:47:19
11 08:02:02
12 08:03:13
13 10:13:54
TIME STOP
06:34:30
06:36:00
06:38:17
06:46:35
07:18:00
07:19:14
07:23:11
07:38:02
07:38:57
07:47:44
08:02:41
08:03:37
10:24:12
14 10:33:46 10:41:29
15 12:37:27 12:44:30
16 13:06:42 13:08:44
3D/MS LOCATION/SCENE
Y/Y ALV Road Site S
Y/Y ALV Road Site S
Y/Y ALV Road Site S
Y/Y ALV Road Site T
Y/Y ALV Road Curve Site C/l
Y/Y ALV Road Curve Site C/l
Y/Y ALV Road Curve Site C/2
Y/Y MSS Site M/l
Y/Y MSS Site M/l
Y/Y MSS Site M/2
Y/Y MSS Site M/1A
Y/Y MSS Site M/1A
Y/N MM Site A
Y/N MM Site C
Y/N MM Site D
Y/N MM Site B
REMARKS
With #1 & #3 Panels
#1 Panel Shadowed
w/o Panels
#1 & #3 Panels
w/o Panels
Forward ^ 100 ft.
#3 Panel
w/o Panel
Back ^ 100 ft.
Repeat Run #8 w/panel #3
Repeat Run #8 w/o panel #3
Multiple Stops w/llne count resets
Multiple Stops Curve Site
Multiple Stops Road "T" site
Multiple Stops w/obstacle
•60-
MiKMHMHft ^^

2p. DATA LOG B/SO/Se-con't
ALV-MSS DENVER DATA COLLECTION
RUN
17
18
19
20
21
22
TIME START TIME STOP
13:12:05 13:17:13
13:28:00 13:32:52
13:34:38 13:35:48
13:47:46 13:53:14
14:05:30 14:06:17
3D/MS LOCATION/SCENE
Y/N MM Site B
Y/N MM Site B
Y/N MM Site B
Y/N MM Site B
Y/N MM Site B
REMARKS
Repeat #16
With #1 & #2 Panels
Moving to Panels
Staggered Panels
Moving through staggered panels
'
14:10:38 14:10:38 Y/N ALV Road Curve Site C Clean Wet road w/car
• 61-
^* ^

2p. DATA LÜG 5/31/86
ALV-MSS DENVER DATA COLLECTION
WEATHER: CLEAR
RUN TIME START TIME STOP 3D/MS LOCATION/SCENE REMARKS
1 11:55:13 11:59:01 Y/N CC Pasture Enroute to MM Site
2 12:03:06 12:07:28 V/N Pasture w/Flags (Site F) Enroute to and over flagged site
3 12:31:34 12:32:07 Y/Y Flagged Site F Stop & Go, Forward and Reverse Wheel Markings
13 12:46:30 12:46:56 Y/Y Flagged Site F Panels at end #1R, #3L
14 12:52:59 12:55:53 Y/N Pasture Site Return route
15 12:57:22 13:01:07 Y/N Pasture Site Return continued
16 13:13:17 13:16:57 Y/N Dirt Road (? Pasture Site Start at Power Lines
17 16:20:29 16:30:14 Y/N MM Flag Site E Stop & Go
18* 16:37:23 16:40:40 Y/N CC Dirt Road Start at Back Country "TM, continuous over Site E
19* 16:57:46 17:00:01 Y/N CC Dirt Road Continue Run 18
intermittent power problems
-62-
mammmA - .;

2PL DATA LOG 6/1/86
ALV-MSS DENVER DATA COLLECTION
WEATHER: PARTLY CLOUDY-OVERCAST
RUN TIME START TIME STOP 3D/MS
1 06:22:43 06:35:16 Y/N
2 06:41:18 06:51:04 Y/N
LOCATION/SCENE
CC Dirt Road
CC Dirt Road
REMARKS
Start at Back Country "T", TV in/out shadow
Reverse of 1
•63-

IJP-
(THIS PAGE INTENTIONALLY LEFT BLANK)
• 64-
i
M M ük.

2ERJM LIST OF REFERENCES
1. Zuk, David M., and Dell'Eva, Mark L., "Three-Dimensional Vision System for the Adaptive Suspension Vehicle", Report Number 170400- 3-F, Environmental Research Institute of Michigan, Ann Arbor, Michigan, January 1983.
2. Zuk, D.M., Dell'Eva, M.L., and Van Atta, P., "3D Sensor for Adaptive Suspension Vehicle", Report Number 164700-4-F, Environmental Research Institute of Michigan, Ann Arbor, Michigan, November 1984.
Rinker, J.N., etal, "Terrain Data Base - Air Photo Analysis, Martin Marietta ALV Test Site", U.S. Army Engineer Topographic Laboratories, Ft. Belvoir, Virginia, January 1986.
-65-
..