Embed Size (px)
Citation preview

~ 19 SO
International Commission for the
Northwest Atlantic Fisheries 1970
RESTRICTED
Serial No.2341 (B.g.18)
ICNAF Comm.Doc.70/14
ANNUAL MEETING - JUNE 1970
Report of
Joint ICES/ICNAF Working Group on Selectivity Analysis
Comparative Selectivity of Bottom Trawls made of Different Materials
(Moscow, March 1969, and Charlottenlund, September 1969)
CONTENTS
Page
INTRODUCTION. • . . • . • . . • . • . . • • . . • • . . . . . . . . • . • . . • . • . • • • . . . • . . . . . • . . . • . . . • . 1
PART A.
PART B.
PART C.
PART D.
PART E.
Comparative evaluation of the properties of net materials used for making trawls. by A. von Brandt .••.•.••••••••••••• 2
The statistical analysis of selectivity data. by J.A.Pope ••. 12
Compilation of selectivity data for cod, haddock and redfish. by A. 1. Treschev ••••••••••.••••.••••••.•.•.•..••..••••••• ' . • • • 22
Conclusions and recommendations.............................. 48
Bibliography. by H. Bohl and M.J.Holden.. •••••••... ••••• •••. 54

INTRODUCTION
Following the report of its Subcommittee on Fishing Gear and Selectivity, the Standing Committee on Research and Statistics (R&S) at the 18th Annual Meeting of ICNAF held in London from 4 to 8 June 1968 recommended:
i) that an ICNAF Working Group on Selectivity Analysis be formed to undertake a review of variability in selection data, including the scientific basis of mesh size differentials for different twine materials;
ii) that the Chairman of R&S appoint a convener for this Working Group;
iii) that experts he appointed to the Working Group by interested member countries;
iv) that ICES be invited to participate, in order to make a joint study of these problems;
v) that the Working Group meet at a mutually convenient time so that its report could be available for the next meeting of both ICNAF and NEAFC.
(ICNAF Redbook 1968. Pt.I. p.12)
At its 56th Annual Meeting held in Copenhagen from 30 September to 9 October 1968, ICES accepted ICNAF's invitation to take part in the activities of the Group (C.Res.1968/3:3).
A preparatory meeting was held in Copenhagen on 4 October 1968 attended by representatives of those countries which expressed their wish to participate in the activities of the Group. at which time, place and program of work were agreed upon.
The Joint ICES/ICNAF Working Group on Selectivity Analysis held its meetings at VNIRO, Moscow, from 26 to 29 March 1969 and at ICES, Charlottenlund, from 2 to 6 September 1969.
The Working Group was to prepare working papers covering the following subjects,
1) Comparison of the properties of net materials of trawls in the North Atlantic and investigation of the effect of trawl construction on selectivity;
2) Analysis of the variability of marine experiments on selectivity and the validity of selectivity data;
3) Compilation of the selectivity data for cod, haddock and redfish, including a tabulation of equivalents for different net materials.
Prof. von Brandt was asked to prepare the first working paper, Hr Pope the second, and Dr Treschev the third. These three papers appear as Parts A, B, and C of this report. A bibliography was prepared by Dr Bohl and Mr Holden which appears as Part E.
The meeting participants were as follows:
Both meetings Dr A.I.Treschev, USSR (Chairman) Mr M.J.Holden, UK (Secretary) Mr J.A .Pope, UK Dr H. Bohl, FRG Prof. A. von Brandt, FRG
First meeting only Dr J. Reuter, Netherlands Mr S. PrUffer, Po~and Dr W. Strzyzewski; Poland Dr G.N.Stepanov, USSR Mr B.I.Danilov, USSR Mr A.A.Volkov, USSR
Second meeting only Mr V.S.Belov, USSR Mr L.M.Zheltov, USSR Mr J. M~ller Christe,nsen, Secretary of the Liaison Committee
\r\

2
PART A
COMPARATIVE EVALUATION OF THE PROPERTIES OF NET MATERIALS USED FOR MAKING TRAWLS
by A. von Brandt
Institut fur Fangtechnik, Hamburg
According to different investigations, the selectivity of codends in trawls may be influenced by different facts:
a) fish (species, quantity, behaviour); b) gear (material, rigging, hanging, mesh size, shape of the mesh); c) operation of the gear (speed, towing force, towing time).
Most lnves tigations underline that the net material has a decisive influence on the selectivity of a trawl. However, there are a1eo examples, e.g. size of the catch or shape of the mesh, that may have an influence.
The selection factor, sf., that means the relation between fish length and mesh size, is considered to be more or less constant' for the different net" materials used for codends in bottom trawling. According to the results of many tests for the same material (e.g. polypropylene), the construction (e.g. twisted.or plaited) and the type of material (e.g. fibre or film) have no influence.
It has been found that different net materials used for codends in the ICNAF and ICES areas have similar or the same selection factor. There are at least two groups:
1) manila, sisal, polyethylene (PE), and polypropylene (PP); 2) cotton, hemp, polyamide (PA), and polyester (PES).
Nevertheless, sometimes doubt arose about the classification of' some-materials. There may be some overlapping according to the complexity of the problem.
The different selectivity of different net materials used for codends in trawling has been explained by other authors with the different properties of the net materials. Extension, flexibility, and roughness have been mentioned as the main reasons for different selectivity.
The difficulty is that the properties of a netting twine are changeable in some degree with the type of manufacture. A hard twisted twine can have not only less strength but also less flexibility compared with a soft twisted one. The tension of netting twines increases with their numbers or diameters, etc. This means that there must be more than one property responsible for the selectivity, even when the net material is taken into consideration.
In the case where different net materials have almost the same selectivity as mentioned before, and their properties are responsible for the selectivity, they must have similar properties. To find them could give an explanation for the theory of the selection process in codends.
Only those net materials which can be exchanged with each other are comparable. According to the differences of properties, it seems unwise to compare net materials used for inshore fishing with small boats with those used for deep sea fishing with big trawlers. Therefore, member countries have been asked for materials used for bottom trawls in the ICES or ICNAF areas only. It may be useful to limit the net materials to R 2,500 tex and 400 m/kg.
The following countries have been kind enough to send samples of net materials: Belgium; Canada; Denmark; Finland; France; Germany, Fed. Rep.; Iceland; Ireland; Italy; NetherlandB; Poland; Portugal; Romania; Spain; Sweden; UK; USA; USSR. Samples are missing from Norway only.

3
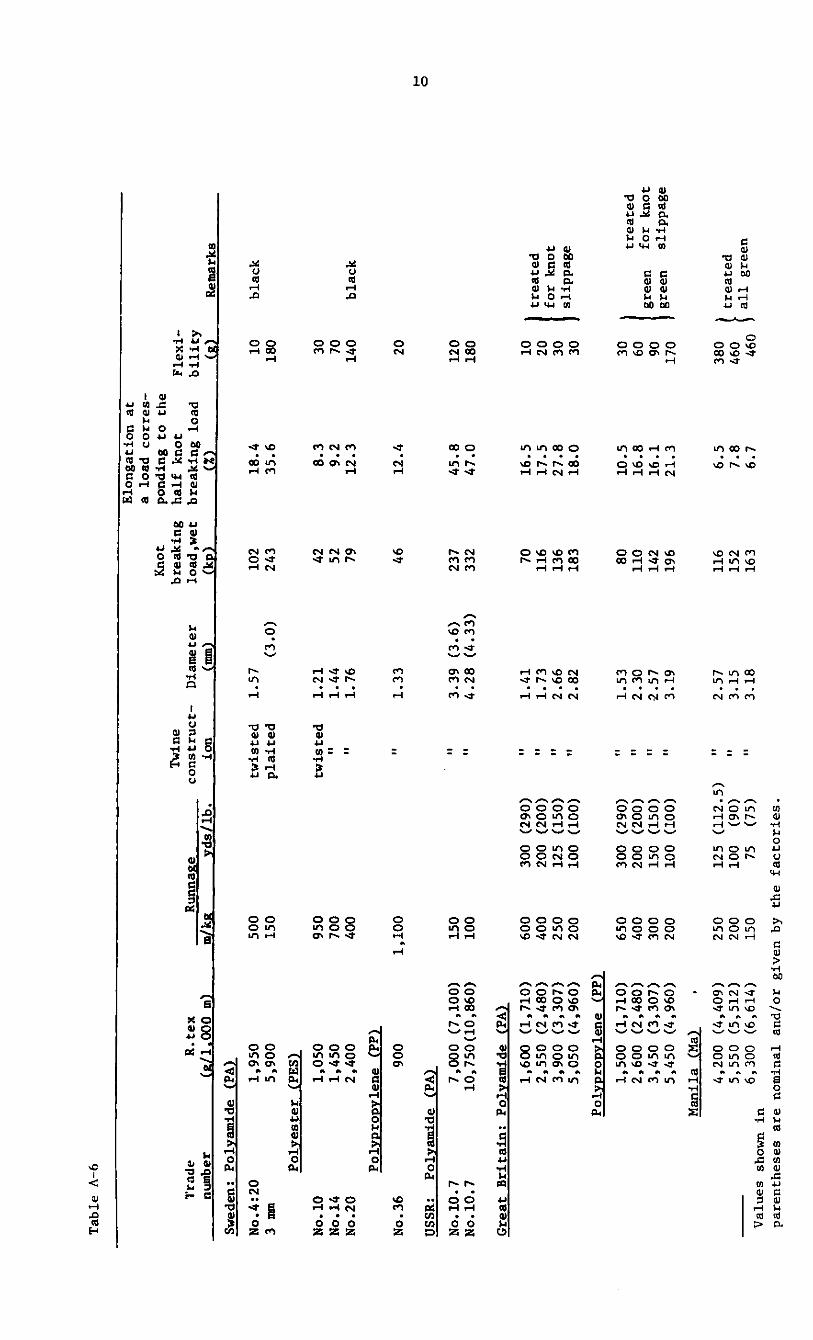
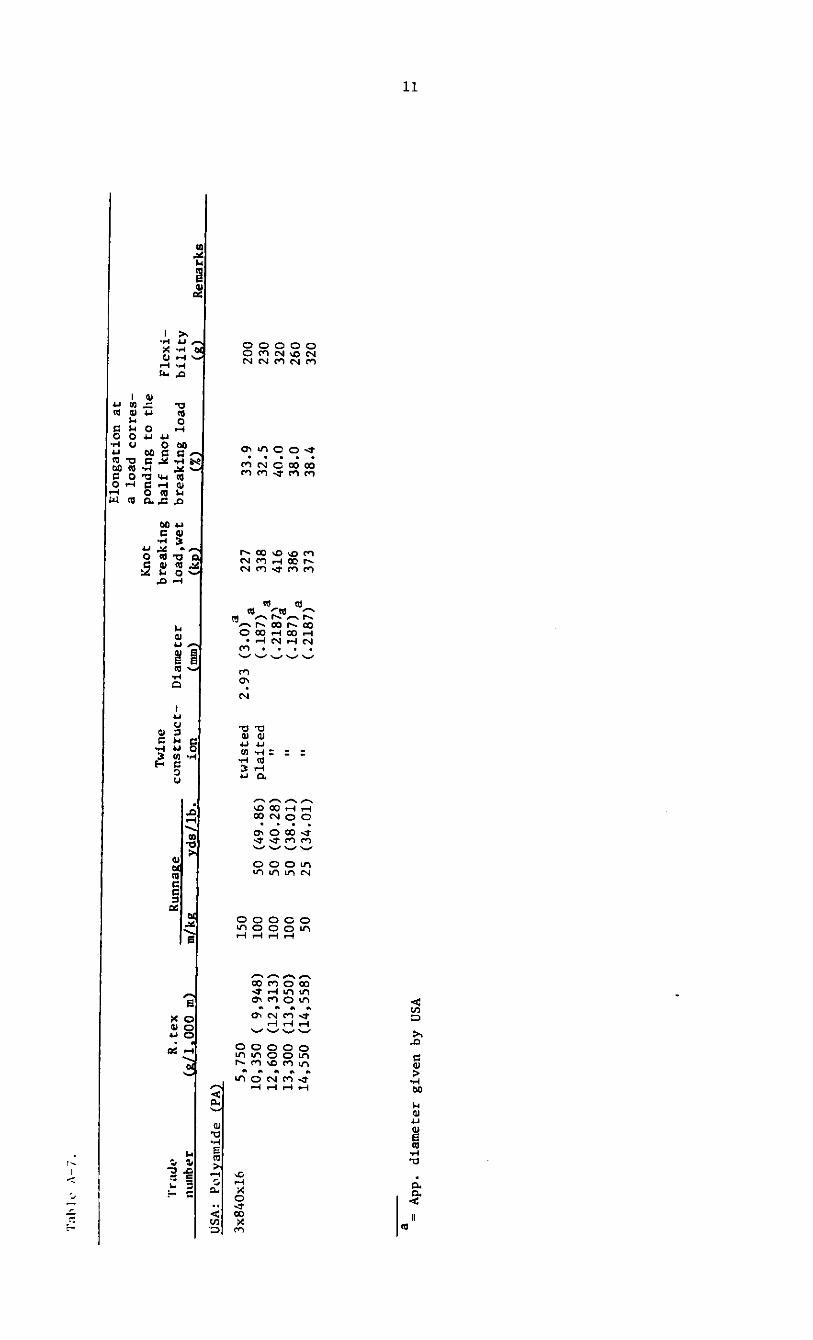
The data for the properties of the netting twines are given in Tables A-I to A-7. These tables show the local designations of the materials and the real ones in R.tex and m/kg (yd./lb.). Moreover, the following.propertles.are included: diameter, knot breaking load. elongation at a load corresponding to the half knot breaking load .in percent and the flexibility. The testing methods follow the rules under discussion in the International Organization for Standardization (ISO), Technical Committee 38/Textiles, Subcommittee 9: Textile Products for Fishing Nets. For the test of the flexibility, a method not yet accepted has been used in spite of some objections made in a ,previous ICES paper 10 years ago.
A preliminary comparison between the properties of the net materials used for codends and the two groups of similar selectivity mentioned above show some relation with the flexibility (Fig. A-I). ~e net materials made of PA, PES, and also unexpectedly PP have almost the same range of flexibility in contrast to net materials made of manila and PE, though there are some extreme values outside the main range, shown by dotted lines.
Moreover, a diagram with the relation of tension and flexibility shows on one side PA and PES and on the other manila and PE with some overlapping by the data for PP in both areas (Fig. A-2).
PA
PES
PP ----------:J ----------
Manila • PE
.- I I I i I 10 50 100 500 1000 5000 9
FI.xibility
Fig. 1. Comparison of flexibility of net materials used for codeftds.
4
• e . PoI",,.,,;* (PIt) .! i • .. • Poly.,'", (PES) ~
" _ • Poly.thyl.n. ( PE J
II . HOfl//o (H) • ~ • Polypropyl.,,, (PF') • "~
• ., '0 -l
\ •• •• JS-l • • • • • •• • • • • •• JO-j
I •• • • •• 15-1 • • • - • • I
~ 20-1 • • ~
• • ~: ~ 15 -I • I ~
~
, II If' 10 -I
• .-•• 51,,,,,,,,,, , iii , Iii I iii i I I Ii I i , I iii ,
i I I i I "'/MII, 10 2f) ~ '0 5Q dO '" '0 9D 'DO 2IJO 300 (/J/) 500 .,. 100 .., 2(J()(J .. g
Fig. 2. Elongation/flexibility (only values> R.2S00 tex or<400 m/kg).
Tah
lt'
A-I
.
E10
nga
t io
n a
t a
loa
d corn~s-
Kno
t p
on
din
g
to
the
Tw
ine
bre
akin
g
half
k
no
t F
lex
i-T
rad
..
R.t
ex
Run
nase
co
nstr
uct-
Dia
met
er
10
ad,w
et
bre
akin
g
load
b
ilit
y
nu
mb
er
(gL
!,OO
O
m)
m£k
S y
ds/
1b
. io
n
(mm
) (k
l!)
(%)
(S)
Rem
arks
Bel
gium
: P
olya
mid
e (P
Al 50
0 2
,10
0
twis
ted
0
.75
3
0.4
2
0.2
'<
:2
600
1,7
00
"
0.9
1
29
.9
28
.8
10
750
1,3
00
"
1.0
0
37
.6
29
.7
10
950
1,0
50
"
1.1
1
41
.4
29
.2
20
1,1
50
85
0 "
1. 2
6 4
5.9
3
1.8
30
1
,45
0
700
" 1
. 44
52
.9
29
.6
50
2,0
00
50
0 "
1.6
8
76
.9
30
.3
40
2,3
00
45
0 "
1.8
4
93
.4
31
.2
50
2,8
50
35
0 "
1.8
9
11
6.6
2
6.9
50
3
,60
0
300
" 2
.22
13
3 3
2.4
13
0 4
,80
0
200
" 2
.55
19
0 3
5.1
18
0 '"
Po
lyet
hy
len
e (P
El
850
1,2
00
"
1.1
0
34
.9
11
.0
170
ora
ng
e 1
,40
0
700
" 1
.65
5
8.9
1
2.0
25
0 g
reen
1
,55
0
650
" 1
.68
6
5.4
1
3.2
22
0 o
ran
ge
1,8
00
55
0 "
1.6
5
10
5.6
1
5.4
27
0 "
2,0
00
50
0 "
1. 7
8 1
06
.3
12
.3
370
" 2
,15
0
450
" 2
.06
1
04
.0
10
.5
580
" 2
,85
0
350
" 2
.27
1
30
.4
10
.6
700
" 3
,25
0
300
" 2
.47
14
3 1
0.4
80
0 g
reen

Tab
le
/1-2
.
Elo
ng
atio
n a
t a
load
co
r res-
Kno
t po
ndin
g to
th
e T
win
e b
reak
ing
h
alf
k
no
t F
lex
i-T
rod
,-R
.tex
R
unna
se
co
nst
ru
ct-
Dia
met
er
load
,wet
b
reak
ing
lo
ad
bil
ity
nu
mbe
r (S
/1.o
o0
m)
m/k
s y
ds/
lb.
ion
(r
om)
(kp)
(%
) (S
) R
emar
ks
Can
ada:
Po
1:t:e
th:t:
1ene
(P
E2
4.5
OD
D
6,1
00
15
0 p
lait
ed
(4
.5)
242
10
.3
1,5
50
o
ran
ge
4.5
rom
6
,40
0
150
" (4
.5)
239
12
.5
1,5
90
..
5.5
OD
D
8,9
50
10
0 "
(5.5
) 37
1 1
5.2
1
,89
0
red
5
.5 r
om
10,1
50
100
" (5
.5)
451
13
.1
2,1
40
o
ran
ge
CP-
90
5,1
00
20
0 "
208
10
.6
1,1
80
"
CP
-160
3
,25
0
300
" 16
4 1
5.5
78
0 "
Teu
1en
e (P
ES2
T-5
0 7
,20
0
150
75
(70)
"
288
8.5
17
0
N:t:1
on
(PA
l
N-5
0 5
,80
0
150
75
(75)
"
288
31
.6
90
U1
stro
n
{PP2
UP-
120
3,8
50
25
0 "
237
10
.4
110
UP-
63
7,5
50
15
0 "
402
12
.1
220
UP-
76
7,4
50
15
0 "
393
11
. 3
220
UP-
76
6,9
50
15
0 "
389
14
.9
300
3/1
6 in
. 1
4,5
00
50
"
676
20
.3
1,1
40
g
old
en,
wit
h c
ore
Den
mar
k:
Po1:
t:am
ide
(PA
l
Td
210/
24
600
1,6
00
tw
iste
d
0.7
7
39
.3
16
.0
-<2
Td
21
0/3
0
750
1,3
00
"
0.8
8
47
.7
16
.2
<2
Td
21
0/36
95
0 1
,05
0
" 0
.96
6
1.8
1
7.9
5
3 O
DD
5
,35
0
200
pla
ited
(3
. 0)
242
26
.8
60
4 m
m
7,0
50
15
0 "
(4.0
) 33
6 2
7.4
11
0
Val
ues
sho
wn
in
par
enth
eses
ar
e n
omin
al
and
/or
giv
en b
y th
e fa
cto
ries.
'I'"
bl,
' /I
-'J
Elo
ng
atio
n a
t a
load
co
rres-
Kn
ot
po
nd
ing
to
th
e T
win
e b
reak
ing
h
alf
k
no
t F
lex
i-T
rad
t·
R.t
ex
Run
na&
e co
nst
ru
ct-
Dia
met
er
10
ad,w
et
bre
akin
g l
oad
b
ilit
y
nUlRb~r
(&l1
.000
m~
mLk
&
l':ds
/1b.
io
n
(nun
~ (k
~~
(%~
(&)
Rem
arks
Fin
lan
d:
l'oll
!am
ide
(PA
)
Td
21
0/1
2
300
(320
) 3
,30
0(3
,30
0)
twis
ted
0
.52
22
1
7.3
-,
2
Td
21
0/1
8
450(
480)
2
,20
0(2
,21
0)
" 0
.67
31
1
7.8
<
2
Td
210/
36
1,0
00
(96
0)
1,0
00
(1,1
00
) "
1.0
5
49
23
.2
5
Td
210/
12
350(
320)
2
,95
0
" 0
.69
22
1
6.6
5
treate
d, b
lack
Td
2
10
/18
55
0(48
0)
1,8
50
"
0.8
8
33
16
.4
20
" "
Td
210/
36
1,2
00
(96
0)
800
" 1
.40
66
2
2.1
40
"
"
Fra
nce
, P
olya
mid
e (P
A)
Fi1
. 2
.4
0 2
,85
0
(2,8
57
) 35
0 p
lait
ed
(2
.4)
134
20
.2
20
Fi1
. 3
0 3
,75
0
(3,5
71
) 25
0 "
(3.0
) 19
4 2
5.0
30
F
i1.
3.5
0
6,8
50
(5
,55
5)
150
twis
ted
3
.53
(3
.5)
291
28
.4
50
Fi1
. 4
.5
(I 6
,10
0
(7,5
18
) 15
0 p
lait
ed
(4
.5 )
285
21. 3
10
0 F
i1.
5.5
0
13
,55
0(1
1,3
63
) 50
"
(5.5
) 49
4 4
1. 7
29
0 ....
Fi1
. 6
0 1
5,2
50
(14
,28
5)
50
" (6
.0)
579
25
.4
240
Fil
in 6
0
24
,70
0(2
1,2
76
) 50
tw
iste
d
5.9
7
(6.0
) 89
0 4
4.0
1
,49
0
Ger
man
y:
Pol
yam
ide
(PA
)
Td
210/
21
550
1,8
00
"
0.8
0
32
I ""
2 Td
2
10
/24
65
0 1
,55
0
" 0
.84
38
-.
:2
Td
21
0/2
7
700
1,4
00
0
.90
41
20
-25
<2
Td
2
10
/60
1
,60
0
650
1.5
0
90
20
Td
210/
60
1,8
00
55
0 1
.6-1
. 7
80-8
5 29
60
Td
2
10
/72
2
,00
0
500
1.6
5
100
20
Td
210/
108
3,0
50
35
0 2
.00
14
0-15
2 30
Td
2
10
/12
0
3,4
00
30
0 2
.10
16
fJ
20-2
5 30
N
t 3
/50
0
6,2
50
15
0 3
.00
27
0 30
N
t 3
/40
0
8,3
00
10
0 3
.50
34
0-39
0 50
5
nun
0 1
1,0
00
10
0 p
lait
ed
(5
.0)
480
20
80
7/1
6
18
,00
0
50
" (7
.0)
777
22
740
Po1
l!et
hl!l
ene
(PE
) 4
mm
0 4
,65
0
200
" (4
.0)
228
14
.1
700
5 mm
1<1
7
,55
0
150
" (5
.0)
352
17
.5
890
Va
lues
sh
own
in
pa
ren
thes
es
are
no
min
al
an
d/o
r g
iven
b
y th
e fa
cto
rie
s.

Tab
le A
-4.
Elo
ng
atio
n a
t a
load
co
rres-
Kno
t po
ndin
g to
th
e T
win
e b
reak
ing
h
alf
kno
t F
lex
i-T
rade
R
.tex
R
unna
!!.e
co
nst
ruct-
Dia
met
er
10ad
,wet
b
reak
ing
lo
ad
bil
ity
R
emar
ks
num
ber
(g/1
.00
0 m
) m
/kg
yd
s/1
b.
ion
(m
m)
(kp)
(%
) (g
) (p
=pr
oquc
er)
Ho
llan
d:
Pol
yam
ide
{PA
l
Td
210/
144
4,8S
0 (4
,6S
0)
200
(21S
.1)
twis
ted
2
.64
18
S.2
3
7.2
18
0 p
V
Td
210/
132
3,8
00
(3
,80
0)
2S0
(26
2.2
) "
2.3
0
16
4.4
3
0.2
20
p
I Td
21
0/12
0 3,
3S0
(3,3
S0)
30
0 (2
98
.3)
" 2
.13
1
63
.6
26
.4
20
p I
3,SO
O
(3,S
OO
) 30
0 (2
87
.8)
" 2
.20
lS
S.S
34
.S
70
p II
3,
800
(3,7
S0
) 2S
0 (2
66
.4)
" 2
.49
lS
1.6
3
8.2
17
0 p
III
3,8S
0 (3
,7S
0)
2S0
(26
7.0
) "
2.3
6
lS7
.3
34
.8
100
p V
Td
21
0/10
8 3
,lS
0
(3,l
S0
) 30
0 (3
18
.0)
" 2
.11
14
2.9
3S. S
70
p
II
3,00
0 (3
,00
0)
3S0
(33S
.6)
" 2
.11
1
23
.8
30.S
60
p
IV
3,SO
O
(3,4
00
) 30
0 (2
94
.8)
" 2.
2S
148.
S
36
.6
80
p V
Td
21
0/96
2,
6S0
(2,6
00
) 40
0 (3
81.S
) "
1. 8
3 1
30
.9
23
.8
10
p I
2,8
00
(2
,7S
0)
3S0
(36
2.3
) "
2.0
0
14
1.6
3
S.8
SO
p
II
(»
3,2S
0 (3
,lS
0)
300
(31
7.7
) -
" 2
.26
1
27
.7
42
.6
210
p II
I 3,
OSO
(3
,00
0)
3S0
(331
. 4)
" 2
.12
1
31
.9
32
.7
60
p V
Icel
and
: P
oly
eth
yle
ne
(PE
l
4 mm
fl
S,9
S0
ISO
p
lait
ed
(4
.0)
260
12
.6
7S0
-gre
.en,
p
I S
mm 1
1 7
,40
0
ISO
"
(S .
0)
323
n.7
91
0 "
---
1'1
4 mm
fl
S,8
00
ISO
"
(4.0
) 21
7 1
7.9
74
0 "
p S
4 mm
16
S,2
00
200
" (4
.0)
229
12
.0
1,1
70
"
p P
S mm
11
8,l
S0
10
0 "
(S.O
) 30
2 1
0.9
1
,74
0
" "
Val
ues
sho
wn
in p
aren
thes
es a
re n
omin
al a
nd
/or
giv
en b
y th
e f
acto
ries.

Elo
ng
atio
n a
t a
load
co
rres-
Kno
t po
ndin
g to
th
e T
win
e b
reak
ing
h
alf
k
no
t F
lex
i-Trad~
R.t
ex
Run
nase
co
nst
ru
ct-
Dia
met
er
load
,wet
b
reak
ing
lo
ad
bil
ity
n
um
be
r (s
l1.0
00
ml
mlk
s :i
ds/
lb.
ion
(n
unl
(kl!
l (%
l (s
l R
emar
ks
Irela
nd
: P
ol:
ieth
:ile
ne
(PE}
4,3
00
(4
,24
0)
250
125
(117
) tw
iste
d
2.9
3
184
10
.0
890
red
3
,65
0
(3,6
74
) 25
0 12
5 (1
35)
" 2
.55
17
1 1
1.2
99
0 o
ran
ge
3,4
50
(2
,75
6)
300
145
(180
) p
lait
ed
16
2 1
6.4
79
0 re
d
2,9
00
(2
,97
0)
350
175
(167
) tw
iste
d
2.5
3
147
22
.2
580
ora
ng
e 2
,95
0
(2,8
35
) 35
0 17
5 (1
75)
" 2
.27
13
3 8
.4
540
red
2
,70
0
(2,6
11
) 35
0 17
5 (1
90)
" 2
.17
15
3 1
5.1
50
0 o
ran
ge
Pol
yam
ide
(PA
l
1,9
00
(1
,57
5)
550
270
(315
) "
1.8
4
69
.1
18
.7
15
750
(636
) 1
,35
0
670
(780
) "
1.0
0
37
.4
15
.9
20
bla
ck
650
(557
) 1
,50
0
750
(890
) "
0.9
4
31
.8
15
.5
30
"
Italy
: P
olya
mid
e (P
A} 3,9
00
25
0 p
lait
ed
17
3 2
8.8
55
'" P
ola
nd
: P
olya
mid
e (P
Al
Td
210/
7x3
600
(600
) 1
,70
0
twis
ted
0
.85
(0
.95
) 3
1.0
2
3.7
5
Td
840/
5x3
1,7
50
(1
,62
0)
600
" 1
.62
(1
.6)
71
.4
29
.1
30
Td
840/
6x3
1,8
50
(1
,69
0)
550
" 1
.64
(1
. 8)
87
.7
26
.7
20
Td
84
0/7
x3
2
,25
0
(2,3
70
) 45
0 "
1.6
9
(2.0
) 1
08
.9
24
.8
20
Td
840/
2x5x
3 3
,35
0
(3,5
60
) 30
0 "
2.1
3
(2.5
) 14
6 2
6.8
30
Td
84
0/4x
5x3
6,5
50
(7
,00
0)
150
" 2
.96
(3
.0)
253
24
.5
40
Po
rtu
sal:
P
oly
eth
:ile
ne
(PE}
5 mm
1'1
7,8
50
15
0 p
lait
ed
(5
.0)
290
11
.4
1,6
50
g
reen
Rom
ania
: P
olya
mid
e (P
Al
5.5
mm
0 1
7,0
55
59
tw
iste
d
(5.5
) 26
1 4
1.3
31
0
Sl!
ain:
P
ol:i
amid
e (P
A}
11
,05
0
100
pla
ited
37
7 3
5.4
63
0
Po
l:ie
thy
len
e (P
El
8,1
50
10
0 "
318
13 .
9 1
,70
0
gre
en
--
dVal
ues
show
n in
par
enth
eses
ar
e nO
!"'in
?1
and
/or
giv
en b
y th
e fa
cto
ries.
Tab
le A
-6
Elo
ng
atio
n a
t a
load
co
rres-
Kno
t po
ndin
g to
th
e T
win
e b
reak
ing
h
alf
kn
ot
Fle
xi-
Tra
de
R.t
ex
Run
nase
co
nst
ruct-
Dia
met
er
load
,wet
b
reak
ing
lo
ad
bil
ity
nu
mbe
r (S
[l,o
oO
ml
m[k
s Id
s/lb
. io
n
(mm
l (k
2l
(Xl
(sl
Rem
arks
Sw
eden
: P
o1Ia
mid
e (P
Al
No
.4:2
0
1,9
50
50
0 tw
iste
d
1.5
7
102
18
.4
10
bla
ck
3mm
5
,90
0
150
pla
ited
(3
.0)
243
35
.6
180
Po
1Ie
ster
(P
ESl
No.
10
1,0
50
95
0 tw
iste
d
1.2
1
42
8.3
30
N
o.14
1
,45
0
700
" 1
.44
52
9
.2
70
No.
20
2,4
00
40
0 "
1. 7
6 79
1
2.3
14
0 b
lack
Po1
I2ro
2I1
ene
(PP
l
No.
36
900
1,1
00
"
1.3
3
46
12
.4
20
.... 0
USS
R:
Po1
Iam
ide
(PA
l
No.
10
. 7
7,0
00
(7
,10
0)
150
" 3
.39
(3
.6)
237
45
.8
120
No
.10
.7
10
,75
0(1
0,8
60
) 10
0 "
4.2
8
(4.3
3)
332
47
.0
180
Gre
at B
rita
in:
Po1
Iam
ide
(PA
l
1,6
00
(1
,71
0)
600
300
(290
) "
1.4
1
70
16
.5
10
2,5
50
(2
,48
0)
400
200
(200
) "
1. 7
3 11
6 1
7.5
20
I trea
ted
3,9
00
(3
,30
7)
250
125
(150
) "
2.6
6
136
27
.8
30
for
kn
ot
5,0
50
(4
,96
0)
200
100
(100
) "
2.8
2
183
18
.0
30
slip
pag
e
Po1
I2ro
(!I1
ene
(PP
l
1,5
00
(1
,71
0)
650
300
(290
) "
1.5
3
80
10
.5
30
2,6
00
(2
,48
0)
400
200
(200
) "
2.3
0
110
16
.8
60
treate
d
3,4
50
(3
,30
7)
300
150
(150
) "
1.5
7
142
16
.1
90 ! gree
n
for
kn
ot
5,4
50
(4
,96
0)
200
100
(100
) "
3.1
9
196
21
.3
170
gre
en
slip
pag
e
Man
ila
(Mal
4,2
00
(4
,40
9)
250
125
(11
2.5
) "
2.5
7
116
6.5
38
0
~ 5
,55
0
(5,5
12
) 20
0 10
0 (9
0)
" 3
.15
15
2 7
.8
460
treate
d
6,3
00
(6
,61
4)
150
75
(75)
"
3.1
8
163
6.7
46
0 all
gre
en
Val
ues
sho
wn
in
par
enth
eses
are
nom
inal
an
d/o
r g
iven
by
the
facto
ries.
Tab
I "
A-
7.
Tw
ine
Tr a
cJt'
R.t
ex
Run
naae
co
nst
ru
ct-
nUJn
bt-r
(a
/1.0
00
m)
m/k
a y
ds/
lb.
ion
liSA
: P
olya
mid
e {P
A2
3x84
0x16
5
,75
0
150
twis
ted
1
0,3
50
(
9,9
48
) 10
0 50
(4
9.8
6)
pla
ited
1
2,6
00
(1
2,3
13
) 10
0 50
(4
0.2
8)
" 1
3,3
00
(1
3,0
50
) 10
0 50
(3
8.0
1)
" 1
4,5
50
(1
4,5
58
) 50
25
(3
4.0
1)
"
a A
pp.
dia
met
er g
iven
by
USA
Kno
t b
reak
ing
D
iam
eter
lo
ad,w
et
(rom
) (k
p)
a 2
.93
(3
.0)
a 22
7 (.
18
7)
a 33
8 (.
21
87
J 41
6 (.
18
7)
a 38
6 (.
21
87
) 37
3
Elo
ng
atio
n a
t a
load
co
r res-
po
nd
ing
to
th
e h
alf
k
no
t b
reak
ing
lo
ad
(%)
33
.9
32
.5
40
.0
38
.0
38
.4
Fle
xi-
bil
ity
(a
)
200
230
320
260
320
Rem
arks
.... ....

12
PART B
THE STATISTICAL ANALYSIS OF SELECTIVITY DATA
by J.A.Pope
Marine Laboratory, Aberdeen, Scotland
1. Introduction
The length-selection curve of a trawl codend gives the relationship between the probability of retention of a fish by that codend and its length. Expressed in general mathematical terms, the form of the relationship is P - f(ll2), where P is the probability of retention, f is some function of the length of fish (1) and 6 is a vector of parameters defining the characteristics of the length-selection curve. -
From both theoretical considerations and practical evidence, the function f(II!) is taken to be monotonic increasing with f • 1 and fmin - O. Largely because of these mathematical pro-max perties, it has been.generally .accepted. that f (l.~). can be realistically and accurately described by some continuous probabilitY.distribution function-and, in particular, by the symmetr1cdi~Jribution function of. the Normal (Gaussian) frequency distribution. Jones (1957) has shown how, on the basis of some specific assumptions concerning variation in codend mesh size and fish body girths, the length-selection curve is exactly expressible as a Normal distribution function. However, this result is entirely dependent on the assumed normality of the frequency distributions of both mesh size in the codend and fish body girth. Other assumptions would lead to other expressions for the length-selection curve.
Pope and Hall (1960) expressed f(ll!) as a logistic function which is also symmetric and, in fact, differs little from the Normal distribution .function. These writers did not attempt nor imply any theoretical justification for this form of curve. A full description of the fitting of this form to experimental data is given by Pope (1964).
Both the Normal distribution function and the logistic function are completely specified by two parameters 61
and 62
(say) in terms of which all points on the selection curve (in particular the 56% selection length) may be determined.
There does exist, however, an extensive body of experimental data indicating that a selectfon curve is not necessarily symmetric about the 50% selection length. A more suitable and flexible mathematical model for the selection curve is clearly desirable.
In practice, however, interest is generally confined to the 50% selection point rather than to the curve as a whole. Little attention appears to have been paid to the selection range (i.e. the length interval between the 25.and 75% selection points). The most important practical problem has, therefore, been that of estimating'50% selectionpoints-from-experimental results.
2. Estimation of a Single Selection Curve
Before attempting any estimation, cons.ideration ought to be given to whether the data to be used are sufficiently reliable to warrant any form of treatment at all. Such consideration, of course, begs the questions, "What is to be estimated?" and "what accuracy is required in the estimates?" Although a complete selection curve is usually desired, the main requirement, 8S already noted, is an estimate of the 50% retention length and accordingly particular attention will be paid to methods of achieving this.
First we must distinguish between various sources of statistical error. We consider the results from a single covered codend haul as being a single realization of how the codend selects fish under the' conditions' pertaining at the time of towing. These conditions refer to the composition of the fish population encountered, the flow of water through the codend during towing, the

--
13
speed of the vessel, etc. Another haul with the Bame codend will not be made under precisely the same conditions and it must be regarded as a single realization of another situation-. Whether the two sets of conditions re:sult"1.n "closely similar or widely d±nsimilar avers"ge selection curves depends simply on how similar the different conditions are on these two occasions. If Pj(lk)' k = 1,2, 3, •..• are the observed proportions retained at lengths 11' 12, 13 , ..• in a particular haul, say haul j, and fj(~I~ the expected proportions derived on the basis of some theoretical law (e.g. that the probabilities of retention follow a Gaussian distribution function law), then we may write
Pj (lk) = fj (1kl~ + Ejk (2.0
The fitting of f (lkI6) to the data from this single haul consists of finding estimates of j - • the parameters~. Such estimates (~, say) will be functions of the statistical errors (Ejk) and the be.at estimates are those which involve these errors in such a way as to make their generalized variance (given by detIE(~-~'(!-~t) as small as possible. Maximum likelihood estimators have this property in large samples, but, in general, it is not difficult to find, by simpler methods, estimates of the parameters, or functions of them, which have sufficiently small variance.
Whilst the Gaussian distribution function, fG(ll~ say, or the logistic, fL(ll~ say, are strictly at best only assumed forms for the function f(ll~, these curves are, at least on empirical evidence, sufficiently realistic for them to be regarded as equally plausible "true" models in a great many situations. The fitting of either curve may thus be regarded as being the most advanced form of treatment of the data. The parameters of these curves may be estimated by maximum likelihood using suitable routines and their variances, or more often the variances of functions of them (e.g." their ratio), evaluated. For example, the logistic curv~ is given by
l/fL (11~·{l+eXp(el-82l)} and the ratio 6/62 is the 50% retention length.
(2.2)
Any method of fitting other than maximum likelihood will not be more efficient, in the sense that it will lead theoretically to variances "of the"estimates as large as or larger than those of the maximum likelihood eetimates. Also, any form of curve other than fL(ll~ or fG(ll~ can be regarded as an approximation to the true model and, like all approximations, will theoretically be less accurate than the true model. Nonetheless, the amount of calculation involved in the maximum likelihood approach and the need for epecial tables makes it very desirable to seek alternative si~pler ways of treating the data.
Simpler approaches are
i) curve fitting by eye ii) approximating to the middle part of the curve by a straight line and fitting by weighted or unweighted least squares
iii) using moving averages of the observed values of fj(lk) to estimate the 50% point only. The results of two sets of comparisons of different methods of fitting curves are given in Tables B-1, B-2, B-3 and B-4. The first two tables are taken from Pope (1966) and give the estimated 50% points and variances respectively of 15 actual selection curves provided by (a) the logistic curve fitted by maximum likelihood, (b) the fitting of an unweighted regression line to the observed proportions retained over approximately the 25-75% range, (c) the 3-point moving average method. Tables B-3 and B-4 give similar data for 9 actual curves provided by methods (a), (b) and (c) above, and (d) eye-fitted curves. These sets of data were taken from two series of replicate hauls made by the same research vessel during two cruises. Within each set the results refer to the same codend. The average values of the variances of the maximum likelihood estimates of 81/62, the 50% retention
lengths, are 0.1023 and 0.0968. These figures imply a percentage standard deviation of between 1.1 and 1.3% on average in the maximum likelihood estimates of a 50% retention length (and hence of a selection factor) from a single set of data (e.g. single haul). This is a very small component of ~rror.
The unweighted linear regression estimates are satisfactorily close to the maximum likelihood estimates and, although all but one of the estimates in Table B-3 are below the maximum likelihood values, there is no reason to suspect bias in this method. The variances of the regression estimates differ appreciably from those of the maximum likelihood estimates in some, but certainly
14
not all, cases. The average value of the regression variances in Tables B-2 and 0.1202 respectively, corresponding, on average, to percentage standard errors of respectively, that is, slightly larger than the maximum likelihood estimates.
B-4 are 0.1758 and 1. 7 and 1.2%
The estimates provided by the use of 3-point moving averages are, like the regression estimates, close to the maximum likelihood values with no evidence of bias. The variances are similar in some cases to those for the above methods but are generally higher, sometimes appreciably so.
The estimates from eye-fitted curves, given in Table B-3, were obtained by asking seven peopl&: to draw curves by.eye, independently.,af one another, to each of the nine sets of points. None of the seven people had previously. drawn a selection curve so that it was necessary to give them Borne gui.dance. beforehand... This~ consisLed of outlining, the principles of curve fitt;f.ng to any sort of data, ,giving a brief acco.unt of codend mesh selection and stating simply the properties of the logistic and Normal dis.tribution function curves. Each person was asked to fit a curve to all the points over the whole range, not merely in the neighbourhood of the 50% point. Thus the deviations of each observed proportion 'from each eye-fitted curve could be measured and compared. The Sums of squares of these deviations are given in Table B-5.
It will be seen immediately from the last column of Table B-3 which gives the averages of the seven eye estimates for each haul, that eye estimation can give 50% points very close to maximum likelihood estimates. What is interesting and of significance in this context is that differences between the seven estimates are small in each of the nine cases. This is reflected in the variances calculated from the seven estimates and shown in the last column of Table B-4. These variances are not estimating precisely the same thing as the variances in the first three columns of Table B-4. They do indicate the degree of reproducibility of eye estimates, however, which is the important point here.
We may conclude from the results of this investigation that, with data of the type examined here, unbiased estimates of 50% points can be obtained by eye. Such estimates are very close to those obtained by the method of maximum likelihood and differences between individuals are likely to be very small indeed so that eye estimation provides a satisfactory substitute for the maximum likelihood approach. Fitting a straight line by least squares is slightlY easier and quicker than a complete maximum likelihood approach-but this method cannot· really be preferred to eye estimation and is not a completely satisfactory substitute for maximum likelihood fitting of either fL(ll~ or fG(ll~. The moving-average method is not to be-recommended generally. It can, even with moderately good data, give occasional rise to ambiguity by providing more than one 50% point for a given set of points. It only estimates the 50% point without bias and the calculation of the variance of the estimated 50% point is tedious.
A further interesting feature of the eye method is brought out in Table B-5 which gives the mean squared deviations of the eye-fitted curves, i.e. the values of n 2 I (Pj(lk)-f*(lk» In,
k=l f*(lk) being the eye-estimated proportion at length lk' It will be seen that differences between the eye-fitted curves are not too large, indicating that all seven people drew fairly similar curves over the whole range. These mean squared deviations are also similar to the same quantities calculated for the logistic curves fitted by maximum likelihood. Despite this the selection ranges estimated by the two methods do show consistent differences, the maximum likelihood estimates being larger in seven out of the nine cases (see Table B-6). The variances of the maximum likelihood esti~tes were obtained using
2 2 2 Var (11-12) = (11-12) Ib S(nwl ) (2.3) and are shown in Table B-6. The variances of the average eye-fitted values, also shown in Table B-6, were obtained in the usual way from the seven estimates for each haul. The variances of the eyeestimated selection ranges are more homogeneous than those of the maximum likelihood estimates, but both methods give similar percentage standard errors of around 10%.
This study has shown that the percentage standard error in the 50% retention length (or selection factor) estimated by somewhat elaborate statistical techniques is of the order of 1-2%, while that of the selection range is of the order of 10%. This sort of accuracy can be obtained, in general, without recourse to statistical procedures, simply by drawing free-hand curves by eye, although there is evidence that selection ranges estimated from eye-fitted curVes may be smaller than by other methods, particularly for curves fL(ll~ and fG(ll~.
15
These results give some. guidance in answering the problem posed at the beginning of this section, namely, how good are the basic data? Any set of data giving a percentage standard error in an estimate of the 50% retention length much in excess of 2%, say ~ 5%, may be taken as unreliable. Any data suspected of being. unreliable would have to have the accuracy of any estimate drawn from it estimated, and this could be done by either submitting the data to a complete statistical treatment or by having several people independently fitting curves by eye.
The studies discussed here were based on relatively good data, and the number of fish in each haul in the estimated selection ranges was in most cases quite large. For example, in the data corresponding to Tables B-3.and B-4, the numbers in the selection range varied between 273 and 4,160 fish. The variances of the'maximum likelihood estimates quoted in Table B-4 are almost perfectly correlated with the number of fish in the selection range, but, even for the haul with the smallest number of fish, the percentage standard errors of the 50% point and the selection range are 1.3 and 13.5% respectively, both close to the average values quoted above.
In the next section it is pointed out that hau1-to-hau1 variability is a much larger component of error than within-haul variability so that errors of estimation for a single haul are relatively unimportant in comparison with other er~ors.
"3. l!mI1:-to-Hau1 Variability Within Experiments
It is customary to make replicate hauls for selectivity study on the same ground and within a short space of time. Such replication is necessary if data are to be useful. The bauls to which the data in Tables B-1, B-2, B-3, and B-4 refer, for instance, were made within a space of three weeks, in both cases on the same fishing ground. They indicate the sort of variability encountered in such replicate hauls.
With Pj(lk) and,fj (lk ) defined as at equation (2.1) we may write for the jth haul
Pj (lk) • f j (\) + Ejk
= f(lk) +{ fj (lk) - f(lk)}+ Ejk
D f(lk) + aj + Ejk (3.1)
wher.e f (lk) denotes the "true" selection curve for the conditions of the experiment and ej
• fj - f
is the deviation of the expected curve for haul j from-f(lk). The random"term Sj'is the hau1-to-hau1
error. An equation,. similar to (3.1), may be written in terms of any parameters estimated from individual haul data. Thus. without introducing any modification to the notation we might write
1j (SO) • ~(SO) + ej + Eie
where Ej represents the error of estimation in the fitted 50% . e
sents. as before. hau1-to-hau1 variability in the SO% points.
the true variances· of the errors Eje-and B respectively, then
2 2 Var(lj (50» • De + °Ej
(3.1)
th point for the j haul and ej
repre-2 2
If DEj and De are used to denote
(3.2)
and. if 11(50). 12 (50) ••••• 1n (SO) are the estimated SO% lengths from n replicate hauls. on average
the following equation is true.
n:1i{lj (SO) - l(SO)}2 -2 De +
n 2 (I 0 j lIn j-1 E
_02 +0- 2
e E (3.3)
where a 2 is the average variance of the errors of estimate for each haul. Using the maximum like~ E
1ihood estimates of the SO% points given in Tables B-1 and B-3. We find that the value of the 2 quantity on" the 1eft-hand"side of (3.3) is 14.2407 and 2.4225 respectively. The estimates of D and - 2 a a for Sets 1 and 2 are therefore
E

16
2 sB = 14.1384
-2 s
E 0.1023
2 sB 2.3257
-2 s = 0.0968 E
-2 respectively, the quantities B being calculated from the variances given in the first columns of E
Tables B-2 8Qd B-4. The var~ance pf the between-haul component within an experiment is thus seen to be considerably.larger than the within-haul component and, clearly, errors of estimation of the 50% point are insignificant. As pointed out by Pope (1966), in such situations, the most appropriate way to combine estimates from replicate observations is to employ a simple unweighted mean.
2 The value of sa for the two sets treated here are quite different and reflect the much
greater variability in the 50% points quoted in Table B-1 than in those quoted in Table B-3. In set 1 there is one quite low value (namely 18.2) and three relatively high values (namely 28.2, 31.2, and 32.9). Naturally the question ,arises whether or not one or more of these estimates should be rejected before calculating the experimental mean.
There are many possible reasons for encountering outlying observations. Selection may be reduced, for example, by quantities of weed blocking the codend ,meshes, etc. On the other hand the 50% point may be raised because of tears or large holes in the codend meshes, etc. It is clearly necessary in selection experiments to keep accurate records at the time, to which reference may be subsequently made for the possible elucidation of abnormal results. Of course this procedure is not without its pitfalls as it is deceptively easy to find, after an outlying observation has been observed, plausible reasons for its occurrence. Probably the most common situation is that in which there is no real evidence of a causal mechanism for the occurrence of a divergent observation and in such situations the idea of a test procedure for deciding whether to reject an observation or not has some apparent attractions. Howev_er, uncritical use of any such procedure is clearly dangerous. It is always advisable, wherever possible, to carry out any projected analysis of data both with and without the outlying observations. If the general conclusions are different in the two analyses then clearly the outlying observations are in a posit.ion to sway action one way or another. In such a situation no firm conclusion is warranted.
Reference has already been made to the extreme observations of Set 1 given in Table B-I. Tha unweighted mean and standard deviation of all 15 values of the 50% pOint are 25.3 and ± 3.77 respectively. The observation with the maximum deviation is 32.9 and the deviation (+7.6) is twice the observed standard deviation. This is in no sense a large deviation, but, for interest, the mean and standard deviation have been recalculated omitting this observation. They are found to be 24.7 and ± 3.25 respectively, not very different from the previous values.
The percentage standard deviations for the two sets of data considered here are 14.9% and 5.2% for Set 1 and Set 2 respectively. The latter figure is close to values quoted by Gulland (1964) for three sets of data obtained by the English research vessel Sir LanaeZot, namely 5.2, 5.3, and 7.3%, and also to a value of 6.1% obtained by the author from a set of 20 replicate hauls. The average of these figures is 7.3% which may be taken as the percentage standard· deviation of a single 50% point or selection factor within an experiment. The percentage standard error of the mean of a set of n r!plicate hauls (i.e. hauls within an experiment on the same ground) is then of the order of (7.3/ln)%. The actual standard errors of the mean 50% points for Sets I and 2 (data of Tables B-1, B-2, B-3, and B-4) are ± 0.973 and ± 0.519 respectively. These give rise to 95% confidence limits of 23.2 to 27.4 for Set 1 and 28.2 to 30.6 for Set 2. In terms of selection factors these limits are 3.31 to 3.91 for Set 1 and 3.48 to 3.78 for Set 2.
4. Variability Between Experiments
When several experiments have been conducted on the same codend material, the mathematical model given by equation (3.1) may be extended to include a component accounting for differences between experiments. Thus we may write
Pij(lk) • f(lk) +{ fi(lk) - f(~) }+{ fi/lk) - fi(lk) }+ Eijk = f(lk) + a i + Bij + Eijk
where now f(lk) represents the
sents the true selection curve th haul of the i experiment and
true "globaltt selection curve for the codend material, fi(lk) th . ) for the i experiment, fij(lk repres~nts the true curve for
Eijk is the true deviation of Pij(lk) from fij(lk)'
(4.1)
repre
the j th

17
The component-at may be a function of a large number of factors, e.g. season of year in
which experiment was conducted, particular research vessel employed, experimental techniques such 8S
duration of hauls, rigging of codend covers, etc. Gulland (1964) in a study of North Sea whiting selection factors for manila and sisal codends found significant differences between results reported by different scientists. Quoting. Gulland, this "is not very surprising, as data presented by the same author are likely to be derived from observations on the same ground as well as with much the same gear". As an example of the sort of variation encountered in different experiments, the data given in Table B-7, taken from Pope and Hall (1964), are considered. These data refer to experiments using double polypropylene codends and the selection factors are for haddock.
The final column in Table B-7 gives the actual coefficients of variation for each separate set of results and they average about 5%. This agrees well with the between-haul within-experiment figure given in the previOUS section.
From equation (4.1), expressed in terms of selection factors xij instead of proportions
Pij(lk)' the variance of a randomly selected value is given by:
2 2 2 2 Var(xij ) • 0a + as + a
E or aa
2 + as (4.2)
·2· (a being small, as we have already seen). The variance of the unweighted mean selection factor of
E th the i experiment is:
- 2 2 Var(xi ) • aa + aS Ini (4.3)
where-D! is the number
the quantities ° 2 and a below, the quantity no
of replicate hauls in the ith experiment. For the data given in Table B-7,
0S2 may be estimated from a one-way analysis of variance. This is shown
being {Eni - £n/IEni }/ll = 3.53
df S. of S. m.s. E(m.s.)
Between experiments 11 1.22 0.1109 0/ + n a 2
a a Within eX2eriments II .Ll!!. 0.0278 2
Total· 52 2.36 aS
The estimates of 0S2 and 0a2are 0.0278 and 0.0235 respectively. Thus the component of
variance between experiments is comparable with that within experiments. From these figures the variances of the experiment means are estimates as:
Experiment
1.1 1.2 2.1 2.2 3.1 4.1 5.1 6.1 1.1 8.1 9.1 9.2
Var(~i) (0.0235 + 0.0278/n
i)
0.0235 + 0.0139 - 0.0374 " + 0.0139 a 0.0374 " + 0.0139 - 0.0374 " + 0.0070 a 0.0305 " + 0.0139 • 0.0374 ~ + 0.0139 - 0.0374 " + 0.0218 - 0.0513 " + 0.0093 - 0.0328 " + 0.0139 - 0.0374 " + 0.0011 • 0.0246 " + 0.0070 • 0.0305 " + 0.0093 • 0.0328
Since the values of nt are, with one exception, much the same in each experiment, the values
of Var(~i) are very nearly equal. Hence a satisfactory mean for double polypropylene based on the 12
sets of data discussed here is an ordi~ary unweighted mean. In this case, the mean selection factor

18
is 3.47 with a variance given bY{ Var(~l) + var(~2) + .,. + var(~12)}/122 ~ (0.0235 + 0.0121)/12 ~ 0.002967. The square root of this quantity is ± 0.0545. Thus approximate 95% confidence limits for the mean selection factor are 3.47 ± 0.11 3.36 and 3.58. The two variance components, 0.0278 and 0.0235, correspond to percentage standard deviations of about 5%, thus confirming the magnitudes quoted in Section 3.
When combining the results of several experiments, especially in those cases where individual haul values are not available, a sufficiently reliable weighting system may be derived by assuming average percentage standard deviations for the within-experiment and the between-experiment components of 7% in both cases. For example, the ICES Cooperative Research Report, No.2 (1964) quotes an experimental value obtained by G. Saetersdal of 4.2, based on 11 hauls, for the selection factor of cod by a double nYlon codend of l40-mm mean mesh size. The variance of this value may be taken as being approximately (0.294)2 + (0.294)2/ 11 ~ 0.0943. This method has been applied to data compiled by Treschev (see Part C) for double polyamide codends. Treschev divided published figures for this material into two groups which he referred to as polyamide A and polyamide B. The values of the cod selection factors and their estimated variances are shown in Table B-8. The latter will be seen to be fairly uniform, largely because the number of hauls in each experiment was reasonably large and similar from experiment to experiment. The inverses of the variances are quoted in Table B-8 and the weighted mean selection factors (Ewixi/rwi ) for po1yamides A and B are respectively 3.90 and 3.57. The weighted mean for both sets of data combined is 3.83. The variance of such a type of weighted mean is l/Iw'and so the standard errors of these values are roughly ± 0.051 and ± 0.097 for po1yamides A and B respectively and ± 0.045 for both combined. This indicates approximate 95% confidence limits of 3.83 ± 0.09 = 3.74 and 3.92 for double polyamide codends.
An additional form of weighting, not related to the accuracy of determinations of selection factor, may be deemed necessary when combining results derived from different experiments. It was painted out that ai
may be a function of a number of factors-operating during any experiment. Thus, for example, suppose it were known that the selection factor for a particular species was definitely lower in spring (say during February, March and April) than at any other time of year. If the majority of experimental results available referred to the spring period it might be more appropriate t£ calculate, in the above manner, two weighted ~eans, one from experiments conducted in the spring (Xl say) and one from the remaining experiments (x
2 say). If, for some purpose, an average figure for the year as a whole were required and if the fishing effort_by the c£mmercia1 fleets was uniform throughout the year, a possible weighted mean would be 0.25xl + Q.75x2 • Similar considerations would apply ~f it were known that selection factor was related to size of catch.
5. Mesh Differentials
We have seen in the preceding sections that the two main components of variance in an experimental value of a 50% selection length, or a selection factor, are the between-haul withinexperiment and the between-experiment components. The coefficients of variation of both components are of the order of 5-10%, say 7% on average. Thus, for a codend material with an average selection factor' of 3.3, the variance of a single determination would be 0.1067. If we assume that experimental values are normally distributed and further that such values are representative of the actual factors operating in the commercial fleets then 95% of all hauls made in a given period of time would have actual selection factors lying approximately between 2.7 and 3.9. Furthermore, if the average selection factor for another codend material were 3.6, and if selection factors for this material were also normally distributed with a variance of 0.1067 (standard deviation ~ 0.33), then some 18% of all commercial hauls by the second material would have actual selection factors below 3.3, the mean of the first material. There will in fact be a considerable overlap of two distributions with means differing by only 10%. This is quite a different matter from the question as to whether or not the mean selection factors for two different materials are really different or not, on which basis present mesh differentials have been established. But the existence of such overlapping distributions should not be lost sight of in defining mesh differentials. The problem of establishing the existence of differences in mean selection factors for different materials has been discussed by Gu1land (1964) who noted that, with the data available to him at the time, confidence limits were wider than the actual differentials than in existence.
should be With the accumulation of more and more data, however, greater precision achieved. In the previous section the average cod selection factor for
in mean values double polyamide was

19
given as 3.83 ± 0.09. with the same accuracy, 5-6% higher or lower.
If the mean selection factor for another codend material were established then it would be deemed to differ significantly from 3.83 if it were some
The establishment of mesh differentials does not rest solely on statistical considerations, of course. Questions of distinguishing between different materials, and law enforcement are also very relevant.
References
GULLAND, J.A. 1964. Variations in selection factors, and mesh differentials. J. Cons. into Explor. Mer, 29: 158-165
I.C.E.S. 1964. Report of the mesh selection working group, 1959-1960. Coop. Res. Rep., No.2, 156 pp. JONES, R. 1957. Some theoretical observations on the escape of haddock from a codend. ICNAF/ICES/ FAO Meeting. Lisbon, 1957. Paper No.S-31.
POPE, J.A. 1966. Manual of methods for fish stock assessment. Part 3. Selectivity of fishing gear. FAO Fish. tech. Paper No.41.
POPE, J.A. aod HALL, W.B. 1960. The selectivity of courlene codends. I.C.E.S. C.M. 1960, Compo Fish. Comm., Paper No.183 (mimeo).
POPE, J.A. and HALL, W.B. 1964. Selectivity of polypropylene codends. I.C.E.S. C.M. 1964, Compo Fish. Comm., Paper No.132 (mimeo).
Table B-1. Comparison of 50% points obtained by different methods of estimation.
Maximum Linear Moving likelihood regression averages
24.6 24.5 24.5 26.5 26.5 26.6 25.5 25.6 25.7 21. 9 21. 7 20.7 23.0 23.0 23.0 25.5 25.4 25.7 18.2 18.2 18.2 21.7 21.7 21.6 27.5 27.5 27.5 22.0 22.1 21.8 25.6 25.6 25.6 24.7 24.4 24.5 28.2 28.2 28.5 31. 2 31.1 31.1 32.9 32.6 32.5
Table B-2. Comparison of variances of 50% points obtained by different methods of estimation (Set 1).
Maximum likelihood
0.0395 0.0530 0.2707 0.1377 0.0905 0.1810 0.0046 0.0134 0.0629 0.1423 0.0533 0.1469 0.0776 0.2154 0.0453
Linear Moving re2ression averages
0.0757 0.0350 0.3922 0.9239 0.0182 0.3094 0.0038 0.0045 0.0471 0.0319 0.1166 0.5138 0.0708 0.0182 0.0759
0.0371 0.0645 0.0557 0.6999 0.1713 0.4199 0.0053 0.0161 0.0784 0.2515 0.0593 0.2356 0.0876 0.1970 0.0305
Table B-3. Comparison of 50% points obtained by different methods of estimation (Set 2).
Maximum likelihood
28.2 29.6 29.7 26.3 29.0 30.5 31.6 29.2 30.8
Linear Moving Eye fitting renessio!L a"er-'!8eIL tl) . J2J . Dl(4) (5) (6) (7) Avg 27.6 28.3 28.2 27.8 28.1 27.7 28.1 28.1 27.6 27.9 29.4 29.8 29.8 29.7 29.7 29.8 29.7 29.9 29.7 29.8 29.5 29.3 29.3 29.4 29.0 29.4 29.4 29.4 29.4 29.3 26.6 26.2 26.5 26.3 26.6 26.4 26.4 26.2 26.4 26.4 28.5 29.2 29.2 29.1 29.2 29.2 29.3 29.0 28.9 29.1 30.4 30.4 30.8 30.5 30.7 30.4 30.6 30.7 30.5 30.6 30.8 31.1 30.5 30.6 30.5 30.3 30.4 30.4 30.7 30.5 28.9 29.1 29.6 29.2 28.9 28.9 28.8 28.4 28.8 28.9 30.5 30.9 30.8 30.9 30.8 30.8 30.8 30.9 30.8 30.8

20
Table B-4. Comparison of variances of 50% points obtained by different methods of estimation (Set 2).
Linear Mov i ng EYl' Maximum likelihood regression avera~es fitting 0.2715 0.0072 0.0234 0.0500 0.0211 0.0329 0.2500 0.0632 0.1521
0.1663 4.7599 0.0')62 0.0524 0.0124 0.0062 0.0173 0.2567 0.0224 0.0536 0.0602 0.0167 0.0648 0.0225 0.0190 0.0535 0.0301 0.0200 0.1935 0.0942 0.0181 0.1604 0.0825 0.1395 0.0794 0.2495 0.0024
Table B-5. Mean squared deviations from eye-fitted and logistic selection curves.
(1) (2) (3) (4) (5) (6) (7} Maximum
likelihood 0.0110 0.0108 0.0058 0.0101 0.0079 0.0086 0.0080 0.0005 0.0022 0.0002 0.0009 0.0008 0.0016 0.0010 0.0008 0.0014 0.0013 0.0013 0.0098 0.0014 0.0009 0.0017 0.0020 0.0023 0.0026 0.0013 0.0015 0.0024 0.0032 0.0022 0.0009 0.0035 0.0016 0.0054 0.0018 0.0018 0.0013 0.0011 0.0003 0.0012 0.0016 0.0009 0.0057 0.0072 0.0053 0.0099 0.0062 0.0097 0.0063 0.0091 0.0085 0.0066 0.0086 0.0075 0.0103 0.0090 0.0019 0.0011 0.0015 0.0011 0.0008 0.0010 0.0012
0.0091 0.0013 0.0012 0.0027 0.0031 0.0014 0.0062 0.0068 0.0017
Table B-6. Comparison of selection ranges estimated from logistic curves and eye-fitted curves.
Logistic curve {maximum likelihood)
S. R. Variance 6.35 2.7217 5.17 0.0455 5.87 0.1273 5.13 0.3647 6.27 0.1800 4.05 0.0890 9.97 2.0325 5.22 0.4380 5.16 0.4841
Eye-fitted
Mean S.R. 4.34 4.86 5.96 4.30 5.26 4.06 6.07 4.31 4.90
curve
Variance 0.2162 0.0662 0.1262 0.0600 0.1462 0.31Q5 0.1290 0.1581 0.1533
21
Table B-7. Haddock selection factors for double polypropylene codends from different experiments.
Coefficient Exper- Selection of jm~Dt Ci[QWUI§ f§~tors Mean Varianc~ variation
1.1 Fair Isle 3.5 3.7 3.6 0.0200 3.9 1.2 Buchan Deeps 3.5 3.8 3.6 0.0450 5.9
2.1 Buchan Deeps 3.5 3.6 3.6 0.0050 2.0 2.2 Auskerry 3.7 3.9 3.6 3.8 0.0167 3.4
3.8
3.1 Orkney/Shetland 3.4 3.0 3.2 0.0800 8.8
4.1 Scalloway 3.0 3.0 3.0
5.1 Moray Firth 3.7 3.7
6.1 Buchan Deeps 3.5 3.2 3.3 3.3 0.0234 4.6
7.1 Moray Firth 3.4 3.3 3.4 0.0050 2.1
8.1 Faraes 3.2 - 3 3.3 - 1 3.4 -10 3.5 - 4 3.5 0.0298 4.9 3.6 - 4 3.7 - 1 3.8 - 3
9.1 Auskerry 3.7 3.6 3.4 3.3 3.·5 0.0333 5.2
9.2 Scalloway 3.5 3.3 3.2 3.3 0.0234 4.6
Table B-8. Average cod selection factors, variances and weighting factors for double polyamide polyamide codends.
S.F. (!Ei~) V \xi) ~al Double Po1Iamide A
w· l/V(xi ) S.F.(xi
) V (Xi) w = l/V(xi
)
4.0 0.0844 11.8 3.2 0.0753 13.3 4.2 0.0943 10.6 3.7 0.0894 11.2 4.4 0.1186 8.4 3.5 0.0720 13.9 4.2 0.0951 10.5 4.0 0.0941 10.6 4.4 0.1044 9.6 3.8 0.0849 11.8 4.3 0.0951 10.5 4.0 0.0941 10.6 4.1 0.0865 11.6 3.9 0.0894 11.2 4.2 0.0951 10.5 3.5 0.0675 14.8 4.3 0.0997 10.0 3.9 0.0870 11.5 3.8 0.0778 12.9 3.7 0.0745 13.4 4.4 0.1044 9.6 3.8 0.0825 12.1 4.4 0.1044 9.6 3.4 0.0629 15.9 4.0 0.0862 11.6 4.1 0.0855 11. 7 4.2 0.0951 10.5 3.8 0.0729 13.7 4.0 0.0862 11.6 3.7 0.1006 9.9 3.6 0.0762 13.1 3.5 0.0686 14.6 4.1 0.1098 _ 9.1
3.7 0.0805 12.4 (b) Double Polyamide B
3.6 0.1270 7.9 3.7 0.0783 12.8 3.51 0.0679 14.7 3.6 0.0688 14.5 3.38 0.0700 14.3 3.8 0.1061 9.4 3.38 0.0840 11.9 3.5 Q.1200 8.3
22
PART C
COMPILATION OF SELECTIVITY DATA FOR COD, HADDOCK AND REDFISH
by A.I.Treschev
All-Union Research Institute of Marine Fisheries and Oceanography, (VNIRO), Moscow
Introduction
The Working Group decided at a preliminary meeting held at ICES in October 1968 to restrict its analyses to data obtained from bottom trawl selectivity experiments made in reNAF Subareas 1, 2, and 3 and ICES Sub-area I and Divisions IIa, lIb and Va in which cod, haddock, and red fish were the species being studies. Tabulation of the data was also limited to experiments· conducted with doublebraided twines because few, if any, trawls used in the above-mentioned areas of the North Atlantic are made of single-braided twines. All the data collected are given in Tables C-I to C-12.
Only results from experiments based on the covered cod end method were used. Experiments in which a topside chafer of any deSign was used were not included in the analysis. Experiments in which the selection factor was given in brackets or followed by a question mark were included but not those in which the number of fish in the selection range formed a very small proportion of the total catch. In those experiments in which the average duration of tow was not given, it was assumed to be 60 min. In the three component method of analysis described below, the total number of fish caught of the species studied was used as a weighting factor if the number of fish in the selection range was not stated; otherwise the result was not used in any of the four methods of analysis. Insofar as possible, all experiments made on one ground at one time were combined, that is, single hauls were grouped. This gave the following number of experiments which could be used:
Manila PP PE PES PA
Cod 69 27 6 2 33
Haddock 47 16 1 2 16
Redfish 25 0 0 0 12
The Working Group was unable to investigate the effect of trawl construction on selectivity because there were insufficient data.
The Three Component Method of Weighting
In determining the mean value, the "weight" of the values investigated is usually determined·by their frequency of occurrence and the mean is obtained from the formula:
x
where Xi is the value investigated,
~(ximi)
~ mi
mi
is frequency of occurrence (weight) of value.
(1)
From the mathematical (statistical) viewpoint, this method of obtaining the mean value is fully justified. However, a more penetrating insight into the essence of the averaged trawl selectivity data obtained from different experiments easily'shows that the true "weight" of each value of the selection factor is determined not only by its frequency of occurrence but also by the conditions of the experiment under which it is obtained. The most important factors are the number of fish within the selection range, which is a f,actor characterizing in each experiment the relation between the fish and the gear, and the duration of the experiment, i.e. the number and the duration of hauls.
Proceeding from this t a method of combining experimental data on trawl se1ect,ivity has been developed in the USSR (A. 1. Treschev, VNIRO Proceedings, v. LXI, .1966).
23
According to this method, the mean weighted value of the selection factor is obtained from the formula:
where
ks EnitiNiki
EnitiNi
ks
n1 , n2 nn
t l , t2 tn
Nl , N2 Nn
kl , k2 '" kn
nltlNlkl + n
2t2
N2
k2 +
nltlNl + n2
t2
N2 +
+ n t N k n n n n + n t N n n n
is the mean weighted trawl selection factor;
are the number of hauls in the first, second and nth experiments;
th are the durations of haul in the first, second and n experiments;
are the numbers of fish within the selection rang_e in the first, second and nth experiments;
th are selection factors in the first, second and n exp~riments.
(2)
It follows from (2) that the mean selection factor is directly dependent on the number of hauls, the duration of hauls and the number of fish within the selection range, and , through all specific selection faetors (1<1' k2 '" kn), on all other factors involved.
Thus, in applying this formula the numerical values of the selection factors obtained by the experimenters are taken as they are and in so doing it is assumed that the value of each specific selection factor reflects the heterogeneity of the populations fished, the size of catch, the peculiarities of the trawl design and the fishing process as well as the method of combining data from different hauls, the method of constructing graphs and calculating selection factors, and many other factors. As far as the reliability (weight) of each specific selection factor is concerned, it is assumed that in all experiments it is mainly dependent on the duration of the experiment (the number of hauls multiplied by their durations) and on the number of fish involved, i.e. the number of fish within the selection range. The higher these two values, the greater its share of influence on the mean value of the selection factor.
Tables of Selectivity Data
The following notes explain the headings of some of the vertical columns in Tables C-l to C-12: 1) SOURCE - refers to Bibliography, Part E;
2) Number of fish in selection range - refers to the total number of fish of the species studied in the selection range from all hauls combined.

"1
11
" C
_ 1
• G
ea"
Bot
tom
tr
aw
l D
ub
Ie M
a il
l A
re
: IC
NA
F
1 2
3,
. IC
ES
rIb
v •
. N
o.
of
fish
T
ota
l N
o.
AtT
I'BO
R
SOU
RC
E LO
CA
LITY
C
OD
-EN
D
ME
THO
D
HA
UL
S
SEL
EC
TIO
lI in
sele
c-
of
fish
A
v.
wei
ght
(kg)
o
f S
pee
d
Mea
n 50
%
tio
n r
ange
st
ud
ied
D
AIE
N
o.
Ave
rage
o
f M
esh
m
,,,h
le
ng
th
Fis
h
By
catc
h
Fa
cto
r R
ange
D
ivis
ion
D
epth
M
ate
ria
l RT~
Run
nage
D
ura
tion
,~
ga
ug
e siz
e
("')
{m
m}
Cad
-C
ad-
Cod
-C
od
-(m
) C
on
st.
g/1
00
0 I
II)
(m/k
g)
(min
) (k
no
ts)
(mm
) C
over
C
over
C
over
eo
d eo
d en
d
end
'0"
;~~
,o~.
P
ara
llel
" ..
nn
<
&n
I ...
. ~at
Boa
t ..
" ..
.. "
.. ..
.. ..
" 21
11
2
.. ..
.. ..
.. ..
105
11
30
58
0 4
.4
Boa
t ..
856
1
.. ..
.. ..
" ..
.. ..
.. ..
60
6'
~at
1,0
80
1
,00
57
0 '.
3
Boa
t ..
.. ..
.. "
.. 19
32
1
.. ..
.. ..
" ..
.. I n
n
.. ..
.. 41
6 ~o
at
1957
d
IClW
' .:
d U
3
d TE
MPL
EMA
N
1963
3L
0
P
1954
C
""O
l"
56
.11
-,.
I ,n
, '"
,.,
10
8 40
69
675
.. ..
.. ""
.. I.
, ..
.. '"
• ,
7 7
4517
2
2.
ICES
""~-VII
Tw
iste
d
c BE
VERT
ON
1956
lIb
19
56
Con
tim
lo s
12
1 ..
1 60
3
.5
10
. 3
.5
3.6
80
1
20
1
9'
-'''-
" ..
" "
" 12
1 "
I.
M
c .,
'n'
."
.. I,n
24
.,
_'M_
b I B
RA
ND
T , ....
"
" "
'M
.. 1
7
,,,
.. n
h .•
1
M
340
""
.... ,,
,
" 19
56.
" "
" "
" n
' «
n
I,..
..
n
.".
ICES
X
I ~er
SAET
ERSD
AL
1963
I
1956
"
7 .0
14
1 5
1'
13
.'
lIOn
1'1
5
11
0
".
1956
d IC
NA
F I,
n:
d d
TEM
PLEM
AN
19
63
3L 0
P
. 19
56
.. "
, ..
" "'
'" I"
367
3.9
25
35
1598
,."
;'CES
19
~n ,~
" on
~e~
" "n
h
. I.
n
42
33
14
1
90
10
0-
IV
" "
" 2
'0
1957
"
5 90
3
" 14
4 49
5 3
.4
160
352
"',
",.
rCN
AF
VII
I CN
AF
MES
TORF
F 19
58
IF
1957
D
oub
le
160
.. 12
4k
g 12
7 47
0 3
.7
105
350
420
3232
59
5
ICES
V
II
Ab
er
SA
ETE
RS
DA
L 19
58 b
I
18
0
1958
..
1 10
0 3
dee
n
IIO
44
5 4
.0
100
'.5
18
7 45
1 3
" 1
80
-V
II
405
13 •
• 1
,20
"
" "
200
1958
"
5 '0
3
.'
" 11
1 20
2 23
4 10
84
533
,.0
-"
" ..
200
" ..
2 10
5 3
.8
.. 11
2 38
5 3
.5
140
492
417
1522
65
6
ICES
V
II
JON
SS
ON
19
60
V
1958
"
5 60
"n
h
.7
7.8
24
2
VII
I "
.. "
1958
..
3 "
.... .n
67
4 10
6 IC
ES
11
0-
VII
•
SAET
ERSD
AL
1958
b
T
200
1958
T
wis
ted
"
3 '0
.6
"
10
8
385
3.7
1
20
70
35
4 11
n,
53
. 2
00
-•
" ..
.. 23
0 ..
.. ..
2 ..
.8
" ! 1
0.
3.5
1
3.,
12
0 85
41
2 14
85
898
a IC
NA
F C
haf
er; b
Giv
__
• 22
<
-d.
. '
=-<
..
...
in B
ran
dt.
1956
; ¥1
Jc:e
d L
oad
Dir
ect
Pu
ll G
auge
3
kg
; f:
stim
ate
d F
rom
Pu
bli
shed
Gra
phs
and
Ta
ble
s.

23
According to this method, the mean weighted value of the selection factor is obtained from the formula:
where
k s
rnitiNiki
rnitiNi
k s
n1
, n2 nn
t l , t2 tn
Nl , N2 Nn
k l , k2 ••• kn
nltlNlkl + n2 t 2N2k2 + nltlNl + n2t 2N2 +
+ n t N k n n n n + n t N n n n
is the mean weighted trawl selection factor;
are the number of hauls in the first, second and nth experiments;
th aTe the durations of haal in the first, second and n experiments;
are the numbers of fish within the selection range in the first, second and nth experiments; .
are selection facLars in the first, second and nth experiments.
(2)
It follows from (2) that the mean selection factor is directly dependent on the number of hauls, the duration of hauls and the number of fish within the selection range, and, through all specific selection factors (kl , k2 ••• kn), on all other factors involved.
Thus, in applying this formula the numerical values of the selection factors obtained by the experimenters are taken as they are and in So doing it is assumed that the value of each specific selection factor reflects the heterogeneity of the populations fished, the size of catch, the peculiarities of the trawl design and the fishing process as well as the method of combining data from different hauls, the method of constructing graphs and calculating selection factors, and many other factors. As far as the reliability (weight) of each specific selection factor is concerned, it is assumed that in all experiments it is mainly dependent on the duration of the experiment (the number of hauls multiplied by their durations) and on the number of fish involved, i.e. the number of fish ~ithin the selection range. The higher these two values, the greater its share of influence on the mean value of the selection factor.
Tables of Selectivity Data
The following notes explain the headings of Borne of the vertical columns in Tables C-l to C-12: 1) SOURCE - refers to Bibliography, Part E';
2) Number of fish in selection range - refers to the total number of fish of the species studied in the selection range from all hauls combined.

-Ge~,
Bot
tom
tr
awl
• Il<
b
le M
aniJ
.1
Are
s:
leN
A
1 2
_ 3.
. IC
ES
lIb
V
a.
No.
o
f fi
sh
To
tal
No.
A
Ul'H
OR
SO
URCE
L
OC
AU
TY
C
OD
-EN
D
ME
mO
D
HA
ULS
SE
LE
CT
IOll
in sele
c-
of
fish
A
v.
wei
ght
(kg)
o
f S
pee
d
Hea
n 50
%
tio
n r
ange
st
ud
ied
D
ATE
N
o.
Ave
rage
o
f M
esh
mea
h le
ng
th
Fis
h
By
catc
h
Div
isio
n
Dep
th
Ma
teri
al
R r
ex
R
un
nag
e F
act
or
Ran
.e
Du
rati
9D t~
gau
ge s
ize
(mo)
(m
o)
Cad
-C
ad-
Cod
-C
od-
(m)
Co
nst
. g/
lOO
O
m)
(m/k
g)
(mo)
C
over
C
over
C
over
(m
in)
(kn
ots
) en
d
end
en
d en
d
'0<
>
~~S
I ,o
!,
Pa
rall
el
" R
<
<&n
" .. I ~at
.. at
" "
" "
" "
" "
" "
2111
2 B
oa'
"
" "
.. "
. 10
5 .1
30
58
0 iM
.
856
1 Bo
at
" "
" "
" "
" ..
.. ..
60
6S
2
" "
" ..
" 10
80
M
..
.ru
t lL
1 "
1~2 Lio
at ..
.. "
" "
" "
-'-""
..
" "
416
I~oa
t
1957
d
ICN
AF
d d
d TE
MPL
EMAN
19
63
3L
0 P
19
54
Co
6 '0
' '"
,.,
.,
108
13
40
69
675
" "
" ,0
., "
., "
..M
e ..
1ll
lL6.
-'
-,
, 45
17
22
. IC
ES
/V
II-V
II
Tw
iste
d
c SE
VER
TON
' 19
56
IIb
19
56
Coo
titt
u01
121
" 1
60
3.5
1
0. 3~
3.6
80
iJ..
2.cL
i.oL
='2
5,
c "
" "
" n
I",
" .0
.5
1
,0.
415
1'.
8
170
124
1.7
-,0
6-B
RA
Nll
T
b l3!
.n.
, ... -"
" "
I '6
0
n 1
7
Lll
2 _."
"l. l3
. lB
n.
1--'-
'-1.
"'" ..
.ll2
.
" 19
56·
" "
" "
n ,
" ,
174.
.50
••• A
I,"
,n
ICE
S X
I .0
i,
A
ber
SA
ETE
RS
DA
L 19
63
r 19
56
" 7
Ide=
L14
4 5
1S
. ll.b
. lilO
. 12
11
-'--'-
-"-
Lu. .
..
"-
1956
d
ICN
AF
'0:
d d
TEM
PLEM
AN
1963
3L
0
P.
1956
"
" , . "
I '1
7
'" 1
,.2
36
7 3 •
• 25
35
15
.8
,n<
>
;CES
19
tn I,~
"
nn
I~er
-L
14.
-
"0
-"
-..,
42
33
141
190
10
0-
IV
" n
" 29
0 19
57
" 5
'0
3 "
144
495
3.4
16
0 35
2 41
6,
"" "
A
ICN
AF
VII
I .~
MES
TOR
FF
19
58
IF
19
57
Do
ub
le
160
" 12
12
7 47
0 3
.7
105
350
420
32
32
59
5
ICE
S V
II
Ab
er
SAET
ERSD
AL
19
58
b
T
180
19
58
"
1 10
0 3
de=
11
0 44
5 4
.0
100
195
187
451
399
18
0-
VII
I III
i3.6
i1
20
20
2 "
" "
200
19
58
"
5 '0
3
••
" 40
5 23
4 1
08
4
53
' 1
90
-"
" "
200
" "
2 10
5 3
.8
" 11
2 38
5 3
.5
140
492
417
15
22
6
5.
ICE
S V
II
JON
SSO
N
19
60
V
1
95
8
" 5
60
3]0
1.
7 76
8 24
2
VII
I "
" "
19
58
"
i3
" ...
,.n
674
I '0
6
ICE
S 1
10
-V
II
a SA
ET
ER
SDA
L
19
58
b
T
200
19
58
T
wis
ted
"
3 90
3
.6
" 10
8 38
5 3
.7
120
370
354
1107
I "
.
20
0-
a i2
"
" "
230
" "
" "
'.8
"
,nn
...
39.5
. l.
u.
1?n
85
412
14.8
5.. L
..a.a.
aIC
NA
F C
ha
fer;
bG
iv __
as
22
~
"---
-..
..
in
Bra
nd
t.1
95
6;
l'il
ted
Loa
d D
irect
Pu
11 G
auge
3
kg
; ~st1mated
Fro
m P
ub
lish
ed G
rap
hs
and
Ta
ble
s.

TA
BL
E
C-
(co
nti
nu
e d
•
AtlT
BO
R
SOUR
CE
WC
AL
ITY
C
OD
-EN
D
MET
HOD
HA
ULS
S
pee
d
DA
tE
No.
A
ver
ag
e o
f D
ivis
ion
D
epth
M
ate
ria
l 'T~
Ru
nn
age
Du
rati
on
to
. (0
) C
onat
. g/
IDD
O
m)
(m/k
g)
(min
) (k
no
ts)
ICES
2
00
-V
II
a S
AE
TER
SD
AL
1958
b
I 25
19
58
Tw
iste
d
Co
ver
1 90
'.
5
i:~:
lCE~
9~
, V
II
Tw
iste
d
II
1°'"
ti
nu
o.,
11
01
Cov
er
5 ~
'.5
" "
" "
" "
" "
, "
" ,~e
,OO
A
" ~~
! 1-
125
" 2
....6
lL
" "
" "
" "
, "
" "
" "
" "
1 "
" "
" "
" "
• "
" "
" "
" "
" "
" "
" "
" "
1 "
" "
" "
" "
J "
Alt
ern
ate
"
" "
" "
Ha.I
" 5
"
" "
" "
" "
3 "
" "
" "
" "
5 "
" "
" "
" "
1
" "
" 20
0 "
~
""' on
,
" "
" "
" "
" -=
~<
ICES
V
III
ICES
19
64
lIb
19
59
125
" 5
60
" "
" "
" "
4 "
" "
" "
" "
1 '0
ICES
"
" I!h
15
5 "
" "
, .J
2
" "
" "
" "
1 90
" "
" "
" "
1 6
.
" "
" "
" "
3 60
" "
" "
.. ..
2 60
SIC
NA
P' C
haf
er;
b Ftx
ed L
oad
Dir
ect
Pu
ll G
auge
3k
g.
No.
o
f fi
sh
SELE
CTI
ON
in
sele
c-
Mea
n
50%
M
e,h
~.h
len
gth
ti
on
ra
nge
F
act
or
Ran
g g
au
ge
size
(=
)
(om
) (o
m)
Cod
-C
over
eo
d
Abe
r de
eD.
11
' 44
0 1
.9
110
20
' ?:
V.
b 12
0 41
2 '.
4
86
, .. b
'on
-'
..l.
!l 1
8'
14
8
Uo1.
--1
1lL
'.
6
flO
O
205
16
'
" ~
" >o
n
I 120
40
. .0
" ..
.IJO
•
137
454
'.J
" 51
2 .7
" "'.
..L
101
384
1.8
50
no
-11
9 U
;7ft
4
.01
1
(10
0
-54
8 4
.0
60
H7
57
0 4
.2
190
141
-"
-' 1
0<
'"
• ""
1451
'-
<,
...l
lil
492
504
123
449
'.5
12
0 10
14
1236
" 37
1 '.
0
_160
24
28
2061
" 35
0 2
.8
140
1985
I "0
'
~~ ~
09
..38
0 .
1.5
..1
ll
(SO
L A
oO
I HI
440
., I (
SO
) 13
7 I 0
' .
" 41
J!.
'.1
LL
120
1m
. I '
A'
128
450
3.5
90
13
0 1
,0,'
128
398
3.1
80
12
75
1504
To
tal
No.
o
f fi
sh
stu
die
d
eo
d-
end
I <75
1
'07
I ,n
,o 1
,<7
1206
21
4
I ,.5
12
41
mn
I H
.
"'"
- -I.
" -
.ow
. -
.. , ,n
"
3061
22
78
1805
40
50
4082
25
02
1,0
0.
,,'"
'0'
,eo
23
1'
2955
Av.
w
eigh
t (k
g)
of
Fis
h
8y
catc
h
Cod
-C
over
C
od-
Cov
er
end
eo
d
N ~

To
"
r_
ed
).
AUTH
OR
SOU
RC
E LO
CALI
TY
CO
D-E
ND
M
ETH
OD
HA
ULS
No.
o
f fi
sb
To
tal
No.
Spee
d M
ean
50%
SE
LEC
TIO
N
in s
ele
e-
of
fisb
A
v.
wei
ght
(kg)
o
f
Div
isio
n
Dep
th
OATE
M
ate
ria
l N
o.
Av
era
ge
of
"Mes
h _
ah
le
ng
th
tio
n r
ange
st
ud
ied
F
ish
B
yca
tch
R
Tex
R
unna
ge
Fa
cto
r R
an.e
(m
) C
ou
st.
g/lO
OO
m
) (m
/kg)
D
ura
tio
n
tow
ga
ug e
si
ze
(=)
(.0
) C
ad-
(min
) (k
no
ts)
(mm
) C
over
C
od-
Cod
-C
over
C
od-
end
end
en
d
end
C
over
"""
" .. ;~
~ ";!
! 12
5 C
over
3
80
126
480
3.8
8
0l
I"
,o.
,.,
" ,.
" "
" ·
, "0
m
,
, ,.
'"
,eo
'"
,,
.
" "
" "
• ..
1 90
13
0 47
0 3
.6
14
0)
'"
.. .,
. 18
2
.. "
.. ..
3 60
•
.. 1
2.
455
3.5
70
I "
1
4.
Vo'
I,.
.
.. ..
.. ·
.. ..
, 80
"0
<
0,
, ,
I,n
.
.. ..
,. "
· ,
.0
"n
<o
n ,
, n
o
152
182
525
1759
~~.~::
IC
ES
.0-
VII
~~
I ~!
!~:
• 8E
VE
IlroN
19
64
ITb
13
0 19
59
Con
t 10
1 •
~
I ,
, ".
un
, ,
.,
2"
1313
4
.'
I ..
. •
" "
" ..
. ..
.. 50
D
O
I, ••
, ,
I ..
I.-
5 3
.5
• ..
.. .,
.. ,
45
3.5
..
" ..
I".
I,.,
,
, ..
I",
I '''n
, .,
T~'
".
ICES
~'
" ..
" •
,,.
. '"
I .. ,
".,
. , ..
" "
,n
" "
.. .0
,
1,0<
,.U
oa
, ""
,"
" 10
.0,
, ... ;:"
S I~
o ..
r~ ••
• '"
, . '"
" "0
" "
.. ..
" "
M
,."
,n
.. ..
" ..
.. ·
• '"
".
, ..
.. "
.. ..
.. "
, '0
'To
.. ..
38
7 U
6
';C!S
'~~
I ~!!
I A
be
r-
,.;;"
I"
,oe
" ..
dee
n
132
447
3.4
10
0 4
.5
1u6
IU8
5
1890
" 1
50
-..
" 17
0 ..
" "
" I
, 9
0
I 3
.S
" I",
' ... , .
,nn
I"
. ,.,
... .,
.
. "
" '6
0
" "
" 90
13
.s
" I",
I.,n
, .
.. Ia
n .
., ,n
n
" "
. '~
. ..
.. "
" 1
7
34
342
, .. '~
~ C
over
b
" ..
" "
" ..
Cha
fer
7 10
5 "
" 10
4 1,
<4
,. I
,n
"0
. ,.
hm
, ,o
.
" "
14
0-
b
" 20
0 ..
.. ..
" •
on
.. "
,n,
o.
'~~~
I~~
e
" ..
.. 2
0 ..
" "
, 90
"
"0
..
0 , .
I,,,
,,
.30
..
36
, 80
70
8 1
00
-e
.. ..
" ,a
e
" "
" "
.. ,
" "
" IC
ES
VI
ICES
19
65
V •
138
1962
T
wis
ted
66
23
151
Cov
er
7 60
4
.0
ICES
11
2 37
6 3
.'
on
80
.7(1
67
2 'eo
" d
4F
1xed
Loa
d
D1 r
ee
e 3
t P
ull
Ga u
g
kg
, °D
ou
ble
Cod
end
Mes
h S
ize 1
05
mm
" ~1ti-Fla p
Ch
afe
r M
esh
Siz
e 1
10 !
lID;
->to
tal
ca
tch
of
all
S
ecie
p
s (C
oden
d
& C
ov
er)

TABL
E C
1
(con
t1n
ued
l.
AllT
HO
R SO
URCE
LO
CA
LITY
C
OD
-EN
D
MET
HOD
HA
ULS
Sp
eed
DATE
'0
. A
vera
ge
of
Div
isio
n
Dep
th
Ma
teri
al
RT~
Run
nage
D
ura
tion
to
w
(m)
Can
st.
g/10
00 I
II)
(-m
/kg)
(m
in)
(kn
ots
)
~,,!
S V
I I ,~<
1965
16
1 i96
2 T
wis
ted
66
23
151
Cov
er
8 60
4
.0
" "
" n
o
.. "
6."
1<
1 "
, 6
0
A.O
VII
"
" "
,.,
" 10
0 "
9 -'
ilL
-'.
.i
7()"
..
" "
.. 15
0 ..
6135
16
3 "
17
84
4.0
V
II
" ..
" "0
"0
' "
100
" I ,
97
3
.5
" "
" 8~
:, I~
~'
" ... 1
51.
" I •
~
, ,
" "
" "
" 15
0 "
6 60
3
.5
" ..
" "
" "0
"
. "
60
,.,
" "
" "
" 10
0 0 ••• "
A
I.
00
,.,
11
9-
.. "
" ,n
o "
" '"
"
4 -"
fi.
,. "-
" ..
.. "
.. 15
0 "0
-'
" I~
1~~
VII
I I n
oo
on
... ,
,..,
.. .. "
101
.. I.
00
,.,
AN
D
214-
... ..
223
" "
" "
4 60
...
3..5
.
" "
2;!;
.. ..
" "
I.
60
,.,
"
2;~
" ..
" "
I ~~~
rnat
, 1
6 .0
, ,
2
2()
" ..
.. 25
5 ..
.. "
" I.
6
0
3.5
.. le
NA
>
2;~
" ..
.. 2
J "
" I,
. ..
2;~
" ..
I.
.0
" ..
" "
.. IC
ES
165-
X
HOLD
EN
1966
d
T
260
1963
..
" C
over
5
100
40
leN
A>
16
0-X
A
lter
na
t HO
DDER
19
65
2J
170
1963
T
wis
ted
99
25
101
10
"",
10
60
3.5
on
d 1~
~ HA
Y "
" "
" I"
60
"
" "
14
5-
.. "
" 18
5 "
.. "
" •
60
.. IC
ES
III
OLS
EN
1962
r
160
1964
..
.. C
over
2
60
3.5
'0"
.. 2~
III
" "
I ,
110
_. "
" _
"el
{'
e"_'
" _
&
.'1
<'
__
_ ..
__
lro_~
..
--.:
I ..
. --
Mea
n 50
%
SELE
CTI
ON
Mes
h m
esh
len
gth
Fac
tor
Ran
g
gau
ge s
ize
(-)
(-)
(-)
ICES
12
7 40
1 3
.2
160
" ",
".
, ,
,.
0
Wes
t o
f£.
120.
:..n
a_ 1
2."
11
0 A
ber
dee
n 1
38
402
2.9
12
2 W
est
bo
ff ,.,
1'0
0
lh4
20
I",
I",,
, Ja
R> I
".m
1117
13
90
13
.3
120
'" 1
"0
,
4 ,.
0
Wes
t I h
nff
"0
h
,o,
I" 7
' I,
,,m
",.
run
, "2
i if
.",
'"'-
" W
est
ho
ff
98
350
3.6
97
" '"
I ,.,
, ..
100
" "0
. 4
R
a.
10.,
.. -
-1
3.5
-
.. 10
6 13
40
1'.
6
1124
.. '0
. I '
.0
, . I.,
.. I J
OO
LICE
.. 12
5 50
0 4
.0
8
" 11
00
1372
I l
.4
1,00
" 12
n L
=.
LV
i.
h.ru
.
., 13
0 45
0 3
.5
106
" 11
3 i
434
13
.8
14
" ,
No.
o
f fi
sh
To
tal
No.
in
sele
c-
of
fish
ti
on
ran
ge
stu
die
d
Cod
-C
over
C
od-
end
end
330
370
H ",
«.
.0
00
'01
"0
2880
18
60
1321
8 37
58
4·'
· <
0.
"'0
".
.0
1
,,0
, ...
,."
3240
20
00
9946
26
73
110
110
lo"
'"
".,
",n
380
-34
0 -
10
,
U7
2
1128
89
6 74
4
904
732
920
348
912
1,,
77
h •
• o
,.0
--
b,n
.
21.2
-
l."
,0.
-13
28
-90
4 -
47
27
1,.
I,
,,
792
93
I ...
. 'H
'O
1,.0
~,
. I" ••
I""
"',. .,
.. I"n
'
524
08
1693
82
6
205
27
444
1.0
,
Avo
w
eigh
t (k
g)
of
Fis
h
ayca
tch
Cod
-C
od-
~ove
Cov
er
end
end
'4
674
'" a
",
I,no
a
2447
26
8
,,.
'"
2640
13
10 a
628
I",
05
0
30
19
0
b,.n
b,
n
bo
-
« ,,,
2640
I,n
" 1
«
,0
, ..
.. , :'\ i---
N ~
: ca
tch
es
t 'ely
i a
1mos
en
tir
: co
d !
V I I
: ca
tch
es
alm
ost
: en
tire
ly
cod
TABE
L C
I -
con
ti
ed)
ou
No.
o
f fi
sh
To
tal
No.
AU
THO
R SO
URCE
LO
CA
LITY
C
OD
-EN
D
MET
HOD
HA
ULS
SE
LEC
TIO
N
in s
ele
c-
of
fish
A
v.
wei
ght
(kg)
o
f S
pee
d
Mea
n S
Ol
tio
n
ran
ge
stu
die
d
DA
TE
No.
A
vera
ge
of
Me,
h m
esh
len
gth
F
ish
8y
catc
h
Fac
tor
Ran,.
Div
isio
n
Dep
th
Ma
teri
al
RT
ex
Run
nage
D
ura
tion
,~
gau
ge s
ize
C=
) Co
) C
onst
. &
/100
0 m
) (m
/kg)
C
=)
Cod
-C
over
C
od-
Cod
-C
over
C
od-
Cov
er
(min
) (k
no
ts)
C .. )
.nd
.n
d
.od
.n
d
~~
2~~~
IV
,.
CRAT
BERC
. , ...
"6
4
Tw
iste
d
125
Coo
or
2 80
3
.0
CES
13
3.5
450
1
3.4
10
5 "4
""
""
".
, !~
E~
.. n
~~
" 10
1 "
1 ~
3.5
"
III
504
3.8
57
"
,.
, .. o
n
" "
" "
" "
" "
1 12
0 3
.5
" 13
1 42
4
.1
86
0 80
36
3 26
0
" "
" "
" "
" "
""
" "'
"--'
-_
ll
138
.. , ..
'"
" "
" "
" "
" "
120
13.5
"
'"
,%
~ ,
: "
1 22
21
1 14
8 46
0-II
I "
" "
480
" "
" "
1 24
0 3
.5
" 55
0 4
.3
70
6 04
3
7'
255
., "
" 4:
~ "
" "
" 1
'Rn
, "
13
1
->35
~ ~~
4.l
56 ~
'2
2.'
.,
Cov
er
a
" 19
66 ~
"
" "
" "
Ch
afer
5
120
3.5
"
128
474
3.7
68
,n
n ".,
I
a D
oub
le C
oden
d M
anil
a.
126-
I11I
II m
esh

"'A
tlT
V
("_
G
ear:
B
otto
m
t.ra
wl
Sn
ecie
s:C
od
.. ,", ._,
AUI'H
OR
SOUR
CE
LO
CA
LIt
y CO
D-EN
D M
ETHO
D H
AIlL
S
Spee
d DA
TE
No.
A
vera
ge
of
Div
isio
n D
epth
M
ater
ial
R T
ex
Run
nage
D
urat
.ion
'ow
(o
l C
onst
. g/
lOO
O I
II)
(m/k
g)
(min
) (k
not
s)
ICES
X
H
OLD
EN
1966
d
r 17
0 19
63
Pla
ited
2
16
.0
Cov
er
1 90
4
ICES
26
0-II
O
LSEN
19
66
r 26
5 19
64
, "
4 60
3
.0
ICN
AF
14o.
. IV
B
RA
TBER
G
1965
m
29
0 19
64
Bra
ided
45
00
" 7
80
3.0
" .. !?
,S
4~ ~"
".n
0
, ,
nn
0
.. ..
n 46
0 "
n "
" ,
120
4
" ..
.. "
" "
" "
, "n
0
" "
" "
" "
" "
, n
n
• .o
BL
1~
:~ a
IC
ES
8o..
V!"
4 C
on·i
nu
o ,
"n
.
N.n
" '0
6
e V
10
0 49
05
204
" !CE
S 1
20
-II
;;II
' n
._"
',
',M
,
.. n
, ,
."r.V
.I·
".,
h ,n
n "
.. ..
" "
" "
" ,
, ,
.. IC
IIAF
18o.
. X
I-X
II
b 49
05
" ,n
••
BO
HL
1967
c
I 8
220
1965
C
onti
nu
o 20
4 "
.. ..
" "
" ."
. ' .• n
n
,n.
" ·
ICES
22
o..
III
OLS
EN
1967
r
250
1966
B
raid
ed
4500
..
4 72
3
.0-3
.
ICIIA
F 10
o..
X
BO
Ht
1967
a
,.
135
1966
H
on
ofi
lam
nt
4800
20
8 "
4 on
•
" "
" "
" .
',on<
,M
"
,nn
•
On
ICES
X
I ,
" '"
U
NPU
BLIS
"
r 24
8 19
66
" (L
OW
ESTO
)
.. ..
.. ..
" ·
" ,.
, "
" ..
" "
" "
• "
'"
ICES
22
o..
III
~:~
a
OLS
EN
1968
I
250
1966
B
raid
ed
4510
eh
a "
,-,.,
~C
ES
III
~::
b
OL
SE
N
,,,.
2.n
•
o~"n
'-,
;CES
~n
~o ..
~~~ a
~EN
'06
7
",n
,
• n
" . ,. ..
IeN
Al
2~~
~.,
B~~~
~~~i
" .,
n,
,."
e,
, 'M
...
, HO
LDEN
"
21o.
. "
" ,
.an
I.
u,
.. ..
.. 23
0 "
" ..
25o.
. C
onti
ouou
.
.. ..
" 26
0 ..
Hu
ltif
il
ent
5012
20
18
" 1
180
3.5
-4.
... _
__
~
...
_ ..
....
_
,, _
__
"
.'-_
.•.•
_ ••..
L "'_
,-
...
-,
, -
--
.
. ,~ ..
1.,.
Hea
D
50%
M
e.h
_.h
len
gt.h
ga
uge
size
(mm
) (m
m)
ICES
134
. 56
1
" 14
5 50
6
" 14
1.
460
" '"
, '"
"
134.
54
6
" n
. "0
" '"
..
,
" ]1
,
436
" '"
" "
'" ln
o
" " 14
1 49
8
" "0
'0
'
" "0
'0
' L
owe.
'0
' S
ci.
'" <1
n
" ,~.
'"
un.
.. ....
.. .0
<
"n
.. .. ."
..
115.
50
4
OR
<,
nh
No.
o
f fi
sh
To
tal
No.
SE
LECT
ION
in
se1e
c:-
of
fish
ti
oD r
ange
st
ud
ied
F
acto
r R
ang
(mm
) C
od-
Cov
er
Cod
-en
d en
d
4.0
10
7 25
0 , ..
"'"
,"",
3.5
17
9 ,.
,~
1,><
I"
,
3.3
12
0 1
4,n
" ..
"'"
.,,-
, 1
.0
'7
., .. ,
4.1
70
.,
, .. d
., 96
68
2
0'
"',
, ,
'"
.. I '"
I"
n
I",
1,.
5
101
I ",
" I .. n
, .n
67
75
I"
: ,.,
.
InJ
1,2
" I
",.
I"
no
"n
n
I ""
1 .. _
3.5
11
4 85
92
51
6 32
, ,
'0
351
329
1682
30
, ,
eo
1386
1
28
' b
..
,n,
, M
' . ,' I
,,,.
.n
•
.. n
'"
(231
) (2
36)
033
60
I , •
n
n
(109
) I (]
71
30
0 b.
,
I ,
, '"
g"
I ..
b ..
,,. 72
57
65
4
5470
66
85
090
"" 34
35
27
89
51
49
71
15
4.4
67
12
0 I,
,. l"
97
7
Av.
w
eigh
t (k
g)
of
Fis
h
Syc:
atch
Cod
-C
od-
Cov
e C
over
en
d en
d
1«
"
" , I"
, ""
" .. n
30
Ion
,n,
1,0
'
h ...
h
,n
I 7
7n
I .. n
1
; .,
n
bn
1,,
0
I,n
600
In
N ~
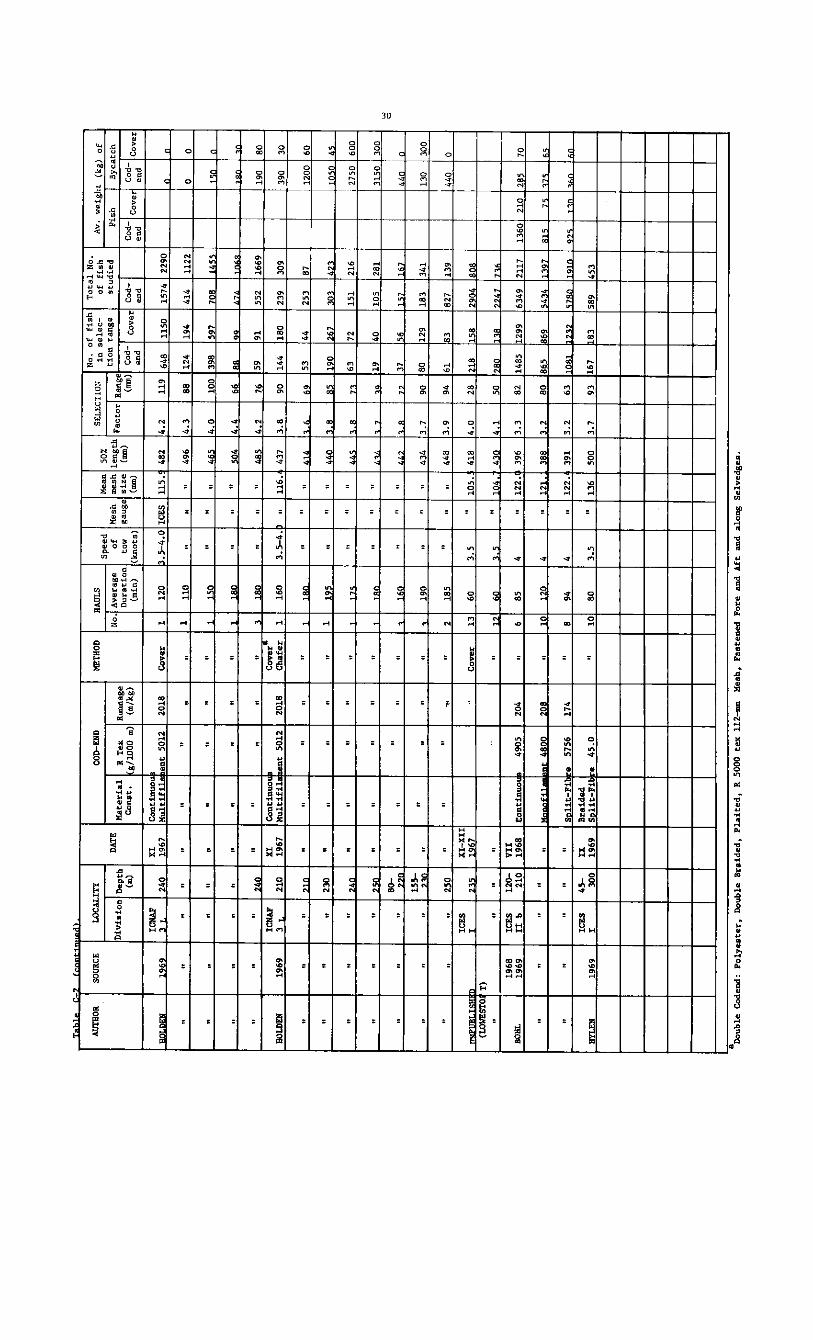
T.h
1,
e_
No.
o
f fi
sh
To
tal
No.
A
Ul'H
OR
SO
UR
CE
LO
CA
LIT
Y
CO
D-E
ND
M
ETH
OD
H
AU
LS
SELE
CTI
ON
in
sele
c-
of
fish
. A
v.
wei
gh
t (k
g)
of
Sp
eed
M
ean
50
%
DA
TE
No.
A
ver
ag
e o
f M
esh
_
sh
le
ng
th
tio
n
ran
ge
stu
die
d
Fia
h .B
ycat
ch
Div
isio
n
Dep
th
Ma
teri
al
.Tex
R
un
nag
e F
act
or
Ran
ge
Du
ra
tio
n
tow
ga
uge
si
ze
(-)
(m)
Co
nst
. g
/10
00
\II)
(m
/kg)
(m
in)
(-)
(-)
Cod
-C
over
C
ad-
Cod
-C
over
C
od-
Cov
er
(kn
ots
) en
d ~d
en
d
en
d
~"!'"'
" X
I cont~~u
Mm
.• ""
lOnO
24
0 19
.7
Ku
ltif
en
t 50
12
2018
C
ove
r 1
120
.5-4
.0 I
CES
11
5.
482
4.2
11
9 .4
8
1150
15
74
2290
.. ..
.. ..
.. ..
.. "
" 1
110
.. ..
.. 4
9'
4.3
88
12
4 1
.4
414
1122
0
0
.. ..
.. ..
" ..
.. ..
.. 1
150
.. ..
.. _4
OS
4.0
10
0 39
8 5
.7
I,n
o
I "-"
.on
n
.. ..
.. "
" "
.. ..
.. 1
..ll!O
.. "
.. ..
504
4.4
66
'"
.. "
.. 24
0 "
" ..
" "
3 18
0 ..
" ..
485
4.2
76
59
.1
55
2 16
69
190
80
ICII
AF
XI
Co
nti
nu
o
Co
ver&
B
OLD
EII
1969
3
•. 21
0 19
67
Mu
lt1
filJ
iaen
t 50
12
2018
C
ha
fer
1 16
0 3
.5-4
. "
116.
43
7 3
.8
.0
144
180
239
30
. 39
0 30
.. "
.. "n
..
" "
" ..
1 18
0.
" ..
" .,.
.n
n'
53
44
253
87
12
00
60
.. ..
" 23
0 "
" "
" ..
1 19
5 ..
.. ..
...w
L ~
85
10n
'n'
I ''''
."
I .n<
n I '"
" "
" I
.. ..
.. 'A
n ..
.. ..
" ..
'"
.. •
..ll
63
72
151
216
i 275
0 60
0
.. ..
.. 25
0 ..
.. "
" "
1 ..l
.8O
. "
" ..
.... . ,
I •
40
105
281
3150
30
0
~n
.. ..
" ..
".
" "
.. ..
.. "
" ~
-= 37
56
'"
1
,,,
I v.n
n
~~
.. ..
.. "
" ..
" "
, 1
.0
" "
" 43
4 3
.7
90
80
129
183
341
130
. 30
0
.. 25
0 "
" "
" "
2 18
5 "
.. "
448
3.'
94
61
83
82
7 13
9 44
0 0
.. ..
_. iCE
S 23
5 ~!
;~II
.,
Cov
er
13
60
3.5
..
10
5.
418
4.0
28
21
8 15
8 20
n,
An.
(L
OW
ESTO
T)
..
.. ..
" "
1 60
I
3.5
"
10
' ~
iAJ.
50
,.n
".
I".,
I,
,,
1968
IC
BS
120-
VII
B
OlIL
19
69
crb
210
1968
:C
onti
nuo
4905
20
4 "
• 85
4
" 12
2.
39
' 3
.3
82
1485
12
99
63
49
21
17
1360
21
0 28
5 70
" ..
.. "
" I.
, ".
."
.RO
. 20
8 "
10
120
4 "
12
1.
388
3.2
80
86
5 18
69
1541
4 1,
..,
."
" I",
I"
" "
" "
" S
'Dl1
t-F
il
e 51
56
174
" 8
94
4 "
12
2.
391
3.2
63
0
"
h ,.,
1
,,0
. It
"n
0
"
no
,<
n I.
n
ICB
S
45
-IX
B
raid
ed
" B
YLE
N
1969
I
300
1969
S
pli
t-F
l e
45
.0
" 10
80
3
.5
136
500
3.7
93
167
83
589
453
a Dou
ble
Cod
end
: P
oly
este
r.
Dou
ble
Bra
ided
, P
lait
ed,
R 5
000
tex
112~
Mes
h,
Fas
ten
ed F
ore
and
Aft
and
alo
ng
Sel
ved
ges
.

TW
.
r.
.~
"' o
. e
.e.
M"
te ..
i ..
1:
D "
".
A .
0'
,,·N
..
."
,,, ..
, TT
h N
o.
of
fish
T
ota
l N
o.
I A
UTH
OR
SO
UR
CE
LOC
ALI
TY
CO
D-E
ND
M
ETH
OD
H
AU
LS
SELE
CTI
ON
in
se
lec-
of
fish
A
vo
wei
gh
t (k
g)
of
Sp
ee
d
Mea
n 50
%
tio
n
ran
ge
stu
die
d
DA
TE
N
n.
Av
era
ge
nf
Me,
h m
esh
le
ng
th
Fis
h
By
catc
h
Div
isio
n
Dep
th
Ma
teri
al
RT~
Run
nage
F
act
or
_,e
Du
rati
on
tn
w
ga
ug
e si
ze
(=
)
(=
)
Cod
-C
ad-
Cad
-C
od-
(m)
Co
nst
. g/
lOO
O m
) (m
/kg)
C
over
C
over
C
over
(m
in)
(kn
ots
) (o
m)
end
end
end
ood
~CES
I~!.
, 1-
-;'-''"
,,,
u.
mo~,
, .. , I,
.n
Cov
er
1 6D
3
.5
klee
n 12
2 42
9 3
.5
90
155-
" "
" 16
5 "
" IA
'n
k
, "
20
452
3.8
70
56
0 53
1 14
91
10
54
1C
NA
F 25
0-IV
19
65
1 0
295
. .,. "
4 90
3
I""·
134
425
3.2
11
5 46
1 38
6 I"
"
'" .n
a,
, .. , ~,,!:AF
'~~
XI-~
~;
~~-
w<
'"
"
i ,.
.. 4
' "
114
' 38
7 3
.4
I 93
2044
1"6
' I,
nm
,n
" ... ,
m
.0<
, "
" 1C
NA
F 10
0-X
"
" I "
e
'He
" "·
7 1
• 13
5 19
66
" n
8 80
4
.0
" 1
13
. 38
5 3
.4
68
T<
" I"
TO
. 1M
" :~
::
;~~
1;~
V!~A
"
" "
" I.
,n
, I A
0 "
'" I
'"
I "
" 10
8.2
1078
12
104
1793
21
65
90
310
40
1CN
AF
215-
IX
Cov
er •
M
ON
TE
IRO
19
68
3 L
26
5 19
67
Tw
iste
d
Ch
afe
r •
180
3.5
-5.
" 40
9 4
.0
81
-3
0-
5795
32
99
13
22
I, ••
'n
.
i !
1 :e:
i --
8p
oll
sh T
ype
Ch
afe
r.
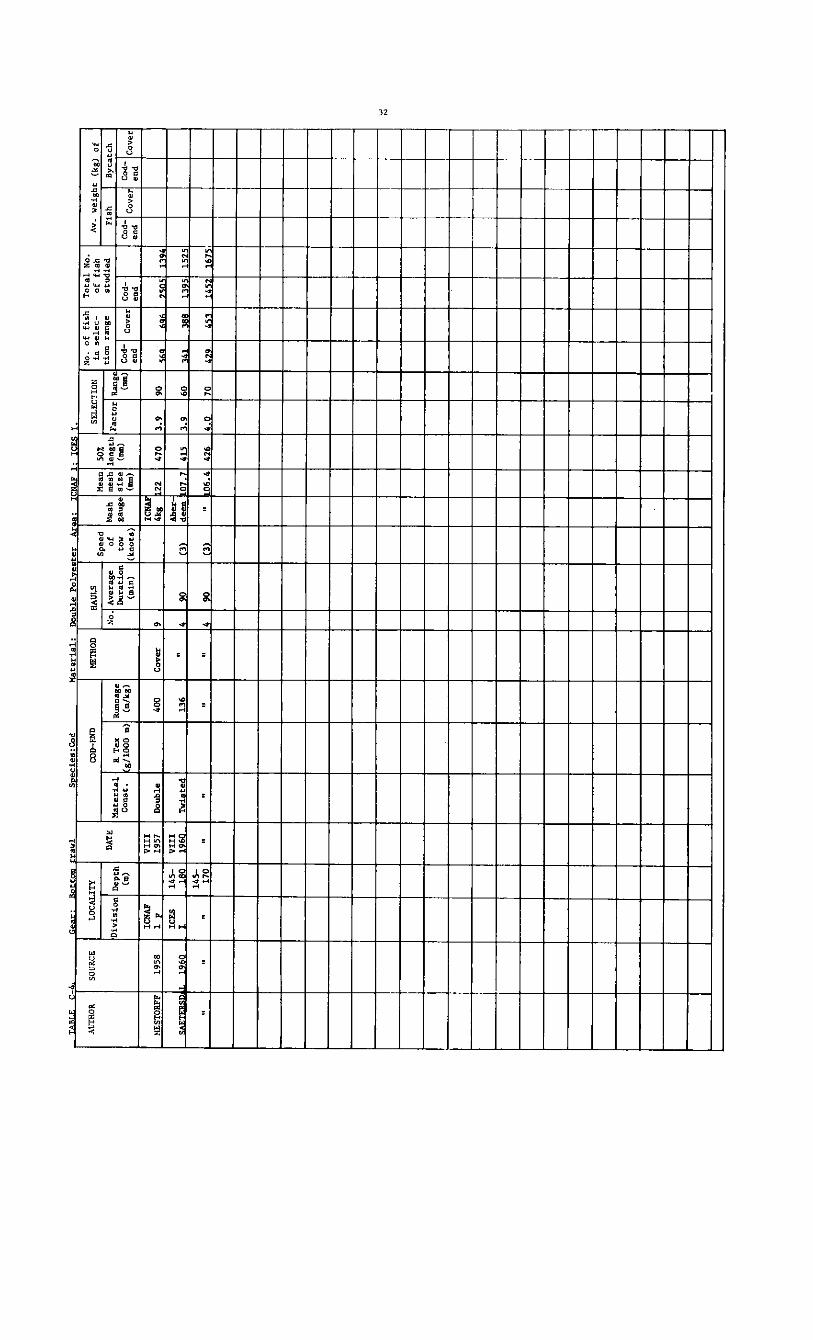
T"L
F
c-
0'
. '"'
''' :l
"aw
l S
""
'cle
s:C
od
Ma
teri
al:
D
oub
le P
ol
est
er
Are
a:
eM'"
l'
ICE
S I.
N
o.
of
fish
T
ota
l N
o.
ALTH
OR
SOllR
CE
LO
CA
LITY
C
OD
-EN
D
MET
HO
D H
AU
LS
SELE
CTI
ON
1n
se
lec-
of
fish
A
v.
wei
gh
t (k
g)
of
Sp
eed
M
ean
50%
ci
on
ra
ng
e st
ud
ied
DA
TE
No.
A
ver
ag
e o
f M
esh
... b
len
gth
F
ish
B
yca
tch
F
act
or
Ran
ge
Div
isio
n
Dep
th
Ma
teri
al
RT~
Ru
nn
age
Du
rati
on
t~
ga
ug
e si
ze
(mm
) (m
) C
on
st.
g/lO
OO
m)
(m/k
g)
(rom
) C
od-
Cov
er
Ca
d-
Cod
-C
over
C
od-
Cov
er
(min
) (k
no
ts)
(mm
) en
d en
d en
d
.. d
IeN
"
VII
I !;
:' ".
,.,
....
".,
H
ESt
OR
FF
1958
1
• 19
57
Dou
ble
40
0 C
ov
er
9 22
47
0 3
.9
gO
, •• n
iCE
S l~
~O
~!;~
~". te
A
" 9
0
m
Ab .
. -
",
, .. "n
. ,
525
136
4 d
een
0
7.7
41
5 3
,9
60
145-
" "
" 17
0 "
" "
" 4
90
()l
" 0
6.4
42
6 4
.0
70
... , ...
,,,,
'6
7',
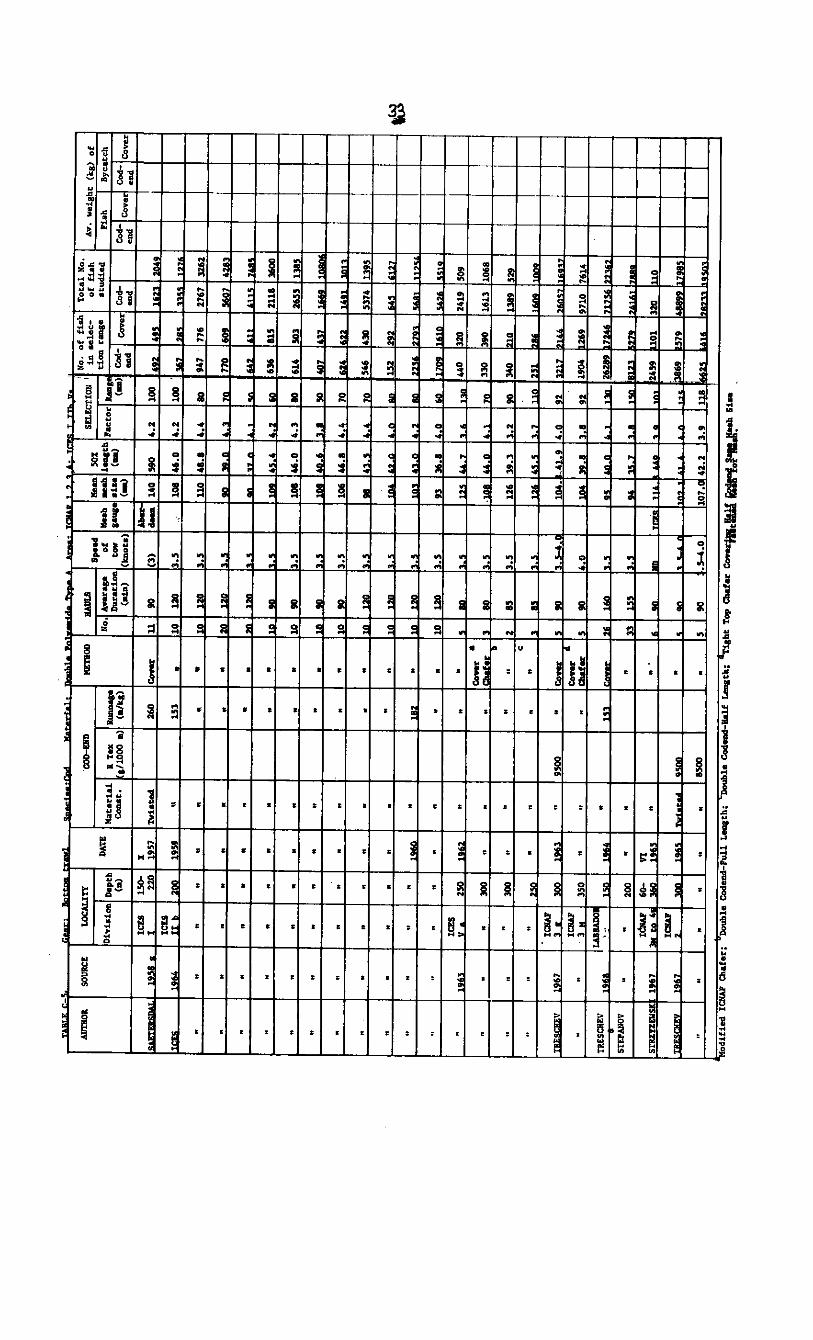
..... c
_
r.~ ......
-, -. .
. .-.
' ..
..CR •
• ,
•.• ~
• N
o.
of
fill
h
To
tal
No.
-SO
UItC
E LO
CA
LITY
'C
OII-
EIID
M
miO
D
IL\D
LS
.... 50
T SE
LECT
ION
I in
nle
c-
of
fuh
A
v.
wei
gbt
<ks)
of
.....
tio
n r
aoae
n
ud
ied
D
ATE
N
•• A
__
0' II
qh
-lucth
n.
h B
ycat
ch
Fac
tor
"C.!i
Div
1ll1
on
Dep
th
Ma
teri
al
K.o
x
--])
or.c
loD
t_
.....
sU.
(.-
)
Cod
-C
od
-C
od
-C
od-
(0)
Co
ut.
1/
1000
a)
(a/k
a)
(oin
) (k
no
ts)
(.-)
C
ov
er
Cov
e C
ov
er
eod
eod
e""
e""
.... ~
150-
• ::-
• ••
I ...
I .
...
I ...
. 2
2.
1957
_
ate
d
260
......
U
go
(3)
14.
590
4.2
lOG
I.~.
,GA
, ~~
20
0 '9
59
" 1
5.
· 1
0
120
•• 5
108
46 •
• 4
.2
lOG
..
1._.
I •
••• I.
, ..
· ·
n •
• •
• •
,. to
ft
•• 5
UO
....
4.4
eo
94
7 77
6 Z7
67
]262
• •
· •
• •
• •
: ... 1
20
' .. ,
I ..
I ...
. I •
. ,
17
. 77
0 60
9 I .
...
I ...
.
· •
• •
• •
• •
I-
... , .
,. I ...
I •
..•
I ...
.
0 •
• •
• •
• •
.. o
o
• : ,
no
I ...
. ...
160
636
W
2118
l6
00
· ·
• •
• •
• •
10
go
3.
5 10
8 46
••
4.3
eo
61
4 50
3 26
5'
1385
· •
• •
• •
· •
,. on
•
I ,n
o I ..
. "
I •.•
le
a I.
,.
I, ..
. I,~
· ·
· ·
· ·
• •
10
90
3.
5 11
45
46 ••
4
.4
7.
I ...
....
I ••.
•
.. ·
• •
• •
• •
I,.
12
ft
I •. ,
I ..
14
1.5
14 ••
17
. 54
6 43
0 "
74
u
n
n "
• "
• ·
• •
I,.
, .. , .
.~
I ...
.. I .
. 15
2 I ...
I .
..
I ...
. ~
· "
" •
,-·
TA.
• ,. ,
M
I •.•
I
•••
In .•
I •
. ,
I ..
I, ••
• I.
, ••
I •••
• .. ..
. ..
" ·
• •
· •
• 10
12
0 3.
5 ••
1".
8
I. 0
I .
. 'n
o
I ...
. I .
...
.. "
, ... ~C
ES
250
, ... ·
• •
I.
.. I •
.•
I".
1 ...
7 I •
.•
n.
..-32
0 24
19
509
• 0
0 •
300
• ·
• ~
I,
.. , .
I. .. ,
I ...
. . ,
,.
'3
0
390
1613
10
68
• n
o
I ...
I ..
· 0
300
• •
• "
2 85
3.
5 12
6 39
.3
3.2
90
l4
0
UI9
c
.. ..
· '5
0 ·
· •
• I.
a.
• n.
•••
7 ".
., ••
• ....
....
n··
....
v '·
'7
.!~
1M
•••
• ,
9500
•
r_
I.
on
' .....
.. , ...
·,41
.' 4 •
• I .
. "
.. .. lC
lW'
....
..
4 I.
9
0
,n<
I .
...
3.B
.2
""
..
0
•• 35
. ,
" ·
cw-;
" 4
.0
1904
97
10
7614
TRES
CN
EV
, .. , lA!
' ......
,~
,~.
• , ..
.. I •
• , ..
• ••
&
ft.
, ...
2.'"
7'"
SlE
PA
NO
V
· ·
ZOO
• •
• 1'
3 1
<.
I •.•
... I n
.7
l.'
I". I
" ••
L
._
..... ! ••
••
snzn
El/
" ,"
7
I .. l
aw
, ...
~
~.
• "
I.
oo
I ..
I ...
..
..,
... I •
•
Iu"
hO
I 32
0
". ....
!CIW'
1
M
, ... 1
_ .•
.••
I ...
. ,
oo
, ~.
.M
.. , •
be"
579
..... "oo
•
" "
• ,
· •
8500
,
5 go
.5
-4 ••
1
07
. 4
2.2
3 •
• IU
B
•• ~ ...
I •••
•• ..
.. ..
. -.
. -
..
--
. -
-.
'iah
t T
op
""-1
iItl
l1ll
inr'
f.Ja
IL~

-' ,
. ."
A
trrH
OR
SO
UR
CE
LO
CA
LIt
y
No.
o
f fi
sh
To
tal
No.
C
OD
-EN
D
MET
HO
D
HA
ULS
5E
LE
CT
IOlI
in
sele
c-
of
fish
A
v.
wei
gh
t (k
g)
of
Sp
ee
d
Mea
n 50
%
DA
TE
N
o.
Ave
rage
o
f M
esh
_.h le
ng
th
tio
n
ran
ge
stu
die
d
Fis
h
ilyca
tch
D
ivis
ion
D
e-pt
h M
at.e
rial
R
Te
x R
unna
ge
Facto
r R
ange
D
ura
tio
n
'ow
g
aug
e si
ze
(-)
(.)
C
on
st.
g/1
0o
o .
)
(m/k
g)
(-)
Cod
-C
over
C
ed
-C
ed
-C
ed
-(m
in)
(kn
ots
) (m
m)
,nd
an
d 'n
d
Cov
er
,nd
C
ov
er
,;~
60-
VI
Cav
'r a
,c<,
;;.0
19
65
Tw
iste
d
Ch
at'
r •
CBS
14.4
40
' 3
.7
1 , ... ,
I ..
" ! 'n
.. I ""
.. ..
.. C
ov
erD
..
.. "
Ch
af,
r 6
.. 17
.6 4
44
3 ••
12
3916
34
75
7633
13
94
:~"!
i I ••• i~
3~0-
X
70
1967
..
4700
13
3 ..
2 24
0 ..
10
.5 4
10
3.7
10
7 50
• 32
3 10
97
375
--
.n.
• n .
... .,
•
Tv
,. B
Ar~
ICN
AF
I'
ICE
S
lIt-
. v~
No.
o
f fi
sh
To
tal
No.
A
l7E
OR
SO
CReE
L
OC
AL
ITY
C
OD
-EN
D
ME
THO
D
HA
DLS
S
EL
EC
nO:,
. in
sele
c-
of
fish
A
v.
;, .. eig.~t
(;':g
) o
f S
peed
M
ean
50
' D
AT
E
No.
A
vera
ge
of
Mes
h m
o,b
len
gth
t.
ion
ra
ng
e stu
die
d
Fis
h
_ L
vcatc
h
Div
isio
n
Dep
th
Mat
eria
l R
Tex
R
unna
ge
Du
rat.
ion
,ow
g
aug
e si
ze
(-)
Fac
tor!
Ran
ge
Ii C
ed
-(.
) C
an
st.
g/lO
OO
m
) (I
II/k
g)
(mm
) :
(mrn
) I C
od-
Cov
er
Cod
-C
ed-
Cc
C:lV
e'
(min
) (k
no
ts)
end
end
end
:",
'
"no
ICE
S
VT
I-V
lI
I"""'E
I.
,.,
8R..-
\..'ID
T 19
56
lIb
19
56
Pla
ited
21
0 eo
ver
5
kg
07
400
3.7
.0
I,
,,
I" ..
I,,
,"
.. "
.. "
" "
" 6
" 32
4
'0
3.7
11
5 70
3 51
4 55
56
.45
.. 19
63
.. 38
0 "
n o-i
.~ 00
41
0 3
••
H.
,,.
I,.,
i .n
..
'!EST
OR'
F'F
'''8
IC
NA
F : ,
~~~;
D
oubl
e 2
'"
" 4
:~ I
",
I "n
1
4.0
11
50
I,M
. '0
'.
I ,.,
. 1
m
" "
" "
" I
'SO
"
" 11
2.
1,00
1
'-9
I .
. ,
I ...
I .
....
I ..
..
I IC
ES
,5-V
III
" I.
,.
I ...
. . .,.
IC
ES
19
64
IIb
11
0 19
59
Pla
ited
19
1 4
60
3.5
-4.
122
53
. 4
.4
70
.. :
" "
·~~s
" ..
I ,,"
" I,
1
M
',M h~
I, •
1.
0 [, ..
,.6
11
11
53
. 1
00
-n
O)
, (7
48
' 1
"4"
I "'0
on
n ..
.. ..
110
" "
210
.. 1
36
02
355
3.5
,
I ..
.. "
100-
" "0
"
2'0
"
I.n
,n
o
I "n
I,
•
I on
'00<
,
" I
".c
;CE
S ·~
o v;
., .
,no
" I •
c
I"n
.n
n C
ES
••
1131
0\
".5
1
I (8
0\
20
IeN
AF
,.
0-
XI-
XII
r-
"""'
tinu
o'"
440
. , 11
4 , .
••
,«.
I ... .,
1 ...
« ,,
. , "
.n
'n<
BO
HL
1967
C
1
8 ,
220
1965
39
62
252
" 8
65
4.4
C
BS
1
25
.4
, Ie
NA
F
.0-
XII
I,
"
c. '"
"7
1
m
,.,.
«n
• o
n I,
....
.. "
i 16
7 d
1 D
11
0 19
65
" 50
00
200
" ,r.
,,. "O
? .,
1'00
,.
7
.. ..
" ..
" "
.. "
" I .
. .
" 45
2 42
3 I,,
,,
1,0
. ,"
00 I
AO
n In
• 0
<
" ..
" "
" "
" "
" 1
7S
4.6
"
12
2.3
421
3
.4
.7
, .. I"
, . ".
«.
.. .. ..
" "
.. "
" "
" "
I 7S
4
.6
.. 1
22
.2 14
01
13
.3
1,0
3
252
214
.30
37
4 lO
BO
24
0 13
5 15
I~~!
~ d
.. "
" "
" ..
" ..
I"
, "
'"
I, ,.
I.
, 3
.,
355
1447
86
1 O
M "'.
' .•
n
'-'
. ,.
h
T
Po
lish
Typ
e C~fer
wit
h M
esh
Siz
e X4
C
od e
nd M
esh
Siz
, P
oli
s yp
e C
haf
er w
ith
Mes
h S
ize
Xl
Cod
end
Mes
h S
ize·
cSp
rin
g
Loa
ded
Gau
ge
Su
bse
qu
entl
y C
alib
rate
d
to
ICE
S;
d IC
NA
F C
haf
er l
27.5
-mm
Mes
h;

T
LL
L
, C
Oll
l::\
.llu
ea./
o
No.
o
f fi
sh
AU
THO
R
SOU
RC
E LO
CA
LITY
C
OD
-EN
D
MET
HO
D
HA
ULS
SE
LEC
TIO
N
in s
ele
c-
Sp
eed
M
ean
50%
DA
TE
No.
o
f M
esh
me.
b le
ng
th
tio
n
ran
ge
Ave
rage
F
act
or
Ran
ge
Div
isio
n
Dep
th
Ma
teri
al
R T
ex
R
unna
ge
Du
rati
on
to
w
ga
ug
e siz
e
(mm
) (.
) C
on
st,
g/
lOaO
m}
(m/k
g)
(om
) C
od-
Cov
er
(min
) (k
no
ts)
(om
) en
d
-'O
R'-
"" ,
~~
'~n
I ~!!
, ...
.ll!!!
lL ~
C=
or
, 75
4
.3
ICE
S '2
2.
412
.4
.li
'"
" m
;CN
AF
lO~ ....
" ~
l2.s2
.. "
7 "
An
"
h"
A" ll.i
'll
.<l
.. .7
"
" "
" L2
oo.
r.
, ,n
<
• n
" iu
•. a
.436
7
73
6 ,n
" "
" "
" ..
" ~:
; a
, on
4
.n
" h,
. /4
01
1
."
" "
" •
" "
" "
" •
« ru
.. --
--'J
.'L
h ,"
I (
313
I (4
181
1968
~~
12
0-I~~
Co
ver
7 73
'.
0
il22.
.l ---
"', .
10
'9 1
1112
"
U6 2
21
"
j06
2
252
" 3,0
.5.
114
Gi.O
UPE
D
DA
tA A
LREA
DY
TA
BULA
TED
BY
SI
NG
LE
H
AULS
IN
PR
ECED
ING
TA.
BI.E
.
Rnm
. ,o
n7
~~
'~n
~!!,
1~~~01 •
'nn
n
,nn
r.
"
, 41
3 1
3.4
1
.4
,7.
" ..
b
" "
" "
" "
" "
=~
2 75
_4
.3
" 1
22
2 -.
ill.
i.J
..4
1.5
'
7n
,
~ollsh T
ype
Ch
afer
wit
h M
esh
Siz
e X
2 C
oden
d M
esh
Siz
e;
DIC
NA
F C
haf
er 127.5-~ M
esh.
To
tal
No.
o
f fi
sh
stu
die
d
Cod
-en
d
on
. ."
,.<0
7."
.,.
."
'301
10
54
26"
,n
• .• 7
0
".
,,,,
m.
Av.
w
eigh
t (k
g)
of
Fis
h
By
catc
h
Cod
-C
over
C
od-
Co
ver
end
eod
."
'" lJ
i.<L
cID
.
ill.o
. Ls
D.
1'-9
0 41
0 il
ls
1,6
0
"n
n
n I
,.n
5'0
17
0 27
5 45
_
' <
10
'6
n I,
..
22
_
.. ..I ,
". I"
n 1.<
"" "
n '".
I .n
~ ~
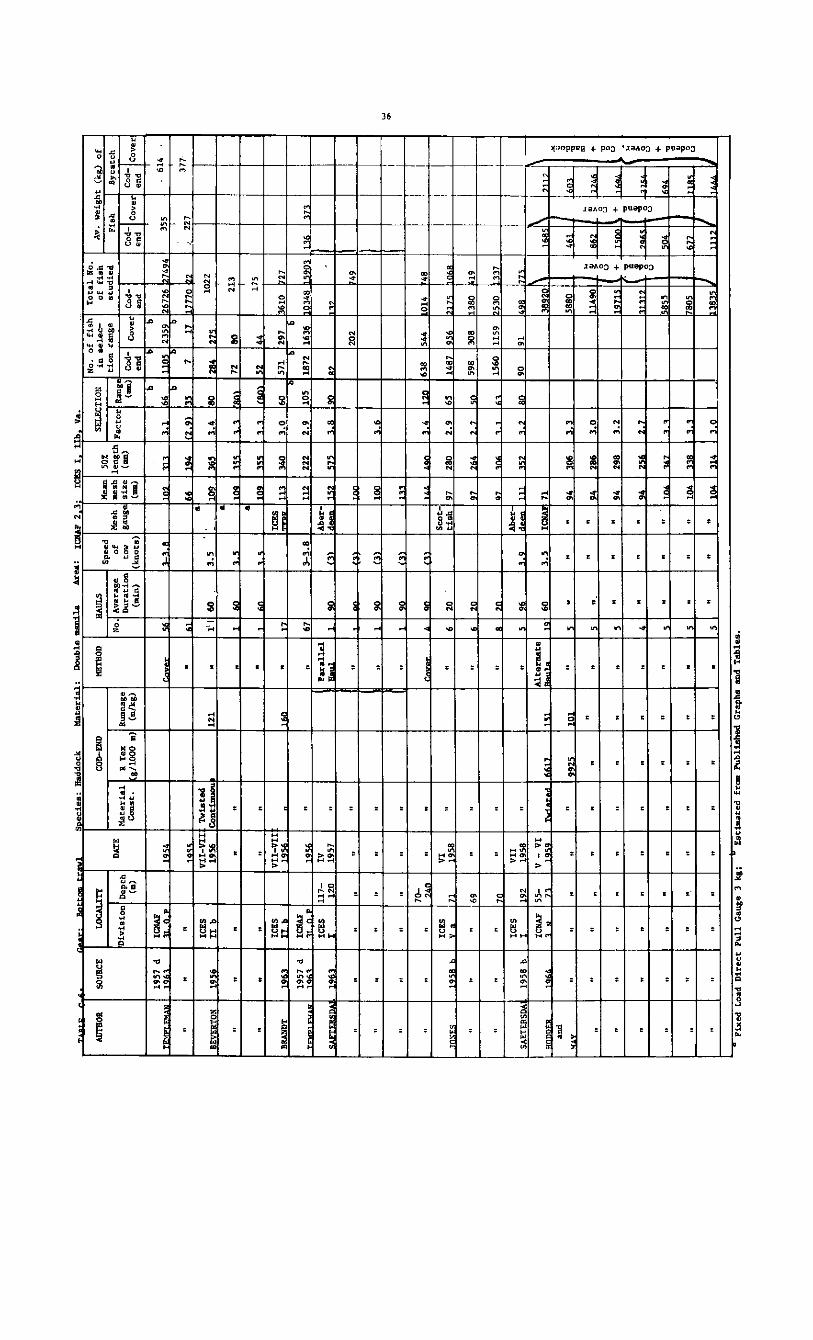
. ..
-, S
pecie
s:
Had
doc
k
Mat
eria
l:
Dou
.ble
1II8
ll1.la
A
rea:
IC
RA
!' 2
3-
ICE
S
I II
b
V ••
No.
o
f fi
sh
To
tal
Ro.
A
IlTB
OI
SOU
RC
E LO
CA
LITY
C
OD
-EN
D
HET
l!OD
II
AllL
S
Me
=
SEl.E
CT
ION
10
aele
c-
of
fis
h
Av.
w
eig
ht
(kg)
o
f S
pee
d
50%
D
ATE
N
o .
Ave
rage
o
f M
e., _.h
len
gth
el
an
.ra
nge
st
ud
ied
F
ish
.8
yca
tch
F
act
or
"= ••
D
ivis
ion
D
epth
M
ate
ria
l R
Tex
R
un
nag
e D
ura
tio
n t~
gau
ge
siZ
e (-)
(-)
Cod
-C
od-
Ca
d_
C
od-
(.)
C
on
st.
a/W
OO
WI)
(m/k
g)
(min
) (k
no
ts)
(..
)
Cov
er
end
C
ove
d C
over
en
d
end
en
~:~;
d
b b
b
~~.
,."
r,
'" I '-, .•
l,
n,
'" '.
1
66
lin
, 2
35
. ,.,
,, ".
,.
355
614
" "
D
,,' '7
77
n
377
.. '0
"
" "
.. ll.
K
liM).
W
7 "
.. 22
7
~E:
VII
-VII
T
wt.
ted
•
....
....
nN
195 •
19
56
Con
t1D
UD
U
12
1
.. 1'
1 6
0
3.5
l.
D!t
36
5 3
.4
80
I",
1022
.
a ..
.. "
.. "
" 1
60
' '
.5
'00
'"
"
on,
72
80
21
3
• "
.. "
.. "
" -'-
i .l
Oi.
~S5
,., 1
'.0
' 52
I ..
115
BRA
.'WT
19 ..
i,"'!
V!!;
~I
1,00
..
.17
1
= L
=-
340
3.0
60
57
1 29
7 bo
,o
Z1
b b
~~~;
d
~~~.
'0
'"
.. "
67
3-3
.8
112
222
2.9
1
05
18
72
1636
03
48 b
.o,
1%
I,
,,
iCES
11
7-
IV
=Ue1
I=-
, .. , 12
0 19
57
" 1
. 90
_
ill.
L
=.
575
3.8
19
0 I.,
..
" "
" "
.. "
.. lI
. 20
2 49
I
" "
.. "
" "
.. 1
90
(J)
1,0
0
3.6
" "
" "
" "
.. 1
90
(J)
l.tn
i
" ..
.. 7~
" ..
.. ~
, .. 12
0 63
8 54
4 0
1'
.8
i !CE
S V
I S
cot.
-i
! m
",
,." ,
17
1 19
58
.. ..
6 20
ti
sh
97
28
0 2
.9
65
11
4"'
10
..
"" 'n
••
" "
" 69
"
" "
• 20
97
, ..
2.,
I,
n
598
308
380
19
" "
.. I,
n
" "
.. •
'n
I.,
,no
,. ,
" 15
60
1159
53
0 33
7
ICE
S V
II
I~er
. .. ,
In,
1-
SA
ET
ER
S""
19
58 b
I
192
1958
"
.. ,
.. I
.•.•
1
m
...J.>
2.
" I,
n
90
91
• n
nn
..
'06
• ~C
NAF
5~
Vt;",
:I .....
... .-1
,,1
7
'"
Al~~
rnat
e
" 6
0
3.5
"_ n
i ... ,n
IR
"
I" "
a
nd
~
0
• .v
"
.. "
.. ..
1.9
25
1
,0,
.. 5
. ..
.. 30
6 58
80
40
1
li.o.
L 0
9 •
3.3
~
~ •
.. ..
.. "
" =
"
.. ..
.. ..
.. ..
.. 5
.. .-
286
3.0
11
490
~ .. ,
• ~
+
>
0 0
~
u u
0 ..
.. "
.. ..
.. ..
.. ..
5 ..
.. ..
94
298
3.2
',m
, +
: '
''''
+
J.ld
&.
u
.~
~
.: 0
D
~ "
.. ..
.. ..
.. ..
.. ..
I.-
256
2.7
"
• -!l
p .....
..
.. "
~
0
° °
u u
u ..
.. ..
.. 5
" ..
.. ..
.. ..
.. ..
-"l4
2.
....
L.3
. ~8
55
' 5
04
I •
••
+ ~
0 • ..
.. ..
" ..
.. ..
.. "
.. 10
4 " .
,.,
: .n
I""
~
" 5
.. 80
5 0 u
" "
.. ..
.. "
.. ..
.. 5
.. ..
.. ~
....3
li.
...3.
.JL
3835
!
m
" .
Fix
ed
Loa
d D
irec
t P
ull
Gau
ge
3 k
g.
Est
imat
ed
fram
P
ub
lish
ed G
raph
s an
d ta
ble
s.

NO
. o
f fi
sh
T
ota
l N
o.
AL'
tHO
R
SOU
R.CE
LO
CA
LITY
C
OD
-EN
D
MET
HO
D I
HA
ULS
S
peed
N
o.1
Ave
rage
I
of
Du
rati
on
t.o
w
(min
) (k
no
ts)
Mea
n
....
h 1_
.' ga
uge
siz
e
(a)
50%
le
ng
th
(mm
)
SEL
EC
TIO
N
in s
e1
ec-
of
fish
(k
g)
of
'Div
isio
n I D
epth
(m
)
DATE
H
at.
eri
al
Co
nst
. R
Tel
l: I Ru
nnag
e 8
/10
00
.)
(m/k
g)
_~:ti:
o~n~r_
..
~.~e
~~~'
~t~U
~d:'
:'=d
~+-_
_ ~~~~~~~~C-i
Facto
r! R
angl
lll
(IIII
D)
Co
d-
end
. " I ~
.. a
I., • .,
IC
ES
VI
/~
IAu.
In
" I.
/_
. I.
4
1.,.1.
.1
3 90
28
6 3
.2
I'1.Hl
Inc:
.
" 2
Ian
294
3.3
lU
ll
I '[I.'
"''''''
'' ..
.. :1
. lO
W'
I ~:
~!"
" I
a ..
-,.
I ...
~ I~
~~~t
el ...
. I £
n
L_._
I ft.
I
1. ...
ru.l1
k • .,
I .... ",n
1'""
I"
I"
I" I
" I
" I"
I"
I
" 15
I"
I" I
" I JQ
·I360
113
I
I I
~1lO0
II . ~
291 II
I-_74 n
" ..
..
..
Of
Of
1;1
" ". 5
"
""
l1.....
1..
b"A7o
; '" ~
" II
....
" "
" "
..
5 II
It
..
1
08
,[.3
40
l3
...2
h.7
1..1U
1 ~ U ~
" II
II
"
II
" "
..
II
15
"
..
It
,10&
..l...3
it.a
l1...2
_ 15
3050
:ta
i ~
II
i..
II
II ""
In
'''
" "
..
11
0
1171
=1
11_6
. I.
?.tc
:.n
0 •
U
SAE.
!£R
SO.U
.1
1960
!RE~!V
1!l
':'Q
5A!T
ERSD
AL
1960
"
ICE
S
I, 1
48
-V
III
I T
wis
ted
1
! 1
60
1
96
0
Ico
nti
nu
olJ
I .!C
ES
ICE
S
I
10
0- , .. 1
50
-'7
0
I Hn
120-
20
0
16
0-
'.5
10
0-
.«
I ,Q
6Q
VII
I 19
60
Tw
iste
d
I nr
C:f
"'.I
/
ICE
S I
III
to".,
T
1,:.
n 1
"'
ICE
S 1
96
5
ICE
S
V.
III-
IV
1962
V 1962
" I
a ...
-.,
I .
...
I A?
71
I ..
.
125
125
125
125
lSO
151
r"
It
" ....
'11.",
I ••
"moo
eo.a
r
Cov
er
a C
haf
er
I~~.
b
I~:~
a
I.
I • 2
.0
4 /,
I '.6
102
10
90
/.
~
/ , ~
/,_
..
/,
I <
A
13
15
6
4 1
48
1'3'
11..0;
(31
I,,,,,
1/':1.'
I, .. ,
3.5
4.0
" .•
, I .
••
..
1 .••
1.-
I ..
11.'''
''' t;:
"".r
-k::m
113
1. 5
1390
3
.0
...
.00
I ... ;n
.:.J J.
.IU
I l'il
t. Ln
n 65
5 15
22
1121
8 tB
70
13
1. 6
14."
I.
. 10
I ?
?6
. l.,
nR
1c:.':I.
. ~o
o
I .. a..
11
..':',.
leA"
~/ .... "
, ~r
-ee
n
1130
.314
20
I .n'7
11.1
n 2
.0
3.2
1 bo '1
UI0
; 1
41
7
h7'\~
~7A.
I ~n..C
. I "'
'till
2.3
6.
I'U
. 11
., b1
.1Jl
1.-
.1 ..
. I.
/'n
21
7 13
1
." '0
0
I ••
A I ..
......
I ....
l..~
I ...
.n
1.,,,.,
k1
1. ~.?
'7
~C!S
CI 1
26
14
24
3.
4 1
0
lOA
n III
IRn
b?~.
, L
.. .,.
~CES
••
310
3.2
4
0)
I<:n
Ic;
n b"
' .....
b ... <.
t
L, ':'1
'.0
. /.ull
~~
}j~
l~ 1
!l
'-:::1
1.
~
" ~ • , .~
2+-
J
I H1
I,
I «
/,
n
" 1
o.
I ","
1,_
" t
, ..
14
0
160
50
1
50
I'
IV'I
'l
,n
3+
Il
a--I)
----
c M
ulU
flap
C
hafe
r;
Do
ub
le
Cod
end
10
5 _
_ M
esh
; G
auge
C
ali
bra
ted
wit
h
ICE
S G
ause
.
~ =

'.
.. J.
I NO:-
of
".b
T
ota
l N
o.
Av.
v
eh
bt
( •• l
of
AlIT
IIO.
SOUR
CE
!.oc
.u.r
rY
CO
D-E
ND
M
ETIIO
D
HA
ULS
~
SE
LE
CT
lOII
in s
ele
c-
of
fish
S
pee
d
50%
ti
an
ra
nge
st
ud
ied
F
i.h
B
yca
tch
D
ATE
I '(.j.:i
N
o.1
Av
er.
ge
of
Me.
h F~t ..
-(;j
' H
ate
ria
l ~g
~l~
til)
In to
w
Ig·ug
, .iz
e
(.,;
;)
(,;;;
; ~:
-'
Co
ver
• ;;:-
g C
ov
., ~
Co
nst
. (.i
.)
(mm
)
Ii ~~ ..
I ~""!
" 15 ;
' I ~.~
"l
;-;-
3.0
! ..... I!I
·~ 'o
n, I!H
,. ..
"".t
'" 1
,,2
5
101
R;;
ili
!. 6
0
13.5
IlC
IW 11
04
31.
""'
1~59
I ~
~~
I~~.
Tr
ia,'"
• '3
2 1,
02
'"
I :
,m
"-~
<
I". -~
, .•
n 26
I~
F,!.
-.~
~
, ... I I
ClW
' .....
.... I •
• n
151
H_
...
I.
AO
-, I ,
.....I
70
h ...
..
i ...
, 1-
=
II! ~:~
... .
• •
· •
1,,
25
10
1 0
I,
An
.5
0
1,5
34
0 I .
..
h •••
• I .
. "
I I"
,.
I •• "
I ,
n,
0 .
n I .
. , 7
7n
• ,_
.. I .
. !
... "
" ·
n n
0 0
J "
" "
• •
n 0
.~
, .. ,.
I ....
. I
" ••
7
7'"
I
" n
" n
" ·
n n
n n
" I ,~
, .. , .
1..
_
.... , .
".,
:~
§ ~
I
ICE
S
19
••
n I"
, Ie
__
I.
·
.. ,
Ian
hSA
h
.n
I""
I ,.
I ,.
'"'-
I".
" "
" ...
n "
• <
'"
..
I.,
I.
n
I ..
I ...
'OA'
I iC
ES
1200
1
19
5.
I"" .
....
11
2,
n 15
60
I.,
lOB
1339
13
.2
182
141
48
1491
13
82
~~;~
I ~~
E~ I ~!
!. I T
w1
.tad
I~
:~ b
• I.n
'"
I ..
, ,
I ,n,
I.
"
,,-,
". 14
M
I,.'
17
n I .
. a
" "
" "
" n
" I,
5
0
1,_
, ".
1390
13
.3
170
" ..
I.m
Hno
n ..
I'.'
;~
18
i.
I ~0A
n I "
''"to
d I 8
271
1,2
1
I ... "
,.
I"
60
13
.,
I lCl
lA '
B7
112 •
• 5,
I .n ..
.n
~
0 ~
.nd
.. " 1
,01
I,
O
. 13
24
13
.'
I ...
...
~
" n
n n
n I 'n~ ~
• ",y
"
. l
r : •
" "
n "
" "
.",
'"
· I,
n
n n
.. 1120
3
.'
~"nn
I ",n
'.
n.
~ ,
) :
~
" "
n "
" "
" "
'II
n ,
· n
•• 13
12
3.3
'._n
..
I ,., •
• 1!
.,
.. ~ •
~ ~
>
" "
" n
, n
100
134,
3
.2
'.n,.
I n
o. ~
:3 "
" ·
" ·
+ ~
" "
" .
. n
, "
. •
109
1338
3
.1
'nn
. I "
"
.00.
c "
" ·
• -~ c
lrellD
ER
.. " ,'n
8~
~ ; .
. n
-~ ...
.m
'"
·
<
An
I,
,
. ,n
o 1
m
u l..
nn
I •••
• I e
n"
u
Jo.'S
SON
lO
BO
!C!,
~O
· 3
• 67
25
0 '3
.8
: .. , '"
,n
w"n
w
" ·
· ·
I,
· 10
4 13
59
3.5
n ..
I .n
" .
· ·
• •
" n
n 1
_-
_ C
'70
I.,
" "
· ·
· '"
I,",
i
, ,
".
.. "
" ·
· ·
· ....
... •
b F
ixed
Loa
d
Din
ct
Pu
ll G
auge
3
kg
; F
lap
Typ
e C
haf
er;

.m.
~
AIJ
TII
Oi
SOU
RCE
I.OC
ALl
TY
CO
D-E
IID
..,.
.00
B
AU
tS
Spee
d
!»td
S1
oe
DA
n
No.
Ave
rage
of
Mes
h D
epth
K
ate
ria
l IT
ex
.....
.... D
ut'a
tion
ga
uge
,ow
(0
) Co
ns,.
&/1
000
11.)
(II/
kg
) (o
in)
(kn
ots
)
1.-
,_. !C
D
~~.
Tw·-·~
11<,
"'-..
I,
" 4 .•
y
",-
,
.. ..
.. ·
.. I"
, ·
I.
n 4
n
•
.. ·
• ·
.. I ,
,,
· I.
..
A
• ..
.. ·
• •
. I,
.,
.. I.
"
• •
•
.. ·
.. ,,.
!!
..
.. I ....
I,.,
·
I.
~
, .
.. ..
.. ..
I ...
..
.. .. "
1"
.. I.
M
4
n
• .
.. ..
':!!.
. I,
M
.. I.
A
n
• <
I~
~ 71
)-"'
r ..
.. ·
1SO
..
.. 61
35
163
.. 16
83
4
.0
d ...
.. ..
.. I,
...
I,o
n
.. I.
..
• •
.. 8
3-
.. ..
· 14
7 ..
.. 15
1 ..
11
60
3
.S
ICD
.. ..
.. ..
.. I".
· A
n
• •
..
" ..
.. I~
;~I
.. 1,0
;0 ..
112
6.
J.,
..
.. "
.. ~!
!~
.. I .
..
• ..
~
• •
.. IC
D
1~~
~ ... I,m
. ~
· . 8O
LDtI!
19
66 d
I
.. ..
n;p
v
, ... !C!
1AF
I ...
...
. ..
,no
"
.. • •
..
Gau
ce C
alib
rate
d w
ith
IC
ES C
auce
; P
ress
ure
Gau
ge D
Ot
Ca
lib
rate
d w
ith
IC
ES
Gau
ge.'
..... 50%
SE
LE
CT
ION
.... le
ng
th F
act
or
Ran
ze
size
(-)
(ma)
(o
m)
I,.,
I, ..
... ,
1".1
\ ~ .. ,
I '" I .
. ,
11
. kn
I, ..
I ..
. I,
,
bn
... ,,
. k
4
~ .. , ...
• I ,
,, ...
11
, I,
n
I n.
11«
I, n
h
M'
"'7
.7 4
22
3.1
lu
o
I",
, .. I •
•
h~
I ",
'An
h
.<
Inn
I ,,,
h ..
I, ,
b.
I ".
<n
, 11
.6
bo
I ".
,~
I, •
",
.n.
,,,
I. n
I .
.
No.
o
f fi
sh
To
tal
No.
in
ael
ec-
of
ftah
ti
on
ran
ge
stu
die
d
Cod
-C
over
C
od
-~d
~d
I,.
I,.
"0
2
258
100
I ••
"08
3
184
A4
n I.~
, ... 5
1'
180
1"0
8A
< ,.,
. I •
••
I .. ,
.• I
....
160
180
1492
17
67
390
I01n
I,,,
. " ..
.-33
60
'93
0
5967
57
51
3'"
I ...
1"
'07
I ...
' ... I .
...
. .. 27
0 32
0 86
1 10
69
840
8'0
I •
• "
I ...
.
,. ..
I •••
1517
11
57
1259
1 84
46
Av.
w
eig
ht
(lur
) o
f
Fis
h
Byu
,tch
Co
d-
Cod
-C
ove
C
o_
r e
nd
e
.d
825
192
1818
'3
8
1750
49
3
I" ..
I ..
. "5 !--
" I.
"
... • ~ !--
~ •
674
177
~+-
I.,.
, .• I
...
n.
14
5'
8 ••
I ...
n I"
. u ~

..... .,
. ea
ar,
....
~
"W,
IIad
do
ek
Dou
ble
Po
lyp
rop
yle
ne
Are
a:
ICE
S I.
Va
•
No.
o
f fi
sh
To
tal
No
. A
v.
""'g
h,
(ko
) o
f ..,.,
.,. SO
URCE
L
OC
llIT
t C
OI>
-EN
D
MEn
lOD
H
AIlL
S
50
. SE
LE
CT
Im.
in s
ele
c-
of
fish
S
pee
d
I:::e .. ~
Fish
'y
oate
h
DATE
u
_
_.
I No.
Av
era
ge
o
f _
.h
len
gth
I Fa«
or
(..;
;)
eio
n r
ange
st
ud
ied
D
epth
~.~
: T~
.J
Run
nage
D
ura
tio
n I(k
!:.)
siz.
e (o
m)
Co
d-
Co
m
Co
d-
Co
d-I C
ov
., c.
;;;:
(.)
C
onst
. (I
ll/k
g)
I Co
ver
(m
in)
(om
) eo
d
eod
en
d
end
me~
.~.
, 12~
;! ..
. e
nvO
Y
• 1&
0-12
0 1
3.0
I IC
ES
11
4,
.. , b .•
'0
' ••
."
...
".
1966
" I ~
oo
~!.,
'.n
< ~,.
· .. I,
'"
· I,
. ".
13.
3 17
0 ,.
, I,
,.
I,m
"0
. ,.
. I "
n
.. ..
· · ~
.. ..
.. ·
, leo
·
l25
.0
(38
0)
1(3.
0) I (6
0)
'An
""
.. , I.
" Io
n.
I ; .,.
1m
.. ·
. ..
.. ..
.. ,
I ..
.. ". .. m
", I" 4
\ I"
.,
'm I,
•• ,
I .. ,
I""
I ..
. .n
I"
,.n
I <e
. , .. , I
,m
,
" ..
" ·
.. ..
.. .
.. ·
• •
A
I""
I,.,
I. ,.
...
.. I
"nn
I ...
,
.. ..
· ·
.. ..
.. ..
· ,
I ..
· '2
4.1
4
00
13
.2
I.,
I ".
h ••
I ...
I,
..
,
~!!,
•
I"" h
,.n
I ",.~
,ne'
T
,on
.. ;;;
:;;:
, I~"n
I ,
• ..
I us
, .. •
••
w.n
,.
0<
,..5.
~c:s
I·;
;~;
I., .
... ,
.00
c=
_ , 1
,20
i 3
.5
1114
38
5 1
13 ••
?
170
? I"
...
i .
.. ·
.. ..
,no
.. · "
n
, .
I H'
380
13 .•
lao
I,
.. ~"
:p
!. 1
'.5
~'
!"
172
~!!5
.. 24
81
403
.. 1
Ito
I 3.5
I,
,,,
1111
40
2 13
••
I ••
'40
\"
I,
..
h ..
i I
.. ..
· 1
0;6
..
.. ..
.. ..
1 I ..
. ..
1111
.1
1
13.7
1.
1 I .
..
he?
I.on
I,.,
,
-, .
· 1
01
..
. -
.. •
I"n
..
I ...
'"
•
.-I ..
. ..
,."
· -
,nn
•
"n
.. I .
. ,
,.."
I,.
Inn
"
~,
I ..
. ..
" ..
.. ..
1 11
20
" ..
I H'
"'"
.. IA
n I ?
S.
h"
4~ ~ .. I ~
~t~~-
"'n
"
.. , ,
10
14 ...
,."
,nn
I
, II
Yl.
I!II
1
9 ••
r-..
.. ,,.
4 ..
. .4
In
.. "0
~!
<e
.. ,
" ,,
. ~~. .~
"n
, I.~
11
." I o
nn 7
11
25
. I
I I
. ·
· ..
· •
75
3.25
W
127.'
46
0 3 •
• 11
18
I (19
8) I (
15
.)
7.4
41
. I
.,;'
;'
.. -
.. •
" '.
2<
,o
7.4
""
. , H
•
I (41)
t42
l 1.
5.
1[28
.. e
_
••••
· 2~
~ ~!
!.
'n •
;:;:;;
: . , ,
. n.
.,
Tro
e w
4
e'
, n
"
I ..
In<
... 'no
~~
... , · ~
~ ... ".
n
" "
I ..
I ,
, ..
.,.
"n
; ,
I ..
1274
l51
5 Im
o
I,,,
.
um
>ta
L
· ,,,
~!
.,
"-,
en
I •
•
.n.
nn
..
I,n
I ,
••
b,n
",.
'o
w
" "
17
6
0
" ,0
&. ,
la
o
". '0
' 11
3.
l..
" .. he
n
Dou
ble
Cod
elld
.: K
u.:
1la
Q,a
fer;
P
o11s
h T
ype
Ch
afe
r:
Mes
b S
ue T
wic
e th
at
of
Cod
ead
.

GRO
UPED
D
A'l'A
ALR
EAD
Y
TABD
LATE
D
BY
SIN
GL
E
HA
ULS
IN
P
UC
ED
ING
TA
BLE
TABL
E C
-7
(co
nti
nu
ed)
No.
o
f fi
sh
To
tal
No.
A
v.
wei
gnt
(kg)
o
f AL
THO
R so
rRC
E
LOCA
LITY
C
OD
-EN
D
MET
HO
D
HA
UlS
SE
L£C
TIO
i; in
sele
c-
of
fish
S
pee
d
Mea
n 50
%
tio
n
ran
ge
stu
die
d
D.u
E
No.
A
vera
ge
of
....
h _
sh
le
ng
th
Fis
h
Byc
atch
F
acto
r R
ange
D
iv1a
ion
D
epth
M
ate
ria
l R
Tex
It
unna
ge
Du
rati
on
tow
ga
uge
sl:.
r.e
( ... ) (0
) C
oast
. S/
lOoo
m)
(m/k
g)
( .. ) (o
m)
Cod
-C
over
C
od-
eO<!
-C
over
C
od-
Cov
er
(min
) (k
no
ts)
end
.n
d
eod
end
! i
I IC
ES
vn
C
onti
nu
o "'
2
! "'H
L 19
67 e
V
•
70
1964
P
lait
ed
490S
20
4 C
ove
r 4
60
ICBS
12
4.'
40
8 3
.3
79
328
''''
•••
I,,"
,"
,
I I
! I
i
!,
i I
! , I ,
! j
, I
I I
I
I !
I , ;:;
i
I I
II I
I I
, I
i I
, ,
! i
I I
i I
I I
I :
I , I
, I
,
I i
I !
i I
! I i
! I
, i
! I
I I
I \
I
I I
I
I i
i !

nA
,.
C_
Gea
r:
Bo
tto
m
traw
l S
pecie
s:
Had
do
ck
Ha
teri
al:
D
oubl
e P
olve
tbvl
eue
Are
a:
ICE
S I.
No.
o
f fi
sh
To
tal
No.
A
l1H
OR
. S
(\UR
CE
LO
CALI
TY
CO
D-E
ND
M
ETR
OO
H
AU
LS
SEL
EC
TIQ
I, in
sele
c-
of
fish
A
vo
wei
gh
t (k
g)
of
Sp
eed
.....
50%
ti
on
ra
ng
e st
ud
ied
D
ATE
N
o.
Ave
rage
o
f ..
.. h
lDes
h le
ng
th
Fis
h
8y
catc
h
Div
isio
n
Fa
cto
r R
ange
D
epth
M
ate
ria
l RT~
Run
nage
D
ura
tio
n
,ow
ga
ug
e sb
:e
(-)
(-)
Cad
-C
ad-
Cod
-C
od-
(.)
C
oo
st.
g/1
00
0
1ft)
(III
/kg
) (o
m)
Cov
er
Cov
er
Co
ve
(la
in)
(kn
ots
) en
d en
d
end
en
d
ICES
15
>-
~!!.
,.
,
~
••
,., I
.. ,
I •
• ,
I ...
T
IC
ES
121
391
3.2
8
3
III
~~ a
" lQ
64
" 25
0 19
63
~
~4
" 14
4 29
3 2
••
12
. (3
09
I '2
28
' .3
3
282
i I
i I
! I
, I !
I I I
, I
I
a D
oub
le C
odeD
d.

-IA
!Il.
F..
...<:
r.
•
Bo
t-tO
Il
tra
wl
Sp
ecie
s:
Had
dock
M
ate
ria
l:
Dou
ble
Pol
yest
er
Atm
lOR
SO
URCE
L
OC
AL
ITY
C
OD
-EN
D
MET
HO
D
IIAIlL
S
DA
TE
No.
A
ver
ag
e D
iviS
ion
D
epth
M
ate
ria
l R
Tex
R
un
nag
e D
ura
tio
n
(0)
Co
ast
. S
/10
00
III)
(a
t/k
g)
(min
)
'0<
0
;CES
1~~~
r;
~~
~
r.
on
14
5-
" "
" 17
0 "
136
" 4
90
a T
ota
l C
atch
.
Are
a:
ICE
S I.
Sp
eed
M
ea.
50%
SE
LE
CT
IOIl
of
Mes
h m
esh
len
gth
F
act
or
Ra
ng
e
t~
gau
ge siz
e
(-)
(mm
) (-)
(kn
ots
)
I",
Ab
er-
,n7
-'
5lL
3
.3
50
(3)
" 10
6.
372
3.5
60
No.
o
f fi
sh
To
tal
No.
in
sele
c-
of
fish
ti
oD.
ran
ge
stu
die
d
Co
d-
Cov
er
Cod
-~d
en
d
1711
1<
7
6 1
'01
6
'·
324
Av.
w
eig
ht
(kg)
o
f
Fis
h
By
catc
h
Cod
-C
over
C
od-
Cov
er:
en
d
en
d
I
I 57
0' I 2
00 a
I
I I I !
I
~
~
0,
• R
, R
, •
R"~,.,,,.L-
. n,
""
ON
..
. ,..
. ".
,,,,
A
trrH
OR
SO
URCE
L
OC
AL
ITY
C
OD
-EN
D
ME
THO
D
HA
ULS
S
pee
d
Mea
n 50
%
S£LECTIo!~
DA
TE
No
. A
vera
ge
of
Mes
h _
sh
le
ng
th
Div
isio
n
Dep
th
Ma
teri
al
R T
ex
. R
unna
ge
Fa
cto
r R
ange
C
on
st.
Du
rati
on
tOR
g
au
ge
size
(-)
(-)
(.)
g/
lOO
O
m.)
(m/k
g)
(min
) (k
no
ts)
(om
)
"a
;CE
S
15
0-
\"
(3)
Ah
er-
.8
250
260
e,
n Q
/l.
de .
.
140
540
90
~DC
1968
"
150
1959
"
182
" 6
90
3.5
10
3 39
1 3
.8
81
. "
" "
200
1960
"
" "
4 70
3
.5
102
371
3.7
74
. IC
ES
1965
.. IC
ES
148
~.6.2
3311
30
2 5
<n
I. n
IC
ES
18.
321
--"
" "
.6
SO
ICES
IC
ES
1965
V
a
300
1962
"
182
" 5
80
3.5
12
1 43
6 .6
11
0
" "
" '0
0
" "
" "
, _0
3
.5
'"'
,,-. ,
• n
" "
" '0
0
" "
" "
, A
S 1
.S
m
."
• w
n
300
" "
" "
" "
" 3
85
3.5
12
2 44
0 .6
80
" "
" 30
0 "
" "
" ,
.n
I, ,
",
s~:;
ov
ICN
AF
1968
2
250
1963
"
" "
8 80
3
.5
98
353
.6
98
ICN
AF
429
I ST
RZY
ZEW
S 19
67
lM-4
w
1965
"
" 5
113.
8
91
c •
Bat
S-e
cies
: ~ck.
D,.
Ole
['ol~"""'~.!c
'!':"
,a
B
Are
il;
ICE
S Ir
"
Va.
IC
ES
Vll
-VIl
B
RA
ND
T 1
96
3
IIb
19
56
210
Cov
er
5 IC
ES
107
330
3.1
90
" "
" "
380
" 1
1
104
350
3.4
70
ICES
V
I B
OH
L 19
67 e
V
. 80
19
64
ontl
nu
ou
4760
21
0 "
8 11
6 n
s
479
3.6
84
vII
" "
" 70
1'
1li4
"
" "
" 1
60
32
4
456
3.4
10
4
n "
" "
" "
" .
" "
. .1.
,n
"" '"
•
a •
ICES
V
I-V
II
" 19
66 R
V
a
70
1964
"
5000
20
0 "
7 55
2
4.1
43
8 3
.5
76
~~ a
" n
" "
" "
" n
• 57
11
24.2
40
0 3
.2
74
Cov
erD
n "
" "
" "
" "
Ch
afer
8
58
12
3.9
38
7 3
.1
105
GlQ
UPE
D D
AD
AlJ
lEA
DY
T
AB
TIT
.I..
ttD
BY
SI
BGJ.
..! l
WJL
S II
I PB
EC
ED
IlfG
TA
BLE
BOHL
1
96
7 e I
VII
19
64 ~t
inUO
wf
ait
ed
a M
ult
i-fl
ap
Ch
afer
; b
IcN
u C
hafe
r(C
erm
an versio~
4760
2
10
C
over
No.
o
f fi
sh
To
tal
No.
in
sele
c-
of
fish
A
vo
wei
gh
t (k
g)
of
tio
n
ran
ge
stu
die
d
Fis
h
By
catc
h
Ced
-C
ed-
Ced
-C
od-
Cov
er
Cov
e C
over
en
d en
d eo
d RO
d
181
13
506
420
., ."
55
2 41
2
200
60
37
012
100
Iso
1210
m
300
00
Z89
1 " ..
130
110
" .. "a
9S
8 11
31
54
'" T
n
"" I.
" 30
3 70
12
61
983
182,
1
,0"
I_J -
f
211
127
I".
75
211
242
110
1145
"" ."
I""
1563
,a
n
'"
1,45
11
0
230
182
517
384
700
240
1390
86
5
166
167
415
315
700
250
965
415
1'4
0
1,02
6 I"
., 1
,.1
0 I,
.,
,,,
." I
,,,
I RIO
<4
, 1
,,,,
I"
.,
1,.
0
'00
'"
I",
1635
16
77
5213
29
16
515
140
320
665
391
lzoo

TABL
E _
11
. O
. .
"""
" "
s,
ies:
&ed
f1.s
h
Mat
eria
l: ~ u
ble
Man
ila
Are
a:
AUTH
OR
SOU
RC
E L
OC
AL
ITY
C
OD
-EN
D
MET
HOD
HA
ULS
S
pee
d
DATE
N
o o
Av
era
ge
of
Div
isio
n
Dep
th
Ma
teri
al
RT
ex
Ru
nn
age
(m)
Co
nst
. D
ura
tio
n t~
g/lO
OO
m)
(til
/kg)
(m
in)
(kn
ots
)
;~~~
a
;;"'"
~o"
Tv
iate
d
1.2
C
o •
30
h
.B
VI
" "
" 19
54
., "
" 4
" "
ICN
AF
V-V
II
" "
,. 0
•
'05
5
" Z
5'
. 10
"
" IC
ES
II
SAE
IER
SDA
l 1
96
) 1
1.
190
1956
"
" 1
'0
(3)
" "
~CES
'~
~ ~ ..
" "
1 12
0 (3
)
~~~~
a
ICN
AF
Y9~6
m~'n ...
,. n
0 "
I.'
" i
17
30
13 ••
ICN
AF
~~~
" "
,. "
,n,
" ,.
'n
I,
n
BR.-\
).'DT
19
60
~CNA
F "
" 16
0 "
5 60
iCES
X
I ... ,
246
1956
"
" 1
105
(3)
" ..
. n
;CE
S '~
~ ~~
!~
" '"
.,~
, on
"
" "
" 2n
o "
" 12
5 "
1 .0
m
IC
ES
390-
VII
"
8300
12
0 "
, 7
. --'
-IC
ES
TRES
HEV
19
66 a
I
350
... , "
'"
" •
on
I "
TRES
CHEV
'0
.' "
. 35
0 "
" "
" 8
'0
3.2
Ro
eR!J!
EV
" "
" "
" 19
61
" 35
0 6
'0
" "
" 1
>0
"
" "
" 6
'0
,
.. ..
" 35
0 ..
.. "
" 6
'0
" IC
ES
IRE
SCH
EV
19
66
T
350
" ..
153
.. 6
,0
"
rCF
<
".,
;CES
,.,
~~
.,
" 66
23
15
1
" 6
60
4.0
" ..
" 17
9 "
" "
" 8
60
4.0
" "
.. ,.,
.
.. "
.. ,
60
140
.. "
.. l~
~ ~!
!?
" .'
" ,.,
"
" ,n
o ,.n
.. "
" 3~
~ 3
0
" "
.30
0
120
" 10
17
4 4
.0
ICES
IX
"
ICES
1
96
5
V.
1962
"
151
, 78
3
.0
ICE
S , ...
, ,n
n , .. ,
" 0
' ,n
n c.
,
•• 3
.5
, --
a C
ali
bra
ted
to
IC
ES.
lCN
AF
.3,
ICE
S T
TT •
. N.
y N
o.
of
fish
T
ot.
al
No.
SE
LE
CT
lOlI
in
sele
c-
of
fish
He~
50
' M
esh
_.h
le
ng
th
tio
n
ran
ge
stu
die
d
Fa
cto
r ~ge
ga
ug
e siz
e
( .. ) (0
0)
Cad
-C
ad-
(00
) C
over
e
nd
e
nd
"".,
'"'
l.2ot
. 2
.7
.7
i.on
n '~n
. 9
9.1
'6
' '.
7
5'
40
160
" 6
6.4
14
1 '.
1
., 8
6'.
.,
n
Abe
r-d
e ..
144
440
3.1
(1
00)
.3
LO
. o
. "0
" 14
4 40
5 , ..
'0
39
5.
" '"
IICN
AF
111
",
2.6
88
46
06 , ...
" l..
.zsL
2.5
8
' ,n
,,'
'.'00
'" 31
0 '.
4
85
495
57
4980
1
49
8
Ab
er-
de .. 1
144
I 3S
O
'.6
14
5 60
1 .5
41
'"0
" ,"
.n
, --'
--"-
--"'
l -.
53L
,,,
'.0.
"'"
" 11
2 I
383
I 2
.'
.0
'0' '"
0'
Wes
t-b
••
Ion,
. ".,
n£
L
41
. L3
BI.. ~
,so.
15
57
116
,., 2
.5
100
1185
46
6 79
50
4'2
116
313
'.7
10
3 lli
._
I "n
.. , "
,n
11
'.
352
2.'
11
1 1
64
5
1274
.1
1
546
lu.
358
3.0
10
8 5
4.
301
37
00
130.
i 38
0 ,.,
67
1
5'0
13
06
.00
, .•.
130.
3
.3
,.,
78
1203
I,n
I".
C ...
1=
-li
Z.
--'lo
B.
...2.
.2.
--"'-
40
40
., 6
" 12
7 '7
5
,.,
160
22SO
20
00
4"
b,,
,
" 1
3'
36
. I
, ••
15
0 50
0 83
0 57
5 '8
A
ber
I,o
n,
""n
, ... ".
I
, .•
,.
2
2683
,.
6,
" 14
9.
46
. 3
.1
1(14
8 I (
, .. ,
m
n
, •.. I '
0'.
ICE
S 1
0.
350
3.'
50
20
'0
1'2
.0
230
2.5
9
Z
'0<
Av.
w
eig
ht
(kg)
o
f
F:l
ah
By
cs
tct\
Cod
-C
od-
d C
ov
ec
Cov
er
en
e
nd
.50
270
3.0
350
120 ,
I i
t , ,
,
I !
I."
,.n
' ..
. +
I
I I
I ,
I
I I
! I , !
i I
410
137
m
I ",
552
30
'
I o<
n I ,,
, ..
" , ...
I ",
,"
I H
n
595
,.5
i
~
~
~ • u ~ ~ ?

TA ...
-"
. Ik
u,
,~~
S~tia8,
ReM
'"'
..... "
, ' .. •
•
II ... ',
TO
F.'
V.
AL"I
'HOR
SO
URCE
. LO
CA
LITY
N
o.
of
fish
T
ota
l N
o.
CO
D-E
ND
M
ETH
OD
H
AU
LS
SEL
EC
TIO
fl in
sele
c-
of
fish
A
v.
wei
gh
t (k
g)
of
Sp
eed
Me~
50%
'Div
isio
n
DA
TE.
No.
A
vera
ge
of
Mes
h _
sh
le
ng
th
tio
n
ran
ge
stu
die
d
Fis
h
By
cs
teh
D
epth
M
ate
ria
l O
Tex
O
un
nag
. su
. ( ... )
Fa
cto
r R
an,
Du
rati
on
,~
gau
ge
(m)
Co
nst
. g
/lO
OO
III)
(m
/kg)
("')
C
od-
Cov
er
Cod
-C
od-
Cod
-(m
in)
(kn
ota
) ("')
C
ove
r d
Cov
er
~d
.nd
.n
d
.n
ICE
S
, •• 5
ICE
S
101
~!.2
To
tal
V
""
"" Le
ov.r
, '"
14
.0
ICl!
S I •
• n
, 7
70
on
, "'.
U
. 47
5 15
6 C
atc
h
ICR
AF
V
III
T!l£
SCJ!
tv
19 ..
3M
4
'"
, •• 2
,.,. ",M
..
7 70
•
'07
, ..
7 17
876 . ...
i
.. ..
.. ..
.. ..
.50
0
.. 8
.. ..
'0'
27
8
.7
12
85
0'
2104
1
50
'0
8104
"""
~~ ~
~~VI
..
, m
..
U4
32
7 12 •
• ..
21
21
....
I IC
ES
~!
i ~~:
' T
ota
l l..
Icrs
. 1
0M
."
-T
wia
ted
,.,
, ..
13
.5
li8
37
8 3
.,
110
>1.0
4J
O
1680
4
7.
, .. '''
' ,
Cat
ch
~ ~
IV-V
I ~~:
I 19
67
i065
3 IC
ES
10
1.
12
0
•• 5
0
40
10
'in
17
~~
i~
3:;
~61
Co
ver
e 17~
I I
1968
75
00
13
' ..
45
7
J ,
~
Ch
•••
,
.""4
, n
o,
'"
0 ,.,
14
69
,
r ...
ro
Bot
tOB
l trav~peci .. :.
-Ked
fia
h--
Ha
t.er1
al:
---Doubl,e...Polyaaide-Type.....B--Araa~CES
XlV
__
__
IC
ES
I I
, ,
I B
IWID
! 1
96
0
XIV
1
95
7
" ..
"0
,
•• 12
1 ,
.. 1
1
60
420
.3
! i
: ..
.. ..
95
165
,
I IC
ES
I~~~
7
"" 13
.1
: 1
".
I,M
. ,
.. ..
!. ".
, !C
ES
34
0-
VII
W
est-
253
I 450
"0
'0
BO
Hl
i196
2 a
b X
IV
430
1961
C
on
tin
uo
47
60
21
. C
ove
r 1
75
4.2
,f
f
BO
. 4
07
.,
(m
(1
20) I
(15
6)
27
. •
" ..
1 0
0
4.2
..
III
,.,
2.'
1(
115
1(2
09
) 1(
221)
44
6 25
. I .
'0 ',
,,
',no
I •
I '.
\ "
, ..
.. ..
.. ..
.. ..
.. ,
00
1
4.'
..
III
,.,
.. '0
' I,
••
'4'
'"
17"
, ,
1 450
I "
, ..
.. ..
.. ..
.. ..
.. 1
'"-
i 4
0
.. ""
''''
' ••
'.3
) (1
48)
(87
) 76
,.
5
.40
13
5 I
• !
I "
.. ..
.. ..
.. ..
.. ..
1 90
4
.0
30
340
• 6
, ?
? ,.
0
I'"
I "" '
.0
." I
I 1
90
4.2
"
.. ..
.. ..
.. ..
.. ..
13
0.
340
I •.•
, ?
, ••
'57
99
0 21
5 75
40
" 1
90
4.'
..
13
1.
340
2 ••
'SO
' (2
58
) 1(
146)
~0
1O
'" :
''''0
'"
.M
" "
.. ..
.. ..
.. ..
.. ..
1 90
4
.2
.. 1
3l.
m
• ••
'B8'
(3
42
) (2
13
) 30
0 36
0 15
40
305
50
5
! ~
" ..
'"
<27
.) 1
(16
ll b
••
I,,,
,.<
n ""
~,
.. ..
.. ..
.. ..
.. ..
.. 1
.. ..
i ..
,~
.. ..
40
80
, ..
.. ,
40
4
.2
.. 11
3 •.
,.,
.. (.
5·
fl3
8l
fl1
8\ .. ,
,.,
<
&0
"'
•
" ..
.. ..
.. ..
" 1
90
4.2
..
13
8.
390
2.8
90
, ..
, .. "4
I"
. R
IO
I,M
1
<0
b,
.. ..
.. ..
.. ..
.. ..
.. 1
90
4.'
..
13
8.
375
2.7
?
, 4
' , ..
".n
I,n
, ,~
+
• M
od
ifie
d
IOlA
F
Ch
afe
r;
n P
oli
sh T
ype
Ch
afer
, M
esh
X4
Cod
ead
Mes
b.
c P
oli
sh C
ha
fer.
Has
h X
2 C
od
end
Mes
h.
..... 1
, (e
oat.
:lD
uadJ
, G
ur
t Bot.~ tr
awl
_'b
dfi
o.
Ka
teri
al:
:D
oubl
e Po
lo,. .... r
ne •
.A
r ...
: IC
BS
Va,
XlV
.
No.
o
f fU
b
To
tal
Ro.
A
v.
'IN.i&
bt
(ka
) o
f .....
.. SO
UIC
E LO
CA
LIT'
C
OO
II-I!I
ID
1IET
Il0D
II
AII
LS
..... SO
. SE
LEC
TIO
II J.
n .. le
e-
of
fUb
B
peR
ti
OD
r ...
........
"' ... 1 .
..
o.\
l'I!
Ro.
A_
rag
e o
f -M
Ob
la
o<
h F
ac:t
or
.....
Bye
at.c
h
DIIp
tb
_.rUl
IT
.. _.
Du
rati
oa
... .-..
.. <,.)
<-
> C
od-
Co
d-
Cod
-<->
eo
a. ••
./
10
00
->
<-tks
) <,
.) ..
... r
C
od-
ea. ••
eo
...
<->
(kn
ota
) o
ed
oed
....
• ••
IIOJI
L I~ •
.• 1=
.....
I~,
6111
1.
... ,
OIl
•••
~~t
I". -=
. C7
-'
,.
,
66
..... I"
" .7
0
75
+
...
.'
" .
" .
n n
.. ..,
•
'"
... ,a.
, 26
21
I'"
no
... '''
A ...
'.M
+
:
11O!
:"lh. ~
VII
=
. -
,on
1961
A
n""
... 0
-,
on ~
Lu •. ~5
.1.6
I,
... ,
.~
.. , lO
ll !
] ...
'M '"
• •
• •
• •
• •
• ,
an
... "
~ .. .. ,
I. ..
n.
un
.,.
., i
, •• "~
..
· •
· ~
• ·
50
00
2
00
•
, ..
•••
" ~ ...
... !.
' I,
n,'
(37
2) 1
1543
1 IS
O
646
59
' 66
5 ,..,
+
• ·
• •
• •
· •
· I
... '.
2
• '4
4
U5
I •
.•
.. I,. .. ,
•••
I ...
I •
••
I •••
L.
, ,.
· "
" ..
· •
• •
• "
Z.,
, ...
. ~ ...
+
" ..
" "
" "
" "
" 1
on ~
" Iw
.J! ~ .l.'
. .1
.137
I, .
. "
I",.
" '1<
6 ..
loon
I."
~M
" ·
· "
.. •
" "
• ..
, A
D
•••
• ..
.. 0
., 'n
A'
Bll
' 1'6
45'
"4
' .. ' 1
.. «
I.~ ,~
+
ICE
S 19
65
ICE
S .....
. ~.
:=
160
.. I" ••
, I"
M2
,,,,,
• •
2SO
• 47
60
210
· "
1110
'.
n
" .. , ..
!.'
.. , &
An
I~
" "
.. •
z:;
· •
""'"
2nD
..
7 1
l1.
...i
.Jl
• ..
... I"
"" 12
22
1742
19
12
' " ..
3.5
1
.50
1,
,5 ~
GBC
IJPBD
.D
lU A
J..B
.UD
Y
TA
W A
TIP
BY
JlI
D.I
B6U
LS D
f P
UC
ED
IS '
DlI
LE
t
No.
o
f n
ah
T
oeal
No.
A
!lTB
OR
SO
UR
CE
LOC
ALI
TT
00
II-'
"
IIETI
lOD
IIA
IILS
50
• SE
LECT
ION
in s
ale
c-
of
fbh
A
v.
wei
ght
(kg)
o
f S
ped
.....
ci
on
ra
na
e .....
... o
.\l'I
! R
o. A
ver .
. _
of
1Iu
. ...
b 1
enlt
h F
act
or .....
F
ish
B
ycae
ch
Div
isio
n D
epth
M
ate
ria
l B
Tex
_0
Dur
at.io
D
...... si
z.
<,.)
tow
<-
) C
od-
Cod
-C
ad-
Cad
-<.)
C
ooo<
. 1
/10
00
.)
<"'kg
> <
... >
""
"or
Co
v ••
Cov
er
<-)
(k
not
s)
.nd
eo
d .o
d
•• d
ICE
S 3'
JO-
VII
F-
tiouo
W
I~
••••
I ...
. I!
OH
L 19
61
%IV
'3
0
1961
P
lait
.ed
47
60
210
0,
" ••
A.
'"
'" I •
•
... I,
n.
2495
93
5 19
0 13
05
25
" 1
"2
n
'90
n
" 40
..
245
• _B
11
5. 4
.2
· n
. ,,
, 12
.7
,,,,
",. I
, ...
l'A
ll 1.
" ,n
oo
.An
Inn
"
,. .. ~
F-.io
uoW
<
Mn
,.
. •
7R
• •
"
" •
· ·
.. A
..
I ••
... 2S
S3
'11
0
3302
31
12
7SO
510
190
+
, ,
I
Ca
lib
rat.
ed A
gain
st.
ICE
S.
48
PART D
CONCLUSIONS AND RECOMMENDATIONS
Conclusions
The Working Group accepted that the minimum mesh size of codends made from different materials should be determined in accordance with the principle" of equivalent selectivity.
The selectivity equivalent of a given material is defined here to be the ratio of the average selection factor for that material to the average selection factor for double manila. The basic data available to the Working Group for the calculation"of average selection factors were those listed in Tables C-l to C-12.
Although the Group agreed that more work is needed on this problem, it decided to separate the selection factors in the tables of selectivity results for cod and haddock into two groups, those in which the polyamide used had an elongation of greater than 25% and those which had a lower elongation. The former was called polyamide A and the latter polyamide B. The division was made on the basis of the results given in Part A of this report, and it was necessary to assume for this purpose that the polyamide used was produced in the country conducting the experiment. This breakdown is shown in the tables of selectivity data (Tables C-l to C-12).
The Working Group spent some time considering the most appropriate-method of evaluating the average for each material. Besides the methods described in Parts B and C of this report, two other types of average were considered, namely the unweighted mean and the mean weighted by the number of hauls corresponding to each selection factor. The Working Group decided to use all four methods, and accordingly four mean values were calculated for each material. These mean values are listed in Table D-l, where it will be seen that, in general, they are in close agreement.
The selectivity equivalents for each material, obtained from the results shown in Table D-l, are given in Table D-2.
Unweighted selection factors for the experiments used are given in the form of a frequency distribution in Table D-3.
The Working Group discussed the selection results in relation to the physical properties of the various twines. It considered that there might be a relationship between elongation and selection factor and it noted that in the case of polyamide there is a wide range in elongation as defined i4 Part I of this report.
Recommendations
The selectivity equivalents for mesh sizes of trawls made from different materials obtained as a result of the analysis of selectivity data and of the tests of the physical properties of trawl twines and mentioned in the conclusions are recommended to be introduced in the Conventions for the North-East and Northwest Atlantic Fisheries in place of the present rules for establishing mesh sizes of trawls made from synthetic materials, insofar as the Commissions consider these groupings enforceable.
The Working Group recommends that for all future selectivity experiments the following information about the codend material used should be tabulated:
TWINE DATA
* a. Material
* b. Type of fibre
* c. Construction
* d. Rtex
* e. Rumage
f. Treat ...... t
g. Wet flexibility
* h. Wet weaver-knot breaking load
i. Wet load elongation curve
.* j. Wet breaking lengths (baaad on
dry IMW.iJ!ll _
NET DATA
a. Method of manufacture
b. Treat_nt ,
49
Chemical nature
Hulti-filament, mono-filament, staple fibre, film (- split fibre)
Twisted, plaited
(m/kg)
Untreated, thermo-fixed, chemically treated, etc.
(a) during breaking load test, (b) after some repeet loadings
Hand or machine made (knotted, knotleas, sinale or double braided)
Untreated, thermo-fixed, chemically treated. ,etc.
c. Wet _h sbe uaina ICES ... ah sause
* d. Wet _h breaking load
e. Wet load elonsation curve (a) during breaking load test, (b) lifter some_ repeat 10lldinas
These tests lire proposed in the present state of knowledge. The list is not exclusive and should be supplemented by other teata as and when they bacome-available.
Tests marked with an IIsteriak (*) should be·carried-ont-according to· ISO standards.
The following laboratories sre prepared to undertake theae teats, free of charge, for those institutions which do not have the necaasary facilities,
tnstitut fUr Fangtechnik, Haaburg (Germany), Palmaille 9 (marked to the attention of Prof. A. von ,randt);
Laboratorium voor Hateriaal Onderzoek THO, IJmuiden (marked to the attention of Dr J. Reuter).
A sample of 100-. twine (minimu.) and a piece of netting measuring 20 meshes by 20 meshes should be sent. To facilitate receipt it ia ebsolutely esaential that the customs declaration should be marked '~ Coe.ercial Value".
As far as other dete are concerned, the WOrking Group recommended that the modified ICNAF form of tabulation used in.thia report should be adopted.
Because manila is no lonler used coe.ercially and becauae it is not readily available, the Working Group reco ... nda that a new standard material be introduced.
The standard netting yarn choa.a ia made of PA-fibres and is manufactured by Apeldoornse Nettenfabriek in Apeldoorn, Netherlanda. It is a twisted trawl yarn with the designation 3/500. The following list indicate. the properties'

Designation
Twist direction
mlkg
Diameter
Twist level
Breaking load (dry)
Breaking load (wet)
Knot breaking load (wet)
Breaking length (dry)
Breaking length (wet)
1/2 knot breaking length
50
Extension (1/2 knot breaking load, wet),
R 6484 tex
Z
154 mlkg (= 77 yards/lb)
2.87 mm
185 approximately
355 kp'approxlmately
315 kp
299 kp
54.9 km
48.6 km
23.1 km
23.8%
The factory mentioned above offers this PA standard netting yarn for 7.75 hfl (cif) in bunches of 2.2 kg. Customers are asked to order quantities of not less than 50 kg.
To ensure the uniformity of the Properties on the one hand and to avoid deterioration during storage on the other, the factory intends·to produce the netting yarn in quantities of 300 kg at a time.
If the relevant committees of ICES and ICNAF agree to adopt the new standard net yarn, the Working Group recommends that the committees take steps to determine whether a standard netting can also be manufactured, and, if so, that it be introduced for selectivity experiments.
The Working Group recommends that further work is needed to determine the relationship between elongation and selection factors.

Tab
le D
-l.
Mea
n se
lecti
on
fa
cto
rs.
Cod
H
addo
ck
Red
fish
(l)
(2
) (3
) (4
) M
ean
(l)
(2
) (3
) (4
) M
ean
(l)
(2
) (3
) (4
) M
ean
Dou
ble
man
ila
3.5
2
3.4
8
3.4
5
3.4
2
3.4
7
3.2
6
3.1
6
3.0
9
3.2
2
3.1
8
2.7
1
2.6
2
2.6
4
2.6
2
2.6
5
Dou
ble
po
lyet
hy
len
e 3
.43
3
.42
3
.37
3
.41
3
.41
3
.20
3
.20
3
.20
3
.20
3
.20
Dou
ble
po
lyp
rop
yle
ne
3.7
4
3.7
0
3.6
0
3.6
3
3.6
7
3.4
8
3.4
5
3.4
2
3.4
5
3.4
5
Do~b1e p
oly
est
er
3.9
5
3.9
5
3.9
5
3.9
5
3.9
5
3.4
0
3.4
0
3.4
2
3.3
9
3.4
0
Dou
ble
poly
amid
e (A
+ B
) 3
.92
4
.00
4
.02
3
.89
3
.96
3
.59
3
.66
3
.62
3
.63
3
.63
Dou
ble
poly
amid
e A
4
.09
4
.09
4
.03
4
.07
4
.07
3
.67
3
.86
3
.73
3
.67
3
.73
en
D
oubl
e po
lyam
ide
B
3.6
6
3.6
6
3.5
7
3.6
3
3.6
3
3.4
0
3.3
3
3.5
1
3.4
0
3.4
1
2.9
2
2.9
5
2.8
4
2.8
7
2.9
0
>-'
(1)
-un
wei
ghte
d m
ean;
(2)
-w
eig
hte
d b
y nu
mbe
r o
f h
auls
on
ly;
(3)
-w
eig
hte
d b
y m
etho
d d
escr
ibed
in
Part
C;
(4)
= w
eig
hte
d b
y m
etho
d d
escr
ibed
in
Part
B.
52
Table D-2. Characteristics of different net materials and equivalents.
Characteristics of material Egui valenta
Percentage elongation at the load of the half knot
Material breaking load Cod Haddock Meao
Double manila 6.5- 7.8 1.00 1.00
Double polyethylene 8.4-22.2 (1) 0.97 0.98 (2) 0.98 1.01 (3) 0.98 1.04 (4) 1.00 0.99
Mean 0.98 1.00 0.99
Double polypropylene 10.4-21. 3 (1) 1.06 1.07 (2) 1.06 1.09 (3) 1.04 1.11 (4) 1.06 1.07
Mean 1.06 1.08 1.07
Double polyester 8.3-12.3 (1) 1.12 1.04 (2) 1.14 1.08 (3) 1.14 1.11 (4). 1.15 1.05
Mean 1.14 1.07 1.10
Double polyamide 15.5-47.0 (1) 1.11 1.10 (2) 1.15 1.16 (3) 1.17 1.17 (4) 1.14 1.13
Mean 1.14 1.14 1.14
Double polyamide A >25.0 (1) 1.16 1.13 (2) 1.18 1.22 (3) 1.17 1.21 (4) 1.19 1.14
Mean 1.18 1.18 1.18
Double polyamide B ~ 25.0 (1) 1.04 1.04 (2) 1.05 1.05 (3) 1.03 1.14 (4) 1.06 1.06
Mean 1.04 1.07 1.06
(1) • unweighted mean;
(2) = weighted by number of hauls only;
(3) = weighted by method described in Part C;
(4) = weighted by method described in Part B.

53
Table D-3. Frequency distributions of unweighted selection factors for cod, haddock, and redfish.
Cod Haddock Redfish S.F. Manila 1'1' PE PES PA Manila 1'1' PE PES fA Manila PA
2.1 1 2.2 2
2.3 a 2.4 1
2.5 3 2.6 3 1
2.7 1 3 4 2.8 3 a 2 1
2.9 3 4 5 2 3.0 2 5 2 a 3.1 2 3 1 2 2 3.2 2 3 1 7 1 1 a 1 a 3.3 4 5 1 11 2 1 a 1 3.4 15 a 2 1 6 6 a 2 a 3.5 7 4 1 5 6 1 1 3 1 3.6 7 1 a 2 2 3 5
3.7 6 1 a 3 1 2 1 3.8 8 1 1 4 1 1 3 3.9 a a 1 2 a 4.0 5 3 1 5 1 4.1 3 3 2 4.2 a 4 4 4.3 2 1 2 4.4 1 3
Total 69 27 6 2 33 47 16 1 2 16 25 12

54
ANON., 1957. International Fisheries Convention 1946. Report of the ad hoc Committee established at the Fourth Meeting of the Permanent Commission,:September 1955. J. Cons., 23: 7-37.
ANCELLIN, J. 1956. Rescherches sur la Selectivite des chaluts pour la P~che de la Sale du Merlan et du Merlu. Revue Trav. Inst. (scient. tech.) P~ch. Marit., 20: 295-319.
1962 S61ectivit6 des chaluts a langoustines'(Nephrops norvegicus (L). I.C.E.S. C.M. 1962, Spec. Meet. on Crustacea, Doc. 7 (mimeo.).
ANCELLIN, M.P. and and nylon. Sci. Meet.
P. DESBROSSES. 1957. The selective action of nets made of manila, hemp Spec. Publ. into Comm. Northw. Atlant. Fish., No.5, p. 8, also Joint
ICNAF/ICES/FAO, Lisbon, Doc. S11 (mimeo.).
ANNANIASSEN, O. and A. HYLEN. 1967., Preliminary report of selectivity experiments with Danish seine. I.C.E.S. C.M. 1967. Gear and Behav. Cttee, Doc. B9 (mimeo,).
BARNES, H. and T.B. BAGENAL, 1951. A statistical study of variability in catches obtained by short repested trawls taken over an inshore ground. J. mar, bioI. Ass. U.K., 29:649-660
BEDFOHD, B.C. and B.W. JONES. 1960. Mesh selection experiments on whiting in the Irish Sea. I.C.E,S, C.M, 1960. Comp, Fish. Cttee, Doc. 58 (mimeo.).
BEVERTON, R.J.H. 1956. Mesh selection of cod (North Sea and Arctic) and haddock (Arctic). I.C.E.S. C.M. 1956. Camp. Fish. Cttee, Doc. 74 (mimeo,).
1958. A possible effect of design of Cover on cod-end selectivity tests for North Ses cod. I,C.E.S. C,M. 1958. Camp. Fish. Cttee, Doc. 113 (mimeo.).
1959. The selectivity of a modified form of topside chafer. Compo Fish. Cttee, Doc, 117 (mimeo.).
1963. Escape of fish through different parts of a cod-end, Northw. At1ant. Fish" No, 5, p, 9-11, also Joint Sci, Meet. 1957, Doc. S14 (mimeo,).
I.C.E.S. C.M. 1959.
Spec. Publ, int. Comm. ICNAF/ICES/FAO, Lisbon,
1964. Fish. Fish.
The selectivity of a flap-type topside chafer. into Comm. Northw. At1ant, Redbook 1964, Part III: 132-139, also Annu. Meet. into Carom, Northw. Atlant. 1964, DoC. 67 (mimeo,).
BEVERTON, R.J.H. and A.R. MANGETTS. 1956. Effects of cod-end meshes on the working characters of trawls. I.C,E.S, C.M. 1956. Camp, Fish. Cttee, Doc. 37 (mimeo.).
1963. The effect of cod-end mesh si~e on certain working characteristics of trawls. Spec. Publ. into Comm, Northw. Atlant, Fish., No.5, p. 12-17.
BEVERTON, R.J.H., B.B. PARRISH, and G.C. TROUT. 1959. Progress Report on trials of topside chafer. Annu. Proc. into Comm. Northw. Atlant. Fish., 9: 86-87.
BLACKER, R.W. 1968. Tests of a large-meshed topside chafer. I.C.E,S. Coop. Res. Rep. Ser. B, 1967, 17-21 (also I.C.E.S. C.M. 1966. Compo Fish. Cttee, Doc. F2 (mimeD.).
BOEREMA, L.K. 1956. Some experiments on factors influencing mesh selection in trawls. J. Cons., 175-191, also I.C.E.S. C.M. 1954, Compo Fish. Cttee, Doc. Unnumbered (mimeD.).
1957. Note on the influence of towing speed on trawl catches. Joint Scient. Meet. ICNAF/ICES/FAO, Lisbon, 1957. Doc. E13 (mimeo.).
1958. Mesh experiments. I.C.E.S. C.M. 1958. Compo Fish. Cttee, Doc. 58 (mimeo.).
BOHL, H. 1960a. Erste deutsche Selektionsversuche mit einer Dorsch-Scherzeese in der west lichen Ostsee. Protok. 'Fisch-Technik, 6: 366-386.
55
BOHL, H. 1960b. Note on the influence of net design on selectivity of trawls. I.C.E.S. C.M. 1960. Compo Fish. Cttee, Doc. 162 (mimeo).
1961. German mesh selection experiments on redfish 1961. I.C.E.S. C.M. 1961. Compo Fish. Cttee, Doc. 88 (mimeo).
1962s. German Research Report, 1961. C. Mesh selection experiments on redfish. into Comm. Northw. Atlant. Fish. Redbook 1962, Part 11:66-68.
1962b. Untersuchungen Gber die Se1ektivitat von Grundsch1eppnetzen in der Rotbarschifischerei unter Ostgronland. Protok. FischTechnik, 8: 34-47.
1963a. Weitere Untersuchungen Uber die Selektivitat der Gerne1enkurren von der nordfriesischen Kuste. Protok. FischTechnik, 8: 231-251.
1963b. Further investigationa on the selectivity of beam trawls in the German shrimp fishery. I.C.E.S. C.M. 1963. Comp. Fish. Cttee, Doc. 55 (mimeo).
1964a. Selektionadaten fur KIiesche und Scholle aus Schleppnetzexperimenten im Seegebiet von Helgoland. Protok. FischTechnik, 8: 304-356.
1966a. Preliminary results from selection experiments with polypropylene cod-ends and topside chafers. I.C.E.S. Coop. Res. Rep. Ser. B, 1965, p. 137-142, also I.C.E.S. C.M. 1964. Compo Fish. Cttee, Doc. 149 (mimeo.).
1966b Escape of herring, haddock and whiting through the cod-end meshes of a herring bottom trawl. I.C.E.S. coop. Res. Rep. Ser. B, 1965, p. 101-116, also I.C.E.S. C.M. 1964. Compo Fish. Cttee, Doc. 4 (mimeo).
1966c. Investigations on the selection of ded and plaice by the cod-end meshes of flatfish trawls. I.C.E.S. Coop. Res. Rep. Ber. B, 1965, p. 117-136, slso I.C.E.S. C.M. 1964. Compo Fish. Cttee, Doc. 5 (mimeo).
1966d Selectivity of herring in bottom trswls. I.C.E.S. Coop. Res. Rep. Ser. B, 1963, p. 38-46, aleo I.C.E.S. C.M. 1962. Compo Fieh. Cttee, Doc. 74 (mimeo).
1967a Selection of cod by bottom trawl cod-ends in southwest Greenland wetere. into Comm. Northw. At1ent. Fieh. Redbook 1967, Part 111:75-81, also Annu. Meet. into Comm. Northw. Atlant. Fish., 1967, Doc. 31 (mimeo).
1967b. Selection experiments with a large-meshed topside chefer. Ibid:82-89, aleo Ibid Doc. 32 (mimeo).
1967c. Selection of cod by bottom trsw1 cod-ends on Store Hel1efiske Bsnk. Ibid: 97-104, elso Annu. Meet. into Comm. Northw. Atlant. Fieh. 1966, Doc. 67 (MimeD).
1967d, Recent selection experiments with the approvedI.C.N.A.F. topside chafer. Ibid: 105-111, also Ibid: Doc. 15 (mimeo).
1967e. Comparative selection experimente with polypropylene and polyamide cod-ends. Ibid: 85-92, also Annu. Meet. into Comm. Northw. Atlant. Fish. 1965, Doc. 31 (mimeo).
1967f. The effect of the approved I.C.N.A.F. topside chafer on cod-end selectivity. Ibid: 122-131, also Annu. Meet. into eomm. Northw. Atlant. Fish. 1966, Doc. 29 (MimeD).
1968. Preliminary results of German mesh selection experiments on cod off Bear Island. I.e.E.S. e.M. 1968. Gear and Behav. ettee, Doc. B 15 (mimeo).
1969. Trawl meeh selection experiments on cod (Gadue morhus··L.) Off Beer Islend. Ber. Dt. Wies. Komm. Meeresforsch., N.F. 20: 84-90.

BOHL, H., and R. KOURA. 1962a. (Crangon vulgaris Fabr.) Doc. 43 (mimeo.).
56
Mesh selection experiments with beam trawls on shrimps off the German coast. I.C.E.S. C.M. 1962. Compo Fish. Cttee.
1962b. Selektionsversuche mit Garnelenkurren vcr de nordfriesischen Kuste. Protok. FischTechnik, 8: 1-33.
BRANDT, A. von. 1955. Zur Technik der Bestimmung der Maschengrosse. Arch FischWiss., 6: 54-64.
1956. Selectivity of manila and 'perlon' cod-ends. I.C.E.S. C.M. 1956. Compo Fish. Cttee, Doc. 71 (mimeo.).
1957a Net materials of man made fibres. I.C.E.S. C.M. 1957. Compo Fish. Cttee, Doc. 20 (mimeo.).
1957a 24. Reise des FFS Anton Dohrn nach Westg~6nland vom 1-30.8.1957. Wiss. Infor. fur die Fisch., 4: 85-94.
1958. Escapement of haddock through a wire mesh cod-end. I.C.E.S. C,M. 1958. Compo Fish. Cttee, Doc. 22 (mimeo.).
1959. Knotless cod-ends and selectivity. I.C.E,S. C,M. 1959. Compo Fish. Cttee. Doc. 101 (mimeo.).
1960. Selection of redfish. I.C.E.S. C.M. 1960. Compo Fish. Cttee, Doc. 10 (mimeo.).
1961. Results of a trip to sub-area 1 for the study of the selectivity of differnet cod-ends for redfish. Annu. Meet. into Carom. Northw. Atlant. Fish. 1961, Doc. 7 (mimeo.).
1963. Selectivity data for aynthetic fibres. Spec. Publ. into Carom. Northw. Atlant. Fish., No.5, p.18-23, also Joint Sci. Meet, ICNAF/ICES/FAO, Lisbon, 1957, Doc. S20 (mimeo.).
1965. Netting twines for trawls. I.C.E.S. C.M. 1965. Compo Fish. Cttee, Doc. 83 (mimeo.
1966. Selectivity of herring in ~idWBter trawls. I.C.E.S. Coop. Res. Rep. Ser. B, 1963, p.47, also I.C.E.S. C.M. 1962. Compo Fish. Cttee, Doc. 75 (mimeo.)
1968. Standardization and fishing gear. t.C.E.S. C.M. 1968. Gear and Behav. Cttee, Doc. B2 (mimeo.).
BRANDT, A. von and CARROTHERS, P.J.G., 1965. Netting twines for trawls. Annu. Meet. into Comm. Northw. At1ant. Fish. 1965, Doc. 63 (mimeo.).
BRATBERG, E., 1965. Norwegian Research Report 1964. into Corom. Northw. Atlant. Fish. Redbook 1965,. Part II: 68-90.
BUCHANAN-WOLLASTON, H.J., 1927. On the selective action of a trawl net with some remarks on the selective action of drift nets. J. Cons., 2: 343-355.
1929. The selective action of the Gelder cod-end and that of other cod-ends compared. J. Cons. 4: 300-308.
1934. A criticism of a frequently used fallacious method of estimating the selective action of a trawl net. (Apendix A: Mesh experiments with trawls 1928-1933 by F.M. Davis). Fishery Invest., Lond. Ser. 2, 14 (1) :56p.
, . BUCKI, F·., W. STRZYZEWSKI and G. ZDZIEBKOWSKI, 1968. The selectivity of cod-end with Polish
chafer, made of 10mm Stylon, for cod and redfish cstches. Annu. Meet. into Northw. Atlant. Fish. 1968, Doc. 4 (mimeo.).

57
CARROTHERS, P.J.G. 1968. Field identification of synthetic fibres used in fish nets. into Comm. Northw. Atlant. Fish. Redbook 1968, Part III : 49-52, also Annu. Meet. into Comm. Northw. Atlant. Fish. 1968, Doc. 94 (mimeo.).
CASSIE, R.M. 1955. The escapement of small fish from trawl nets and its application to the management of the New Zealand snapper fisheries. Fish. Bull. Wellington, N.Z., 11: 1-99.
CIEGLEWICZ, W., and W. STRZYZEWSKI, 1957. Selection of Baltic cod by cod-ends of different materials. I.C.E.S, Spec. Scientific Meeting on '~easures for improving the stock of demersal fish in the Baltic", Doc. 25 (mimeo.).
1958. Selection of cod by different parts of cod-end, I,C,E,S, C,M. 1958. Compo Fish. Cttee, Doc. III (mimeo.).
1959a. Note on the selectivity of cod-end made of synthetic fibre. I.C.E.S. C.M. 1959. Compo Fish. Cttee., Doc. 32 (mimeo.).
1959b. Investigations on the selection of the Baltic cod by cod-end as the basis for establishing of the minimum mesh size. Prace-Reports Sea Fish. Inst., Gdynia, lOlA.
1960. Notes on the further results of investigations into the selectivity of synthetic fibre cod-end. I.C.E.S. C.M. 1960. Compo Fish. Cttee, Doc. 63 (mimeo.).
CLARK, J.R. 1952a. Experiments on the escapemement of undersized haddock through otter trawls. Comm. Fish. Rev., 14 (9): 1-7.
1952b. Further experiments on the escape of undersized haddock through otter trawls. Comm. Fish. Rev., 14 (12): 7-12.
1956. Selectivity of nylon cod-end tested by 'Albatross III'. Comm. Fish. Rev., 18 (7) : 44-45.
1957a. Size selection of fish by otter trawls. Proceedings of the Gulf and Caribbean Fisheries Institute, 10th A. Session: 113-118.
1957b Validity of the covered cod-end method, Spec. Pub1. into Comm. Northw. At1ant. Fish., No.5, p. 41-55, also Joint Sci. Meet. ICNAF/ICES/FAO, Lisbon, Doc. S22 (mimeo.).
1957c. Effective escape area of the cod-end. Joint Sci. Meet. ICNAF/ICES/FAO, Lisbon, Doc. S23 (mimeo.).
1957d. Stimulus-responae in mesh selection. Spec. Publ., into Comm. Northw. Atiant. Fish., No.5, p. 61-63, also Joint ·Sci. Meet. ICNAF/ICES/FAO, Lisbon, Doc. S30 (mimeo.).
1957e. Escapement through the forward parts of the trawl. Ibid: 31-41, also Ibid Doc. S33 (mimeo.).
1958. Underwater television observations of the effect of chafing gear on escapement of haddock. Annu. Proc. into Comm. Northw. Atlant. Fish., 8: 101-102.
1963. Size selection of fish by otter trawls. Results of recent experiments in the Northwest Atlantic. Spec. Publ. into Comm. Northw. Atlant. Fish., No.5, p.24-96, also Joint Sci. Meet. ICNAF/ICES/FAO, Lisbon, Doc. S-22,24-25,-26-27,-29,-30,-33(mimeo.).
CLARK, J.R., and F.E. NICKY, 1957. Fishing efficiency of regulated Georges Bank trawlers. Joint Sci. Meet. ICNAF/ICES/FAO, Lisbon, Doc. S-34 (mimeo.).
CLARK, J.R., F. McCRACKEN, and W. TEMPLEMAN. 1958. Summary of gear selection information for the Commission area. Annu. Proc. into Comm. Northw. Atlant. Fish., 8: 83-98.
CLARK, R.S. 1934. 90: 49-57.
Scottish seine net investigations. ,
Rapp. P.-v. Reun. Cons. perm. into Mer,

58
COLE, H.A., and A.C. SIMPSON, 1962. Selection by trawl nets in the Nephrops fishery. I.C.E.S. C.M. 1962. Spec. Meet. on Crustaces, Doc. 25 (mimeo.).
" ;' £" DARDIGNAC, J., L. HEDE~HAUY, M. PORTIER. 1968. Selectivite des chaluts en polyamide dans la peche du merlu (Nouvelles exp€riences: juin-juillet 1968). I.C.E.S. C.M. 1968. Gear and Behav. Cttee, Doc. B16 (Mimeo.).
DARDIGNAC, J., F. LOZANO-CABO, M. LIMA-DIAZ and P. MERIEL-BUSSY. 1967. mail1age dans la"p~che du merlu. Resultats preliminaires d rune III (juin-juillet 1967). I.e.E.S. C.M. 1967. Gear and Behav.
S€lectivit~ de divers compagne dans la r'gion Cttee, Doc. B7 (mimeo.).
DAVIS, F.M. 1929. Preliminary note on experimental trawling with cod-end meshes of different sizes. J. Cons., 4: 287-299.
1934a. Mesh experiments with trawls, 1928-1933. Fishery Invest., Lond •. , Ser. 2, 14 (1): 56 p.
1934b A mesh experiment indicating that small fish escape while the trawl is being towed. Rapp. P.-v. Reun. Cons. perm. into Explor. Mer, 90: 22-26
1934c. Pewliminary note on a commercial mesh experiment. Rapp. P.-v. R~un. Cons. perm. into Exp10r. Mer, 90: Appendix D, 27-31.
DESBROSSES, P., 1955. Donn€es preliminaires concernant les r€sultats de la campagne du 'President Th. Tissier' en Her du Nord et Her de Norvege. Sci. P~che, (32).
1956a. Programme de la campagne du 'Pr€sident Th. Tissier' en 1956. Sci. P~che, (35).
1956b. 1956.
R€sultats preliminaires de la premi€re campagne du ' President tho Tissier' en Sci. ~che, (41).
DRAGANIK, B. and C.Z. ZUKOWSKI, 1967. Investigation on selectivity of bottom trawl cod-end. Type BS-2, in relation to haddock on Georges Bank, 1965. into Comm. Northw. At1ant. Fish. Redbook 1967, Part III : 93-96, also Annu. Meet. into Comm. Northw. At1ant. Fish. 1967, Doc. 28 (mimeo.).
ELLIS, R. W. 1951. Further experiments on the shrinkage of trawl cod-end meshes. I.C.E.S. C.M. 1951. Fishing Gear Sub-Cttee, Doc. unnumbered (mimeo.).
1963. Experiments to investigate the escape of fish through the meshes of different parts of the trawl. Spec. Pub1. into Comm. Northw. Atlant. Fish., No.5, p. 97-101.
FULTO~, t.W., 1893. The capture and destruction of immature sea fish. Part 3: The relation between the size mesh of trawl nets and the fish captured. Rep. Fish. Bd Scot., 12: 302-312.
FURNESTIN, J., 1955. Experiences sur les mail1ages des cha1uts. I.C.E.S. C.H. 1955. Compo Fish. Cttee, Doc. 67 (mimeo.).
GILlS C. 1952. La p~che crevettiere sur la cate Be1ge: Son evolution au cours des annees 1935-1951 et son influence sur 1a stock de 1a crevette. Institut d'Etudes Maritimes, Ostende, H~oire No.8.
1953. Selective action of 80 mm mesh and its effect on yield in fishing for soles. Belgian Memorandum communicated to 2nd Meeting of Permanent Commission, No. 1953.
GOTTLIEB, E. 1960+ 1961. On the selection of Upeneus Mo11ucenais and Mul1us barbatus by trawl cod-ends in the Israeli fisheries G.F.C. for the Mediterranean, Techn. Paper 8/60, 1960 and 8/61, 1961.
GRAHAM, M. 1954 Trials of mesh selection in trawls and seines. J. Cons., 20: 62-71.
59
GRAHAM, M., R.J.H. BEVERTON, A.R. MARGETTS, and J.A. GULLAND. 1954. A note on published trawler/seiner comparisons. J. Cons., 20: 51-55.
GRAHAM, M., A.R. MARGETTS, and J.A. GULLAND. 1953. Some trials of seines and trawls in 1953. I.C.E.S. C.M. 1953. N. Sea Sub-Cttee Compo Fish., Doc. 15 (mimeo.).
GULLAND, J.A. 1956. On the selection of hake and whiting by the mesh of trawls. J. Cons., 21: 296-309.
1964. Variations in selection factors, and mesh differentials. J. Cons., 29: 158-165.
HILLIS, J.P. 1962. Whiting mesh selection experiments in Irish waters. I.C.E.S. C.M. 1962. Compo Fish. Cttee, Doc. 62 (mimeo.).
1968. The whiting fishery off countries Dublin and Louth on the east coast of Ireland. I, The commercial catch. Irish Fisheries Invest., Ser. B. (Marine), (4).
HODDER, V.M. 1963. Mesh selection of haddock in Divisions 3N and 30. Annu. Meet into Comm. Northw. Atlant. Fish. 1963, Doc. 53 (mimeo.).
HODDER, V.M., and A.W. MAY. 1964. The effect of catch size on the selectivity of otter trawls. Res. Bull. into Comm. Northw. Atlant. Fish., No.1, p. 28-35.
1965. Otter trawl selectivity and girth-length relationships for cod in ICNAF subarea 2. Ibid, No.2, p. 8-18.
HOLDEN, M.J. 1966a. Comparison manila and polypropylene also I.C.E.S. C.M. 1964.
of the selection factor for cod in the Barents Sea, using (ulstron) cod-ends. I.C.E.S. Coop. Res. Ser. B, 1965, 143-148 Compo Fish. Cttee .• Doc. 43 (mimeo.).
1966b. Comparison of the selection factors for whiting in the Irish Sea, using courlene and polypropylene (ulstron) cod-ends. I.C.E.S. Coop. Res. Rep. Ser. B, 1965, p. 149-151, also I.C.E.S. C.M. 1964. Compo Fish. Cttee, Doc. 44 (mimeo.).
1966c. The effect of tight topside chafers on the selectivity of manila cod-ends. I.C.E.S. Coop. Res. Rep. Ser. B, 1965, p. 152-155 also I.C.E.S. C.M. 1964. Compo Fish. Cttee, Doc. 45 (mimeo.).
1966d. Comparison of the selectivity of manila and polypropylene (ulstron) cod-ends. I.C.E.S. Coop. Res. Rep. Ser. B. 1965, p. 156-163, also I.C.E.S. C.M. 1964. Compo Fish. Cttee, Doc. 154 (mimeo.).
1969. Selectivity experiments on the Grand Bank of Newfoundland in 1967. Annu. Meet. into Comm. Northw. Atlant. Fish. 1969, Doc. 36 (mimeo.)
HOLDEN, M. J., and B.W. JONES. 1967. The effect of a Polish-type chafer on cod-end selectivity for haddock. I.C.E.S. Coop. Res. Rep. Ser. B, 1966, p. 47-50, also I.C.E.S. C.M. 1967. Gear and Behav Cttee., Doc. B6 (mimeo.).
HYLEN, A. 1967 Selectivity experiments with a large-meshed topside chafer. I.C.E.S. Coop. Res. Rep. Ser, B, 1967, p. 22-24, also .I.C.E.S. C.M. 1966. Comp. Fish. Cttee, Doc. F13 (mimeo.).
1969. Selectivity experiments with a cod-end made of polypropylene split fibre. I.C.E.S. Coop. Res. Rep. Ser. B, 1968, p. 51-55, also I.C.E.S. C.M. 1967. Gear and Behav. Cttee, Doc. BlO (mimeo.).
1960. General considerations on trawl and seine mesh selection and its measurement. Report of I.e.E.S. mesh selection working group, 1960.
1964. Report of the mesh selection working group, 1959-1960. I.C.E,S. Coop. Res. Rep. No.2: 1-156.
1965. Report of the 1962 Ice1~d trawl mesh selection working group. I.C.E.S. Coop. Res. Rep., No.3: 42 p., also Annu. Meet. into Comm. Northw. At1ant. Fish., 1963, Doc. 34 (mimeo).

60
HYLEN, A. 1959. Review of redfish selection and chafing gear in relation to fishery assessment problems. A. Meet. into Comm. NW. Atlant. Fish., Special Appendix 86. Annu. Meet. into Comm. Northw. Atlant. Fish, 1959.
1960. Proceedings of the Joint Scientific Meeting of ICNAF/ICES/FAO on fishing effort, the effect of fishing on resources and selectivity of fishing gear, Vol. I, 45 p., F.A.O., Rome.
1962. Compilation of selectivity data. Annu. Meet. into Comm. Northw. Atlant. Fish. 1962, Doc. 6 (Mimeo.).
1963a Report of gear and selectivity sUb-committee. Int. Comm. Northw. Atlant. Fish. Redbook 1963, Part I: 49-53.
1963b. The selectivity of fishing gear. Vol, 2 of Proc. of Joint ICNAF/ICES/FAO Spec. Sci. Meet., Lisbon, 1957. Spec. Publ. int, Comm. Northw. Atlant. Fish. No.5, 225 p.
1965. Report of sub-committee on gear and selectivity. Int. Comm. Northw. Atlant. Fish. Redbook 1965, Part I: 60-65.
1967. Compilation of selectivity data presented to the Commission from 1962-1966. Ibid 1967, Part III: 101-113.
IZNANKIN, Yu. A. 1963. tests of trawls.
On the assessment of the reliability of the results of comparative RYb. Khoz., 39, (1): 24-27.
IVERSEN, T. 1934. R'un. Cons.
Some remarks on mesh width and its influence on young fish. perm. into Explor. Mer. 90: 39-42,
Rapp. P.-v.
JANKOVICH, J. 1954. Selectivity of cod-end mesh sizes in otter trawling. Washington Dept. Fish. Res. Pap. 1 (2): 19-24.
JEAN, Y. 1959. Selection studies on sub-division 4T cod. Annu. Meet. into Comm. Northw. Atlant. Fish. 1959, Doc. 13 (mimeo.).
JENSEN, A.J.C. 1958. Investigations on the selection of plaice, dab, and cod by the cod-end meshes of Danish seine and light trawls. I.C.E.S. C.M. 1958. Camp. Fish. Cttee, Doc. 130 (mimeo.).
1949. The Relation between the size of mesh and the length of the fish released. Rapp. P. -v. R6un. Cons. perm. into Explor. Mer, 125: 65-69.
JENSEN, A.C. and R.C. HENNEMUTH. 1966. in nylon cod-ends of trawl nets. p. 86-101.
Size selection and retainment of silver and red hake Res. Bull. into Comm. Northw. Atlant. Fish., No.3
JOHNSTONE, J. 1910. Influence of size of net mesh. In: Report of measurements of Irish Sea plaice made during year 1909. Trans. Liverpool BioI. Soc. 24: 146-151.
JONES, B.W. 1966a. Trawl selectivity of cod at Faroe. I.C.E.S. Coop. Res. Rep. Ser. B, 1964, p. 49-52, also I.C.E.S. C.M. 1963. Camp. Fish. Cttee, Doc. 87 (mimeo.).
1966b/ Selectivity of haddock and whiting by an u1stron cod-end. I.C.E.S. Coop. Res. Rep. Ser. B, 1964, p. 58-59, also I.C.E.S. C.M. 1963. Compo Fish. Cttee, Doc. unnumbered (mimeo.).
JONES, R. 1958a. Some observations on the analysis of selection data. I.C.E.S. C.M. 1958. Compo Fish. Cttee, Doc. 81 (Mimeo.).
1958b. Some observations on cover effects. I.e.E.S. C.M. 1958. Compo Fish. Cttee. Doc. 82 (mimeo).
61
JONES, R., 1960. Mesh selection and apparent growth of haddock. J. Cons., 25: 177-184.
1963. Some theoretical aspects on the escape of haddock from a cod-end. Spec. Pub1. into Comm. Northw. At1ant. Fish., No.5, p. 116-127, also Joint Sci. Meet. ICNAF/ICES/ FAO, Lisbon, 1957, Doc. 5-31 (mimeo.).
JONSSON, J. 1960. Selection factors for Icelandic cod and haddock, 1958-1960. I.C.E.S. C.M. 1960. Compo Fish. Cttee, Doc. 134 (mimeo.).
KLUST, G. 1956a. Veranderungen des Durchmessers von Netzgarnen durch Wasserung. Protok. FischTechnik, 4: 84-106.
1956b. tangenveranderungen von Net_garen durch Wasserung. Protok. FischTechnik, 4: 70-83.
1956c. Change of length of net twines by water. I.C.E.S. C.M. 1956, Compo Fish. Cttee, Doc. 68 (Mimeo.).
1956d. Changes in the diameter of net twines by water. Ibid, Doc. 69 (mimeo.).
1966. Synthetic net msterials and their trade names. Annu. Meet. into Comm, Northw. At1ant. Fish., 1966, Doc. 73 (mimeo,).
KOTTHAUS. A. 1950. Ressenuntersuchungeh am Rotbarsch. Ber. dt. wiss. Komm Meeresforsch., 22: 94-114.
KURCH.
1960. Zum Rassenproblem beim Rotbarsch. Ibid, 16: 18-50.
G. 1964. Premi~re Serie d'experiences sur la s€lectivite du chalut a Ie Golfe de Gascogne. Sci. Pache, 123, 6 p:
poiSBons dans
LESTEV. A.V., 1963. (rockfish).
The selectivity of the cod-end of trawls used in fishing for redfish I_v. tikhookean. nauchno-issted. Inst. rYb. Khoz, Okeanogr., 49: 227-236.
, d A -LETACONNO.UX. R., 1955. Experiences e l!eche avec des cha1uts de dixhuit metres a msillages differents. Rev. Trav. Inst. ~ches Mar., 19: 51-85.
L'SHEV. M. N •• 1957. Some data to estimate the success of the operation and the selectivity effect of the Esstern Baltic herring. I.C.E.S. C.M. 1957. Herring Cttee, Doc. unnumbered,
LONGHURST, A.R., 1959. Prediction of selection factors in a tropical trawl fishery. Nature, Lond., 184: 1170.
LONGHURST, A.R. 1960. Mesh selection factors in the trawl fishery off tropical West Africa. J. Cons., 25: 318-325.
LUCAS, C.E., seine,
A. RITCHIE, B.B. PARRISH, and J.A. POPE. 1954. Ibid, 20: 36-50.
Mesh selection in the roundfish
LUX, F.E. 1968. Cod-end mesh selection studies of yellowtail flounder Limsnda ferrugines (Storer). Annu. Meet. into Comm. Northw. Atlant. Fish., 1968, Res. Doc. 91 (mimeo.).
MANN. M.J. 1962. Escape of Pseudolithus senegalensis (C. snd V.) from trawl nets in a Nigerian fishery. Nature, Lond., 193: 955-956.
MARGETTS, A.R. 1949a. Experimental comparison of fishing capacities of Danish seiners and trawlers. Rapp. P.-v. R~un. Cons. perm. into Explor. Mer, 125: 83-96.
1949b. Experimental comparison of fishing capacities of different trawlers and trawls. Ibid: 72-82.

62
MARGETTS, A.R. 1954a. Selection of Salas by mesh of trawls. J. Cons., 20: 276-289.
1954b. 1954.
The sampling of demersal fish stocks by trawls and seines. I.C.E.S. C.M. Spec. Sci. Meet. 'Sampling' Cae. 28 (mimo.).
1954c Effect of net material on mesh selection. I.C.E.S. C.M. 1954. Camp. Fish. Cttee, Doc. unnumbered (mimeo.).
1954d. to mesh Doc. 28
The length-girth relationships in haddock and whiting selection. J. Cons. 20: 56-61, also ICES C.M. 1953. (mimeo.) •
and their application Compo Fish. Cttee.
1955a. Interim report on the selection by trawl cod-end meshes made of various materials. I.C.E.S. C.M. 1955. Compo Fish. Cttee, Doc. 43 (mimeo.).
1955b. Definition and testing of light trawls. Ibid, Doc. 65 (mimeo.).
1956. A mesh experiment with sisal, cotton and nylon cod-ends. Ibid, 1956, Ibid, Doc. 73 (mimeo.). 1957. The length-girth relationships in Whiting and cod and their application to mesh selection. J. Cons., 23: 64-71, also ICES C.M. 1956, Compo Fish. Cttee, Doc. 44 (mimeo.).
1959. A preliminary report on the international Artie mesh experiment, 1959. I.C.E.S. C.M. 1959, Compo Fish. Cttee, Doc. 81 (mimeo.).
1963a. An illustration of differing selectivities in two trawls. Spec. Publ. into Comm. Northw. Atlant. Fish., No.5, p. 156-157, also Joint Sci. Meet. ICNAF/ICES/FAO, Lisbon, 1957, Doc. S6 (mimeo.).
1963b. Escapes of fish through the component parts of trawls. Ibid, P. 158-165, Ibid, Doc. S5.
1965a. Trawl mesh selectivity. World FiBhing, 14 (4): 47-50.
1965b. Further selectivity data. I.C.E.S. C.M. 1965. Compo Fish. Cttee, 'Doc. 126 (mimeo.).
MARGETTS, A.R., G. SAETERSDAL, A. von BRANDT, and A.I. TRESCHEV. 1964. The 1959 international Artic trawl mesh selection experiment. I.C.E.S. Coop. Res. Rep., 2: 31-106.
MARTIN, W.R. 1957. Canadian researches, 1956. Comm. Northw. Atlant. Fish., 7: 25-26, Fish. 1959, Doc. 7 (mimeo.).
Sub-area 4. Mesh selections. Annu. Proc. into also Annu. Meet. into Comm. Northw. Atlant.
McCRACKEN, F.D. 1957. Effect of mesh si~e variation on selection span. Joint Sci. Meet. ICNAF/ICES/FAO, Lisbon, 1957, Doc. SlO (mimeo.).
1959. Top chafing gear studies. Annu. Meet. into Comm. Northw. Atlant. Fish., 1959, Doc. 21 (mimeo.).
1960. Selectivity of cod-ends with various types of topside chafers. into Comm. Northw. Atlant. Fish., Redbook 1960, Part II: 66-69, also Annu. Meet. into Comm. Northw. Atlant. Fish. 1960, Doc. 19 (mim,eo.).
1963. Selection by cod-end meshes and hooks of cod, haddock, flatfish and redfish. Spec. Publ. into Comm. Northw. Atlant. Fish., No.5, p. 131-155, also Joint Sci. Meet. ICNAF/ICES/FAO, Lisbon, 1957, Doc. S13 (mimeo.). and Joint Sci. Meet. ICNAF/ICES/FAO, Lisbon, 1957, Doc. S39 (mimeo.).

63
McCRACKEN, F.D. 1964. Minimum mesh sizes and equivalents for different materials to meet ICNAF regulations. into Comm. Northw. Atlant. Fish. Redbook 1964, PartIII: 143-150.
McCRACKEN, F.D., and J.R. CLARK. 1958. Report to the Standing Committee on research and statistics re topside cod-end chafing gear. I.CIN,A.F. reprints of selected reports of the Stand. Cttee on R. and G. from the '1958 and 1956 Annual Meetings, 40-43, also Annu. Meet. into Comm. Northw. At1ant. Fish. 1958, Doc. 14 (mimeo.).
McRAE, E.D., and R.C. HENNEMUTH. 1964. 58 mm manila and 76 rom nylon. Doc. 48 (mimeo.).
Selectivity and gilling of redfish in cod-ends of Annu. Meet. into Comm. Northw. Atlant. Fish., 1964,
MESSTOROFF, J. 1958. Length-girth measurements of cod and their relationships to mesh selection. I.C.E.S. C.M. 1958. Compo Fish. Cttee, Doc. 23 (mimeo.).
MONTEIRO, R. 1966. Hake mesh selection experiments on the Portuguese coast. I.C.E.S. Coop. Res. Rep. Ser. B, 1964, 53-57, also I.C.E.S. C.M. 1963. Compo Fish Cttee, Doc. 88 (mimeo.).
1968. Some observations on the selectivity of trawl nets with the Polish-type topside chafer. Int. Corom. Northw. At1ant. Fish., Redbook 1968, Part III: 110-112, also Annu. Meet. into Comm. Northw. At1ant. Fish. 1968, Doc. 100 (mimeo.).
NEDELEC, c. 1968. Influence de la forme des cha1uts sur l'~coulement de l'eau dans 1a peche et des r~percus8ionB possibles Bur 1a selectivite. I.GIE,S. e,M. 1968, Gear and Behav. Cttee, Doc. B9 (mimeD.).
OLSEN, S. 1962. Selection experiments with a eour1ene cod-end in the Barents Sea. I.C.E.S. C.M. 1962, Doe. 36 (mimeo.).
1966. Norweigian mesh selection experiments in 1963 and 1964. I.C.E.S. Coop. Rep. Ser. B, 1965, 1964-168, also I.C.E.S. C.M. 1964, Doe. 118 (mimeo.).
1967. Experiments with a topside chafer of double mesh size. I.C.E.S. Coop. Res. Rep. Ser. B. 1965, 26-28, also I.C.E.S. C.M. 1966. Compo Fish. Cttee, Doc. F1 (mimeo.)
OTTERLIND, G. 1959. Report on Swedish trawl experiments in the southern Baltic. I.C.E.S. C.M. 1959. Compo Fish. Cttee, Doe. 120 (mimeo.).
1960. Me,sh selection results for Baltic cod. I.C.E.S. C.M. 1960. Compo Fish. Cttee, Doe. 205 (mimeo.).
OTTERLIND, G., and G. SELLERBERG. 1957. Some notes on Swedish trawl experiments in the southern Baltic. I.C.E.S. C.M. 1957, Spec. Sci. Meet. on '~easures for improving the stock of demersal fish in the Baltic", Doe. 62 (mimeo,).
PALOHEIMO, J.E .. and E. CADIMA. 1964. Excerpts from "On statistics of mesh selection". Annu. Meet. into Comm. Northw. Atlant. Fish., 1964, Doc. 98 (mimeo.).
PARRISH. B.B. 1949. Fishing capacities of gears used by English and Scottish research vessels. Rapp. P.-v. Reun. Cons. perm. into Explor. Mer, 125: 1-96.
1950a. Experiments on the shrinkage of trawl cod-end meshes. I.C.E.S. C.M. 1950. Compo Fish. Cttee, Doc. unnumbered (mimeo.).
1950b. Experiments to determine the effect of the use of a the fishing power of the otter trawl. I.C.E.S. C.M. 1950. Doc. unnumbered (mimeD.).
small meshed cover on Compo Fish. Sub-Cttee,
1951. Fishing capacities of Lowestoft and Aberdeen trawls when used on flatfish grounds. J. Cons., 17: 156-171.
64
PARRISH, B.B. 1963a. fibres in the 150-156.
Selectivity differences between cod-ends made of natural and synethetic I.C.N.A.F. area. into Comm. Northw. Atlant. Fish. Redbook 1963, PartIII:
163b. Some remarks on selection processes in fishing operations. Spec. Publ. into Comm. Northw. Atlant. Fish., No.5, p. 166-170.
PARRISH, B.B., and J.A. POPE. 1963. Further results on the effects of using small-mesh covers; effects on the catches of the escape sizes of fish. Spec. Publ. into Camm. Northw. Atlant. Fish., No.5, p. 171-174, also I.C.E.S. C.M. 1951. Compo Fish. Sub-Cttee (mimeo.).
POPE, J.A., and W.B. HAIL. 1960. The selectivity of courlene cod-ends. I.C.E.S. C.M. 1960. Compo Fish. Cttee, Doc. 183 (mimeo.).
1966. Selectivity of polypropylene cod-ends. I.C.E.S. Coop. Res. Rep. Ser. B, 1965, 173-187, also I.C.E.S. C.M. 1964. Compo Fish. Cttee, Doc. 132 (mimeo.).
POPE, J.A., W.B. HALL, and M.H. AKHTAR. 1965. selection of haddock and whiting by polypropylene trawl cod-ends. I.C.E.S. C.M. 1965. Compo Fish. Cttee, Doc, 101 (mimeo.).
POPE, J.A., M, 1958. Cttee,
ROESSINGH, A. von BRANDT, I.C.E.S. Coop. Res. Rep., Doc. 88 (mimeo.).
1964. International mesh selection experiments, (2): 7-29, also I.C.E.S. C.M, 1958. Compo Fish.
RODRIGUEZ, 0., D. OLEGARIO, et al., 1963. Experiences about trawl selectivity in the of Biscay. I.C.E.S.-C.~ 1963. Compo Fish. Cttee, Doc. unnumbered.
Bay
RODRIGUEZ, 0" F. VIVES, A, EZAMA, and in Marin (Pontevedra, Spain). paper No. 16.
0, CENDRERO. ,1963. Trawl selectivity experiments Gen. Fish, Counc. Medit" 7th Session, Techn,.
ROESSINGH, M. 1959. Recent experiments on gear and mesh selection in the Netherlands. I.C.E,S, C.M. 1959. Comp. Fish. Cttee, Doc. 88 (mimeo,).
1960. Netherlands work on mesh selection. I.C.E.S. C.M, 1960. Comp, Fish. Cttee, Doc. 100 (mimeo,).
RUSSEL, E.S., and T. EDSER. 1926. The relation between the cod-end mesh and size of fish caught. J. Cons., 1: 39-54.
SADOWSKI, S. 1960, The effect of the material on the action of the trawl under tow. I.C.E.S. C.M. 1960. Compo Fish. Cttee, Doc. 64 (mimeo.).
SAETERSDAL, G. 1955. Experiments with 1arge-mesh trawls in the Bear Island area. I.C.E.S. C.M. 1955. Compo Fish. Cttee, Doc. 16 (mimeo,).
1957, Mesh selection results for cod, haddock and redfish. Joint Sci. Meet. ICNAF/ ICES/FAO, Lisbon, Doc. S37.
1958a. Mesh Selection data on Artie eod and haddock. I.C.E.S. C,M. 1958. Compo Fish. Cttee, Doc. 71 (mimeo,),
1958b. Selectivity experiments with topside chafers. I.C.E.S. C.M. 1958. Compo Fish. Cttee, Doc, 72 (mimeo.).
1960. Norweigian trawl mesh selection experiments, 1960. I.C,E,S. C.M. 1960. Compo Fish. Cttee, Doc. 89 (mimeo.),
1963. A Note on the methods used in mesh selection experiments. Spec. Pub1. into Comm. Northw. At1ant, Fish., No.5, p. 185-188, also Joint Sci. Meet. ICNAF/ICES/FAO. Lisbon, 1957, Doc. S35 (mimeo.).

65
SHESTOV, V.P. 1966. Girth-length relationships in some species of fish and selectivity of cod-ends in the Barents Sea. Trudy vaea. nauchno-issled. lnst. morak. ryb. Khoz. Okeanogr., 41: 63-72.
STRYZEWSKI, W. 1961. Preliminary note on the herring trawl selectivity. Experiments carried out in summer 1961. I.C.E.S. C.M. 1961. Compo Fish Cttee, Doc. 142 (mimeo.).
STRZYZEWSKI, W., and J. ZAUCHA. 1957. The Polish measuring gauge with accuracy tests. Joint Sci. Meet. ICNAF/ICES/FAO, Lisbon, Doc. S18 (mimeo.).
1963. The stretch of meshes. Spec. Publ. into Comm. Northw. Atlant. Fish., No.5, p. 193-200, also ~oint Sci. Meet. ICNAF/ICES/FAO. Lisbon, 1957, Doc. S32 (mimeo.).
TEMPLEMAN, W. 1957a. Selection of redfish. Joint Sci. Meet. ICNAF/ICES/FAO, Lisbon, Doc. S21 (mimeo.).
1957b. Otter trawls .and mesh measurements in .selection experiments. Joint Sci. Meet. ICNAF/ICES/FAO, Lisbon, Doc. 538 (mimeo~).
1957c. Selection of witch flounder. Joint Sci. Meet. ICNAF/ICES/FAO, Lisbon, Doc. s40 (mimeo.).
1957d. Selection of haddock, cod and American plaice. Joint Sci. Meet. ICNAF/ICES/ FAO, Lisbon, Doc. S4l (mimeo.).
1957e. Girth measurements of haddock, cod and redfish. Joint Sci. Meet. ICNAF/ICES/ FAO, Lisbon, Doc. S42 (mimo.).
1957f. Redfish meshing. Joint Sci. Meet. ICNAF/ICES/FAO, Lisbon, Doc. 543 (mimeo.).
1963. Otter trawl covered cod-end and alternate haul mesh selection experiments on redfish, haddock, cod, American plaice and witch flounders; girth measurements of haddock, cod and redfish and meshing of redfish in the Newfoundland area. Spec. Pub1. into Comm. Northw. Atlant. Fish., No.5, p. 201-217.
THOMAS, H.J. 1962. A comparison of the catch of, Norway lobsters using trawls of SO and 70 mm, respectively. I.C,E,S. elM. 1962. Spec. Meet. on Crustacea, Doc. 21 (mimeo,).
TODD, R.A. 1911. Covered net experiments. Mar. bioI. Ass. U.K., Int. Fishery Invest., Rep. 3, 1906-1908: 177-206. '
TOLMACHEV, V.I. 1964a. The influence of the weight of the catch on the selectivity of trawls. RYb. Khoz., (12): 45-46.
J 1964b. A study of the causes of the selectivity of trawling gears. Trudy atlant. nauchno-issled. Inst. morsk. rYb. Khoz. Okeanogr., 12: 100-128.
TRESCHEV. A.I. 1963. On the selectivity of trawls and drift nets. Spec. Publ. into Comm. Northw. At1ant. Fish. No.5, p. 218-221, also Joint Sci. Meet. ICNAF/ICES/FAO. Lisbon, 1957, Doc. 519 (mimeo.).
1964. Some data on effect of meshing and chafer on trawl selectivity in relation to redfish. Annu. Meet. into Comm. Northw. Atlant. Fish., 1964, Doc. 88 (mimeo.).
1966. Selectivity of trawls with reference to the redfish. Trudy vses. nauchnoissled. Inst. morsk. riib. Khoz. Okeanogr •• 61: 17-61.
1967. The effect of chafers on the selectiVity, strength and durability of trawls. Int. Comm. Northw. Atlant. Fish. Redbook 1967, Part 111132-142.

66
TRESCHEV, A.I., and C.N. STEPANOV, 1968, Comparative se1eetivity of trawl nets made of Kapron and manila. Annu, Meet. into Comm. North~. At1ant. Fish., 1968, Doc. 58 (mimeo.).
TRESCHEV, A.I., and V,M. NAUMOV. 1967. The study of the effect of 1arge-meshed chafer on the selectivity of the trawl net. Int. Comm; Northw. At1ant. Fish. Redbook 1967, Part III: 90-100.
TRESCHEV, A.I., V.P. SHESTOV, and V.M. ROGACHEV. 1961, Selectivity of trawl nets in redfish fishing in the area of Copytov Bank. I.C.E.S. C.M. 1961. Compo Fish. Cttee, Doc. 112 (mimeo.).
VINOGRADOV, N.N. 1961. On the effect of the construction of the cod-ends of trawls on the si~e composition of fish in the catches. Ryb. Khoz., 37 (I). 20-26.
ZIJLSTRA, J.J., 1957. Mesh experiments with a herring trawl. I.C.E.S. C.M. 1957. Comp. Fish Cttee, Doc. unnlDllbered (mimeo.).
1961. Some data on the meshing of herring in a herring trawl. I.C.E.S. C.M. 1961. Comp, Fish. Cttee, Doc. 42 (mimeo.).


![Ch089 Tzevelekou 2341 Final[1]](https://img.pdfslide.us/doc/110x75/577d33cf1a28ab3a6b8bcfab/ch089-tzevelekou-2341-final1.jpg)