Embed Size (px)
Citation preview
19 Feb 2008 Biology 555:Crystallographic Phasing II
p. 1 of 38
Protein DataCrystal StructurePhases
Overview of the Phase Problem
John RoseACA Summer School 2006
Reorganized by Andy Howard, Biology 555, Spring 2008Part 2 of 2
Remember We can measure reflection intensities
We can calculate structure factors from the intensitiesWe can calculate the structure factors from atomic positions
We need phase information to generate the image

19 Feb 2008 Biology 555:Crystallographic Phasing II
p. 2 of 38
From Glusker, Lewis and Rossi
€
Puvw =1
V| Fhkl
hkl
∑ |2 cos2π (hu + kv + lv)
Finding the Heavy Atomsor Anomalous Scatterers
The Patterson function - a F2 Fourier transform
with = 0 - vector map
(u,v,w instead of x,y,z) - maps all inter-atomic
vectors - get N2 vectors!!
(where N= number of atoms)
19 Feb 2008 Biology 555:Crystallographic Phasing II
p. 3 of 38
The Difference Patterson Map
SIR : |F|2 = |Fnat - Fder|2
SAS : |F|2 = |Fhkl - F-h-k-l|2
Patterson map is centrosymmetric - see peaks at u,v,w & -u, -v, -w
Peak height proportional to ZiZj
Peak u,v,w’s give heavy atom x,y,z’s - Harker analysis
Origin (0,0,0) maps vector of atom to itself
19 Feb 2008 Biology 555:Crystallographic Phasing II
p. 4 of 38
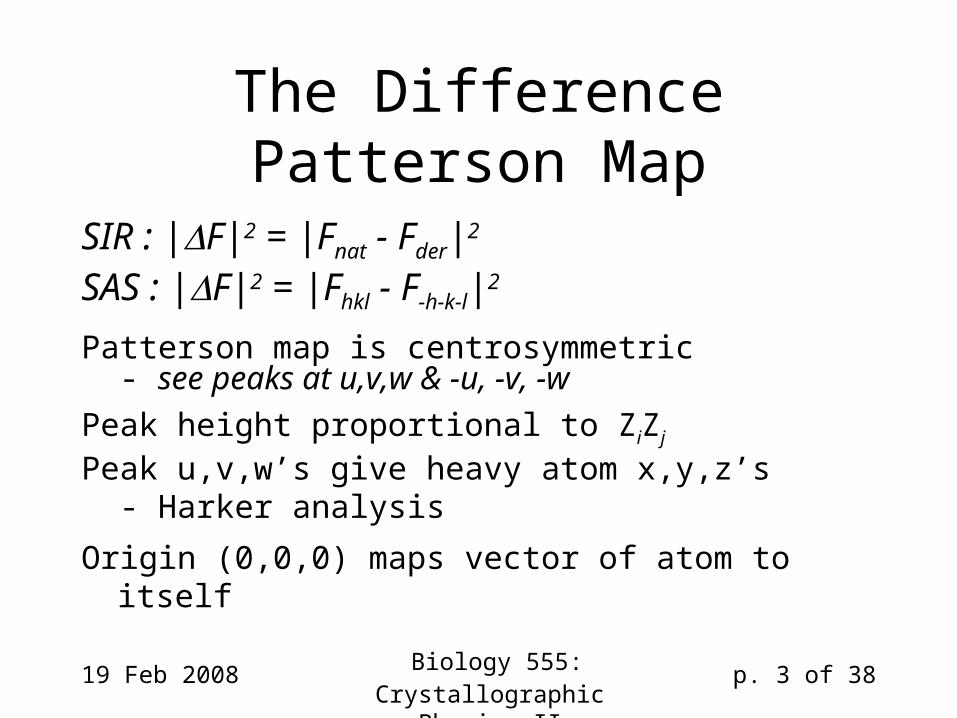
Harker analysis• Certain relationships apply in Patterson
maps that enable us to determine some of the coordinates of our heavy atoms
• They depend on looking at differences between atomic positions
• These relationships were worked out by Lindo Patterson and David Harker
• Patterson space is centrosymmetric but otherwise similar to original symmetry; but Patterson symmetry has no translations
David Harker
19 Feb 2008 Biology 555:Crystallographic Phasing II
p. 5 of 38
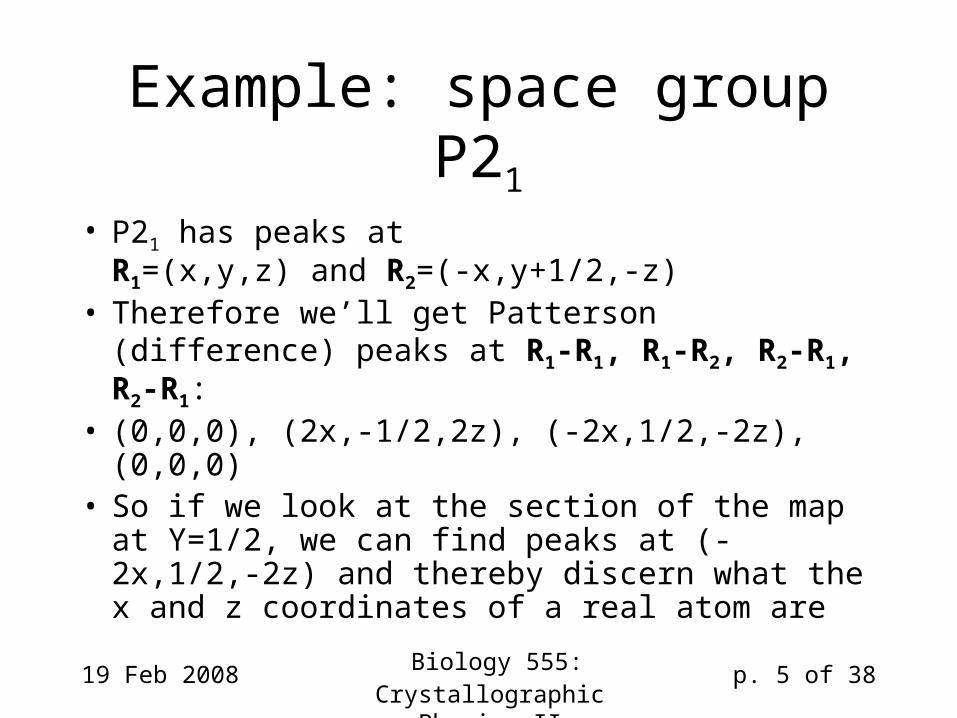
Example: space group P21
• P21 has peaks atR1=(x,y,z) and R2=(-x,y+1/2,-z)
• Therefore we’ll get Patterson (difference) peaks at R1-R1, R1-R2, R2-R1, R2-R1:
• (0,0,0), (2x,-1/2,2z), (-2x,1/2,-2z),(0,0,0)• So if we look at the section of the map at Y=1/2,
we can find peaks at (-2x,1/2,-2z) and thereby discern what the x and z coordinates of a real atom are
19 Feb 2008 Biology 555:Crystallographic Phasing II
p. 6 of 38
How do we actually use this?
• Compute difference Patterson map,i.e. map with coefficients derived from Fhkl
PH - FhklP or Fhkl - F-h-k-l
• Examine Harker sections• Peaks in Harker sections tell us where the
heavy atoms or anomalous scatterers are• Automated programs like BNP, SOLVE,
SHELX can do the heavy lifting for us
19 Feb 2008 Biology 555:Crystallographic Phasing II
p. 7 of 38
A Note About Handedness
• We identify each reflection by an index, hkl.• The hkl also tells us the relative location of that reflection
in a reciprocal space coordinate system.• The indexed reflection has correct handedness if a data
processing program assigns it correctly.• The identity of the handedness of the molecule of the
crystal is related to the assignment of the handedness of the data, which may be right or wrong!
• Note: not all data processing programs assign handedness correctly!
• Be careful with your data processing.
19 Feb 2008 Biology 555:Crystallographic Phasing II
p. 8 of 38
O
N
M
L
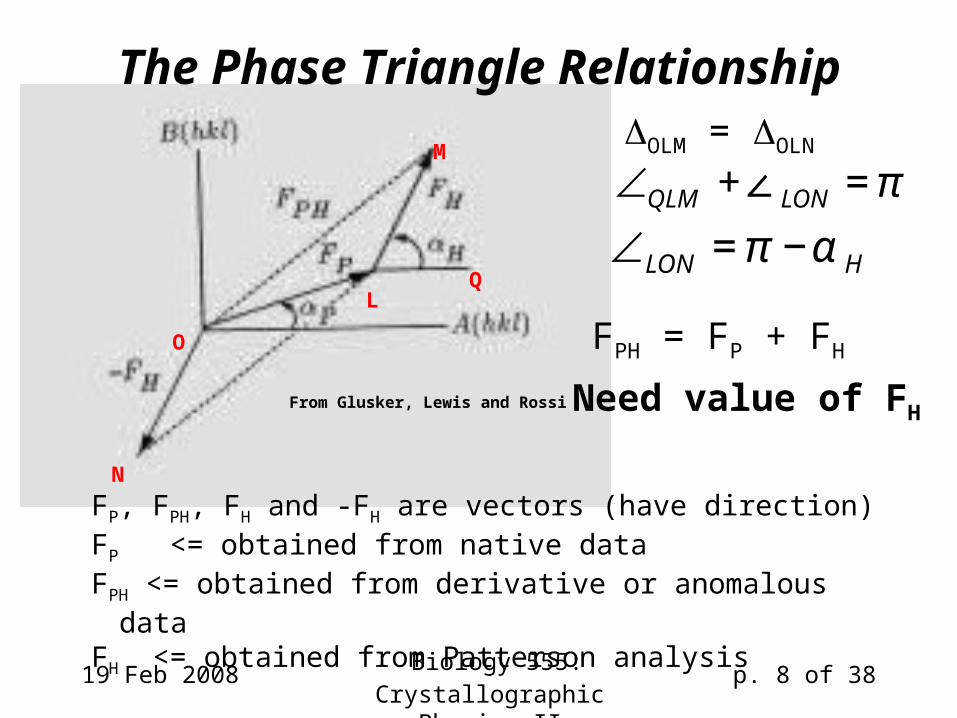
OLM = OLN
Q
€
∠QLM +∠LON = π
€
∠LON = π −α H
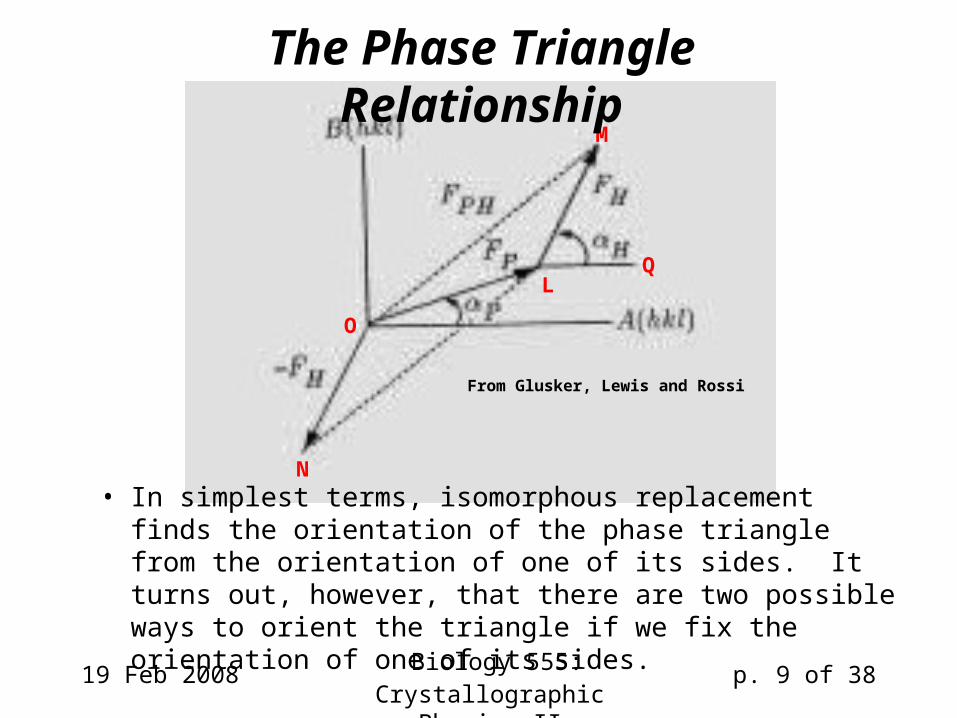
FPH = FP + FH
Need value of FHFrom Glusker, Lewis and Rossi
The Phase Triangle Relationship
FP, FPH, FH and -FH are vectors (have direction)FP <= obtained from native dataFPH <= obtained from derivative or anomalous dataFH <= obtained from Patterson analysis
19 Feb 2008 Biology 555:Crystallographic Phasing II
p. 9 of 38
O
N
M
LQ
From Glusker, Lewis and Rossi
The Phase Triangle Relationship
• In simplest terms, isomorphous replacement finds the orientation of the phase triangle from the orientation of one of its sides. It turns out, however, that there are two possible ways to orient the triangle if we fix the orientation of one of its sides.
19 Feb 2008 Biology 555:Crystallographic Phasing II
p. 10 of 38
X1 trueor false
X2 trueor false
From Glusker, Lewis and Rossi
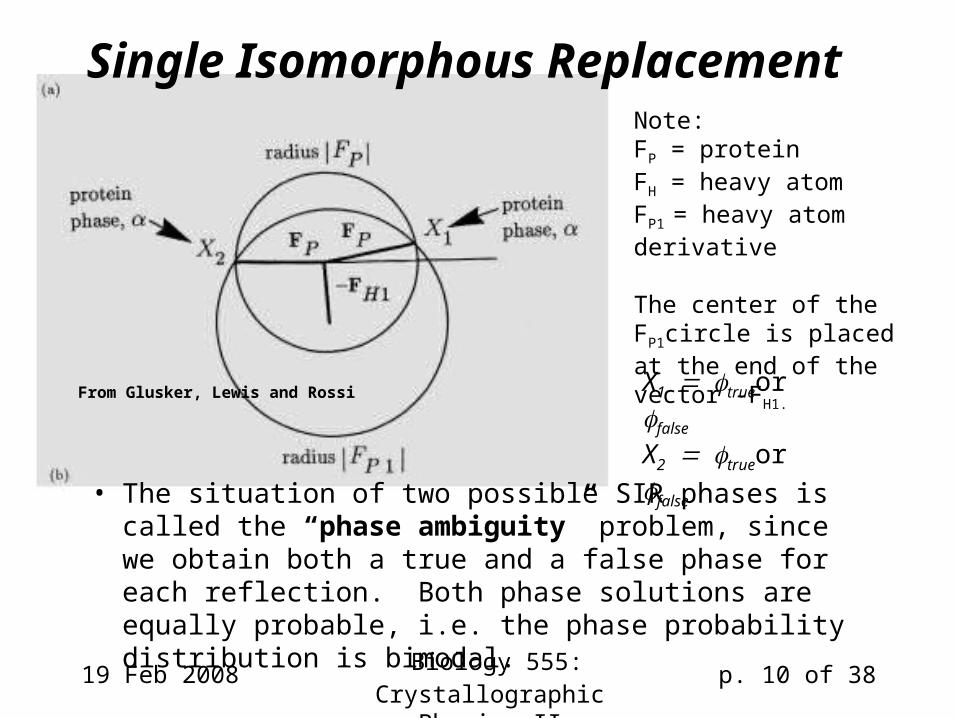
Note: FP = proteinFH = heavy atomFP1 = heavy atom derivative
The center of the FP1circle is placed at the end of the vector -FH1.
Single Isomorphous Replacement
• The situation of two possible SIR phases is called the “phase ambiguity” problem, since we obtain both a true and a false phase for each reflection. Both phase solutions are equally probable, i.e. the phase probability distribution is bimodal.

19 Feb 2008 Biology 555:Crystallographic Phasing II
p. 11 of 38
X1 trueor false
X2 trueor false
From Glusker, Lewis and Rossi
Note: FP = proteinFH = heavy atomFP1 = heavy atom derivative
The center of the FP1circle is placed at the end of the vector -FH1.
Resolving the Phase Ambugity
Add more information:(1) Add another derivative (Multiple Isomorphous Replacement)(2) Use a density modification technique (solvent flattening) (3) Add anomalous data (SIR with anomalous scattering)
19 Feb 2008 Biology 555:Crystallographic Phasing II
p. 12 of 38
X true
X false
X fals
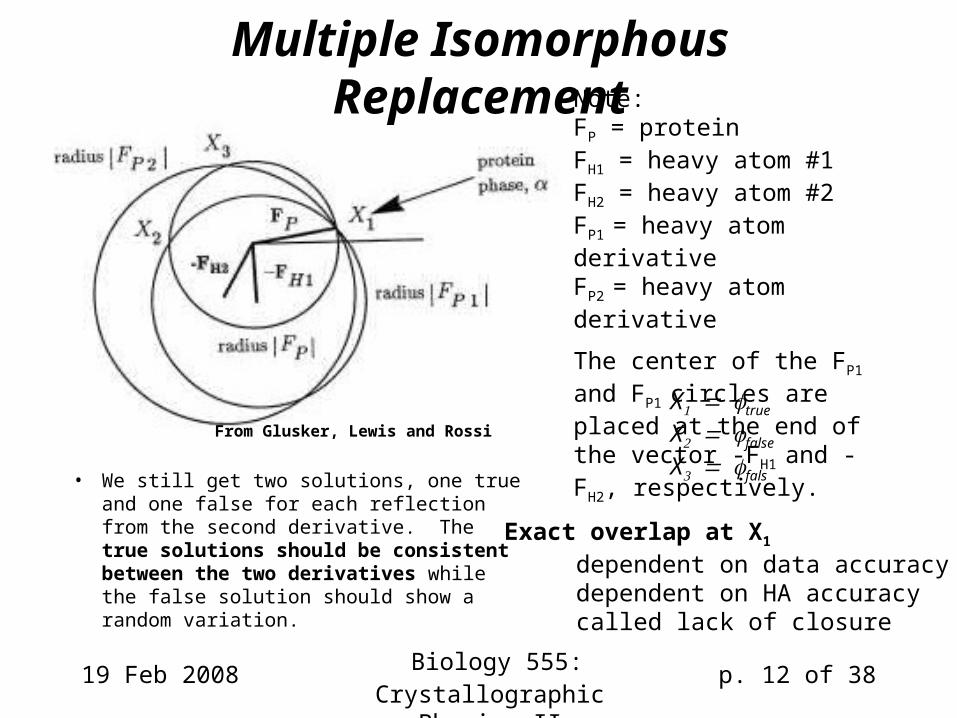
Exact overlap at X1
dependent on data accuracy dependent on HA accuracy called lack of closure
From Glusker, Lewis and Rossi
Note: FP = proteinFH1 = heavy atom #1FH2 = heavy atom #2FP1 = heavy atom derivative FP2 = heavy atom derivative
The center of the FP1 and FP1
circles are placed at the end of the vector -FH1 and -FH2, respectively.
Multiple Isomorphous Replacement
• We still get two solutions, one true and one false for each reflection from the second derivative. The true solutions should be consistent between the two derivatives while the false solution should show a random variation.
19 Feb 2008 Biology 555:Crystallographic Phasing II
p. 13 of 38
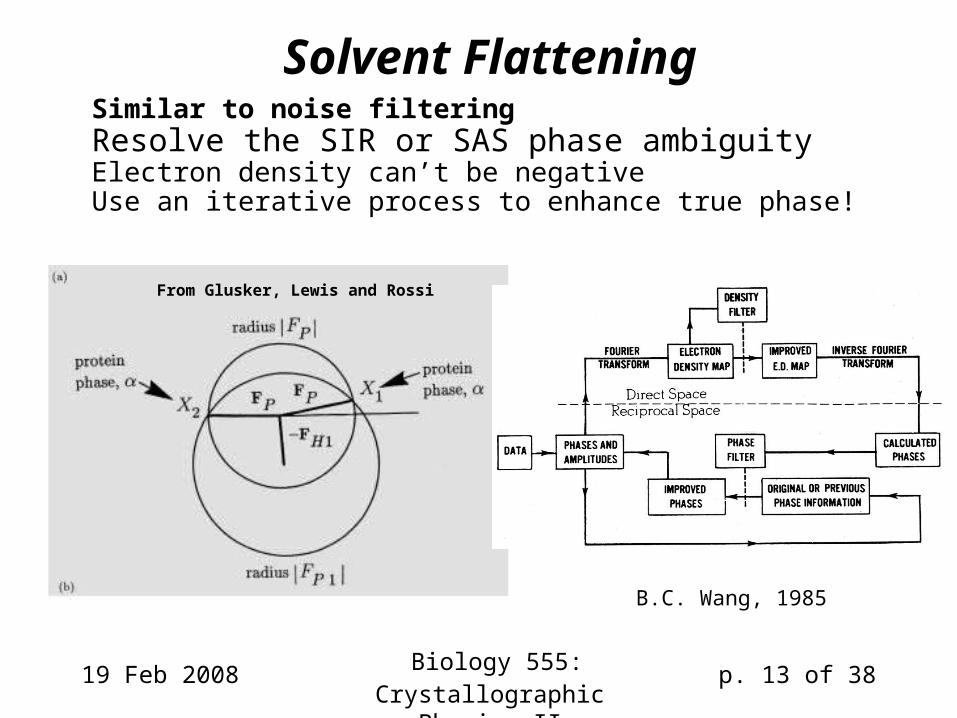
B.C. Wang, 1985
From Glusker, Lewis and Rossi
Solvent FlatteningSimilar to noise filteringResolve the SIR or SAS phase ambiguityElectron density can’t be negative Use an iterative process to enhance true phase!

19 Feb 2008 Biology 555:Crystallographic Phasing II
p. 14 of 38
How does solvent flattening resolve the phase ambiguity?
• Solvent flattening can locate and enhance the protein image—viz., whatever is not solvent must be protein!
• From the protein image, the phases of the structure factors of the protein can be calculated
• These calculated phases are then used to select the true phases from sets of true and false phases
19 Feb 2008 Biology 555:Crystallographic Phasing II
p. 15 of 38
Using the structure to solve the phase ambiguity
• Thus, in essence, the phase ambiguity is resolved by the protein image itself!
• This solvent-flattening process was made practical by the introduction of the ISIR/ISAS program suite (Wang, 1985) and other phasing programs such DM and PHASES are based on this approach.
19 Feb 2008 Biology 555:Crystallographic Phasing II
p. 16 of 38
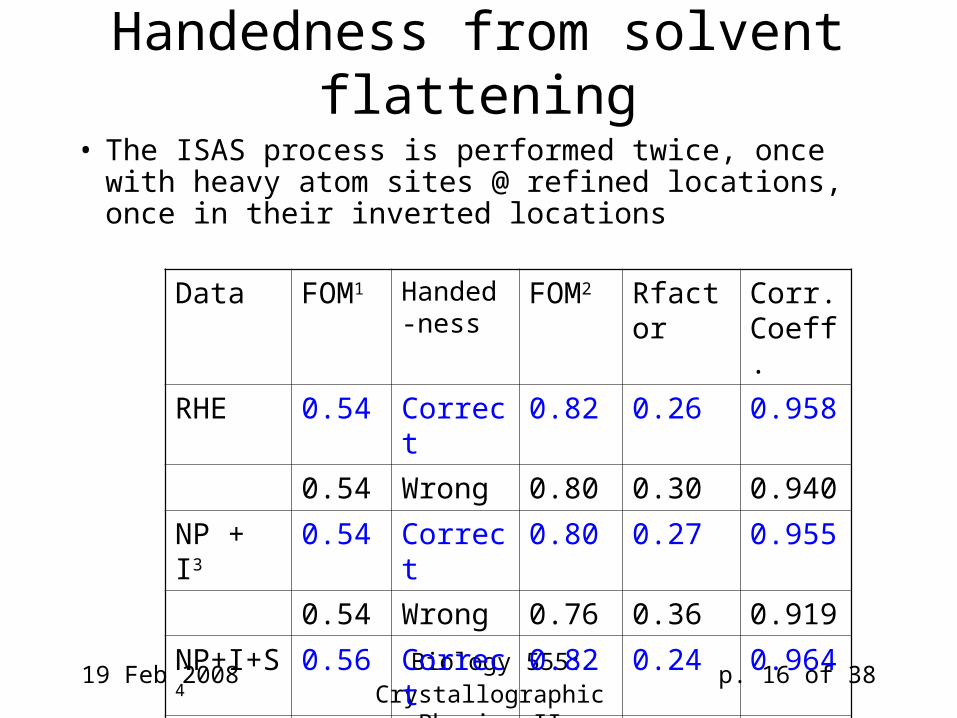
Handedness from solvent flattening
• The ISAS process is performed twice, once with heavy atom sites @ refined locations, once in their inverted locations
Data FOM1 Handed-ness
FOM2 Rfactor Corr.Coeff.
RHE 0.54 Correct 0.82 0.26 0.958
0.54 Wrong 0.80 0.30 0.940
NP + I3 0.54 Correct 0.80 0.27 0.955
0.54 Wrong 0.76 0.36 0.919
NP+I+S4 0.56 Correct 0.82 0.24 0.964
0.56 Wrong 0.78 0.35 0.926
19 Feb 2008 Biology 555:Crystallographic Phasing II
p. 17 of 38
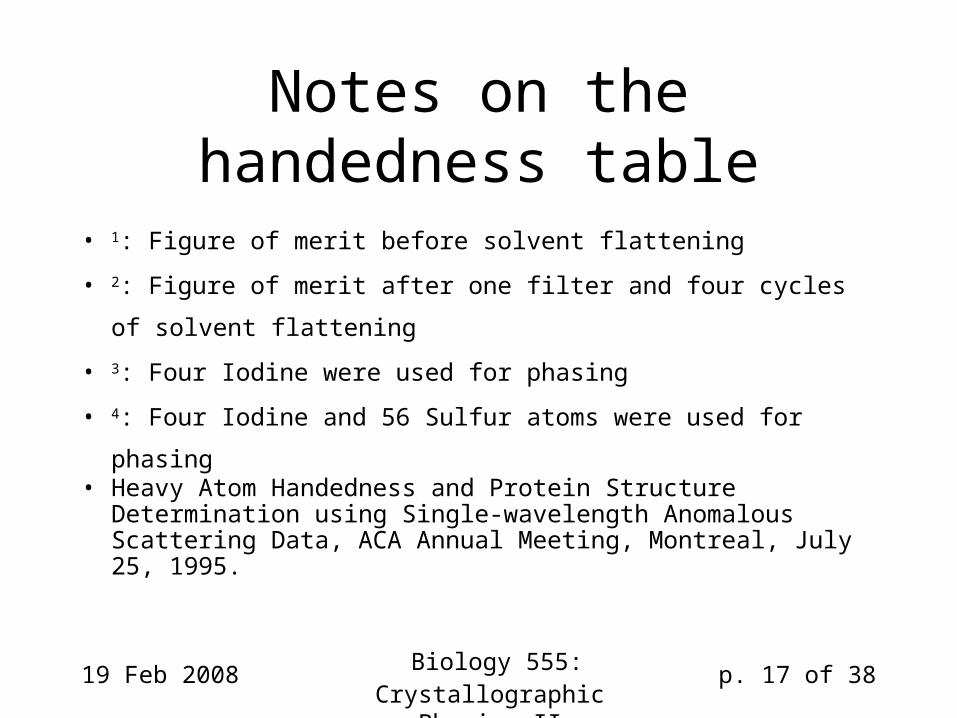
Notes on the handedness table
• 1: Figure of merit before solvent flattening
• 2: Figure of merit after one filter and four cycles of solvent
flattening
• 3: Four Iodine were used for phasing
• 4: Four Iodine and 56 Sulfur atoms were used for phasing• Heavy Atom Handedness and Protein Structure Determination
using Single-wavelength Anomalous Scattering Data, ACA Annual Meeting, Montreal, July 25, 1995.

19 Feb 2008 Biology 555:Crystallographic Phasing II
p. 18 of 38
Does the correct hand make a difference?
• Yes!
• The wrong hand will give the mirror image!
19 Feb 2008 Biology 555:Crystallographic Phasing II
p. 19 of 38
Anomalous Dispersion Methods
• All elements display an anomalous dispersion (AD) effect in X-ray diffraction
• For light elements (H, C, N, O), anomalous dispersion effects are negligible; they’re small even for S and P at typical X-ray energies
• For heavier elements, especially when the X-ray wavelength approaches an atomic absorption edge of the element, these AD effects can be very large.

19 Feb 2008 Biology 555:Crystallographic Phasing II
p. 20 of 38
Scattering power when anomalous scattering exists
The scattering power of an atom exhibiting AD effects is:
fAD = fn + f' + if”where:fnis the normal scattering power of the atom in absence of
AD effectsf' arises from the AD effect and is a real factor
(+/- signed) added to fn
f" is an imaginary term which also arises from the AD effect
f" is always positive and 90° ahead of (fn + f') in phase angle
19 Feb 2008 Biology 555:Crystallographic Phasing II
p. 21 of 38
f’ and f”
• The values of f' and f" are highly dependent on the wavelength of the X-radiation.
• In the absence of AD effects, Ihkl = I-h-k-l (Friedel’s Law).
• With AD effects, Ihkl ≠ I-h-k-l (Friedel’s Law breaks down).
• Accurate measurement of Friedel pair differences can be used to extract starting phases if the AD effect is large enough.
19 Feb 2008 Biology 555:Crystallographic Phasing II
p. 22 of 38
f”
Fn
Fhkl
real
F-h-k-lΔf”
F-n
F+++
F---
real
f’
f’
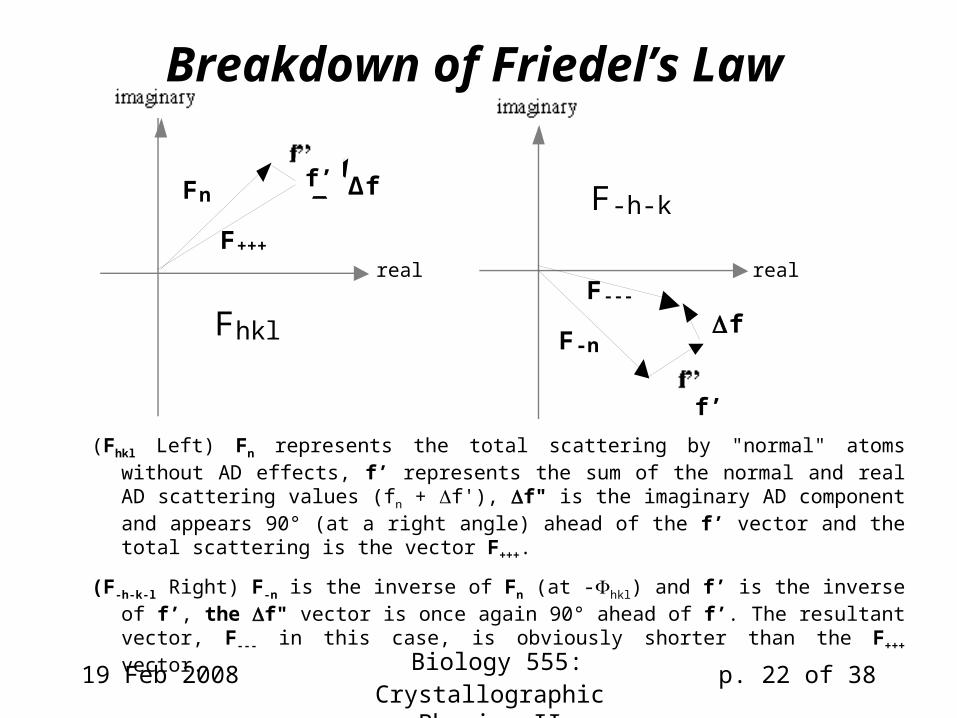
Breakdown of Friedel’s Law
(Fhkl Left) Fn represents the total scattering by "normal" atoms without AD effects, f’ represents the sum of the normal and real AD scattering values (fn + f'), f" is the imaginary AD component and appears 90° (at a right angle) ahead of the f’ vector and the total scattering is the vector F+++.
(F-h-k-l Right) F-n is the inverse of Fn (at -hkl) and f’ is the inverse of f’, the f" vector is once again 90° ahead of f’. The resultant vector, F--- in this case, is obviously shorter than the F+++ vector.
19 Feb 2008 Biology 555:Crystallographic Phasing II
p. 23 of 38
Collecting Anomalous Scattering Data
• Anomalous scatterers, such as selenium, are generally incorporated into the protein during expression of the protein or are soaked into the crystals in a manner similar to preparing a heavy atom derivative.
• Bromine, iodine, xenon and traditional heavy atom compounds are also good anomalous scatterers.
19 Feb 2008 Biology 555:Crystallographic Phasing II
p. 24 of 38
How strong is the signal?
• The anomalous signal, the difference between |F+++| and |F---| is generally about one order of magnitude smaller than that between |FPH(hkl)|, and |FP(hkl)|.
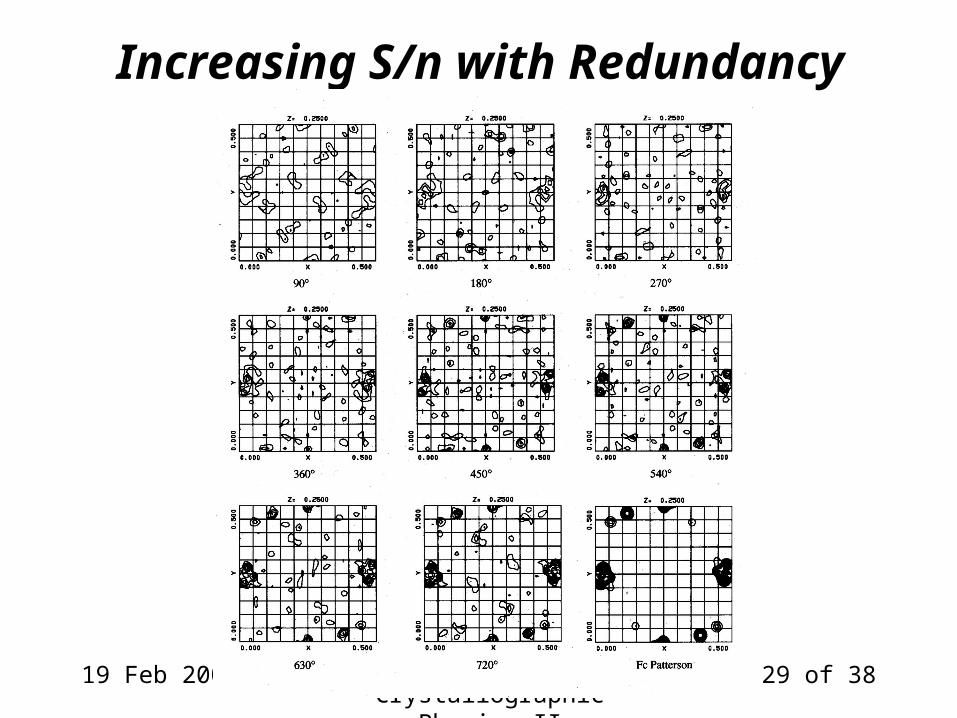
• Thus, the signal-to-noise (S/n) level in the data plays a critical role in the success of anomalous scattering experiments, i.e. the higher the S/n in the data the greater the probability of producing an interpretable electron density map.
19 Feb 2008 Biology 555:Crystallographic Phasing II
p. 25 of 38
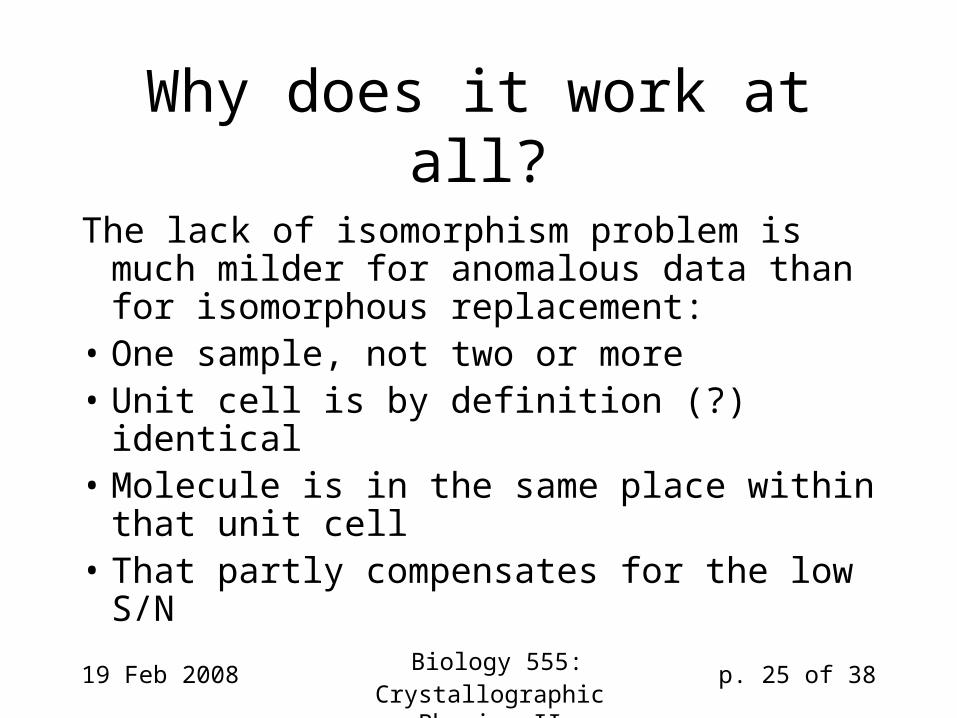
Why does it work at all?
The lack of isomorphism problem is much milder for anomalous data than for isomorphous replacement:
• One sample, not two or more• Unit cell is by definition (?) identical• Molecule is in the same place within that
unit cell• That partly compensates for the low S/N
19 Feb 2008 Biology 555:Crystallographic Phasing II
p. 26 of 38
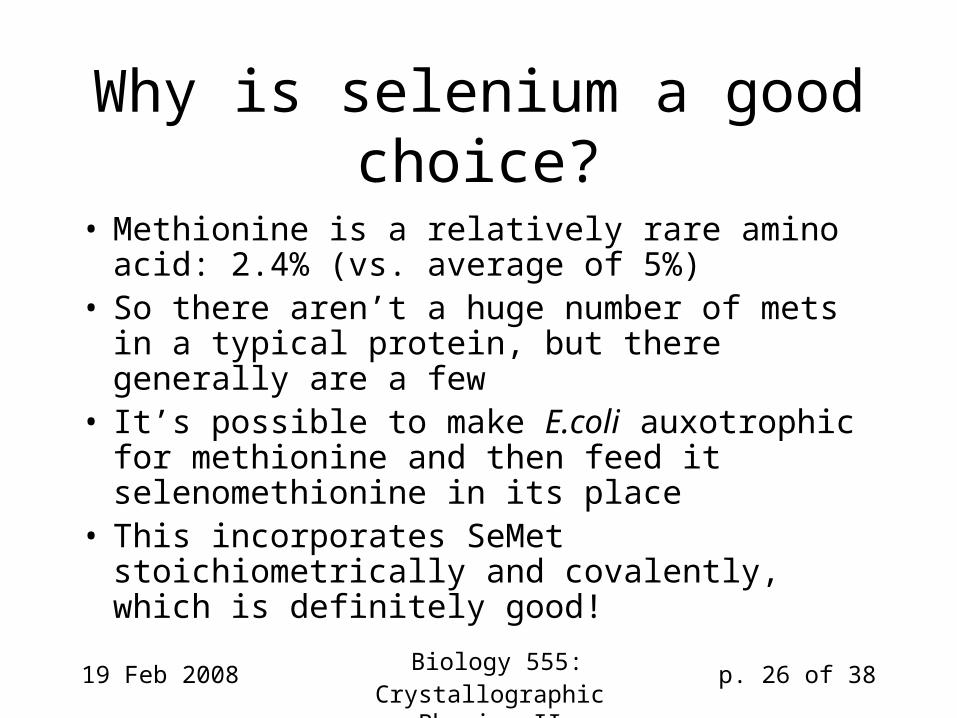
Why is selenium a good choice?
• Methionine is a relatively rare amino acid: 2.4% (vs. average of 5%)
• So there aren’t a huge number of mets in a typical protein, but there generally are a few
• It’s possible to make E.coli auxotrophic for methionine and then feed it selenomethionine in its place
• This incorporates SeMet stoichiometrically and covalently, which is definitely good!
19 Feb 2008 Biology 555:Crystallographic Phasing II
p. 27 of 38
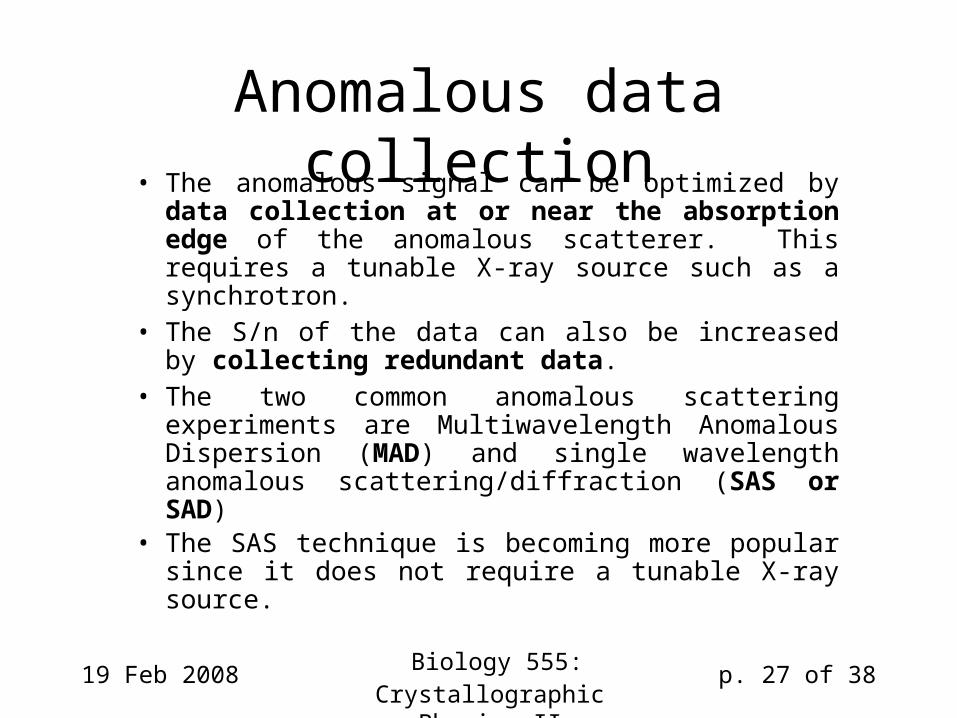
Anomalous data collection• The anomalous signal can be optimized by data
collection at or near the absorption edge of the anomalous scatterer. This requires a tunable X-ray source such as a synchrotron.
• The S/n of the data can also be increased by collecting redundant data.
• The two common anomalous scattering experiments are Multiwavelength Anomalous Dispersion (MAD) and single wavelength anomalous scattering/diffraction (SAS or SAD)
• The SAS technique is becoming more popular since it does not require a tunable X-ray source.
19 Feb 2008 Biology 555:Crystallographic Phasing II
p. 28 of 38
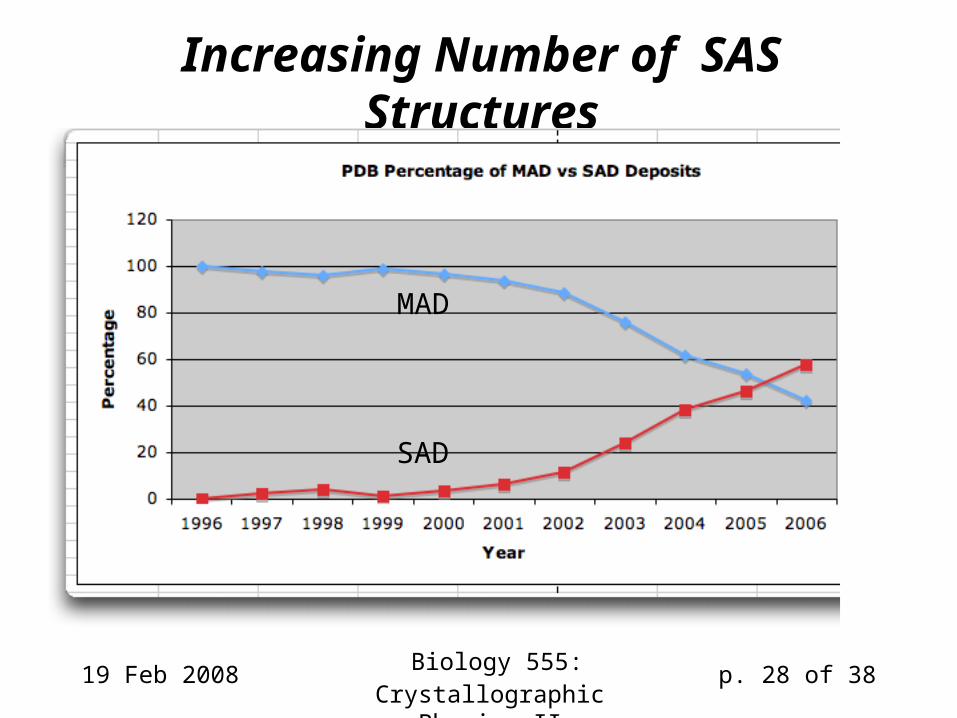
Increasing Number of SAS Structures
MAD
SAD
19 Feb 2008 Biology 555:Crystallographic Phasing II
p. 29 of 38
Increasing S/n with Redundancy
19 Feb 2008 Biology 555:Crystallographic Phasing II
p. 30 of 38
From Glusker, Lewis and Rossi
.
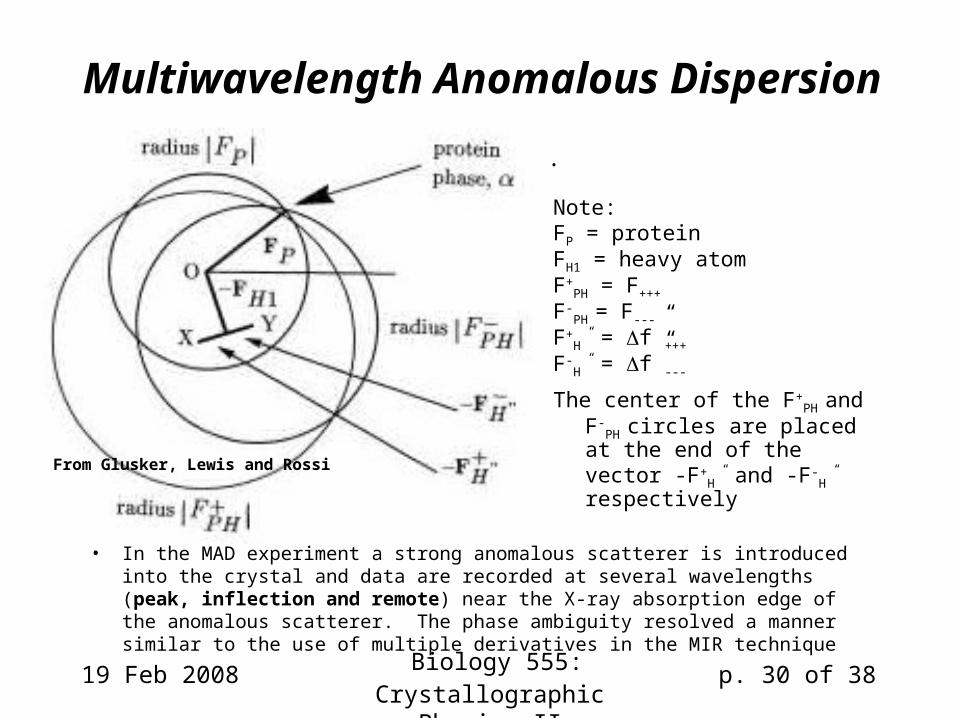
Multiwavelength Anomalous Dispersion
Note: FP = proteinFH1 = heavy atomF+
PH = F+++
F-PH = F---
F+H” = f”+++
F-H” = f”---
The center of the F+PH and F-
PH
circles are placed at the end of the vector -F+
H” and -F-H”
respectively
• In the MAD experiment a strong anomalous scatterer is introduced into the crystal and data are recorded at several wavelengths (peak, inflection and remote) near the X-ray absorption edge of the anomalous scatterer. The phase ambiguity resolved a manner similar to the use of multiple derivatives in the MIR technique
19 Feb 2008 Biology 555:Crystallographic Phasing II
p. 31 of 38
Single Wavelength Anomalous Scattering
• The SAS method, which combines the use of SAS data and solvent flattening to resolve phase ambiguity was first introduced in the ISAS program (Wang, 1985). The technique is very similar to resolving the phase ambiguity in SIR data.
• The SAS method does not require a tunable source and successful structure determination can be carried out using a home X-ray source on crystals containing anomalous scatterers with sufficiently large f” such as iron, copper, iodine, xenon and many heavy atom salts.
19 Feb 2008 Biology 555:Crystallographic Phasing II
p. 32 of 38
Sulfur S-SAS: experimental realities
• The ultimate goal of the SAS method is the use of S-SAS to phase protein data since most proteins contain sulfur. However sulfur has a very weak anomalous scattering signal with f” = 0.56 e- for Cu X-rays. The S-SAS method requires careful data collection and crystals that diffract to 2Å resolution.
• A high symmetry space group (more internal symmetry equivalents) increases the chance of success.
• The use of soft X-rays such as Cr K ( = 2.2909Å) X-rays doubles the sulfur signal (f” = 1.14 e-).
• There over 20 S-SAS structures in the Protein Data Bank.
19 Feb 2008 Biology 555:Crystallographic Phasing II
p. 33 of 38
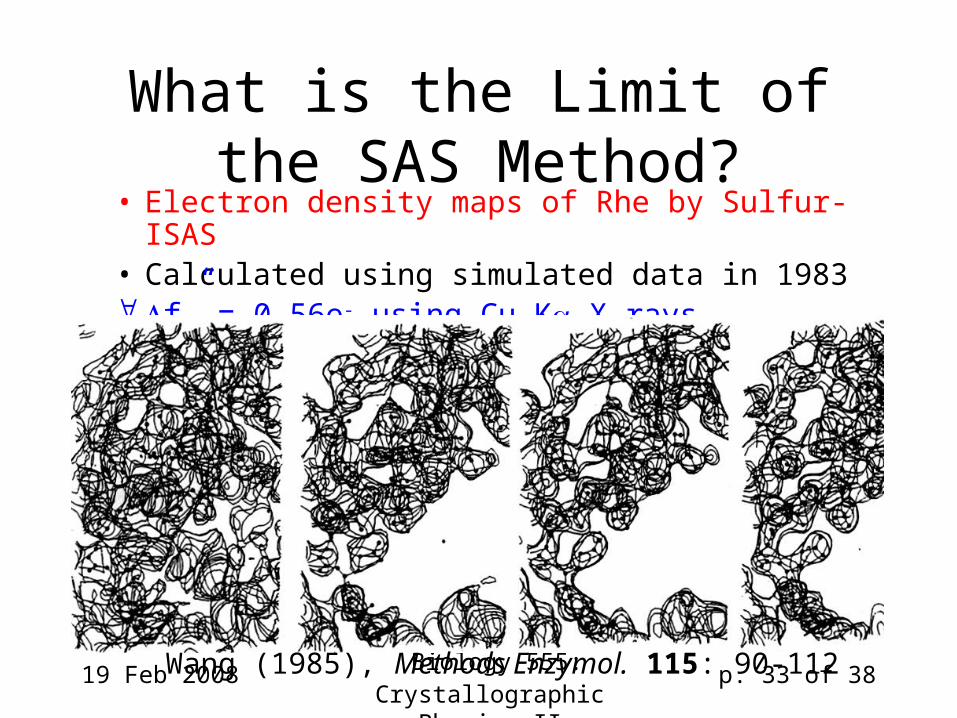
What is the Limit of the SAS Method?
• Electron density maps of Rhe by Sulfur-ISAS• Calculated using simulated data in 1983 f” = 0.56e- using Cu K X-rays
Wang (1985), Methods Enzymol. 115: 90-112
19 Feb 2008 Biology 555:Crystallographic Phasing II
p. 34 of 38
Molecular Replacement
• Molecular replacement has proven effective for solving macromolecular crystal structures based upon the knowledge of homologous structures.
• The method is straightforward and reduces the time and effort required for structure determination because there is no need to prepare heavy atom derivatives and collect their data.
• Model building is also simplified, since little or no chain tracing is required.

19 Feb 2008 Biology 555:Crystallographic Phasing II
p. 35 of 38
Molecular Replacement:Practical Considerations
• The 3-dimensional structure of the search model must be very close (< 1.7Å r.m.s.d.) to that of the unknown structure for the technique to work.
• Sequence homology between the model and unknown protein is helpful but not strictly required. Success has been observed using search models having as low as 17% sequence similarity.
• Several computer programs such as AmoRe, X-PLOR/CNS PHASER are available for MR calculations.
19 Feb 2008 Biology 555:Crystallographic Phasing II
p. 36 of 38
px.cryst.bbk.ac.uk/03/sample/molrep.htm
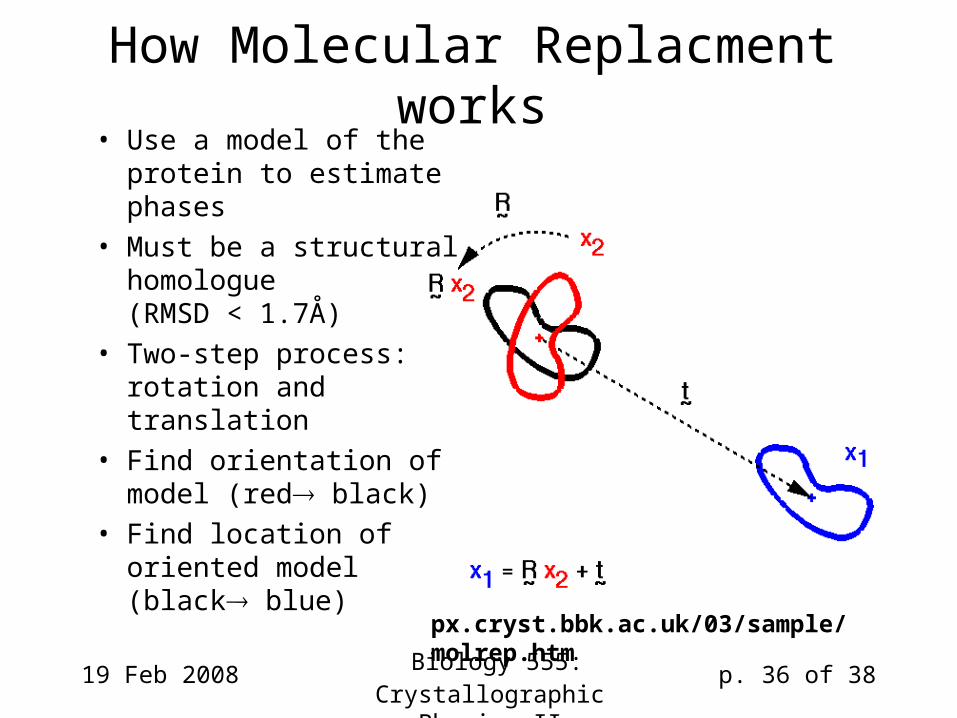
How Molecular Replacment works• Use a model of the
protein to estimate phases
• Must be a structural homologue(RMSD < 1.7Å)
• Two-step process: rotation and translation
• Find orientation of model (red black)
• Find location of oriented model (black blue)

19 Feb 2008 Biology 555:Crystallographic Phasing II
p. 37 of 38
Using a protein model to estimate phases:the rotation function
• We need to determine the model’s orientation in X1’s unit cell
• We use a Patterson search approach in (,,), which are Euler angles associated with the rotational space

19 Feb 2008 Biology 555:Crystallographic Phasing II
p. 38 of 38
Euler angles for rotation function
The coordinate system is rotated by:
• an angle around the original z axis;
• then by an angle around the new y axis;
• and then by an angle around the final z axis.
zyz convention
19 Feb 2008 Biology 555:Crystallographic Phasing II
p. 39 of 38
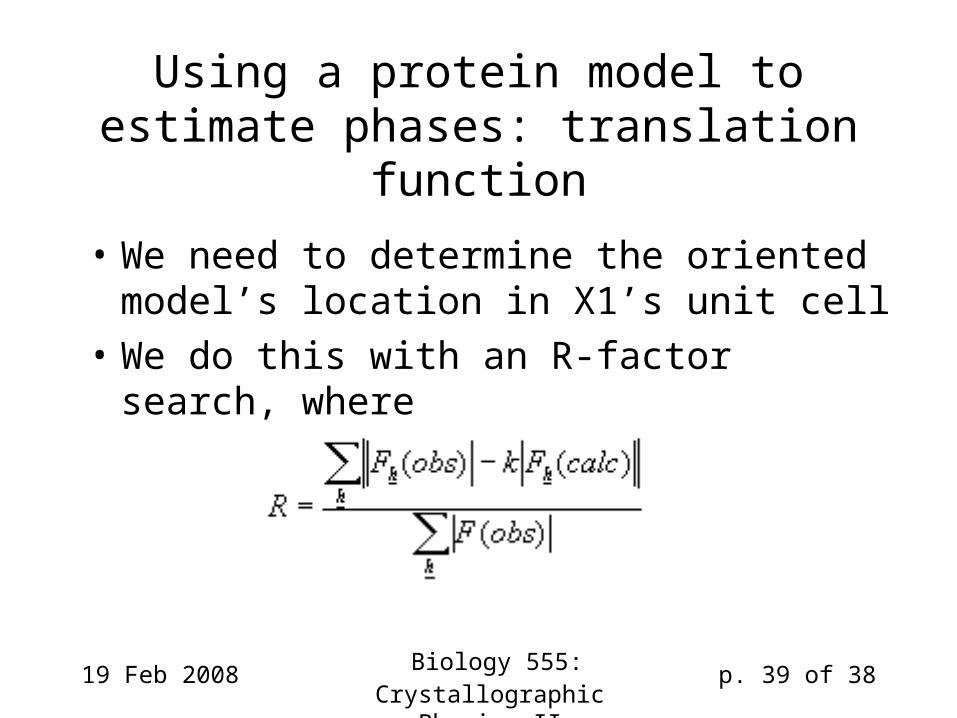
Using a protein model to estimate phases: translation function
• We need to determine the oriented model’s location in X1’s unit cell
• We do this with an R-factor search, where
19 Feb 2008 Biology 555:Crystallographic Phasing II
p. 40 of 38
Translation functions• Oriented model is stepped through the X1 unit
cell using small increments in x, y, and z (e.g. x x+ step)
• The point where R is lowest represents the correct location
• There exists an alternative method that uses maximum likelihood to find the translation peak; this notion is embodied in the software package PHASER by Randy Read