Embed Size (px)
Citation preview

18 January 2008 Copyright © 2008 BEST Robotics, Inc. All rights reserved. 1
Jubilee BEST RoboticsJubilee BEST Robotics
Welcome to BEST Robotics

18 January 2008 Copyright © 2008 BEST Robotics, Inc. All rights reserved. 2
Overview of OrganizationOverview of Organization OfficersPresident Janne Ackerman Raytheon Company
Vice-President George Blanks (District 5) Auburn University
Secretary Greg Young (District 2) Freescale Semiconductor
Treasurer Mary Helmick (District 3) Texas Instruments
DirectorsMary Lou Ewald Auburn University Awards and Judging Committee
Robin Fenton McGill Toolen Catholic High School Teacher Advisory Committee
Larry Frutiger Retired, The Boeing Co Public Awareness Committee
John Martini University of Arkansas – Fort Smith Policy and Procedure Committee
Velda Morris School District of Philadelphia
Rudy Zupanic J. Preston Automation Board Development Committee
Control Platform Committee – Greg Young
Hub Development Committee – George Blanks
Strategic Alliances – Mary Helmick
Terry Grimley, Ted Malher, Steve Marium, Jon Cutshaw and many others

18 January 2008 Copyright © 2008 BEST Robotics, Inc. All rights reserved. 3
Advisory CouncilAdvisory Council Dr. Paul Beran Chancellor – Univ. of Arkansas – Fort Smith Dr. Ken Berry Professor – California State Univ. Director of Robo-Educators David Brant Senior V.P. Cessna Aircraft – Engineering Wichita, Kansas Chris Culbert NASA – Human Robotics Systems Johnson Space Center Dr. Richard Gale Dean of Undergraduate Studies – Texas Tech University Art George VP Texas Instruments Dallas, Texas Dr. Rubio Dean of College of Engineering – University of North Texas Hugh Hall Brigadier General – U.S. Army (Retired) VP Logistics/Info. – MTCI Steve Harris President – Rixan Associates Dayton, Ohio Susan Herman VP Texas Instruments – Dallas, Texas Joerg Kemnade VP Engineering – Degussa Corporation Mobile, Alabama Steve Perry The Forum – Harris, DeVille, & Associates Mobile, Alabama Lee Sampson Principle Engineer Lockheed Martin Aeronautics Fort Worth, TX Charles Shepard Technology Development - Bell Helicopter Textron – Colleyville, TX Joseph Sun School of Engineering – University of Pennsylvania Andrew Unverzagt Senior Director – TXU Energy – Dallas, Texas Ronald Weaver President/CEO CAMtech Precision Manufacturing – Jupiter, Florida

18 January 2008 Copyright © 2008 BEST Robotics, Inc. All rights reserved. 4
Vision and Mission of BESTVision and Mission of BEST
Vision
To excite our nation’s students about engineering, science and technology to unlock their imagination and discover their potential.
• Mission
To inspire students to pursue careers in engineering, science, technology and math through participation in a sports-like science-and engineering-based robotics competition.

18 January 2008 Copyright © 2008 BEST Robotics, Inc. All rights reserved. 5
Annual Cost NationallyAnnual Cost Nationally
$85 per student

18 January 2008 Copyright © 2008 BEST Robotics, Inc. All rights reserved. 6
Market AnalysisMarket Analysis Together, BEST and FIRST control at least 90% of
the middle school and high school educational workforce development market.
FIRST Robotics is a program similar to BEST, but with much higher costs (to the schools in particular), and no requirement that the students do the work.
BEST and FIRST have developed LEGO Robotics programs for Kindergarten and Grade School students to extend student coverage from K-12
(LEGO League – GEAR)

18 January 2008 Copyright © 2008 BEST Robotics, Inc. All rights reserved. 7
Market AnalysisMarket Analysis BEST game season and FIRST game season run
during opposite semesters, so there is no competition for time or venue. Some teams participate in both programs.
BEST and FIRST Robotics compete for many of the same funding sources. FIRST has a higher profile (visibility) and a dedicated paid staff resulting in a much large share of funding.

18 January 2008 Copyright © 2008 BEST Robotics, Inc. All rights reserved. 8
Organization (Future)Organization (Future) BRI Board of Directors (Working Board/Committees)
Advisory Council recommends three paid positions within the next three years.
Currently the only BRI income is the $2000 per hub license fee. This covers insurance and administration costs.

18 January 2008 Copyright © 2008 BEST Robotics, Inc. All rights reserved. 9
GoalsGoals Maintain current “culture” of the program that puts the interest of students above
all else and understands the reason why so many volunteers do what they do.
Implement BEST Robotics across the U.S. and internationally.
Promote workforce development alliances between industry, educators, and the BEST Program.
Provide program involvement for grades K-12.
Increase participation of women and minority students in rural and inner city schools.
Provide continuous infusion of new technology into the program at little to no cost to Hubs or Regionals.
Establish a college scholarship program.

BEST Demographics BEST Demographics 2007 Survey2007 Survey
BEST Advisory Council
18 January 2008
Copyright © 2008 BEST Robotics, Inc. All rights reserved.

18 January 2008 Copyright © 2008 BEST Robotics, Inc. All rights reserved. 11
BackgroundBackground The board of directors initiated a survey of participant
demographics in 2005 that was continued in 2006 and 2007.
This was done through a form to be filled out by each team and submitted at the Hub competition.
Hub directors were asked to enter the data at www.bestinc.org.

18 January 2008 Copyright © 2008 BEST Robotics, Inc. All rights reserved. 12
Process OutcomesProcess Outcomes In 2006 we received data from 22 of 31 hubs. In 2007 we received data from 29 of 33 hubs. As in 2006, the reported student totals are
extrapolated to include the hubs that did not submit data.

18 January 2008 Copyright © 2008 BEST Robotics, Inc. All rights reserved. 13
Size of BEST – ApproachSize of BEST – Approach 29 of the 33 hubs reported numbers for 2007, but all
33 hubs reported the number of schools participating. We computed the total student numbers by
extrapolating data from team counts that were reported on the BEST website.

18 January 2008 Copyright © 2008 BEST Robotics, Inc. All rights reserved. 14
BEST Direct ImpactBEST Direct Impact Average students/team for 2007 is 17.8, slightly above last
year’s 16.7.
2005 2006 2007
Hubs 27 31 33
Teams 519 535 584
Students 8719 8935 9998

18 January 2008 Copyright © 2008 BEST Robotics, Inc. All rights reserved. 15
Gender – All ParticipantsGender – All Participants
31%
69%
Female
Male
This reflects ALL student participants (robot construction team and BEST Award team)
We reported 32% female for 2006 and 29% in 2005.

18 January 2008 Copyright © 2008 BEST Robotics, Inc. All rights reserved. 16
Gender – Based on Gender – Based on ParticipationParticipation
Robot Construction Team
80%
20%
Males Females
BEST Award Team
58%
42%

18 January 2008 Copyright © 2008 BEST Robotics, Inc. All rights reserved. 17
Race – 25 Hubs ReportingRace – 25 Hubs Reporting
2006
12%
6%
65%
15%2%
African-American
Asian
Caucasian
Hispanic
Other
2007
13%
6%
63%
15%
3%
Race demographics are comparable to last year. This portion of the survey is optional. As such, the data for 2007 reflects a return response of approximately 70%
of the BEST students.

18 January 2008 Copyright © 2008 BEST Robotics, Inc. All rights reserved. 18
Type of SchoolType of School
82%
12%4%2%
Public
Private
Home
Other
This is identical to last year.

18 January 2008 Copyright © 2008 BEST Robotics, Inc. All rights reserved. 19
School Grade LevelSchool Grade Level
17%
68%
10%5%
Junior/Middle
High School
K-12
Other
This is nearly identical to last year.
18 January 2008 Copyright © 2008 BEST Robotics, Inc. All rights reserved. 20
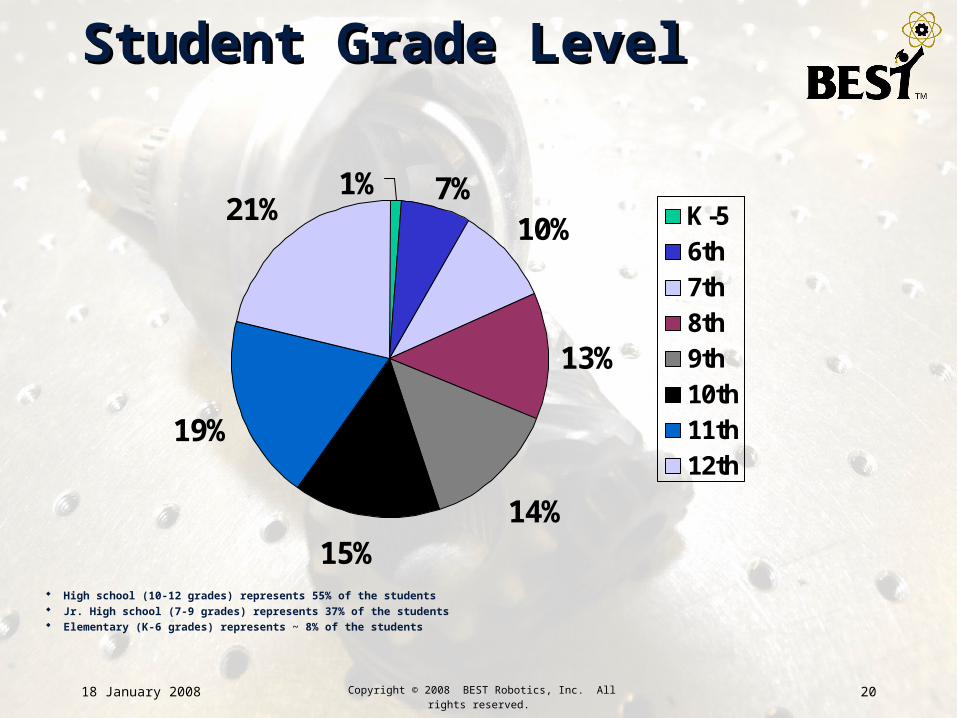
Student Grade LevelStudent Grade Level
10%
13%
14%15%
19%
21%7%1%
K-56th7th8th9th10th11th12th
High school (10-12 grades) represents 55% of the students Jr. High school (7-9 grades) represents 37% of the students Elementary (K-6 grades) represents ~ 8% of the students
18 January 2008 Copyright © 2008 BEST Robotics, Inc. All rights reserved. 21
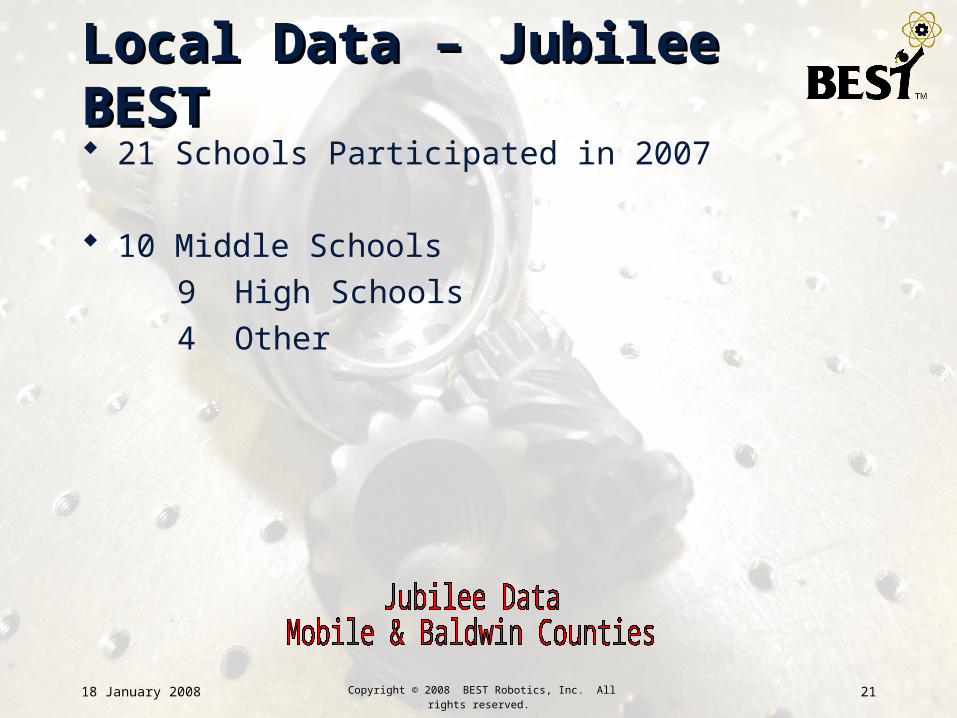
Local Data – Jubilee BESTLocal Data – Jubilee BEST 21 Schools Participated in 2007
10 Middle Schools
9 High Schools
4 Other

18 January 2008 Copyright © 2008 BEST Robotics, Inc. All rights reserved. 22
Type of SchoolType of School
62%
33%
5% 0%
Public
Private
Home
Other

18 January 2008 Copyright © 2008 BEST Robotics, Inc. All rights reserved. 23
Gender – All ParticipantsGender – All Participants
37%
63%
Female
Male
This reflects ALL student participants (robot construction team and BEST Award team)

18 January 2008 Copyright © 2008 BEST Robotics, Inc. All rights reserved. 24
Student RepresentationStudent Representation
2007
25%
4%
68%
2%
1% African-American
Asian
Caucasian
Hispanic
Other
This portion of the survey is optional. As such, the data for 2007 reflects a return response of approximately 90% of the BEST students.

18 January 2008 Copyright © 2008 BEST Robotics, Inc. All rights reserved. 25
Likely to Pursue Science, Likely to Pursue Science, Technology, or Engineering CareerTechnology, or Engineering Career
Positive Responses, Gender based
34%
66%
FemaleMale
Percentages based on 502 students.
Responses of All Participants
47%53%
Students Unlikely to Pursue STEM Careers
Students Likely to Pursue STEM Careers

18 January 2008 Copyright © 2008 BEST Robotics, Inc. All rights reserved. 26
Student Grade LevelStudent Grade Level
18%
19%7%
12%
12%
13%18%
1%K-5
6th
7th
8th
9th
10th
11th
12th
High school (9-12 grades) represents 31% of the students Jr. High school (6-8 grades) represents 55% of the students Elementary (K-5 grades) represents ~ 1% of the students
6th
7th
8th9th
11th
12th
10th

18 January 2008 Copyright © 2008 BEST Robotics, Inc. All rights reserved. 27
School Grade LevelSchool Grade Level
38%
43%
14%5%
Junior/Middle
High School
K-12
Other