Embed Size (px)
Citation preview

<Title of Presentation>
By: <Author Name>, <Organization>
<Date>
<Title of Presentation> By: <Author Name>, <Organization>
<Date>
17th INTERNATIONAL CONFERENCE & EXHIBITION
ON LIQUEFIED NATURAL GAS (LNG 17)
CRITICAL SUCCESS FACTORS FOR
ELECTRICITY GENERATION PROJECTS
BASED ON LNG
By: Pablo Quiroga, Repsol-Gas Natural LNG
Enrique Dameno, Repsol
April 18th, 2013
17th INTERNATIONAL CONFERENCE & EXHIBITION ON
LIQUEFIED NATURAL GAS (LNG 17)
© STREAM
2
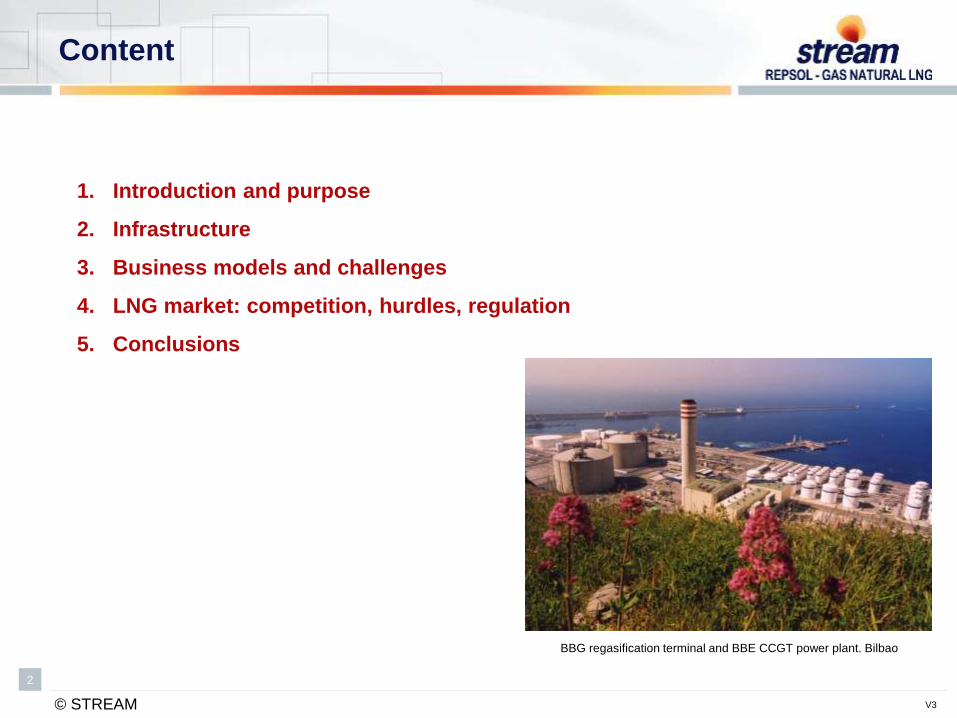
Content
1. Introduction and purpose
2. Infrastructure
3. Business models and challenges
4. LNG market: competition, hurdles, regulation
5. Conclusions
BBG regasification terminal and BBE CCGT power plant. Bilbao
V3

© STREAM
3
Introduction and purpose
This presentation outlines the challenges that the
sponsor of an LNG power generation project faces, the
ways to overcome them and be successful
1
Oil prices have driven power
generation costs extremely
high in many markets
Natural gas is seen as one
solution to reduce the energy
bill
Not all projects manage to
fulfil their objectives in time
and within budget Source: World Energy Outlook 2012. IEA
-
1 000
2 000
3 000
4 000
5 000
6 000
7 000
8 000
9 000
10 000
2010 2015 2020 2025 2030 2035
Po
we
r C
ap
ac
ity (
GW
)
World Power Plants Capacity by fuel type
Marine
CSP
Solar PV
Geothermal
Wind
Bioenergy
Hydro
Nuclear
Gas
Oil
Coal
CSP: Concentrating Solar Power
Solar PV: Solar Photovoltaics
Energy is one of the key
factors in economic
development
© STREAM
4
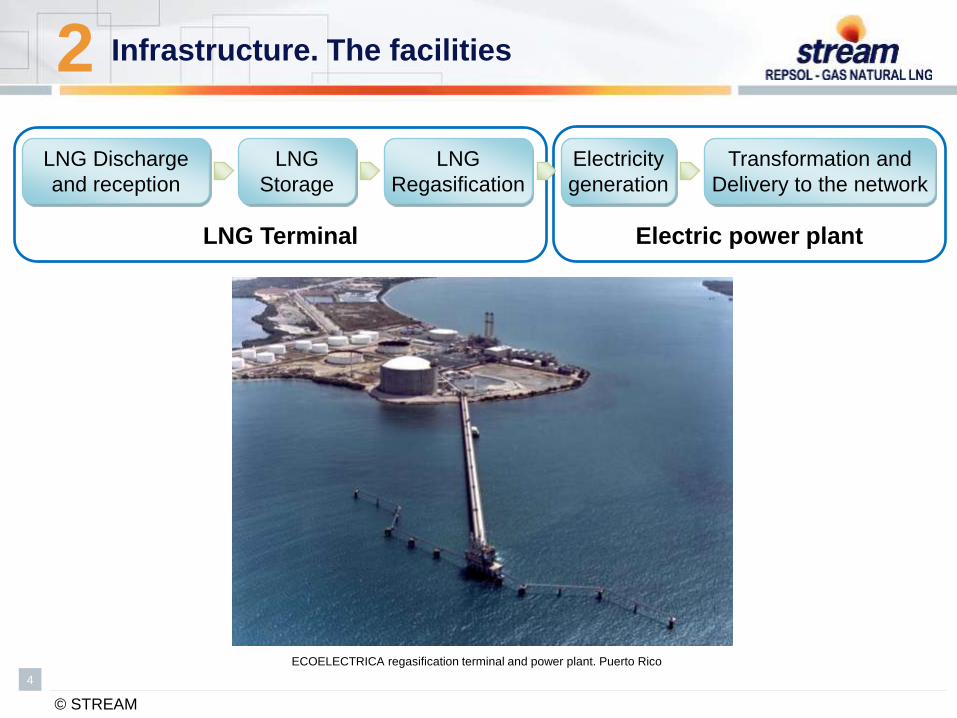
Infrastructure. The facilities 2
LNG Terminal Electric power plant
LNG Discharge
and reception
LNG
Storage
LNG
Regasification
Electricity
generation
Transformation and
Delivery to the network
ECOELECTRICA regasification terminal and power plant. Puerto Rico

© STREAM
5
LNG regasification terminal 2 Typology Onshore and Offshore
Onshore
81 Terminals
Sendout capacity range:1 to 30 Bcma
LNG Storage: 30,000 to 2,700,000 m3
1 or 2 berthing points
Offshore
14 Terminals
Regasification vessel
11 Terminals
Dock sendout
8 Terminals
Sendout capacity range:1 to 4 Bcma
LNG Storage: 125,000 to 150,000 m3
0 or 1 additional berthing point
Buoy sendout
3 Terminals
Sendout capacity :4 Bcma
LNG Storage: 138,000 to 150,000 m3
No berthing point GBS
1 Terminal
Sendout capacity: 8 Bcma
LNG Storage: 250,000 m3
1 berthing point
Mixed configurations
Vessel storage and onshore regasification
2 Terminal
Sendout capacity: 2 Bcma
LNG Storage: 162,000 m3
1 berthing point
Note: Typical ranges
Onshore
(Canaport LNG terminal)
GBS
(Adriatic LNG terminal)
Dock sendout
(Bahia Blanca GasPort)
Buoy sendout
(Neptune LNG terminal)
Mixed configuration
(GNL Mejillones)
© STREAM
6
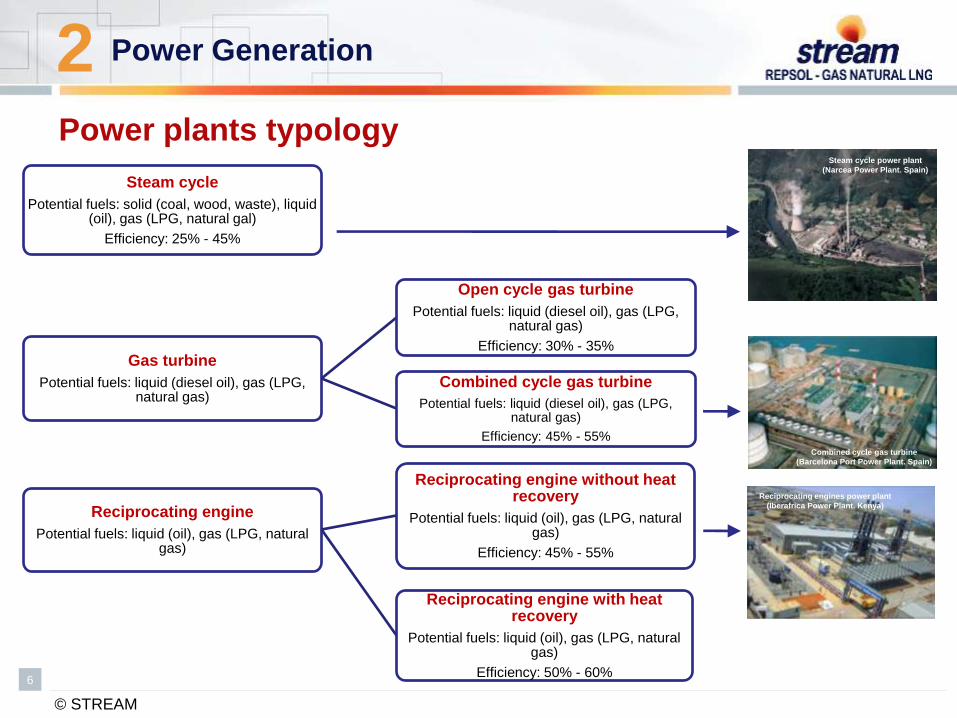
Power Generation 2 Power plants typology
Steam cycle
Potential fuels: solid (coal, wood, waste), liquid (oil), gas (LPG, natural gal)
Efficiency: 25% - 45%
Gas turbine
Potential fuels: liquid (diesel oil), gas (LPG, natural gas)
Open cycle gas turbine
Potential fuels: liquid (diesel oil), gas (LPG, natural gas)
Efficiency: 30% - 35%
Combined cycle gas turbine
Potential fuels: liquid (diesel oil), gas (LPG, natural gas)
Efficiency: 45% - 55%
Reciprocating engine
Potential fuels: liquid (oil), gas (LPG, natural gas)
Reciprocating engine without heat recovery
Potential fuels: liquid (oil), gas (LPG, natural gas)
Efficiency: 45% - 55%
Reciprocating engine with heat recovery
Potential fuels: liquid (oil), gas (LPG, natural gas)
Efficiency: 50% - 60%
Steam cycle power plant
(Narcea Power Plant. Spain)
Combined cycle gas turbine
(Barcelona Port Power Plant. Spain)
Reciprocating engines power plant
(Iberafrica Power Plant. Kenya)
© STREAM
7
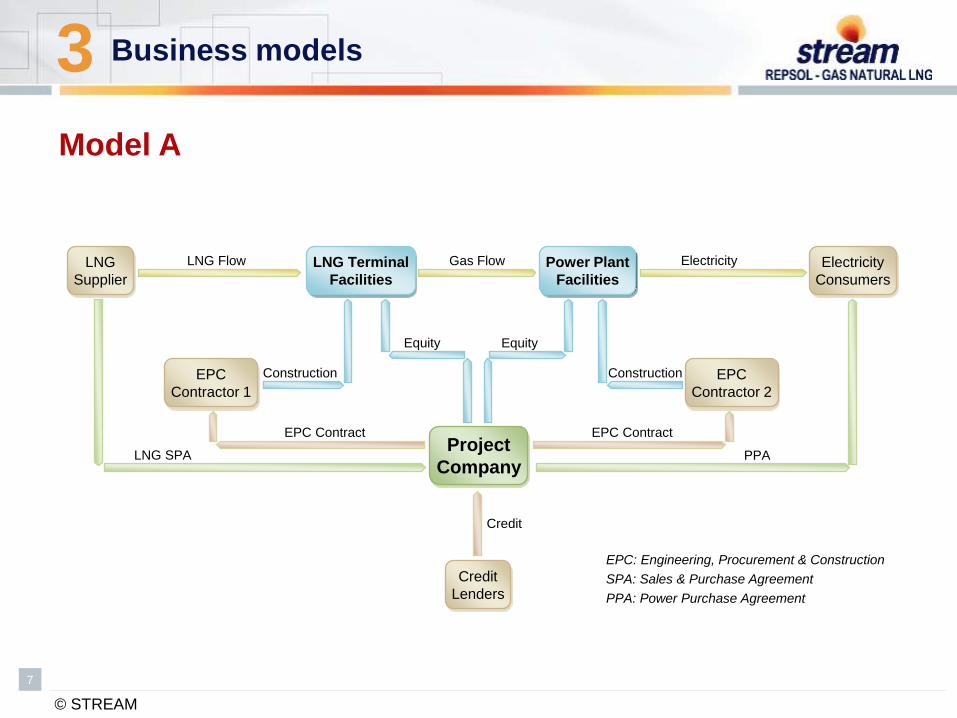
Business models 3
Model A
LNG Terminal
Facilities
Power Plant
Facilities
Project
Company
EPC
Contractor 1
Credit
Lenders
LNG
Supplier
Electricity
Consumers
EPC
Contractor 2
EPC Contract EPC Contract
EPC: Engineering, Procurement & Construction
LNG SPA PPA
Construction Construction
Equity Equity
Credit
LNG Flow Gas Flow Electricity
SPA: Sales & Purchase Agreement
PPA: Power Purchase Agreement
© STREAM
8
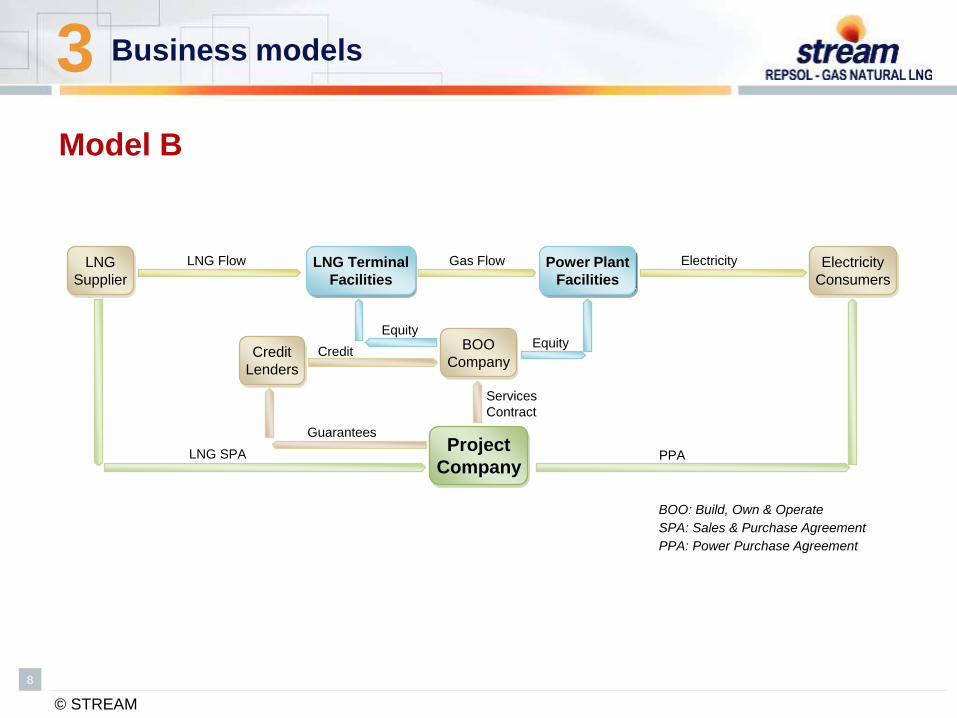
Business models 3
Model B
LNG Terminal
Facilities
Power Plant
Facilities
Project
Company
BOO
Company Credit
Lenders
LNG
Supplier
Electricity
Consumers
Guarantees
Services
Contract
LNG SPA PPA
Equity Equity
Credit
LNG Flow Gas Flow Electricity
SPA: Sales & Purchase Agreement
PPA: Power Purchase Agreement
BOO: Build, Own & Operate
© STREAM
9
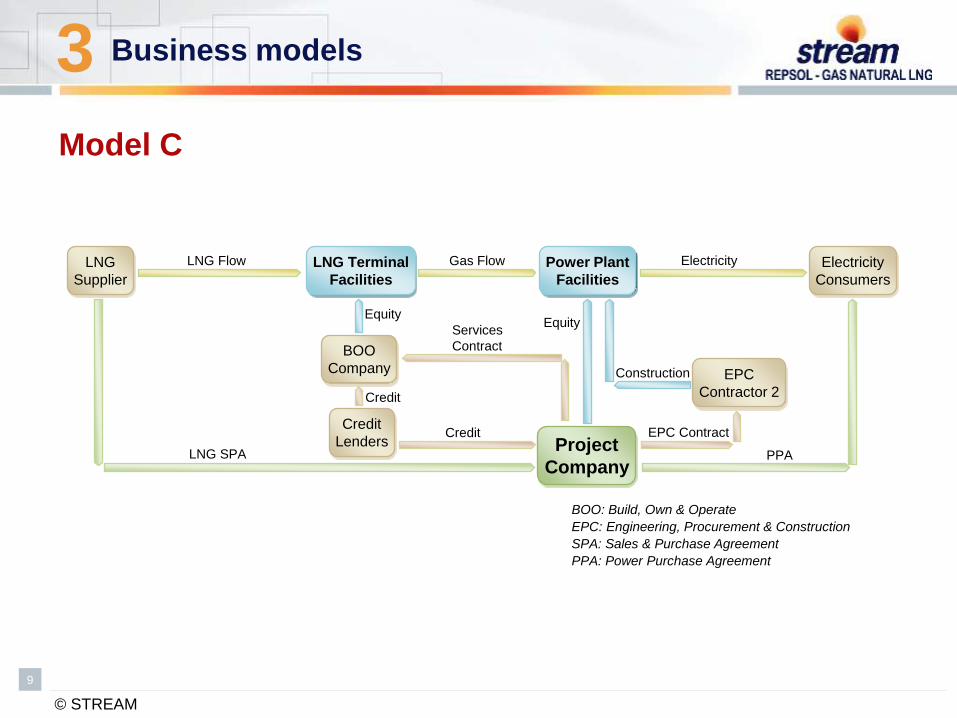
Business models 3
Model C
LNG Terminal
Facilities
Power Plant
Facilities
Project
Company
BOO
Company
Credit
Lenders
LNG
Supplier
Electricity
Consumers
Services
Contract
LNG SPA PPA
Equity Equity
Credit
LNG Flow Gas Flow Electricity
SPA: Sales & Purchase Agreement
PPA: Power Purchase Agreement
BOO: Build, Own & Operate
EPC
Contractor 2
EPC Contract
Construction
Credit
EPC: Engineering, Procurement & Construction
© STREAM
10
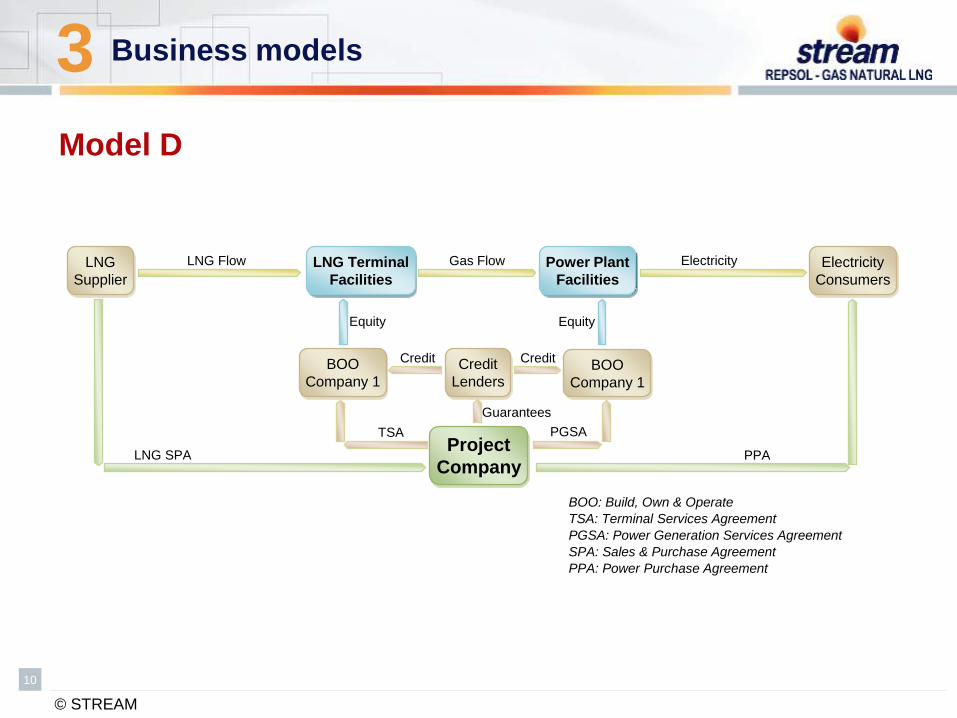
Business models 3
Model D
LNG Terminal
Facilities
Power Plant
Facilities
Project
Company
Credit
Lenders
LNG
Supplier
Electricity
Consumers
TSA
TSA: Terminal Services Agreement
LNG SPA PPA
Equity Equity
Credit
LNG Flow Gas Flow Electricity
SPA: Sales & Purchase Agreement
PPA: Power Purchase Agreement
BOO
Company 1 BOO
Company 1
Credit
Guarantees
PGSA
BOO: Build, Own & Operate
PGSA: Power Generation Services Agreement

© STREAM
11
Business models 3
Tolling Model
LNG Terminal
Facilities
Power Plant
Facilities
Project
Company Credit
Lenders
LNG
Supplier
Electricity
Consumers
Services Contract
LNG SPA
Equity Equity
Credit
LNG Flow Gas Flow Electricity
SPA: Sales & Purchase Agreement
Guarantees
© STREAM
12
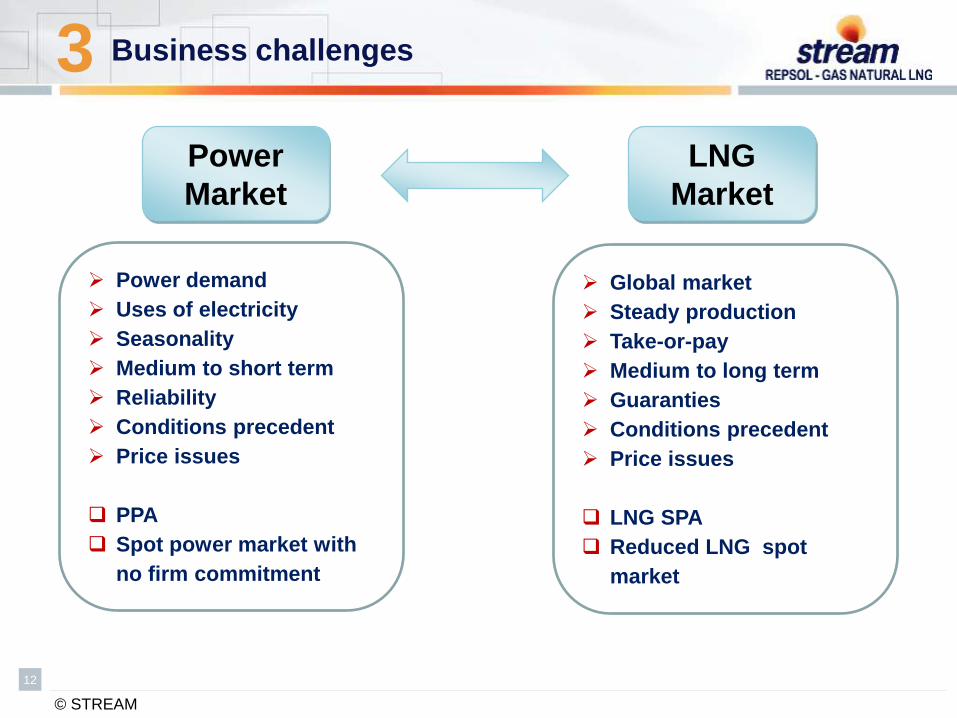
Business challenges 3
Power
Market
LNG
Market
Power demand
Uses of electricity
Seasonality
Medium to short term
Reliability
Conditions precedent
Price issues
PPA
Spot power market with
no firm commitment
Global market
Steady production
Take-or-pay
Medium to long term
Guaranties
Conditions precedent
Price issues
LNG SPA
Reduced LNG spot
market
© STREAM
13
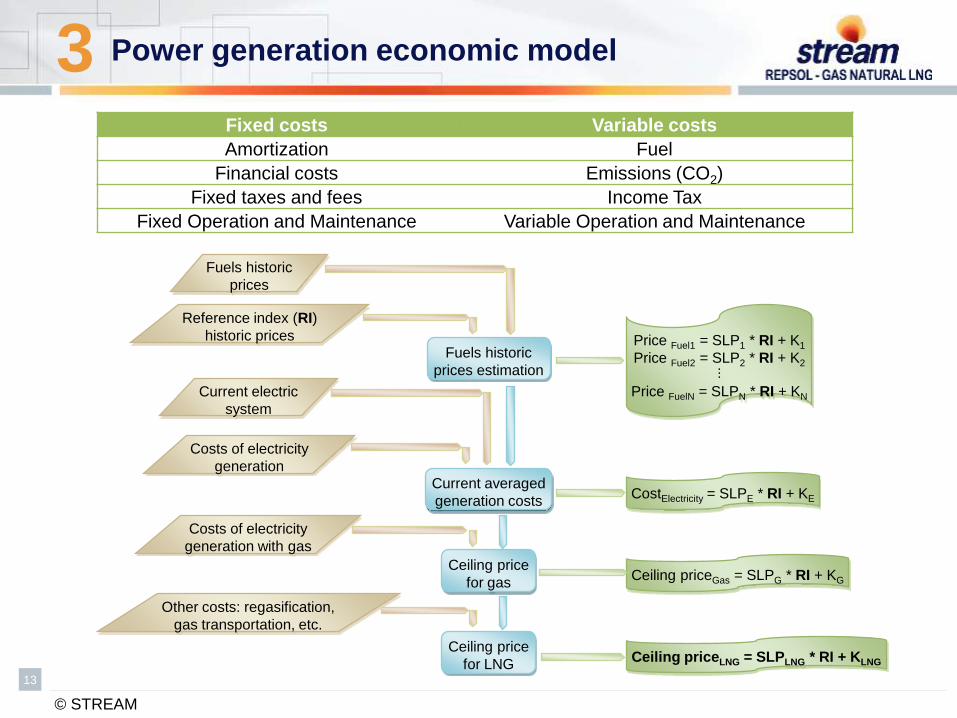
Power generation economic model 3
Fuels historic
prices estimation
Price Fuel1 = SLP1 * RI + K1
Price Fuel2 = SLP2 * RI + K2 · · · Price FuelN = SLPN * RI + KN
Fuels historic
prices
Reference index (RI)
historic prices
Current electric
system
Costs of electricity
generation
Costs of electricity
generation with gas
Other costs: regasification,
gas transportation, etc.
Current averaged
generation costs CostElectricity = SLPE * RI + KE
Ceiling price
for gas Ceiling priceGas = SLPG * RI + KG
Ceiling price
for LNG Ceiling priceLNG = SLPLNG * RI + KLNG
Fixed costs Variable costs
Amortization Fuel
Financial costs Emissions (CO2)
Fixed taxes and fees Income Tax
Fixed Operation and Maintenance Variable Operation and Maintenance
© STREAM
14
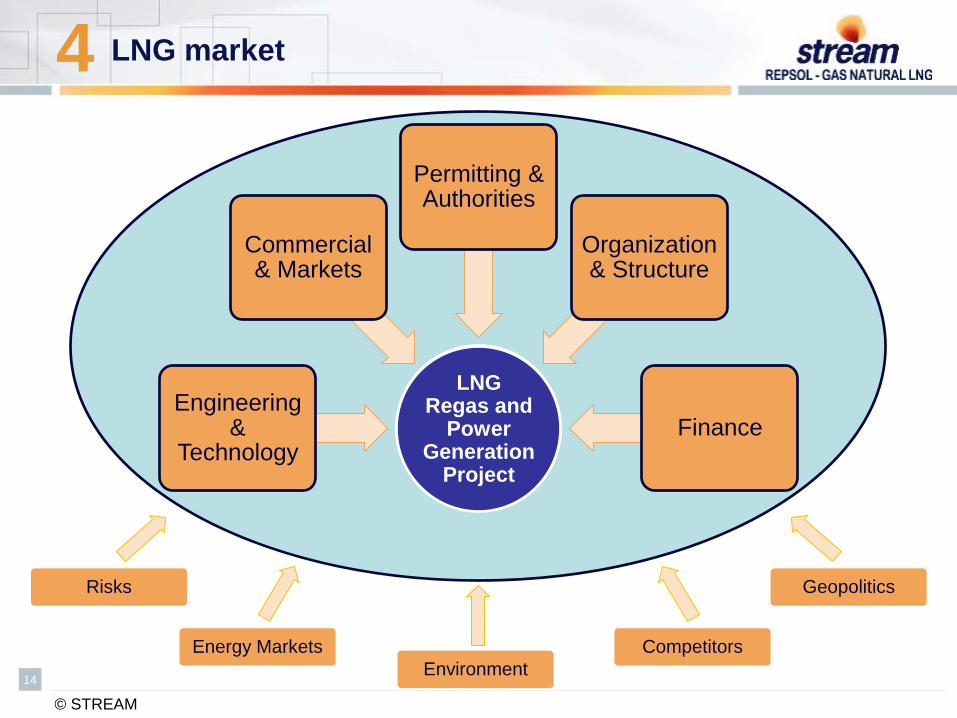
Real life markets are very complex structures
LNG market 4
Small-Mid Scale Regas Project
Engineering &
Technology
Commercial & Markets
Permitting & Authorities
Organization & Structure
Finance
Competitors
Geopolitics
Energy Markets
Risks
LNG Regas and
Power Generation
Project
Environment
© STREAM
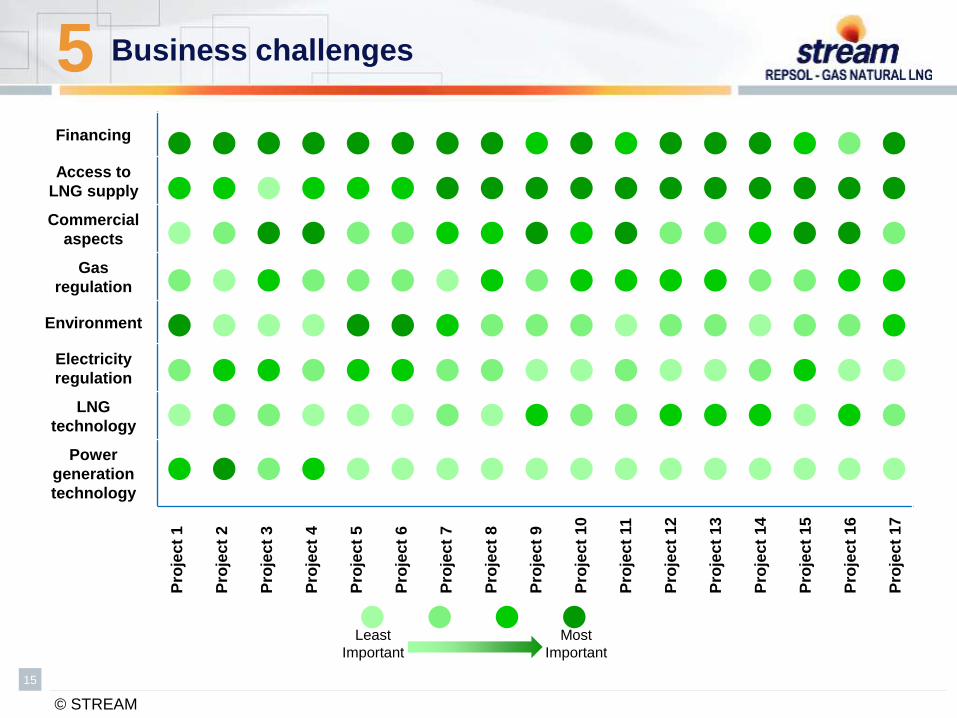
15
Business challenges 5 Financing
Access to
LNG supply
Commercial
aspects
Gas
regulation
Environment
Electricity
regulation
LNG
technology
Power
generation
technology
Pro
jec
t 1
Pro
jec
t 2
Pro
jec
t 3
Pro
jec
t 4
Pro
jec
t 5
Pro
jec
t 6
Pro
jec
t 7
Pro
jec
t 8
Pro
jec
t 9
Pro
jec
t 10
Pro
jec
t 11
Pro
jec
t 12
Pro
jec
t 13
Pro
jec
t 14
Pro
jec
t 15
Pro
jec
t 16
Pro
jec
t 17
Most
Important
Least
Important
© STREAM
16
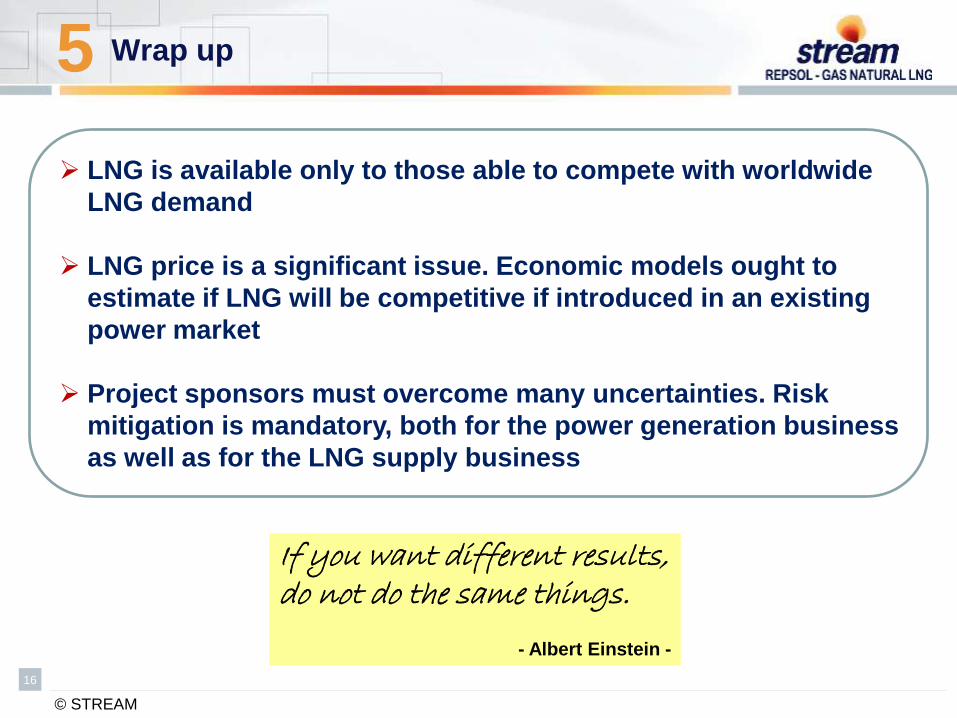
Wrap up 5
LNG is available only to those able to compete with worldwide
LNG demand
LNG price is a significant issue. Economic models ought to
estimate if LNG will be competitive if introduced in an existing
power market
Project sponsors must overcome many uncertainties. Risk
mitigation is mandatory, both for the power generation business
as well as for the LNG supply business
If you want different results, do not do the same things.
- Albert Einstein -

© STREAM
17
Thank you for your kind attention
www.streamlng.com
Pablo Quiroga L. REPSOL – GAS NATURAL LNG
Business Development & Technology Manager