Embed Size (px)
DESCRIPTION
ndhdshhsd
Citation preview


Space Weather, Environment and Societies

Space Weather, Environmentand Societies
by
Jean LilenstenResearcher (CNRS), Planetary Laboratory of the Grenoble University(Université Joseph Fourier), France
and
Jean Bornarel
Physics Spectrometry Laboratory, FranceProfessor Grenoble University (Université Joseph Fourier),

A C.I.P. Catalogue record for this book is available from the Library of Congress.
ISBN-10 1-4020-4331-7 (HB)ISBN-13 978-1-4020-4331-4 (HB)ISBN-10 1-4020-4332-5 (e-book)ISBN-13 978-1-4020-4332-1 (e-book)
Published by Springer,P.O. Box 17, 3300 AA Dordrecht, The Netherlands.
www.springeronline.com
Front cover photo:Photograph of the Sun seen by EIT from the SOHO satellite (ESA/NASA)
Printed on acid-free paper
All Rights Reserved© 2006 SpringerNo part of this work may be reproduced, stored in a retrieval system, or transmittedin any form or by any means, electronic, mechanical, photocopying, microfilming, recordingor otherwise, without written permission from the Publisher, with the exceptionof any material supplied specifically for the purpose of being enteredand executed on a computer system, for exclusive use by the purchaser of the work.
Printed in the Netherlands.

COoperation in the field of Scientific and Technical Research Network (COST).
Grenoble Sciences
Grenoble Sciences pursues a triple aim :• to publish works responding to a clearly defined project, with no curriculum or
vogue constraints,• to guarantee the selected titles’ scientific and pedagogical qualities,• to propose books at an affordable price to the widest scope of readers.
Each project is selected with the help of anonymous referees, followed by a one-year (in average) interaction between the authors and a Readership Committee,whose members’ names figure in the front pages of the book. Publication is thenconfided to the most adequate publishing company by Grenoble Sciences.
(Contact : Tél.: (33) (0)4 76 51 46 95 - Fax: (33) (0)4 76 51 45 79E-mail: [email protected])
Scientific Director of Grenoble Sciences : Jean BORNAREL,Professor at the Joseph Fourier University, France
The "Space Weather, Environment and Societies" Reading Committee included:
• Anne DE RUDDER, Researcher at the Rutherford-Appleton Laboratory, Oxford• Jean ABOUDARHAM, Astronomer at the Paris-Meudon Observatory• Jean-Bernard ROBERT, Professor at the Joseph Fourier Universityand Gwenaëlle LECLAIR, Nicolas PERETTO, Didier RIEU
Translation: Madeleine POULARD
Grenoble Sciences is supported by the French Ministry of Education and Researchand the "Région Rhône-Alpes".
Selected and edited by G renoble Sciences, this book is supported by the European

Technical Research
COST –the acronym for European COoperation in the field of Scientific andTechnical Research– is the oldest and widest European intergovernmental networkfor cooperation in research. Established by the Ministerial Conference in November1971, COST is presently used by the scientific communities of 35 European countriesto cooperate in common research projects supported by national funds.
The funds provided by COST –less than 1% of the total value of the projects–support the COST cooperation networks (COST Actions) through which, with onlyaround €20 million per year, more than 30,000 European scientists are involved inresearch having a total value which exceeds €2 billion per year. This is the financialworth of the European added value which COST achieves.
A "bottom up approach" (the initiative of launching a COST Action comes from theEuropean scientists themselves), "à la carte participation" (only countries interestedin the Action participate), "equality of access" (participation is open also to thescientific communities of countries not belonging to the European Union) and"flexible structure" (easy implementation and light management of the researchinitiatives) are the main characteristics of COST.
As precursor of advanced multidisciplinary research COST has a very importantrole for the realisation of the European Research Area (ERA) anticipating andcomplementing the activities of the Framework Programmes, constituting a "bridge"towards the scientific communities of emerging countries, increasing the mobilityof researchers across Europe and fostering the establishment of "Networks ofExcellence" in many key scientific domains such as: Physics, Chemistry, Tele-communications and Information Science, Nanotechnologies, Meteorology,Environment, Medicine and Health, Forests, Agriculture and Social Sciences. Itcovers basic and more applied research and also addresses issues of pre-normativenature or of societal importance.
European COoperation in the field of Scientific and

TABLE OF CONTENTS
XI
Chapter 1 – The Sun.....................................................................................................1
1. The formation of the stars and the Sun....................................................................1
2. The characteristics of the Sun ..................................................................................7
3. A representation of the Sun....................................................................................11
4. The internal structure of the Sun............................................................................11
5. The photosphere, solar radiation, the solar wind ..................................................17
6. The thermal profile of the solar atmosphere .........................................................24
7. Solar dynamics ........................................................................................................277.1. Sunspots. The solar cycle. Prominences and eruptions ..............................277.2. Coronal holes. Fast wind ..............................................................................377.3. The large-scale structure: coronal streamers ...............................................407.4. Coronal mass ejections .................................................................................427.5. An index of solar activity .............................................................................45
8. The Sun: at the source of space weather................................................................46
Chapter 2 – The Earth ...............................................................................................49
1. The Earth within the solar system..........................................................................49
2. The internal structure of the Earth: the geomagnetic field ...................................53
3. The atmosphere of the Earth ..................................................................................583.1. The homosphere ............................................................................................583.2. The heterosphere, the thermosphere, the ionosphere..................................61
4. The magnetosphere .................................................................................................684.1. The magnetosphere and the network of currents ........................................704.2. The polar lights..............................................................................................794.3. Magnetic storms and sub-storms..................................................................864.4. High altitude lightning flashes .....................................................................89
Chapter 3 – Toward a space weather ......................................................................91
1. The consequences of solar agressions on our technological environment ..........931.1. Pipelines.........................................................................................................931.2. Transmission of electricity ...........................................................................941.3. Railways ........................................................................................................97
Introduction ................................................................................................................. Acknowledgements XIII..................................................................................................

VIII SPACE WEATHER, ENVIRONMENT AND SOCIETIES
1.5. Spacecraft launches.....................................................................................1011.6. Satellite flight ..............................................................................................1031.7. The reentry of spacecraft into the atmosphere ..........................................1101.8. Space debris and its effects.........................................................................111
2. Other impacts of solar activity .............................................................................1142.1. Biological effects ........................................................................................1142.2. The climate ..................................................................................................1172.3. Insurance companies...................................................................................1192.4. Military defence ..........................................................................................1202.5. Tourism and education of the public .........................................................121
3. Space weather in order to forecast .......................................................................1213.1. Its birth certificate .......................................................................................1213.2. A science that is still in its early stages and its applications.....................1253.3. Toward maturity: the intense space weather storms
of October-November 2003........................................................................128
Appendices .................................................................................................................133
1 – The density and kinetic energy of a gas ..............................................................135
2 – The internal nuclear processes of the Sun...........................................................138
3 – The electromagnetic field.....................................................................................141
4 – The dipolar magnetic field ...................................................................................145
5 – The doppler effect and the wavelength................................................................150
6 – Photometric quantities..........................................................................................153
7 – The blackbody.......................................................................................................157
8 – A comprehensive view of electromagnetic waves .............................................160
9 – The magnetic field and the movement of particles, frozen plasma and fields......163
10 – Kinetic pressure and magnetic pressure............................................................166
11 – The Coriolis force...............................................................................................167
12 – Kepler's laws .......................................................................................................171
13 – Sidereal time and solar time...............................................................................174
14 – The characterization of magnetic activity by means of indexes......................177
15 – The variation in molecular concentration with altitude ...................................179
16 – Elements of atmospheric chemistry...................................................................181
17 – The movement of a charged particle in a magnetic field tube.........................184
18 – The calculation of the position of the magnetopause .......................................187
19 – The planets of the solar system in the glare of the Sun....................................189
20 – The Moon in the glare of the Sun......................................................................198
21 – Comets, meteors and asteroids in the glare of the Sun.....................................201
22 – Orbital parameters ..............................................................................................205
1.4. Telecommunications .....................................................................................98

TABLE OF CONTENTS IX
A few useful constants ..............................................................................................217
References .................................................................................................................. 219
Word glossary............................................................................................................221
Glossary of names, acronyms and logos................................................................233
Index............................................................................................................................239
23 – Space weather instruments.................................................................................209

I
Space Weather, Environment and Societies illustrates the unexpected effects of solaractivity on human activity. Although the characteristics of our star have, on the whole,remained pretty well unchanged throughout the history of mankind, lately its moodswings, and considerably varying ejection of matter and radiation have had disruptiveeffects on our technology-based society. Data and energy are transmitted using thesame vehicles as in nature: charged particles and electromagnetic waves. This meansthat whole areas of our technical environment are concerned: telecommunications,production and transmission of electricity, transportation of oil, railways, positioningsystems, airplanes, satellites… Incidents and accidents are on the rise, hence the need toforecast solar activity with precision and to quantify the response from the terrestrialenvironment: this is the objective of space weather.
The first chapter of the book introduces the Sun and explains its emissions of electro-magnetic waves and particles, particularly in the direction of the Earth. The secondchapter explains how the ionized environment and the magnetic characteristics of theEarth form natural barriers against fatal radiation and showers of particles. The thirdchapter shows how fragile our industrialized societies, with their electrical networks,pipelines, airplanes and so on, have become in the face of natural phenomena.
A well informed or hurried reader can read Space Weather, Environment and Societiesin one sitting. This would be akin to reading a novel illustrated with diagrams andwonderful photographs. Included with the text are footnotes that provide historical,technical and scientific details. More detailed explanations are to be found in the23 appendices. Some of these are aimed at the reader whose scientific levelcorresponds to the first cycle of university with the aim of consolidating hiscomprehension of a physical phenomenon. Others, given here purposely to avoidoverloading the main part of the text, provide further information on the relationshipbetween the Sun and the atmosphere of other planets or the detection apparatusrequired for space weather. The meanings of words or symbols can be found in theglossary. The bibliography of websites and books, the index and the table of contentsare intended for the reader who will use this work as a reference tool.
We hope that Space Weather, Environment and Societies will go toward furtheringthe knowledge of and respect for the wonderful world that surrounds us.
NTRODUCTION

We thank Pierre, Nicole and Jean-François MEIN (DASOP), Serge KOUTCHMY
(IAP), Jean-Pierre HAIGNERÉ (CNES), Pierre VOLKE and Chantal LATHUILLÈRE
(LPG), Messieurs DUBOS, LEROY, LAMBERT, BESNIER and LAURENT (Uranoscope),Dirk LUMMERZHEIM and Jan CURTIS (Geophysical Institute of Alaska), Renée PRANGÉ
and Laurent PALLIER (IAS), Arslan ERINMEZ (National Grid) for their iconographichelps, as well as the staff of the SOHO spacecraft. SOHO is an internationalcooperative project between ESA and NASA. These agencies have very kindly chosena politic of large diffusion of their scientific findings. We thank Wlodek KOFMAN
(LPG), Pierre LANTOS (DASOP), Jean-Louis BOUGERET (DESPA), Ljiljana CANDER
(RAL), Jean-Yves PRADO (CNES) and François LEFEUVRE (LPCE) for helpfulldiscussions.
We thank our scientific referees Chantal LATHUILLÈRE and Matthieu KRETZSCHMAR
(LPG), Paul GILLES (LPCE), Anne DE RUDDER (RAL), Jean ABOUDARHAM (DASOP),Jean-Bernard ROBERT (CRTBT) as well as Gwenaëlle LECLAIR, Nicolas PERETTO andDidier RIEU. We thank our English translation readers Toby CLARK, Pascale LELONG,David DARR and Barbara DRESSLER. We finally thank the Grenoble Sciences staff:Nicole SAUVAL, Julie RIDARD and Catherine DI LEO.
The authors
To my family, to Geneviève, Lola and Maël
J. L.
ACKNOWLEDGEMENTS

Chapter 1
THE SUN
Figure 1.1 - The Sun as seen by EIT from the SOHO satellite
The Sun is at the origin of the energy we receive, the very origin of life. We believewe know it well and yet it has only been a short time since we first becamefully aware of its behavior! The first spectral studies to determine its chemicalcomposition were carried out during the nineteenth century. In 1945, the appendixto the Manhattan project concerning the first atom bomb provided an explanationfor the internal source of the Sun's energy. Finally, in 1995, the SOHO satellite(SOlar Heliospheric Observatory, ESA/NASA) was launched. Since then, findingshave accumulated. So where do we go from here?
1. THE FORMATION OF THE STARS AND THE SUN
One only has to look up at the sky on a clear night to see that, in some parts, matterappears to be far more condensed. What can be seen are primarily clouds of gas,

2 SPACE WEATHER, ENVIRONMENT AND SOCIETIES
planets from our solar system, stars or galaxies. Each of these galaxies contains ahuge number of stars. Our own galaxy, known as the Milky Way, is made up ofabout 100 billion stars. Also, galaxies come in clusters. In our "Local Cluster", thereare about thirty small galaxies around two giants: the Nebula of Andromeda and theMilky Way. Light takes between 80,000 and 100,000 years to travel from one endof the Milky Way to the other so the diameter of our galaxy is said to be between80,000 and 100,000 light years 1. It would, therefore, take 3 to 4 million years totravel across the Local Cluster.
The Sun is not an exotic object in the universe, but merely a star amongst manyothers. But how are these stars formed? From the hydrogen and helium gases thatwere formed abundantly at the birth of our present universe, and a detonator. Thelatter is a shock wave that spreads beyond the blast of an explosion. The explosionis usually that of another star. This immediately raises the problem of the firstgeneration of stars According to the current standard theory, the shock wave mayhave been the one associated with the first explosion, the famous "Big Bang" at theorigin of our universe.
Globules
Figure 1.2 - A cloud of molecular hydrogen in the Eagle nebula.The photograph was taken by the WFPC2 on the Hubble space telescope
This is a star incubator. Some globules can be seen on the edge of the long fingersof gas (credit J. Hester and P. Scowen – Arizona State University; NASA).
1 One light year is 9.461 ¥ 1012 kilometers.

1 – THE SUN 3
Once the mechanism has been triggered, gravity keeps it going. Matter is moreabundant in a compressed area, therefore the forces of gravitational attraction 2 arehigher. This sector, which spreads over tens or even hundreds of light years, attractsthe surrounding isolated particles and the whole area soon becomes opaque to thelight of neighboring stars. The embryo of a star goes through a cooling phase duringwhich it drops to about 10 degrees Kelvin, because it cannot be heated by outsideglow. Inside, however, as the density increases, so do the impacts 3. Denser globulesappear locally and here, the collisions are sufficiently numerous for the chemicalreactions between atoms to create various molecules. For a while, the heat producedby these impacts offsets the lack of heat due to the opacity. This is the isothermalphase. When the concentration increases from about 105 to 1011 atoms per cm3,–which is still quite a considerable vacuum compared with the 1019 molecules percm3 found in our terrestrial atmosphere at sea level– the infrared radiation emitted bythe internal collisions can no longer escape: all the radiation emitted from within thecloud is reabsorbed by the cloud; the energy remains enclosed and the temperatureof the cloud of gas increases to about 100 degrees Kelvin. The density, too, increasesdue to the effect of gravitation. On the one hand, gravity compresses the star and, onthe other hand, the heat given out by the collisions slows down the compression 4.When the concentration of particles reaches 1014 atoms per cm3, the two effectsbalance each other out: the dynamic collapse of the cloud stops over an area equalin radius to about five times the average distance from the Earth to the Sun. Thevolume thus defined is known as the first stellar nucleus 5.
However, the external parts, attracted by gravity, compress this first nucleus. Theconcentration and temperature in the center increase progressively to 1016 atoms percm3 and 2,000 Kelvins. These values are high enough for the diatomic moleculesof hydrogen to separate into hydrogen atoms. The separation consumes energy, andthis reduces the temperature of the first nucleus. The pressure bearing the mass ofthe cloud decreases and this triggers a second phase of dynamic collapse. When thepressure reaches 1024 atoms per cm3 (about the same as liquid water under normal
2 The law of gravitation expresses the fact that two homogenous and spherically symmetric
masses m and m' placed at a distance d from each other (centers of gravity in G and G') attract
each other in the direction G G' with forces of magnitude F2
= ¢G mmd
, where G is the universal
constant of gravitation (6.672 ¥ 10 –11 m3 kg
–1 s –2 in International System units, i.e. with masses
expressed in kilograms, distances in meters and forces in Newton).
3 See appendix 1 for the thermodynamic link that associates the number of impacts with pressureand temperature.
4 The heat created by the impacts corresponds to infrared radiation, or photons, of a momentum hcn
(as a module) which create over a unit of area a pressure called "radiation pressure". Thispressure plays a part in the slowing down of the cloud compression.
5 The adjective "stellar" makes it possible to distinguish it from the atomic nuclei to be found furtheron. Within this first nucleus, electromagnetic forces play a part that we shall not mention here.

4 SPACE WEATHER, ENVIRONMENT AND SOCIETIES
conditions) and the temperature 100,000 Kelvins, thermal pressure is once againsufficient to balance gravitational forces leading to the formation of a second stellarnucleus of a few solar diameters. About 100,000 years elapse between the appearanceof the shock wave and the formation of the second stellar nucleus
The second stellar nucleus withstands the forces of internal gravity until thetemperature at the core exceeds 10 million degrees. The collisions then become soviolent that in spite of the electrostatic forces that repulse them, the nuclei ofhydrogen come into contact with each other. Nucleons combine and form firstdeuterium and then nuclei with four nucleons: helium 6. A nucleus of helium, comingfrom four nuclei of hydrogen via a nuclear reaction, is lighter than those four nucleiof hydrogen: the difference in mass has turned into energy. The mass of hydrogenis 1.00797 grams per mole 7 while that of helium is 4.0026 grams per mole. Thedifference in mass for one mole produces energy of 2.6352 ¥ 1015 joules, i.e. enoughto supply 2 billion 100-Watt lamps for more than 7 hours… A star is born!
Many observations can be explained from the above description. A more completemodel would have to take into account the effect of rotation on the cloud in whichthe star was formed. In the universe, rotation is a generalized way of consumingenergy and can be found at all scales, from the largest (that of galaxies) to thesmallest (that of atoms and molecules) without forgetting the rotation of the planetsaround the Sun, on their axis or the rotation of the Sun on its own axis. Theestablishment of a complete model including rotation is beyond the scope of thisbook (the bibliography includes a few titles that provide an approach to the subject).It is worth explaining, however, why most star formation results in a binary system,with one star rotating around the other. The lone Sun is, therefore, the exceptionrather than the rule.
Nuclear reactions provide the energy that makes a star shine. It then settles into anew stationary state. There is no further visible external change. Its radius remainsthe same and its energy output is practically constant. The first phase of its life,during which it contracts and warms up, takes about 15 million years. This phase iscalled T Tauri. The second phase, known as the principal sequence, during which itshines in a regular manner is presently that of our Sun and of 80% of the stars to beseen in the sky. It started 4.6 billion years ago for the Sun and will go on for another5 billion years.
This nuclear phase comes to an end when the hydrogen in the stellar core has beenconsumed. The more massive a star, the more powerful its gravitational motor: itshines more brightly and its hydrogen reserves are used up more quickly. A star often solar masses consumes its fuel about 5,000 times faster than the Sun. However,
6 See appendix 2 for the two nuclear processes involved in this transformation.
7 At a temperature of 273.15 Kelvin and a pressure of 101,325 Pascal, one mole represents22.4 liters of gas, i.e. 6.022 ¥ 1023 molecules.

1 – THE SUN 5
less massive stars have a life span equal to several times that of the Sun –that is, ifthey reach the principal phase, which is not the case for those with a mass of less than0.07 of the solar mass. These "too small" stars contract into brown, then black, dwarfsor even, as is thought to have been observed in other systems, into giant planets.
In 5 billion years, when hydrogen accounts for only 5% of the core matter, theinternal energy of the Sun provided by nuclear combustion will no longer be enoughto offset the force of gravity that tends to make it collapse on itself. The contractionwill then have the upper hand. When the core temperature exceeds 100 milliondegrees, a new nuclear reaction will become possible: three nuclei of helium willcombine to form a nucleus of carbon. Before the start of this reaction, the increasein temperature brought about by the contraction will stimulate the nuclearcombustion of the hydrogen round the circumference of the central area. This willlead to the dilatation of the star: the Sun will swell to factor 100 and will becomea red giant, like Antares in Scorpion and Betelgeuse in Orion. Once the central
Figure 1.3 - The NGC 6543 nebula, or cat's eye,photographed by the WFPC2 on the Hubble space telescope
Its complex shape suggests it comes from a system of double stars, one of whichbecame a white dwarf, probably about a thousand years ago. The resolution ofthe telescope is not sufficient to make out the two stars (credit J.P. Harrington andK.J. Borkowski – University of Maryland; NASA).

6 SPACE WEATHER, ENVIRONMENT AND SOCIETIES
combustion of helium has finished, the former convection zone of the star and asmall amount of the matter produced by the nuclear fusion reactor –also known asnucleosynthesis– will be blown out into space, in the shape of a ring called aplanetary nebulous, centered around a ball of hot ashes, a white dwarf, about thesame size as Earth. This white dwarf will glow faintly before dying away to becomea black dwarf, with a volume about a million times smaller than its present volume.
More massive stars, of about ten to twelve solar masses, are able to carry on thecycle, producing increasingly heavy elements, even iron. When they explode, theyexist as supernovae for a few earth days, enabling even heavier atoms to be madeand propelling all these elements into space. Therefore, all the matter that makes uptelluric planets comes from one or more supernovae.
Inside the Sun itself, although the gas is made up essentially of hydrogen (93.96%)and helium (5.9190%) traces of other elements can also be found. Like telluricplanets, they cannot be traced back to the primordial universe composed essentiallyof hydrogen and helium. This means that they too were produced by a star that hasdisappeared.
Table 1.1 - The composition of the Sunexpressed in mass percentage of the various components 8
Name Symbol Mass %
Hydrogen H 93.96
Helium He 5.9190
Oxygen O 0.0648
Carbon C 0.0395
Nitrogen N 0.0082
Silicon Si 0.0042
Magnesium Mg 0.0037
Neon Ne 0.0035
Iron Fe 0.0030
Sulfur S 0.0015
Aluminum Al 0.0003
Calcium Ca 0.0002
Sodium Na 0.0002
Nickel Ni 0.0002
Argon Ar 0.0001
8 These proportions were obtained by analyzing the solar spectrum, the composition of the solar
wind and models of stars. Their accuracy during these calculations must not be misunderstood.Many questions remain unresolved; furthermore, the modifications inside the Sun areconsiderable. For instance, in the peripheral layers, the mass of hydrogen amounts to between69% and 75%, that of helium to between 25% and 29% and that of other elements is around 2%.

1 – THE SUN 7
The proportion of these elements in the Sun is so low that it could be considerednegligible (table 1.1). However, it is of utmost importance for at least one reason: itenables the star to be characterized by observation. Each physical element has itsown signature that depends on the wavelengths of the electromagnetic waves itemits at a given temperature. If we were able to observe only hydrogen and helium,the number of wavelengths would be limited, providing only part of the globalinformation on the Sun. The fact that we can also observe the radiation of heavierelements such as oxygen, iron… provides a wealth of extra information.
Due to the high temperatures in all regions of the Sun, the elements mentionedabove are dissociated into ions and free electrons. This type of mixture is calledplasma. This is the fourth state of matter and can be solid (as with metals) or fluid.It can be mixed with neutral matter (this is the case with high altitude planetaryatmospheres). It can be cold (as low as a few hundred thousand Kelvins) or hot (morethan one million Kelvins). It is sensitive to the presence of an electromagnetic fieldand can generate one of its own.
2. THE CHARACTERISTICS OF THE SUN
The Sun is a star of average size, like billions of others in the universe. Here are itsmain characteristics.
Its equatorial diameter is 1,392,000 kilometers, that is, 109 times that of the Earth. Itsmass of 2 ¥ 1030 kilograms represents 99.97% of that of the solar system. Its densitymass is 1,400 kg m–3 –1.4 times that of water– about one quarter of that of Earth.
The Sun rotates on its axis. This axis is approximately perpendicular to the plane inwhich the Earth rotates round the Sun (the ecliptic plane) thus making it possible todefine a geographical North Pole and South Pole. By agreement, these are on thesame side of the ecliptic plane as the North and South poles of the Earth. Also byagreement, the solar East and West are opposite the terrestrial East and West for anobserver placed between the Earth and the Sun.
Compared with those of the Earth, the rotation shows some surprising characteristics.To us, it seems perfectly natural for a day to have the same duration in the North orthe South of France, Norway, Africa, at the bottom of the ocean or on top of amountain. This is because the Earth rotates as a whole, rigidly. The same cannotbe said of the Sun, where the speed of rotation of the surface matter near the equatoris different from that found near the poles. Moreover, SOHO brought to light agigantic flux of hot plasma, an equatorial "river" which flows 4% more quickly thanthe matter along its banks. This "river" is approximately 500,000 kilometers wide(Earth has a diameter of roughly 13,000 kilometers) and about 200,000 kilometersdeep. Below the poles there are two other solar rivers which, although a great dealsmaller than the equatorial river, are still huge by terrestrial standards: each of themis about 27,000 kilometers wide, enough to contain our planet twice over.

8 SPACE WEATHER, ENVIRONMENT AND SOCIETIES
Table 1.2 - Some distinctive parameters of solar system planets and the Sun
Diameter atthe equator
[km]
Mass [kg] Mass / Massof the Sun
Densityin
relationto liquid
water
Specificrotation
(day)
Gravity**
[m s –2]
Sun 1,392,000 2 ¥ 1030 1 1.4 25.38 275.5
Mercury 4,879 3.302 ¥ 1023 1.65 ¥ 10 –7 5.43 58.65 2.78
Venus 12,104 4.870 ¥ 1024 2.44 ¥ 10 –6 5.24 243.01* 8.60
Earth 12,756 5.974 ¥ 1024 2.99 ¥ 10 –6 5.52 1 9.78
Mars 6,794 6.419 ¥ 1023 3.21 ¥ 10 –7 3.93 1.026 3.72
Jupiter 142,984 1.900 ¥ 1027 0.95 ¥ 10 –3 1.33 0.41 22.88
Saturn 120,536 5.685 ¥ 1026 2.84 ¥ 10 –4 0.69 0.427 9.05
Uranus 51,118 8.683 ¥ 1025 4.34 ¥ 10 –5 1.27 0.45* 7.77
Neptune 49,528 1.024 ¥ 1026 0.51 ¥ 10 –4 1.64 0.67 11
Pluto 2,390 1.238 ¥ 1022 0.65 ¥ 10 –8 1.73 6.39 0.4
* The rotation of Venus and Uranus is retrograde, i.e. in the opposite direction tothat of the Earth.** Mean gravity on the surface.
As the Sun rotates, the matter at the equator drifts towards the poles at a relativelyslow speed: about 80 kilometers per hour. The flow of matter back from thepoles towards the equator theoretically occurs at a depth of approximately200,000 kilometers (this has not yet been confirmed) meaning the matter istransported roughly ten times more slowly than on the surface. It would, therefore,take more than twenty years for a particle to complete the full cycle from thesurface of the solar equator to a pole and then back through the inside of the Sun;this value can be compared with that of the duration of the cycle of solar activity.
Since the speed of rotation of the Sun varies between the equator and the pole, thelatitude 9 must be specified each time a value is given. The usual reference is 16°.At this latitude, as seen from the Earth, the Sun appears to complete a rotation in27.2753 terrestrial days. If we take a latitudinal average from the equator to thepole, we obtain a value of 27.7 days with extreme values of about 35 days near thepoles and 25 on the equator. This is known as synodic rotation. However, the Earthrotates on its axis as well as around the Sun. The solar rotation we can observe from
9 The latitude of a site on a rotating sphere is the angle between the zenith of the site and the
equatorial plane. This notion will be brought up again in chapter 2 and its appendixes.

1 – THE SUN 9
Earth is, in fact, a combination of terrestrial rotations and the specific rotation of theSun. An observer at a fixed point in the solar system would only see the rotation ofthe Sun itself i.e. sidereal rotation, which is, on average, 25.38 days over a giventime, at said latitude of 16°.
We have presented an account of the speed of rotation on the surface of the Sun.However, just as this varies with latitude, it also varies with depth. Based onindirect measurements, going down into the Sun, the synodic rotation speed (whichwill be used for future reference and which is 27.7 days on average) first increasesdown to a depth of 50,000 kilometers from the surface, where the rotation takes26.6 days. It then decreases steadily according to depth down to 0.5 of the solarradius (rotation in about 29 days). However, the core of the Sun rotates on its axis inabout 8 days.
The mean value of the magnetic field 10 on the surface of the quiet Sun –thisexpression will be explained shortly– is about 10
–4 Tesla 11. In the direction of theEarth from which we observe it, the component of this field is known as thelongitudinal component. It is also roughly equal to one Gauss. Our Earth also has amagnetic field equal to about 0.5 Gauss on its surface, i.e. comparable to that of theSun. On our planet, we are accustomed to our two magnetic poles, the North Poleand the South Pole. A magnetic field which has two poles is said to be dipolar.However, can the same be said of the Sun? The answer is yes, but in a strangemanner: the dipolar component of the Sun varies in intensity in time and thisvariation appears to be relatively cyclical, over a period of eleven years.
In addition to this dipolar component, there are two extra pairs of North and Southpoles, as shown in figure 1.4; obviously this form is said to be quadrupolar andis also variable in time. However, whatever the scale, the magnetic field of theSun contains components that make it extremely complex to describe. Figure 1.5represents a model that reproduces observations of the magnetic field on the surfaceof the Sun.
For a few years now, it has appeared that the Sun's behavior could be interpretedand predicted if we had precise knowledge of its magnetic field, down to its mostintimate scales. However, we are still a long way from having acquired thisknowledge.
10 A magnetic field is associated with charges in motion. When a charge undergoes a rotating
movement, its magnetic moment is perpendicular to the rotation plane. Generally, magneticmoments are distributed at random throughout matter so that the resultant (the sum of themoments) is zero. When the movements become organized, the magnetic moments can add upso that the resultant is not zero. Electromagnetism and in particular the expression of the dipoleare revised in appendixes 3 and 4.
11 10 –4 Tesla = 1 Gauss.

10 SPACE WEATHER, ENVIRONMENT AND SOCIETIES
Figure 1.4 - Solar magnetic field lines,generated by a theoretical model for minimum solar activity
Here we see a dipolar component (i.e. a North pole and a South pole) and alsoquadrupolar components. The coronal holes (see this chapter) are surmounted byopen lines on which solar particles spiral. This set of pictures shows the ultravioletsolar radiation emitted by the corona (see this chapter) on August 17 1966. Thephotograph of the solar disk (also in this chapter) was taken by the EIT instrumentand that of the corona by the UVCS instrument (in a five-times ionized oxygenwavelength). Both instruments were on board SOHO.
Figure 1.5 - Small-scale solar magnetic field linesas shown by a theoretical model and observations
Here the highest lines are at approximately 0.25 solar radii. The horizontal scale ison the order of 100,000 kilometers (credit SOHO/MDI).

1 – THE SUN 11
3. A REPRESENTATION OF THE SUN
We can understand what goes on in the Sun's interior, by comparing it with waterboiling in a saucepan. The flame of the stove represents the core of the Sun.However, whereas in the saucepan the energy is produced by a chemical reactionbetween the gas on the stove and air, inside the Sun it is produced by nuclear fusion.
The saucepan does not distort upon heating. It simply transmits energy by radiationand is a radiative zone. In the same fashion, around the core of the Sun, matter isnot compact enough to generate a nuclear fusion, yet it is too compact to move. Itcan only radiate the energy it receives.
When boiling occurs in the saucepan, the heated water at the bottom rises to thesurface, cools as it rises and sinks to the bottom again; this is known as convection.In a broader sense, certain types of heaters that create atmospheric convection arecalled convectors. Likewise, on the Sun, moving from the core to the outer layer,gravity is no longer sufficient to compact the matter: boiling can take place andwe have the solar convection zone that corresponds to matter set in motion byconvection.
Moreover, just as evaporation takes place above the saucepan, there is also aphenomenon of solar evaporation. If we look closely, we can see that droplets ofwater are ejected between the convection bubbles of water. On the Sun, matter isejected from the surface.
However, the comparison must not be taken too far: to begin with, the production ofenergy is of a different nature (nuclear fusion as opposed to the combustion of agas). Next, the atoms that make up the saucepan are bound together by electrostaticforces, not gravitational forces. The water is inside the saucepan whereas the solarradiative zone is inside the convection zone. Solar evaporation is not the same asthat of a liquid and magnetic forces also contribute to the ejection of droplets ofsolar matter.
This type of representation of the Sun was first acquired in the 1950s and hardlychanged at all over the next 40 years. More recently however, our vision hasprogressed somewhat.
4. THE INTERNAL STRUCTURE OF THE SUN
In the heart of the Sun, the nuclear oven occupies a sphere with a radius of200,000 kilometers, where 50 to 70% of the total mass of the star is concentrated.We have already seen that hydrogen is changed into helium by nuclear fusion.Along with these reactions there is a loss of mass due to an emission of energyaccording to the well-known formula E = mc2, in which E is the energy produced by

12 SPACE WEATHER, ENVIRONMENT AND SOCIETIES
Chromosphere
Convective zone
Radiative zone
Nuclear core
Protuberance
Coronal burst
Eruption
Coronal hole
Coronal hole
Figure 1.6 - The structure of the Sun as given by various instrumentson board the SOHO satellite (sources SOHO/MDI for the internal section,
EIT for the chromosphere, LASCO for the solar corona)
a mass m and c is the speed of light in a vacuum 12. Every second, 700 billionkilograms of hydrogen fuse into 695.7 billions of kilograms of helium. Most of theenergy (98%) is evacuated in the form of photons 13.
In the center of the Sun, the concentration amounts to 5 ¥ 1031 particles per m3
(compared with that of the terrestrial atmosphere at ground level which is about1025 particles per m3). The voluminal mass is 150 tons per m3, pressure is about220 billion times atmospheric pressure and the temperature about 15.6 milliondegrees. The Sun began its nuclear combustion about 4.6 billion years ago. The coreis therefore already hydrogen-depleted and it is estimated that the maximum level ofthe present source of energy production is located at approximately 0.1 solar radiusfrom the center.
How can we be so sure of all this without being able to see it with our own eyes?Experimental and numerical models have shown that apart from nuclear fusion noknown source is capable of producing the energy that the Sun produces. By measuring
12 c = 299,792,458 m s
–1; this is generally rounded off to 3 ¥ 108 m s –1.
13 The photon is a small quantity of luminous energy. For a light of frequency n (in Hertz)energy E (in Joule) of the photon is obtained by E = hn where h is the Planck constant(= 6,626 ¥ 10
–34 J s).
1 – THE SUN 13
the quantity of light released by the Sun, we can estimate the amount of matterrequired to produce it. The analysis of the light and of the composition of interstellarspace, gives us the composition of the Sun and, therefore, the mass of its core.
The remaining 2% of solar energy are evacuated in the form of particles known asneutrinos which probably have no mass 14.
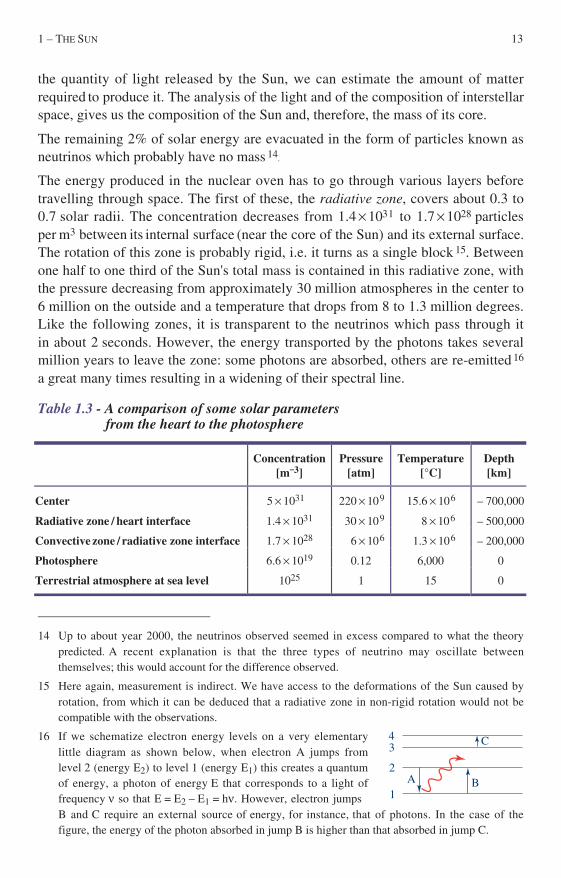
The energy produced in the nuclear oven has to go through various layers beforetravelling through space. The first of these, the radiative zone, covers about 0.3 to0.7 solar radii. The concentration decreases from 1.4 ¥ 1031 to 1.7 ¥ 1028 particlesper m3 between its internal surface (near the core of the Sun) and its external surface.The rotation of this zone is probably rigid, i.e. it turns as a single block 15. Betweenone half to one third of the Sun's total mass is contained in this radiative zone, withthe pressure decreasing from approximately 30 million atmospheres in the center to6 million on the outside and a temperature that drops from 8 to 1.3 million degrees.Like the following zones, it is transparent to the neutrinos which pass through itin about 2 seconds. However, the energy transported by the photons takes severalmillion years to leave the zone: some photons are absorbed, others are re-emitted 16
a great many times resulting in a widening of their spectral line.
Table 1.3 - A comparison of some solar parametersfrom the heart to the photosphere
Concentration[m–3]
Pressure[atm]
Temperature[°C]
Depth[km]
Center 5 ¥ 1031 220 ¥ 109 15.6 ¥ 106 – 700,000
Radiative zone / heart interface 1.4 ¥ 1031 30 ¥ 109 8 ¥ 106 – 500,000
Convective zone / radiative zone interface 1.7 ¥ 1028 6 ¥ 106 1.3 ¥ 106 – 200,000
Photosphere 6.6 ¥ 1019 0.12 6,000 0
Terrestrial atmosphere at sea level 1025 1 15 0
14 Up to about year 2000, the neutrinos observed seemed in excess compared to what the theory
predicted. A recent explanation is that the three types of neutrino may oscillate betweenthemselves; this would account for the difference observed.
15 Here again, measurement is indirect. We have access to the deformations of the Sun caused byrotation, from which it can be deduced that a radiative zone in non-rigid rotation would not becompatible with the observations.
16 If we schematize electron energy levels on a very elementarylittle diagram as shown below, when electron A jumps fromlevel 2 (energy E2) to level 1 (energy E1) this creates a quantumof energy, a photon of energy E that corresponds to a light offrequency n so that E = E2 – E1 = hn. However, electron jumps
A B
C43
2
1
B and C require an external source of energy, for instance, that of photons. In the case of thefigure, the energy of the photon absorbed in jump B is higher than that absorbed in jump C.

14 SPACE WEATHER, ENVIRONMENT AND SOCIETIES
Figure 1.7 - This picture of solar granulation was taken on June 20 1999,with THEMIS (Heliographic Telescope for the Study of Solar Magnetism
and Instabilities) one of the very large CNRS instruments,developed in collaboration with Italy
It represents a square with sides of approximately 24,000 kilometers.(credit THEMIS/CNRS/INSU/CNR)
February 23th 1996, between 16:00 and 21:03 UT
50
0 50
Y (
arcs
ec)
X (arcsec)SOHO/MDI
100
100
Figure 1.8 - A supergranulation network superimposed in redon a photograph taken by the MDI instrument on SOHO
The arrows represent the speed of ascension of the supergranules, with the blue tothe top. Each side of the picture represents approximately 120,000 kilometers.

1 – THE SUN 15
At the end of this long journey, the photons reach an agitated zone, the convectionzone, in which protons and electrons spin round and round and form cells. Theconvection corresponds to a bulk motion of matter: hot gas rises, then cools,transmitting energy to the superficial layers of the solar atmosphere before sinkingdown again. In the outer region of the convection zone, on the surface of the Sun,the temperature is only about 6,000 degrees. Although this motion does not occur ina perfectly coherent manner, observation has shown a cyclic variation of 5 minutesfor the vertical speeds (this has given rise to a branch of astrophysics called solarseismology). From the Earth, these cells resemble grains of rice and are thereforeknown as granules. The average diameter of a granule is 1,200 kilometers and thedistance between the center of the granules is, on average, 1,500 kilometers. Sothey are huge bubbles of soup rising and sinking on the surface of the Sun! Theduration of a granule is 18 minutes on average and it rises to an altitude of about200 kilometers. There are several states of convection. Supergranules are of thesame origin and aspect as granules but differ in size (30,000 kilometers), speed ofascension (360 kilometers per hour) and duration (20 hours). They too are triggeredby the convection of hot matter but in this case from deeper layers as in thesaucepan where bubbles of different sizes can rise to the surface.
How can we see these solar bubbles? One method is to observe only what movesi.e. by taking snapshots one second apart and screening them dot by dot. If there hasbeen no motion, the difference between the pictures will be completely black. Anypart that is not black corresponds to a movement. The Doppler effect 17 is then usedto interpret the results. A rising supergranule corresponds to a decrease in thewavelength of the light wave received. For the observer, the color shifts towardblue. When the supergranule falls back down, the wavelength of the light wavereceived increases and the color shifts toward red. By studying the differencesbetween frames it is possible to tell not only what has moved but also the directionof movement relative to the observer.
The photograph of the Sun in figure 1.9 is based on this principle. First of all, itshows that the Sun rotates on its own axis. The left side is moving toward theobserver while the right side is drawing away, giving the attractive graduatedshading. This mean rotation then has to be screened and the picture re-processed tohighlight its main characteristics. The result can be seen in figure 1.10.
17 The velocity v of displacement of a body that emits a light of wavelength l can be calculated by
the difference Dl between the wavelength of the light observed and that of the light emitted. The
relation is: v c c observed emitted
emitted= =
-Dll
l ll
. In this convention, v is positive when the body
at the source of the light is moving away from the observer. A demonstration of the formerformula can be found in appendix 5.

16 SPACE WEATHER, ENVIRONMENT AND SOCIETIES
Figure 1.9 - This photograph of the Sun was taken by the MDI instrumenton board SOHO on March 30 1996
MDI uses the Doppler effect. The darkest shades correspond to a movement of2,500 metres per second towards the observer and the white to a movement of2,000 metres per second away (credit Stanford Loockheed Institute for SpaceResearch; SOHO/MDI).
Figure 1.10 - Part of the Sun after processing picture 1.9Here the darkest shades correspond to a movement of 50 meters per second towardsthe observer and the lightest to a movement of 50 meters per second away (creditSOHO/MDI).

1 – THE SUN 17
When processed, the picture reveals bubbles of different sizes: they are granules orsupergranules. By studying a great many exposures of this type, it was shown asearly as 1960 that granules appear and disappear with a periodicity of 296 seconds(with an uncertainty of ± 3 seconds). It was very quickly assumed that the origin ofthe phenomenon was to be found inside our star, providing an indirect way ofstudying the Sun's interior.
Radiative and convection zones can be differentiated by their dynamics. Therotation of the former is rigid, solely zonal and its speed which is perpendicular tothe axis of rotation of the Sun, is probably slower (about 29 days) than that of fluidrotation. At the interface between the two zones, charged particles trigger frictionand this creates currents known as "dynamo" currents. It is estimated that theseelectric currents are at the origin of the large-scale solar magnetic field (at least asfar as dipolar and quadrupolar components are concerned). The flow of matter fromthe equator towards the poles on the surface and from the poles towards the equatorin the depths of the Sun, very likely contributes to the formation of the magneticfield and its variations in time.
Astronomy, like all other fields of science, progressed considerably during the20th century. What did we know about the Sun a hundred years ago? Since wehad no knowledge of nuclear physics, its energy was thought to be generated solelyby the collision of condensed matter.
"On the assumption that nebulous matter was, at the start, extremely tenuous, acalculation was made of the amount of heat that could have been generated by allthese molecules falling toward the center, by the condensation that was at the originof the solar system. Assuming the specific heat of the condensing mass to be thatof water, the heat from the condensation alone would have been enough to producea rise in temperature of 28 million degrees centigrade (…). The condensationmovement was more than sufficient to produce the present temperature of the Sunand the temperature originating from all the planets (…). If the rate of emissionremains at the present level, the solar heat produced by the former condensation ofits mass will last for approximately 20 million years."
(C. FLAMMARION, Popular Astronomy, 1882)
5. THE PHOTOSPHERE, SOLAR RADIATION,THE SOLAR WIND
The photosphere is the visible "surface" of the Sun. It deserves a special mention inthe description of our star insofar as this is where most of the radiation and the solarwind come from. It is a definite boundary since it is the seat of the granules, super-granules and other phenomena such as sunspots or filaments covered in this chapter.

18 SPACE WEATHER, ENVIRONMENT AND SOCIETIES
Figure 1.11 - A picture of the photosphere taken with a filter letting through lightwith a wavelength of 58.4 nanometers (neutral hydrogen lines) on August 28, 1996
An assembly of 11 hours of observation at high resolution (credit CDS/SOHO).
99% of the total radiation is given off by the photosphere. The energy given out isapproximately 4 ¥ 1026 Watts (about 260 million Watts per square meter of solarsurface). The Earth receives only 1.743 ¥ 1017 Watts at cloud level or 1366.1 Wattsper square meter over the area of its surface lit by the Sun at the zenith. The latternumber is also called the solar constant, in spite of the fact that it is probably lessconstant than was thought only a few years ago.
Its radiation spectrum is similar to that of a blackbody 18 at 5,777 Kelvins. Ablackbody is a thermodynamic system that radiates at its own equilibriumtemperature. The properties of a blackbody, of its spectrum in particular, dependonly on the temperature: the total amount of energy emitted over the whole spectrumper unit of area (luminous flux density) varies as the fourth power of the temperature.The constant of proportionality is called the Stefan constant and is equal to5.67 ¥ 10
–8 W m–2 K–4. In other words, if we compare a fireback to a blackbody, thehigher its temperature rises, the more it radiates towards the room it is heating.
The spectrum of the blackbody can be calculated using a formulation expressed byPLANCK in 1901. In figure 1.12 the blue line represents the spectrum of a blackbodyat 5,777 Kelvin and the red line the measured spectrum of the Sun. The differences
18 Appendix 6 contains a presentation of the photometric magnitudes and appendix 7 describes the
black body and the most commonly used relations (laws of Wien, Stefan, Planck).

1 – THE SUN 19
are due in part to the absorption of lines in the media traversed between thephotosphere and the point of observation, but also to the fact that the blackbodyradiation requires thermodynamic equilibrium, which is not quite achieved on theSun. However, the differences remain slight.
The principal characteristic of the visible radiation of the Sun is its stability. Itsanalysis shows that it spans all colors 19. However, some of the wavelengths emittedby the photosphere are absorbed in the atmosphere of the Sun and it is possible, in asolar spectrum, to distinguish between the lines emitted and the lines absorbed(known as the emission or absorption spectrum). Figure 1.13 shows the range ofcolors of the visible solar radiation.
When PLANCK put forward a theory in 1901, little did he suspect the presence ofsuch intense invisible solar radiation 20. In 1937, SAHA demonstrated that theexcitation of atmospheric nitrogen could only be explained by the presence ofphoton radiation far more energetic than that which could be observed and at least a
Figure 1.12 - A comparison between the spectrum of the black bodyat 5,777 Kelvin (blue curve) and the solar spectrum (red curve)
Figure 1.13 - The solar spectrum obtained in 1972on top of the Jungfrau at 3,600 metres
The abscissa runs from 300 nanometers (on the left) to 1,000 nanometers (on theright) (credit L. Delbouille, L. Neven, G. Roland, BASS 2000).
19 The spectroscope, with which several of the lines of the solar spectrum were dissociated, was
invented by FRAUNHOFER (1787-1826).
20 Appendix 8 contains a presentation of radiation scales.

20 SPACE WEATHER, ENVIRONMENT AND SOCIETIES
million times more considerable than predicted by PLANCK. It was not until 1946that the first experiments carried out from rockets made it possible to measureeffectively the short wavelengths of solar radiation: ultraviolet (UV), then X-raysand, finally, gamma rays, the latter being the product of radioactive disintegration.The major characteristic of UV and X-rays is that they vary tremendously from onehour to the next, one month to the next and one year to the next. The ultraviolet fluxcan be multiplied by two and the X flux by thirty. Ultraviolet is more abundant butunfortunately the instruments used to measure its spectrum are heavy and, therefore,difficult to take on board a satellite.
The photosphere is not only the principal site in space from where electromagneticwaves are emitted, it is also the area where particles that make up what is known assolar wind are emitted. This phenomenon is closely related to the presence of a solarmagnetic field. We have pointed out that the magnetic field has large-scalecomponents, the origin of which can probably be found at the interface between theconvection zone and the radiative zone (see figure 1.4). The magnetic proliferationon the surface of the Sun (see figure 1.5) is probably due to the convection ofionized matter that creates numerous local magnetic fields. However, just as chargedparticles in motion create a magnetic field in a symmetrical pattern, a magnetic fielddraws the electrically charged particles along its field lines 21.
Now, let us imagine the convection of plasma that creates a local magnetic field onthe Sun, with a local North pole and a local South pole. These poles are linked byfield lines, around which plasma travels. Furthermore, due to the bubbling effect ofthe photosphere an ejection of plasma towards the outer region of the Sun at speedsof between 700,000 and 2.5 million kilometers per hour is added to the movementalong the field lines. To use a vivid image, the magnetic field lines carried by theplasma stretch toward the outer region of the Sun, into interplanetary space, whilekeeping their feet on the Sun.
Once it has left the Sun, this field is called "interplanetary" and the plasma becomesknown as "solar wind". In the case of the Sun, it is impossible to say whether thefield generates the movement of plasma or vice-versa. They are said to be "frozen"within each other 22 or that we have a frozen flux situation. This is what an observeron the Sun would see. An observer placed outside the star would have to add to themovement of particles the specific rotation of the Sun, and especially the fact thatthe footpoints of the field lines are anchored to the sun itself. The effect resembleswater spraying out of a portable watering-can: an ant on the watering-can sees the
21 A magnetic field line is the curve that is tangential at all points to the local magnetic field. Like
the equator or the isobars of a meteorological map, a field line is an imaginary line but can beused as a guide for physical representation (see appendixes 3 and 4).
22 In relation to the equations of appendix 9 concerning electromagnetism, this results in stationary
electromagnetic forces i.e. q E q+ Ÿ =v B 0 where E is the electrical field vector, B the
magnetic field vector and v the velocity of the particle of charge q.

1 – THE SUN 21
water spray straight out (radially) but the gardener sees a spiral known as the "spiralof Archimedes" Seen from the Earth, the interplanetary magnetic field does notappear to arrive in a straight line from the Sun but rather from its western limb(which also corresponds to the western edge of Earth for an observer on the diurnalside) From this point, for the same observer, it hits the spatial environment in agraceful east-west curve (figure 1.14).
Earth
Sunψ
Rotation of the Sun
BNorthPole
Figure 1.14 - Archimedes spiralThe lines represent the interplanetary magnetic field or the trajectory of the frozensolar plasma, indiscriminately.
The angle Y formed by a field line and the radial axis (with the Sun as the startingpoint) at a given spot depends on the ejection velocity of the solar wind. At Earthlevel, it is roughly one radian (or about 60°) for a mean wind velocity of 370 km s
–1.By then, the particles have covered a distance of 1.4 AU 23 along this path.
We have just described a first process of particle exchange between the surface ofthe Sun and its atmosphere. This emission is permanent and concerns the greaterpart of the photosphere, the solar zone known as "quiet". The energy given out during
23 At terrestrial orbit level, angle Y between the spiral of Archimedes and the axis connecting the
Sun to Earth, measured on the nocturnal side, is expressed in function of speed V (km s –1) of the
solar wind stream according to: Y =23 150
V if Y is expressed in degrees and Y = 404
V when
expressed in radians.
Length L (in astronomical units) of the magnetic field line connecting the Earth to the
photosphere is then: LLn= + + + +Ê
ËÁ
ˆ
¯˜1
21
122
Y Y YY
where Y is expressed in radians.
For a mean wind of 370 km s –1, the angle obtained is 62.6° (ª1 rd) and length L ª1.4 UA.

22 SPACE WEATHER, ENVIRONMENT AND SOCIETIES
Table 1.4 - Solar wind parameters at 1 AU
Usual highvalues
Minimumobserved
Nominalvalue
Number of particles per m3 83 ¥ 106 ª 0 5 ¥ 106
Velocity [km s–1] 950 250 370
Total intensity of the interplanetary magnetic field [nT] 85 ª 0 6
Intensity of the North-South componentof the interplanetary magnetic field [nT]
27 – 31 0
the ejection of these particles is roughly 10,000 Watts per square meter of solar area,which may seem low in comparison with the energy radiated as light. However,the influence of this solar wind has revealed itself to be of the utmost importancein space weather.
The mean concentration of solar wind at Earth level is 5 million particles per squaremeter i.e. roughly 5 ¥ 109 times lower than that of the air we breathe. The temperatureranges from a few hundred thousand to a few million degrees. However, here thenotion of temperature has a completely different meaning. Air temperature, forinstance, is the result of thermal exchanges caused by collisions between particles.When we receive heat from the air it is due to the collision of various molecules onour skin. In other words, temperature is a statistical quantity, a mean value takenfrom an infinite number of impacts.
There seems to be no point in measuring the temperature of a single particle since,alone, it cannot exchange heat. This is more or less what happens in the solar wind.There are relatively few particles and since they are all moving in the samedirection the likelihood of them coming into contact is very low. On average, overthe 200 million kilometers separating the Sun from the Earth (taking into accountthe spiral of Archimedes) they have less than … 5 chances of collision! Bytemperature, therefore, we mean the correspondence of particles in speed: the hotterthey are, the faster they are, or, in other words, the more energetic in terms ofkinetic energy 24.
Up until 1995, the only data concerning solar wind came from measurements takenalong the rotational orbit of the Earth, i.e. at one Astronomical Unit and in the
24 For a gas at temperature T, statistic mechanics give the expression of kinetic energy Ec in
function of mass m of a molecule and its mean quadratic velocity EN
k T mvcddl
B= =2
12
2
–Nddl is the number of degrees of freedom of the gas. In the terrestrial atmosphere, for neutral
particles, it is equal to 3 since the gas can move freely in three directions (gravity is not takeninto account). In the solar atmosphere, it can be considered that magnetic stresses reduce the
number of degrees of freedom to 2, so that E k T mvc B= = 12
2 .

1 – THE SUN 23
ecliptic plane. Since then, our knowledge has been enriched by the data obtained bythe ULYSSES probe which measures solar wind pole to pole at about 1.3 AU fromthe Sun. Before this, there were two contradictory models of solar wind, both basedon observations made in the ecliptic plane. The first model predicted a gradualincrease in solar wind velocity from the solar equator to the poles while the othersuggested that velocity would be maximum at a mean latitude. Neither of thesemodels was proven to be correct: during its first orbit, which took place in quietsolar conditions, ULYSSES observed that there are two distinct types of solar wind.Between the heliospherical latitudes 25 of 20° North and 20° South (thus comprisingthe ecliptic plane) the solar wind flows at an average speed of 400 kilometers persecond (this value can vary considerably). Then, over a distance of fewer than tendegrees, it increases to 750 kilometers per second. The regime then becomes fast butnoticeably less perturbed. The speed then increases slowly to reach approximately800 kilometers per second at latitude of about 80°. During its second orbit, whichtook place during active conditions, the picture was much more disturbed. Thereason will show up clearly later.
Figure 1.15 - An artist's impression of the ULYSSES satellite orbiting round the Sun, beyond the orbit of the Earth that can be seen in the foreground
The scales between the Sun and the planets have not been respected.(credit ULYSSES/ESA/NASA)
25 Concerning the solar sphere. The heliosphere is the area in space that undergoes the influence of
the solar atmosphere; it reaches as far as the limit where the stellar wind from other stars clasheswith the solar wind (between 100 and 150 AU).

24 SPACE WEATHER, ENVIRONMENT AND SOCIETIES
The models predicted a decrease in the flow of the solar wind above the poles. Thisis not so. Although there is a considerable decrease in the density of the solar wind,it is, on average, less considerable than the increase in velocity, resulting in a slightincrease in the flow rather than the expected decrease.
6. THE THERMAL PROFILE OF THE SOLAR ATMOSPHERE
Beyond the photosphere is the beginning of the solar atmosphere which, for a longtime, could only be observed from the Earth's surface in white light, during eclipses.Observations of this type are limited by the natural opacity of the atmosphere of ourplanet. Furthermore, details only become visible when their brilliancy differs fromthe natural background. This is the case when there is a significant difference inconcentration or in temperature between a structure of the Sun and its environment.Right up to the 1990s, our description of the Sun was misled by our senses: we wereunable to see the evolution of these structures, as they passed through zones ofsolar atmosphere with different macroscopic characteristics and therefore withbrilliancies that moved through space and sometimes disappeared. To study theatmosphere of the Sun, it is essential to start by defining the thermal profile of itssurface on the corona.
Our knowledge is largely based on the following observational principle: whenatoms receive heat, the thermal energy can exceed the electromagnetic energy thatmaintains the electrons in a given situation in relation to their atomic core. Anelectron is released and the atom is ionized. The higher the temperature rises, themore the ions thus created lose their electronic shell. As the temperature rises,atoms with several electrons will be transformed into increasingly (positively)charged ions. Iron that has been ionized up to fifteen times can be found on the Sun.When particles are excited, they are de-excited by emission of radiation with aspecific wavelength, a kind of signature. The idea, therefore, is to observe the Sunat specific wavelengths to highlight specific ions and, consequently, the temperatureof the medium.
The temperature is not the same throughout the photosphere. Moving spaceward, itdrops by about 1,000 degrees over a layer of about 500 kilometers (this varieswith the granular movements). Like our ejections of boiling water, solar matter ispropelled permanently between granules and supergranules in the form of protonand electron tongues known as spicules (between granules) or macrospicules(between supergranules). The main characteristics of spicules are a base diameter of1,000 kilometers, a height of between 5,000 and 10,000 kilometers, a mean numberof 30 per super-granule and a lifespan of 8 minutes. Their temperature is about100,000 degrees. Although their correlation with the magnetic field has been proven,their origin is still uncertain.
1 – THE SUN 25
12 000
8 000
Alti
tude
[km
]
16 000
4 000
03×103 104 3×10⁴ 3×105105 106 3×10⁶ 107
Temperature [K]
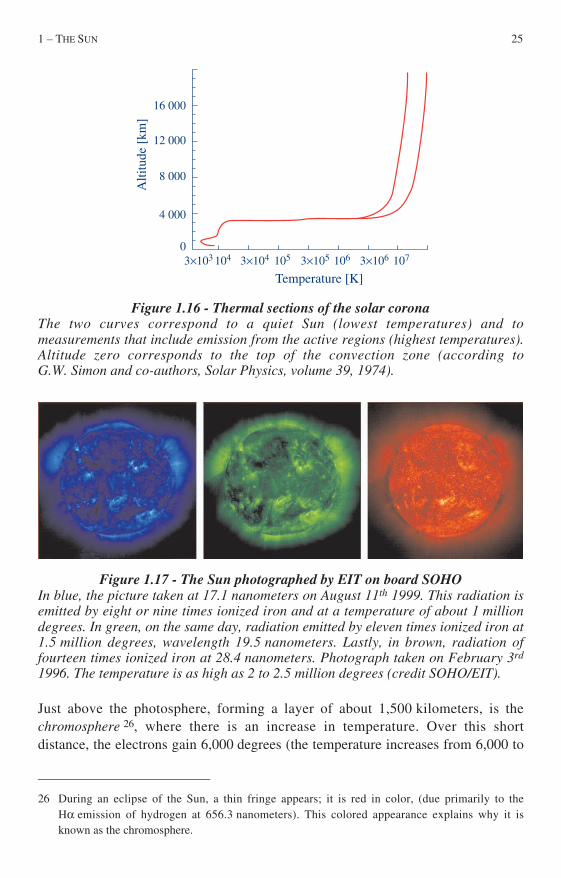
Figure 1.16 - Thermal sections of the solar coronaThe two curves correspond to a quiet Sun (lowest temperatures) and tomeasurements that include emission from the active regions (highest temperatures).Altitude zero corresponds to the top of the convection zone (according toG.W. Simon and co-authors, Solar Physics, volume 39, 1974).
Figure 1.17 - The Sun photographed by EIT on board SOHOIn blue, the picture taken at 17.1 nanometers on August 11th 1999. This radiation isemitted by eight or nine times ionized iron and at a temperature of about 1 milliondegrees. In green, on the same day, radiation emitted by eleven times ionized iron at1.5 million degrees, wavelength 19.5 nanometers. Lastly, in brown, radiation offourteen times ionized iron at 28.4 nanometers. Photograph taken on February 3rd
1996. The temperature is as high as 2 to 2.5 million degrees (credit SOHO/EIT).
Just above the photosphere, forming a layer of about 1,500 kilometers, is thechromosphere 26, where there is an increase in temperature. Over this shortdistance, the electrons gain 6,000 degrees (the temperature increases from 6,000 to
26 During an eclipse of the Sun, a thin fringe appears; it is red in color, (due primarily to the
Ha emission of hydrogen at 656.3 nanometers). This colored appearance explains why it isknown as the chromosphere.

26 SPACE WEATHER, ENVIRONMENT AND SOCIETIES
12,000 degrees) that is a gain of about 4 degrees per kilometer. The source of heatis, of course, photospheric radiation but, also, a magnetic interaction, which has notyet been correctly modeled. The spicules that rise to an altitude of several thousandkilometers pass through the chromosphere. Other horizontal structures called fibrillescarry matter. These are relatively cold, dark structures of matter that appear to definethe limits of the magnetic structures of the chromosphere. Spicules, macrospicules andfibrilles form networks and, in altitude, these networks reproduce the granules andsupergranules of the photosphere.
Figure 1.18 - On November 15th 1999, it is Mercury's turn to try and eclipse the SunThe TRACE satellite photographs the event. On the edge of the solar corona,spicules i.e. tongues of fire can be seen rising from the photosphere (credit Big BearLaboratory (BBSO – California); New Jersey Institute of Technology (NJIT)).
Figure 1.19 - The chromosphere clearly shows up as a pinkish-red fringein this picture taken during the eclipse on August 11th 1999
(external corona observed during the second contact; credit P., N. and J.F. Mein,DASOP, Observatory of Paris-Meudon).

1 – THE SUN 27
From the chromosphere, the solar atmosphere that has become hotter is called thesolar corona. This is the area that shines brightly enough to be visible during totaleclipses. Between 2,500 and 3,000 kilometers, the temperature rises abruptly from12,000 degrees to more than 1 million degrees 1,000 kilometers higher up, i.e. about1,000 degrees per kilometer (see figure 1.16). It then goes on rising over about15,000 kilometers to reach several million degrees. This area is called the transitionregion.
Beyond this starts what we could call the high solar atmosphere, bathing in its solarwind and "interplanetary" magnetic field. The wind can be characterized in aperfectly classical manner by the kinetic pressure it produces. Less familiar, perhaps,is the fact that the magnetic field, which produces a magnetic force, can also becharacterized by a pressure 27. In the case of solar wind, these two pressures arequite comparable.
7. SOLAR DYNAMICS
We have known since the seventeenth century that solar activity is variable.However, even outside of its most agitated periods, the Sun displays dynamics of anextreme amplitude. In other words, although we tend to use the terms "calm" and"active" to describe solar activity, this is all relative: during a period of calm, theSun can undergo eruptive bursts that affect it as a whole.
At the beginning of this book, the Sun and its atmosphere were described as perfectsymmetrical and homogenous spheres. The study of solar activity shows thissimplification to be incorrect. Our understanding of the Sun remains limited: themost recent observations have invalidated models without providing satisfactoryalternative mechanisms. For the time being, the Sun can only be presentedmorphologically. In a manner, which is no doubt discretionary, we shall proceedto study four indicators of solar dynamics: solar spots, solar coronal holes, solarcorona mass ejections and finally the large-scale structure of the streamers. Thesephenomena, which occur at increasing altitudes, constitute separate levels of solaractivity which are, however, undoubtedly related.
7.1. SUNSPOTS. THE SOLAR CYCLE. PROMINENCES AND ERUPTIONS
Figure 1.20 shows the photosphere. Dark zones are clearly distinguishable: these aresunspots. They can easily be observed by taking a fairly wide piece of plastic piping(PVC as used for construction, for instance) and covering one end with a sheet ofpaper. Next, make a hole in the paper and direct that end of the pipe towards the
27 Appendix 10 contains elements concerning kinetic pressure and magnetic pressure.

28 SPACE WEATHER, ENVIRONMENT AND SOCIETIES
Sun. On the other side, at a good distance from the pipe, place a sheet of white paperthat will serve as a screen. The distance depends on the length of the tube and mustbe adjusted until the projection of the Sun is sufficiently clear 28.
Sunspots, sometimes seen in clusters, are mainly located at latitudes of between40° North and 40° South. They appear to be darker because their temperature islower: about 4,000 degrees. They therefore shine less brightly than the surroundingphotosphere. Their diameter can exceed 300,000 kilometers. The magnetic fieldinside the spots is 100 to 5,000 times more intense than the surrounding field. A spotgrows over a few days and a cluster of spots can last for 10 to 100 days. Since theyare easy to observe, there has been a relatively precise count since 1610, that is,since the invention of the telescope. Regular counts have been carried out sincethe eighteenth century. The behavior of these spots is rather spectacular: there are
Figure 1.20 - This picture shows the highest number of sunspots groupsobserved during the present cycle (23rd) on September 20th 2000
The total area of photosphere covered by the spots amounts to more than twelvetimes the total area of the Earth (credit MDI/SOHO).
28 Never observe the Sun with the naked eye, or with ordinary sunglasses! This could lead to
burning of the retina, and this damage could be permanent. This happened to 27 people in Franceduring the eclipse on August 11th 1999. If you still have the special eclipse glasses lying in adrawer somewhere, do not use them again. They may have micro-scratches which would let therays of the Sun through. Only use them if they have been kept in their original packing withoutbeing folded.

1 – THE SUN 29
periods of maximum with more than 300 and periods of minimum with no spots atall! Since regular observation first began, the longest period without spots lasted for70 years. This is the Maunder minimum, from 1645 to 1715. There have, however,been other, less pronounced periods with a low number of spots: between 1795 and1830 (the Dalton minimum) and at the start of the twentieth century. When thenumber of spots is low the Sun is said to be quiet and when this number is high it issaid to be in an active period. A great many other parameters characterize solaractivity. For instance, the production of the ultraviolet flux, which we have alreadymentioned, varies in a manner very similar to that of sunspots.
For the last 250 years or so, the behavior of the number of spots appears to have beenmore consistent. Using as a starting point a quiet period, with no spots, if we waitfor a few months we can see them forming at around latitude 45° North or South.Then, over the next five years, the area of formation moves nearer to the equator.As maximum activity is reached, 4 to 5 years into the cycle, new spots appear nearlatitude 5° but in decreasing numbers. After roughly eleven years, the Sun returnsmore or less to its original state. This cycle is called the Schwabe cycle.
The cycle becomes more complicated if the sign of the magnetic field of thesunspots is taken into account (North or South, positive or negative). The followingbehavior, sometimes known as the "Hales Polarity Law" can then be observed: thepolarity of the foremost spots in one of the hemispheres is the opposite of that in the
Figure 1.21 - A photograph of sunspots in the chromosphere, observed in the alpharay of hydrogen (656.28 nanometers) on July 14th 2000, recorded at Dunn's SolarTelescope in the National Solar Observatory / Sacramento Peak ObservatoryOne side of this square represents 124,000 kilometers. This picture represents oneof the major solar flares of cycle 23, known as the Bastille Day flare. Along withthis flare there was an ejection of coronal matter at more than 1,500 kilometers persecond (credit S. Koutchmy, CNRS-France; C. Viladrich).
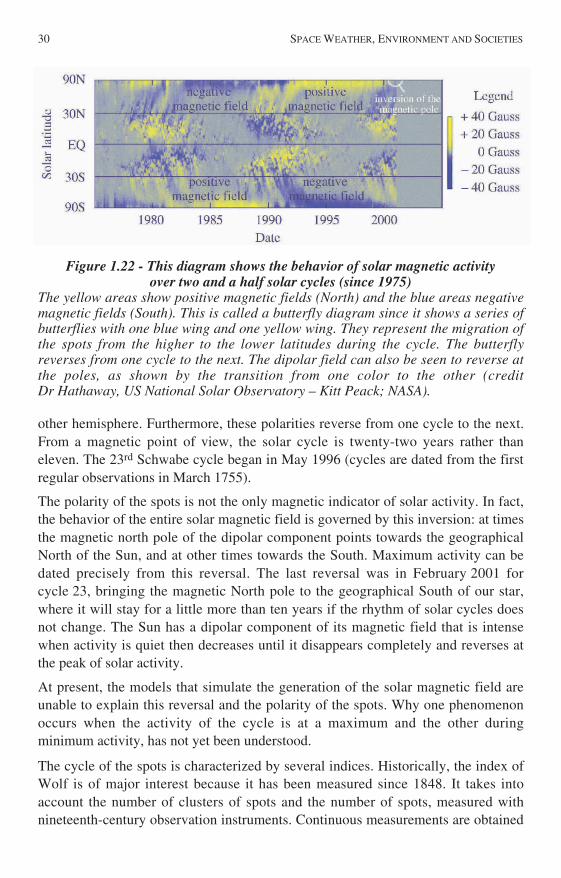
30 SPACE WEATHER, ENVIRONMENT AND SOCIETIES
Figure 1.22 - This diagram shows the behavior of solar magnetic activityover two and a half solar cycles (since 1975)
The yellow areas show positive magnetic fields (North) and the blue areas negativemagnetic fields (South). This is called a butterfly diagram since it shows a series ofbutterflies with one blue wing and one yellow wing. They represent the migration ofthe spots from the higher to the lower latitudes during the cycle. The butterflyreverses from one cycle to the next. The dipolar field can also be seen to reverse atthe poles, as shown by the transition from one color to the other (creditDr Hathaway, US National Solar Observatory – Kitt Peack; NASA).
other hemisphere. Furthermore, these polarities reverse from one cycle to the next.From a magnetic point of view, the solar cycle is twenty-two years rather thaneleven. The 23rd Schwabe cycle began in May 1996 (cycles are dated from the firstregular observations in March 1755).
The polarity of the spots is not the only magnetic indicator of solar activity. In fact,the behavior of the entire solar magnetic field is governed by this inversion: at timesthe magnetic north pole of the dipolar component points towards the geographicalNorth of the Sun, and at other times towards the South. Maximum activity can bedated precisely from this reversal. The last reversal was in February 2001 forcycle 23, bringing the magnetic North pole to the geographical South of our star,where it will stay for a little more than ten years if the rhythm of solar cycles doesnot change. The Sun has a dipolar component of its magnetic field that is intensewhen activity is quiet then decreases until it disappears completely and reverses atthe peak of solar activity.
At present, the models that simulate the generation of the solar magnetic field areunable to explain this reversal and the polarity of the spots. Why one phenomenonoccurs when the activity of the cycle is at a maximum and the other duringminimum activity, has not yet been understood.
The cycle of the spots is characterized by several indices. Historically, the index ofWolf is of major interest because it has been measured since 1848. It takes intoaccount the number of clusters of spots and the number of spots, measured withnineteenth-century observation instruments. Continuous measurements are obtained

1 – THE SUN 31
by applying correction factors to observations gathered with our modern, extremelyprecise instruments in order to allow comparison with those WOLF would haveobtained with his own instrument. Amongst other norms of observation, index RI isused for monthly spots and index RI12 averaged over a year 29.
Since instruments are increasingly precise and we need an index that can be used asa geophysical record, we apply a correction factor kcorr that is adjusted accordingto the apparatus and takes into account its precision of observation so that twoinstruments of different precision give the same number. On figure 1.23 we showthe evolution of R over a period of 63 years. The variation is relatively regular anddetermines the activity of the solar cycle.
300200100
0198019601940
Year
Suns
pot n
umbe
r
Figure 1.23 - The evolution of index R according to the yearsThe cycle of approximately 11 years is particularly visible.
Figure 1.24 - A photograph of a sunspot and the surrounding granules(credit S. Koutchmy, IAP-CNRS)
29 The names of the indexes have been decided once and for all. Thus the index of Wolf is R and
depends on the number of groups of spots G and the number of the spots T: R = kcorr (10 G + T).The mean index of spots per month is called RI12. It is calculated using the relation
RIRI
RI mRI
m12
112
6
2
6
25
5= + +
+
=-Â
( ) ( ) ( )Ê
ËÁ
ˆ
¯˜
– where RI(m) represents the number of
spots during month m.

32 SPACE WEATHER, ENVIRONMENT AND SOCIETIES
The eleven-year cycle may not be a true one. We may have been led astray by thevery short period of observation. The cycles may vary, sometimes by 5 years andsometimes by 100 years, in a chaotic manner. This is one of the questions astro-physicists are trying to answer. This duration in itself –11 years if we consider thenumber of spots and 22 years if we also take into account their magnetic polarity–poses a challenge. It calls to mind the time it takes for a surface element to migratefrom the equator to the pole and then from the pole to the equator. Do theseobservations apply to correlated processes or are they independent? And where doesthe inversion of the dipolar field fit into the puzzle? There is no answer to thesequestions for the time being. As things stand, we are unable to assemble the pieces ofthese numerous but scattered and probably fragmentary observations to form a whole.
How are the spots formed? The surface magnetic field of the Sun shows up as fieldlines that are perpendicular to the surface but can be found both above and belowthe photosphere. This is what leads to the ejection of spicules. However, matterrevolves more slowly at high latitudes than at lower ones and more quickly near theinterior than near the surface. Under the effect of these rotations, magnetic field linesare distorted, coil up, twist… They become more complex in shape, as shown infigure 1.5 or photograph 1.25.
When the field lines become very dense, a sort of bulge is formed beyond thesurface, giving rise locally to intense magnetic field tubes, perpendicular to thesurface. In this zone, matter is slowed down (or organized) by the field lines, heat
Figure 1.25 - The TRACE satellite reveals the magnetic loopsabove the photosphere
The scale of this picture is about 100,000 kilometers per 5 centimeters. It was takenat 17.1 nanometers, the characteristic wavelength of an emission at 1 millionKelvins (credit TRACE-NASA).

1 – THE SUN 33
input from neighboring zones becomes difficult, the gas cools down, and a spot isborn. Once it has formed, the spot is progressively eroded by the motion of thematter of supergranulations. The field lines produced by a spot favor the dissipationof energy towards the immediate atmosphere, giving rise to hot atmospheric zoneswhich can extend into the solar corona: these are chromospheric plages.
A few days after they appear, a filament may form above the spots. This is a longstructure that seems darker because it rises from the lower, colder layers towardshotter layers. They can be seen as dark areas on a light background (figure 1.27).
However, if this prominence appears on the side of the Sun (in relation to us) it willstand out as a light area on the dark background of the sky, like an arch that canreach up to 10,000 kilometers into the corona: it is then called an active regionprominence. Its magnetic field can be as high as 50 Gauss i.e. 50 times the dipolarsolar field. It is to be noted that the base of the prominences is not located onthe sunspots, even though the two phenomena are probably connected. This is yetanother question concerning solar astrophysics to which, as yet, we have no answer.Here are a few other questions: are the prominences loops, bubbles or arches?Sometimes they appear to be twisted: they are like rubber bands that have beentwisted and turned until they snap or unwind very quickly. When we do this, energyis stocked slowly in the rubber band and then released violently. Does the samephenomenon occur in the prominences?
Sunspots have been known for several centuries. This is how C. FLAMMARION
interpreted them more than a hundred years ago:
"The Sun will die. It is losing heat constantly because the energy it consumes as itradiates is, so to speak, unconceivable… If the Sun is still condensing sufficientlyfast to offset such depletion (…) then it will not yet have started to cool down;otherwise, its cooling down period will already have begun. This is more likely thecase since the spots that cover it periodically can only be regarded as a sign of thisdrop in temperature. The day will come when the spots will be far more numerousthan they are at present and will start to cover a considerable area of the solarglobe."
(C. FLAMMARION, Popular Astronomy, 1882)
A prominence can last for up to three solar rotations. Sometimes a bright pointappears on a chromospheric plage and, in a matter of minutes, this point spreads untilit covers an area of more than 50,000 kilometers in diameter. Then this brightnessdecreases in less than 3 hours. This phenomenon, known as a solar flare, is oftenpreceded by a local prominence; the energy trapped in the prominence is suddenlyreleased: up to 1023 joules are emitted in a few minutes. This is equivalent to theproduction of 30 million 1,000 megawatts power plants over a period of 100 years.This ejection comes with intense ultraviolet and X radiation as well as radio waves

34 SPACE WEATHER, ENVIRONMENT AND SOCIETIES
Chromosphericplage
Sunspots
Fibrilles
Figure 1.26 - This photograph, taken from the Pic du Midi on August 26th 1979(Haaaa ray) shows an active center on the chromospheric level with a network
of fibrilles, two spots with reverse polarities and chromospheric plages(credit Observatory of Midi-Pyrénées-solar team. Author: C.E. Alissandrakis)
Sunspot
Filament
Luminous zone
Figure 1.27 - A picture of the photosphere on November 5th 2000 (during an activeperiod), taken by the Meudon spectroheliograph in Haaaa (656.3 nanometers)
We can see a great number of filaments, sunspots, luminous zones.(credit DASOP, Observatory of Paris-Meudon; CNRS)

1 – THE SUN 35
Figure 1.28 - Here we can see a prominence in the active region on the limbof the solar disk, photographed in white light during the total eclipse of the Sun
on July 11th 1991, from Mauna Kea in Hawai(credit S. Koutchmy, IAP-CNRS)
and, frequently, the emission of high energy 30 –up to 1 gigaelectronvolt 31– particlesthat can be sent out from the Sun. This is the second process –fundamentally sporadicin character– by which particle exchange takes place between the surface of the Sunand its atmosphere and then between the Sun and the atmosphere of the Earth. Thisphenomenon seems to occur more frequently when the filament is S-shaped or areversed S. This observation is a sure-fire clue when it comes to forecasting solareruptions. Figure 1.29 shows one of these eruptions.
Prominences of another type, unrelated to the presence of spots, are to be foundabove what is called the "quiet" Sun. They are known as "quiescent" prominencesand can reach an altitude of 100,000 kilometers (0.15% of the Solar radius). Theyhave a magnetic field of about 10 Gauss. The mass of the largest of these canrepresent up to one fifth of the coronal mass. They can also end in a flare, as shownon figure 1.30, and propel their matter out into space.
Flares are phenomena that involve tremendous amounts of energy. Temperatures ofup to 25 million degrees can be reached in large flares. At temperatures such asthese, iron is ionized 25 times.
30 Sometimes, one differentiates between eruptions that seem to eject primarily radiation ("flares")
and those that transport energy in the form of matter ("eruption"). There is, however, noconsensus on this terminology.
31 The electronvolt is the energy transmitted to an electron above the threshold of a difference inpotential of 1 Volt. This energy is equal to 1.6 ¥ 10
–19 joules in the International System.Therefore 1 gigaelectronvolt is equal to 1.6 ¥ 10
–10 joules.

36 SPACE WEATHER, ENVIRONMENT AND SOCIETIES
Figure 1.29 - In this figure, a solar flare spreads near and above a sunspotNote the S-shaped filament that does not disappear as the flare develops. About4 hours elapsed from the start of the phenomenon (top left) to the end (bottom right)(credit Hiraiso Solar Terrestrial Research Center, Japan).
Figure 1.30 - A photograph of the chromosphere,taken by the ultraviolet telescope on Skylab on August 9th 1973
(line of once-ionized helium HeII at 30.4 nanometers)The diameter of the prominence that is bursting out into a flare is about 34 timesthat of the Earth (credit NASA).

1 – THE SUN 37
01:18 UT 07:18 UT 13:19 UT 16:07 UT 19:29 UT
Figure 1.31 - Here is a spectacular series of pictures taken by SOHOon August 27th 1997, showing a magnificent solar flare
It was taken at 30.4 nanometers. This corresponds to a temperature of 60,000 to80,000 degrees, far colder than the environment which is at 1 million degrees. Onthe fourth picture, at 16.07 UT, the diameter of the prominence is about 28 timesthat of the Earth (credit SOHO/EIT consortium).
Figure 1.32 - A seismic wave on the surface of the Sun, on July 9th 1996,combined with a solar flare and, probably, a coronal mass ejection
Within an hour, the wave is ten terrestrial radii from the flare (credit SOHO/MDI).
Flares can sometimes lead to seismic waves that spread over a very large part of theSun. Figures 1.31 and 1.32 illustrate these phenomena of our star during a period,which can still be considered as "quiet"!
7.2. CORONAL HOLES. FAST WIND
We have explored the solar atmosphere starting from the surface of the Sun, thephotosphere. Recall (figure 1.16) that at an altitude of about 3,000 kilometers andover a few tens of kilometers, the temperature increases suddenly from 10,000to 100,000 degrees and very quickly reaches several million degrees. This area ofintense heat is called the transition region. What sort of structures can be foundabove this? Observation of the Sun with X-rays, almost systematically shows large,

38 SPACE WEATHER, ENVIRONMENT AND SOCIETIES
not very bright plages. These are extremely mobile low-density structures that arecooler than the corona (1 to 2 million degrees) and can cover up to one third of theSun. They are called coronal holes. The principal holes are often located at the polesand their magnetic field opens widely toward space, providing a sort of exit for thesolar wind. They cover a larger area during periods when the Sun is quiet and shrinkwhen it is active. The physics of coronal holes remains, by and large, unknown.
Large tongues of matter called plumes break loose from coronal holes. These plumesare far bigger than the spicules: a few tens of thousands of kilometers compared witha few thousand. Their temperature is about 1 million degrees, that is, ten timesgreater than that of the spicules. Their origin is still uncertain. Wind blows almosttwice as fast as the solar wind that blows from the spicules. Called fast wind, it wasmeasured by the ULYSSES probe beyond a latitude of 20 degrees. It normally blowsat even higher latitudes but the Coriolis 32 effect tends to deflect it back toward thesolar equator i.e. toward the ecliptic plane 33.
B
A
Figure 1.33 - The Sun photographed in X-rays by the YOHKOH satelliteon December 5th 1999
The coronal hole (A) and the solar dynamics are clearly revealed. One of thereasons it is so difficult to compare pictures is that we must bear in mind thatdifferent layers of the Sun are observed with different wavelengths. We can also seecoronal loops (in B, for instance) plotting the local magnetic field (credit JapaneseInstitute of Space and Astronautical Science (ISAS/LPARL); NASA).
32 See the revision on the force of Coriolis in appendix 11.
33 The plane of the Earth's orbit round the Sun.

1 – THE SUN 39
Figure 1.34 - This picture was taken at 17.1 nanometers,with the radiation emitted by eight or nine times ionized iron
At this wavelength we can observe (in processed colors) a darker area at the polewhich is a "coronal hole". Plumes are huge strands of matter above this coronalhole (credit EIT on SOHO).
Figure 1.35 - On December 6th 1991, EIT took four photographs of the Sun,at 17.1 nanometers (top left), 19.5 nanometers (top right), 28.4 nanometers
(bottom left) and 30.4 nanometers (bottom right)Coronal loops can be observed on all these pictures, meaning that they occur atvarious altitudes above the chromosphere. The coronal holes are clearly visible onthe picture of the fourteen times ionized iron at 28.4 nanometers.


![Friendly Societies Act, 1896. - Legislation.gov.uk · Friendly Societies Act, 1896. [C$. 25.] (c) as respects benefit building societies and societies A.D. 1896. instituted for purposes](https://img.pdfslide.us/doc/110x75/60a1c91672f1981bec5f2f74/friendly-societies-act-1896-friendly-societies-act-1896-c-25-c-as-respects.jpg)


![Egypt’s Entrepreneurship Ecosystemegyptinnovember.com/wp-content/uploads/2018/12/Day-1_7... · 2019. 3. 22. · Egyptian Entrepreneurship Ecosystem Infograph [ELLI] V.a Designed](https://img.pdfslide.us/doc/110x75/5fc4584a27cfa66d657ed77b/egyptas-entrepreneurship-ecos-2019-3-22-egyptian-entrepreneurship-ecosystem.jpg)