Embed Size (px)
Citation preview

1
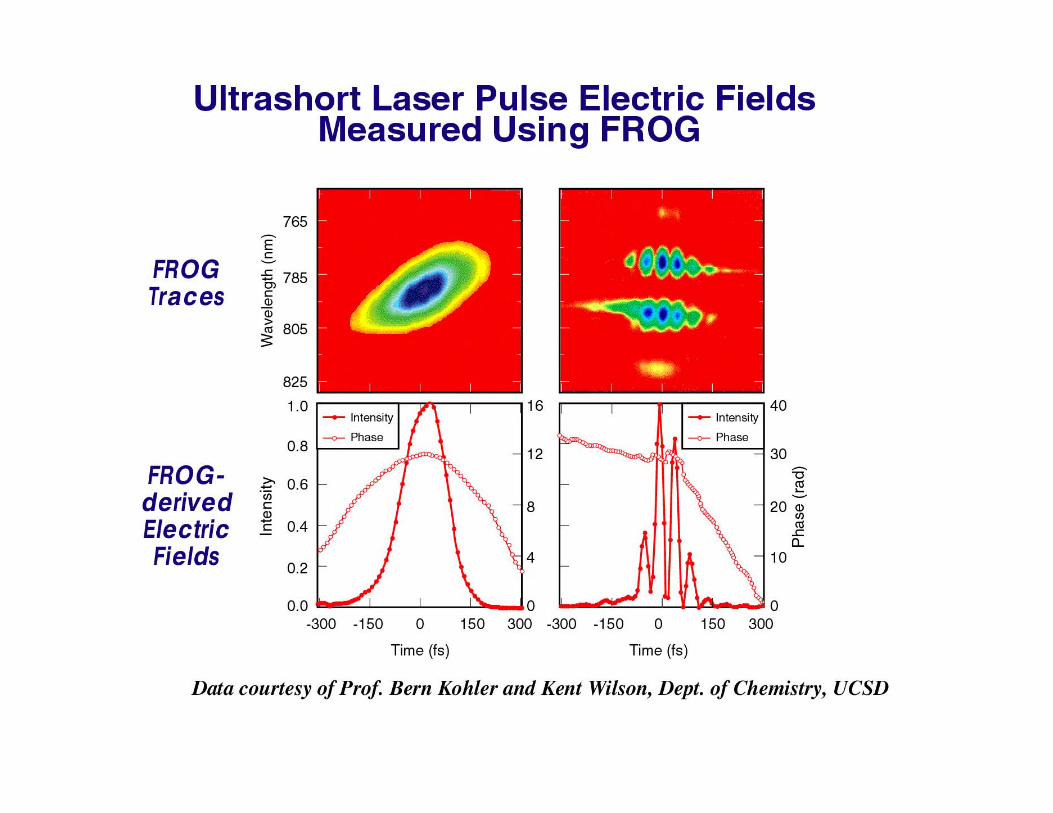
17. Measuring Ultrashort Laser Pulses II: FROG
10 20 30 40 50 60
10
20
30
40
50
60
SHG FROG trace--expanded
10 20 30 40 50 60
10
20
30
40
50
60
FROG trace--expanded
The Musical Score and the Spectrogram
Frequency-Resolved Optical Gating (FROG)
1D vs. 2D Phase Retrieval
FROG as a 2D Phase-retrieval Problem
Second-harmonic-generation (SHG) FROG (and other geometries)
Measuring the shortest event ever created
Single-shot FROG, XFROG, TREEFROG, and GRENOUILLE
Rick Trebino, Georgia Tech, [email protected]

2
Time
Intensity
Phase
Perhaps it’s time to ask how researchers in other fields deal with their waveforms…
Consider, for example, acoustic waveforms.
Autocorrelation and related techniques yield little information about the pulse.

3
time
frequ
ency
ffpp pp
It’s a plot of frequency vs. time, with information on top about the intensity.
The musical score lives in the “time-frequency domain.”
Most people think of acoustic waves in terms of a musical score.

4
A mathematically rigorous form of a muscial score is the “spectrogram.”
The spectrogram is a function of and . It is the set of spectra of all temporal slices of E(t).
If E(t) is the waveform of interest, its spectrogram is:
SpE (, ) E(t) g(t ) exp(it) dt
2
where g(t-) is a variable-delay gate function and is the delay.
Without g(t-), SpE(,) would simply be the spectrum.

5
The Spectrogram of a waveform E(t)
We must compute the spectrum of the product: E(t) g(t-)
g(t-)E(t)
time0
The spectrogram tells the color and intensity of E(t) at the time .
g(t-) contributes only intensity, not phase (i.e., color), to the signal pulse.
E(t) contributes phase (i.e., color),
to the signal pulse.
E(t) g(t-)

6
Negatively chirped pulse
Positively chirped pulse
Unchirped pulse
10 20 30 40 50 60
10
20
30
40
50
60
SHG FROG trace--expanded
10 20 30 40 50 60
10
20
30
40
50
60
FROG trace--expanded
Like a musical score, the spectrogram visually displays the frequency vs. time.
Freq
uenc
yFr
eque
ncy
Time
Delay
Spectrograms for Linearly Chirped Pulses

7
Properties of the Spectrogram
The spectrogram resolves the dilemma! It doesn’t need the shorter event! It temporally resolves the slow components and spectrally resolves the fast components.
Algorithms exist to retrieve E(t) from its spectrogram.
The spectrogram essentially uniquely determines the waveform intensity, I(t), and phase, (t).
There are a few ambiguities, but they are “trivial.”
The gate need not be—and should not be—significantly shorter than E(t).
Suppose we use a delta-function gate pulse:
E(t) (t ) exp(it ) dt
2
E() exp(i ) 2
E( ) 2= The Intensity.
No phase information!
8
IFROG(,) = Esig(t,) e-it dt 2
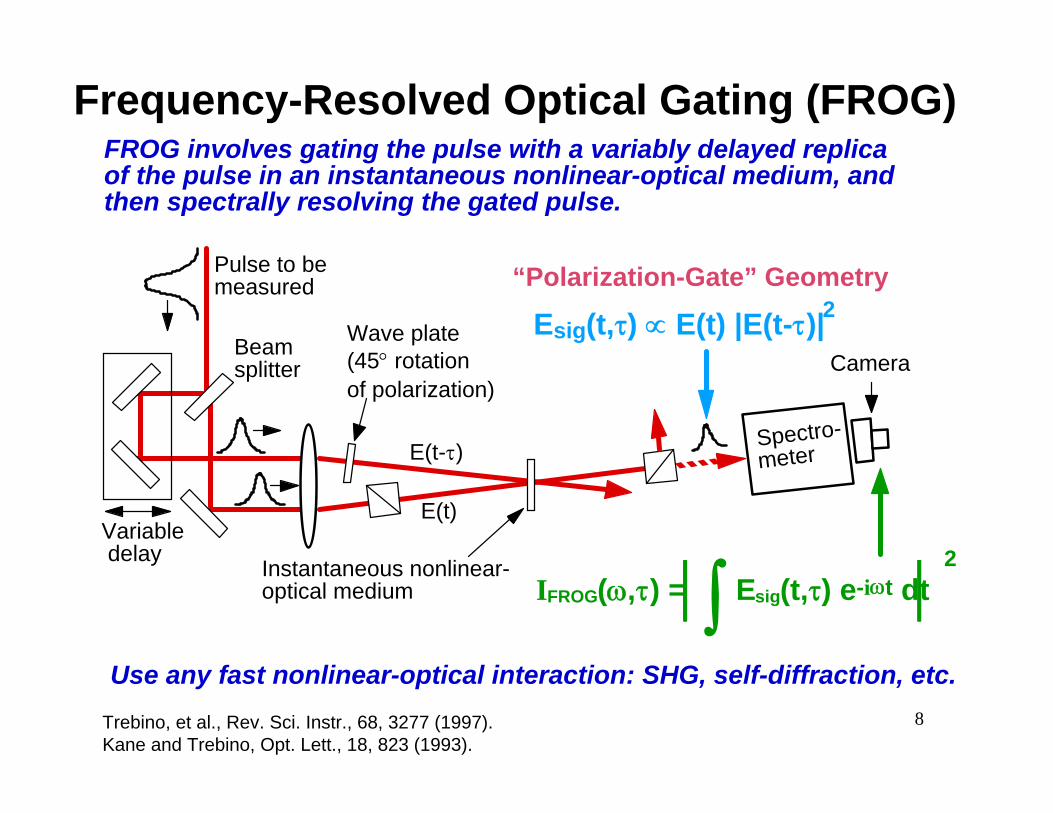
FROG involves gating the pulse with a variably delayed replica of the pulse in an instantaneous nonlinear-optical medium, and then spectrally resolving the gated pulse.
Use any fast nonlinear-optical interaction: SHG, self-diffraction, etc.
Spectro- meter
CameraBeam splitter
Instantaneous nonlinear-optical medium
Pulse to be measured
E(t)
E(t-)
Wave plate (45 rotation of polarization)
Esig(t,) E(t) |E(t-)|2
Variable delay
“Polarization-Gate” Geometry
Frequency-Resolved Optical Gating (FROG)
Trebino, et al., Rev. Sci. Instr., 68, 3277 (1997).Kane and Trebino, Opt. Lett., 18, 823 (1993).
9
Frequency-Resolved Optical Gating
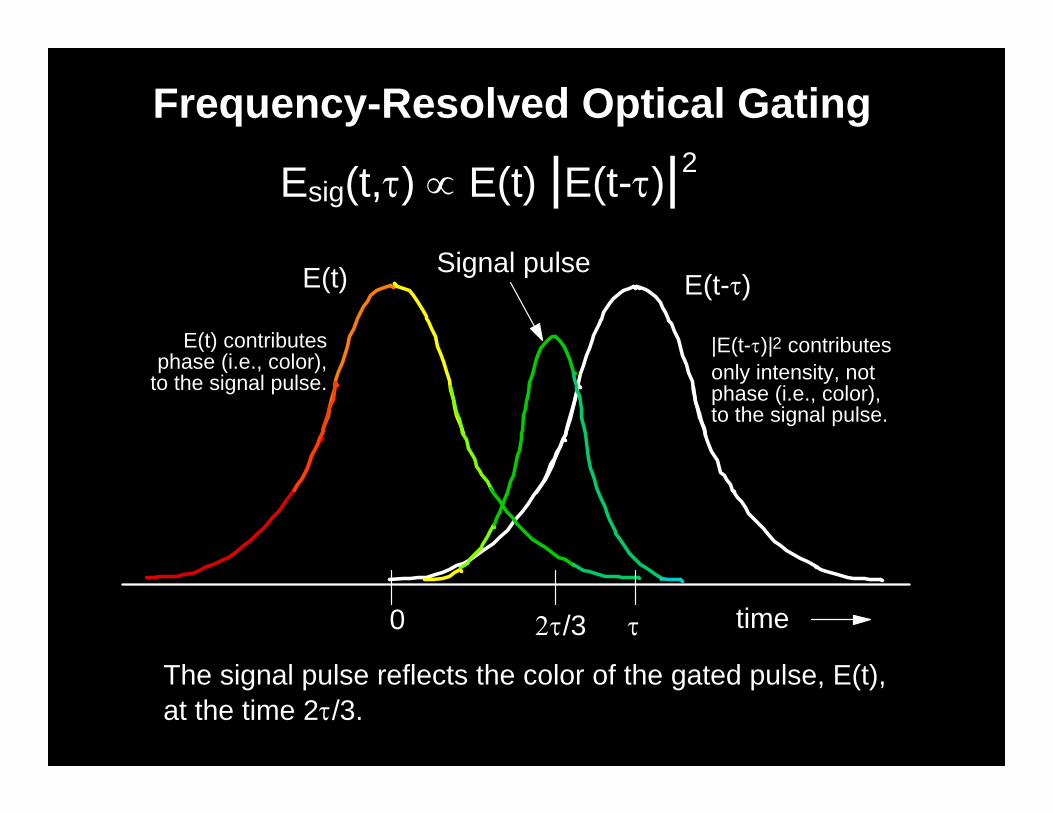
Esig(t,) E(t) |E(t-)|2
E(t-)E(t)
time0
Signal pulse
/3
The signal pulse reflects the color of the gated pulse, E(t), at the time 2/3.
|E(t-)|2 contributes only intensity, not phase (i.e., color), to the signal pulse.
E(t) contributes phase (i.e., color),
to the signal pulse.

10
Negatively chirped pulse
Positively chirped pulse
Unchirped pulse
10 20 30 40 50 60
10
20
30
40
50
60
SHG FROG trace--expanded
10 20 30 40 50 60
10
20
30
40
50
60
FROG trace--expanded
The FROG trace visually displays the frequency vs. time.
Freq
uenc
yFr
eque
ncy
Time
Delay
FROG Traces for Linearly Chirped Pulses

11
10 20 30 40 50 60
10
20
30
40
50
60
FROG trace--expanded
10 20 30 40 50 60
10
20
30
40
50
60
FROG trace--expanded
10 20 30 40 50 60
10
20
30
40
50
60
FROG trace--expanded
Self-phase-modulated pulse
Double pulseCubic-spectral-phase pulse
Freq
uenc
yFr
eque
ncy
Inte
nsity
Time
Delay
FROG Traces for More Complex PulsesFr
eque
ncy
Delay
12
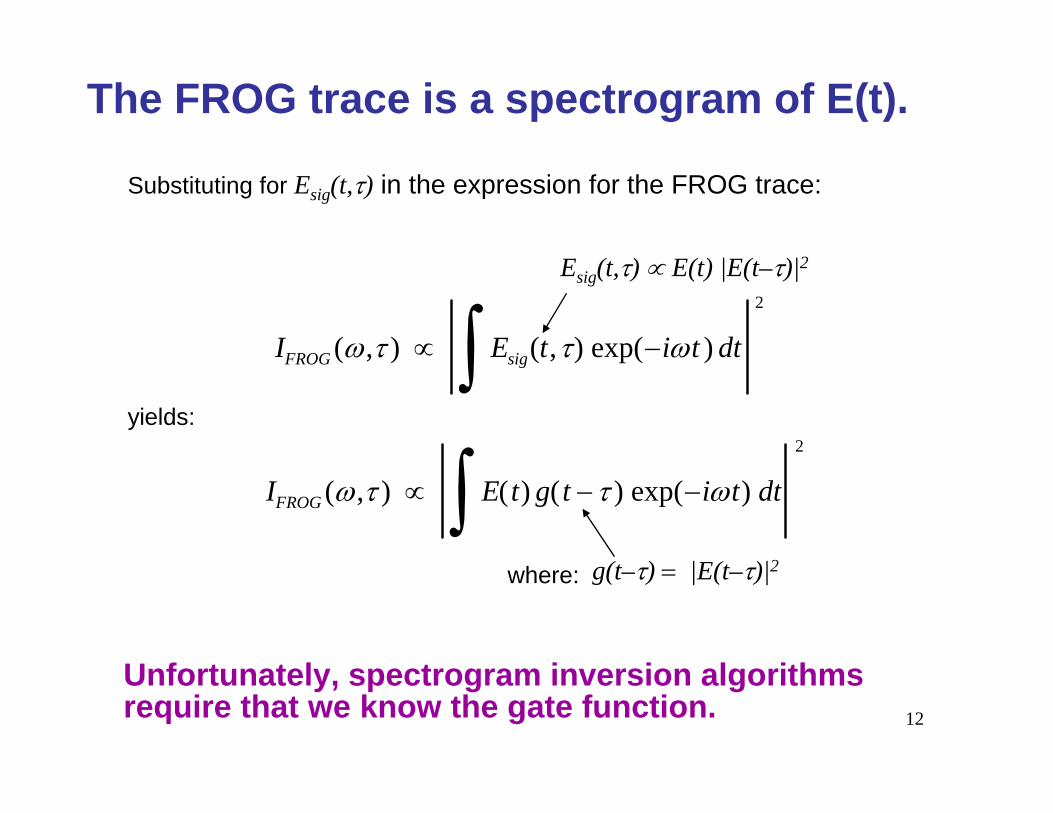
Unfortunately, spectrogram inversion algorithms require that we know the gate function.
Substituting for Esig(t,) in the expression for the FROG trace:
yields:
Esig(t,) E(t) |E(t–)|2
IFROG (, ) Esig(t,) exp(it ) dt2
IFROG (, ) E(t) g(t ) exp(it) dt2
where: g(t–) |E(t–)|2
The FROG trace is a spectrogram of E(t).

13
If Esig(t,), is the 1D Fourier transform with respect to delay of some new signal field, Esig(t,), then:
IFROG (, ) ˆ E sig (t,) exp(i t i) dt d2
So we must invert this integral equation and solve for Esig(t,).
This integral-inversion problem is the 2D phase-retrieval problem,for which the solution exists and is unique.And simple algorithms exist for finding it.
and
The input pulse, E(t), is easily obtained from Esig(t,): E(t) Esig(t,)
Instead, consider FROG as a two-dimensional phase-retrieval problem.
Stark, Image Recovery, Academic Press, 1987.

14
1D Phase Retrieval: Suppose we measure S() and desire E(t), where:
Given S(kx,ky), there is essentially one solution for E(x,y)!!!It turns out that it’s possible to retrieve the 2D spectral phase!
.
Given S(), there are infinitely many solutionsfor E(t). We lack the spectral phase.
2D Phase Retrieval: Suppose we measure S(kx,ky) and desire E(x,y):
These results are related to the Fundamental Theorem of Algebra.
We assume that E(t) and E(x,y) are of finite extent.
S() E (t) exp(it) dt
2
S(kx,ky) E(x, y) exp(ikxx ikyy) dx dy
2
1D vs. 2D Phase Retrieval
Stark, Image Recovery, Academic Press,
1987.

15
The Fundamental Theorem of Algebra states that all polynomials can be factored:
fN-1 zN-1 + fN-2 zN-2 + … + f1 z + f0 = fN-1 (z–z1 ) (z–z2 ) … (z–zN–1)
The Fundamental Theorem of Algebra fails for polynomials of two variables.Only a set of measure zero can be factored.
fN-1,M-1 yN-1 zM-1 + fN-1,M-2 yN-1 zM-2 + … + f0,0 = ?
Why does this matter?
The existence of the 1D Fundamental Theorem of Algebra implies that 1D phase retrieval is impossible.
The non-existence of the 2D Fundamental Theorem of Algebra implies that 2D phase retrieval is possible.
Phase Retrieval and the Fundamental Theorem of Algebra

16
1D Phase Retrieval and the Fundamental Theorem of Algebra
The Fourier transform {F0 , … , FN-1} of a discrete 1D data set, { f0 , …, fN-1}, is:
Fk fm eimk
m 0
N 1
fm zm
m 0
N 1
where z = e–ik
The Fundamental Theorem of Algebra states that any polynomial,fN-1zN-1 + … + f0 , can be factored to yield: fN-1 (z–z1 ) (z–z2 ) … (z–zN–1)
So the magnitude of the Fourier transform of our data can be written:
|Fk| = | fN-1 (z–z1 ) (z–z2 ) … (z–zN–1) | where z = e–ik
Complex conjugation of any factor(s) leaves the magnitude unchanged,but changes the phase, yielding an ambiguity! So 1D phase retrieval isimpossible!
polynomial!

17
2D Phase Retrieval and the Fundamental Theorem of Algebra
The Fourier transform {F0,0 , … , FN-1,N-1} of a discrete 2D data set, { f0.0 , …, fN-1,N-1}, is:
Fk ,q fm, p e imk
p 0
N 1
e ipq
m 0
N 1
fm, p ymz p
p 0
N 1
m 0
N 1
where y = e–ik
and z = e–iq
But we cannot factor polynomials of two variables. So we can only complex conjugate the entire expression (yielding a trivial ambiguity).
Only a set of polynomials of measure zero can be factored.So 2D phase retrieval is possible! And the ambiguities are very sparse.
Polynomial of 2 variables!

18
An iterative Fourier-transform algorithm finds the pulse intensity and phase
Esig(t,) Esig(t,) E(t) |E(t-)|2
FFT with respect to t
Esig(,)Replace the magnitude of Esig(,) with ¦I FROG(,)
Inverse FFT with respect to
Esig(,)
Constraint #1: mathematical form of optical nonlinearity
Constraint #2: FROG trace data
Start with noise
Esig(t,)
E(t)
Esig(t,)
E(t)
˜ E sig (, )˜ E sig(, )
E sig(t, )Find E sig(t, ) E(t) E(t ) 2
E sig(t, ) such that
and is as close as possible to Esig(t,)
DeLong and Trebino, Opt. Lett., 19, 2152 (1994)

19
Generalized Projections
The Solution!
Initial guess for Esig(t,)
A projection maps the current guess for the waveform to the closest point in the constraint set.
Convergence is guaranteed for convex sets, but generally occurs even with nonconvex sets.
Set of waveforms that satisfy nonlinear-optical constraint:
Set of waveforms that satisfy data constraint:
Esig(t,) E(t) |E(t–)|2
IFROG (, ) Esig(t, ) exp(i t) dt2
Esig(t,)

20
We must find E sig(t, ) E(t) E(t ) 2E sig(t, ) such thatand is as close as possible to Esig(t,).
Applying the Signal Field Constraint
The way to do this is to find the field, E(t), that minimizes:
Z Esig(t, ) E( t) E(t ) 2 2dt d
E sig(t, ) E(t) E(t ) 2
Once we find the E(t) that minimizes Z, we write the new signal field as:
This is the new signal field in the iteration.
21

22
Frequency-Resolved Optical Gating (FROG)
FROG involves gating the pulse with a variably delayed replica of the pulse in an instantaneous nonlinear-optical medium, and then spectrally resolving the gated pulse.
Camera
Beam splitter Second-harmonic-
generation crystal
Pulse to be measured
E(t)
E(t-)
IFROG(,) = Esig(t,) e-it dt 2
Esig(t,) E(t) E(t-)Variable delay
Spectrometer
We can use a second-harmonic-generation crystal for the nonlinear-optical medium.
This setup is convenient because it already exists in most excite-probe experiments.Second-harmonic generation (SHG) is the strongest NLO effect.
Second-Harmonic-Generation FROG
Kane and Trebino, JQE, 29, 571 (1993).DeLong and Trebino, JOSA B, 11, 2206 (1994).
23
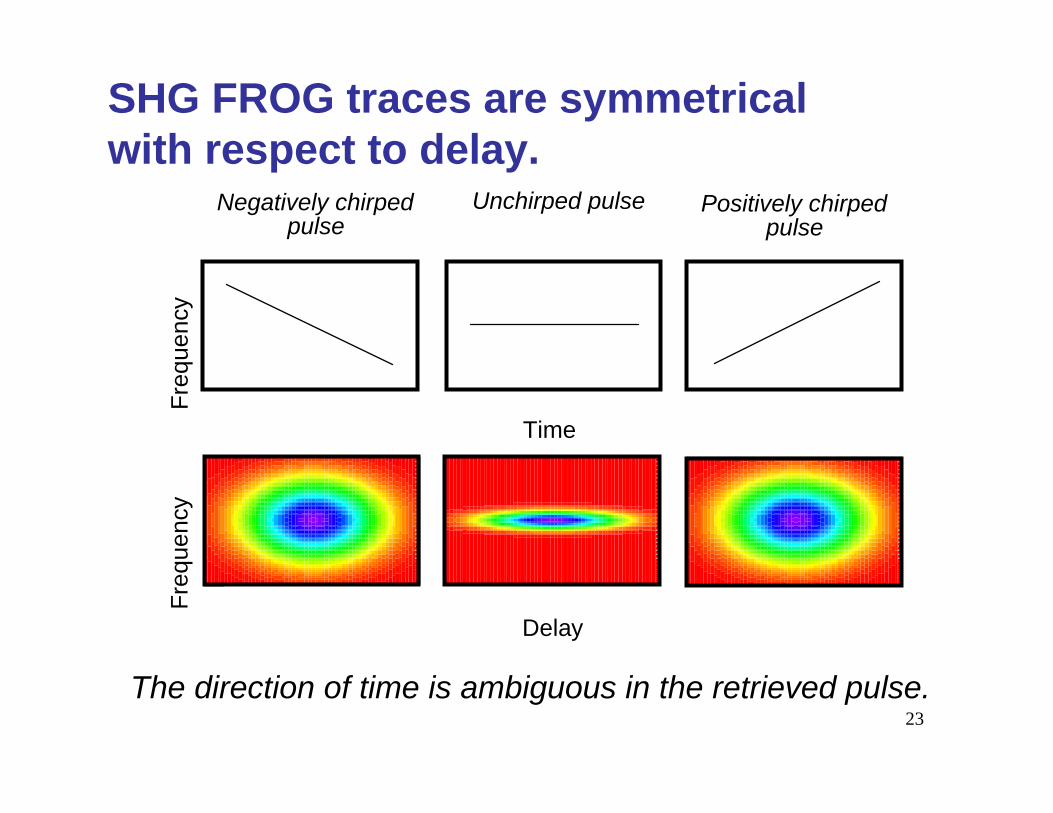
Negatively chirped pulse
Positively chirped pulse
Unchirped pulse
10 20 30 40 50 60
10
20
30
40
50
60
SHG FROG trace--expanded
10 20 30 40 50 60
10
20
30
40
50
60
SHG FROG trace--expanded
10 20 30 40 50 60
10
20
30
40
50
60
SHG FROG trace--expanded
The direction of time is ambiguous in the retrieved pulse.
Freq
uenc
yFr
eque
ncy
Time
Delay
SHG FROG traces are symmetrical with respect to delay.

24
10 20 30 40 50 60
10
20
30
40
50
60
SHG FROG trace--expanded
10 20 30 40 50 60
10
20
30
40
50
60
SHG FROG trace--expanded
10 20 30 40 50 60
10
20
30
40
50
60
SHG FROG trace--expanded
Self-phase-modulated pulse
Double pulseCubic-spectral-phase pulse
SHG FROG traces are symmetrized PG FROG traces.
Freq
uenc
yFr
eque
ncy
Inte
nsity
Time
Delay
SHG FROG traces for complex pulsesFr
eque
ncy
Delay
25
-10000 -5000 0 5000 10000
2555
2560
2565
2570
2575
2580
Time (fs)
Wav
elen
gth
(nm
)
0 500 1000 1500 2000 2500 3000 3500
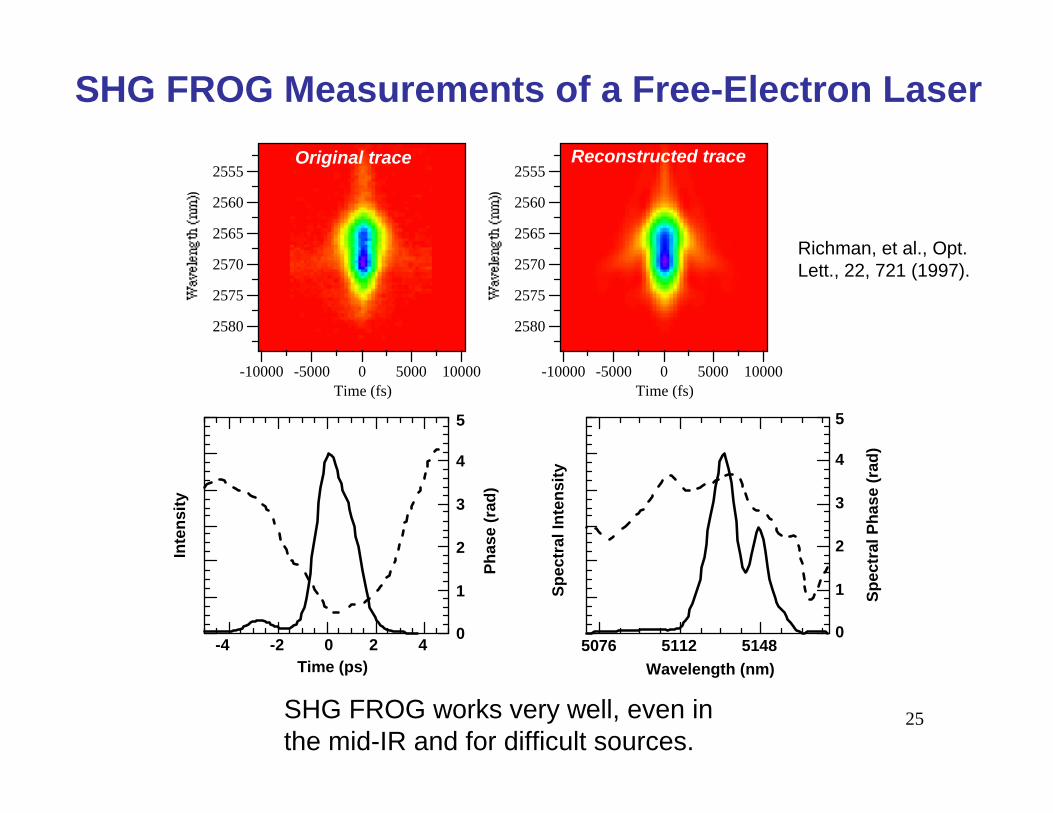
Original trace
-10000 -5000 0 5000 10000
2555
2560
2565
2570
2575
2580
Time (fs)
Wav
elen
gth
(nm
)
0 500 1000 1500 2000 2500 3000 3500
Reconstructed trace
SHG FROG Measurements of a Free-Electron Laser
SHG FROG works very well, even in the mid-IR and for difficult sources.
Richman, et al., Opt. Lett., 22, 721 (1997).
Time (ps) Wavelength (nm)5076 5112 5148-4 -2 0 2 4
Inte
nsity
Spec
tral
Inte
nsity
Phas
e (r
ad)
Spec
tral
Pha
se (r
ad)
0
4
3
2
1
5
0
4
3
2
1
5

26
Sho
rtest
pul
se le
ngth
Year
Shortest pulse vs. year
Plot prepared in 1994, reflecting the state of affairs at that time.

27
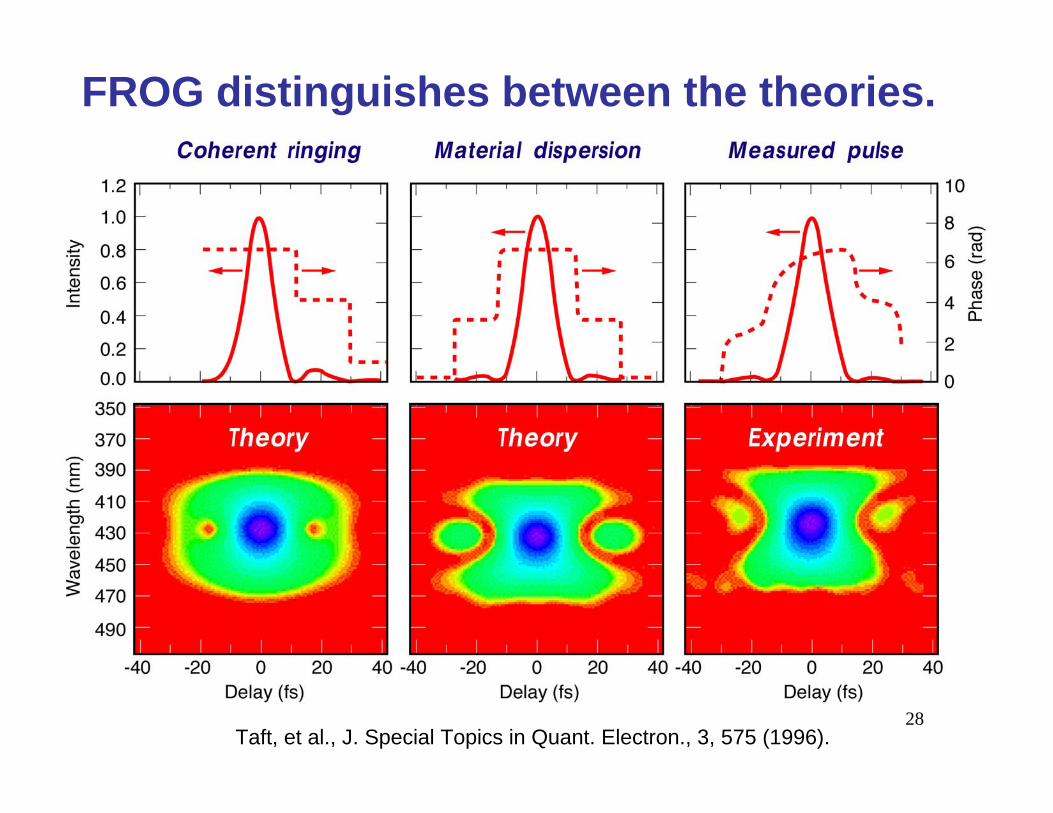
The measured pulse spectrum had two humps,and the measured autocorrelation had wings.
Data courtesy of Kapteynand Murnane, WSU
Despite different predictions for the pulse shape, both theories were consistent with the data.
Two different theories emerged, and both agreed with the data.
From Harvey et. al, Opt. Lett.,v. 19, p. 972 (1994)
From Christov et. al, Opt. Lett.,v. 19, p. 1465 (1994)
28
FROG distinguishes between the theories.
Taft, et al., J. Special Topics in Quant. Electron., 3, 575 (1996).

29
SHG FROG Measurements of a 4.5-fs Pulse
Baltuska, Pshenichnikov, and Weirsma,J. Quant. Electron., 35, 459 (1999).
30
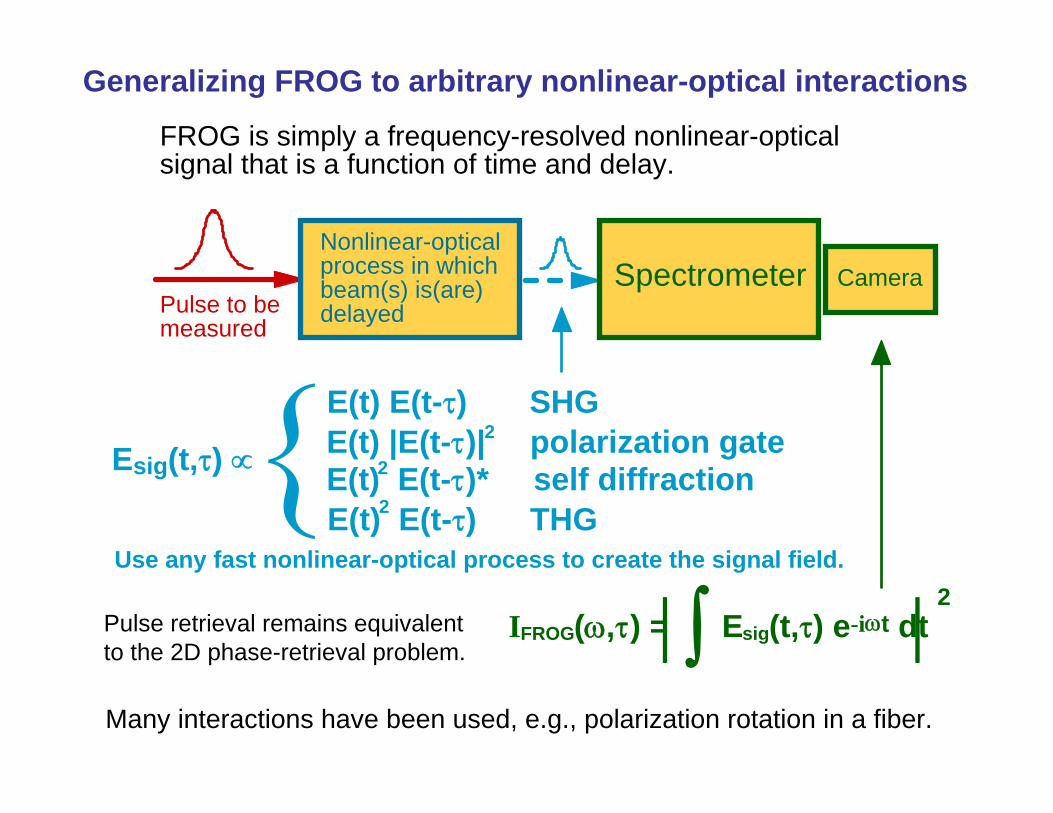
FROG is simply a frequency-resolved nonlinear-optical signal that is a function of time and delay.
IFROG(,) = Esig(t,) e-it dt 2
E(t) |E(t-)| polarization gate E(t) E(t-)* self diffraction E(t) E(t-) THG
E(t) E(t-) SHG
2
2Esig(t,)
2
Use any fast nonlinear-optical process to create the signal field.
Pulse to be measured
Nonlinear-optical process in which beam(s) is(are) delayed
Spectrometer Camera
Obtaining E(t) from the FROG trace is equivalent to the 2D phase-retrieval proble
Pulse retrieval remains equivalentto the 2D phase-retrieval problem.
Many interactions have been used, e.g., polarization rotation in a fiber.
Generalizing FROG to arbitrary nonlinear-optical interactions

31
10 20 30 40 50 60
10
20
30
40
50
60
FROG trace--expanded
10 20 30 40 50 60
10
20
30
40
50
60
SHG FROG trace--expanded
g
Time
Delay
SHG FROG traces are the least intuitive; TG, PG, and SD FROG traces are the most.
Self-phase-modulated pulse
Freq
uenc
yTHG FROG SD FROGSHG FROG
DelayDelay
Freq
uenc
y
PG FROGTG FROG
FROG traces of the same pulse for different geometries
32
TG
PG
SD
THG Pr
SHG Pr
Pr
Pr
WP
Pol
Pol
Pr
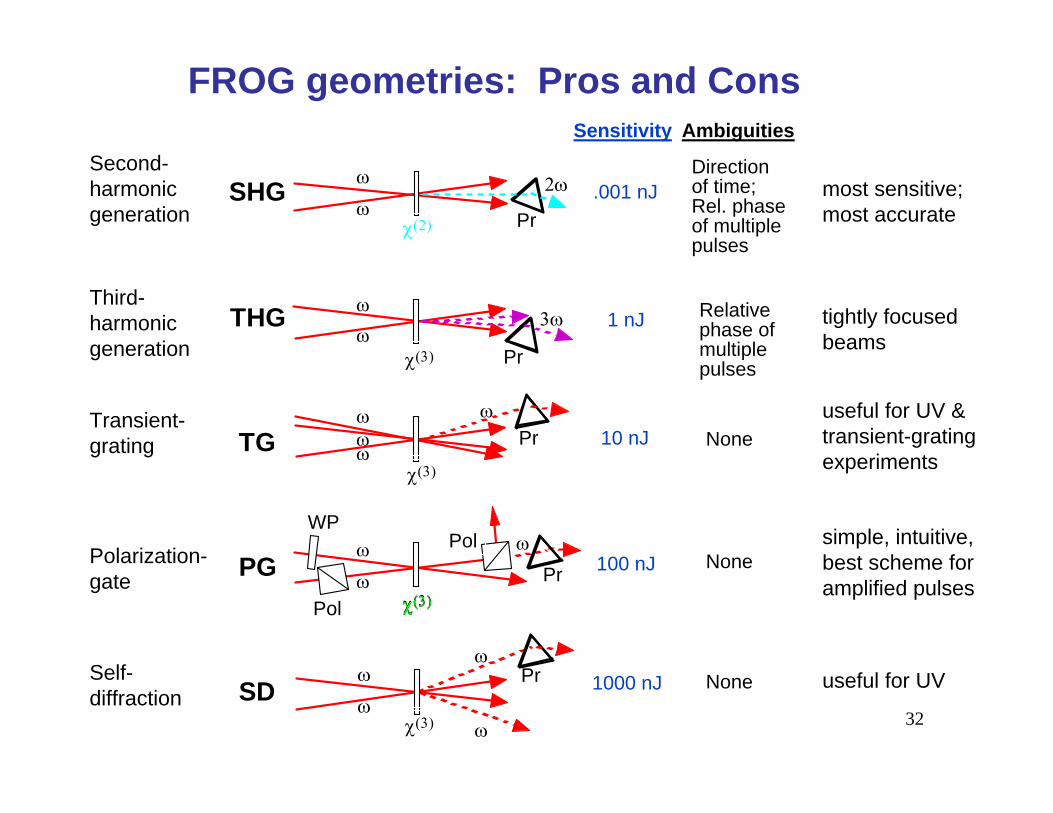
Sensitivity Ambiguities
.001 nJ
1 nJ
100 nJ
1000 nJ
10 nJ
None
None
None
Relative phase of multiple pulses
Direction of time; Rel. phase of multiple pulses
FROG geometries: Pros and Cons
Second-harmonicgeneration
Third-harmonicgeneration
Transient-grating
Polarization-gate
Self-diffraction
most sensitive;most accurate
tightly focusedbeams
useful for UV &transient-gratingexperiments
simple, intuitive,best scheme for amplified pulses
useful for UV
33
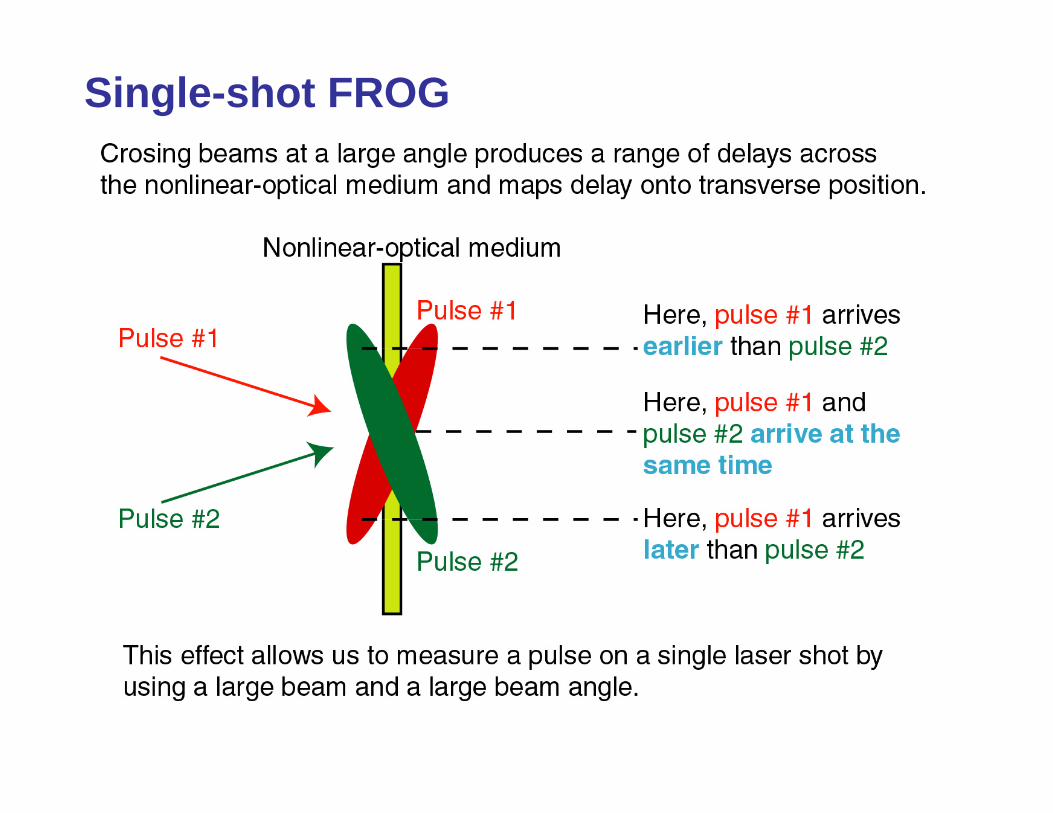
Single-shot FROG
34
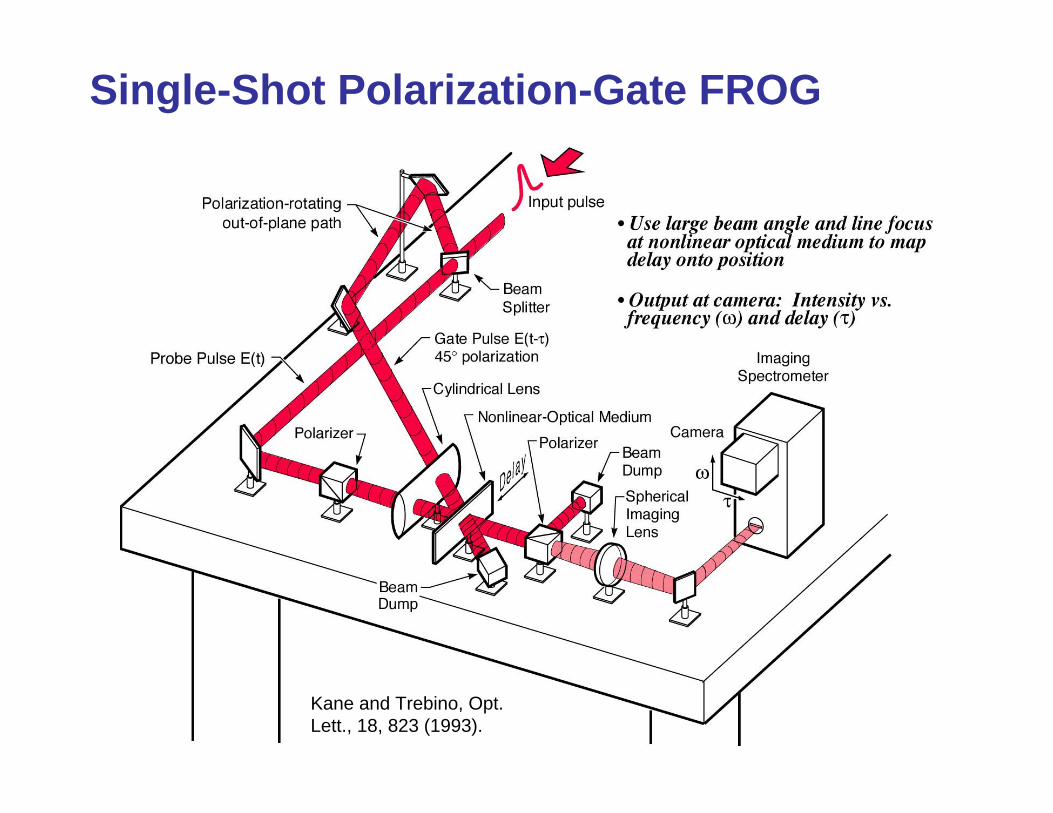
Single-Shot Polarization-Gate FROG
Kane and Trebino, Opt. Lett., 18, 823 (1993).
35
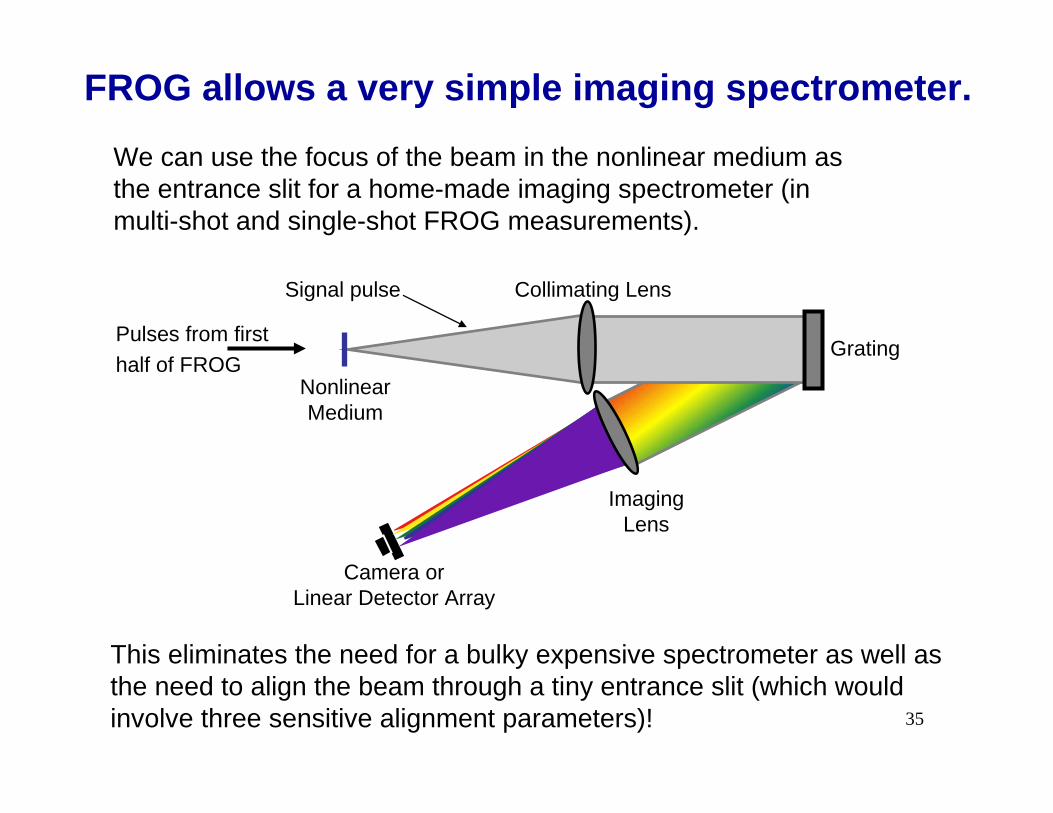
This eliminates the need for a bulky expensive spectrometer as well as the need to align the beam through a tiny entrance slit (which would involve three sensitive alignment parameters)!
We can use the focus of the beam in the nonlinear medium as the entrance slit for a home-made imaging spectrometer (in multi-shot and single-shot FROG measurements).
FROG allows a very simple imaging spectrometer.
Pulses from first half of FROG
Collimating Lens
Camera orLinear Detector Array
Grating
Imaging Lens
Nonlinear Medium
Signal pulse

36
When a known reference pulse is available:Cross-correlation FROG (XFROG)
ESF (t, ) E(t)Eg(t )
The XFROG trace (a spectrogram):
Unknown pulse CameraE(t)
Eg(t–)
SFGcrystal
LensKnown pulse
If a known pulse is available (it need not be shorter), then it can be used to fully measure the unknown pulse. In this case, we perform sum-frequency generation, and measure the spectrum vs. delay.
IXFROG(, ) E( t) Eg (t ) exp(it) dt
2
Spectro-meter
XFROG completely determines the intensity and phase of the unknown pulse, provided that the gate pulse is not too long or too short.If a reasonable known pulse exists, use XFROG, not FROG.
Linden, et al., Opt. Lett., 24, 569 (1999).

37
Example of XFROG measure-ment: microstructure-fiber ultrabroadband continuum.
The continuum has many applications, from medical imaging to metrology.
It’s important to measure it.

38
Ultrabroadband ContinuumUltrabroadband continuum was created by propagating 1-nJ, 800-nm, 30-fs pulses through 16 cm of Lucent microstructure fiber. The 800-nm pulse was measured with FROG,so it made an ideal known gate pulse.
This pulse has a time-bandwidth product of ~ 4000, and is the most complex ultrashort pulse ever measured.
XFROG trace
Retrieved intensity and phase
Kimmel, Lin, Trebino, Ranka, Windeler, and Stentz, CLEO 2000.
39
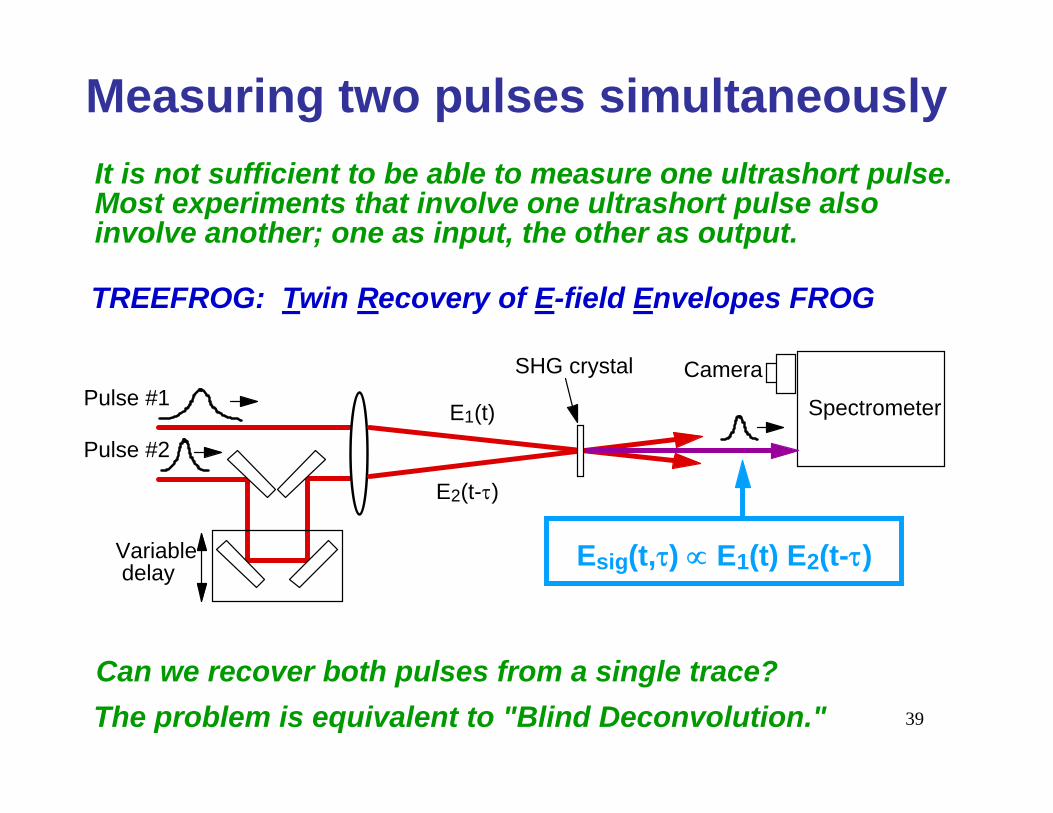
TREEFROG: Twin Recovery of E-field Envelopes FROG
CameraSHG crystalPulse #1
E1(t)
E2(t-)
Variable delay
Esig(t,) E1(t) E2(t-)
Spectrometer
Pulse #2
Can we recover both pulses from a single trace?The problem is equivalent to "Blind Deconvolution."
It is not sufficient to be able to measure one ultrashort pulse. Most experiments that involve one ultrashort pulse also involve another; one as input, the other as output.
Measuring two pulses simultaneously

40
1D vs. 2D Blind Deconvolution
41
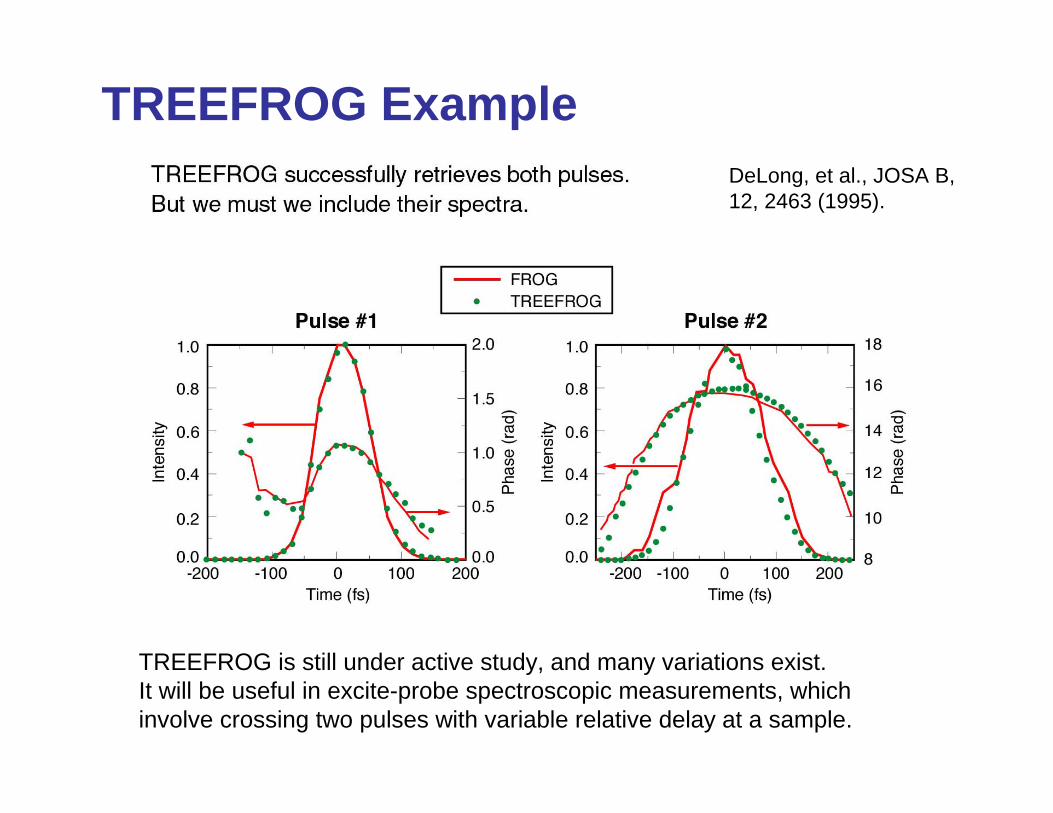
TREEFROG is still under active study, and many variations exist.It will be useful in excite-probe spectroscopic measurements, which involve crossing two pulses with variable relative delay at a sample.
TREEFROG ExampleDeLong, et al., JOSA B, 12, 2463 (1995).
42
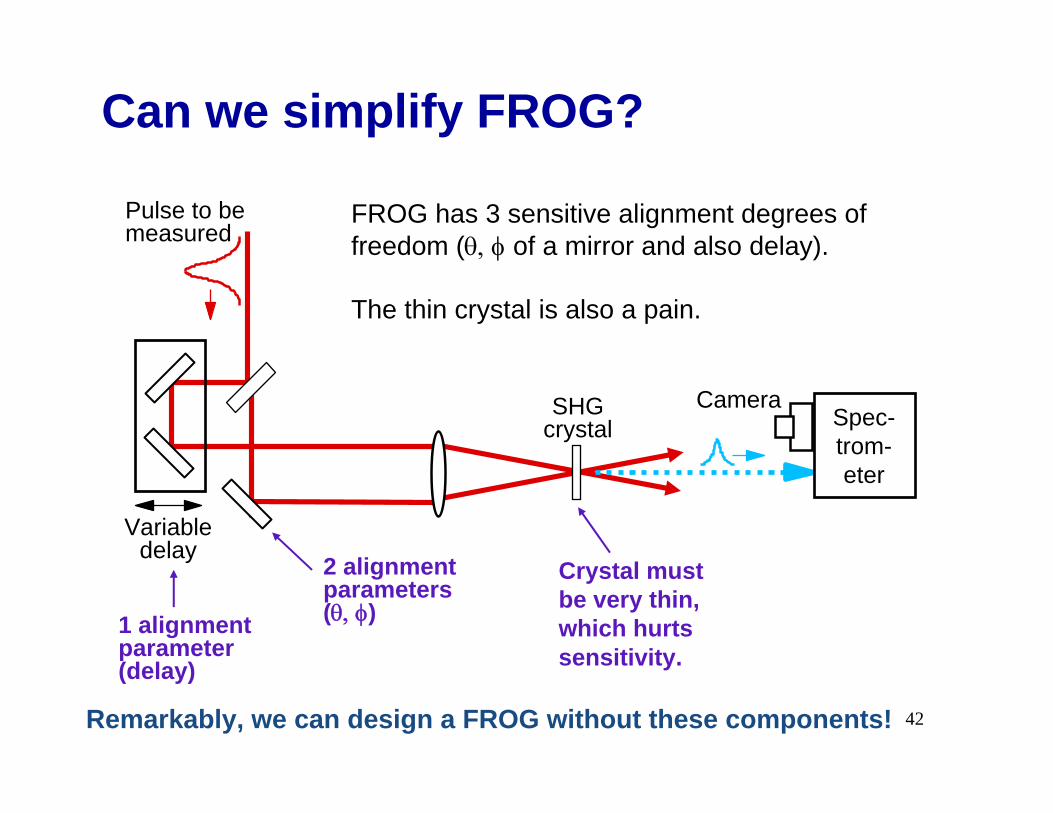
2 alignment parameters ()
Can we simplify FROG?
SHGcrystal
Pulse to be measured
Variable delay
CameraSpec-trom-eter
FROG has 3 sensitive alignment degrees of freedom ( of a mirror and also delay).
The thin crystal is also a pain.
1 alignment parameter (delay)
Crystal must be very thin, which hurts sensitivity.
Remarkably, we can design a FROG without these components!

43
GRating-Eliminated No-nonsense Observationof Ultrafast Incident Laser Light E-fields
(GRENOUILLE)
Patrick O’Shea, Mark Kimmel, Xun Gu and Rick Trebino, Optics Letters, 2001.
2 key innovations: A single optic that replaces the entiredelay line,and a thick SHG crystal that replaces both the thin crystal andspectrometer.
GRENOUILLE
FROG

44
Crossing beams at a large angle maps delay onto transverse position.
Even better, this design is amazingly compact and easy to use, and it never misaligns!
Here, pulse #1 arrivesearlier than pulse #2
Here, the pulsesarrive simultaneously
Here, pulse #1 arriveslater than pulse #2
Fresnel biprism
=(x)
x
Input pulse
Pulse #1
Pulse #2
The Fresnel biprism

45
Very thin crystal creates broad SH spectrum in all directions.Standard autocorrelators and FROGs use such crystals.
VeryThinSHG
crystal
Thin crystal creates narrower SH spectrum ina given direction and so can’t be used
for autocorrelators or FROGs.
ThinSHG
crystal
Thick crystal begins to separate colors.
ThickSHG crystalVery thick crystal acts like
a spectrometer! Why not replace the spectrometer in FROG with a very thick crystal?
Verythick crystal
Suppose white light with a large divergence angle impinges on an SHG crystal. The SH generated depends on the angle. And the angular width of the SH beam created varies inversely with the crystal thickness.
The thick crystal
46
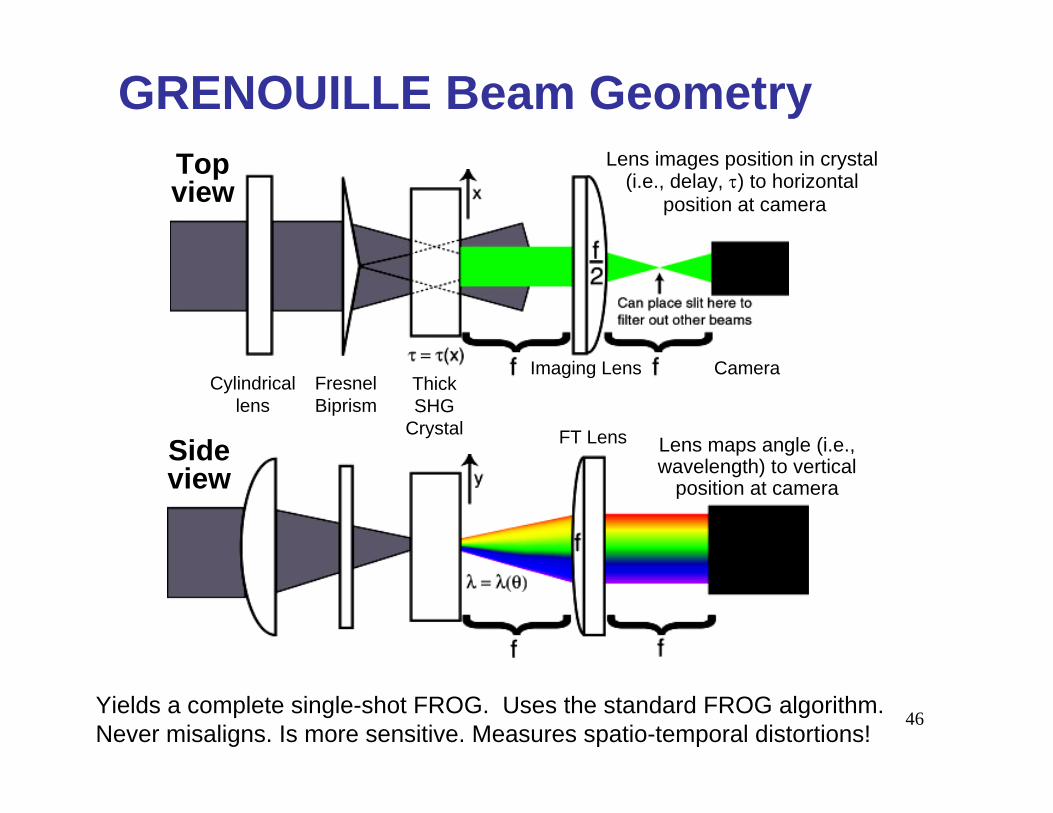
Lens images position in crystal (i.e., delay, ) to horizontal
position at camera
Topview
Sideview
Cylindricallens
FresnelBiprism
ThickSHG
Crystal
Imaging Lens
FT Lens
Yields a complete single-shot FROG. Uses the standard FROG algorithm. Never misaligns. Is more sensitive. Measures spatio-temporal distortions!
Camera
Lens maps angle (i.e.,wavelength) to vertical
position at camera
GRENOUILLE Beam Geometry

47
Testing GRENOUILLE
GRENOUILLE FROG
Mea
sure
dR
etrie
ved
Retrieved pulse in the time and frequency domains
Compare a GRENOUILLE measurement of a pulse with a tried-and-true FROG measurement of the same pulse:

48
Disadvantages of GRENOUILLE
Its low spectral resolution limits its use to pulse lengths between ~ 20 fs and ~ 1 ps.
Like other single-shot techniques, it requires good spatial beam quality.
Improvements on the horizon:
Inclusion of GVD and GVM in FROG code to extend the range of operation to shorter and longer pulses.