Embed Size (px)
Citation preview

BOCI research is available electronically on Bloomberg (BOCR <go>), thomsonreuters.com and at www.bociresearch.com. NB: BUY = ≥+10% compared with the relevant benchmark index over a 6-month period; SELL = ≤-10% compared with the relevant benchmark index over a 6-month period; HOLD = ≤+10% and ≥-10% compared with the relevant benchmark index over a 6-month period; Not Rated (NR)
METALS & MINING Sector Update
Robin TSUI +852 2905 2260
[email protected] Key Highlights of this Report *Detailed commodity price assumptions Page 4 *Central banks' gold holdings as % of foreign reserves Page 7 *China & India’s jewellery demand Page 6 *Industrial demand for gold recovering Page 8 *Gold supply shortfall continuing Page 8 Where are we Different? *Our more bullish view on gold, copper and zinc with long dated prices assumed to stay higher for longer. Metal Price Forecasts 2011E 2012E 2013E 2014E Long-
dated Gold (US$/oz) BOCI 1,420 1,380 1,300 1,200 950 Consensus 1,425 1,355 1,240 1,168 700-950 Copper (US$/tonne) BOCI 9,000 8,700 8,500 8,400 6,000 Consensus 9,058 9,500 9,039 8,189 5,000-
6,000 Zinc (US$/tonne) BOCI 2,364 2,625 2,350 2,425 2,050 Consensus 2,408 2,443 2,800 2,412 1,800-
2,000 Sources: Bloomberg, BOCI Research estimates Key BOCI Events/ Catalysts G-Resources Martabe Gold Mine site visit (IJ) 9-11 Feb CST Mining NDR (HK) 15 Feb Gold Universe Share Target Company Code Rating price price Upside (HK$) (HK$) (%) China Gold Int’l 2099.HK BUY 39.95 56.60 42 G-Resources 1051.HK BUY 0.60 0.71 18 Real Gold Mining 0246.HK BUY 12.70 16.30 28 Zhaojin Mining 1818.HK HOLD 31.55 32.05 2 Zijin Mining - H 2899.HK BUY 6.70 8.40 25 Zijin Mining - A (Rmb)
601899.SS BUY 7.22 10.08 49
Sources: Company data, Bloomberg, BOCI Research estimates Closing prices as of 14 January 2011 All figures subject to rounding
China/Hong Kong Gold Sector Entering a golden period In 2011, gold is set to ride through the year with higher price volatility, as investors digest global economic data to determine where the global economy is heading. Although gold prices have had some correction lately with the increase in investors’ risk appetite over the optimism of the global economic outlook, we do not see a forthcoming major price correction. After all, more than 60% of global gold consumption is driven by jewellery consumption and industrial sectors, which are positively correlated with economic growth. We upgrade Zijin Mining to BUY as its diversified production base and higher metal prices should translate to a strong year ahead. The stock underperformed against the HSI and its peers in 2010 and we think its current price offers value. With the increase in price volatility, we also prefer the smaller-cap gold producers which can offer larger production and earnings growth upsides, coupled with attractive valuations. We maintain our BUY on Real Gold, China Gold International Resources and G-Resources and downgrade Zhaojin to HOLD on valuation grounds.
Key Factors for Rating Global economic outlook remains uncertain.
Any potential inflationary pressure should have a positive effect on gold prices.
Strong global jewellery demand led by India and China, which are registering strong economic growth.
Key Risks Increase in gold price volatility.
Global economic recovery leading to hot money flowing from commodities to equities.
Buys Zijin Mining, Real Gold Mining, China Gold International
Resources, and G‐Resources.
Figure 1. Gold Price Assumptions 2011E 2012E 2013E 2014E Gold (US/oz) - Old 1,245 1,250 1,200 1,050 Gold (US/oz) - New 1,420 1,380 1,300 1,200 Change % 14 10 8 14 Street 1,425 1,355 1,240 1,168 BOCI vs Street (%) 0 2 5 3 Source: BOCI Research estimates
OVERWEIGHT
1177 JJaannuuaarryy 22001111
17 January 2011 China/Hong Kong Gold Sector 2
Table of Contents
BOCI VIEW FOR 2011 ..........................................3
KEY INDUSTRY THEMES TO LOOK AHEAD .................6
G-RESOURCES......................................................................10 REAL GOLD MINING ...............................................................12 CHINA GOLD INT’L RESOURCES..................................................14 ZHAOJIN MINING....................................................................16 ZIJIN MINING .........................................................................18
LISTED COMPANIES IN THIS REPORT ......................22

17 January 2011 China/Hong Kong Gold Sector 3 THIS DOCUMENT MAY NOT BE DISTRIBUTED IN OR INTO THE PRC.
BBOOCCII VVIIEEWW FFOORR 22001111
In 2010, gold was at the right place at the right time ‐ After registering a 30% return last year, gold had an exceptional year, beating historical highs for numerous times. Gold was at the right place at the right time. Mounting sovereign debts in the euro zone, sluggish unemployment outlook in the US, muted economic growth (with the exception of Asian markets), and deprecating currencies had investors fleeing to gold as a safe haven and currency hedge. 2011 should be no repeat of 2010. Moreover, demand will likely come from a different angle. Global economic data in 2011, in particular from the US, are expected to read better than 2010. Investors’ risk appetite should increase, and hot money move from commodities to equities. In 2011, we expect gold price volatility to increase as investors continuously digest global economic data to determine where the global economy is heading. From the latest statistics available from the World Gold Council (WGC), investment demand now represents nearly 37% of global gold demand compared to just 16% in 2005. The easy access to gold investment vehicles such as ETFs contributed to the increase in price volatility.
Demand to come from a different angle ‐ Investors get increasingly nervous whether 2011 will be a year of correction for gold price after the 30% gain last year. Factors such as the improving global economic conditions in the West, appreciating US dollar and increasing investors’ risk appetite would weaken gold’s role as safe haven as well as currency hedge, leading to a decrease in investment demand. In 2011, gold demand is likely to approach from a different angle to the previous. We expect an increase in consumption from the jewellery and industrial sectors, backed by the growth in the East. Investment demand should stay robust as investors view gold as an investment asset and gold has its inflation hedge function should there be any sign of inflationary pressure. After all, more than 60% of global gold consumption is driven by jewellery consumption and industrial sectors, which are positively correlated with economic growth. We do not think there will be a major price correction.
Gold’s uniqueness to support price – Gold can be used for multiple purposes: making jewellery, investment, manufacturing of goods in the industrial and dental sectors, currency and inflation hedge, safe haven as well as store of value. No other commodities can offer this diverse range of usage. This is what makes gold unique. Since 2001, gold prices have gained an average of 18% YoY, which means gold can find support during the times of boom and bust.
We expect an increase in price volatility in 2011
Strong demand from the jewellery and industrial sectors
Gold has such a diverse range of usage that we do not think it will warrant a huge price correction
17 January 2011 China/Hong Kong Gold Sector 4 THIS DOCUMENT MAY NOT BE DISTRIBUTED IN OR INTO THE PRC.
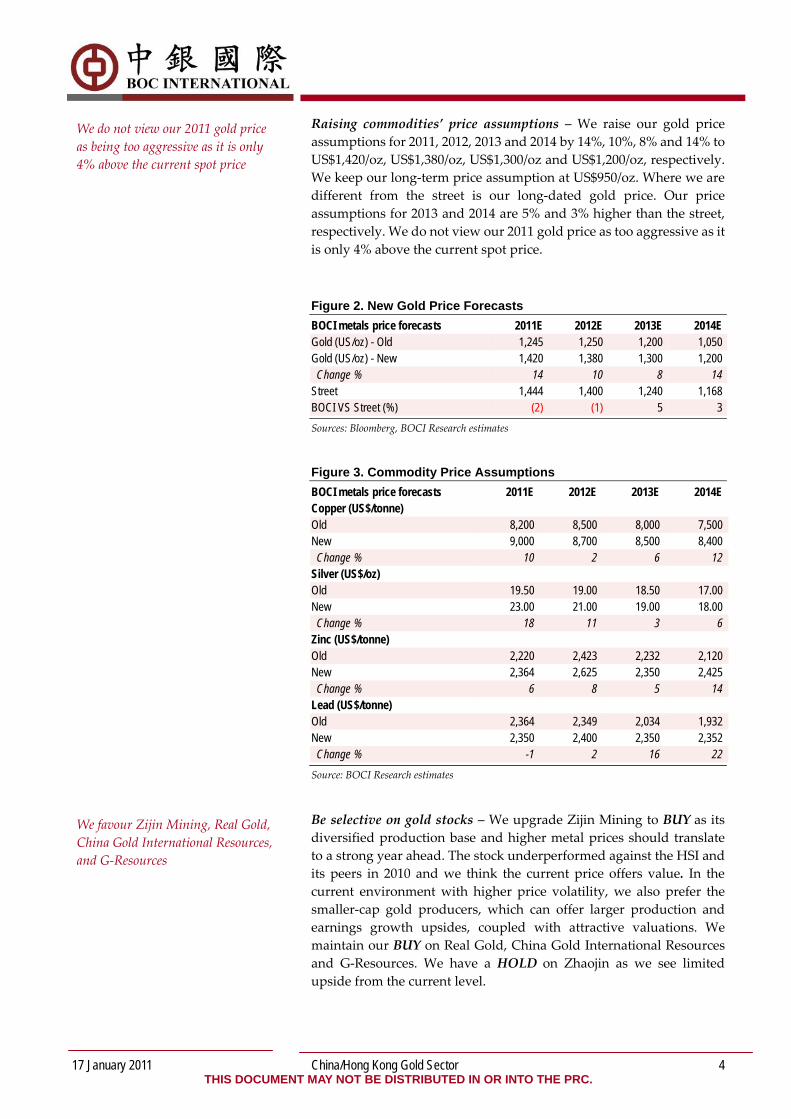
Raising commodities’ price assumptions – We raise our gold price assumptions for 2011, 2012, 2013 and 2014 by 14%, 10%, 8% and 14% to US$1,420/oz, US$1,380/oz, US$1,300/oz and US$1,200/oz, respectively. We keep our long‐term price assumption at US$950/oz. Where we are different from the street is our long‐dated gold price. Our price assumptions for 2013 and 2014 are 5% and 3% higher than the street, respectively. We do not view our 2011 gold price as too aggressive as it is only 4% above the current spot price.
Figure 2. New Gold Price Forecasts BOCI metals price forecasts 2011E 2012E 2013E 2014E Gold (US/oz) - Old 1,245 1,250 1,200 1,050 Gold (US/oz) - New 1,420 1,380 1,300 1,200 Change % 14 10 8 14 Street 1,444 1,400 1,240 1,168 BOCI VS Street (%) (2) (1) 5 3 Sources: Bloomberg, BOCI Research estimates
Figure 3. Commodity Price Assumptions BOCI metals price forecasts 2011E 2012E 2013E 2014E Copper (US$/tonne) Old 8,200 8,500 8,000 7,500 New 9,000 8,700 8,500 8,400 Change % 10 2 6 12 Silver (US$/oz) Old 19.50 19.00 18.50 17.00 New 23.00 21.00 19.00 18.00 Change % 18 11 3 6 Zinc (US$/tonne) Old 2,220 2,423 2,232 2,120 New 2,364 2,625 2,350 2,425 Change % 6 8 5 14 Lead (US$/tonne) Old 2,364 2,349 2,034 1,932 New 2,350 2,400 2,350 2,352 Change % -1 2 16 22 Source: BOCI Research estimates
Be selective on gold stocks – We upgrade Zijin Mining to BUY as its diversified production base and higher metal prices should translate to a strong year ahead. The stock underperformed against the HSI and its peers in 2010 and we think the current price offers value. In the current environment with higher price volatility, we also prefer the smaller‐cap gold producers, which can offer larger production and earnings growth upsides, coupled with attractive valuations. We maintain our BUY on Real Gold, China Gold International Resources and G‐Resources. We have a HOLD on Zhaojin as we see limited upside from the current level.
We do not view our 2011 gold price as being too aggressive as it is only 4% above the current spot price
We favour Zijin Mining, Real Gold, China Gold International Resources, and G‐Resources
17 January 2011 China/Hong Kong Gold Sector 5 THIS DOCUMENT MAY NOT BE DISTRIBUTED IN OR INTO THE PRC.
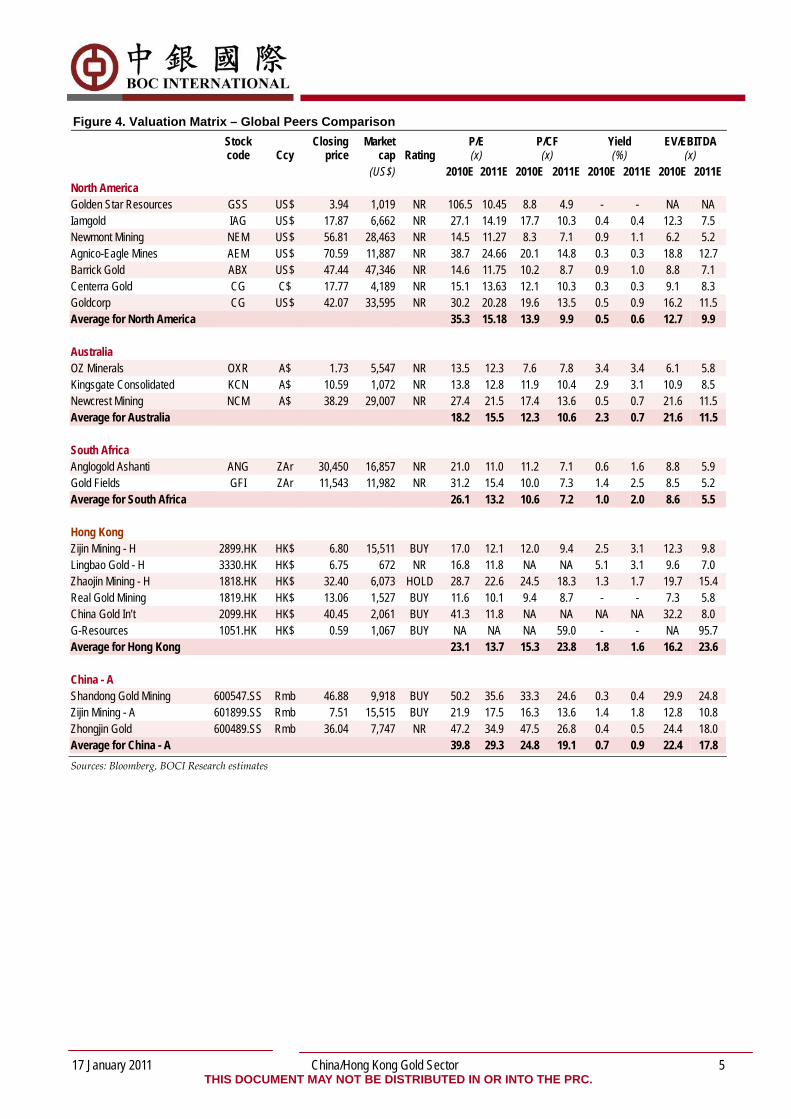
Figure 4. Valuation Matrix – Global Peers Comparison
Stock code Ccy
Closing price
Market cap Rating
P/E (x)
P/CF (x)
Yield (%)
EV/EBITDA (x)
(US$) 2010E 2011E 2010E 2011E 2010E 2011E 2010E 2011E North America Golden Star Resources GSS US$ 3.94 1,019 NR 106.5 10.45 8.8 4.9 - - NA NA Iamgold IAG US$ 17.87 6,662 NR 27.1 14.19 17.7 10.3 0.4 0.4 12.3 7.5 Newmont Mining NEM US$ 56.81 28,463 NR 14.5 11.27 8.3 7.1 0.9 1.1 6.2 5.2 Agnico-Eagle Mines AEM US$ 70.59 11,887 NR 38.7 24.66 20.1 14.8 0.3 0.3 18.8 12.7 Barrick Gold ABX US$ 47.44 47,346 NR 14.6 11.75 10.2 8.7 0.9 1.0 8.8 7.1 Centerra Gold CG C$ 17.77 4,189 NR 15.1 13.63 12.1 10.3 0.3 0.3 9.1 8.3 Goldcorp CG US$ 42.07 33,595 NR 30.2 20.28 19.6 13.5 0.5 0.9 16.2 11.5 Average for North America 35.3 15.18 13.9 9.9 0.5 0.6 12.7 9.9 Australia OZ Minerals OXR A$ 1.73 5,547 NR 13.5 12.3 7.6 7.8 3.4 3.4 6.1 5.8 Kingsgate Consolidated KCN A$ 10.59 1,072 NR 13.8 12.8 11.9 10.4 2.9 3.1 10.9 8.5 Newcrest Mining NCM A$ 38.29 29,007 NR 27.4 21.5 17.4 13.6 0.5 0.7 21.6 11.5 Average for Australia 18.2 15.5 12.3 10.6 2.3 0.7 21.6 11.5 South Africa Anglogold Ashanti ANG ZAr 30,450 16,857 NR 21.0 11.0 11.2 7.1 0.6 1.6 8.8 5.9 Gold Fields GFI ZAr 11,543 11,982 NR 31.2 15.4 10.0 7.3 1.4 2.5 8.5 5.2 Average for South Africa 26.1 13.2 10.6 7.2 1.0 2.0 8.6 5.5 Hong Kong Zijin Mining - H 2899.HK HK$ 6.80 15,511 BUY 17.0 12.1 12.0 9.4 2.5 3.1 12.3 9.8 Lingbao Gold - H 3330.HK HK$ 6.75 672 NR 16.8 11.8 NA NA 5.1 3.1 9.6 7.0 Zhaojin Mining - H 1818.HK HK$ 32.40 6,073 HOLD 28.7 22.6 24.5 18.3 1.3 1.7 19.7 15.4 Real Gold Mining 1819.HK HK$ 13.06 1,527 BUY 11.6 10.1 9.4 8.7 - - 7.3 5.8 China Gold In’t 2099.HK HK$ 40.45 2,061 BUY 41.3 11.8 NA NA NA NA 32.2 8.0 G-Resources 1051.HK HK$ 0.59 1,067 BUY NA NA NA 59.0 - - NA 95.7 Average for Hong Kong 23.1 13.7 15.3 23.8 1.8 1.6 16.2 23.6 China - A Shandong Gold Mining 600547.SS Rmb 46.88 9,918 BUY 50.2 35.6 33.3 24.6 0.3 0.4 29.9 24.8 Zijin Mining - A 601899.SS Rmb 7.51 15,515 BUY 21.9 17.5 16.3 13.6 1.4 1.8 12.8 10.8 Zhongjin Gold 600489.SS Rmb 36.04 7,747 NR 47.2 34.9 47.5 26.8 0.4 0.5 24.4 18.0 Average for China - A 39.8 29.3 24.8 19.1 0.7 0.9 22.4 17.8 Sources: Bloomberg, BOCI Research estimates

17 January 2011 China/Hong Kong Gold Sector 6 THIS DOCUMENT MAY NOT BE DISTRIBUTED IN OR INTO THE PRC.
Figure 5. Global Gold Demand Breakdown: 9M10
Jewellery52%
Investment37%
Industrial11%
Source: WGC Figure 6. China and India’s Dominance in Gold Jewellery Consumption
India32%
Greater China21%
Rest of the World47%
Source: WGC Figure 7. India’s Jewellery Demand Trend
0
100
200
300
400
500
600
700
2005 2006 2007 2008 2009 2010E0
2
4
6
8
10
12
India (LHS) Real GDP YoY% (RHS)
tonnes (% )
*2010E figures are based on annualising the 9‐month actual figures from WGC’s data. Sources: WGC, BOCI Research estimates Figure 8. China’s Jewellery Demand Trend
050
100150200250300350400450
2005 2006 2007 2008 2009 2010E0
2
4
6
8
10
12
China (LHS) Real GDP YoY% (RHS)
tonnes (% )
*2010 figures are based on annualising the 9‐month actual figures from WGC Sources: WGC, BOCI Research estimates
KKEEYY IINNDDUUSSTTRRYY TTHHEEMMEESS TTOO LLOOOOKK
AAHHEEAADD
There were several key themes that drove global gold demand and prices in 2010: robust demand for jewellery from Asian markets; increase in investment demand over economic concerns in the US and Europe; potential inflation fears; and recovery in the use of gold by the industrial sector. These themes are likely to continue and we will see gold prices supported by these factors in 2011. Also, central banks are likely to hold and remain a net buyer of gold as they continue to view gold as a ‘store of value’ and as a means to divert investments from their US dollar foreign reserves. Below is a list of key industry themes that we should pay attention to in 2011:
1. China and India’s economic growth: China and India are currently the largest buyers of gold jewellery and their respective economic growth and consumer confidence will play an essential role in supporting global gold prices. According to the latest data available from the WGC, for 9M10, jewellery demand represented 52% of total global gold demand. Within the 52%, consumption from India and Greater China contributed 32% and 21%, respectively. Economic growth is linked to consumer spendings, which include the purchase of discretionary items such as gold. Our China economic team forecasts the Chinese economy will grow at 8.6% in 2011, and according to IMF, India’s growth will come in at 8.4%. We expect the Middle East countries and the US, which are traditionally two big buyers of gold, to pick up their jewellery consumptions as their respective economies heat up. For jewellery consumption, we see limited downside.
2. US and European economic conditions: Gold investment demand grew to 37% of total demand in 9M10 as weak economic conditions in the US and Europe had investors fleeing to gold as safe haven. Aggressive monetary expansions by central banks such as the QE2 in the second half of 2010 also generated excessive hot money flowing into commodities. Both regions’ economic conditions should improve in 2011, leading to the re‐allocation of funds from commodities to equities but we do not think it would warrant a huge correction in gold prices as investors still see gold as an investment asset. Negative news coming from the US unemployment report and European central bank’s balance sheet will continue to put pressure on the dollar and euro, but the magnitude should be quite different from the previous year as both are in an economic recovery phase. Gold price volatility should increase amid an uncertain environment but we are confident in our gold price assumption of US$1,420/oz this year. Almost all of the clients we have talked to are bullish on gold in the near term.

17 January 2011 China/Hong Kong Gold Sector 7 THIS DOCUMENT MAY NOT BE DISTRIBUTED IN OR INTO THE PRC.
Figure 9. Central Banks Becoming Net Buyers Since 2Q09
-100
0
100
200
300
400
500
600
700
2005 2006 2007 2008 1Q09 2Q09 3Q09 4Q09 1Q10 2Q10 3Q10
(tonnes)
Source: WGC
Figure 10. Global Gold Holdings
01,0002,0003,0004,0005,0006,0007,0008,0009,000
USA
Germ
any
IMF
Italy
Fran
ce
China
Switz
erlan
d
Russ
ia
Japa
n
Neth
erlan
ds
(tonnes)
Source: Bloomberg
3. Central banks are net buyers of gold: When you see the central banks become net buyers of gold, it re‐assures us that even the government officials are upbeat on gold prices. Since 2Q09, central banks have turned from net sellers to net buyers of gold. Why? Central banks are diversifying their foreign exchange reserves, which means they are losing confidence in the US dollar. Flight to quality, inflation hedge to offset inflationary pressure, and expectation of higher gold prices are also incentives for central banks to hold onto gold. According to WGC, the central banks of Russia, the Philippines, Thailand and Bangladesh were the latest banks to add their gold holdings. Another question we seek to answer is whether China’s central bank would increase its current gold holdings of 1,054 tonnes. The latest official gold holdings show that China’s holdings were 1.7% of their total foreign reserve, less than most of the developed and emerging markets.
Figure 11. Central Banks’ Gold Holdings as % of Foreign Reserves Countries Tonnes % of total foreign reserve USA 8,133.50 73.90 Germany 3,401.80 70.30 IMF 2,846.70 0 Italy 2,451.80 68.60 France 2,435.40 67.20 China 1,054.10 1.70 Switzerland 1,040.10 16.40 Russia 775.2 6.70 Japan 765.2 3.00 Netherlands 612.5 57.50 Source: Bloomberg
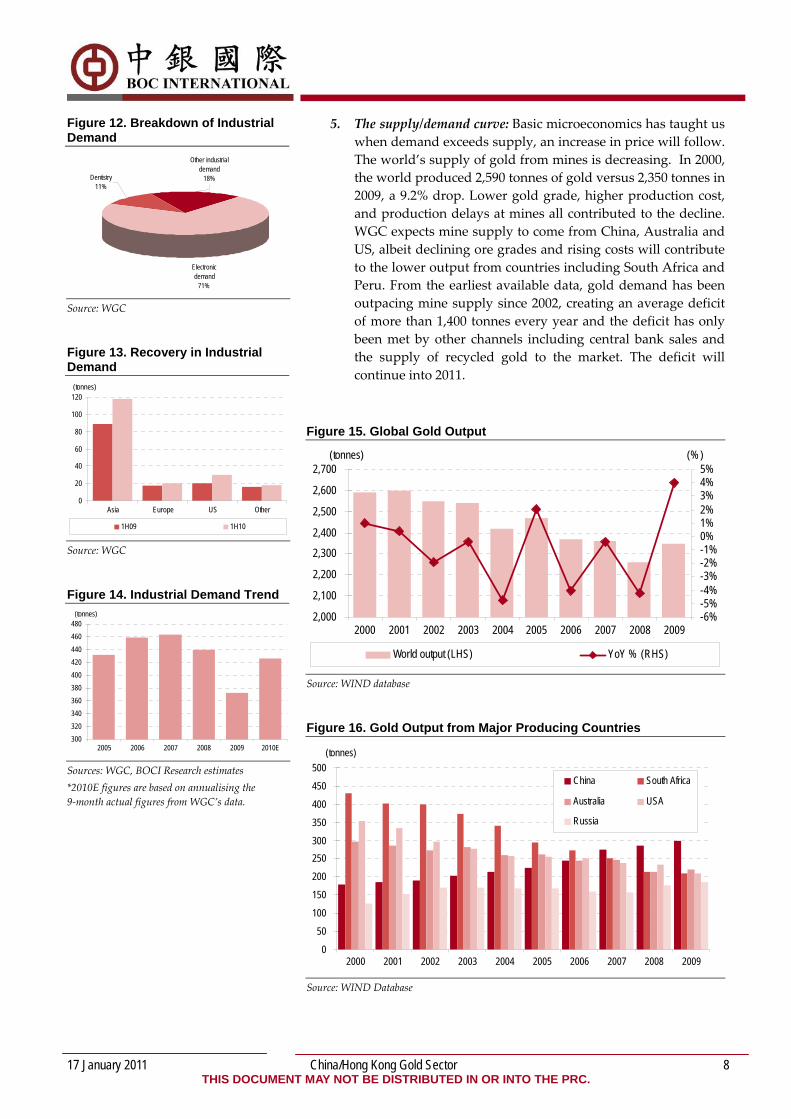
4. Economic growth to improve industrial demand – According to the latest data available from the WGC, gold consumption from the industrial sectors represents 11% of global gold demand and the WGC expects the economic growth in key markets such as China and India to drive demand for consumer electronics. Gold’s properties of conductivity, malleability and resistance to corrosion are viewed as the material of choice for industrial uses. Gold consumption from the industrial sector has returned to long‐term trend levels backed by the resilience of the Asian markets. Again, like jewellery demand, the demand from Chinese and Indian markets will remain the key in 2011.
17 January 2011 China/Hong Kong Gold Sector 8 THIS DOCUMENT MAY NOT BE DISTRIBUTED IN OR INTO THE PRC.
Figure 12. Breakdown of Industrial Demand
Other industrial demand
18%Dentistry 11%
Electronic demand
71% Source: WGC
Figure 13. Recovery in Industrial Demand
0
20
40
60
80
100
120
Asia Europe US Other
1H09 1H10
(tonnes)
Source: WGC
Figure 14. Industrial Demand Trend
300320340360380400420440460480
2005 2006 2007 2008 2009 2010E
(tonnes)
Sources: WGC, BOCI Research estimates *2010E figures are based on annualising the 9‐month actual figures from WGC’s data.
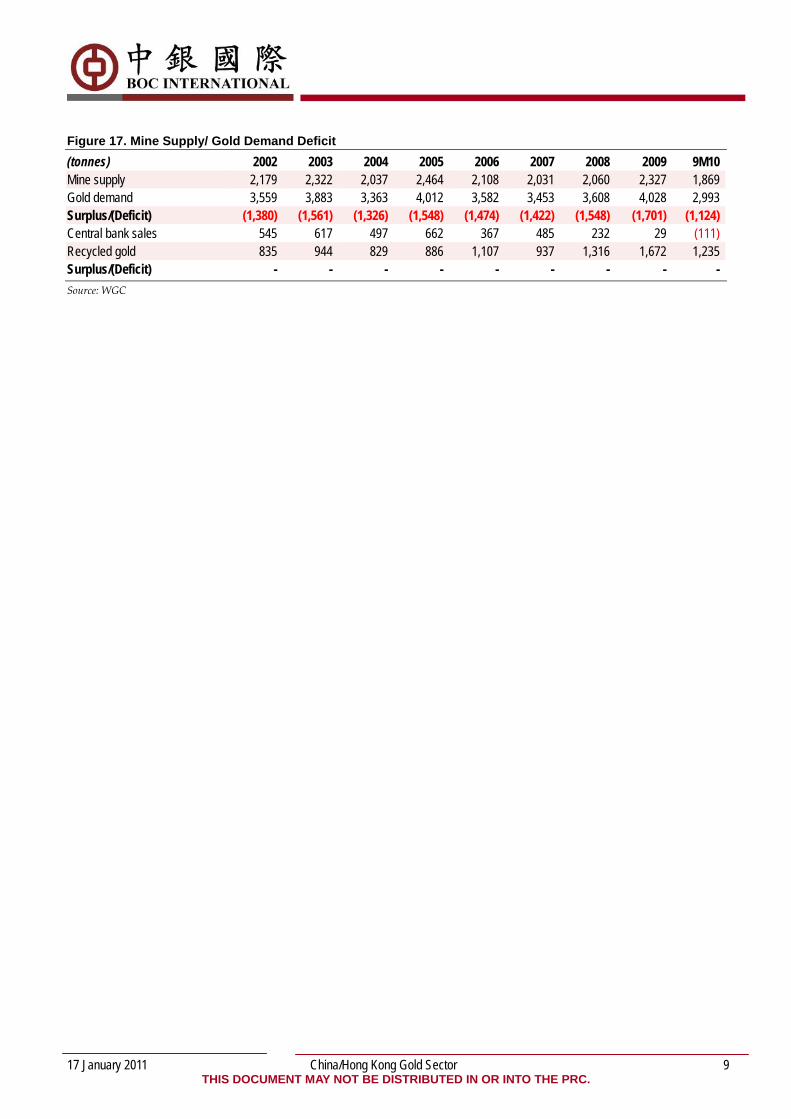
5. The supply/demand curve: Basic microeconomics has taught us when demand exceeds supply, an increase in price will follow. The world’s supply of gold from mines is decreasing. In 2000, the world produced 2,590 tonnes of gold versus 2,350 tonnes in 2009, a 9.2% drop. Lower gold grade, higher production cost, and production delays at mines all contributed to the decline. WGC expects mine supply to come from China, Australia and US, albeit declining ore grades and rising costs will contribute to the lower output from countries including South Africa and Peru. From the earliest available data, gold demand has been outpacing mine supply since 2002, creating an average deficit of more than 1,400 tonnes every year and the deficit has only been met by other channels including central bank sales and the supply of recycled gold to the market. The deficit will continue into 2011.
Figure 15. Global Gold Output
2,000
2,100
2,200
2,300
2,400
2,500
2,600
2,700
2000 2001 2002 2003 2004 2005 2006 2007 2008 2009-6%-5%-4%-3%-2%-1%0%1%2%3%4%5%
World output (LHS) YoY % (RHS)
(tonnes) (% )
Source: WIND database
Figure 16. Gold Output from Major Producing Countries
0
50
100
150
200
250300
350
400
450
500
2000 2001 2002 2003 2004 2005 2006 2007 2008 2009
China South Africa
Australia USA
Russia
(tonnes)
Source: WIND Database
17 January 2011 China/Hong Kong Gold Sector 9 THIS DOCUMENT MAY NOT BE DISTRIBUTED IN OR INTO THE PRC.
Figure 17. Mine Supply/ Gold Demand Deficit (tonnes) 2002 2003 2004 2005 2006 2007 2008 2009 9M10 Mine supply 2,179 2,322 2,037 2,464 2,108 2,031 2,060 2,327 1,869 Gold demand 3,559 3,883 3,363 4,012 3,582 3,453 3,608 4,028 2,993 Surplus/(Deficit) (1,380) (1,561) (1,326) (1,548) (1,474) (1,422) (1,548) (1,701) (1,124) Central bank sales 545 617 497 662 367 485 232 29 (111) Recycled gold 835 944 829 886 1,107 937 1,316 1,672 1,235 Surplus/(Deficit) - - - - - - - - - Source: WGC
17 January 2011 China/Hong Kong Gold Sector 10 THIS DOCUMENT MAY NOT BE DISTRIBUTED IN OR INTO THE PRC.
METALS & MINING — Precious Metals Target Price Change
Robin TSUI +852 2905 2260
Share Price vs Index
0.300.350.400.450.500.550.600.65
14/01
/10
14/02
/10
14/03
/10
14/04
/10
14/05
/10
14/06
/10
14/07
/10
14/08
/10
14/09
/10
14/10
/10
14/11
/10
14/12
/10
14/01
/11
0
50
100
150
200
250
G-Resources Group Ltd HSI
Turnover (HK$ m)HK$
Sources: Bloomberg, BOCI Research
Share Price Performance (%) YTD 1M 3M 12M Absolute (1.6) 1.7 17.6 17.6 Relative to HSI (6.5) (4.7) 16.0 6.1 Sources: Bloomberg, BOCI Research
Key Data Total issued shares (m) 14,067 Free float (%) 82 Free float mkt. cap. (HK$ m) 6,786 3M avg. daily turnover (HK$ m) 28 Net debt/equity (%) (2010 E) Net cash Major shareholders (%)
China Sci-Tech 9 Sources: Company data, Bloomberg, BOCI Research estimates
G-Resources Production not far off
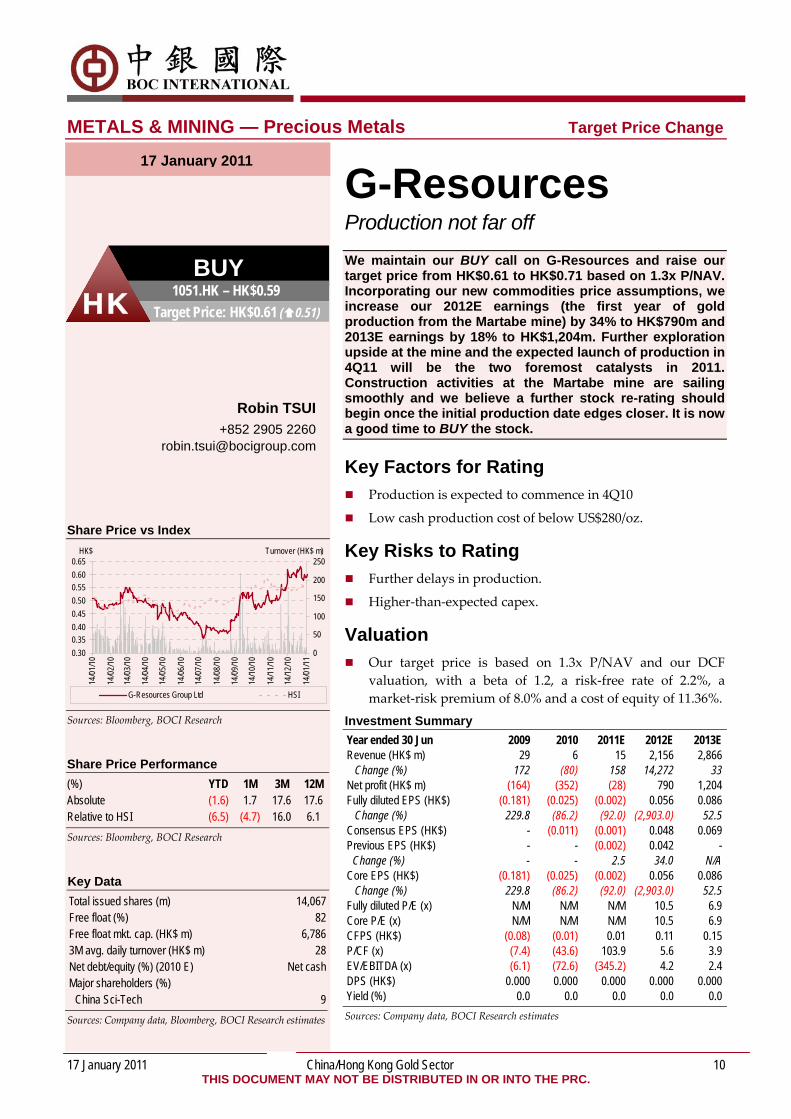
We maintain our BUY call on G-Resources and raise our target price from HK$0.61 to HK$0.71 based on 1.3x P/NAV. Incorporating our new commodities price assumptions, we increase our 2012E earnings (the first year of gold production from the Martabe mine) by 34% to HK$790m and 2013E earnings by 18% to HK$1,204m. Further exploration upside at the mine and the expected launch of production in 4Q11 will be the two foremost catalysts in 2011. Construction activities at the Martabe mine are sailing smoothly and we believe a further stock re-rating should begin once the initial production date edges closer. It is now a good time to BUY the stock.
Key Factors for Rating Production is expected to commence in 4Q10
Low cash production cost of below US$280/oz.
Key Risks to Rating Further delays in production.
Higher‐than‐expected capex.
Valuation Our target price is based on 1.3x P/NAV and our DCF
valuation, with a beta of 1.2, a risk‐free rate of 2.2%, a market‐risk premium of 8.0% and a cost of equity of 11.36%.
Investment Summary Year ended 30 Jun 2009 2010 2011E 2012E 2013E Revenue (HK$ m) 29 6 15 2,156 2,866 Change (%) 172 (80) 158 14,272 33 Net profit (HK$ m) (164) (352) (28) 790 1,204 Fully diluted EPS (HK$) (0.181) (0.025) (0.002) 0.056 0.086 Change (%) 229.8 (86.2) (92.0) (2,903.0) 52.5 Consensus EPS (HK$) - (0.011) (0.001) 0.048 0.069 Previous EPS (HK$) - - (0.002) 0.042 -
Change (%) - - 2.5 34.0 N/A Core EPS (HK$) (0.181) (0.025) (0.002) 0.056 0.086 Change (%) 229.8 (86.2) (92.0) (2,903.0) 52.5 Fully diluted P/E (x) N/M N/M N/M 10.5 6.9 Core P/E (x) N/M N/M N/M 10.5 6.9 CFPS (HK$) (0.08) (0.01) 0.01 0.11 0.15 P/CF (x) (7.4) (43.6) 103.9 5.6 3.9 EV/EBITDA (x) (6.1) (72.6) (345.2) 4.2 2.4 DPS (HK$) 0.000 0.000 0.000 0.000 0.000 Yield (%) 0.0 0.0 0.0 0.0 0.0 Sources: Company data, BOCI Research estimates
BUY 1051.HK – HK$0.59
Target Price: HK$0.61 ( 0.51) HK
17 January 2011
17 January 2011 China/Hong Kong Gold Sector 11 THIS DOCUMENT MAY NOT BE DISTRIBUTED IN OR INTO THE PRC.
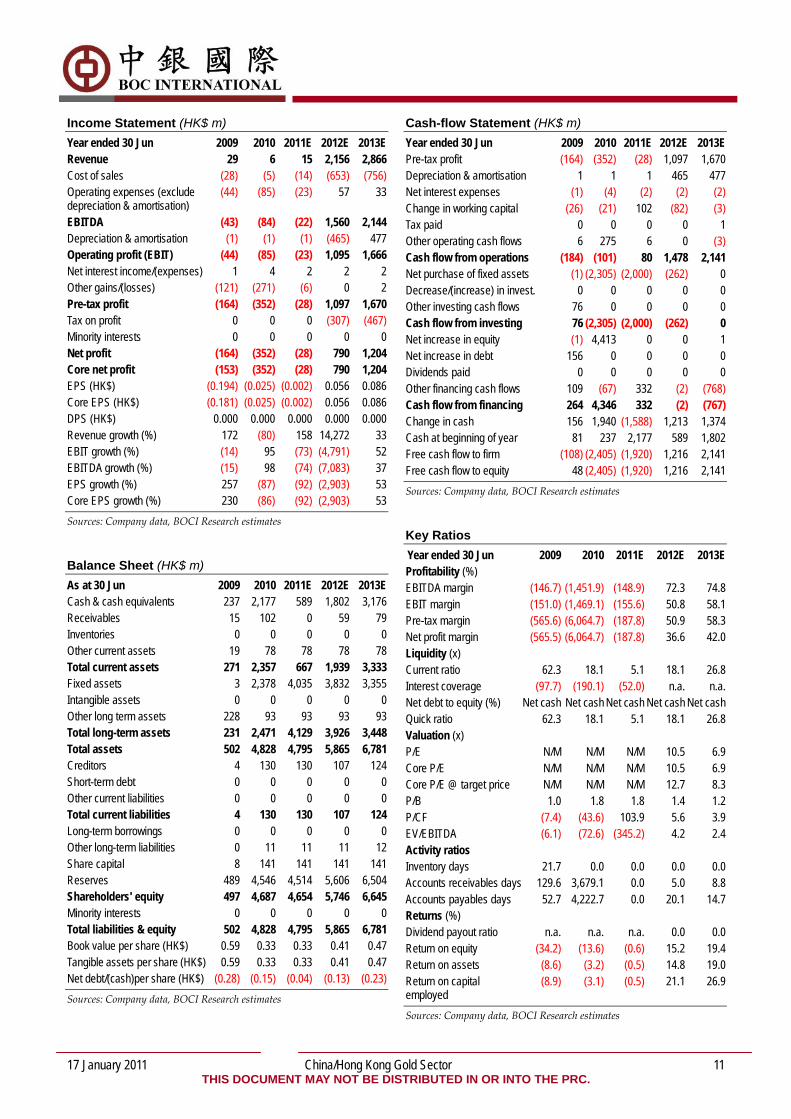
Income Statement (HK$ m) Year ended 30 Jun 2009 2010 2011E 2012E 2013E Revenue 29 6 15 2,156 2,866 Cost of sales (28) (5) (14) (653) (756) Operating expenses (exclude depreciation & amortisation)
(44) (85) (23) 57 33
EBITDA (43) (84) (22) 1,560 2,144 Depreciation & amortisation (1) (1) (1) (465) 477 Operating profit (EBIT) (44) (85) (23) 1,095 1,666 Net interest income/(expenses) 1 4 2 2 2 Other gains/(losses) (121) (271) (6) 0 2 Pre-tax profit (164) (352) (28) 1,097 1,670 Tax on profit 0 0 0 (307) (467) Minority interests 0 0 0 0 0 Net profit (164) (352) (28) 790 1,204 Core net profit (153) (352) (28) 790 1,204 EPS (HK$) (0.194) (0.025) (0.002) 0.056 0.086 Core EPS (HK$) (0.181) (0.025) (0.002) 0.056 0.086 DPS (HK$) 0.000 0.000 0.000 0.000 0.000 Revenue growth (%) 172 (80) 158 14,272 33 EBIT growth (%) (14) 95 (73) (4,791) 52 EBITDA growth (%) (15) 98 (74) (7,083) 37 EPS growth (%) 257 (87) (92) (2,903) 53 Core EPS growth (%) 230 (86) (92) (2,903) 53 Sources: Company data, BOCI Research estimates
Balance Sheet (HK$ m) As at 30 Jun 2009 2010 2011E 2012E 2013E Cash & cash equivalents 237 2,177 589 1,802 3,176 Receivables 15 102 0 59 79 Inventories 0 0 0 0 0 Other current assets 19 78 78 78 78 Total current assets 271 2,357 667 1,939 3,333 Fixed assets 3 2,378 4,035 3,832 3,355 Intangible assets 0 0 0 0 0 Other long term assets 228 93 93 93 93 Total long-term assets 231 2,471 4,129 3,926 3,448 Total assets 502 4,828 4,795 5,865 6,781 Creditors 4 130 130 107 124 Short-term debt 0 0 0 0 0 Other current liabilities 0 0 0 0 0 Total current liabilities 4 130 130 107 124 Long-term borrowings 0 0 0 0 0 Other long-term liabilities 0 11 11 11 12 Share capital 8 141 141 141 141 Reserves 489 4,546 4,514 5,606 6,504 Shareholders' equity 497 4,687 4,654 5,746 6,645 Minority interests 0 0 0 0 0 Total liabilities & equity 502 4,828 4,795 5,865 6,781 Book value per share (HK$) 0.59 0.33 0.33 0.41 0.47 Tangible assets per share (HK$) 0.59 0.33 0.33 0.41 0.47 Net debt/(cash)per share (HK$) (0.28) (0.15) (0.04) (0.13) (0.23) Sources: Company data, BOCI Research estimates
Cash-flow Statement (HK$ m) Year ended 30 Jun 2009 2010 2011E 2012E 2013E Pre-tax profit (164) (352) (28) 1,097 1,670 Depreciation & amortisation 1 1 1 465 477 Net interest expenses (1) (4) (2) (2) (2) Change in working capital (26) (21) 102 (82) (3) Tax paid 0 0 0 0 1 Other operating cash flows 6 275 6 0 (3) Cash flow from operations (184) (101) 80 1,478 2,141 Net purchase of fixed assets (1) (2,305) (2,000) (262) 0 Decrease/(increase) in invest. 0 0 0 0 0 Other investing cash flows 76 0 0 0 0 Cash flow from investing 76 (2,305) (2,000) (262) 0 Net increase in equity (1) 4,413 0 0 1 Net increase in debt 156 0 0 0 0 Dividends paid 0 0 0 0 0 Other financing cash flows 109 (67) 332 (2) (768) Cash flow from financing 264 4,346 332 (2) (767) Change in cash 156 1,940 (1,588) 1,213 1,374 Cash at beginning of year 81 237 2,177 589 1,802 Free cash flow to firm (108) (2,405) (1,920) 1,216 2,141 Free cash flow to equity 48 (2,405) (1,920) 1,216 2,141 Sources: Company data, BOCI Research estimates
Key Ratios Year ended 30 Jun 2009 2010 2011E 2012E 2013E Profitability (%) EBITDA margin (146.7) (1,451.9) (148.9) 72.3 74.8 EBIT margin (151.0) (1,469.1) (155.6) 50.8 58.1 Pre-tax margin (565.6) (6,064.7) (187.8) 50.9 58.3 Net profit margin (565.5) (6,064.7) (187.8) 36.6 42.0 Liquidity (x) Current ratio 62.3 18.1 5.1 18.1 26.8 Interest coverage (97.7) (190.1) (52.0) n.a. n.a. Net debt to equity (%) Net cash Net cash Net cash Net cash Net cash Quick ratio 62.3 18.1 5.1 18.1 26.8 Valuation (x) P/E N/M N/M N/M 10.5 6.9 Core P/E N/M N/M N/M 10.5 6.9 Core P/E @ target price N/M N/M N/M 12.7 8.3 P/B 1.0 1.8 1.8 1.4 1.2 P/CF (7.4) (43.6) 103.9 5.6 3.9 EV/EBITDA (6.1) (72.6) (345.2) 4.2 2.4 Activity ratios Inventory days 21.7 0.0 0.0 0.0 0.0 Accounts receivables days 129.6 3,679.1 0.0 5.0 8.8 Accounts payables days 52.7 4,222.7 0.0 20.1 14.7 Returns (%) Dividend payout ratio n.a. n.a. n.a. 0.0 0.0 Return on equity (34.2) (13.6) (0.6) 15.2 19.4 Return on assets (8.6) (3.2) (0.5) 14.8 19.0 Return on capital employed
(8.9) (3.1) (0.5) 21.1 26.9
Sources: Company data, BOCI Research estimates
17 January 2011 China/Hong Kong Gold Sector 12 THIS DOCUMENT MAY NOT BE DISTRIBUTED IN OR INTO THE PRC.
METALS & MINING — Precious Metals Target Price Change
Robin TSUI +852 2905 2260
Share Price vs Index
89
1011121314151617
15/01
/10
15/02
/10
15/03
/10
15/04
/10
15/05
/10
15/06
/10
15/07
/10
15/08
/10
15/09
/10
15/10
/10
15/11
/10
15/12
/10
15/01
/11
02004006008001,0001,2001,4001,600
Real Gold Mining Ltd HSCEI
Turnover (HK$ m)HK$
Sources: Bloomberg, BOCI Research
Share Price Performance (%) YTD 1M 3M 12M Absolute (6.2) (8.4) (11.1) 11.4 Relative to HSCEI (8.1) (12.1) (6.1) 6.7 Sources: Bloomberg, BOCI Research
Key Data Total issued shares (m) 905 Free float (%) 59 Free float mkt. cap. (HK$ m) 6,975 3M avg. daily turnover (HK$ m) 70 Net debt/equity (%) (2010 E) Net cash Major shareholder (%) Lead Honest 41 Sources: Company data, Bloomberg, BOCI Research estimates
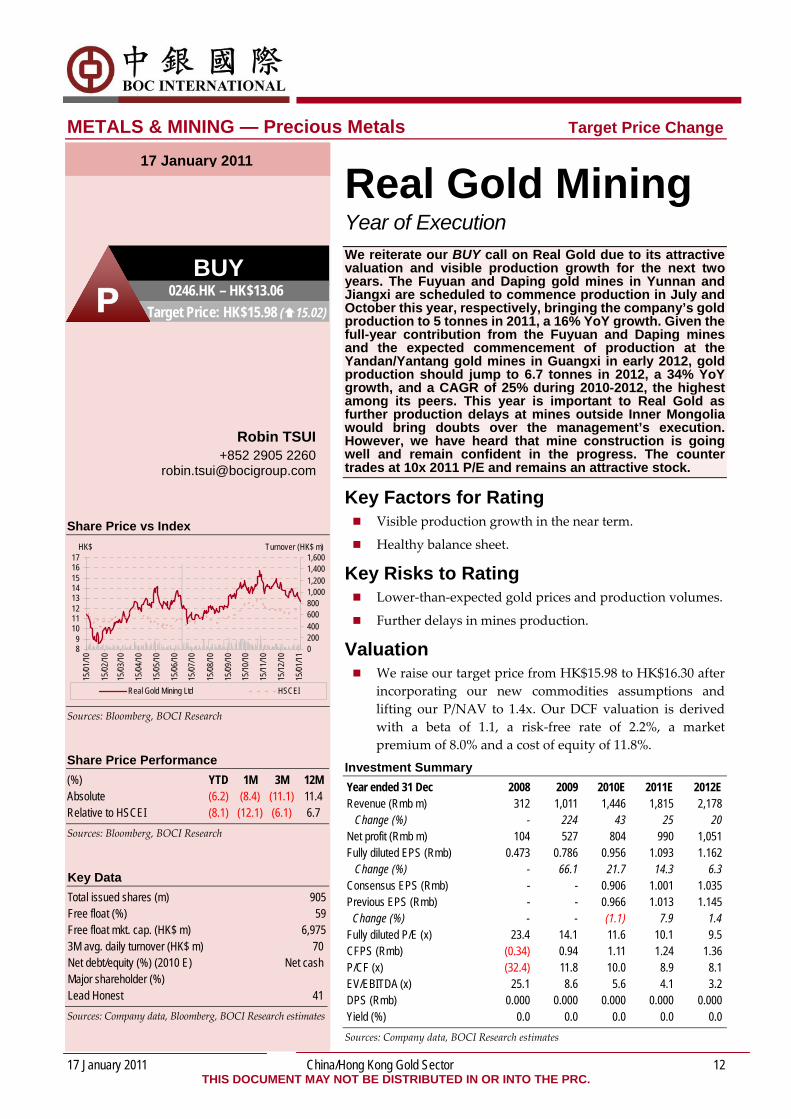
Real Gold Mining Year of Execution We reiterate our BUY call on Real Gold due to its attractive valuation and visible production growth for the next two years. The Fuyuan and Daping gold mines in Yunnan and Jiangxi are scheduled to commence production in July and October this year, respectively, bringing the company’s gold production to 5 tonnes in 2011, a 16% YoY growth. Given the full-year contribution from the Fuyuan and Daping mines and the expected commencement of production at the Yandan/Yantang gold mines in Guangxi in early 2012, gold production should jump to 6.7 tonnes in 2012, a 34% YoY growth, and a CAGR of 25% during 2010-2012, the highest among its peers. This year is important to Real Gold as further production delays at mines outside Inner Mongolia would bring doubts over the management’s execution. However, we have heard that mine construction is going well and remain confident in the progress. The counter trades at 10x 2011 P/E and remains an attractive stock.
Key Factors for Rating Visible production growth in the near term.
Healthy balance sheet.
Key Risks to Rating Lower‐than‐expected gold prices and production volumes.
Further delays in mines production.
Valuation We raise our target price from HK$15.98 to HK$16.30 after
incorporating our new commodities assumptions and lifting our P/NAV to 1.4x. Our DCF valuation is derived with a beta of 1.1, a risk‐free rate of 2.2%, a market premium of 8.0% and a cost of equity of 11.8%.
Investment Summary Year ended 31 Dec 2008 2009 2010E 2011E 2012E Revenue (Rmb m) 312 1,011 1,446 1,815 2,178 Change (%) - 224 43 25 20 Net profit (Rmb m) 104 527 804 990 1,051 Fully diluted EPS (Rmb) 0.473 0.786 0.956 1.093 1.162 Change (%) - 66.1 21.7 14.3 6.3 Consensus EPS (Rmb) - - 0.906 1.001 1.035 Previous EPS (Rmb) - - 0.966 1.013 1.145
Change (%) - - (1.1) 7.9 1.4 Fully diluted P/E (x) 23.4 14.1 11.6 10.1 9.5 CFPS (Rmb) (0.34) 0.94 1.11 1.24 1.36 P/CF (x) (32.4) 11.8 10.0 8.9 8.1 EV/EBITDA (x) 25.1 8.6 5.6 4.1 3.2 DPS (Rmb) 0.000 0.000 0.000 0.000 0.000 Yield (%) 0.0 0.0 0.0 0.0 0.0 Sources: Company data, BOCI Research estimates
BUY 0246.HK – HK$13.06
Target Price: HK$15.98 ( 15.02) P
17 January 2011
17 January 2011 China/Hong Kong Gold Sector 13 THIS DOCUMENT MAY NOT BE DISTRIBUTED IN OR INTO THE PRC.
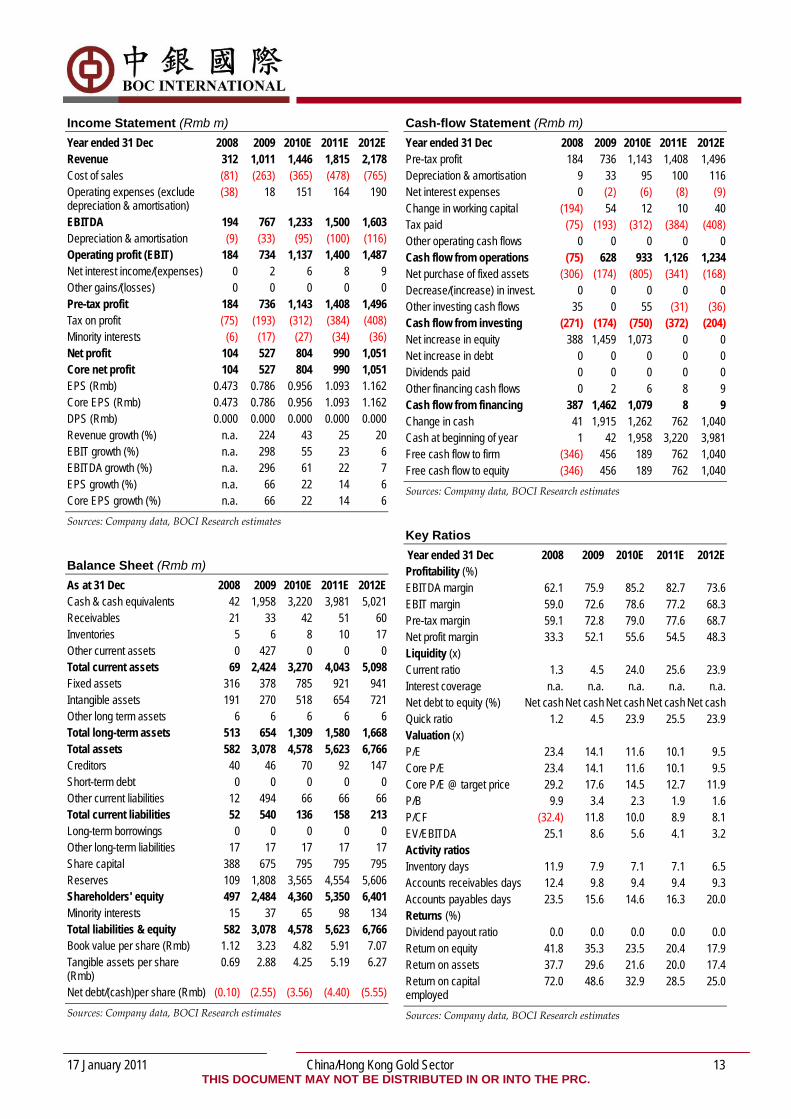
Income Statement (Rmb m) Year ended 31 Dec 2008 2009 2010E 2011E 2012E Revenue 312 1,011 1,446 1,815 2,178 Cost of sales (81) (263) (365) (478) (765) Operating expenses (exclude depreciation & amortisation)
(38) 18 151 164 190
EBITDA 194 767 1,233 1,500 1,603 Depreciation & amortisation (9) (33) (95) (100) (116) Operating profit (EBIT) 184 734 1,137 1,400 1,487 Net interest income/(expenses) 0 2 6 8 9 Other gains/(losses) 0 0 0 0 0 Pre-tax profit 184 736 1,143 1,408 1,496 Tax on profit (75) (193) (312) (384) (408) Minority interests (6) (17) (27) (34) (36) Net profit 104 527 804 990 1,051 Core net profit 104 527 804 990 1,051 EPS (Rmb) 0.473 0.786 0.956 1.093 1.162 Core EPS (Rmb) 0.473 0.786 0.956 1.093 1.162 DPS (Rmb) 0.000 0.000 0.000 0.000 0.000 Revenue growth (%) n.a. 224 43 25 20 EBIT growth (%) n.a. 298 55 23 6 EBITDA growth (%) n.a. 296 61 22 7 EPS growth (%) n.a. 66 22 14 6 Core EPS growth (%) n.a. 66 22 14 6 Sources: Company data, BOCI Research estimates
Balance Sheet (Rmb m) As at 31 Dec 2008 2009 2010E 2011E 2012E Cash & cash equivalents 42 1,958 3,220 3,981 5,021 Receivables 21 33 42 51 60 Inventories 5 6 8 10 17 Other current assets 0 427 0 0 0 Total current assets 69 2,424 3,270 4,043 5,098 Fixed assets 316 378 785 921 941 Intangible assets 191 270 518 654 721 Other long term assets 6 6 6 6 6 Total long-term assets 513 654 1,309 1,580 1,668 Total assets 582 3,078 4,578 5,623 6,766 Creditors 40 46 70 92 147 Short-term debt 0 0 0 0 0 Other current liabilities 12 494 66 66 66 Total current liabilities 52 540 136 158 213 Long-term borrowings 0 0 0 0 0 Other long-term liabilities 17 17 17 17 17 Share capital 388 675 795 795 795 Reserves 109 1,808 3,565 4,554 5,606 Shareholders' equity 497 2,484 4,360 5,350 6,401 Minority interests 15 37 65 98 134 Total liabilities & equity 582 3,078 4,578 5,623 6,766 Book value per share (Rmb) 1.12 3.23 4.82 5.91 7.07 Tangible assets per share (Rmb)
0.69 2.88 4.25 5.19 6.27
Net debt/(cash)per share (Rmb) (0.10) (2.55) (3.56) (4.40) (5.55) Sources: Company data, BOCI Research estimates
Cash-flow Statement (Rmb m) Year ended 31 Dec 2008 2009 2010E 2011E 2012E Pre-tax profit 184 736 1,143 1,408 1,496 Depreciation & amortisation 9 33 95 100 116 Net interest expenses 0 (2) (6) (8) (9) Change in working capital (194) 54 12 10 40 Tax paid (75) (193) (312) (384) (408) Other operating cash flows 0 0 0 0 0 Cash flow from operations (75) 628 933 1,126 1,234 Net purchase of fixed assets (306) (174) (805) (341) (168) Decrease/(increase) in invest. 0 0 0 0 0 Other investing cash flows 35 0 55 (31) (36) Cash flow from investing (271) (174) (750) (372) (204) Net increase in equity 388 1,459 1,073 0 0 Net increase in debt 0 0 0 0 0 Dividends paid 0 0 0 0 0 Other financing cash flows 0 2 6 8 9 Cash flow from financing 387 1,462 1,079 8 9 Change in cash 41 1,915 1,262 762 1,040 Cash at beginning of year 1 42 1,958 3,220 3,981 Free cash flow to firm (346) 456 189 762 1,040 Free cash flow to equity (346) 456 189 762 1,040 Sources: Company data, BOCI Research estimates
Key Ratios Year ended 31 Dec 2008 2009 2010E 2011E 2012E Profitability (%) EBITDA margin 62.1 75.9 85.2 82.7 73.6 EBIT margin 59.0 72.6 78.6 77.2 68.3 Pre-tax margin 59.1 72.8 79.0 77.6 68.7 Net profit margin 33.3 52.1 55.6 54.5 48.3 Liquidity (x) Current ratio 1.3 4.5 24.0 25.6 23.9 Interest coverage n.a. n.a. n.a. n.a. n.a. Net debt to equity (%) Net cash Net cash Net cash Net cash Net cash Quick ratio 1.2 4.5 23.9 25.5 23.9 Valuation (x) P/E 23.4 14.1 11.6 10.1 9.5 Core P/E 23.4 14.1 11.6 10.1 9.5 Core P/E @ target price 29.2 17.6 14.5 12.7 11.9 P/B 9.9 3.4 2.3 1.9 1.6 P/CF (32.4) 11.8 10.0 8.9 8.1 EV/EBITDA 25.1 8.6 5.6 4.1 3.2 Activity ratios Inventory days 11.9 7.9 7.1 7.1 6.5 Accounts receivables days 12.4 9.8 9.4 9.4 9.3 Accounts payables days 23.5 15.6 14.6 16.3 20.0 Returns (%) Dividend payout ratio 0.0 0.0 0.0 0.0 0.0 Return on equity 41.8 35.3 23.5 20.4 17.9 Return on assets 37.7 29.6 21.6 20.0 17.4 Return on capital employed
72.0 48.6 32.9 28.5 25.0
Sources: Company data, BOCI Research estimates
17 January 2011 China/Hong Kong Gold Sector 14 THIS DOCUMENT MAY NOT BE DISTRIBUTED IN OR INTO THE PRC.
METALS & MINING — Precious Metals Company Update
Robin TSUI +852 2905 2260
Share Price vs Index
38
40
42
44
46
48
30/11
/10
04/12
/10
08/12
/10
12/12
/10
16/12
/10
20/12
/10
24/12
/10
28/12
/10
01/01
/11
05/01
/11
09/01
/11
13/01
/11
0
100
200
300
400
500
600
China Gold International Res HSI
Turnover (HK$ m)HK$
Sources: Bloomberg, BOCI Research
Share Price Performance (%) YTD 1M 3M 12M Absolute (4.9) (3.4) NA NA Relative to HSCEI (6.8) (7.1) NA NA Sources: Bloomberg, BOCI Research
Key Data Total issued shares (m) 396 Free float (%) 40 Free float mkt. cap. (HK$ m) 6,390 3M avg. daily turnover (HK$ m) 38 Net debt/equity (%) (2010 E) Net cash Major shareholder (%) Lead Honest 39 Sources: Company data, Bloomberg, BOCI Research estimates
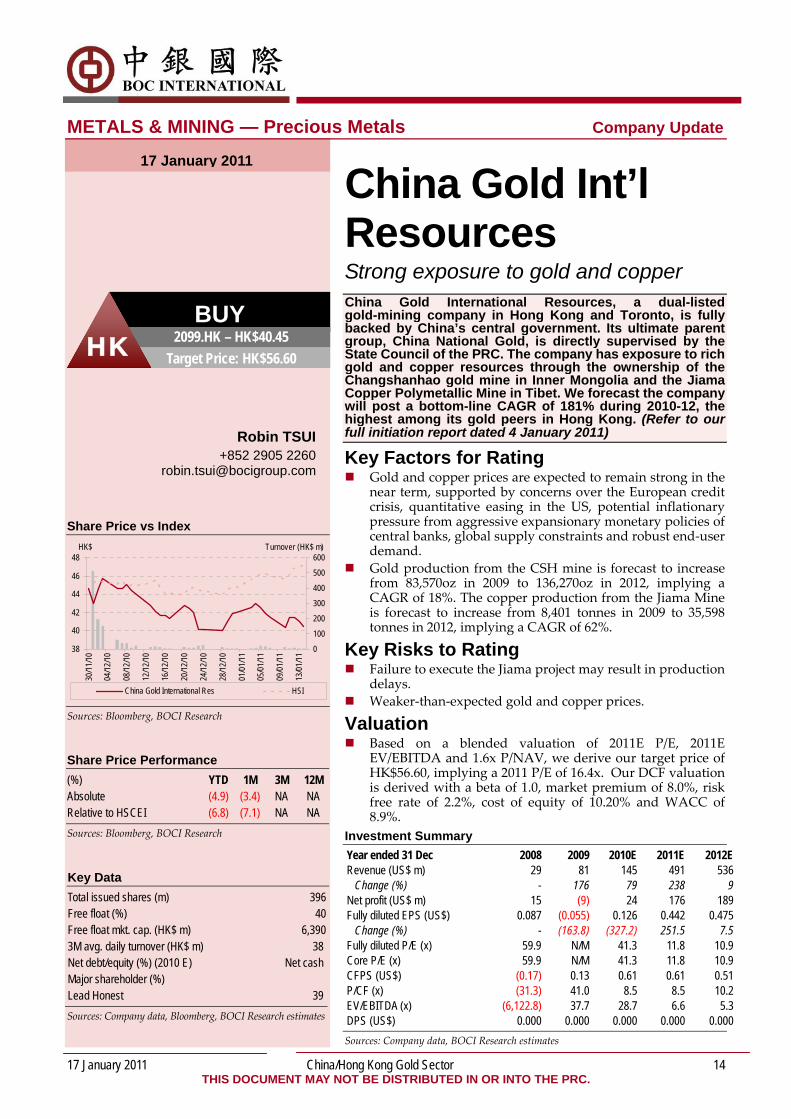
China Gold Int’l Resources Strong exposure to gold and copper China Gold International Resources, a dual-listed gold-mining company in Hong Kong and Toronto, is fully backed by China’s central government. Its ultimate parent group, China National Gold, is directly supervised by the State Council of the PRC. The company has exposure to rich gold and copper resources through the ownership of the Changshanhao gold mine in Inner Mongolia and the Jiama Copper Polymetallic Mine in Tibet. We forecast the company will post a bottom-line CAGR of 181% during 2010-12, the highest among its gold peers in Hong Kong. (Refer to our full initiation report dated 4 January 2011)
Key Factors for Rating Gold and copper prices are expected to remain strong in the
near term, supported by concerns over the European credit crisis, quantitative easing in the US, potential inflationary pressure from aggressive expansionary monetary policies of central banks, global supply constraints and robust end‐user demand.
Gold production from the CSH mine is forecast to increase from 83,570oz in 2009 to 136,270oz in 2012, implying a CAGR of 18%. The copper production from the Jiama Mine is forecast to increase from 8,401 tonnes in 2009 to 35,598 tonnes in 2012, implying a CAGR of 62%.
Key Risks to Rating Failure to execute the Jiama project may result in production
delays. Weaker‐than‐expected gold and copper prices.
Valuation Based on a blended valuation of 2011E P/E, 2011E
EV/EBITDA and 1.6x P/NAV, we derive our target price of HK$56.60, implying a 2011 P/E of 16.4x. Our DCF valuation is derived with a beta of 1.0, market premium of 8.0%, risk free rate of 2.2%, cost of equity of 10.20% and WACC of 8.9%.
Investment Summary Year ended 31 Dec 2008 2009 2010E 2011E 2012E Revenue (US$ m) 29 81 145 491 536 Change (%) - 176 79 238 9 Net profit (US$ m) 15 (9) 24 176 189 Fully diluted EPS (US$) 0.087 (0.055) 0.126 0.442 0.475 Change (%) - (163.8) (327.2) 251.5 7.5 Fully diluted P/E (x) 59.9 N/M 41.3 11.8 10.9 Core P/E (x) 59.9 N/M 41.3 11.8 10.9 CFPS (US$) (0.17) 0.13 0.61 0.61 0.51 P/CF (x) (31.3) 41.0 8.5 8.5 10.2 EV/EBITDA (x) (6,122.8) 37.7 28.7 6.6 5.3 DPS (US$) 0.000 0.000 0.000 0.000 0.000 Sources: Company data, BOCI Research estimates
17 January 2011
BUY 2099.HK – HK$40.45
Target Price: HK$56.60 HK
17 January 2011 China/Hong Kong Gold Sector 15 THIS DOCUMENT MAY NOT BE DISTRIBUTED IN OR INTO THE PRC.
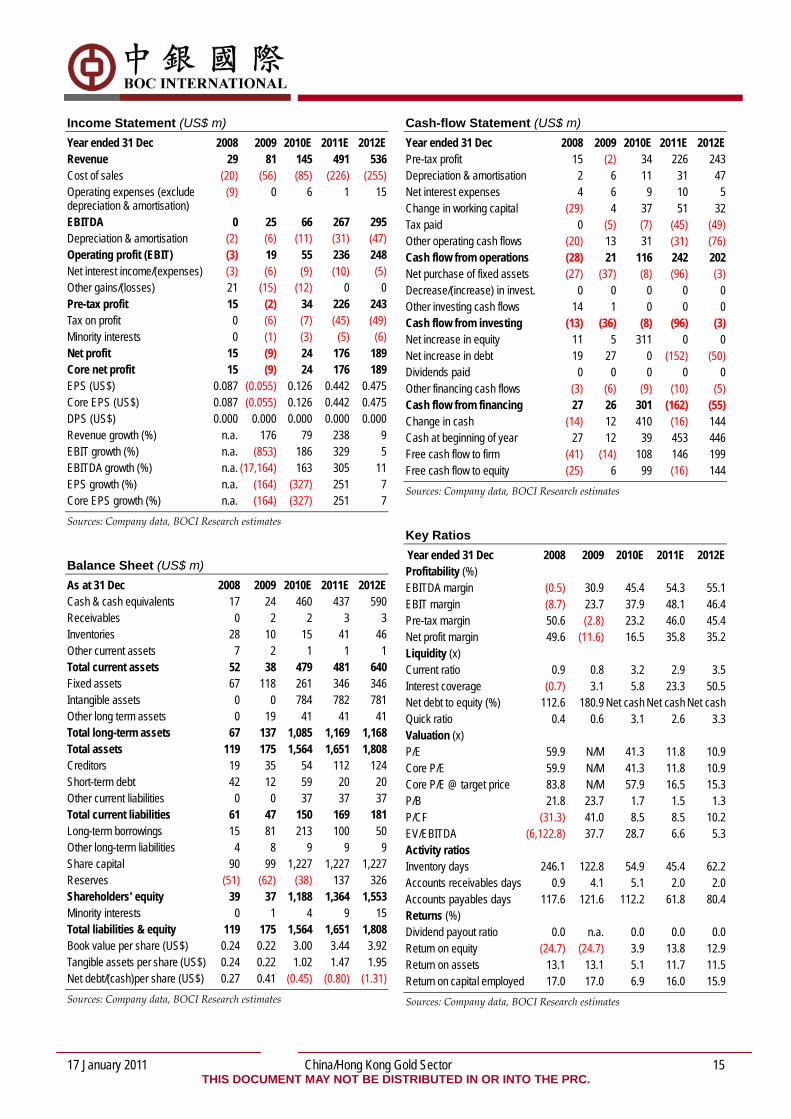
Income Statement (US$ m) Year ended 31 Dec 2008 2009 2010E 2011E 2012E Revenue 29 81 145 491 536 Cost of sales (20) (56) (85) (226) (255) Operating expenses (exclude depreciation & amortisation)
(9) 0 6 1 15
EBITDA 0 25 66 267 295 Depreciation & amortisation (2) (6) (11) (31) (47) Operating profit (EBIT) (3) 19 55 236 248 Net interest income/(expenses) (3) (6) (9) (10) (5) Other gains/(losses) 21 (15) (12) 0 0 Pre-tax profit 15 (2) 34 226 243 Tax on profit 0 (6) (7) (45) (49) Minority interests 0 (1) (3) (5) (6) Net profit 15 (9) 24 176 189 Core net profit 15 (9) 24 176 189 EPS (US$) 0.087 (0.055) 0.126 0.442 0.475 Core EPS (US$) 0.087 (0.055) 0.126 0.442 0.475 DPS (US$) 0.000 0.000 0.000 0.000 0.000 Revenue growth (%) n.a. 176 79 238 9 EBIT growth (%) n.a. (853) 186 329 5 EBITDA growth (%) n.a. (17,164) 163 305 11 EPS growth (%) n.a. (164) (327) 251 7 Core EPS growth (%) n.a. (164) (327) 251 7 Sources: Company data, BOCI Research estimates
Balance Sheet (US$ m) As at 31 Dec 2008 2009 2010E 2011E 2012E Cash & cash equivalents 17 24 460 437 590 Receivables 0 2 2 3 3 Inventories 28 10 15 41 46 Other current assets 7 2 1 1 1 Total current assets 52 38 479 481 640 Fixed assets 67 118 261 346 346 Intangible assets 0 0 784 782 781 Other long term assets 0 19 41 41 41 Total long-term assets 67 137 1,085 1,169 1,168 Total assets 119 175 1,564 1,651 1,808 Creditors 19 35 54 112 124 Short-term debt 42 12 59 20 20 Other current liabilities 0 0 37 37 37 Total current liabilities 61 47 150 169 181 Long-term borrowings 15 81 213 100 50 Other long-term liabilities 4 8 9 9 9 Share capital 90 99 1,227 1,227 1,227 Reserves (51) (62) (38) 137 326 Shareholders' equity 39 37 1,188 1,364 1,553 Minority interests 0 1 4 9 15 Total liabilities & equity 119 175 1,564 1,651 1,808 Book value per share (US$) 0.24 0.22 3.00 3.44 3.92 Tangible assets per share (US$) 0.24 0.22 1.02 1.47 1.95 Net debt/(cash)per share (US$) 0.27 0.41 (0.45) (0.80) (1.31) Sources: Company data, BOCI Research estimates
Cash-flow Statement (US$ m) Year ended 31 Dec 2008 2009 2010E 2011E 2012E Pre-tax profit 15 (2) 34 226 243 Depreciation & amortisation 2 6 11 31 47 Net interest expenses 4 6 9 10 5 Change in working capital (29) 4 37 51 32 Tax paid 0 (5) (7) (45) (49) Other operating cash flows (20) 13 31 (31) (76) Cash flow from operations (28) 21 116 242 202 Net purchase of fixed assets (27) (37) (8) (96) (3) Decrease/(increase) in invest. 0 0 0 0 0 Other investing cash flows 14 1 0 0 0 Cash flow from investing (13) (36) (8) (96) (3) Net increase in equity 11 5 311 0 0 Net increase in debt 19 27 0 (152) (50) Dividends paid 0 0 0 0 0 Other financing cash flows (3) (6) (9) (10) (5) Cash flow from financing 27 26 301 (162) (55) Change in cash (14) 12 410 (16) 144 Cash at beginning of year 27 12 39 453 446 Free cash flow to firm (41) (14) 108 146 199 Free cash flow to equity (25) 6 99 (16) 144 Sources: Company data, BOCI Research estimates
Key Ratios Year ended 31 Dec 2008 2009 2010E 2011E 2012E Profitability (%) EBITDA margin (0.5) 30.9 45.4 54.3 55.1 EBIT margin (8.7) 23.7 37.9 48.1 46.4 Pre-tax margin 50.6 (2.8) 23.2 46.0 45.4 Net profit margin 49.6 (11.6) 16.5 35.8 35.2 Liquidity (x) Current ratio 0.9 0.8 3.2 2.9 3.5 Interest coverage (0.7) 3.1 5.8 23.3 50.5 Net debt to equity (%) 112.6 180.9 Net cash Net cash Net cash Quick ratio 0.4 0.6 3.1 2.6 3.3 Valuation (x) P/E 59.9 N/M 41.3 11.8 10.9 Core P/E 59.9 N/M 41.3 11.8 10.9 Core P/E @ target price 83.8 N/M 57.9 16.5 15.3 P/B 21.8 23.7 1.7 1.5 1.3 P/CF (31.3) 41.0 8.5 8.5 10.2 EV/EBITDA (6,122.8) 37.7 28.7 6.6 5.3 Activity ratios Inventory days 246.1 122.8 54.9 45.4 62.2 Accounts receivables days 0.9 4.1 5.1 2.0 2.0 Accounts payables days 117.6 121.6 112.2 61.8 80.4 Returns (%) Dividend payout ratio 0.0 n.a. 0.0 0.0 0.0 Return on equity (24.7) (24.7) 3.9 13.8 12.9 Return on assets 13.1 13.1 5.1 11.7 11.5 Return on capital employed 17.0 17.0 6.9 16.0 15.9 Sources: Company data, BOCI Research estimates
17 January 2011 China/Hong Kong Gold Sector 16 THIS DOCUMENT MAY NOT BE DISTRIBUTED IN OR INTO THE PRC.
METALS & MINING — Precious Metals Rating Change
Robin TSUI +852 2905 2260
Share Price vs Index
10
15
20
25
30
35
15/01
/10
15/02
/10
15/03
/10
15/04
/10
15/05
/10
15/06
/10
15/07
/10
15/08
/10
15/09
/10
15/10
/10
15/11
/10
15/12
/10
15/01
/11
0100200300400500600700800
Zhaojin Mining Industry HSCEI
Turnover (HK$ m)HK$
Sources: Bloomberg, BOCI Research
Share Price Performance (%) YTD 1M 3M 12M Absolute (0.8) (1.1) 22.3 88.9 Relative to HSCEI (2.7) (4.9) 27.2 84.2 Sources: Bloomberg, BOCI Research
Key Data Total issued shares (m) 1,457 Free float (%) 35 Free float mkt. cap. (HK$ m) 16,716 3M avg. daily turnover (HK$ m) 33 Net debt/equity (%) (2010 E) Net cash Major shareholder (%)
Zhaojin Group 38 Sources: Company data, Bloomberg, BOCI Research estimates
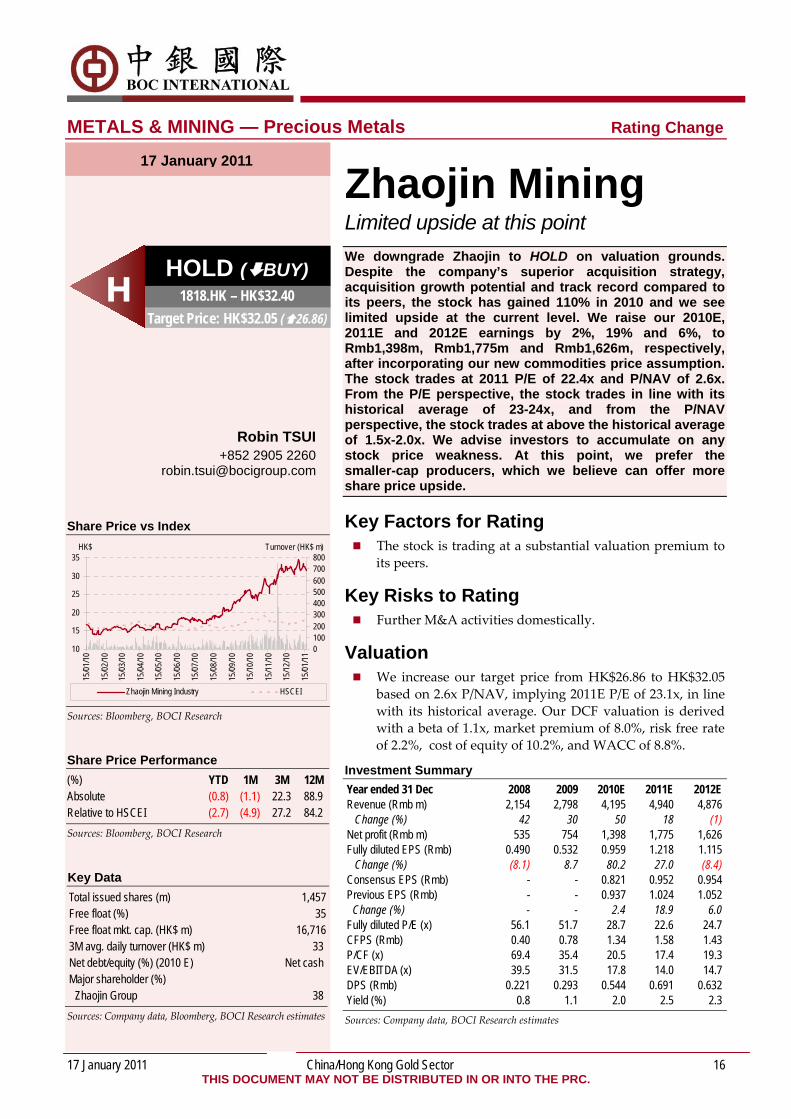
Zhaojin Mining Limited upside at this point We downgrade Zhaojin to HOLD on valuation grounds. Despite the company’s superior acquisition strategy, acquisition growth potential and track record compared to its peers, the stock has gained 110% in 2010 and we see limited upside at the current level. We raise our 2010E, 2011E and 2012E earnings by 2%, 19% and 6%, to Rmb1,398m, Rmb1,775m and Rmb1,626m, respectively, after incorporating our new commodities price assumption. The stock trades at 2011 P/E of 22.4x and P/NAV of 2.6x. From the P/E perspective, the stock trades in line with its historical average of 23-24x, and from the P/NAV perspective, the stock trades at above the historical average of 1.5x-2.0x. We advise investors to accumulate on any stock price weakness. At this point, we prefer the smaller-cap producers, which we believe can offer more share price upside.
Key Factors for Rating The stock is trading at a substantial valuation premium to
its peers.
Key Risks to Rating Further M&A activities domestically.
Valuation We increase our target price from HK$26.86 to HK$32.05
based on 2.6x P/NAV, implying 2011E P/E of 23.1x, in line with its historical average. Our DCF valuation is derived with a beta of 1.1x, market premium of 8.0%, risk free rate of 2.2%, cost of equity of 10.2%, and WACC of 8.8%.
Investment Summary Year ended 31 Dec 2008 2009 2010E 2011E 2012E Revenue (Rmb m) 2,154 2,798 4,195 4,940 4,876 Change (%) 42 30 50 18 (1) Net profit (Rmb m) 535 754 1,398 1,775 1,626 Fully diluted EPS (Rmb) 0.490 0.532 0.959 1.218 1.115 Change (%) (8.1) 8.7 80.2 27.0 (8.4) Consensus EPS (Rmb) - - 0.821 0.952 0.954 Previous EPS (Rmb) - - 0.937 1.024 1.052
Change (%) - - 2.4 18.9 6.0 Fully diluted P/E (x) 56.1 51.7 28.7 22.6 24.7 CFPS (Rmb) 0.40 0.78 1.34 1.58 1.43 P/CF (x) 69.4 35.4 20.5 17.4 19.3 EV/EBITDA (x) 39.5 31.5 17.8 14.0 14.7 DPS (Rmb) 0.221 0.293 0.544 0.691 0.632 Yield (%) 0.8 1.1 2.0 2.5 2.3 Sources: Company data, BOCI Research estimates
17 January 2011
HOLD ( BUY) 1818.HK – HK$32.40
Target Price: HK$32.05 ( 26.86) H

17 January 2011 China/Hong Kong Gold Sector 17 THIS DOCUMENT MAY NOT BE DISTRIBUTED IN OR INTO THE PRC.
Income Statement (Rmb m) Year ended 31 Dec 2008 2009 2010E 2011E 2012E Revenue 2,154 2,798 4,195 4,940 4,876 Cost of sales (1,074) (1,349) (1,653) (1,789) (1,926) Operating expenses (exclude depreciation & amortisation)
(64) (170) (284) (327) (265)
EBITDA 1,016 1,279 2,258 2,823 2,685 Depreciation & amortisation (252) (250) (327) (391) (444) Operating profit (EBIT) 764 1,029 1,931 2,433 2,241 Net interest income/(expenses) 1 (11) (93) (98) (103) Other gains/(losses) (55) (3) (2) (3) (3) Pre-tax profit 710 1,015 1,836 2,331 2,135 Tax on profit (171) (264) (464) (589) (540) Minority interests (4) 3 26 33 30 Net profit 535 754 1,398 1,775 1,626 Core net profit 535 776 1,398 1,775 1,626 EPS (Rmb) 0.490 0.517 0.959 1.218 1.115 Core EPS (Rmb) 0.490 0.532 0.959 1.218 1.115 DPS (Rmb) 0.221 0.293 0.544 0.691 0.632 Revenue growth (%) 42 30 50 18 (1) EBIT growth (%) 44 35 88 26 (8) EBITDA growth (%) 54 26 77 25 (5) EPS growth (%) (8) 6 85 27 (8) Core EPS growth (%) (8) 9 80 27 (8) Sources: Company data, BOCI Research estimates
Balance Sheet (Rmb m) As at 31 Dec 2008 2009 2010E 2011E 2012E Cash & cash equivalents 689 2,269 2,521 3,248 3,595 Receivables 35 11 16 19 19 Inventories 422 475 582 630 679 Other current assets 380 263 198 198 198 Total current assets 1,526 3,018 3,317 4,095 4,490 Fixed assets 2,148 2,763 3,377 3,767 4,118 Intangible assets 1,847 2,365 2,942 3,230 3,504 Other long term assets 410 436 484 501 518 Total long-term assets 4,405 5,564 6,803 7,498 8,139 Total assets 5,931 8,582 10,120 11,593 12,629 Creditors 206 373 458 495 533 Short-term debt 471 611 696 781 875 Other current liabilities 433 567 771 896 887 Total current liabilities 1,110 1,551 1,925 2,172 2,295 Long-term borrowings 8 1,546 1,555 1,565 1,575 Other long-term liabilities 404 517 519 521 523 Share capital 1,457 1,457 1,457 1,457 1,457 Reserves 2,598 3,110 4,187 5,368 6,239 Shareholders' equity 4,055 4,567 5,645 6,826 7,696 Minority interests 353 400 476 509 539 Total liabilities & equity 5,931 8,582 10,120 11,593 12,629 Book value per share (Rmb) 2.78 3.13 3.87 4.68 5.28 Tangible assets per share (Rmb)
1.52 1.51 1.85 2.47 2.88
Net debt/(cash)per share (Rmb) (0.14) (0.08) (0.18) (0.62) (0.78) Sources: Company data, BOCI Research estimates
Cash-flow Statement (Rmb m) Year ended 31 Dec 2008 2009 2010E 2011E 2012E Pre-tax profit 710 1,015 1,836 2,331 2,135 Depreciation & amortisation 252 250 327 391 444 Net interest expenses (1) 11 93 98 103 Change in working capital (223) 266 203 111 (19) Tax paid (273) (332) (464) (589) (540) Other operating cash flows (32) (78) (37) (43) (42) Cash flow from operations 433 1,132 1,958 2,300 2,081 Net purchase of fixed assets (1,872) (1,299) (1,559) (920) (920) Decrease/(increase) in invest. 0 0 0 0 0 Other investing cash flows 260 182 522 182 (48) Cash flow from investing (1,612) (1,118) (1,038) (738) (968) Net increase in equity 0 0 0 0 0 Net increase in debt 103 1,678 18 18 28 Dividends paid (199) (242) (594) (755) (691) Other financing cash flows 347 130 (93) (98) (103) Cash flow from financing 251 1,566 (669) (835) (767) Change in cash (928) 1,581 252 727 347 Cash at beginning of year 1,626 689 2,269 2,521 3,248 Free cash flow to firm (1,113) 27 938 1,577 1,128 Free cash flow to equity (1,030) 1,686 846 1,482 1,038 Sources: Company data, BOCI Research estimates
Key Ratios Year ended 31 Dec 2008 2009 2010E 2011E 2012E Profitability (%) EBITDA margin 47.2 45.7 53.8 57.2 55.1 EBIT margin 35.5 36.8 46.0 49.2 46.0 Pre-tax margin 33.0 36.3 43.8 47.2 43.8 Net profit margin 24.9 26.9 33.3 35.9 33.3 Liquidity (x) Current ratio 1.4 1.9 1.7 1.9 2.0 Interest coverage 44.3 44.5 17.6 21.4 19.0 Net debt to equity (%) Net cash Net cash Net cash Net cash Net cash Quick ratio 1.0 1.6 1.4 1.6 1.7 Valuation (x) P/E 56.1 53.1 28.7 22.6 24.7 Core P/E 56.1 51.7 28.7 22.6 24.7 Core P/E @ target price 55.5 51.1 28.4 22.3 24.4 P/B 9.9 8.8 7.1 5.9 5.2 P/CF 69.4 35.4 20.5 17.4 19.3 EV/EBITDA 39.5 31.5 17.8 14.0 14.7 Activity ratios Inventory days 128.4 121.4 116.7 123.7 124.0 Accounts receivables days 5.8 3.0 1.2 1.3 1.4 Accounts payables days 37.4 37.8 36.1 35.2 38.5 Returns (%) Dividend payout ratio 60.3 56.7 56.7 56.7 56.7 Return on equity 13.8 17.5 27.4 28.5 22.4 Return on assets 10.6 10.5 15.4 16.7 13.8 Return on capital employed 17.4 17.3 25.1 27.1 22.2 Sources: Company data, BOCI Research estimates
17 January 2011 China/Hong Kong Gold Sector 18 THIS DOCUMENT MAY NOT BE DISTRIBUTED IN OR INTO THE PRC.
METALS & MINING — Precious Metals Rating Change
Robin TSUI +852 2905 2260
Share Price vs Index – H shares
4
5
6
7
8
9
15/01
/10
15/02
/10
15/03
/10
15/04
/10
15/05
/10
15/06
/10
15/07
/10
15/08
/10
15/09
/10
15/10
/10
15/11
/10
15/12
/10
15/01
/11
0
500
1,000
1,500
2,000
Zijin Mining - H HSCEI
Turnover (HK$ m)HK$
Sources: Bloomberg, BOCI Research Share Price Performance – H shares YTD 1M 3M 12M Absolute (%) (7.1) (5.6) (14.4) (10.4) Relative to HSCEI (%) (9.0) (9.4) (9.5) (15.1) Sources: Bloomberg, BOCI Research Key Data – H shares Total issued shares (m) 14,541 Free float (%) 30 Free float mkt. cap. (HK$ m) 26,087 3M avg. daily turnover (HK$ m) 212 Net debt/equity (%) (2010E) Net cash Major shareholders (%)
Minxi Xinghang 29 Sources: Company data, Bloomberg, BOCI Research estimates
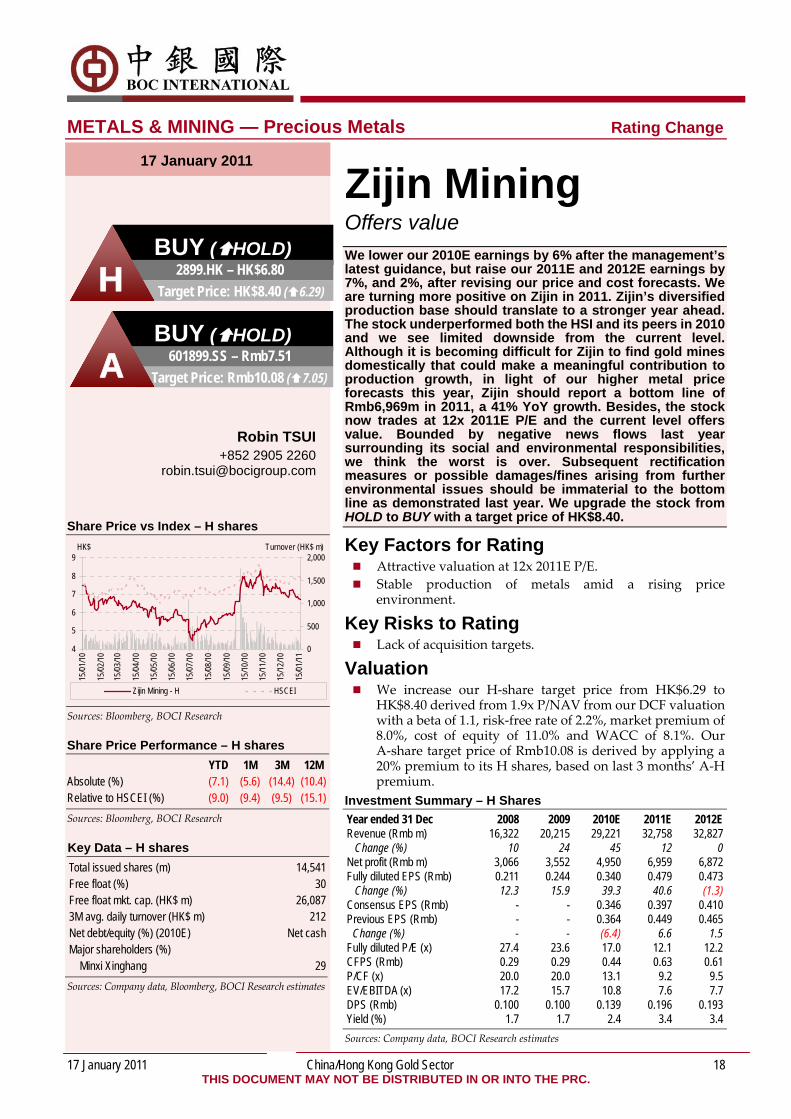
Zijin Mining Offers value We lower our 2010E earnings by 6% after the management’s latest guidance, but raise our 2011E and 2012E earnings by 7%, and 2%, after revising our price and cost forecasts. We are turning more positive on Zijin in 2011. Zijin’s diversified production base should translate to a stronger year ahead. The stock underperformed both the HSI and its peers in 2010 and we see limited downside from the current level. Although it is becoming difficult for Zijin to find gold mines domestically that could make a meaningful contribution to production growth, in light of our higher metal price forecasts this year, Zijin should report a bottom line of Rmb6,969m in 2011, a 41% YoY growth. Besides, the stock now trades at 12x 2011E P/E and the current level offers value. Bounded by negative news flows last year surrounding its social and environmental responsibilities, we think the worst is over. Subsequent rectification measures or possible damages/fines arising from further environmental issues should be immaterial to the bottom line as demonstrated last year. We upgrade the stock from HOLD to BUY with a target price of HK$8.40.
Key Factors for Rating Attractive valuation at 12x 2011E P/E. Stable production of metals amid a rising price
environment.
Key Risks to Rating Lack of acquisition targets.
Valuation We increase our H‐share target price from HK$6.29 to
HK$8.40 derived from 1.9x P/NAV from our DCF valuation with a beta of 1.1, risk‐free rate of 2.2%, market premium of 8.0%, cost of equity of 11.0% and WACC of 8.1%. Our A‐share target price of Rmb10.08 is derived by applying a 20% premium to its H shares, based on last 3 months’ A‐H premium.
Investment Summary – H Shares Year ended 31 Dec 2008 2009 2010E 2011E 2012E Revenue (Rmb m) 16,322 20,215 29,221 32,758 32,827 Change (%) 10 24 45 12 0 Net profit (Rmb m) 3,066 3,552 4,950 6,959 6,872 Fully diluted EPS (Rmb) 0.211 0.244 0.340 0.479 0.473 Change (%) 12.3 15.9 39.3 40.6 (1.3) Consensus EPS (Rmb) - - 0.346 0.397 0.410 Previous EPS (Rmb) - - 0.364 0.449 0.465
Change (%) - - (6.4) 6.6 1.5 Fully diluted P/E (x) 27.4 23.6 17.0 12.1 12.2 CFPS (Rmb) 0.29 0.29 0.44 0.63 0.61 P/CF (x) 20.0 20.0 13.1 9.2 9.5 EV/EBITDA (x) 17.2 15.7 10.8 7.6 7.7 DPS (Rmb) 0.100 0.100 0.139 0.196 0.193 Yield (%) 1.7 1.7 2.4 3.4 3.4 Sources: Company data, BOCI Research estimates
17 January 2011
BUY ( HOLD) 2899.HK – HK$6.80
Target Price: HK$8.40 ( 6.29) H BUY ( HOLD)
601899.SS – Rmb7.51 Target Price: Rmb10.08 ( 7.05) A

17 January 2011 China/Hong Kong Gold Sector 19 THIS DOCUMENT MAY NOT BE DISTRIBUTED IN OR INTO THE PRC.
Share Price vs Index – A shares
456789
1011
15/0
1/10
15/0
2/10
15/0
3/10
15/0
4/10
15/0
5/10
15/0
6/10
15/0
7/10
15/0
8/10
15/0
9/10
15/1
0/10
15/1
1/10
15/1
2/10
15/0
1/11 0
1,0002,0003,0004,0005,0006,0007,000
Zijin Mining Group Co Ltd-A FTSE-Xinhua A50
Turnover (Rmb m)Rmb
Sources: Bloomberg, BOCI Research
Share Price Performance – A shares (%) YTD 1M 3M 12M Absolute (12.1) (14.1) (29.7) (23.2) Relative to FTSE-Xinhua A50
(9.4) (8.6) (15.4) (1.9)
Sources: Bloomberg, BOCI Research
Key Data – A share Total issued shares (m) 14,541 Free float (%) 30 Free float mkt. cap. (Rmb m) 32,762 3M avg. daily turnover (Rmb m) 504 Net debt/equity (%)(2010E) Net cash Sources: Company data, Bloomberg, BOCI Research
Investment Summary - A Year ended 31 Dec 2008 2009 2010E 2011E 2012E Revenue (Rmb m) 16,984 20,956 29,397 32,934 33,004 Change (%) 11 23 40 12 0 Net profit (Rmb m) 3,005 3,541 4,951 7,159 6,980 Fully diluted EPS (Rmb)
0.207 0.244 0.340 0.492 0.480
Change (%) 6.6 17.8 39.8 44.6 (2.5) Consensus EPS (Rmb)
- - 0.359 0.445 0.487
Previous EPS (Rmb)
- - 0.364 0.457 0.471
Change (%) - - (6.4) 7.6 2.0 Fully diluted P/E (x) 36.3 30.8 22.1 15.3 15.6 CFPS (Rmb) 0.28 0.27 0.53 0.66 0.66 P/CF (x) 26.5 27.6 14.3 11.4 11.3 EV/EBITDA (x) 20.6 18.0 12.8 9.3 9.2 DPS (Rmb) 0.100 0.100 0.139 0.196 0.193 Yield (%) 1.3 1.3 1.9 2.6 2.6
Sources: Company data, Bloomberg, BOCI Research
A Laggard in 2010 Bounded by negative news flows surrounding its social and environmental responsibilities in 2010, Zijin’s stock performance significantly lagged behind its peers and HSI. While the gold spot price was up 30%, Zijin returned a ‐3% versus Zhaojin’s +110%, G‐Resources’ +24% and Real Gold’s +21%. While the street has been concerned about Zijin’s organic and acquisition growth, we think higher metal prices this year coupled with stable metal production should translate into a strong year ahead. So far in 2011, the stock is down ‐7%, underperforming Zhaojin’s ‐5% and G‐Resources’ ‐3%. The stock trades at 12x 2011E P/E. We consider the current level attractive after revisiting our model assumptions.
Preferring Zijin on Valuation Grounds Zhaojin was our top buy and returned a significant 110% during 2010. We saw company switching from Zijin to Zhaojin during 2H10 when Zijin’s copper mine leakage was first reported in early July 2010. The switching was evident: Zhaojin’s share price in 2H10 gained 77% versus 16% in 1H10 as investors strove for management with a good track record and execution to leverage on the rising gold price environment. Zhaojin, in our view, is now expensive, trading at 22.4x 2011E P/E or 2.6x P/NAV compared to Zijin’s 12.0x and 1.5x P/NAV. We think investors will gradually switch from Zhaojin to Zijin to look for value and more upside potential. Zijin’s higher exposure to copper (16% in 2011E) is also a major factor for our upgrade.
17 January 2011 China/Hong Kong Gold Sector 20 THIS DOCUMENT MAY NOT BE DISTRIBUTED IN OR INTO THE PRC.
Income Statement — H share (Rmb m) Year ended 31 Dec 2008 2009 2010E 2011E 2012E Revenue 16,322 20,215 29,221 32,758 32,827 Cost of sales (10,329) (13,642) (19,514) (20,014) (20,262) Operating expenses (exclude depreciation & amortisation)
(1,129) (1,127) (1,912) (2,066) (2,318)
EBITDA 4,863 5,445 7,794 10,677 10,248 Depreciation & amortisation (645) (936) (1,010) (1,210) (965) Operating profit (EBIT) 4,218 4,509 6,784 9,467 9,283 Net interest income/(expenses)
(146) (168) (81) (11) 49
Other gains/(losses) 461 705 328 428 428 Pre-tax profit 4,533 5,045 7,030 9,884 9,760 Tax on profit (639) (968) (1,349) (1,897) (1,873) Minority interests (828) (525) (731) (1,028) (1,015) Net profit 3,066 3,552 4,950 6,959 6,872 Core net profit 3,066 3,552 4,950 6,959 6,872 EPS (Rmb) 0.211 0.244 0.340 0.479 0.473 Core EPS (Rmb) 0.211 0.244 0.340 0.479 0.473 DPS (Rmb) 0.100 0.100 0.139 0.196 0.193 Revenue growth (%) 10 24 45 12 0 EBIT growth (%) (2) 7 50 40 (2) EBITDA growth (%) (3) 12 43 37 (4) EPS growth (%) 12 16 39 41 (1) Core EPS growth (%) 12 16 39 41 (1) Sources: Company data, BOCI Research estimates
Balance Sheet — H share (Rmb m) As at 31 Dec 2008 2009 2010E 2011E 2012E Cash & cash equivalents 5,039 4,138 7,658 12,931 17,446 Receivables 1,419 1,523 2,301 2,468 2,473 Inventories 1,594 2,590 3,605 3,800 3,847 Other current assets 0 710 0 0 0 Total current assets 8,052 8,961 13,565 19,198 23,766 Fixed assets 8,259 10,051 11,704 12,946 13,935 Intangible assets 4,440 5,614 6,183 6,723 7,228 Other long term assets 5,466 5,020 5,115 5,211 5,307 Total long-term assets 18,166 20,685 23,002 24,880 26,470 Total assets 26,218 29,646 36,567 44,079 50,236 Creditors 728 957 1,369 1,404 1,422 Short-term debt 2,516 3,458 4,917 6,052 7,010 Other current liabilities 2,415 2,753 3,403 3,651 3,681 Total current liabilities 5,659 7,168 9,690 11,107 12,113 Long-term borrowings 969 407 579 713 826 Other long-term liabilities 410 457 457 457 457 Share capital 1,454 1,454 1,454 1,454 1,454 Reserves 14,681 16,716 20,212 25,145 29,169 Shareholders' equity 16,135 18,171 21,666 26,600 30,623 Minority interests 3,045 3,443 4,174 5,202 6,217 Total liabilities & equity 26,218 29,646 36,567 44,079 50,236 Book value per share (Rmb) 1.11 1.25 1.49 1.83 2.11 Tangible assets per share (Rmb)
0.80 0.86 1.06 1.37 1.61
Net debt/(cash)per share (Rmb) (0.11) (0.02) (0.15) (0.42) (0.66) Sources: Company data, BOCI Research estimates
Cash-flow Statement — H share (Rmb m) Year ended 31 Dec 2008 2009 2010E 2011E 2012E Pre-tax profit 4,533 5,045 7,030 9,884 9,760 Depreciation & amortisation 645 936 1,010 1,210 965 Net interest expenses 146 168 81 11 (49) Change in working capital (684) (899) (365) (79) (5) Tax paid (639) (968) (1,349) (1,897) (1,873) Other operating cash flows 0 (96) 0 0 0 Cash flow from operations 4,001 4,187 6,408 9,129 8,798 Net purchase of fixed assets (5,009) (4,955) (3,137) (2,718) (2,537) Decrease/(increase) in invest. 0 0 0 0 0 Other investing cash flows 0 0 0 0 0 Cash flow from investing (5,009) (4,955) (3,137) (2,718) (2,537) Net increase in equity 0 0 0 0 0 Net increase in debt 2,957 (379) (1,632) (1,268) (1,072) Dividends paid 1,454 (1,454) (1,454) (2,026) (2,849) Other financing cash flows (600) 1,700 3,335 2,156 2,175 Cash flow from financing 3,811 (133) 249 (1,139) (1,745) Change in cash 2,803 (902) 3,520 5,272 4,516 Cash at beginning of year 2,237 5,039 4,138 7,658 12,931 Free cash flow to firm (866) (645) 3,405 6,605 6,536 Free cash flow to equity 1,804 (1,193) 1,558 5,132 5,238 Sources: Company data, BOCI Research estimates
Key Ratios — H share Year ended 31 Dec 2008 2009 2010E 2011E 2012E Profitability (%) EBITDA margin 29.8 26.9 26.7 32.6 31.2 EBIT margin 25.8 22.3 23.2 28.9 28.3 Pre-tax margin 27.8 25.0 24.1 30.2 29.7 Net profit margin 18.8 17.6 16.9 21.2 20.9 Liquidity (x) Current ratio 1.4 1.3 1.4 1.7 2.0 Interest coverage 14.7 26.8 31.6 46.2 41.1 Net debt to equity (%) Net
cash Net cash Net cash Net cash Net cash
Quick ratio 1.1 0.9 1.0 1.4 1.6 Valuation (x) P/E 27.4 23.6 17.0 12.1 12.2 Core P/E 27.4 23.6 17.0 12.1 12.2 Core P/E @ target price 33.8 29.2 20.9 14.9 15.1 P/B 5.2 4.6 3.9 3.2 2.7 P/CF 20.0 20.0 13.1 9.2 9.5 EV/EBITDA 17.2 15.7 10.8 7.6 7.7 Activity ratios Inventory days 46.6 56.0 57.9 67.5 68.9 Accounts receivables days 28.3 26.6 23.9 26.6 27.5 Accounts payables days 14.7 15.2 14.5 15.5 15.7 Returns (%) Dividend payout ratio 47.4 40.9 40.9 40.9 40.9 Return on equity 28.6 20.7 24.9 28.8 24.0 Return on assets 16.8 13.0 16.6 19.0 15.9 Return on capital employed 24.1 18.7 24.3 27.6 23.0 Sources: Company data, BOCI Research estimates
17 January 2011 China/Hong Kong Gold Sector 21 THIS DOCUMENT MAY NOT BE DISTRIBUTED IN OR INTO THE PRC.
Income Statement – A (Rmb m) Year ended 31 Dec 2008 2009 2010E 2011E 2012E Revenue 16,984 20,956 29,397 32,934 33,004 Cost of sales (10,627) (14,156) (19,508) (20,008) (20,255) Operating expenses (exclude depreciation & amortisation)
(974) (552) (1,180) (1,299) (1,267)
Operating profit (EBIT) 5,383 6,247 8,709 11,626 11,481 Depreciation & amortisation (706) (1,215) (750) (920) (957) EBITDA 4,677 5,032 7,959 10,706 10,524 Net interest inc./(expenses) (98) (45) (215) (205) (226) Other gains/(losses) (106) 32 (470) (470) (470) Pre-tax profit 4,472 5,019 7,275 10,031 9,828 Tax on profit (639) (968) (1,349) (1,897) (1,873) Minority interests (828) (509) (975) (975) (975) Net profit 3,005 3,541 4,951 7,159 6,980 Core net profit 3,005 3,541 4,951 7,159 6,980 EPS (Rmb) 0.207 0.244 0.340 0.492 0.480 Core EPS (Rmb) 0.207 0.244 0.340 0.492 0.480 DPS (Rmb) 0.100 0.100 0.139 0.196 0.193 Revenue growth (%) 11 23 40 12 0 EBIT growth (%) (7) 8 58 35 (2) EBITDA growth (%) (5) 16 39 33 (1) EPS growth (%) 7 18 40 45 (2) Core EPS growth (%) 7 18 40 45 (2) Sources: Company data, BOCI Research estimates
Balance Sheet – A (Rmb m) As at 31 Dec 2008 2009 2010E 2011E 2012E Cash & cash equivalents 5,039 4,138 7,658 12,931 17,446 Receivables 1,419 572 2,354 2,621 2,626 Inventories 1,594 2,638 3,705 3,800 3,847 Other current assets 0 1,611 0 0 0 Total current assets 8,052 8,959 13,718 19,351 23,919 Fixed assets 8,259 10,051 11,704 12,946 13,935 Intangible assets 4,440 5,614 6,183 6,723 7,228 Other long term assets 5,466 5,020 4,951 5,047 5,143 Total long-term assets 18,166 20,685 22,838 24,717 26,306 Total assets 26,218 29,644 36,556 44,068 50,226 Creditors 728 978 1,369 1,404 1,422 Short-term debt 2,558 3,341 4,917 6,052 7,010 Other current liabilities 2,373 2,849 3,403 3,651 3,681 Total current liabilities 5,659 7,168 9,690 11,107 12,113 Long-term borrowings 969 407 579 713 826 Other long-term liabilities 410 457 446 446 446 Share capital 1,454 1,454 1,454 1,454 1,454 Reserves 14,681 16,716 20,211 25,146 29,170 Shareholders' equity 16,135 18,170 21,665 26,601 30,624 Minority interests 3,045 3,443 4,174 5,202 6,217 Total liabilities & equity 26,218 29,646 36,555 44,069 50,226 Book value per share (Rmb) 1.11 1.25 1.49 1.83 2.11 Tangible assets per share(Rmb) 0.80 0.86 1.06 1.37 1.61 Net debt/(cash)per share (Rmb) (0.10) (0.03) (0.15) (0.42) (0.66) Sources: Company data, BOCI Research estimates
Cash-flow Statement – A (Rmb m) Year ended 31 Dec 2008 2009 2010E 2011E 2012E Pre-tax profit 4,472 5,019 7,275 10,031 9,828 Depreciation & amortisation 706 1,215 750 920 957 Net interest expenses 98 45 215 205 226 Change in working capital (679) (1,420) 45 (79) (5) Tax paid (639) (968) (1,349) (1,897) (1,873) Other operating cash flows (39) 64 703 436 519 Cash flow from operations 3,919 3,955 7,639 9,617 9,653 Net purchase of fixed assets (5,009) (4,955) (3,189) (2,732) (2,537) Decrease/(increase) in invest. 0 0 0 0 0 Other investing cash flows 0 0 0 0 0 Cash flow from investing (5,009) (4,955) (3,189) (2,732) (2,537) Net increase in equity 0 0 0 0 0 Net increase in debt 2,957 (379) (1,632) (1,268) (1,072) Dividends paid 1,454 (1,454) (1,454) (2,026) (2,849) Other financing cash flows (518) 1,934 2,156 1,683 1,337 Cash flow from financing 3,893 101 (930) (1,612) (2,583) Change in cash 2,803 (900) 3,520 5,273 4,532 Cash at beginning of year 2,236 5,039 4,138 7,658 12,931 Free cash flow to firm (948) (877) 4,583 7,079 7,390 Free cash flow to equity 1,721 (1,425) 2,737 5,606 6,093 Sources: Company data, BOCI Research estimates
Key Ratios – A Year ended 31 Dec 2008 2009 2010E 2011E 2012E Profitability (%) EBITDA margin 31.7 29.8 29.6 35.3 34.8 EBIT margin 27.5 24.0 27.1 32.5 31.9 Pre-tax margin 26.3 23.9 24.7 30.5 29.8 Net profit margin 17.7 16.9 16.8 21.7 21.1 Liquidity (x) Current ratio 1.4 1.2 1.4 1.7 2.0 Interest coverage 47.7 113.0 37.1 52.2 46.6 Net debt to equity (%) Net
cash Net
cash Net
cash Net
cash Net
cash Quick ratio 1.1 0.9 1.0 1.4 1.7 Valuation (x) P/E 36.3 30.8 22.1 15.3 15.6 Core P/E 36.3 30.8 22.1 15.3 15.6 Core P/E @ target price 48.8 41.4 29.6 20.5 21.0 P/B 6.8 6.0 5.0 4.1 3.6 P/CF 26.5 27.6 14.3 11.4 11.3 EV/EBITDA 20.6 18.0 12.8 9.3 9.2 Activity ratios Inventory days 45.3 54.5 59.3 68.5 68.9 Accounts receivables days 27.5 17.3 18.2 27.6 29.0 Accounts payables days 14.2 14.9 14.6 15.4 15.6 Returns (%) Dividend payout ratio 48.4 41.1 40.9 39.8 40.3 Return on equity 28.0 20.6 24.9 29.7 24.4 Return on assets 18.6 14.5 19.6 21.5 18.1 Return on capital employed 25.8 20.9 28.1 30.6 25.3 Sources: Company data, BOCI Research estimates
17 January 2011 China/Hong Kong Gold Sector 22 THIS DOCUMENT MAY NOT BE DISTRIBUTED IN OR INTO THE PRC.
LLIISSTTEEDD CCOOMMPPAANNIIEESS IINN TTHHIISS RREEPPOORRTT
Anglo Gold Ashanti (ANG.SJ/SAR30,450, NR)
Agnico‐Eagle Mines (AEM.US/US$70.59, NR)
Barrick Gold (ABX.CN/C$47.44, NR)
China Gold International Resources (CGG.HK/HK$40.45, BUY)
Centerra Gold (CG.CN/C$17.77, NR)
Goldcorp (G.CN/C$42.07, NR)
Goldenstar Resources (GSS.US/US$3.94, NR)
Gold Fields (GFI.SJ/SAR11,543, NR)
G‐Resources (1051.HK/HK$0.59, BUY)
Iamgold (IAG.US/US$17.87, NR)
Kingsgate Consolidated (KCN.AU/A$10.59, NR)
Newcrest (NCM.AU/A$38.29, NR)
Newmont Mining (NEM.US/US$56.81, NR)
OZ Minerals (OXR.AU/A$1.73, NR)
Real Gold (0246.HK/HK$13.06, BUY)
Shandong Gold Mining (600547.SS/Rmb46.88, BUY)
Zhaojin Mining (1818.HK/HK$32.40, HOLD)
Zhongjin Gold (600489.SS/Rmb36.04, NR)
Zijin Mining (2899.HK/HK$6.80; 601899.SS/Rmb7.51, BUY)
Prices as of 14 January 2011 All figures subject to rounding NB: BUY = ≥ +10% compared with the relevant benchmark index over a 6-month period; SELL = ≤ -10% compared with the relevant benchmark index over a 6-month period; HOLD = ≤ +10% and ≥ -10% compared with the relevant benchmark index over a 6-month period; Not Rated (NR)
17 January 2011 China/Hong Kong Gold Sector 23 THIS DOCUMENT MAY NOT BE DISTRIBUTED IN OR INTO THE PRC.
DISCLOSURE
The views expressed in this report accurately reflect the personal views of the analysts. Each analyst declares that neither he/she nor his/her associate serves as an officer of nor has any financial interests in relation to the listed corporation reviewed by the analyst. None of the listed corporations reviewed or any third party has provided or agreed to provide any compensation or other benefits in connection with this report to any of the analysts, BOCI Research Limited and BOCI Group. Member companies of BOCI Group confirm that they, whether individually or as a group (i) do not own 1% or more financial interests in any of the listed corporations reviewed; (ii) are not involved in any market‐making activities for any of the listed corporations reviewed; (iii) do not have any individual employed by or associated with any member companies of BOCI Group serving as an officer of any of the listed corporations reviewed; and (iv) have not had any investment banking relationships with any of the listed corporations reviewed within the preceding 12 months.
This disclosure statement is made pursuant to paragraph 16 of the “Code of Conduct for Persons Licensed by or Registered with the Securities and Futures Commission” and is updated as of 13 January 2011. Waiver has been obtained by BOC International Holdings Limited from the Securities and Futures Commission of Hong Kong to disclose any interest the Bank of China Group may have in this research report.
This report was originally prepared and issued by BOCI Research Limited for distribution to their professional, accredited and institutional investor customers. It is not directed to, or intended for distribution to or use by, any person or entity who is a citizen or resident of or located in any locality, state, country or other jurisdiction where such distribution, publication, availability or use would be contrary to law or regulation or which would subject BOCI Research Limited, BOC International Holdings Limited and its subsidiaries and affiliates (collectively “BOCI Group”) to any registration or licensing requirement within such jurisdictions. None of the material, nor its contents, nor any copy of it, may be altered in any way, transmitted to, copied or distributed to any other party, without the prior express written permission of BOCI Group. All trademarks, service marks and logos used in this report are trademarks or service marks or registered trademarks or service marks of BOCI Group. The information, tools and material presented in this report are provided to you for information purposes only and shall not be used or considered as an offer or the solicitation of an offer to sell or to buy or subscribe for securities or other financial instruments. BOCI Group may not have taken any steps to ensure that the securities referred to in this report are suitable for any particular investor. The contents of this report do not constitute investment advice to any person and such person shall not be treated as a customer of BOCI Group by virtue of receiving this report. Information and opinions presented in this report have been obtained or derived from sources believed by BOCI Group to be reliable, but BOCI Group makes no representation as to their accuracy or completeness and BOCI Group accepts no liability for loss arising from the use of the material presented in this report unless such liability arises under specific statutes or regulations. This report is not to be relied upon in substitution for the exercise of independent judgment. BOCI Group may have issued other reports that are inconsistent with, and reach different conclusions from, the information presented in this report. The reports reflect the different assumptions, views and analytical methods of the analysts who prepared them. For the avoidance of doubt, views expressed in this report do not necessarily represent those of BOCI Group. This report may provide the addresses of, or contain hyperlinks to, various websites. To the extent that this report refers to material outside BOCI Group’s own website, BOCI Group has not reviewed the linked sites and takes no responsibility for the content contained therein. Such address or hyperlink (including addresses or hyperlinks to BOCI Group’s own website material) is provided solely for your convenience and information and the content of the linked sites does not in any way form part of this report. Accessing such websites shall be at your own risk. BOCI Group may, to the extent permitted by law, participate or invest in financing transactions with the issuer(s) of the securities referred to in this report, perform services for or solicit business from such issuers, and/or have a position or effect transactions in the securities or other financial instruments thereon. BOCI Group may, to the extent permitted by law, act upon or use the information or opinions presented herein, or the research or analysis on which they are based, before the material is published. BOCI Group and the analysts preparing this report (each an “analyst” and collectively the “analysts”) may have relationships with, financial interests in or business relationships with any or all of the companies mentioned in this report (each a “listed corporation” and collectively the “listed corporations”). See “Disclosure”. Information, opinions and estimates are provided on an “as in” basis without warranty of any kind and may be changed at any time without prior notice. Nothing in this report constitutes investment, legal, accounting or tax advice nor a representation that any investment or strategy is suitable or appropriate to your individual circumstances. Nothing in this report constitutes a personal recommendation to you. This report has been prepared and issued by BOCI Research Limited. This information is confidential and is intended solely for the use of its recipient. This report is distributed in Hong Kong by BOCI Research Limited and BOCI Securities Limited; in Singapore by BOC International (Singapore) Pte. Limited.; and in the United Kingdom by Bank of China International (UK) Limited. This information may only be issued or passed on to any person in the United Kingdom if that person is of a kind described in Article 19 of the Financial Services and Markets Act 2000 (Financial Promotions) Order 2001 or otherwise pursuant to exemptions to section 21 of the Financial Services and Markets Act 2000. In addition, no person who is an Authorised Person may issue or pass on this information, or otherwise promote BOCI Group, to any person in the United Kingdom other than under the rules of the Financial Services Authority (FSA) applicable to such Authorised Persons. This information may only be issued or passed on to any person in the United Kingdom if that person is of a kind described in Article 19 of the Financial Services and Markets Act 2000 (Financial Promotions) Order 2001 or otherwise pursuant to exemptions to section 21 of the Financial Services and Markets Act 2000. In addition, no person who is an Authorised Person may issue or pass on this information, or otherwise promote BOCI Group, to any person in the United Kingdom other than under the rules of the Financial Services Authority (FSA) applicable to such Authorised Persons. This report and any information, material and contents herein are intended for general circulation only and do not take into account the specific investment objectives, financial situation or particular needs or any particular person. This report and any information, material and contents herein are intended for general circulation only and do not take into account the specific investment objectives, financial situation or particular needs or any particular person. The investment(s) mentioned in this report may not be suitable for all investors and a person receiving or reading this report should seek advice from a financial adviser regarding the suitability of such investment(s), taking into account the specific investment objectives, financial situation or particular needs of that person, before making a commitment to purchase any of such investment(s). The suitablity of any particular investment or strategy whether opined on, described in or referred to in this report or otherwise will depend on a person’s individual circumstances and objectives and should be confirmed by such person with his advisers independently before adoption or implementation thereof (either as is or is varied). Without prejudice to any of the foregoing disclaimers, to the extent that the reader is an accredited or expert investor as defined in Regulation 2 of the Financial Advisers Regulations (“FAR”) of the Financial Advisers Act (Cap. 110) of Singapore (“FAA”), BOC International (Singapore) Pte Limited is in any event exempted (i) by Regulation 34 of the FAR from the requirement to have a reasonable basis for making any recommendation as mandated under Section 27 of the FAA, and (ii) by Regulation 35 of the FAR from the requirements in Section 36 of the FAA mandating disclosure of any interests in securities mentioned in this report, or in their acquisition or disposal, that it or its associated or connected persons may have. The recipient of the analysis or report should contact BOCI in Singapore if they have any queries as to the report/analysis. Copyright 2011 BOCI Research Limited, BOC International Holdings Limited and its subsidiaries and affiliates. All rights reserved.
20/F, Bank of China Tower 1 Garden Road Hong Kong Tel: (852) 2867 6333 Fax: (852) 2147 9513 Toll free numbers to Hong Kong: China North: 10800 8521065 China South: 10800 1521065 Singapore: 800 852 3392 BOCI Securities Limited 20/F, Bank of China Tower 1 Garden Road Hong Kong Tel: (852) 2867 6333 Fax: (852) 2147 9513 BOC International (UK) Limited 90 Cannon Street London EC4N 6HA United Kingdom Tel: (4420) 7022 8888 Fax: (4420) 7022 8877 BOC International (USA) Inc. Room 202, 1270 Avenue of the Americas New York, NY, 10020, USA Tel: (1) 212 259 0888 Fax: (1) 212 259 0889 BOC International (Singapore) Pte. Limited. Reg. No. 199303046Z 4 Battery Road 4/F Bank of China Building Singapore 049908 Tel: (65) 6412 8856 / 6412 8630 Fax: (65) 6534 3996 / 6532 3371 BOC International (China) Limited 39/F Bank of China Tower 200 Yincheng Zhong Road Shanghai Pudong District 200121 China Tel: (8621) 6860 4866 Fax: (8621) 5888 3554 BOC International Holdings Limited Representative Office 15/F, Tower 2 Yingtai Business Center No.28 Finance Street, Xicheng District Beijing 100032, China Tel: (8610) 6622 9000 Fax: (8610) 6657 8950