Embed Size (px)
Citation preview
164 IEEE TRANSACTIONS ON MEDICAL IMAGING, VOL. 31, NO. 2, FEBRUARY 2012
Joint Modeling of Anatomical and FunctionalConnectivity for Population Studies
Archana Venkataraman*, Yogesh Rathi, Marek Kubicki, Carl-Fredrik Westin, and Polina Golland
Abstract—We propose a novel probabilistic framework to mergeinformation from diffusion weighted imaging tractography andresting-state functional magnetic resonance imaging correlationsto identify connectivity patterns in the brain. In particular, wemodel the interaction between latent anatomical and functionalconnectivity and present an intuitive extension to populationstudies. We employ the EM algorithm to estimate the modelparameters by maximizing the data likelihood. The method si-multaneously infers the templates of latent connectivity for eachpopulation and the differences in connectivity between the groups.We demonstrate our method on a schizophrenia study. Our modelidentifies significant increases in functional connectivity betweenthe parietal/posterior cingulate region and the frontal lobe andreduced functional connectivity between the parietal/posteriorcingulate region and the temporal lobe in schizophrenia. Wefurther establish that our model learns predictive differencesbetween the control and clinical populations, and that combiningthe two modalities yields better results than considering each onein isolation.
Index Terms—Biomedical imaging, brain modeling, magneticresonance imaging (MRI), population analysis.
I. INTRODUCTION
T HE INTERACTION between anatomical and functionalimaging modalities offers a rich framework for under-
standing the effects of neuropsychiatric disorders. Specifically,correlations present in resting-state functional magnetic reso-nance imaging (fMRI) data are believed to reflect the intrinsicfunctional connectivity of the brain [1], [2]. Similarly, diffusionweighted imaging (DWI) tractography is used to estimate theunderlying white matter fibers and provides valuable informa-tion about anatomical connectivity within the brain [3]. To date,relatively little progress has been made on combining informa-
Manuscript received June 16, 2011; revised August 11, 2011; accepted Au-gust 15, 2011. Date of publication August 30, 2011; date of current versionFebruary 03, 2012. This work was supported in part by the National Alliancefor Medical Image Analysis (NIH NIBIB NAMIC U54-EB005149), in part bythe Neuroimaging Analysis Center (NIH NCRR NAC P41-RR13218), in partby the NSF CAREER Grant 0642971, and in part by NIH R01MH074794. A.Venkataraman was supported by the National Defense Science and EngineeringGraduate Fellowship (NDSEG). Asterisk indicates corresponding author.*A. Venkataraman is with the Computer Science and Artificial Intelligence
Laboratory, Massachusetts Institute of Technology, Cambridge, MA 02139USA.C.-F. Westin is with the Computer Science and Artificial Intelligence Labo-
ratory, Massachusetts Institute of Technology, Cambridge, MA 02139 USA andalso with the Laboratory for Mathematics Imaging, Harvard Medical School,Boston, MA 02215 USA.Y. Rathi and M. Kubicki are with the Psychiatry Neuroimaging Laboratory,
Harvard Medical School, Boston, MA 02215 USA.P. Golland is with the Computer Science and Artificial Intelligence Labora-
tory, Massachusetts Institute of Technology, Cambridge, MA 02139 USA.Digital Object Identifier 10.1109/TMI.2011.2166083
tion from these imaging modalities. Prior analysis has focusedon correspondences between independently computed statisticsof fMRI and DWI data [4]–[7]. Clinical studies typically iden-tify significant population differences separately within eachmodality and compare them a posteriori [8], [9].In this work, we propose and demonstrate a novel proba-
bilistic framework to infer the relationship between resting-statefMRI and DWI tractography. In particular, we introduce the no-tion of latent anatomical and functional connectivity betweenbrain regions. These variables represent an underlying processin the brain which cannot be observed directly from the data.The resulting model describes how the latent connectivity dif-fers between two populations and makes intuitive assumptionsabout the fMRI and DWI image generation process to constructthe data likelihood. Our fMRI/DWI observation model is sharedacross subjects. Hence, we assume that the effects of a disordercan be explained via changes in latent anatomical and functionalconnectivity. To the best of our knowledge, ours is the first sto-chastic model to combine resting-state fMRI and DWI data inorder to infer changes induced by a neurological disease.We employ the EM algorithm to efficiently estimate tem-
plates of latent connectivity for each population and to iden-tify group differences. The EM algorithm optimizes the modelparameters by maximizing the data likelihood. We employ per-mutation tests and cross validation to verify the robustness ofour method. We perform an extensive evaluation of the modelon synthetic data. In addition, we learn stable patterns of inter-action in a population study of schizophrenia.Schizophrenia is a poorly-understood disorder marked
by widespread cognitive difficulties affecting intelligence,memory, and executive attention. These impairments are notlocalized to a particular cortical region, but rather, they reflectabnormalities in widely-distributed functional and anatomicalnetworks [10], [11]. Accordingly, our model identifies connec-tivity differences dispersed throughout the brain. This paperextends our prior work presented at the International Confer-ence on Medical Image Computing and Computer AssistedIntervention [12] by providing more detailed derivations ofthe model and estimation procedure and by including moreexperimental evaluation of the methods.The remainder of this paper is organized as follows. Section II
summarizes prior research on joint modeling of fMRI and DWIdata. We also review clinical findings of schizophrenia in thissection. We introduce our generative model in Section III anddevelop the corresponding inference algorithm in Section IV.Section V presents the framework used for the empirical val-idation of our approach. Sections VI and VII report experi-mental results based on synthetic and clinical data, respectively.
0278-0062/$26.00 © 2011 IEEE
VENKATARAMAN et al.: JOINT MODELING OF ANATOMICAL AND FUNCTIONAL CONNECTIVITY FOR POPULATION STUDIES 165
Section VIII discusses the behavior of our model, its advantagesand drawbacks, and future directions of research. We concludewith a summary of contributions in Section IX.
II. BACKGROUND AND RELATED WORK
A. Multimodal Analysis in the Brain
Both DWI and fMRI have recently gained popularity as non-invasive imaging tools useful for the study of the brain and theeffects of neurological diseases. DWI captures the anisotropicdiffusion of water throughout the brain and is often used to esti-mate white matter bundles via tractography. Common measuresof anatomical connectivity include the probability of diffusionbetween two brain regions, the number of fibers linking two re-gions, and the mean fractional anisotropy (FA) along the tracts[3]. fMRI studies can be divided into two broad categories. Task-based studies measure the response to a given experimental par-adigm in order to localize brain functionality [13]. In contrast,resting-state fMRI measures spontaneous, low-frequency os-cillations. Correlations within these signals reflect the intrinsicfunctional connectivity between brain regions [1], [2].Early work in multimodal analysis focused on the relation-
ship between task fMRI activations and the underlying anatomy.One popular technique is to use regions of fMRI activation asseed points for tractography [14]–[16]. Another approach is toquantify the relationship between anatomical connectivity andmeasures of functional co-activation in predefined regions of in-terest [17], [18].Presently, the focus has shifted to resting-state fMRI for
joint analysis [19]. Studies commonly compute statistics of thefMRI and DWI signals (such as fMRI correlations, fractionalanisotropy values, etc.) and search for correspondences betweenthese metrics a posteriori [4], [5], [20]. A notable exception isthe recently demonstrated approach in [6] where the authorsconstruct cortical connection graphs based on histological dataof the macaw brain and simulate the corresponding functionalcorrelations using a dynamical system to model the interactionswithin the graph. Although promising, this analysis has notbeen replicated using DWI data in humans.The above methods have yielded many insights into the na-
ture of connectivity in the brain. For example, fMRI-guidedtractography has improved the mapping of the motor, visual andlanguage areas [14]–[16]. It has also been established that whilea high degree of anatomical connectivity predicts higher func-tional correlations, the converse does not always hold [4], [20].For example, strong functional correlations can be found be-tween spatially distributed locations in the brain, whereas oneis more likely to identify white matter tracts connecting nearbyregions.The main limitation of the prior works in joint fMRI/DWI
modeling is an artificial separation between the modalities. Theanalysis is largely performed on the individual modalities, andinformation is later pooled into a joint representation. In con-trast, we assume that the structure and organization of the brainis captured by some underlying generative process. The fMRI
and DWI measures are conditionally independent given the de-tails of this latent process. We use bothmodalities to infer popu-lation templates of connectivity and demonstrate that our modelcaptures stable patterns of connectivity.
B. Population Studies
Univariate tests and random effects analysis are, to a greatextent, the standard in population studies of connectivity[21]–[24]. In this case, significantly different connections areidentified using a statistical score that is computed indepen-dently for each functional correlation or DWI measure.Prior work has also explored multi-pattern analysis for func-
tional connectivity. Specifically, group independent componentanalysis (gICA) has been used to represent the data as a set ofspatially-independent regions with associated time courses [25],[26]. In [25], group functional connectivity is computed as themaximum lagged correlation between the detected time courses,and two-sample t-tests are employed to identify significant pop-ulation differences. In [26], a neural network is constructed forpatient classification of first-episode schizophrenia.Our work focuses on a population study of schizophrenia,
as several of its clinical symptoms may be linked to abbera-tions in connectivity [27]. Relatively few studies to date havecombined resting-state fMRI and DWI tractography to analyzeschizophrenia [8], [9]. Univariate statistical tests are commonlyused to identify significant population differences in bothtemporal correlations and in mean Fractional Anisotrophy (FA)values. The relevant connections are then compared acrossmodalities. This approach treats functional and structuralconnections as independent and ignores distributed patternsof connectivity. In contrast, we jointly infer the network offunctional and anatomical connectivity.
C. Schizophrenia: Findings and Hypotheses
Schizophrenia is a neuropsychiatric disorder characterizedby gross distortions in the perception of reality. Despite gen-erating considerable interest in the neuroscience community,the origins and expression of the disease are still poorly under-stood [28]. For example, structural findings only weakly and in-consistently correlate with the clinical and cognitive symptomsof schizophrenia [29]. Similarly, functional experiments reportdeficits in many cognitive domains, most notably memory andattention, but do not consistently report clinical correlates [30].At present, the cognitive impairments of schizophrenia are
believed to reflect underlying abnormalities in distributed brainnetworks. In particular, schizophrenia may compromise neuralcommunication between cortical regions [27]. Recent studieshave also focused on the degeneration of anatomical connec-tivity [24], fueled in part by postmortem and genetic evidenceof myelination anomalies in patients with schizophrenia.Findings from resting-state fMRI data include reduced
connectivity in the brain’s default network [31], [32], dorso-lateral prefrontal cortex [23] and a widespread reduction inconnectivity throughout the brain [22]. In contrast, althoughthe majority of DWI studies report white matter abnormalities,there is no consensus on the location and nature of thesechanges [24], [33]. The most commonly reported anoma-lies are between frontal and temporal lobes and between the
166 IEEE TRANSACTIONS ON MEDICAL IMAGING, VOL. 31, NO. 2, FEBRUARY 2012
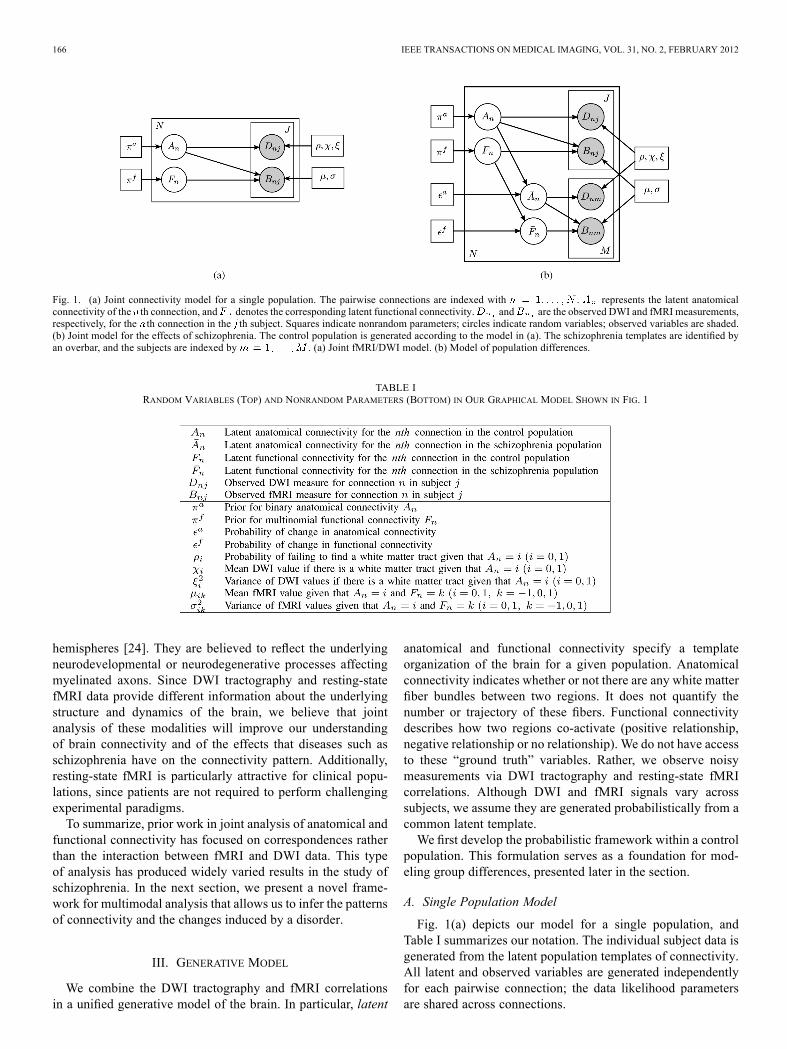
Fig. 1. (a) Joint connectivity model for a single population. The pairwise connections are indexed with . represents the latent anatomicalconnectivity of the th connection, and denotes the corresponding latent functional connectivity. and are the observed DWI and fMRI measurements,respectively, for the th connection in the th subject. Squares indicate nonrandom parameters; circles indicate random variables; observed variables are shaded.(b) Joint model for the effects of schizophrenia. The control population is generated according to the model in (a). The schizophrenia templates are identified byan overbar, and the subjects are indexed by . (a) Joint fMRI/DWI model. (b) Model of population differences.
TABLE IRANDOM VARIABLES (TOP) AND NONRANDOM PARAMETERS (BOTTOM) IN OUR GRAPHICAL MODEL SHOWN IN FIG. 1
hemispheres [24]. They are believed to reflect the underlyingneurodevelopmental or neurodegenerative processes affectingmyelinated axons. Since DWI tractography and resting-statefMRI data provide different information about the underlyingstructure and dynamics of the brain, we believe that jointanalysis of these modalities will improve our understandingof brain connectivity and of the effects that diseases such asschizophrenia have on the connectivity pattern. Additionally,resting-state fMRI is particularly attractive for clinical popu-lations, since patients are not required to perform challengingexperimental paradigms.To summarize, prior work in joint analysis of anatomical and
functional connectivity has focused on correspondences ratherthan the interaction between fMRI and DWI data. This typeof analysis has produced widely varied results in the study ofschizophrenia. In the next section, we present a novel frame-work for multimodal analysis that allows us to infer the patternsof connectivity and the changes induced by a disorder.
III. GENERATIVE MODEL
We combine the DWI tractography and fMRI correlationsin a unified generative model of the brain. In particular, latent
anatomical and functional connectivity specify a templateorganization of the brain for a given population. Anatomicalconnectivity indicates whether or not there are any white matterfiber bundles between two regions. It does not quantify thenumber or trajectory of these fibers. Functional connectivitydescribes how two regions co-activate (positive relationship,negative relationship or no relationship). We do not have accessto these “ground truth” variables. Rather, we observe noisymeasurements via DWI tractography and resting-state fMRIcorrelations. Although DWI and fMRI signals vary acrosssubjects, we assume they are generated probabilistically from acommon latent template.We first develop the probabilistic framework within a control
population. This formulation serves as a foundation for mod-eling group differences, presented later in the section.
A. Single Population Model
Fig. 1(a) depicts our model for a single population, andTable I summarizes our notation. The individual subject data isgenerated from the latent population templates of connectivity.All latent and observed variables are generated independentlyfor each pairwise connection; the data likelihood parametersare shared across connections.
VENKATARAMAN et al.: JOINT MODELING OF ANATOMICAL AND FUNCTIONAL CONNECTIVITY FOR POPULATION STUDIES 167
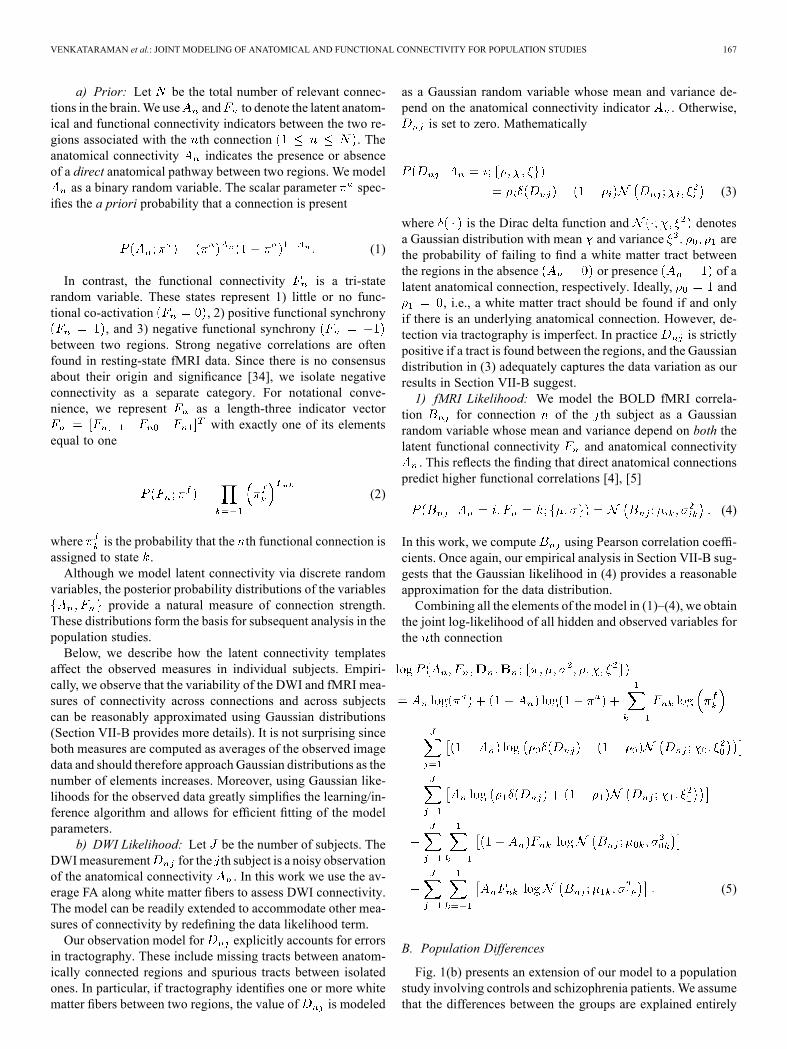
a) Prior: Let be the total number of relevant connec-tions in the brain.We use and to denote the latent anatom-ical and functional connectivity indicators between the two re-gions associated with the th connection . Theanatomical connectivity indicates the presence or absenceof a direct anatomical pathway between two regions. We model
as a binary random variable. The scalar parameter spec-ifies the a priori probability that a connection is present
(1)
In contrast, the functional connectivity is a tri-staterandom variable. These states represent 1) little or no func-tional co-activation , 2) positive functional synchrony
, and 3) negative functional synchronybetween two regions. Strong negative correlations are oftenfound in resting-state fMRI data. Since there is no consensusabout their origin and significance [34], we isolate negativeconnectivity as a separate category. For notational conve-nience, we represent as a length-three indicator vector
with exactly one of its elementsequal to one
(2)
where is the probability that the th functional connection isassigned to state .Although we model latent connectivity via discrete random
variables, the posterior probability distributions of the variablesprovide a natural measure of connection strength.
These distributions form the basis for subsequent analysis in thepopulation studies.Below, we describe how the latent connectivity templates
affect the observed measures in individual subjects. Empiri-cally, we observe that the variability of the DWI and fMRI mea-sures of connectivity across connections and across subjectscan be reasonably approximated using Gaussian distributions(Section VII-B provides more details). It is not surprising sinceboth measures are computed as averages of the observed imagedata and should therefore approach Gaussian distributions as thenumber of elements increases. Moreover, using Gaussian like-lihoods for the observed data greatly simplifies the learning/in-ference algorithm and allows for efficient fitting of the modelparameters.
b) DWI Likelihood: Let be the number of subjects. TheDWImeasurement for the th subject is a noisy observationof the anatomical connectivity . In this work we use the av-erage FA along white matter fibers to assess DWI connectivity.The model can be readily extended to accommodate other mea-sures of connectivity by redefining the data likelihood term.Our observation model for explicitly accounts for errors
in tractography. These include missing tracts between anatom-ically connected regions and spurious tracts between isolatedones. In particular, if tractography identifies one or more whitematter fibers between two regions, the value of is modeled
as a Gaussian random variable whose mean and variance de-pend on the anatomical connectivity indicator . Otherwise,
is set to zero. Mathematically
(3)
where is the Dirac delta function and denotesa Gaussian distribution with mean and variance . arethe probability of failing to find a white matter tract betweenthe regions in the absence or presence of alatent anatomical connection, respectively. Ideally, and
, i.e., a white matter tract should be found if and onlyif there is an underlying anatomical connection. However, de-tection via tractography is imperfect. In practice is strictlypositive if a tract is found between the regions, and the Gaussiandistribution in (3) adequately captures the data variation as ourresults in Section VII-B suggest.1) fMRI Likelihood: We model the BOLD fMRI correla-
tion for connection of the th subject as a Gaussianrandom variable whose mean and variance depend on both thelatent functional connectivity and anatomical connectivity. This reflects the finding that direct anatomical connections
predict higher functional correlations [4], [5]
(4)
In this work, we compute using Pearson correlation coeffi-cients. Once again, our empirical analysis in Section VII-B sug-gests that the Gaussian likelihood in (4) provides a reasonableapproximation for the data distribution.Combining all the elements of the model in (1)–(4), we obtain
the joint log-likelihood of all hidden and observed variables forthe th connection
(5)
B. Population Differences
Fig. 1(b) presents an extension of our model to a populationstudy involving controls and schizophrenia patients. We assumethat the differences between the groups are explained entirely
168 IEEE TRANSACTIONS ON MEDICAL IMAGING, VOL. 31, NO. 2, FEBRUARY 2012
by changes in latent connectivity and that the two populationsshare the same data likelihood model.In particular, we assume the model in Fig. 1(a) for the control
population and treat the latent connectivity templateof the schizophrenia population as a “corrupted” version of thehealthy template. In particular, with (small) probability, eachconnection can switch its state
(6)
(7)
Rather than parameterizing all possible connectivity differ-ences, we rely on scalars and to govern the probability ofchange within each modality. For binary random variablesand , this implies that the probability of change in anatom-ical connectivity does not depend on the value of . A similarproperty holds for the tri-state random variables and . Ad-ditionally, (7) assumes that functional connectivity switches toits other two states with equal probability. Empirically, our re-sults are more robust using (6) and (7) than if we infer all tran-sition probabilities for each modality.
IV. ALGORITHMS
We employ the maximum likelihood (ML) framework to es-timate the model parameters
(8)
where is the set of model parameters.for the single-population model;
for the model of populationdifferences.We derive the expectation-maximization (EM) algorithm [35]
for fitting the models. The EM algorithm constructs the jointposterior of all hidden variables, which is later used to inferpopulation differences. The total number of model parametersis small. In particular, the posterior distribution can be com-puted directly from the observed data and the model parameters
. Since these parameters are shared acrossconnections and across subjects, the solution is based on a smallset of unknown values.
A. Single Population Model
We use and to denote thehidden and observed variables, respectively, associated with theth connection.Since is a binary random variable and is a tri-state
random variable, the latent vector assumes one of six dis-tinct values. The EM algorithm iterates between estimating theposterior probability of the hidden variables and estimating
the model parameters . Due to the independence of pairwiseconnections, this problem reduces to a standard mixture modelwith six components.For notational simplicity, we index the six states of using
a set . We construct the associated prior distributionand data likelihood by eval-
uating (1)–(4). In particular, if the index l denotes the latent as-signment
Independence across pairwise connections gives rise to asimple sum in the log-likelihood of the observed and hiddenvariables
(9)
E-Step: We fix the model parameter estimates and update theposterior probability estimates of the latent variables
(10)
M-Step: We fix the posterior probability estimatesand update the model parameter estimates . Givena guess of the parameters from the previous itera-tion, we construct a lower bound to the log-likelihood
. With some al-gebraic manipulation, we obtain
(11)
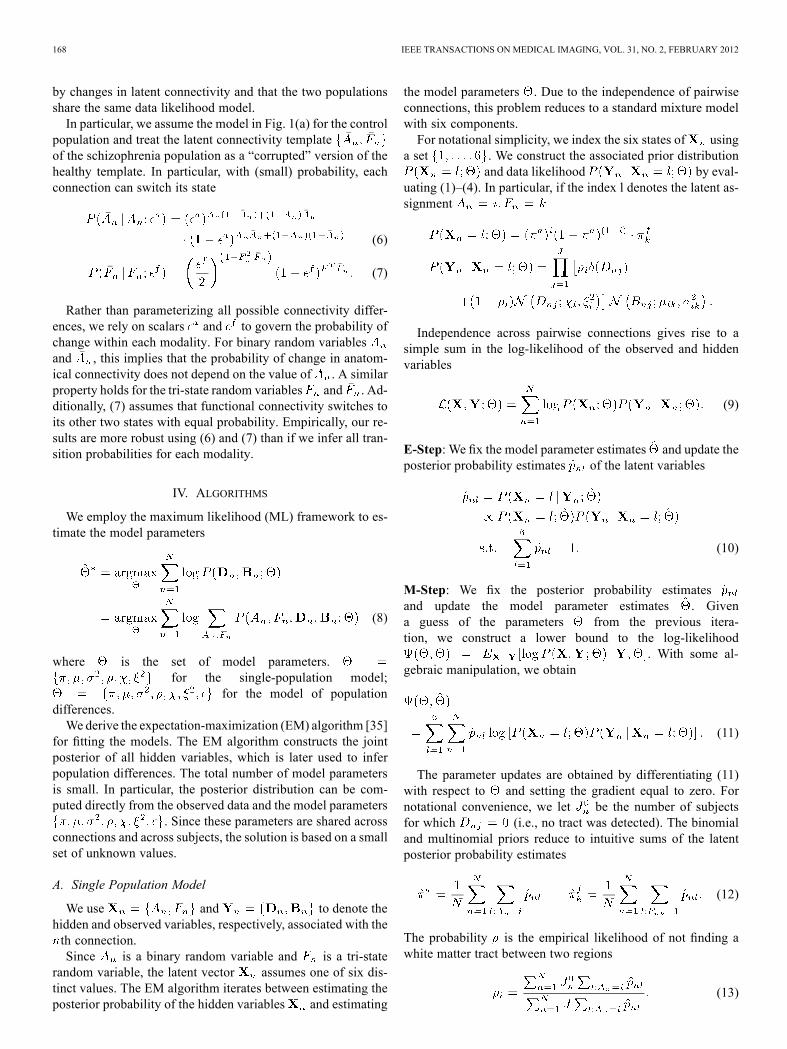
The parameter updates are obtained by differentiating (11)with respect to and setting the gradient equal to zero. Fornotational convenience, we let be the number of subjectsfor which (i.e., no tract was detected). The binomialand multinomial priors reduce to intuitive sums of the latentposterior probability estimates
(12)
The probability is the empirical likelihood of not finding awhite matter tract between two regions
(13)
VENKATARAMAN et al.: JOINT MODELING OF ANATOMICAL AND FUNCTIONAL CONNECTIVITY FOR POPULATION STUDIES 169
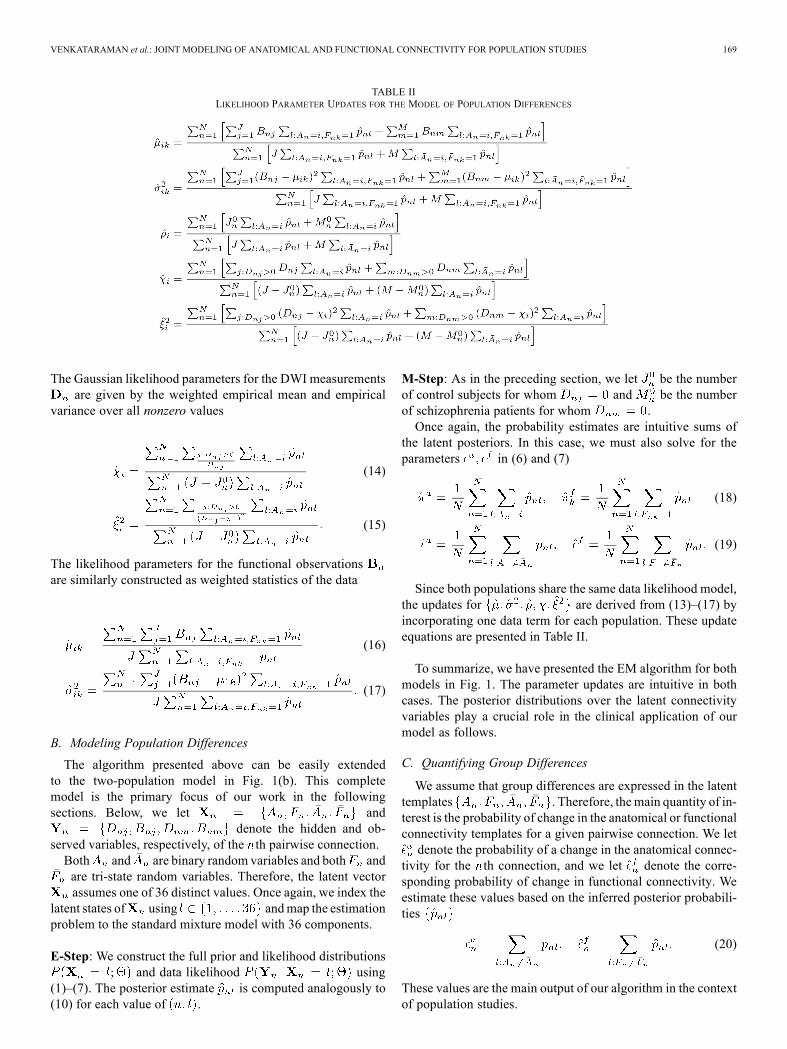
TABLE IILIKELIHOOD PARAMETER UPDATES FOR THE MODEL OF POPULATION DIFFERENCES
The Gaussian likelihood parameters for the DWI measurementsare given by the weighted empirical mean and empirical
variance over all nonzero values
(14)
(15)
The likelihood parameters for the functional observationsare similarly constructed as weighted statistics of the data
(16)
(17)
B. Modeling Population Differences
The algorithm presented above can be easily extendedto the two-population model in Fig. 1(b). This completemodel is the primary focus of our work in the followingsections. Below, we let and
denote the hidden and ob-served variables, respectively, of the th pairwise connection.Both and are binary random variables and both andare tri-state random variables. Therefore, the latent vectorassumes one of 36 distinct values. Once again, we index the
latent states of using andmap the estimationproblem to the standard mixture model with 36 components.
E-Step: We construct the full prior and likelihood distributionsand data likelihood using
(1)–(7). The posterior estimate is computed analogously to(10) for each value of .
M-Step: As in the preceding section, we let be the numberof control subjects for whom and be the numberof schizophrenia patients for whom .Once again, the probability estimates are intuitive sums of
the latent posteriors. In this case, we must also solve for theparameters in (6) and (7)
(18)
(19)
Since both populations share the same data likelihood model,the updates for are derived from (13)–(17) byincorporating one data term for each population. These updateequations are presented in Table II.
To summarize, we have presented the EM algorithm for bothmodels in Fig. 1. The parameter updates are intuitive in bothcases. The posterior distributions over the latent connectivityvariables play a crucial role in the clinical application of ourmodel as follows.
C. Quantifying Group Differences
We assume that group differences are expressed in the latenttemplates . Therefore, themain quantity of in-terest is the probability of change in the anatomical or functionalconnectivity templates for a given pairwise connection. We letdenote the probability of a change in the anatomical connec-
tivity for the th connection, and we let denote the corre-sponding probability of change in functional connectivity. Weestimate these values based on the inferred posterior probabili-ties
(20)
These values are the main output of our algorithm in the contextof population studies.
170 IEEE TRANSACTIONS ON MEDICAL IMAGING, VOL. 31, NO. 2, FEBRUARY 2012
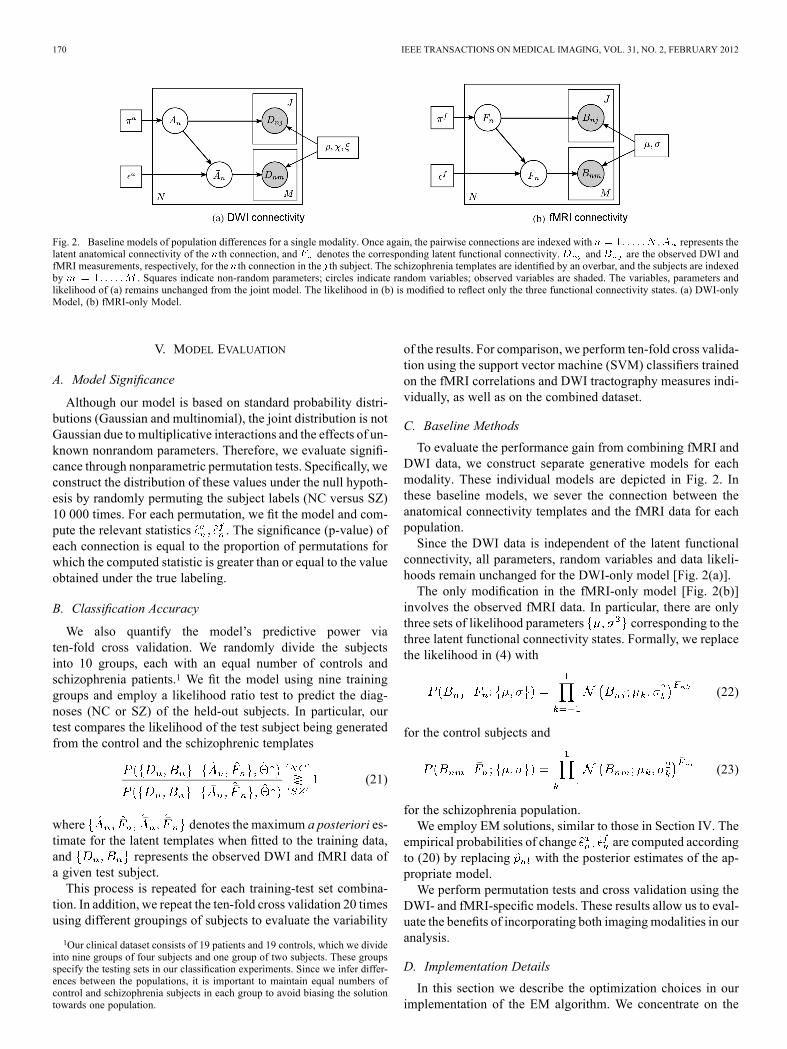
Fig. 2. Baseline models of population differences for a single modality. Once again, the pairwise connections are indexed with . represents thelatent anatomical connectivity of the th connection, and denotes the corresponding latent functional connectivity. and are the observed DWI andfMRI measurements, respectively, for the th connection in the th subject. The schizophrenia templates are identified by an overbar, and the subjects are indexedby . Squares indicate non-random parameters; circles indicate random variables; observed variables are shaded. The variables, parameters andlikelihood of (a) remains unchanged from the joint model. The likelihood in (b) is modified to reflect only the three functional connectivity states. (a) DWI-onlyModel, (b) fMRI-only Model.
V. MODEL EVALUATION
A. Model Significance
Although our model is based on standard probability distri-butions (Gaussian and multinomial), the joint distribution is notGaussian due to multiplicative interactions and the effects of un-known nonrandom parameters. Therefore, we evaluate signifi-cance through nonparametric permutation tests. Specifically, weconstruct the distribution of these values under the null hypoth-esis by randomly permuting the subject labels (NC versus SZ)10 000 times. For each permutation, we fit the model and com-pute the relevant statistics . The significance (p-value) ofeach connection is equal to the proportion of permutations forwhich the computed statistic is greater than or equal to the valueobtained under the true labeling.
B. Classification Accuracy
We also quantify the model’s predictive power viaten-fold cross validation. We randomly divide the subjectsinto 10 groups, each with an equal number of controls andschizophrenia patients.1 We fit the model using nine traininggroups and employ a likelihood ratio test to predict the diag-noses (NC or SZ) of the held-out subjects. In particular, ourtest compares the likelihood of the test subject being generatedfrom the control and the schizophrenic templates
(21)
where denotes the maximum a posteriori es-timate for the latent templates when fitted to the training data,and represents the observed DWI and fMRI data ofa given test subject.This process is repeated for each training-test set combina-
tion. In addition, we repeat the ten-fold cross validation 20 timesusing different groupings of subjects to evaluate the variability
1Our clinical dataset consists of 19 patients and 19 controls, which we divideinto nine groups of four subjects and one group of two subjects. These groupsspecify the testing sets in our classification experiments. Since we infer differ-ences between the populations, it is important to maintain equal numbers ofcontrol and schizophrenia subjects in each group to avoid biasing the solutiontowards one population.
of the results. For comparison, we perform ten-fold cross valida-tion using the support vector machine (SVM) classifiers trainedon the fMRI correlations and DWI tractography measures indi-vidually, as well as on the combined dataset.
C. Baseline Methods
To evaluate the performance gain from combining fMRI andDWI data, we construct separate generative models for eachmodality. These individual models are depicted in Fig. 2. Inthese baseline models, we sever the connection between theanatomical connectivity templates and the fMRI data for eachpopulation.Since the DWI data is independent of the latent functional
connectivity, all parameters, random variables and data likeli-hoods remain unchanged for the DWI-only model [Fig. 2(a)].The only modification in the fMRI-only model [Fig. 2(b)]
involves the observed fMRI data. In particular, there are onlythree sets of likelihood parameters corresponding to thethree latent functional connectivity states. Formally, we replacethe likelihood in (4) with
(22)
for the control subjects and
(23)
for the schizophrenia population.We employ EM solutions, similar to those in Section IV. The
empirical probabilities of change are computed accordingto (20) by replacing with the posterior estimates of the ap-propriate model.We perform permutation tests and cross validation using the
DWI- and fMRI-specific models. These results allow us to eval-uate the benefits of incorporating both imaging modalities in ouranalysis.
D. Implementation Details
In this section we describe the optimization choices in ourimplementation of the EM algorithm. We concentrate on the
VENKATARAMAN et al.: JOINT MODELING OF ANATOMICAL AND FUNCTIONAL CONNECTIVITY FOR POPULATION STUDIES 171
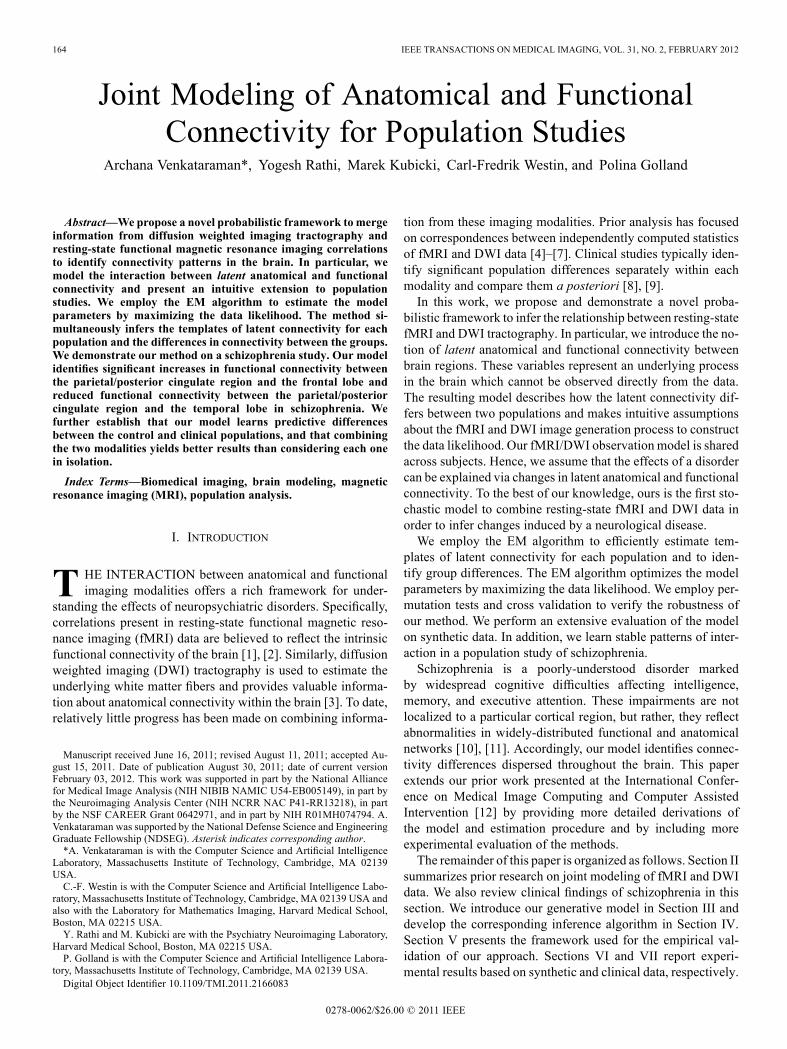
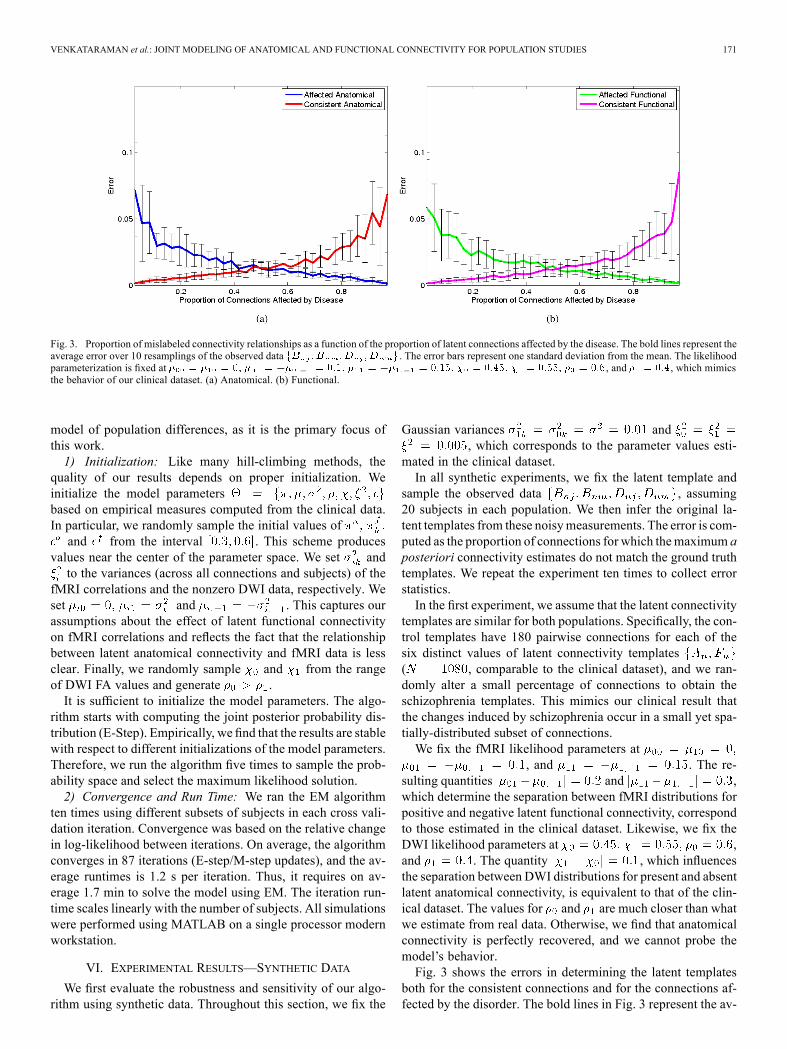
Fig. 3. Proportion of mislabeled connectivity relationships as a function of the proportion of latent connections affected by the disease. The bold lines represent theaverage error over 10 resamplings of the observed data . The error bars represent one standard deviation from the mean. The likelihoodparameterization is fixed at , and , which mimicsthe behavior of our clinical dataset. (a) Anatomical. (b) Functional.
model of population differences, as it is the primary focus ofthis work.1) Initialization: Like many hill-climbing methods, the
quality of our results depends on proper initialization. Weinitialize the model parametersbased on empirical measures computed from the clinical data.In particular, we randomly sample the initial values ofand from the interval . This scheme produces
values near the center of the parameter space. We set andto the variances (across all connections and subjects) of the
fMRI correlations and the nonzero DWI data, respectively. Weset and . This captures ourassumptions about the effect of latent functional connectivityon fMRI correlations and reflects the fact that the relationshipbetween latent anatomical connectivity and fMRI data is lessclear. Finally, we randomly sample and from the rangeof DWI FA values and generate .It is sufficient to initialize the model parameters. The algo-
rithm starts with computing the joint posterior probability dis-tribution (E-Step). Empirically, we find that the results are stablewith respect to different initializations of the model parameters.Therefore, we run the algorithm five times to sample the prob-ability space and select the maximum likelihood solution.2) Convergence and Run Time: We ran the EM algorithm
ten times using different subsets of subjects in each cross vali-dation iteration. Convergence was based on the relative changein log-likelihood between iterations. On average, the algorithmconverges in 87 iterations (E-step/M-step updates), and the av-erage runtimes is 1.2 s per iteration. Thus, it requires on av-erage 1.7 min to solve the model using EM. The iteration run-time scales linearly with the number of subjects. All simulationswere performed using MATLAB on a single processor modernworkstation.
VI. EXPERIMENTAL RESULTS—SYNTHETIC DATA
We first evaluate the robustness and sensitivity of our algo-rithm using synthetic data. Throughout this section, we fix the
Gaussian variances and, which corresponds to the parameter values esti-
mated in the clinical dataset.In all synthetic experiments, we fix the latent template and
sample the observed data , assuming20 subjects in each population. We then infer the original la-tent templates from these noisymeasurements. The error is com-puted as the proportion of connections for which themaximum aposteriori connectivity estimates do not match the ground truthtemplates. We repeat the experiment ten times to collect errorstatistics.In the first experiment, we assume that the latent connectivity
templates are similar for both populations. Specifically, the con-trol templates have 180 pairwise connections for each of thesix distinct values of latent connectivity templates( , comparable to the clinical dataset), and we ran-domly alter a small percentage of connections to obtain theschizophrenia templates. This mimics our clinical result thatthe changes induced by schizophrenia occur in a small yet spa-tially-distributed subset of connections.We fix the fMRI likelihood parameters at
, and . The re-sulting quantities and ,which determine the separation between fMRI distributions forpositive and negative latent functional connectivity, correspondto those estimated in the clinical dataset. Likewise, we fix theDWI likelihood parameters at ,and . The quantity , which influencesthe separation between DWI distributions for present and absentlatent anatomical connectivity, is equivalent to that of the clin-ical dataset. The values for and are much closer than whatwe estimate from real data. Otherwise, we find that anatomicalconnectivity is perfectly recovered, and we cannot probe themodel’s behavior.Fig. 3 shows the errors in determining the latent templates
both for the consistent connections and for the connections af-fected by the disorder. The bold lines in Fig. 3 represent the av-
172 IEEE TRANSACTIONS ON MEDICAL IMAGING, VOL. 31, NO. 2, FEBRUARY 2012
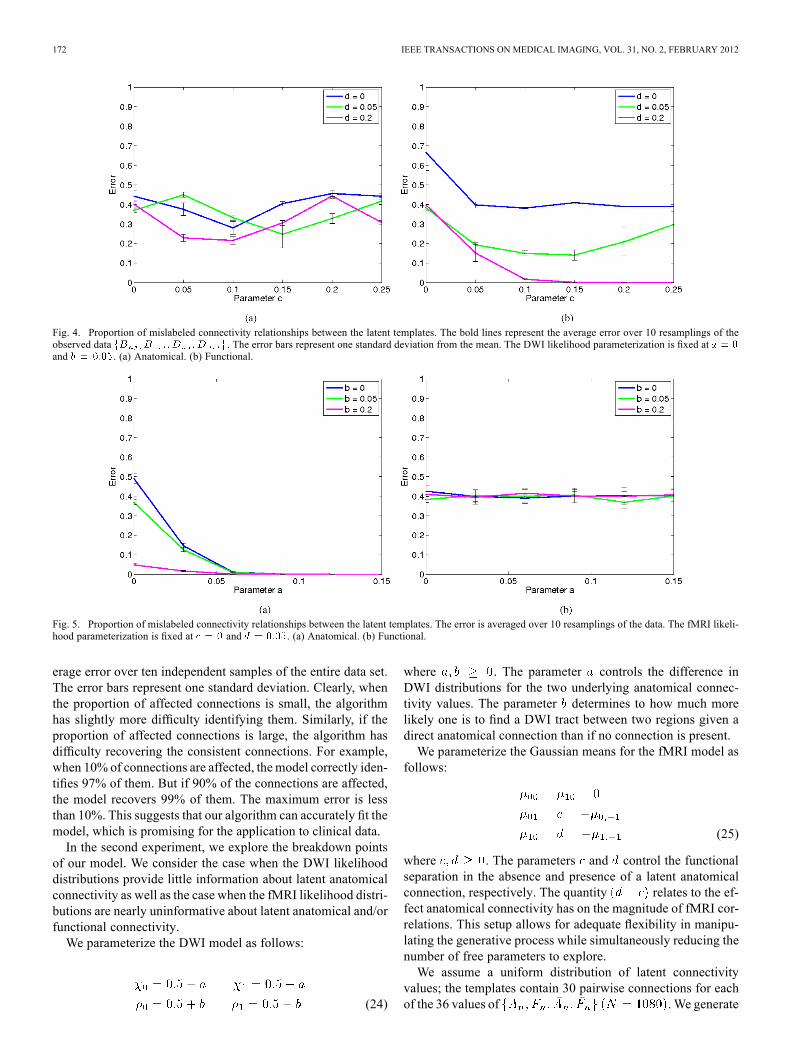
Fig. 4. Proportion of mislabeled connectivity relationships between the latent templates. The bold lines represent the average error over 10 resamplings of theobserved data . The error bars represent one standard deviation from the mean. The DWI likelihood parameterization is fixed atand . (a) Anatomical. (b) Functional.
Fig. 5. Proportion of mislabeled connectivity relationships between the latent templates. The error is averaged over 10 resamplings of the data. The fMRI likeli-hood parameterization is fixed at and . (a) Anatomical. (b) Functional.
erage error over ten independent samples of the entire data set.The error bars represent one standard deviation. Clearly, whenthe proportion of affected connections is small, the algorithmhas slightly more difficulty identifying them. Similarly, if theproportion of affected connections is large, the algorithm hasdifficulty recovering the consistent connections. For example,when 10% of connections are affected, themodel correctly iden-tifies 97% of them. But if 90% of the connections are affected,the model recovers 99% of them. The maximum error is lessthan 10%. This suggests that our algorithm can accurately fit themodel, which is promising for the application to clinical data.In the second experiment, we explore the breakdown points
of our model. We consider the case when the DWI likelihooddistributions provide little information about latent anatomicalconnectivity as well as the case when the fMRI likelihood distri-butions are nearly uninformative about latent anatomical and/orfunctional connectivity.We parameterize the DWI model as follows:
(24)
where . The parameter controls the difference inDWI distributions for the two underlying anatomical connec-tivity values. The parameter determines to how much morelikely one is to find a DWI tract between two regions given adirect anatomical connection than if no connection is present.We parameterize the Gaussian means for the fMRI model as
follows:
(25)
where . The parameters and control the functionalseparation in the absence and presence of a latent anatomicalconnection, respectively. The quantity relates to the ef-fect anatomical connectivity has on the magnitude of fMRI cor-relations. This setup allows for adequate flexibility in manipu-lating the generative process while simultaneously reducing thenumber of free parameters to explore.We assume a uniform distribution of latent connectivity
values; the templates contain 30 pairwise connections for eachof the 36 values of .We generate
VENKATARAMAN et al.: JOINT MODELING OF ANATOMICAL AND FUNCTIONAL CONNECTIVITY FOR POPULATION STUDIES 173
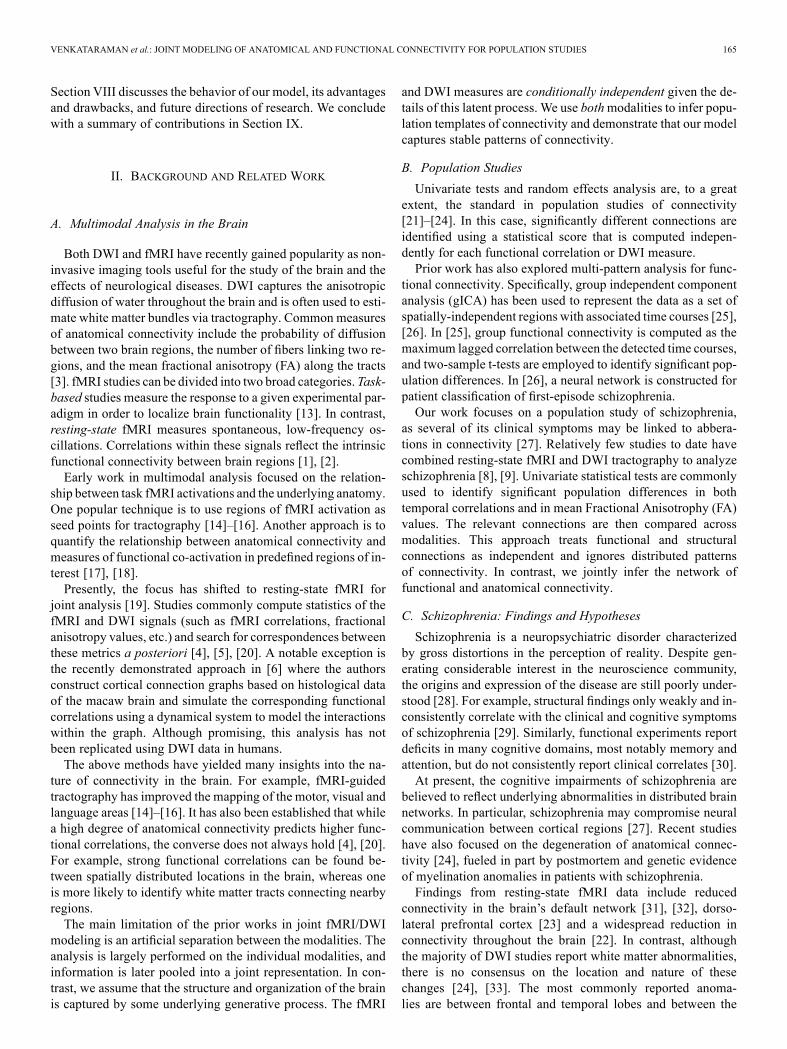
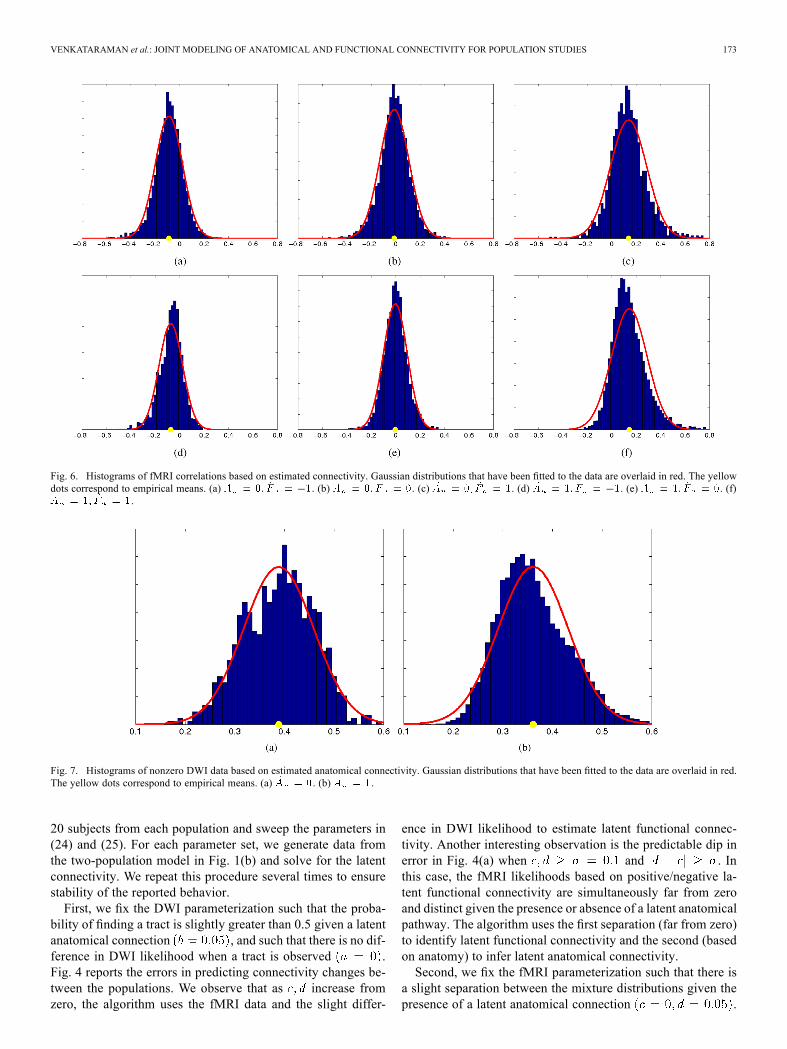
Fig. 6. Histograms of fMRI correlations based on estimated connectivity. Gaussian distributions that have been fitted to the data are overlaid in red. The yellowdots correspond to empirical means. (a) . (b) . (c) . (d) . (e) . (f)
.
Fig. 7. Histograms of nonzero DWI data based on estimated anatomical connectivity. Gaussian distributions that have been fitted to the data are overlaid in red.The yellow dots correspond to empirical means. (a) . (b) .
20 subjects from each population and sweep the parameters in(24) and (25). For each parameter set, we generate data fromthe two-population model in Fig. 1(b) and solve for the latentconnectivity. We repeat this procedure several times to ensurestability of the reported behavior.First, we fix the DWI parameterization such that the proba-
bility of finding a tract is slightly greater than 0.5 given a latentanatomical connection , and such that there is no dif-ference in DWI likelihood when a tract is observed .Fig. 4 reports the errors in predicting connectivity changes be-tween the populations. We observe that as increase fromzero, the algorithm uses the fMRI data and the slight differ-
ence in DWI likelihood to estimate latent functional connec-tivity. Another interesting observation is the predictable dip inerror in Fig. 4(a) when and . Inthis case, the fMRI likelihoods based on positive/negative la-tent functional connectivity are simultaneously far from zeroand distinct given the presence or absence of a latent anatomicalpathway. The algorithm uses the first separation (far from zero)to identify latent functional connectivity and the second (basedon anatomy) to infer latent anatomical connectivity.Second, we fix the fMRI parameterization such that there is
a slight separation between the mixture distributions given thepresence of a latent anatomical connection .
174 IEEE TRANSACTIONS ON MEDICAL IMAGING, VOL. 31, NO. 2, FEBRUARY 2012
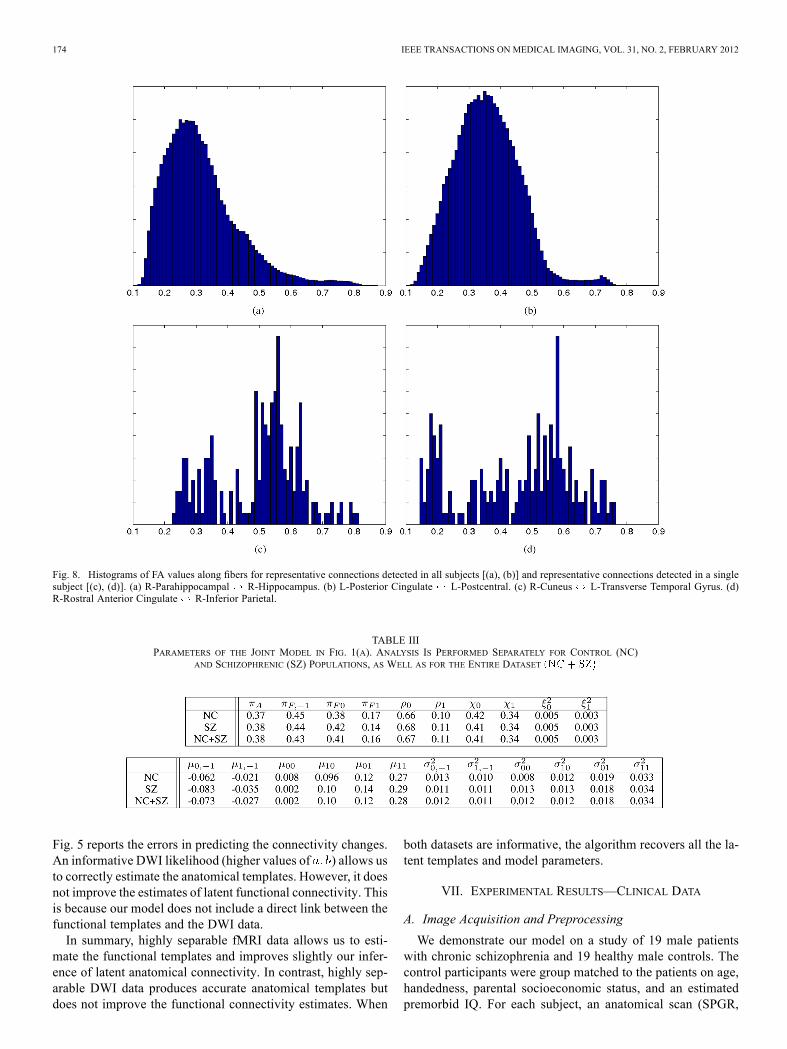
Fig. 8. Histograms of FA values along fibers for representative connections detected in all subjects [(a), (b)] and representative connections detected in a singlesubject [(c), (d)]. (a) R-Parahippocampal R-Hippocampus. (b) L-Posterior Cingulate L-Postcentral. (c) R-Cuneus L-Transverse Temporal Gyrus. (d)R-Rostral Anterior Cingulate R-Inferior Parietal.
TABLE IIIPARAMETERS OF THE JOINT MODEL IN FIG. 1(A). ANALYSIS IS PERFORMED SEPARATELY FOR CONTROL (NC)
AND SCHIZOPHRENIC (SZ) POPULATIONS, AS WELL AS FOR THE ENTIRE DATASET
Fig. 5 reports the errors in predicting the connectivity changes.An informative DWI likelihood (higher values of ) allows usto correctly estimate the anatomical templates. However, it doesnot improve the estimates of latent functional connectivity. Thisis because our model does not include a direct link between thefunctional templates and the DWI data.In summary, highly separable fMRI data allows us to esti-
mate the functional templates and improves slightly our infer-ence of latent anatomical connectivity. In contrast, highly sep-arable DWI data produces accurate anatomical templates butdoes not improve the functional connectivity estimates. When
both datasets are informative, the algorithm recovers all the la-tent templates and model parameters.
VII. EXPERIMENTAL RESULTS—CLINICAL DATA
A. Image Acquisition and Preprocessing
We demonstrate our model on a study of 19 male patientswith chronic schizophrenia and 19 healthy male controls. Thecontrol participants were group matched to the patients on age,handedness, parental socioeconomic status, and an estimatedpremorbid IQ. For each subject, an anatomical scan (SPGR,
VENKATARAMAN et al.: JOINT MODELING OF ANATOMICAL AND FUNCTIONAL CONNECTIVITY FOR POPULATION STUDIES 175
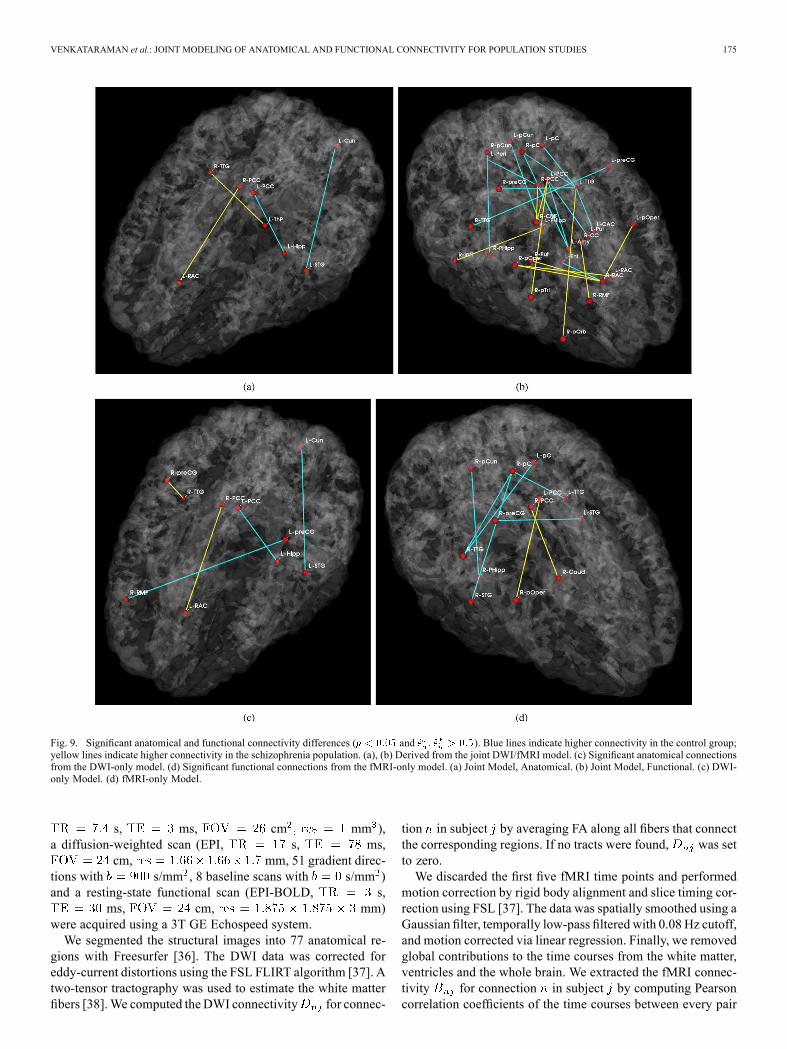
Fig. 9. Significant anatomical and functional connectivity differences ( and ). Blue lines indicate higher connectivity in the control group;yellow lines indicate higher connectivity in the schizophrenia population. (a), (b) Derived from the joint DWI/fMRI model. (c) Significant anatomical connectionsfrom the DWI-only model. (d) Significant functional connections from the fMRI-only model. (a) Joint Model, Anatomical. (b) Joint Model, Functional. (c) DWI-only Model. (d) fMRI-only Model.
s, ms, cm mm ),a diffusion-weighted scan (EPI, s, ms,
cm, mm, 51 gradient direc-tions with s/mm , 8 baseline scans with s/mm )and a resting-state functional scan (EPI-BOLD, s,
ms, cm, mm)were acquired using a 3T GE Echospeed system.We segmented the structural images into 77 anatomical re-
gions with Freesurfer [36]. The DWI data was corrected foreddy-current distortions using the FSL FLIRT algorithm [37]. Atwo-tensor tractography was used to estimate the white matterfibers [38].We computed the DWI connectivity for connec-
tion in subject by averaging FA along all fibers that connectthe corresponding regions. If no tracts were found, was setto zero.We discarded the first five fMRI time points and performed
motion correction by rigid body alignment and slice timing cor-rection using FSL [37]. The data was spatially smoothed using aGaussian filter, temporally low-pass filtered with 0.08 Hz cutoff,and motion corrected via linear regression. Finally, we removedglobal contributions to the time courses from the white matter,ventricles and the whole brain. We extracted the fMRI connec-tivity for connection in subject by computing Pearsoncorrelation coefficients of the time courses between every pair
176 IEEE TRANSACTIONS ON MEDICAL IMAGING, VOL. 31, NO. 2, FEBRUARY 2012
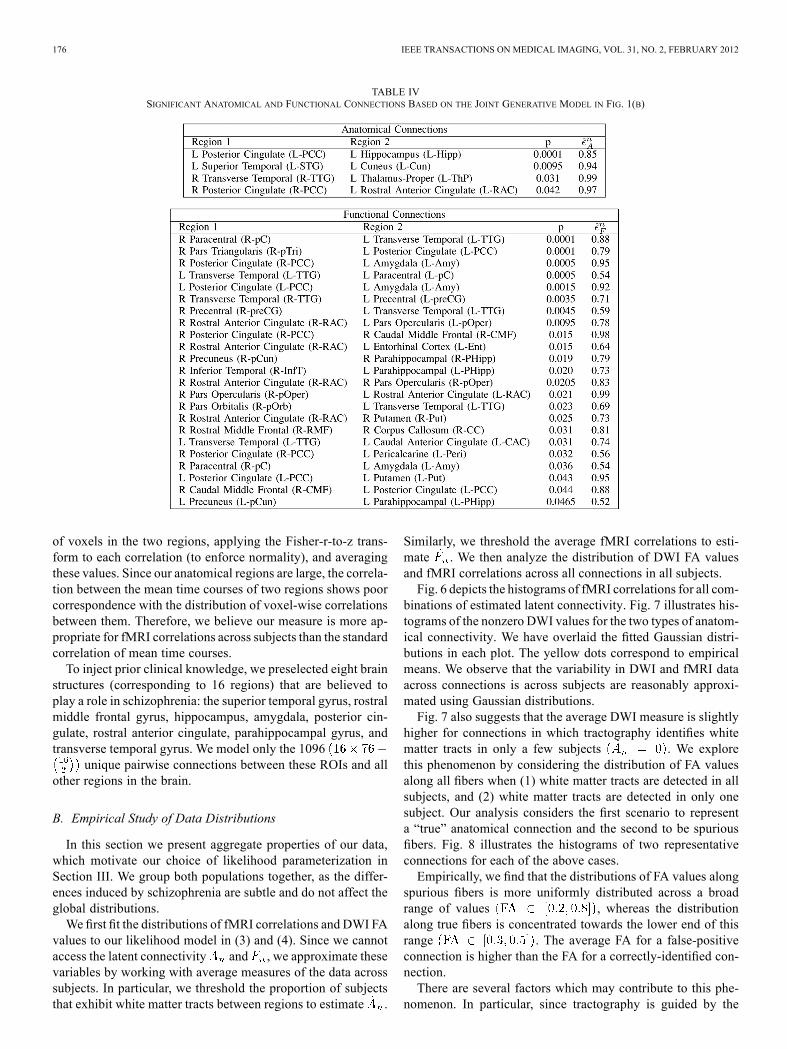
TABLE IVSIGNIFICANT ANATOMICAL AND FUNCTIONAL CONNECTIONS BASED ON THE JOINT GENERATIVE MODEL IN FIG. 1(B)
of voxels in the two regions, applying the Fisher-r-to-z trans-form to each correlation (to enforce normality), and averagingthese values. Since our anatomical regions are large, the correla-tion between the mean time courses of two regions shows poorcorrespondence with the distribution of voxel-wise correlationsbetween them. Therefore, we believe our measure is more ap-propriate for fMRI correlations across subjects than the standardcorrelation of mean time courses.To inject prior clinical knowledge, we preselected eight brain
structures (corresponding to 16 regions) that are believed toplay a role in schizophrenia: the superior temporal gyrus, rostralmiddle frontal gyrus, hippocampus, amygdala, posterior cin-gulate, rostral anterior cingulate, parahippocampal gyrus, andtransverse temporal gyrus. We model only the 1096
unique pairwise connections between these ROIs and allother regions in the brain.
B. Empirical Study of Data Distributions
In this section we present aggregate properties of our data,which motivate our choice of likelihood parameterization inSection III. We group both populations together, as the differ-ences induced by schizophrenia are subtle and do not affect theglobal distributions.We first fit the distributions of fMRI correlations and DWI FA
values to our likelihood model in (3) and (4). Since we cannotaccess the latent connectivity and , we approximate thesevariables by working with average measures of the data acrosssubjects. In particular, we threshold the proportion of subjectsthat exhibit white matter tracts between regions to estimate .
Similarly, we threshold the average fMRI correlations to esti-mate . We then analyze the distribution of DWI FA valuesand fMRI correlations across all connections in all subjects.Fig. 6 depicts the histograms of fMRI correlations for all com-
binations of estimated latent connectivity. Fig. 7 illustrates his-tograms of the nonzero DWI values for the two types of anatom-ical connectivity. We have overlaid the fitted Gaussian distri-butions in each plot. The yellow dots correspond to empiricalmeans. We observe that the variability in DWI and fMRI dataacross connections is across subjects are reasonably approxi-mated using Gaussian distributions.Fig. 7 also suggests that the average DWI measure is slightly
higher for connections in which tractography identifies whitematter tracts in only a few subjects . We explorethis phenomenon by considering the distribution of FA valuesalong all fibers when (1) white matter tracts are detected in allsubjects, and (2) white matter tracts are detected in only onesubject. Our analysis considers the first scenario to representa “true” anatomical connection and the second to be spuriousfibers. Fig. 8 illustrates the histograms of two representativeconnections for each of the above cases.Empirically, we find that the distributions of FA values along
spurious fibers is more uniformly distributed across a broadrange of values , whereas the distributionalong true fibers is concentrated towards the lower end of thisrange . The average FA for a false-positiveconnection is higher than the FA for a correctly-identified con-nection.There are several factors which may contribute to this phe-
nomenon. In particular, since tractography is guided by the
VENKATARAMAN et al.: JOINT MODELING OF ANATOMICAL AND FUNCTIONAL CONNECTIVITY FOR POPULATION STUDIES 177
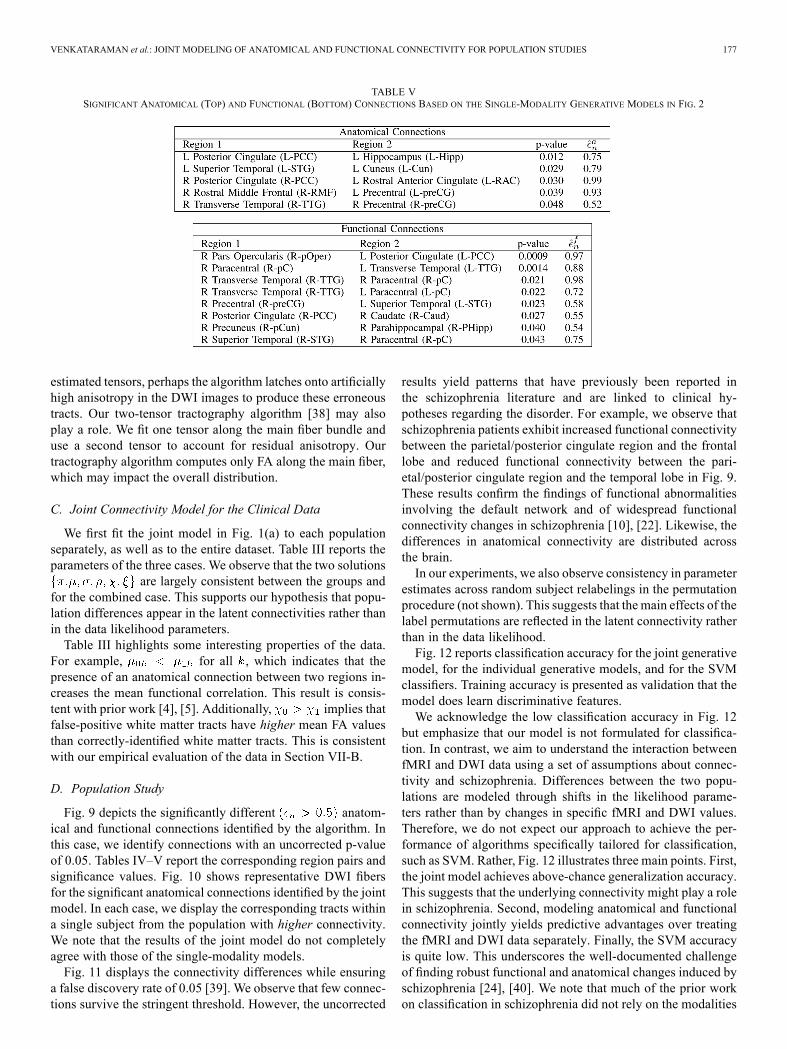
TABLE VSIGNIFICANT ANATOMICAL (TOP) AND FUNCTIONAL (BOTTOM) CONNECTIONS BASED ON THE SINGLE-MODALITY GENERATIVE MODELS IN FIG. 2
estimated tensors, perhaps the algorithm latches onto artificiallyhigh anisotropy in the DWI images to produce these erroneoustracts. Our two-tensor tractography algorithm [38] may alsoplay a role. We fit one tensor along the main fiber bundle anduse a second tensor to account for residual anisotropy. Ourtractography algorithm computes only FA along the main fiber,which may impact the overall distribution.
C. Joint Connectivity Model for the Clinical Data
We first fit the joint model in Fig. 1(a) to each populationseparately, as well as to the entire dataset. Table III reports theparameters of the three cases. We observe that the two solutions
are largely consistent between the groups andfor the combined case. This supports our hypothesis that popu-lation differences appear in the latent connectivities rather thanin the data likelihood parameters.Table III highlights some interesting properties of the data.
For example, for all , which indicates that thepresence of an anatomical connection between two regions in-creases the mean functional correlation. This result is consis-tent with prior work [4], [5]. Additionally, implies thatfalse-positive white matter tracts have higher mean FA valuesthan correctly-identified white matter tracts. This is consistentwith our empirical evaluation of the data in Section VII-B.
D. Population Study
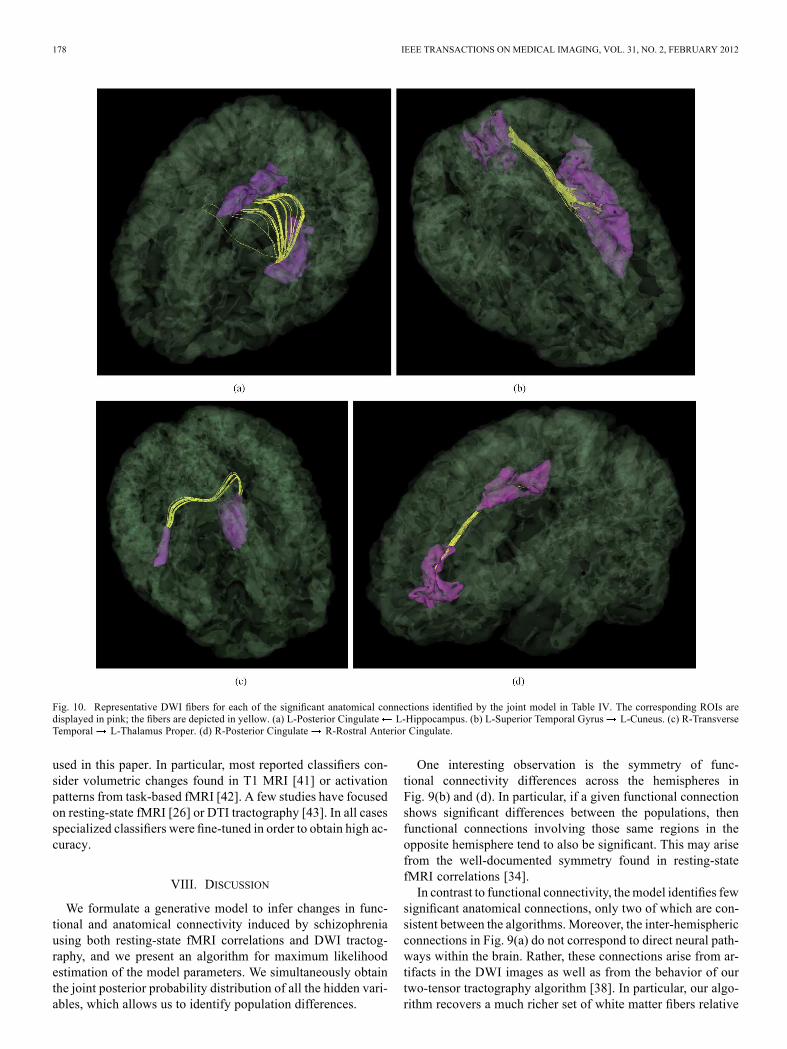
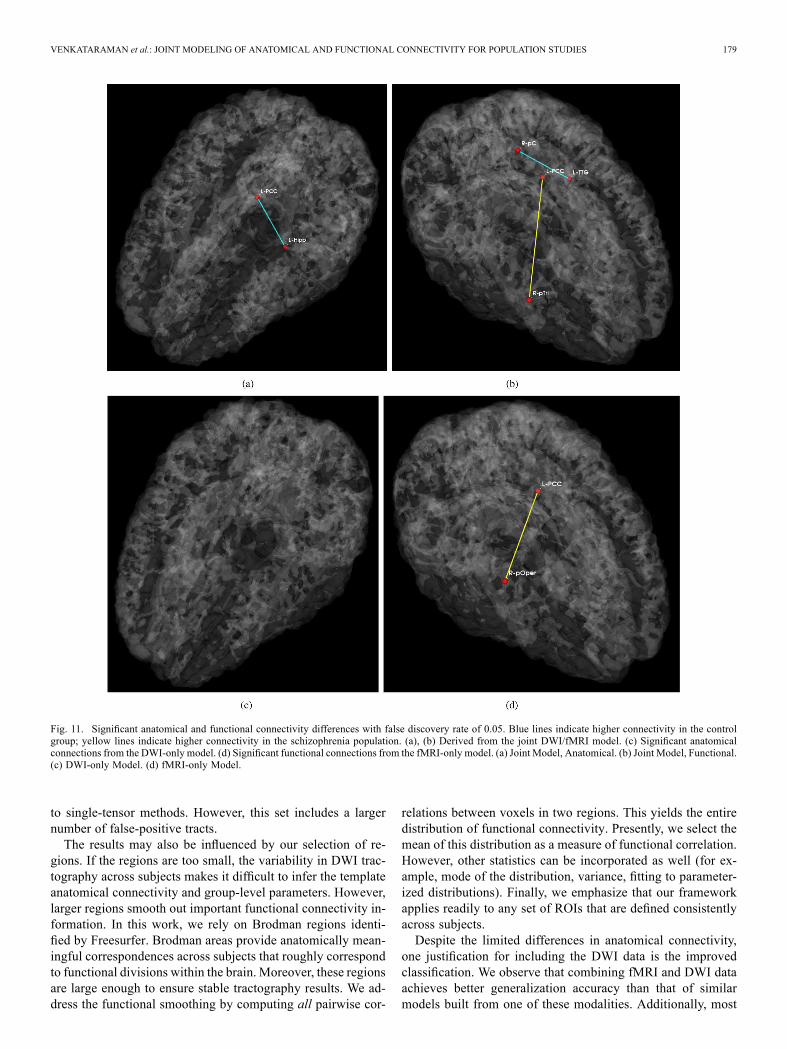
Fig. 9 depicts the significantly different anatom-ical and functional connections identified by the algorithm. Inthis case, we identify connections with an uncorrected p-valueof 0.05. Tables IV–V report the corresponding region pairs andsignificance values. Fig. 10 shows representative DWI fibersfor the significant anatomical connections identified by the jointmodel. In each case, we display the corresponding tracts withina single subject from the population with higher connectivity.We note that the results of the joint model do not completelyagree with those of the single-modality models.Fig. 11 displays the connectivity differences while ensuring
a false discovery rate of 0.05 [39]. We observe that few connec-tions survive the stringent threshold. However, the uncorrected
results yield patterns that have previously been reported inthe schizophrenia literature and are linked to clinical hy-potheses regarding the disorder. For example, we observe thatschizophrenia patients exhibit increased functional connectivitybetween the parietal/posterior cingulate region and the frontallobe and reduced functional connectivity between the pari-etal/posterior cingulate region and the temporal lobe in Fig. 9.These results confirm the findings of functional abnormalitiesinvolving the default network and of widespread functionalconnectivity changes in schizophrenia [10], [22]. Likewise, thedifferences in anatomical connectivity are distributed acrossthe brain.In our experiments, we also observe consistency in parameter
estimates across random subject relabelings in the permutationprocedure (not shown). This suggests that the main effects of thelabel permutations are reflected in the latent connectivity ratherthan in the data likelihood.Fig. 12 reports classification accuracy for the joint generative
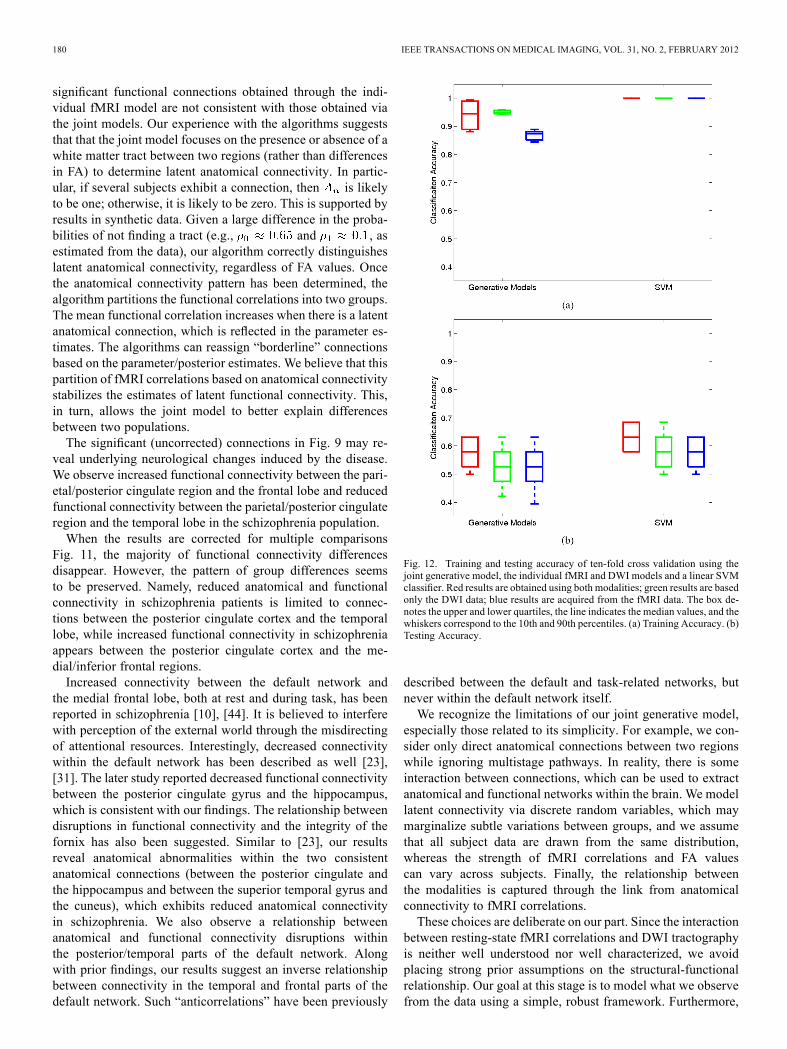
model, for the individual generative models, and for the SVMclassifiers. Training accuracy is presented as validation that themodel does learn discriminative features.We acknowledge the low classification accuracy in Fig. 12
but emphasize that our model is not formulated for classifica-tion. In contrast, we aim to understand the interaction betweenfMRI and DWI data using a set of assumptions about connec-tivity and schizophrenia. Differences between the two popu-lations are modeled through shifts in the likelihood parame-ters rather than by changes in specific fMRI and DWI values.Therefore, we do not expect our approach to achieve the per-formance of algorithms specifically tailored for classification,such as SVM. Rather, Fig. 12 illustrates three main points. First,the joint model achieves above-chance generalization accuracy.This suggests that the underlying connectivity might play a rolein schizophrenia. Second, modeling anatomical and functionalconnectivity jointly yields predictive advantages over treatingthe fMRI and DWI data separately. Finally, the SVM accuracyis quite low. This underscores the well-documented challengeof finding robust functional and anatomical changes induced byschizophrenia [24], [40]. We note that much of the prior workon classification in schizophrenia did not rely on the modalities
178 IEEE TRANSACTIONS ON MEDICAL IMAGING, VOL. 31, NO. 2, FEBRUARY 2012
Fig. 10. Representative DWI fibers for each of the significant anatomical connections identified by the joint model in Table IV. The corresponding ROIs aredisplayed in pink; the fibers are depicted in yellow. (a) L-Posterior Cingulate L-Hippocampus. (b) L-Superior Temporal Gyrus L-Cuneus. (c) R-TransverseTemporal L-Thalamus Proper. (d) R-Posterior Cingulate R-Rostral Anterior Cingulate.
used in this paper. In particular, most reported classifiers con-sider volumetric changes found in T1 MRI [41] or activationpatterns from task-based fMRI [42]. A few studies have focusedon resting-state fMRI [26] or DTI tractography [43]. In all casesspecialized classifiers were fine-tuned in order to obtain high ac-curacy.
VIII. DISCUSSION
We formulate a generative model to infer changes in func-tional and anatomical connectivity induced by schizophreniausing both resting-state fMRI correlations and DWI tractog-raphy, and we present an algorithm for maximum likelihoodestimation of the model parameters. We simultaneously obtainthe joint posterior probability distribution of all the hidden vari-ables, which allows us to identify population differences.
One interesting observation is the symmetry of func-tional connectivity differences across the hemispheres inFig. 9(b) and (d). In particular, if a given functional connectionshows significant differences between the populations, thenfunctional connections involving those same regions in theopposite hemisphere tend to also be significant. This may arisefrom the well-documented symmetry found in resting-statefMRI correlations [34].In contrast to functional connectivity, themodel identifies few
significant anatomical connections, only two of which are con-sistent between the algorithms. Moreover, the inter-hemisphericconnections in Fig. 9(a) do not correspond to direct neural path-ways within the brain. Rather, these connections arise from ar-tifacts in the DWI images as well as from the behavior of ourtwo-tensor tractography algorithm [38]. In particular, our algo-rithm recovers a much richer set of white matter fibers relative
VENKATARAMAN et al.: JOINT MODELING OF ANATOMICAL AND FUNCTIONAL CONNECTIVITY FOR POPULATION STUDIES 179
Fig. 11. Significant anatomical and functional connectivity differences with false discovery rate of 0.05. Blue lines indicate higher connectivity in the controlgroup; yellow lines indicate higher connectivity in the schizophrenia population. (a), (b) Derived from the joint DWI/fMRI model. (c) Significant anatomicalconnections from the DWI-only model. (d) Significant functional connections from the fMRI-only model. (a) Joint Model, Anatomical. (b) Joint Model, Functional.(c) DWI-only Model. (d) fMRI-only Model.
to single-tensor methods. However, this set includes a largernumber of false-positive tracts.The results may also be influenced by our selection of re-
gions. If the regions are too small, the variability in DWI trac-tography across subjects makes it difficult to infer the templateanatomical connectivity and group-level parameters. However,larger regions smooth out important functional connectivity in-formation. In this work, we rely on Brodman regions identi-fied by Freesurfer. Brodman areas provide anatomically mean-ingful correspondences across subjects that roughly correspondto functional divisions within the brain. Moreover, these regionsare large enough to ensure stable tractography results. We ad-dress the functional smoothing by computing all pairwise cor-
relations between voxels in two regions. This yields the entiredistribution of functional connectivity. Presently, we select themean of this distribution as a measure of functional correlation.However, other statistics can be incorporated as well (for ex-ample, mode of the distribution, variance, fitting to parameter-ized distributions). Finally, we emphasize that our frameworkapplies readily to any set of ROIs that are defined consistentlyacross subjects.Despite the limited differences in anatomical connectivity,
one justification for including the DWI data is the improvedclassification. We observe that combining fMRI and DWI dataachieves better generalization accuracy than that of similarmodels built from one of these modalities. Additionally, most
180 IEEE TRANSACTIONS ON MEDICAL IMAGING, VOL. 31, NO. 2, FEBRUARY 2012
significant functional connections obtained through the indi-vidual fMRI model are not consistent with those obtained viathe joint models. Our experience with the algorithms suggeststhat that the joint model focuses on the presence or absence of awhite matter tract between two regions (rather than differencesin FA) to determine latent anatomical connectivity. In partic-ular, if several subjects exhibit a connection, then is likelyto be one; otherwise, it is likely to be zero. This is supported byresults in synthetic data. Given a large difference in the proba-bilities of not finding a tract (e.g., and , asestimated from the data), our algorithm correctly distinguisheslatent anatomical connectivity, regardless of FA values. Oncethe anatomical connectivity pattern has been determined, thealgorithm partitions the functional correlations into two groups.The mean functional correlation increases when there is a latentanatomical connection, which is reflected in the parameter es-timates. The algorithms can reassign “borderline” connectionsbased on the parameter/posterior estimates. We believe that thispartition of fMRI correlations based on anatomical connectivitystabilizes the estimates of latent functional connectivity. This,in turn, allows the joint model to better explain differencesbetween two populations.The significant (uncorrected) connections in Fig. 9 may re-
veal underlying neurological changes induced by the disease.We observe increased functional connectivity between the pari-etal/posterior cingulate region and the frontal lobe and reducedfunctional connectivity between the parietal/posterior cingulateregion and the temporal lobe in the schizophrenia population.When the results are corrected for multiple comparisons
Fig. 11, the majority of functional connectivity differencesdisappear. However, the pattern of group differences seemsto be preserved. Namely, reduced anatomical and functionalconnectivity in schizophrenia patients is limited to connec-tions between the posterior cingulate cortex and the temporallobe, while increased functional connectivity in schizophreniaappears between the posterior cingulate cortex and the me-dial/inferior frontal regions.Increased connectivity between the default network and
the medial frontal lobe, both at rest and during task, has beenreported in schizophrenia [10], [44]. It is believed to interferewith perception of the external world through the misdirectingof attentional resources. Interestingly, decreased connectivitywithin the default network has been described as well [23],[31]. The later study reported decreased functional connectivitybetween the posterior cingulate gyrus and the hippocampus,which is consistent with our findings. The relationship betweendisruptions in functional connectivity and the integrity of thefornix has also been suggested. Similar to [23], our resultsreveal anatomical abnormalities within the two consistentanatomical connections (between the posterior cingulate andthe hippocampus and between the superior temporal gyrus andthe cuneus), which exhibits reduced anatomical connectivityin schizophrenia. We also observe a relationship betweenanatomical and functional connectivity disruptions withinthe posterior/temporal parts of the default network. Alongwith prior findings, our results suggest an inverse relationshipbetween connectivity in the temporal and frontal parts of thedefault network. Such “anticorrelations” have been previously
Fig. 12. Training and testing accuracy of ten-fold cross validation using thejoint generative model, the individual fMRI and DWI models and a linear SVMclassifier. Red results are obtained using both modalities; green results are basedonly the DWI data; blue results are acquired from the fMRI data. The box de-notes the upper and lower quartiles, the line indicates the median values, and thewhiskers correspond to the 10th and 90th percentiles. (a) Training Accuracy. (b)Testing Accuracy.
described between the default and task-related networks, butnever within the default network itself.We recognize the limitations of our joint generative model,
especially those related to its simplicity. For example, we con-sider only direct anatomical connections between two regionswhile ignoring multistage pathways. In reality, there is someinteraction between connections, which can be used to extractanatomical and functional networks within the brain. We modellatent connectivity via discrete random variables, which maymarginalize subtle variations between groups, and we assumethat all subject data are drawn from the same distribution,whereas the strength of fMRI correlations and FA valuescan vary across subjects. Finally, the relationship betweenthe modalities is captured through the link from anatomicalconnectivity to fMRI correlations.These choices are deliberate on our part. Since the interaction
between resting-state fMRI correlations and DWI tractographyis neither well understood nor well characterized, we avoidplacing strong prior assumptions on the structural-functionalrelationship. Our goal at this stage is to model what we observefrom the data using a simple, robust framework. Furthermore,
VENKATARAMAN et al.: JOINT MODELING OF ANATOMICAL AND FUNCTIONAL CONNECTIVITY FOR POPULATION STUDIES 181
given the potentially large amounts of inter-subject variabilityand external noise, we intentionally simplify the model toreduce the number of parameters and avoid over-fitting. Theselimitations provide ample opportunities for future work.
IX. CONCLUSION
We proposed a novel probabilistic framework that fusesinformation from resting-state fMRI correlations and DWItractography to infer the differences between two populations.We show that the model captures variations in functionaland anatomical connectivity induced by schizophrenia. Inparticular, we detect increased functional connectivity fromthe parietal lobe to the frontal lobe and decreased functionalconnectivity from the parietal lobe to the temporal lobe. Fi-nally, we demonstrate the predictive power of our joint modelthrough cross validation. These results establish the promiseof our approach for combining multiple imaging modalities tobetter understand the brain.
REFERENCES[1] R. L. Buckner and J. L. Vincent, “Unrest at rest: Default activity
and spontaneous network correlations,” NeuroImage, vol. 37, pp.1091–1096, 2007.
[2] M. D. Fox and M. E. Raichle, “Spontaneous fluctuations in brain ac-tivity observed with functional magnetic resonance imaging,” Nature,vol. 8, pp. 700–711, 2007.
[3] P. Basser and C. Pierpaoli, “Microstructural and physiological featuresof tissues elucidated by quantitative-diffusion-tensor MRI,” J. Magn.Reson., vol. 111, pp. 209–219, 1996.
[4] C. J. Honey, O. Sporns, L. Cammoun, X. Gigandet, J. P. Thiran, R.Meuli, and P. Hagmann, “Predicting human resting-state functionalconnectivity from structural connectivity,” Proc. Nat. Acad. Sci., vol.106, pp. 2035–2040, 2009.
[5] M. A. Koch, D. G. Norris, and M. Hund-Georgiadis, “An investigationof functional and anatomical connectivity using magnetic resonanceimaging,” NeuroImage, vol. 16, pp. 241–250, 2002.
[6] O. Sporns, G. Tononi, and G.M. Edelman, “Theoretical neuroanatomy:Relating anatomical and functional connectivity in graphs and corticalconnection matrices,” Cerebral Cortex, vol. 10, pp. 127–141, 2000.
[7] C. J. Honey, R. Kotter, M. Breakspear, and O. Sporns, “Network struc-ture of cerebral cortex shapes functional connectivity on multiple timescales,” Proc. Nat. Acad. Sci., vol. 104, pp. 10 240–10 245, 2007.
[8] M. Ke, X. Huang, H. Shen, Z. Zhou, X. Chen, and D. Hu, “Combinedanalysis for resting state fMRI and DTI data reveals abnormal devel-opment of function-structure in early-onset schizophrenia,” LNAI, vol.5009, pp. 628–635, 2008.
[9] Y. Zhou, N. Shu, Y. Liu, M. Song, Y. Hao, H. Liu, C. Yu, Z. Liu, andT. Jiang, “Altered resting-state functional connectivity and anatomicalconnectivity of hippocampus in schizophrenia,” Schizophrenia Res.,vol. 100, pp. 120–132, 2008.
[10] S. Gabrieli-Whitfield, H. W. Thermenos, Z. Milanovic, M. T. Tsuang,S. V. Faraone, R. W. McCarley, M. E. Shenton, A. I. Green, A.Nieto-Castanon, P. LaViolette, J. Wojcik, J. D. Gabrieli, and L. J.Seidman, Hyperactivity and Hyperconnectivity of the Default Net-work in Schizophrenia and in First-Degree Relatives of PersonsWith Schizophrenia. Washington, DC: Nat. Acad. Sci., 2009, pp.1279–1284.
[11] J. Burns, D. Job,M. E. Bastin, H.Whalley, T.MacGillivray, E. C. John-stone, and S. M. Lawrie, “Structural disconnectivity in schizophrenia:A diffusion tensor magnetic resonance imaging study,” Br. J. Psychi-atry, vol. 182, pp. 439–443, 2003.
[12] A. Venkataraman, Y. Rathi, M. Kubicki, C.-F. Westin, and P. Golland,“Joint generative model for fMRI/DWI and its application to popula-tion studies,” inMICCAI: Int. Conf. Med. Image Computing ComputerAssist. Intervent., 2010, vol. 13, pp. 191–199.
[13] K. Friston, A. Holmes, K. Worsley, J.-P. Poline, C. Frith, and R. Frack-owiak, “Statistical parametric maps in functional imaging: A generallinear approach,” Human Brain Mapp., vol. 2, pp. 189–210, 1995.
[14] M. Guye, G. J. Parker, M. Symms, P. Boulby, C. A. Wheeler-King-shott, A. Salek-Haddadi, G. J. Barker, and J. S. Duncan, “Combinedfunctional MRI and tractography to demonstrate the connectivity ofthe human primary motor cortex in vivo,” NeuroImage, vol. 19, pp.1349–1360, 2003.
[15] R. F. Dougherty, M. Ben-Shachar, R. Bammer, A. A. Brewer, and B.A. Wandell, “Functional organization of occipital-callosal fiber tracts,”Proc. Nat. Acad. Sci., vol. 102, pp. 7350–7355, 2005.
[16] H. W. Powell, G. J. Parker, D. C. Alexander, M. R. Symms, P. A.Boulby, C. A. Wheeler-Kingshott, G. J. Barker, U. Noppeney, M. J.Koepp, and J. S. Duncan, “Hemispheric asymmetries in language-re-lated pathways: A combined functional MRI and tractography study,”NeuroImage, vol. 32, pp. 388–399, 2006.
[17] H. Johansen-Berg, T. E. Behrens, M. D. Robson, I. Drobnjak, M.F. Rushworth, J. M. Brady, S. M. Smith, D. J. Higham, and P. M.Matthews, “Changes in connectivity profiles define functionallydistinct regions in human medial frontal cortex,” Proc. Nat. Acad. Sci.,vol. 101, pp. 13 335–13 340, 2004.
[18] A. T. Toosy, O. Ciccarelli, G. J. Parker, C. A. Wheeler-Kingshott, D.H. Miller, and A. J. Thompson, “Characterizing function-structure re-lationships in the human visual system with functional MRI and diffu-sion tensor imaging,” NeuroImage, vol. 21, pp. 1452–1463, 2004.
[19] E. Rykhlevskaia, G. Gratton, and M. Fabiani, “Combining structuraland functional neuroimaging data for studying brain connectivity: Areview,” Psychophysiology, vol. 45, pp. 173–187, 2008.
[20] M. D. Greicius et al., “Resting-state functional connectivity in the de-fault mode network,” Cerebral Cortex, vol. 19, pp. 72–78, 2009.
[21] M. D. Greicius, B. H. Flores, V. Menon, G. H. Glover, H. B. Solvason,H. Kenna, A. L. Reiss, and A. F. Schatzberg, “Resting-state functionalconnectivity in major depression: Abnormally increased contributionsfrom subgenual cingulate cortex and thalamus,” Biol. Psychiatry, vol.62, pp. 429–437, 2007.
[22] M. Liang, Y. Zhou, T. Jiang, Z. Liu, L. Tian, H. Liu, and Y.Hao, “Widespread functional disconnectivity in schizophrenia withresting-state functional magnetic resonance imaging,” NeuroReportBrain Imag., vol. 17, pp. 209–213, 2006.
[23] Y. Zhou, M. Liang, T. Jiang, L. Tian, Y. Liu, Z. Liu, H. Liu, andF. Kuang, “Functional dysconnectivity of the dorsolateral prefrontalcortex in first-episode schizophrenia using resting-state fMRI,” NeuroLett., vol. 417, pp. 297–302, 2007.
[24] M. Kubicki, R. McCarley, C.-F. Westin, H.-J. Park, S. Maier, R.Kikinis, F. A. Jolesz, and M. E. Shenton, “A review of diffusion tensorimaging studies in schizophrenia,” J. Psychiatric Res., vol. 41, pp.15–30, 2007.
[25] M. J. Jafri, G. D. Pearlson, M. Stevens, and V. D. Calhoun, “A methodfor functional network connectivity among spatially independentresting-state components in schizophrenia,” NeuroImage, vol. 39, pp.1666–1681, 2008.
[26] M. Jafri and V. Calhoun, “Functional classification of schizophreniausing feed forward neural networks,” in International Conference ofthe IEEE Engineering in Medicine and Biology Society, 2006, pp.6631–6634.
[27] K. J. Friston and C. D. Frith, “Schizophrenia: A disconnection syn-drome?,” Clinical Neuroscience, vol. 3, pp. 89–97, 1995.
[28] R. Tandon, M. S. Keshavan, and H. A. Nasrallah, “Schizophrenia, ‘justthe facts’: What we know in 2008, Part 1: Overview,” SchizophreniaRes., vol. 100, pp. 4–19, 2008.
[29] M. E. Shenton, C. C. Dickey, M. Frumin, and R. W. McCarley, “Areview of MRI findings in schizophrenia,” Schizophrenia Res., vol. 49,pp. 1–52, 2001.
[30] R. L. Mitchell, R. Elliott, and P. W. Woodruff, “fMRI and cognitivedysfunction in schizophrenia,” TRENDS Cognitive Sci., vol. 5, pp.71–81, 2001.
[31] R. L. Bluhm, J. Miller, R. A. Lanius, E. A. Osuch, K. Boksman, R. W.Neufeld, J. Théberge, B. Schaefer, and P. Williamson, “Spontaneouslow-frequency fluctuations in the bold signal in schizophrenic patients:Abnormalities in the default network,” Schizophrenia Bull., pp. 1–9,2007.
[32] R. L. Buckner, J. R. Andrews-Hanna, and D. L. Schacter, “The brain’sdefault network anatomy, function, and relevence to disease,” Ann. NYAcad. Sci., vol. 1124, pp. 1–38, 2008.
[33] A. Konrad and G. Winterer, “Disturbed structural connectivity inschizophrenia—Primary factor in pathology or epiphenomenon,”Schizophrenia Bull., vol. 34, pp. 72–92, 2008.
182 IEEE TRANSACTIONS ON MEDICAL IMAGING, VOL. 31, NO. 2, FEBRUARY 2012
[34] K. V. Dijk, T. Hedden, A. Venkataraman, K. Evans, S. Lazar, and R.Buckner, “Intrinsic functional connectivity as a tool for human con-nectomics: Theory, properties and optimization,” J. Neurophysiol., vol.103, pp. 297–321, 2010.
[35] A. Dempster, N. M. Laird, and D. B. Rubin, “Maximum likelihoodfrom incomplete data via the EM algorithm,” J. R. Stat. Soc., vol. 39,pp. 1–38, 1977.
[36] B. Fischl, D. H. Salat, A. J. van der Kouwe, N. Makris, F. Ségonne,B. T. Quinn, and A. M. Dale, “Sequence-independent segmentation ofmagnetic resonance images,” NeuroImage, vol. 23, pp. 69–84, 2004.
[37] S. M. Smith, M. Jenkinson, M. W. Woolrich, C. F. Beckmann, T. E.Behrens, H. Johansen-Bern, P. R. Bannister, M. D. Luca, I. Drobnjak,D. E. Flitney, R. K. Niazy, J. Saunders, J. Vickers, Y. Zhang, N. D.Stefano, J. M. Brady, and P. M. Matthews, “Advances in functionaland structural MR image analysis and implementation as FSL,” Neu-roImage, vol. 23, pp. 208–219, 2004.
[38] J. G. Malcolm, M. E. Shenton, and Y. Rathi, “Neural tractographyusing an unscented Kalman filter,” in Int. Conf. Inf. Process. Med.Imag., 2009, vol. 21, pp. 126–138.
[39] Y. Benjamini and Y. Hochberg, “Controlling the false discovery rate:A practical and powerful approach to multiple testing,” J. R. Stat. Soc.,Ser. B (Methodological), vol. 57, pp. 125–133, 1995.
[40] O. Demirci, V. Clark, V. Magnotta, N. Audreasen, J. Lauriello, K.Keihl, G. Pearlson, and V. Calhoun, “A review of challenges in theuse of fMRI for disease classification/characterization and a projectionpursuit application from a multi-site fMRI schizophrenia study,” BrainImag. Behav., vol. 2, pp. 207–226, 2008.
[41] Y. Fan, R. Gur, R. Gur, X. Wu, D. Shen, M. Calkins, and C. Da-vatzikos, “Unaffected family members and schizopphrenia patientsshare brain structure patterns: A high-dimensional pattern classifica-tion study,” Biol. Psychiatry, vol. 63, pp. 118–124, 2008.
[42] J. Ford, H. Farid, F. Makedon, L. Flashman, T. McAllister, V. Mega-looikonomou, and A. Saykin, “Patient classification of fMRI activationmaps,” in MICCAI: Int. Conf. Med. Image Computing Computer As-sist. Intervent., 2003, vol. 6, pp. 58–65.
[43] V.Mohan, G. Sundaramoorhi, M. Kubicki, T. Douglas, and A. Tannen-baum, “Population analysis of the cingulum bundle using the tubularsurface model for schizophrenia detection,” Med. Imag. 2010: Com-puter-Aided Diagnosis, vol. 7624, 2010.
[44] Y. Zhou, M. Liang, T. Jiang, L. Tian, Y. Liu, Z. Liu, H. Liu, andF. Kuang, “Functional dysconnectivity of the dorsolateral prefrontalcortex in first-episode schizophrenia using resting-state fMRI,” Neu-rosci. Lett., vol. 417, pp. 297–302, 2007.