Embed Size (px)
Citation preview
HEALTH WORKFORCE REQUIREMENTS FOR
UNIVERSAL HEALTH COVERAGE AND THE SUSTAINABLE DEVELOPMENT GOALS
Human Resources for Health Observer Series No 17

HEALTH WORKFORCE REQUIREMENTS FOR
UNIVERSAL HEALTH COVERAGE AND THE SUSTAINABLE DEVELOPMENT GOALS
Background paper No. 1 to the Global Strategy on Human Resources for Health.
WHO Library Cataloguing-in-Publication Data
Health workforce requirements for universal health coverage and the Sustainable Development Goals.
(Human Resources for Health Observer, 17)
1.Health Manpower. 2.Universal Coverage. 3.Health Priorities. I.World Health Organization.
ISBN 978 92 4 151140 7 (NLM classification: W 76)
© World Health Organization 2016
All rights reserved. Publications of the World Health Organization are available on the WHO website (http://www.who.int) or can be purchased from WHO Press, World Health Organization, 20 Avenue Appia, 1211 Geneva 27, Switzerland (tel.: +41 22 791 3264; fax: +41 22 791 4857; email: [email protected]).
Requests for permission to reproduce or translate WHO publications –whether for sale or for non-commercial distribution– should be addressed to WHO Press through the WHO website (http://www.who.int/about/licensing/copyright_form/index.html).
The designations employed and the presentation of the material in this publication do not imply the expression of any opinion whatsoever on the part of the World Health Organization concerning the legal status of any country, territory, city or area or of its authorities, or concerning the delimitation of its frontiers or boundaries. Dotted and dashed lines on maps represent approximate border lines for which there may not yet be full agreement.
The mention of specific companies or of certain manufacturers’ products does not imply that they are endorsed or recommended by the World Health Organization in preference to others of a similar nature that are not mentioned. Errors and omissions excepted, the names of proprietary products are distinguished by initial capital letters.
All reasonable precautions have been taken by the World Health Organization to verify the information contained in this publication. However, the published material is being distributed without warranty of any kind, either expressed or implied. The responsibility for the interpretation and use of the material lies with the reader. In no event shall the World Health Organization be liable for damages arising from its use.
Design: Blossom.
Layout: L’IV Com Sàrl, Villars-sous-Yens, Switzerland.
Printed by the WHO Document Production Services, Geneva, Switzerland.
TABLE OF CONTENTS
Major contributors and acknowledgements . . . . . . . . . . . . . . . . . . . . . . . . . 3
Abbreviations . . . . . . . . . . . . . . . . . . . . . . . . . . . . . . . . . . . . . . . . . . . . . . . . . . . . . . . . . . . 4
Glossary . . . . . . . . . . . . . . . . . . . . . . . . . . . . . . . . . . . . . . . . . . . . . . . . . . . . . . . . . . . . . . . . . . 5
Executive summary . . . . . . . . . . . . . . . . . . . . . . . . . . . . . . . . . . . . . . . . . . . . . . . . . . . . . 6
1. Introduction . . . . . . . . . . . . . . . . . . . . . . . . . . . . . . . . . . . . . . . . . . . . . . . . . . . . . . . . . . 8
2. Overview of methodology . . . . . . . . . . . . . . . . . . . . . . . . . . . . . . . . . . . . . . . . . . 9
2.1 Scope . . . . . . . . . . . . . . . . . . . . . . . . . . . . . . . . . . . . . . . . . . . . . . . . . . . . . . . . . . . . . . . . 9
2.2 Identification of health worker needs to meet universal health coverage and SDG-related targets . . . . . . . . . . . . . . . . . . . . . . . . . . . . . . . . . . . . . . . . . . . . . . . . . . . . . . . . . 9
2.3 Estimated current and forecasted supply of health workers . . . . . . . . . . . . . . . . . . . . . . . . 11
2.4 Current and forecasted needs-based shortages of health workers . . . . . . . . . . . . . . . . . . . 112.5 Estimating annual average exponential growth rates to overcome needs-based shortages . 11
3. Results . . . . . . . . . . . . . . . . . . . . . . . . . . . . . . . . . . . . . . . . . . . . . . . . . . . . . . . . . . . . . . . 123.1 A novel SDG-based estimate of health worker needs . . . . . . . . . . . . . . . . . . . . . . . . . . . . . 12
3.2 Total numbers of health workers needed to meet the SDG index threshold, estimated for 2013 and forecasted for 2030. . . . . . . . . . . . . . . . . . . . . . . . . . . . . . . . . . . . . . 14
3.3 Estimated current supply of health workers (2013) . . . . . . . . . . . . . . . . . . . . . . . . . . . . . . 14
3.4 Forecasted supply of health workers in 2030 . . . . . . . . . . . . . . . . . . . . . . . . . . . . . . . . . . 17
3.5 Current and forecasted needs-based health worker shortages in relation to the SDG index threshold . . . . . . . . . . . . . . . . . . . . . . . . . . . . . . . . . . . . . . . . . . . . . . . . . . . . . 18
4. Discussion . . . . . . . . . . . . . . . . . . . . . . . . . . . . . . . . . . . . . . . . . . . . . . . . . . . . . . . . . . . 20
4.1 Limitations . . . . . . . . . . . . . . . . . . . . . . . . . . . . . . . . . . . . . . . . . . . . . . . . . . . . . . . . . . . . 20
4.2 Interpretation: estimating health worker needs . . . . . . . . . . . . . . . . . . . . . . . . . . . . . . . . . 20
4.3 Current and forecasted supply of health workers . . . . . . . . . . . . . . . . . . . . . . . . . . . . . . . . 21
4.4 Current and forecasted needs-based shortage of health workers . . . . . . . . . . . . . . . . . . . . 21
4.5 Research agenda . . . . . . . . . . . . . . . . . . . . . . . . . . . . . . . . . . . . . . . . . . . . . . . . . . . . . . . 21
5. Conclusions and recommendations . . . . . . . . . . . . . . . . . . . . . . . . . . . . . . 23
Annex 1. A novel SDG-based benchmark of health worker needs . . 24
Annex 2. Methods for projecting supply . . . . . . . . . . . . . . . . . . . . . . . . . . . . . 28
Annex 3. Current and forecasted estimates of needs-based shortage of health workers . . . . . . . . . . . . . . . . . . . . . . . . . . . . . . . . . . . . . . . . . . . 30
References . . . . . . . . . . . . . . . . . . . . . . . . . . . . . . . . . . . . . . . . . . . . . . . . . . . . . . . . . . . . . . 32
1Issue 1, 2016
FiguresFigure 1. Results from the SDG index composite needs-based method: proportion of 12 selected SDG tracer
indicators achieved as a function of health workers per 1000 population (n = 210 countries and territories) . . . . . . . . . . . . 13
Figure 2. SDG composite method: percentile rank order of countries according to level of 12 SDG tracer indicators achieved (n = 210 countries and territories) . . . . . . . . . . . . . . . . . . . . . . . . . . . . . . . . . . . . . . . . . . . . . . . . . . . . . . . 13
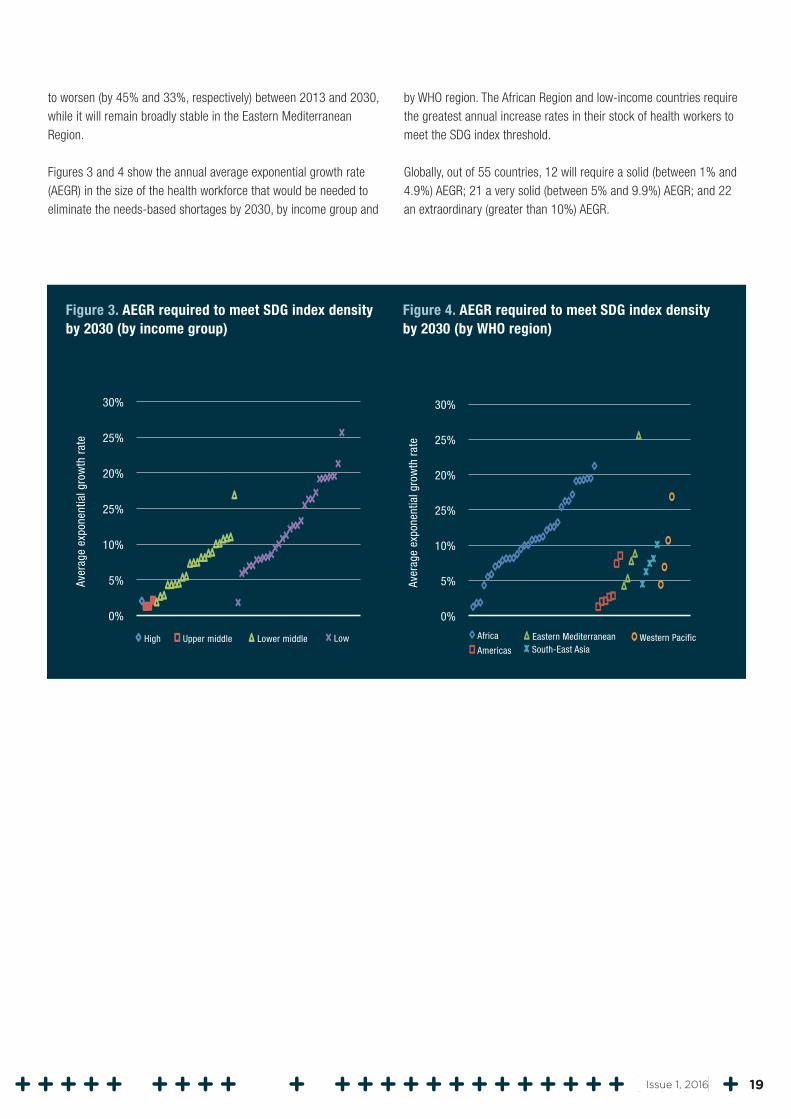
Figure 3. AEGR required to meet SDG index density by 2030 (by income group) . . . . . . . . . . . . . . . . . . . . . . . . . . . . . 19
Figure 4. AEGR required to meet SDG index density by 2030 (by WHO region) . . . . . . . . . . . . . . . . . . . . . . . . . . . . . . 19
TablesTable 1. The 12 selected tracer indicators in the SDG index threshold and their primary classification . . . . . . . . . . . . 12
Table 2. Total numbers of health workers needed (total need) to reach the SDG threshold estimated for 2013
and forecasted for 2030 (by income group and WHO region) . . . . . . . . . . . . . . . . . . . . . . . . . . . . . . . . . . . . . . . . . . . . 14
Table 3. Workforce supply in 2013 . . . . . . . . . . . . . . . . . . . . . . . . . . . . . . . . . . . . . . . . . . . . . . . . . . . . . . . . . . . . . . 25
Table 4. Population-weighted density of health workers (per 1000 population) by cadre and income group, 2013 . . . . 15
Table 5. Range of 2013 health worker density (per 1000 population) estimates by cadre, income group and region (unweighted by population size) . . . . . . . . . . . . . . . . . . . . . . . . . . . . . . . . . . . . . . . . . . . . . . . . . . . . . . . . . . . . . . . . 16
Table 6. Range (25th, 50th and 75th percentile) of 2013 health worker density (per 1000 population)
estimates by cadre, income group, and region (unweighted by population size) . . . . . . . . . . . . . . . . . . . . . . . . . . . . . 16
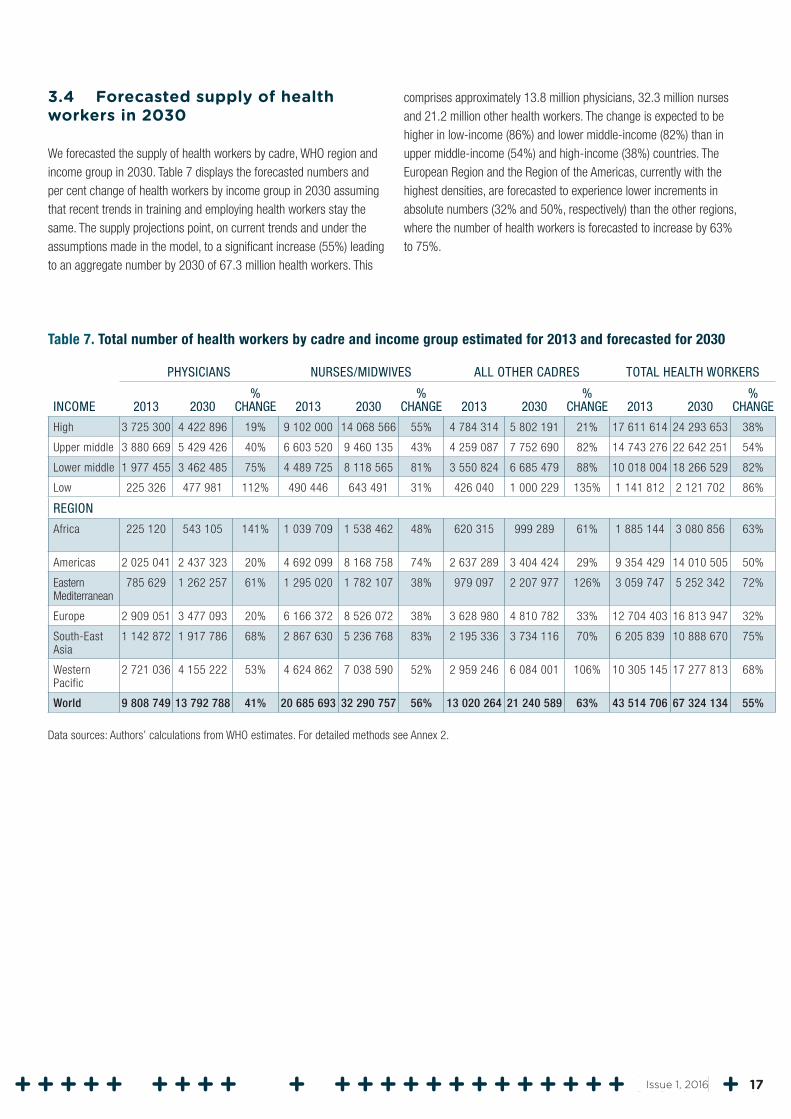
Table 7. Total number of health workers by cadre and income group estimated for 2013 and forecasted for 2030 . . . 17
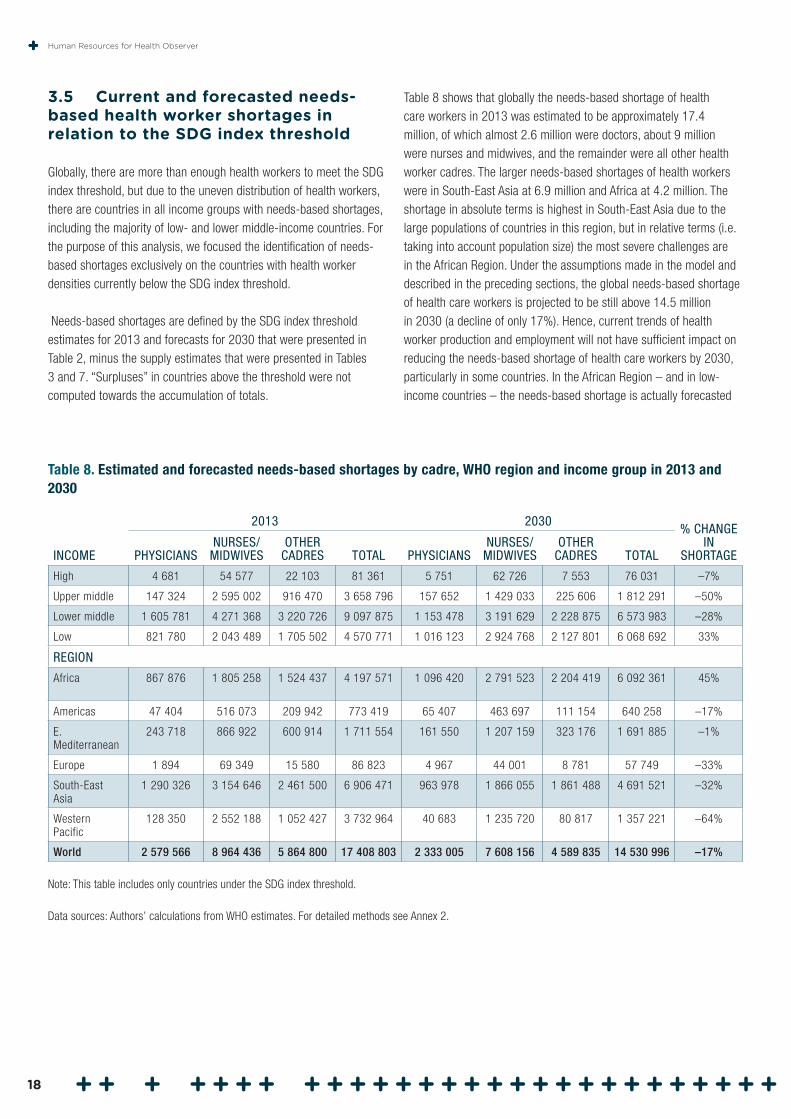
Table 8. Estimated and forecasted needs-based shortages by cadre, WHO region and income group in
2013 and 2030 . . . . . . . . . . . . . . . . . . . . . . . . . . . . . . . . . . . . . . . . . . . . . . . . . . . . . . . . . . . . . . . . . . . . . . . . . . . . 18
Table A1.1 SDG tracer indicators, GHE causes and DALYs lost . . . . . . . . . . . . . . . . . . . . . . . . . . . . . . . . . . . . . . . . . . 24
Table A1.2 Conversion of DALYs to SDG weights . . . . . . . . . . . . . . . . . . . . . . . . . . . . . . . . . . . . . . . . . . . . . . . . . . . . 26
Table A2.1 Physicians per 1000 population data outliers . . . . . . . . . . . . . . . . . . . . . . . . . . . . . . . . . . . . . . . . . . . . . . 28
Table A3.1 Estimated and forecasted SDG threshold-based health worker shortages by cadre, income
group and region, 2013 and 2030 (threshold value = 4.45) . . . . . . . . . . . . . . . . . . . . . . . . . . . . . . . . . . . . . . . . . . . 30
Table A3.2 Estimated and forecasted SEM threshold-based health worker shortages by cadre, income
group and region, 2013 and 2030 (threshold value = 2.97) . . . . . . . . . . . . . . . . . . . . . . . . . . . . . . . . . . . . . . . . . . . 31
Table A3.3 Estimated and forecasted DEA threshold-based health worker shortages by cadre, income
group and region, 2013 and 2030 (threshold value = 2.56) . . . . . . . . . . . . . . . . . . . . . . . . . . . . . . . . . . . . . . . . . . . 31
Human Resources for Health Observer
2
The development of this paper was coordinated by Giorgio Cometto (Global Health Workforce Alliance, WHO), under the oversight of James Campbell (Director, Health Workforce, and Executive Director, Global Health Workforce Alliance, WHO).
The quantitative analyses included in this report were conducted by the following individuals and institutions: Richard Scheffler (School of Public Health and the Goldman School of Public Policy at the University of California, Berkeley); Kate Tulenko (IntraHealth International, Inc.); Tim Bruckner (University of California, Irvine); Eric L. Keuffel (independent consultant); Jenny Liu (Institute for Health and Aging, Social and Behavioral Sciences, School of Nursing, University of California, San Francisco); Alexander Preker (Health Investment and Financing Corporation); Barbara Stilwell (IntraHealth International, Inc.); and Julia Brasileiro (IntraHealth International, Inc.).
The development and implementation of the methodology, and the conceptualization and write-up of the text of the report, including the interpretation and policy implications, was a collaborative effort among the WHO Secretariat and the individuals listed above.
A technical advisory group provided strategic guidance, methodological advice and peer review of earlier drafts of the report: David Evans (University of Basel, Switzerland), Angelica Sousa, Amani Siyam, Karin Stenberg and Tessa Edejer (WHO), Octavian Bivol and Gabriele Fontana (UNICEF), Xenia Scheil-Adlung (ILO), Akiko Maeda (World Bank), Tomoko Ono (JICA), Gilles Dussault (Instituto de Higiene e Medicina Tropical, Lisbon, Portugal), and Remco Van de Pas (Institute of Tropical Medicine, Antwerp, Belgium).
Melanie Cowan, Leanne Riley, Gretchen Stevens and Daniel Hogan (WHO) availed health service coverage data, which were used to determine health workforce requirements.
Financial support for this study was provided by Norad through a grant to the Global Health Workforce Alliance, a partnership hosted and administered by WHO.
Suggested citation: Richard Scheffler,* Giorgio Cometto,* Kate Tulenko, Tim Bruckner, Jenny Liu, Eric L. Keuffel, Alexander Preker, Barbara Stilwell, Julia Brasileiro, James Campbell. Health workforce requirements for universal health coverage and the Sustainable Development Goals – Background paper N.1 to the WHO Global Strategy on Human Resources for Health: Workforce 2030. Human Resources for Health Observer Series No 17. World Health Organization, 2016.
*Denotes co-first authors
Correspondence: [email protected]
Major contributors and acknowledgements
3Issue 1, 2016
AEGR average exponential growth rateDALY disability-adjusted life-yearDEA data envelopment analysisDTP3 diphtheria–tetanus–pertussisGHE Global Health EstimatesGHWA Global Health Workforce AllianceICT information and communications technologyILO International Labour OrganizationIV instrumental variableMDG Millennium Development GoalOECD Organisation for Economic Co-operation and DevelopmentSDG Sustainable Development GoalSEM simultaneous equation methodWHO World Health Organization
AbbreviationsHuman Resources for Health Observer
4
Demand. The number of health workers that the health system (both public and private) can support in terms of funded positions or economic demand for services. Demand correlates with the economic capacity of a country, with higher levels of resource availability resulting in greater demand for health services and thus for health workers to provide them.
Health workers. All people engaged in actions whose primary intent is to enhance health.
Need. The number of health workers required to attain the objectives of the health system. There are various approaches to calculating this number – for example, it is sometimes estimated based on a threshold of minimum availability of health workers to address priority population health issues, or in relation to the specific service delivery profile and requirements of a health system. “Need” for health workers is defined in this analysis as the number of health workers required to meet the threshold defined within this paper.
Needs-based shortage. The situation in which the number of health workers needed to meet population health needs exceeds the available supply of health workers.
Supply. The number of health workers that are available in a country. Future supply can be estimated taking into account a variety of parameters, including education capacity, attrition and retention.
Glossary
5Issue 1, 2016
Introduction
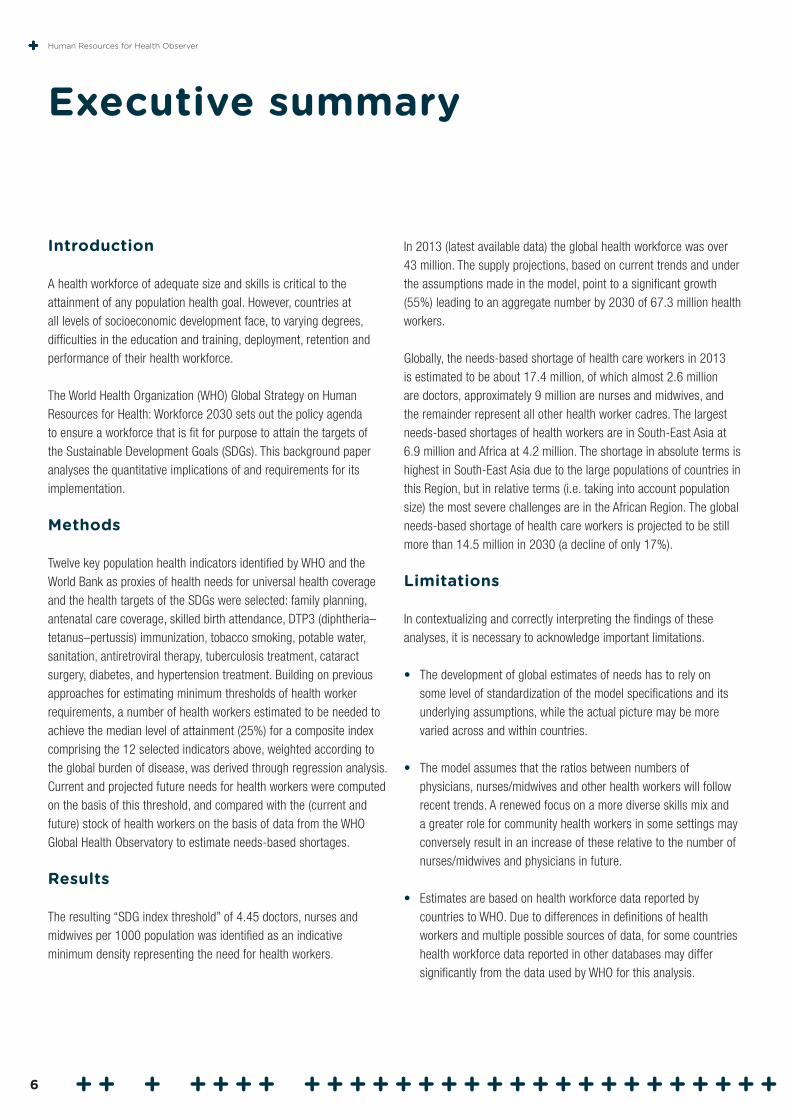
A health workforce of adequate size and skills is critical to the attainment of any population health goal. However, countries at all levels of socioeconomic development face, to varying degrees, difficulties in the education and training, deployment, retention and performance of their health workforce.
The World Health Organization (WHO) Global Strategy on Human Resources for Health: Workforce 2030 sets out the policy agenda to ensure a workforce that is fit for purpose to attain the targets of the Sustainable Development Goals (SDGs). This background paper analyses the quantitative implications of and requirements for its implementation.
Methods
Twelve key population health indicators identified by WHO and the World Bank as proxies of health needs for universal health coverage and the health targets of the SDGs were selected: family planning, antenatal care coverage, skilled birth attendance, DTP3 (diphtheria–tetanus–pertussis) immunization, tobacco smoking, potable water, sanitation, antiretroviral therapy, tuberculosis treatment, cataract surgery, diabetes, and hypertension treatment. Building on previous approaches for estimating minimum thresholds of health worker requirements, a number of health workers estimated to be needed to achieve the median level of attainment (25%) for a composite index comprising the 12 selected indicators above, weighted according to the global burden of disease, was derived through regression analysis. Current and projected future needs for health workers were computed on the basis of this threshold, and compared with the (current and future) stock of health workers on the basis of data from the WHO Global Health Observatory to estimate needs-based shortages.
Results
The resulting “SDG index threshold” of 4.45 doctors, nurses and midwives per 1000 population was identified as an indicative minimum density representing the need for health workers.
Executive summary
In 2013 (latest available data) the global health workforce was over 43 million. The supply projections, based on current trends and under the assumptions made in the model, point to a significant growth (55%) leading to an aggregate number by 2030 of 67.3 million health workers.
Globally, the needs-based shortage of health care workers in 2013 is estimated to be about 17.4 million, of which almost 2.6 million are doctors, approximately 9 million are nurses and midwives, and the remainder represent all other health worker cadres. The largest needs-based shortages of health workers are in South-East Asia at 6.9 million and Africa at 4.2 million. The shortage in absolute terms is highest in South-East Asia due to the large populations of countries in this Region, but in relative terms (i.e. taking into account population size) the most severe challenges are in the African Region. The global needs-based shortage of health care workers is projected to be still more than 14.5 million in 2030 (a decline of only 17%).
Limitations
In contextualizing and correctly interpreting the findings of these analyses, it is necessary to acknowledge important limitations.
• The development of global estimates of needs has to rely on some level of standardization of the model specifications and its underlying assumptions, while the actual picture may be more varied across and within countries.
• The model assumes that the ratios between numbers of physicians, nurses/midwives and other health workers will follow recent trends. A renewed focus on a more diverse skills mix and a greater role for community health workers in some settings may conversely result in an increase of these relative to the number of nurses/midwives and physicians in future.
• Estimates are based on health workforce data reported by countries to WHO. Due to differences in definitions of health workers and multiple possible sources of data, for some countries health workforce data reported in other databases may differ significantly from the data used by WHO for this analysis.
Human Resources for Health Observer
6
• While efforts were made to collect the best available evidence to inform the analysis, it was not possible to find a strong empirical basis for every variable in the modelling strategy adopted. In such instances, expert knowledge informed the modelling.
Interpretation
By including coverage of noncommunicable diseases in the SDG index, this analysis represents a step forward in terms of identifying health workforce requirements for universal health coverage and the SDGs. The identification of a higher threshold of minimum health workforce availability requirements resulted in greater needs (and needs-based shortages) than all previous estimates. This increase reflects the staffing needed to deliver a more comprehensive range of health services and a transition to people-centred integrated health care.
Current trends of health worker production and employment will not have sufficient impact on reducing the needs-based shortage of health care workers by 2030, particularly in some countries: in the African Region the needs-based shortage is actually forecast to worsen between 2013 and 2030, while it will remain broadly stable in the Eastern Mediterranean Region.
On current trends, by 2030 some parts of the world would face a substantial and widening mismatch between the number of health workers needed to provide essential services (need), the availability of health professionals (supply) and the countries’ capacity to employ them (demand): in the African Region, where many countries are
confronted with fiscal space challenges, a modest growth in the capacity to employ workers is likely to lead to a shortage based on economic demand, with the overall supply of health workers remaining constrained. Both demand and supply will, however, fall short of population needs.
Greater investments will be required in these contexts to boost market-based demand and supply, and to align them more closely with population health needs.
Conclusions and recommendations
These projections and simulations should be understood as a note of caution against complacency. Maintaining the status quo in health worker production and employment is expected to result in too slow a progress (or even a worsening gap, especially in countries that are already lagging behind in their health outcomes) and continuing global imbalances. Substantial efforts are required in the “recruitment, development and training and retention of the health workforce in developing countries” to better align health workforce production and deployment to population needs.
Improving the availability of health workers should be accompanied by corresponding efforts to enhance their distribution, accessibility, performance and productivity. There is potential for greater efficiency in the health workforce by adopting a more diverse and sustainable skills mix geared to service delivery models emphasizing the primary health care approach.
7Issue 1, 2016
Health systems can only function with health workers; improving health service coverage and health outcomes depends on a fit-for-purpose and fit-to-practise health workforce (1). The need for health workers globally is expected to grow significantly in the coming decades as a result of a confluence of factors, including population growth, ageing, changing epidemiology and new technologies. On the horizon are new challenges, including increased prevalence of noncommunicable diseases that require a lifetime of care and management; meeting the health needs of adolescents in “youth bulge” countries; and building resilient public health systems everywhere that can respond quickly and flexibly to epidemics such as Ebola or Middle East respiratory syndrome, as well as contributing to the progressive realization of universal health coverage (2). Efforts to scale up essential interventions to achieve the health-related targets of the Sustainable Development Goals (SDGs) and universal health coverage are likely to be thwarted by insufficient availability of health workers in low- and middle-income countries.
The new World Health Organization (WHO) Global Strategy on Human Resources for Health: Workforce 2030 (the Global Strategy) examines the contemporary evidence and provides policy options and recommendations for transformative actions to effectively tackle the most significant health workforce challenges in the decades to come (3). This background paper was commissioned to inform the Global Strategy by examining and quantifying the health workforce needs for this ambitious agenda. More specifically, it attempts to contribute to the evidence base to address the following policy question:
1. Introduction
The purpose of this report is to help inform countries and the global community in developing appropriate, sustainable and cost-effective strategies to eliminate needs-based shortages. This analysis recognizes that health workforce availability in adequate numbers is only a precondition to effective service coverage: equally important are other attributes of the health workforce, including its accessibility, the acceptability of the care it provides, and its quality and performance (1).
In the context of the transition from the
Millennium Development Goals (MDGs) to the SDGs,
what are the needs (and the corresponding shortage)
of health workers now, and what will they be in 2030 if
present trends continue?
Human Resources for Health Observer
8
This analysis was conducted according to a sequential approach, which entailed:
1. development of a novel approach to estimate health worker needs in 2013 and forecast to 2030;
2. estimation of the current (2013 data) stock of health workers, and projections to 2030 on current trends;
3. calculation of the needs-based shortage of health workers in 2013 and forecast of the same to 2030.
2.1 Scope
The relevance of this analysis applies to the health workforce at large. The quantitative estimates on which it is based are disaggregated according to three subgroups: “physicians”, “nurses/midwives”, and “other cadres”. For the purpose of this report, “other cadres” refers to the seven other cadres of health workers in the WHO Global Health Workforce Statistics database: dentistry personnel, pharmaceutical personnel, laboratory health workers, environment and public health workers, community and traditional health workers, health management and support health workers, and other health workers (which include “medical assistants, dieticians, nutritionists, occupational therapists, medical imaging and therapeutic equipment technicians, optometrists, ophthalmic opticians, physiotherapists, personal care workers, speech pathologists and medical trainees”) (4). The report presents findings according to WHO regional groupings of countries and according to the World Bank-defined income groupings of countries. The estimates refer to health workers in both the public and private sectors.
2. Overview of methodology
2.2 Identification of health worker needs to meet universal health coverage and SDG-related targets
The first step in the analysis was to identify a minimum threshold of health worker numerical availability in relation to health targets in the SDGs. We chose to base the threshold on the sum of doctors and nurses/midwives per 1000 population. This was done for two reasons: (a) to be consistent with the health worker threshold from the 2006 World health report and previous research; and (b) due to the lack of adequate data on the numbers of other cadres of health workers. We recognize that other health workers are critical to the cost-effective delivery of quality health services and we include them in our analyses through a fixed ratio. The analysis was informed by earlier research on the identification of health workforce needs (5–9), as well as by an alternative methodology based in a broader social protection approach to estimate health workforce requirements to attain universal health coverage developed by the International Labour Organization (ILO) (10, 11). The approach used for this analysis, however, marks a departure from prior work in that it represents an entirely novel methodology that identifies health worker minimum availability in relation to attaining high coverage of selected health services used as tracer indicators for universal health coverage (see Annex 1 for details). In developing empirical estimates of minimum requirements of health workers, alternative methodological approaches have been tested.
The approach used in the base case scenario resulted in the identification of an SDG composite index threshold, consisting of the estimated number of skilled health workers needed to reach the minimum proportion of achievement of high coverage (defined as 80% or above) for 12 selected health indicators linked to the health SDG. The minimum proportion of achievement was set to correspond
9Issue 1, 2016
with the median rank of all countries in achievement of the 12 tracers: family planning, antenatal care coverage, skilled birth attendance, DTP3 (diphtheria–tetanus–pertussis) immunization, tobacco smoking, potable water, sanitation, antiretroviral therapy, tuberculosis treatment, cataract surgery, diabetes, and hypertension treatment (see also Figure 1). These indicators had been identified as tracers for universal health coverage in the joint WHO-World Bank 2015 universal health coverage monitoring report, and were adopted for the purpose of this analysis (12). Their relative importance to the development of the SDG index was determined on the basis of the contribution of the diseases to which they refer to the global burden of disease. The value of the SDG composite threshold thus identified was determined to be 4.45 doctors, nurses and midwives per 1000 population.
The second approach to identifying a threshold is a simultaneous equation method (SEM), which is better suited to reflect that health workers typically would jointly cover several of the above health services. Coverage data limitations, however, only allowed this technique to be applied to three indicators: sanitation, DTP vaccine coverage, and four antenatal care visits, using as instrumental variables country factors, including availability of fresh water (for sanitation), country latitude (for DTP), and adolescent fertility rate (for antenatal care). We estimated equations that simultaneously
Box 1. Prior thresholds for health worker needs
The 2006 World health report identified a minimum health worker density of 2.3 skilled health workers (physicians and nurses/midwives) per 1000 population, which was considered generally necessary to attain high coverage (80%) of skilled birth attendance. For nearly 10 years, the 2.3 workers per 1000 threshold has galvanized support and enabled policy-makers and advocates to push for goals and countries to measure their progress. However, this threshold has its limitations in the SDG era: it is based on a single health service (assisted deliveries) that is provided episodically, and its focus is on maternal and newborn health, whereas the SDG agenda refers to a broader range of services, including noncommunicable diseases.
To reflect the broader nature of universal health coverage, the ILO has developed an alternative method to identify a minimum threshold of health worker availability, rooted in an approach that identifies vulnerable countries in terms of their social protection systems and outcomes. Based on this approach, reflected in the World social security report 2010–2011 (13) and in a background paper for the 2010 World health report, the threshold, termed as a “staff access deficit indicator”, identified a minimum workforce availability of 3.4 skilled health workers per 1000 population. This value has subsequently been updated to 4.1 per 1000 (11). The ILO approach, while linked more explicitly to the policy ambition of universal health coverage in the context of broader social protection, does not have a direct empirical link with health service coverage.
Other similar thresholds exist. For instance, a value of 5.9 skilled health professionals (midwives, nurses and physicians) per 1000 population was identified as the workforce requirement for the Ending Preventable Maternal Deaths initiative, which entails reducing global maternal deaths to 50 per 100 000 live births by 2035 (14).
solved the thresholds, resulting in values of 3.99 (sanitation), 0.6 (DTP), and 2.97 (antenatal care) doctors, nurses and midwives per 1000 population. The antenatal care threshold of 2.97 skilled health workers per 1000 population was selected as the value for the SEM threshold, given the weak theoretical and empirical link between health worker availability and sanitation coverage.
The third threshold uses data envelopment analysis (DEA), which derives an efficiency score based on attaining the greatest rate of coverage for SDG tracer indicators per health worker density. Of the 192 countries with sufficient data to contribute to DEA, the 20 most efficient countries yielded a DEA threshold of 2.56 doctors, nurses and midwives per 1000 population.
These different estimates, together with previous ones – described in Box 1 – illustrate the variability in results by applying different conceptual and methodological approaches. Given that data limitations restricted the applicability and evidence base of the SEM model to few services and of the DEA model to few countries, the results obtained through these approaches could not be regarded as representative of countries at large. For these reasons, the estimate based on the SDG index (4.45 doctors, nurses and midwives per 1000 population) was chosen as a basis for the remainder of the analysis.
Human Resources for Health Observer
10
2.3 Estimated current and forecasted supply of health workers
To estimate each country’s current stock of health workers, we retrieved health workforce figures from the WHO Global Health Observatory. Yearly workforce density data were obtained from the WHO Global Health Observatory database for 210 countries and territories. We used 2013 as the base year and used the most recent year of data available for each country. For each country, we calculated the population density of physicians and nurses/midwives for the most recent year for which there were data and adjusted the number to the 2013 populations of these countries. For countries with missing data on health workers (i.e., no values since 2008), we imputed numbers of physicians and nurses/midwives based on average density of physicians and nurses/midwives for each of the four World Bank-designated income groups.
Next, we used available “other cadres” data to estimate, for each World Bank-defined income level, a cadre multiplier that, when multiplied by the total number of physicians and nurses/midwives in that country, provides the estimate of “all other cadres” supply. This process yielded the following “other cadres” multipliers: high income (0.373), upper middle income (0.406), lower middle income (0.549), and low income (0.595).
Supply of health workers was calculated at the country level and aggregated and reported by WHO region and World Bank income group.
The supply of physicians and nurses/midwives was projected to 2030 based on historical data on the increase in densities of physicians and nurse/midwives in each country. To forecast supply, a linear growth rate model was adopted, which assumes that the historical growth rate of physicians and nurses/midwives per capita for each country will continue into the future at the same rate each year; this was
done to avoid underestimating future supply and, as a consequence, overestimating future shortages (see Annex 2 for more details).
2.4 Current and forecasted needs-based shortages of health workers
We used the three thresholds developed in the sections above (SDG composite index, SEM, and DEA) to determine the magnitude of health worker needs-based shortages, taking into account projected population and health workforce growth (15). United Nations projected population growth numbers were used to estimate the former (16), while the forecasted supply of health workers to 2030 was computed through step 2 described above.
We built scenarios to take account of different country contexts and trends. The magnitude of the needs-based shortage of health workers was calculated at the country level and aggregated and reported by WHO region and World Bank income group for each of the different thresholds (see Annex 3).
2.5 Estimating annual average exponential growth rates to overcome needs-based shortages
To assess the feasibility of overcoming needs-based shortages in countries with a value of health worker density below the SDG index value of 4.45 skilled health workers per 1000 population, we calculated the annual average exponential growth rate (AEGR) in supply that would be needed to reach the SDG threshold by 2030. AEGR growth rates were calculated using the formula [ln(n2030/s2013)-ln(s2030/s2013)]/(2030-2013).
Consistently with prior analysis (1), we categorized the level of growth required as low (less than 1%), solid (between 1% and 4.9%), very solid (between 5% and 9.9%) and extraordinary (AEGR greater than 10%).
11Issue 1, 2016
3.1 A novel SDG-based estimate of health worker needs
The 2006 World health report developed a method for estimating health worker needs that was based on the density necessary to achieve 80% coverage of essential health services (such as births with a skilled health worker and immunization), finding that a health worker density of 2.3 skilled health workers (physicians and nurses/midwives) per 1000 population was generally necessary to attain high coverage.
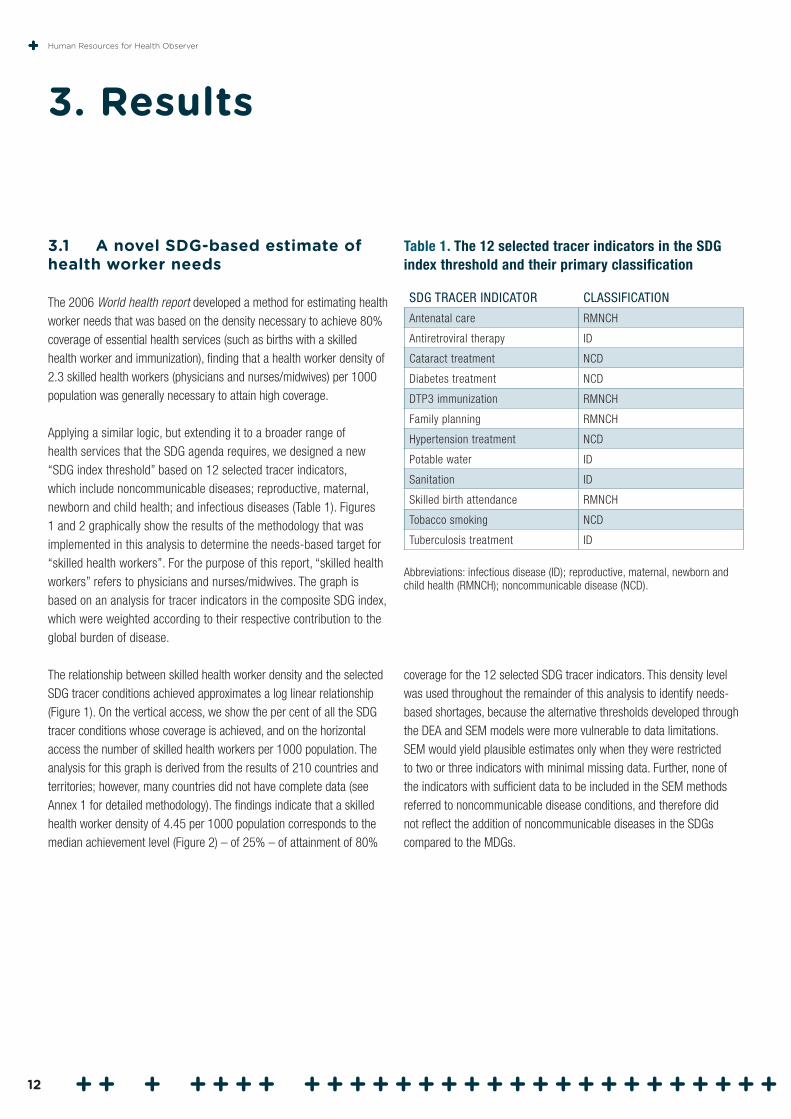
Applying a similar logic, but extending it to a broader range of health services that the SDG agenda requires, we designed a new “SDG index threshold” based on 12 selected tracer indicators, which include noncommunicable diseases; reproductive, maternal, newborn and child health; and infectious diseases (Table 1). Figures 1 and 2 graphically show the results of the methodology that was implemented in this analysis to determine the needs-based target for “skilled health workers”. For the purpose of this report, “skilled health workers” refers to physicians and nurses/midwives. The graph is based on an analysis for tracer indicators in the composite SDG index, which were weighted according to their respective contribution to the global burden of disease.
The relationship between skilled health worker density and the selected SDG tracer conditions achieved approximates a log linear relationship (Figure 1). On the vertical access, we show the per cent of all the SDG tracer conditions whose coverage is achieved, and on the horizontal access the number of skilled health workers per 1000 population. The analysis for this graph is derived from the results of 210 countries and territories; however, many countries did not have complete data (see Annex 1 for detailed methodology). The findings indicate that a skilled health worker density of 4.45 per 1000 population corresponds to the median achievement level (Figure 2) – of 25% – of attainment of 80%
3. Results
coverage for the 12 selected SDG tracer indicators. This density level was used throughout the remainder of this analysis to identify needs-based shortages, because the alternative thresholds developed through the DEA and SEM models were more vulnerable to data limitations. SEM would yield plausible estimates only when they were restricted to two or three indicators with minimal missing data. Further, none of the indicators with sufficient data to be included in the SEM methods referred to noncommunicable disease conditions, and therefore did not reflect the addition of noncommunicable diseases in the SDGs compared to the MDGs.
Table 1. The 12 selected tracer indicators in the SDG index threshold and their primary classification
SDG TRACER INDICATOR CLASSIFICATION
Antenatal care RMNCH
Antiretroviral therapy ID
Cataract treatment NCD
Diabetes treatment NCD
DTP3 immunization RMNCH
Family planning RMNCH
Hypertension treatment NCD
Potable water ID
Sanitation ID
Skilled birth attendance RMNCH
Tobacco smoking NCD
Tuberculosis treatment ID
Abbreviations: infectious disease (ID); reproductive, maternal, newborn and child health (RMNCH); noncommunicable disease (NCD).
Human Resources for Health Observer
12
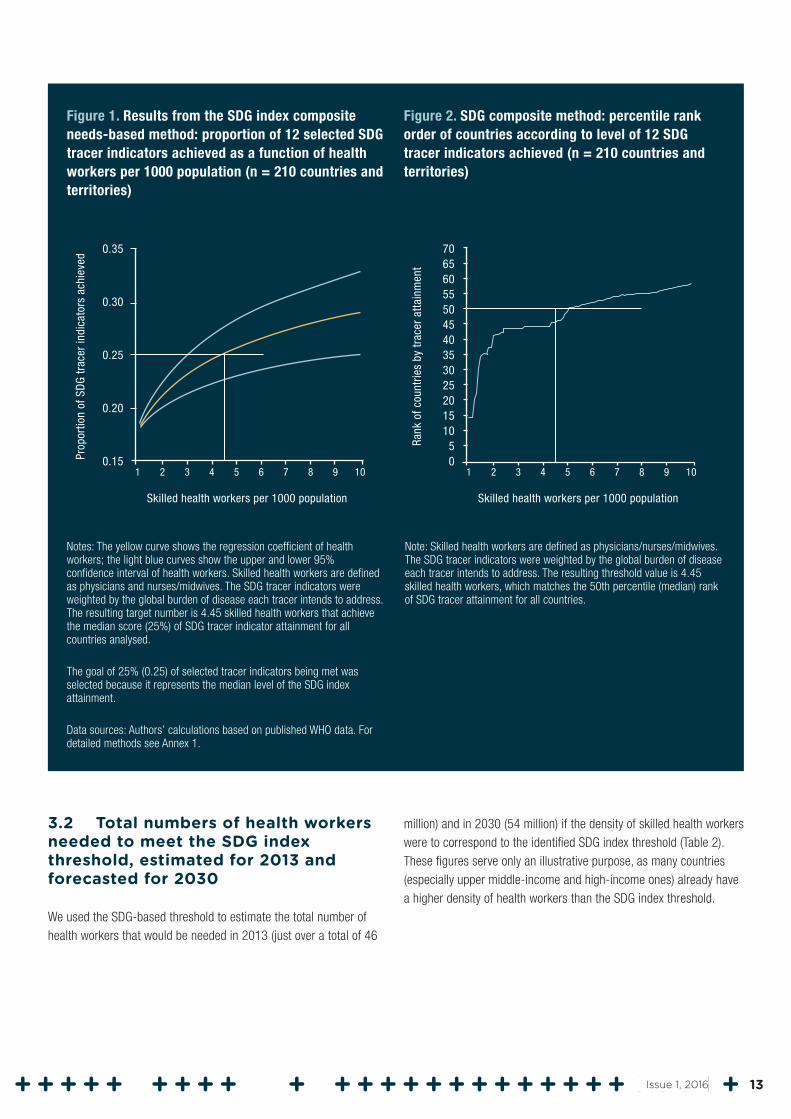
Figure 1. Results from the SDG index composite needs-based method: proportion of 12 selected SDG tracer indicators achieved as a function of health workers per 1000 population (n = 210 countries and territories)
Notes: The yellow curve shows the regression coefficient of health workers; the light blue curves show the upper and lower 95% confidence interval of health workers. Skilled health workers are defined as physicians and nurses/midwives. The SDG tracer indicators were weighted by the global burden of disease each tracer intends to address. The resulting target number is 4.45 skilled health workers that achieve the median score (25%) of SDG tracer indicator attainment for all countries analysed.
The goal of 25% (0.25) of selected tracer indicators being met was selected because it represents the median level of the SDG index attainment.
Data sources: Authors’ calculations based on published WHO data. For detailed methods see Annex 1.
Figure 2. SDG composite method: percentile rank order of countries according to level of 12 SDG tracer indicators achieved (n = 210 countries and territories)
Note: Skilled health workers are defined as physicians/nurses/midwives. The SDG tracer indicators were weighted by the global burden of disease each tracer intends to address. The resulting threshold value is 4.45 skilled health workers, which matches the 50th percentile (median) rank of SDG tracer attainment for all countries.
3.2 Total numbers of health workers needed to meet the SDG index threshold, estimated for 2013 and forecasted for 2030
We used the SDG-based threshold to estimate the total number of health workers that would be needed in 2013 (just over a total of 46
million) and in 2030 (54 million) if the density of skilled health workers were to correspond to the identified SDG index threshold (Table 2). These figures serve only an illustrative purpose, as many countries (especially upper middle-income and high-income ones) already have a higher density of health workers than the SDG index threshold.
0.20
0.25
Skilled health workers per 1000 population
0.15
0.35
Prop
ortio
n of
SD
G tr
acer
indi
cato
rs a
chie
ved
10
0.30
1 2 3 4 5 6 7 8 9
5
35
Skilled health workers per 1000 population
0
70
Rank
of c
ount
ries
by tr
acer
atta
inm
ent
10
55
1 2 3 4 5 6 7 8 9
1015202530
404550
6065
13Issue 1, 2016
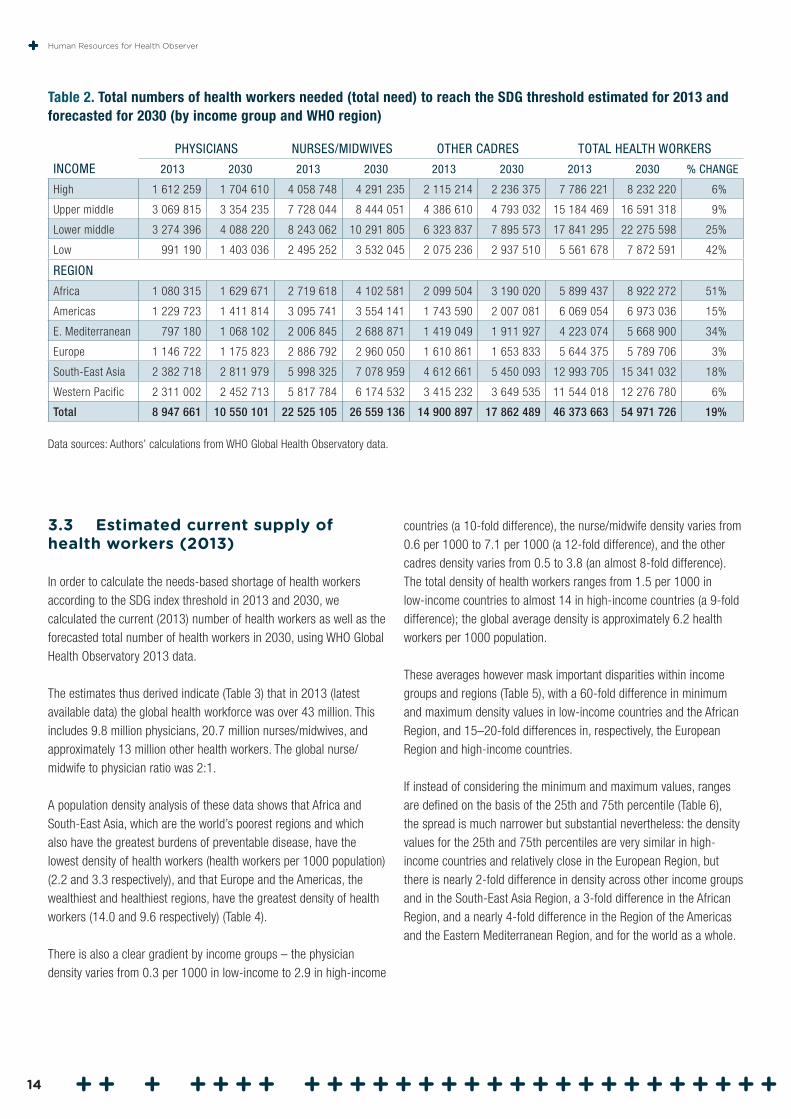
Table 2. Total numbers of health workers needed (total need) to reach the SDG threshold estimated for 2013 and forecasted for 2030 (by income group and WHO region)
INCOME
PHYSICIANS NURSES/MIDWIVES OTHER CADRES TOTAL HEALTH WORKERS
2013 2030 2013 2030 2013 2030 2013 2030 % CHANGE
High 1 612 259 1 704 610 4 058 748 4 291 235 2 115 214 2 236 375 7 786 221 8 232 220 6%
Upper middle 3 069 815 3 354 235 7 728 044 8 444 051 4 386 610 4 793 032 15 184 469 16 591 318 9%
Lower middle 3 274 396 4 088 220 8 243 062 10 291 805 6 323 837 7 895 573 17 841 295 22 275 598 25%
Low 991 190 1 403 036 2 495 252 3 532 045 2 075 236 2 937 510 5 561 678 7 872 591 42%
REGION
Africa 1 080 315 1 629 671 2 719 618 4 102 581 2 099 504 3 190 020 5 899 437 8 922 272 51%
Americas 1 229 723 1 411 814 3 095 741 3 554 141 1 743 590 2 007 081 6 069 054 6 973 036 15%
E. Mediterranean 797 180 1 068 102 2 006 845 2 688 871 1 419 049 1 911 927 4 223 074 5 668 900 34%
Europe 1 146 722 1 175 823 2 886 792 2 960 050 1 610 861 1 653 833 5 644 375 5 789 706 3%
South-East Asia 2 382 718 2 811 979 5 998 325 7 078 959 4 612 661 5 450 093 12 993 705 15 341 032 18%
Western Pacific 2 311 002 2 452 713 5 817 784 6 174 532 3 415 232 3 649 535 11 544 018 12 276 780 6%
Total 8 947 661 10 550 101 22 525 105 26 559 136 14 900 897 17 862 489 46 373 663 54 971 726 19%
Data sources: Authors’ calculations from WHO Global Health Observatory data.
3.3 Estimated current supply of health workers (2013)
In order to calculate the needs-based shortage of health workers according to the SDG index threshold in 2013 and 2030, we calculated the current (2013) number of health workers as well as the forecasted total number of health workers in 2030, using WHO Global Health Observatory 2013 data.
The estimates thus derived indicate (Table 3) that in 2013 (latest available data) the global health workforce was over 43 million. This includes 9.8 million physicians, 20.7 million nurses/midwives, and approximately 13 million other health workers. The global nurse/midwife to physician ratio was 2:1.
A population density analysis of these data shows that Africa and South-East Asia, which are the world’s poorest regions and which also have the greatest burdens of preventable disease, have the lowest density of health workers (health workers per 1000 population) (2.2 and 3.3 respectively), and that Europe and the Americas, the wealthiest and healthiest regions, have the greatest density of health workers (14.0 and 9.6 respectively) (Table 4).
There is also a clear gradient by income groups – the physician density varies from 0.3 per 1000 in low-income to 2.9 in high-income
countries (a 10-fold difference), the nurse/midwife density varies from 0.6 per 1000 to 7.1 per 1000 (a 12-fold difference), and the other cadres density varies from 0.5 to 3.8 (an almost 8-fold difference). The total density of health workers ranges from 1.5 per 1000 in low-income countries to almost 14 in high-income countries (a 9-fold difference); the global average density is approximately 6.2 health workers per 1000 population.
These averages however mask important disparities within income groups and regions (Table 5), with a 60-fold difference in minimum and maximum density values in low-income countries and the African Region, and 15–20-fold differences in, respectively, the European Region and high-income countries.
If instead of considering the minimum and maximum values, ranges are defined on the basis of the 25th and 75th percentile (Table 6), the spread is much narrower but substantial nevertheless: the density values for the 25th and 75th percentiles are very similar in high-income countries and relatively close in the European Region, but there is nearly 2-fold difference in density across other income groups and in the South-East Asia Region, a 3-fold difference in the African Region, and a nearly 4-fold difference in the Region of the Americas and the Eastern Mediterranean Region, and for the world as a whole.
Human Resources for Health Observer
14
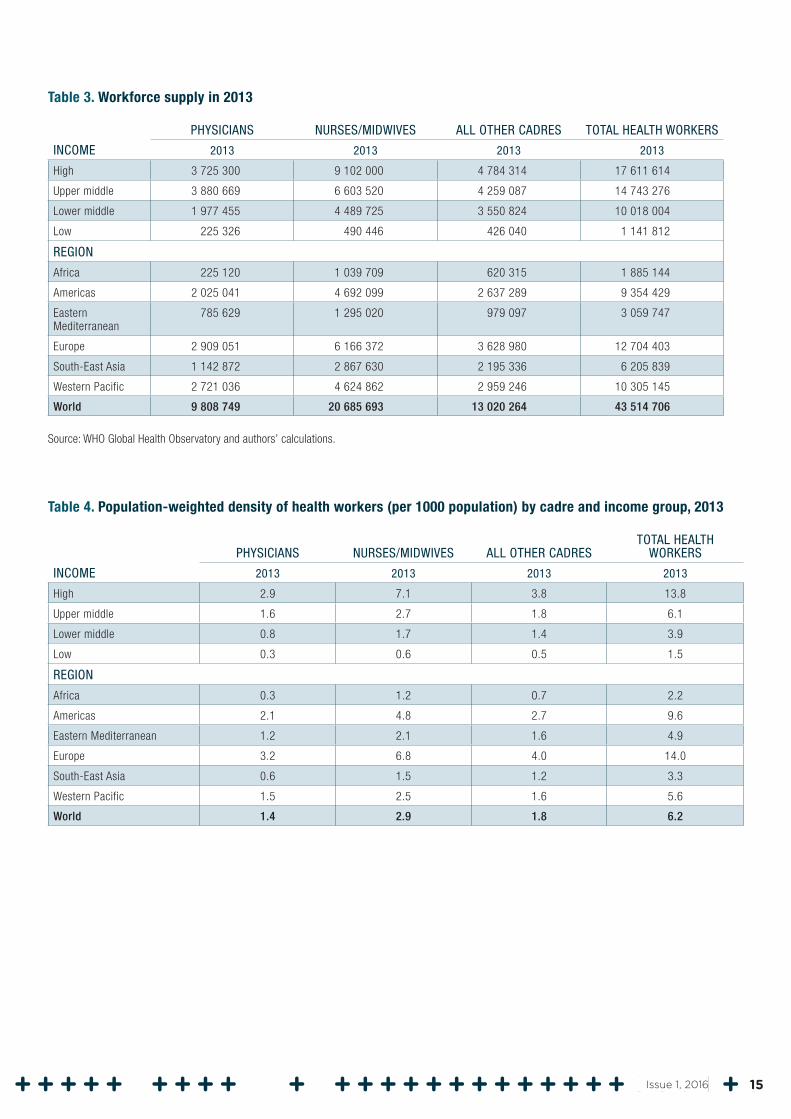
Table 3. Workforce supply in 2013
INCOME
PHYSICIANS NURSES/MIDWIVES ALL OTHER CADRES TOTAL HEALTH WORKERS
2013 2013 2013 2013
High 3 725 300 9 102 000 4 784 314 17 611 614
Upper middle 3 880 669 6 603 520 4 259 087 14 743 276
Lower middle 1 977 455 4 489 725 3 550 824 10 018 004
Low 225 326 490 446 426 040 1 141 812
REGION
Africa 225 120 1 039 709 620 315 1 885 144
Americas 2 025 041 4 692 099 2 637 289 9 354 429
Eastern Mediterranean
785 629 1 295 020 979 097 3 059 747
Europe 2 909 051 6 166 372 3 628 980 12 704 403
South-East Asia 1 142 872 2 867 630 2 195 336 6 205 839
Western Pacific 2 721 036 4 624 862 2 959 246 10 305 145
World 9 808 749 20 685 693 13 020 264 43 514 706
Source: WHO Global Health Observatory and authors’ calculations.
Table 4. Population-weighted density of health workers (per 1000 population) by cadre and income group, 2013
INCOME
PHYSICIANS NURSES/MIDWIVES ALL OTHER CADRESTOTAL HEALTH
WORKERS
2013 2013 2013 2013
High 2.9 7.1 3.8 13.8
Upper middle 1.6 2.7 1.8 6.1
Lower middle 0.8 1.7 1.4 3.9
Low 0.3 0.6 0.5 1.5
REGION
Africa 0.3 1.2 0.7 2.2
Americas 2.1 4.8 2.7 9.6
Eastern Mediterranean 1.2 2.1 1.6 4.9
Europe 3.2 6.8 4.0 14.0
South-East Asia 0.6 1.5 1.2 3.3
Western Pacific 1.5 2.5 1.6 5.6
World 1.4 2.9 1.8 6.2
15Issue 1, 2016
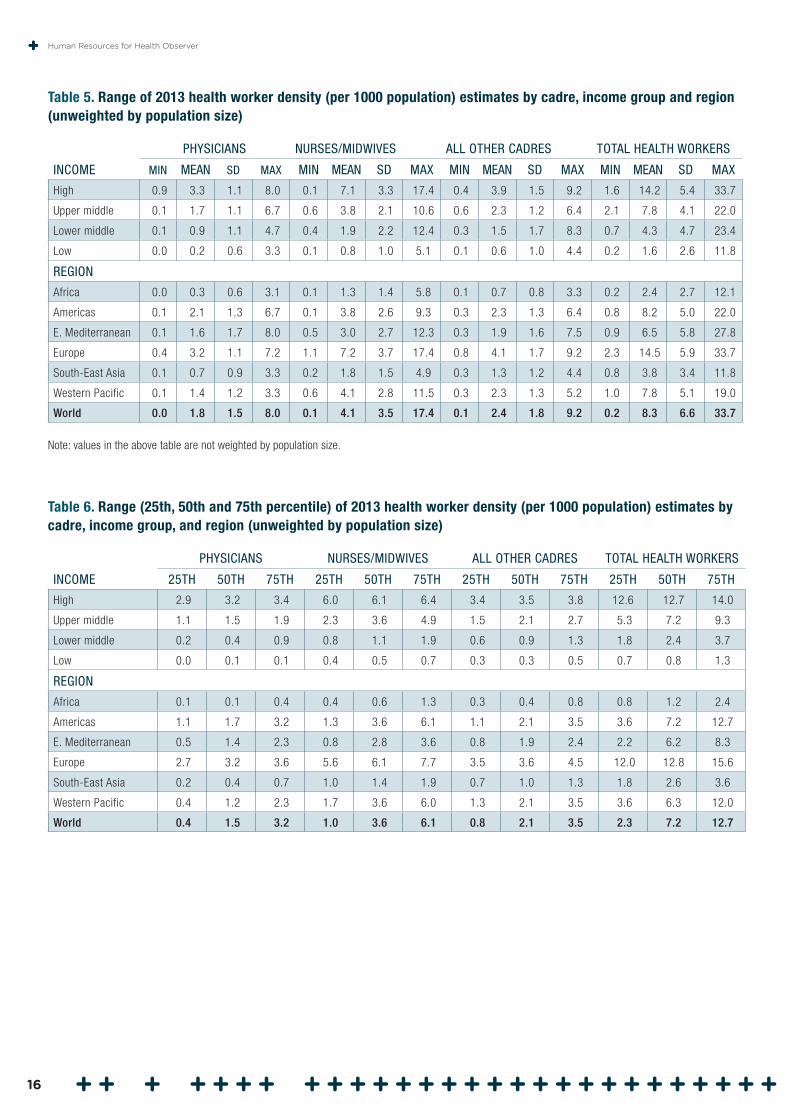
Table 5. Range of 2013 health worker density (per 1000 population) estimates by cadre, income group and region (unweighted by population size)
INCOME
PHYSICIANS NURSES/MIDWIVES ALL OTHER CADRES TOTAL HEALTH WORKERS
MIN MEAN SD MAX MIN MEAN SD MAX MIN MEAN SD MAX MIN MEAN SD MAX
High 0.9 3.3 1.1 8.0 0.1 7.1 3.3 17.4 0.4 3.9 1.5 9.2 1.6 14.2 5.4 33.7
Upper middle 0.1 1.7 1.1 6.7 0.6 3.8 2.1 10.6 0.6 2.3 1.2 6.4 2.1 7.8 4.1 22.0
Lower middle 0.1 0.9 1.1 4.7 0.4 1.9 2.2 12.4 0.3 1.5 1.7 8.3 0.7 4.3 4.7 23.4
Low 0.0 0.2 0.6 3.3 0.1 0.8 1.0 5.1 0.1 0.6 1.0 4.4 0.2 1.6 2.6 11.8
REGION
Africa 0.0 0.3 0.6 3.1 0.1 1.3 1.4 5.8 0.1 0.7 0.8 3.3 0.2 2.4 2.7 12.1
Americas 0.1 2.1 1.3 6.7 0.1 3.8 2.6 9.3 0.3 2.3 1.3 6.4 0.8 8.2 5.0 22.0
E. Mediterranean 0.1 1.6 1.7 8.0 0.5 3.0 2.7 12.3 0.3 1.9 1.6 7.5 0.9 6.5 5.8 27.8
Europe 0.4 3.2 1.1 7.2 1.1 7.2 3.7 17.4 0.8 4.1 1.7 9.2 2.3 14.5 5.9 33.7
South-East Asia 0.1 0.7 0.9 3.3 0.2 1.8 1.5 4.9 0.3 1.3 1.2 4.4 0.8 3.8 3.4 11.8
Western Pacific 0.1 1.4 1.2 3.3 0.6 4.1 2.8 11.5 0.3 2.3 1.3 5.2 1.0 7.8 5.1 19.0
World 0.0 1.8 1.5 8.0 0.1 4.1 3.5 17.4 0.1 2.4 1.8 9.2 0.2 8.3 6.6 33.7
Note: values in the above table are not weighted by population size.
Table 6. Range (25th, 50th and 75th percentile) of 2013 health worker density (per 1000 population) estimates by cadre, income group, and region (unweighted by population size)
INCOME
PHYSICIANS NURSES/MIDWIVES ALL OTHER CADRES TOTAL HEALTH WORKERS
25TH 50TH 75TH 25TH 50TH 75TH 25TH 50TH 75TH 25TH 50TH 75TH
High 2.9 3.2 3.4 6.0 6.1 6.4 3.4 3.5 3.8 12.6 12.7 14.0
Upper middle 1.1 1.5 1.9 2.3 3.6 4.9 1.5 2.1 2.7 5.3 7.2 9.3
Lower middle 0.2 0.4 0.9 0.8 1.1 1.9 0.6 0.9 1.3 1.8 2.4 3.7
Low 0.0 0.1 0.1 0.4 0.5 0.7 0.3 0.3 0.5 0.7 0.8 1.3
REGION
Africa 0.1 0.1 0.4 0.4 0.6 1.3 0.3 0.4 0.8 0.8 1.2 2.4
Americas 1.1 1.7 3.2 1.3 3.6 6.1 1.1 2.1 3.5 3.6 7.2 12.7
E. Mediterranean 0.5 1.4 2.3 0.8 2.8 3.6 0.8 1.9 2.4 2.2 6.2 8.3
Europe 2.7 3.2 3.6 5.6 6.1 7.7 3.5 3.6 4.5 12.0 12.8 15.6
South-East Asia 0.2 0.4 0.7 1.0 1.4 1.9 0.7 1.0 1.3 1.8 2.6 3.6
Western Pacific 0.4 1.2 2.3 1.7 3.6 6.0 1.3 2.1 3.5 3.6 6.3 12.0
World 0.4 1.5 3.2 1.0 3.6 6.1 0.8 2.1 3.5 2.3 7.2 12.7
Human Resources for Health Observer
16
3.4 Forecasted supply of health workers in 2030
We forecasted the supply of health workers by cadre, WHO region and income group in 2030. Table 7 displays the forecasted numbers and per cent change of health workers by income group in 2030 assuming that recent trends in training and employing health workers stay the same. The supply projections point, on current trends and under the assumptions made in the model, to a significant increase (55%) leading to an aggregate number by 2030 of 67.3 million health workers. This
comprises approximately 13.8 million physicians, 32.3 million nurses and 21.2 million other health workers. The change is expected to be higher in low-income (86%) and lower middle-income (82%) than in upper middle-income (54%) and high-income (38%) countries. The European Region and the Region of the Americas, currently with the highest densities, are forecasted to experience lower increments in absolute numbers (32% and 50%, respectively) than the other regions, where the number of health workers is forecasted to increase by 63% to 75%.
Table 7. Total number of health workers by cadre and income group estimated for 2013 and forecasted for 2030
INCOME
PHYSICIANS NURSES/MIDWIVES ALL OTHER CADRES TOTAL HEALTH WORKERS
2013 2030%
CHANGE 2013 2030%
CHANGE 2013 2030%
CHANGE 2013 2030%
CHANGE
High 3 725 300 4 422 896 19% 9 102 000 14 068 566 55% 4 784 314 5 802 191 21% 17 611 614 24 293 653 38%
Upper middle 3 880 669 5 429 426 40% 6 603 520 9 460 135 43% 4 259 087 7 752 690 82% 14 743 276 22 642 251 54%
Lower middle 1 977 455 3 462 485 75% 4 489 725 8 118 565 81% 3 550 824 6 685 479 88% 10 018 004 18 266 529 82%
Low 225 326 477 981 112% 490 446 643 491 31% 426 040 1 000 229 135% 1 141 812 2 121 702 86%
REGION
Africa 225 120 543 105 141% 1 039 709 1 538 462 48% 620 315 999 289 61% 1 885 144 3 080 856 63%
Americas 2 025 041 2 437 323 20% 4 692 099 8 168 758 74% 2 637 289 3 404 424 29% 9 354 429 14 010 505 50%
Eastern Mediterranean
785 629 1 262 257 61% 1 295 020 1 782 107 38% 979 097 2 207 977 126% 3 059 747 5 252 342 72%
Europe 2 909 051 3 477 093 20% 6 166 372 8 526 072 38% 3 628 980 4 810 782 33% 12 704 403 16 813 947 32%
South-East Asia
1 142 872 1 917 786 68% 2 867 630 5 236 768 83% 2 195 336 3 734 116 70% 6 205 839 10 888 670 75%
Western Pacific
2 721 036 4 155 222 53% 4 624 862 7 038 590 52% 2 959 246 6 084 001 106% 10 305 145 17 277 813 68%
World 9 808 749 13 792 788 41% 20 685 693 32 290 757 56% 13 020 264 21 240 589 63% 43 514 706 67 324 134 55%
Data sources: Authors’ calculations from WHO estimates. For detailed methods see Annex 2.
17Issue 1, 2016
3.5 Current and forecasted needs-based health worker shortages in relation to the SDG index threshold
Globally, there are more than enough health workers to meet the SDG index threshold, but due to the uneven distribution of health workers, there are countries in all income groups with needs-based shortages, including the majority of low- and lower middle-income countries. For the purpose of this analysis, we focused the identification of needs-based shortages exclusively on the countries with health worker densities currently below the SDG index threshold.
Needs-based shortages are defined by the SDG index threshold estimates for 2013 and forecasts for 2030 that were presented in Table 2, minus the supply estimates that were presented in Tables 3 and 7. “Surpluses” in countries above the threshold were not computed towards the accumulation of totals.
Table 8 shows that globally the needs-based shortage of health care workers in 2013 was estimated to be approximately 17.4 million, of which almost 2.6 million were doctors, about 9 million were nurses and midwives, and the remainder were all other health worker cadres. The larger needs-based shortages of health workers were in South-East Asia at 6.9 million and Africa at 4.2 million. The shortage in absolute terms is highest in South-East Asia due to the large populations of countries in this region, but in relative terms (i.e. taking into account population size) the most severe challenges are in the African Region. Under the assumptions made in the model and described in the preceding sections, the global needs-based shortage of health care workers is projected to be still above 14.5 million in 2030 (a decline of only 17%). Hence, current trends of health worker production and employment will not have sufficient impact on reducing the needs-based shortage of health care workers by 2030, particularly in some countries. In the African Region – and in low-income countries – the needs-based shortage is actually forecasted
Table 8. Estimated and forecasted needs-based shortages by cadre, WHO region and income group in 2013 and 2030
INCOME
2013 2030% CHANGE
IN SHORTAGEPHYSICIANS
NURSES/ MIDWIVES
OTHER CADRES TOTAL PHYSICIANS
NURSES/ MIDWIVES
OTHER CADRES TOTAL
High 4 681 54 577 22 103 81 361 5 751 62 726 7 553 76 031 –7%
Upper middle 147 324 2 595 002 916 470 3 658 796 157 652 1 429 033 225 606 1 812 291 –50%
Lower middle 1 605 781 4 271 368 3 220 726 9 097 875 1 153 478 3 191 629 2 228 875 6 573 983 –28%
Low 821 780 2 043 489 1 705 502 4 570 771 1 016 123 2 924 768 2 127 801 6 068 692 33%
REGION
Africa 867 876 1 805 258 1 524 437 4 197 571 1 096 420 2 791 523 2 204 419 6 092 361 45%
Americas 47 404 516 073 209 942 773 419 65 407 463 697 111 154 640 258 –17%
E. Mediterranean
243 718 866 922 600 914 1 711 554 161 550 1 207 159 323 176 1 691 885 –1%
Europe 1 894 69 349 15 580 86 823 4 967 44 001 8 781 57 749 –33%
South-East Asia
1 290 326 3 154 646 2 461 500 6 906 471 963 978 1 866 055 1 861 488 4 691 521 –32%
Western Pacific
128 350 2 552 188 1 052 427 3 732 964 40 683 1 235 720 80 817 1 357 221 –64%
World 2 579 566 8 964 436 5 864 800 17 408 803 2 333 005 7 608 156 4 589 835 14 530 996 –17%
Note: This table includes only countries under the SDG index threshold.
Data sources: Authors’ calculations from WHO estimates. For detailed methods see Annex 2.
Human Resources for Health Observer
18
to worsen (by 45% and 33%, respectively) between 2013 and 2030, while it will remain broadly stable in the Eastern Mediterranean Region.
Figures 3 and 4 show the annual average exponential growth rate (AEGR) in the size of the health workforce that would be needed to eliminate the needs-based shortages by 2030, by income group and
by WHO region. The African Region and low-income countries require the greatest annual increase rates in their stock of health workers to meet the SDG index threshold.
Globally, out of 55 countries, 12 will require a solid (between 1% and 4.9%) AEGR; 21 a very solid (between 5% and 9.9%) AEGR; and 22 an extraordinary (greater than 10%) AEGR.
Figure 3. AEGR required to meet SDG index density by 2030 (by income group)
Figure 4. AEGR required to meet SDG index density by 2030 (by WHO region)
5%
25%
0%
30%
Aver
age
expo
nent
ial g
row
th r
ate 25%
High Upper middle Lower middle Low
10%
20%
5%
25%
0%
30%Av
erag
e ex
pone
ntia
l gro
wth
rat
e 25%
Africa
Americas
Eastern Mediterranean Western Pacific
10%
20%
South-East Asia
19Issue 1, 2016
4.1 Limitations
In contextualizing and correctly interpreting the findings of this analysis, it is necessary to acknowledge explicitly its most important limitations.
• The development of global estimates of needs has to rely on some level of standardization of the model specifications and its underlying assumptions, whereby it is assumed, for instance, that different countries have similar health care production functions, or that cadres of health workers that have the same or a similar classification have overlapping roles and tasks. The actual picture may be more varied, limiting the validity of these generic assumptions.
• Similarly, needs have been estimated to be the same across all countries, whereas the national patterns of burden of disease, as well as its demographic structure, are known determinants of variance in health services use (and, indirectly, of health workforce requirements).
• The model assumes that the ratios between numbers of physicians, nurses/midwives, and other cadres of health workers will follow recent trends. The required other cadres and the optimal skills mix differ per context. As the heterogeneous group of other cadres is essential in moving health service coverage and public health gains forward, a renewed focus on a more diverse skills mix, and a greater role for community-based practitioners (17), may conversely result in an increase of these relative to the number of nurses/midwives and physicians in future.
• While efforts were made to collect the best available evidence to inform the analysis, for many key variables in the modelling strategy adopted it was not possible to find a strong empirical basis. In such instances expert knowledge informed the modelling. Lack of comprehensive data on other aspects, such as geographical distribution within countries and gender composition, restricted the scope of the analysis.
• The SDG composite index value is highly sensitive to different thresholds of attainment of service coverage.
4. Discussion
• Data used for the analysis were largely derived from databases that are populated by WHO with data reported by countries; the validity of the estimates produced is therefore correlated to the validity of the data on individual variables from the individual countries on which they are based. Due to differences in definitions of health workers and multiple possible sources of data, for some countries health workforce data reported in other databases may differ significantly from the data used by WHO for this analysis.
• For many of the key variables, and particularly health worker stock and production, data were not available for a significant number of countries, which made it necessary to resort to imputation techniques. The absence of data on some cadres (such as community-based practitioners) was particularly detrimental, as it made it impossible to factor in this cadre in the modelling adopted, resulting in estimates that may not fully capture the reality and the potential of a more diverse and composite skills mix in the delivery of health care services. A similar consideration applies to the grouping of “other cadres” of health workers, for which empirical evidence was largely absent, and modelled estimates had to be produced based on a minority of countries with sufficient data available.
Caution is therefore warranted in interpreting the analysis, in light of the variable quality of the underlying data, and considering the intrinsic uncertainty that surrounds any estimates developed making extensive use of modelling and imputation techniques.
4.2 Interpretation: estimating health worker needs
This analysis defined a threshold of health worker needs in a new way, using a combination of 12 SDG-related indicators. By including coverage of noncommunicable diseases in its requirements, the SDG index sets a higher standard of access to health workers, resulting in greater needs (and needs-based shortages) than previous estimates. The difference is particularly stark if the new threshold is compared to past analyses based on requirements for skilled attendance at birth and immunization, which resulted in the identification of a much lower requirement of 2.3 skilled health workers (physicians and nurses/midwives) per 1000 population.
Human Resources for Health Observer
20
The SDG index threshold of 4.45 skilled health workers (physicians and nurses/midwives) per 1000 population represents an almost doubling of the indicative number of skilled health workers needed to meet health needs. This increase reflects the staffing needed to deliver the comprehensive range of health services incorporated in the ambition of the SDG goal on health and well-being (18, 19). The figure is not dissimilar from other benchmarks of health worker density developed in relation to the universal health coverage goal (such as the 4.11 threshold proposed by the ILO). The ambition of the SDGs, and the health workforce implications arising from it, is the critical driver behind the increased need.
The SDG index threshold does take into account some of the increased need for health workers due to global ageing and global economic growth. Noncommunicable diseases rise with average age and income. Therefore older and wealthier populations will demand that health systems expand beyond provision of basic preventive and maternal and child services to provide noncommunicable disease services, and the SDG threshold will more accurately reflect demand for health workers (20).
However, the blanket adoption in the model of the SDG index threshold assumes similar patterns of disease across countries and over time, whereas both epidemiologic and population patterns are and will keep on evolving (21).
The SDG index threshold can support the development of global estimates, aggregate analyses and cross-country comparisons. It should not however be used as a benchmark for planning at national level, as it does not reflect the heterogeneity of countries in terms of baseline conditions, health system needs, optimal workforce composition and skills mix. It is important that use of the SDG index threshold does not result in an exclusive focus on physicians and nurses/midwives while underinvesting in community-based health workers and other cadres. Every country should consider its unique epidemiology, demography, finances and health system set-up, and the existing numbers, distribution, and skills mix of health workers, in the planning of the workforce it will need to meet the SDGs by 2030.
4.3 Current and forecasted supply of health workers
Our estimate of the current and projected future stock of health workers shows that, despite increased production, population growth in some contexts is outstripping the increase in health workers, resulting in lower density of health workers (health workers per 1000 population). This phenomenon is strongest in low-income countries.
Our estimate of health worker needs also does not take into account how technology, such as information and communication technology (ICT) (22), or new drugs or treatments may influence the demand for health workers and their training. Innovation may enable differing approaches to the skills mix, which will hopefully improve the efficiency of the health workforce.
4.4 Current and forecasted needs-based shortage of health workers
The current and forecasted health worker shortages based on needs identified through the SDG index threshold are greatest in the poorest regions of the world with the greatest burden of preventable disease and the fewest resources. Importantly, on current trends the gap is expected to widen by 2030 in low-income countries, while it is expected to reduce in middle- and high-income countries. The 22 countries facing the most challenging conditions might require maintaining for 15 years an annual AEGR of skilled health workers in excess of 10%, an ambitious task with considerable policy and financing implications. Despite evidence that some countries are achieving important health gains in spite of low density of skilled health workers (23), in some cases also thanks to the contribution of community-based health workers and other cadres (24), these supply and needs-based shortage projections caution against complacency, as maintaining a status quo in health worker production and employment is expected to result in a worsening gap in some of the most disadvantaged countries in the world.
4.5 Research agenda
This analysis has highlighted the need for improving basic information on availability and distribution of existing health workers.
In many countries, even basic information fields, such as health worker stock and distribution, are largely limited to physicians, nurses and midwives, despite the growing role played by other cadres. Data on geographical distribution within countries, gender composition and other critical aspects are similarly limited and fragmented. More evidence is needed on all these aspects, which would allow more robust aggregate estimates like those developed in this analysis, but also, and more importantly, significant improvements in the capacity of countries to understand the conditions and opportunities in their national health labour markets. Crucially, this evidence should be developed not through one-off special studies and surveys, but rather through putting in place country-level mechanisms – embedded in national structures and processes and designed to be sustainable – to collate, analyse and use data on a routine basis.
21Issue 1, 2016
WHO has initiated a process to support Member States in the creation of national health workforce accounts – mechanisms that contain and dynamically measure priority data on the public and private health workforces in countries. National health workforce accounts include (a) national health workforce registries (data on every health worker in the country in both the public and private sectors); (b) data on health worker education (including number and output of schools, financing, recruitment and regulation); (c) labour market data (including salaries,
regulation, exit and entry into market); and (d) skills mix and efficiency data. Data on health worker migration, which all countries have committed to providing via the WHO Global Code of Practice on the International Recruitment of Health Personnel (25), would also help countries better understand the regional and global flow of health workers, providing a helpful input in the design and implementation of strategies so that health workers can be cost-effectively retained in low-income countries.
Human Resources for Health Observer
22
Despite the caveats noted in the limitations section (4.1), this analysis represents the first attempt to define on an empirical basis the health workforce requirements associated with Sustainable Development Goal 3.
On current trends, the global health labour market is moving towards a deepening mismatch between needs, supply and demand, with most of the growth in supply concentrated in upper middle-income and high-income countries, alongside a worsening needs-based shortage in low-income countries. The growth in supply in some high- and middle-income countries will be outstripped by growing demand (26); this, together with persisting high wage differentials with low-income countries, will contribute to growing international mobility of health personnel, a trend already visible based on latest Organisation for Economic Co-operation and Development (OECD) data (27). Conversely, the growth in demand in low-income countries will be lower than the growth in need, requiring public sector intervention and international solidarity mechanisms to correct for the market failure of underproduction and underemployment of health workers in these contexts.
Countries should improve the coherence between their education, health, finance, labour and employment strategies, progressively moving towards a health workforce adequate in numbers, quality, competencies, distribution and performance, and able to meet today’s and tomorrow’s population health needs and expectations. An exclusive or over-restrictive focus on numerical shortages carries a risk of policy misalignment. Improved performance, productivity and quality are equally important in devising and implementing comprehensive workforce strategies.
Minimizing inefficiencies is a critical element of the response required, and a precondition for developing a robust investment
5. Conclusions and recommendations
case: opportunities exist to ensure better value for money across the whole health workforce value chain, from planning to education, deployment and performance management. The countries with the greatest resource challenges should recognize that they may not have in the short and medium term the resources to train, employ and retain sufficient numbers of skilled health workers with their current skills mix or with the model of curative hospital-based care typical of most high-income countries (28). They should therefore consider innovations in their models of care and educational strategies that include greater reliance on mid-level providers (such as nurses, advanced-practice nurses and other physician substitutes) and community-based practitioners collaborating with skilled health professionals towards integrated primary health care delivery models (29, 30).
In parallel with improving efficiency of spending of current resources, some countries will have an opportunity to increase resource allocation for human resources for health investments through economic growth. Domestic spending on human resources for health averages 33.6% of total government expenditure on health in countries with available data; and government expenditure on health is in many low- and middle-income countries lower than the 4–5% of gross domestic product generally considered necessary to progress towards universal health coverage (31).
In these settings, greater efforts to mobilize domestic resources are both necessary and possible, and should be supported by appropriate macroeconomic policies at national and global levels, complemented where necessary by international solidarity mechanisms. Funding levels should reflect the value of effective human resources for health to the country’s economy by factoring in the potential for improved worker productivity in other sectors (32), and the broader socioeconomic returns of investing in health sector employment.
23Issue 1, 2016
Three benchmarks for estimating current health worker needs
1. SDG composite method
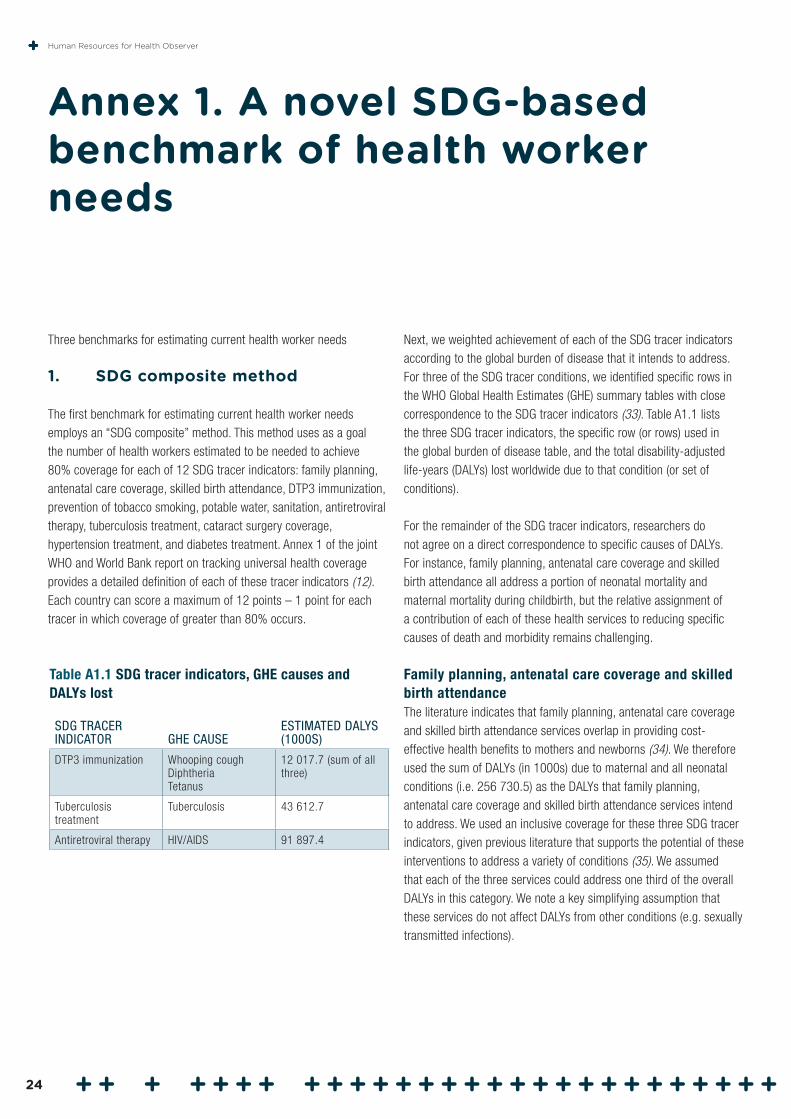
The first benchmark for estimating current health worker needs employs an “SDG composite” method. This method uses as a goal the number of health workers estimated to be needed to achieve 80% coverage for each of 12 SDG tracer indicators: family planning, antenatal care coverage, skilled birth attendance, DTP3 immunization, prevention of tobacco smoking, potable water, sanitation, antiretroviral therapy, tuberculosis treatment, cataract surgery coverage, hypertension treatment, and diabetes treatment. Annex 1 of the joint WHO and World Bank report on tracking universal health coverage provides a detailed definition of each of these tracer indicators (12). Each country can score a maximum of 12 points – 1 point for each tracer in which coverage of greater than 80% occurs.
Annex 1. A novel SDG-based benchmark of health worker needs
Next, we weighted achievement of each of the SDG tracer indicators according to the global burden of disease that it intends to address. For three of the SDG tracer conditions, we identified specific rows in the WHO Global Health Estimates (GHE) summary tables with close correspondence to the SDG tracer indicators (33). Table A1.1 lists the three SDG tracer indicators, the specific row (or rows) used in the global burden of disease table, and the total disability-adjusted life-years (DALYs) lost worldwide due to that condition (or set of conditions).
For the remainder of the SDG tracer indicators, researchers do not agree on a direct correspondence to specific causes of DALYs. For instance, family planning, antenatal care coverage and skilled birth attendance all address a portion of neonatal mortality and maternal mortality during childbirth, but the relative assignment of a contribution of each of these health services to reducing specific causes of death and morbidity remains challenging.
Family planning, antenatal care coverage and skilled birth attendance The literature indicates that family planning, antenatal care coverage and skilled birth attendance services overlap in providing cost-effective health benefits to mothers and newborns (34). We therefore used the sum of DALYs (in 1000s) due to maternal and all neonatal conditions (i.e. 256 730.5) as the DALYs that family planning, antenatal care coverage and skilled birth attendance services intend to address. We used an inclusive coverage for these three SDG tracer indicators, given previous literature that supports the potential of these interventions to address a variety of conditions (35). We assumed that each of the three services could address one third of the overall DALYs in this category. We note a key simplifying assumption that these services do not affect DALYs from other conditions (e.g. sexually transmitted infections).
Table A1.1 SDG tracer indicators, GHE causes and DALYs lost
SDG TRACER INDICATOR GHE CAUSE
ESTIMATED DALYS (1000S)
DTP3 immunization Whooping coughDiphtheriaTetanus
12 017.7 (sum of all three)
Tuberculosis treatment
Tuberculosis 43 612.7
Antiretroviral therapy HIV/AIDS 91 897.4
Human Resources for Health Observer
24
Potable water and sanitationWe used global burden of disease estimates for water-related diseases and infectious diarrhoea from Prüss and colleagues to assign DALY weights for potable water and sanitation SDG tracer indicators (36). Prüss and colleagues (their Table 5) estimate a total of 5856 DALYs (in 1000s) attributable to the following water-related diseases: schistosomiasis, trachoma, ascariasis, trichuriasis and hookworm disease. They also estimate 76 340 DALYs (in 1000s) due to infectious diarrhoea, which is preventable by improved sanitation and drinking water. The ratio of infectious diarrhoea to water-related diseases, in terms of DALYs, is: 76 340 / 5856 = 13.0362
The WHO 2014 GHE summary tables includes DALY estimates for water-related diseases but not for infectious diarrhoea. We use the 13.0362 multiplier from Prüss and colleagues to estimate the current DALY burden due to infectious diarrhoea. Next, we sum the DALY burden for water-related diseases (i.e., schistosomiasis, trachoma, ascariasis, trichuriasis and hookworm disease) and infectious diarrhoea to provide the total DALYs the potable water and sanitation interventions intend to address. This process yields 134 019 DALYs (in 1000s). We partitioned these DALYs evenly across potable water and sanitation SDG tracer indicators (i.e., each tracer receives 50% attribution of addressing the DALYs), given that these services typically occur together and are both crucial for reducing water-related diseases and infectious diarrhoea.
Tobacco smokingIn their 2002 WHO report, Ezzati and colleagues (p. 2161) write: “The … global burden of disease due to tobacco [is] 4.1% in 2000” (37). We use the 4.1% figure to calculate the overall DALYs attributable to tobacco smoking, given that WHO also uses this statistic online (38). We multiply the overall DALYs in the WHO GHE 2012 table by 4.1% to yield 112 141.6 (in 1000s). We note that more recent estimates of DALYs attributable to smoking appear in the literature (39). We remain open to applying another weight of the tobacco score according to WHO’s preference.
CataractsThe 2004 update of the WHO Global burden of disease report includes an analysis of sense organ disorders. Part 4 of the report states (p. 47): “Causes of vision loss are responsible for more than two thirds of the DALYs for sense organ disorders in women” (40). We know of no male-specific estimate of DALYs due to vision loss. We therefore assume that men and women share the same incidence and causes of vision loss. Next, the WHO Global Initiative for the Elimination of Avoidable Blindness estimates that approximately 47% of cases of low vision and blindness are due to cataracts globally (41). We apply these
estimates to the DALYs for “sense organ disorders” from the WHO 2014 GHE summary tables to estimate overall DALYs that cataract surgery coverage intends to address.
Global DALYs caused by sense organ disorders: 52 639.9 (in 1000s)
Vision loss responsible for __ % of these disorders: 66%
Cataracts account for __ % of vision loss: 47%
Cataract surgery coverage may address: 52 639.9 x 0.66 x 0.47
= 16 328.9 DALYs (in 1000s)
DiabetesThe 2010 global burden of disease assessment provides an estimate of global DALYs caused by diabetes: 46 857 (in 1000s) (39, Table 2). Given that this source does not provide an overall DALY estimate from all causes, we cannot know whether the overall DALY burden in the 2010 report is identical to the estimates in the WHO GHE summary tables that we use to derive all weights. To approximate this diabetes weight, we therefore multiplied the ratio of diabetes to tuberculosis1 DALYs from Table 2 of the global burden of disease assessment (i.e., 46 857 / 49 399) by the number of DALYs due to tuberculosis (shown above in Table A1.1). This process gives the number of DALYs due to diabetes (i.e., 41 368, in 1000s), standardized to the WHO GHE DALY estimates.
HypertensionIn their 2010 global burden of disease assessment, Lim and colleagues estimate that hypertension accounts for 7.0% of global DALYs (42). We applied this proportion to overall DALYs in the WHO GHE summary tables to estimate 191 461 DALYs (in 1000s) attributable to hypertension.
Conversion of DALYs to SDG weightsWe compile results from the calculations above in Table A1.2. The DALYs column lists the global burden of disease that each SDG tracer indicator intends to address. We then arrive at the “analytic weight” column by dividing DALYs by “sum DALYs”.
1 The choice of tuberculosis is somewhat arbitrary. We could have chosen two other conditions, shown in Table A1.1 (i.e., HIV, DTP), with one-to-one correspondence to conditions shown in the WHO GHE summary tables. However, we chose tuberculosis, given that it ranked number 13 in all-cause DALYs, and diabetes ranked number 14 in all-cause DALYs. The assumption in using tuberculosis DALYs to standardize the diabetes weight is that the ratio of tuberculosis to diabetes DALY burden remains constant from 2012 to 2013. We view this assumption as reasonable.
25Issue 1, 2016
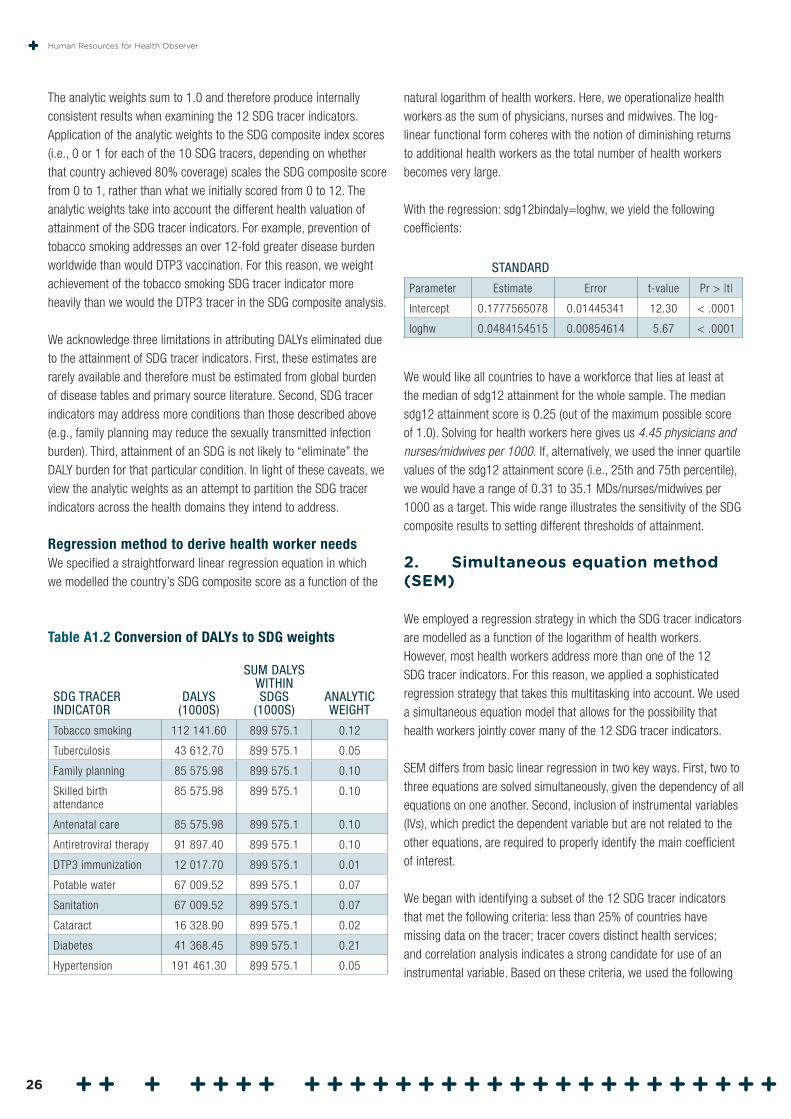
The analytic weights sum to 1.0 and therefore produce internally consistent results when examining the 12 SDG tracer indicators. Application of the analytic weights to the SDG composite index scores (i.e., 0 or 1 for each of the 10 SDG tracers, depending on whether that country achieved 80% coverage) scales the SDG composite score from 0 to 1, rather than what we initially scored from 0 to 12. The analytic weights take into account the different health valuation of attainment of the SDG tracer indicators. For example, prevention of tobacco smoking addresses an over 12-fold greater disease burden worldwide than would DTP3 vaccination. For this reason, we weight achievement of the tobacco smoking SDG tracer indicator more heavily than we would the DTP3 tracer in the SDG composite analysis.
We acknowledge three limitations in attributing DALYs eliminated due to the attainment of SDG tracer indicators. First, these estimates are rarely available and therefore must be estimated from global burden of disease tables and primary source literature. Second, SDG tracer indicators may address more conditions than those described above (e.g., family planning may reduce the sexually transmitted infection burden). Third, attainment of an SDG is not likely to “eliminate” the DALY burden for that particular condition. In light of these caveats, we view the analytic weights as an attempt to partition the SDG tracer indicators across the health domains they intend to address.
Regression method to derive health worker needsWe specified a straightforward linear regression equation in which we modelled the country’s SDG composite score as a function of the
Table A1.2 Conversion of DALYs to SDG weights
SDG TRACER INDICATOR
DALYS (1000S)
SUM DALYS WITHIN SDGS
(1000S)ANALYTIC WEIGHT
Tobacco smoking 112 141.60 899 575.1 0.12
Tuberculosis 43 612.70 899 575.1 0.05
Family planning 85 575.98 899 575.1 0.10
Skilled birth attendance
85 575.98 899 575.1 0.10
Antenatal care 85 575.98 899 575.1 0.10
Antiretroviral therapy 91 897.40 899 575.1 0.10
DTP3 immunization 12 017.70 899 575.1 0.01
Potable water 67 009.52 899 575.1 0.07
Sanitation 67 009.52 899 575.1 0.07
Cataract 16 328.90 899 575.1 0.02
Diabetes 41 368.45 899 575.1 0.21
Hypertension 191 461.30 899 575.1 0.05
natural logarithm of health workers. Here, we operationalize health workers as the sum of physicians, nurses and midwives. The log-linear functional form coheres with the notion of diminishing returns to additional health workers as the total number of health workers becomes very large.
With the regression: sdg12bindaly=loghw, we yield the following coefficients:
STANDARD
Parameter Estimate Error t-value Pr > |t|
Intercept 0.1777565078 0.01445341 12.30 < .0001
loghw 0.0484154515 0.00854614 5.67 < .0001
We would like all countries to have a workforce that lies at least at the median of sdg12 attainment for the whole sample. The median sdg12 attainment score is 0.25 (out of the maximum possible score of 1.0). Solving for health workers here gives us 4.45 physicians and nurses/midwives per 1000. If, alternatively, we used the inner quartile values of the sdg12 attainment score (i.e., 25th and 75th percentile), we would have a range of 0.31 to 35.1 MDs/nurses/midwives per 1000 as a target. This wide range illustrates the sensitivity of the SDG composite results to setting different thresholds of attainment.
2. Simultaneous equation method (SEM)
We employed a regression strategy in which the SDG tracer indicators are modelled as a function of the logarithm of health workers. However, most health workers address more than one of the 12 SDG tracer indicators. For this reason, we applied a sophisticated regression strategy that takes this multitasking into account. We used a simultaneous equation model that allows for the possibility that health workers jointly cover many of the 12 SDG tracer indicators.
SEM differs from basic linear regression in two key ways. First, two to three equations are solved simultaneously, given the dependency of all equations on one another. Second, inclusion of instrumental variables (IVs), which predict the dependent variable but are not related to the other equations, are required to properly identify the main coefficient of interest.
We began with identifying a subset of the 12 SDG tracer indicators that met the following criteria: less than 25% of countries have missing data on the tracer; tracer covers distinct health services; and correlation analysis indicates a strong candidate for use of an instrumental variable. Based on these criteria, we used the following
Human Resources for Health Observer
26
three tracers: proper sanitation, DTP vaccine coverage, and four antenatal care visits.
IV data are retrieved from the World Bank database and the CIA World Factbook. We include definitions of the IVs here:
Annual freshwater withdrawals, total (billion cubic meters). Annual freshwater withdrawals refer to total water withdrawals, not counting evaporation losses from storage basins. Withdrawals also include water from desalination plants in countries where they are a significant source. Withdrawals can exceed 100% of total renewable resources where extraction from non-renewable aquifers or desalination plants is considerable or where there is significant water reuse. Withdrawals for agriculture and industry are total withdrawals for irrigation and livestock production and for direct industrial use (including withdrawals for cooling thermoelectric plants). Withdrawals for domestic uses include drinking water, municipal use or supply, and use for public services, commercial establishments and homes. The Pearson correlation coefficient between sanitation and freshwater withdrawals = 0.34.
Average latitude.2 Average latitude is found for each country. We then take its absolute value. Previous literature shows that the viral and bacterial burden correlates positively with distance from the equator. The Pearson correlation coefficient between DTP coverage and absolute latitude = 0.31.
Adolescent fertility rate. This is calculated as births per 1000 women aged 15–19 years. Literature finds that this measure correlates inversely with family planning, women’s health and infant health in general. The Pearson correlation coefficient between antenatal care and adolescent fertility = –0.52.
We solve these equations in the SEM framework:
• proper sanitation = constant + loghealthworkers + income_level + (IV)cubic feet of freshwater delivered
• dtpvaccinecoverage = constant + loghealthworkers + income_level + (IV)country’s average latitude in absolute value
• proper antenatalcare = constant + loghealthworkers + income_level + (IV)adolescent fertility rate.
We find interpretable results for each coefficient; the Hausman test suggests that two-stage least squares estimation fits the data better
2 Source: CIA World Factbook.
than does ordinary least squares; and the IVs are all statistically significant in the final model.
If we use the two-stage least squares coefficients, and solve for the relevant thresholds for each tracer condition (i.e., 80% coverage for DTP, 80% coverage for proper sanitation, and 80% coverage for antenatal care), we find the following health worker levels (physicians and nurses/midwives only):
DTP: 0.60 per 1000; antenatal care: 2.97 per 1000; sanitation: 3.79 per 1000.
The Global Health Workforce Alliance (GHWA) Working Group noted that the literature concerning the relation between health workforce and a country’s level of proper sanitation is not as strong as that for antenatal care. For this reason, the GHWA Working Group chose the antenatal care indicator to derive the SEM measure of target health workers: 2.97 workers per 1000.
3. Data envelopment analysis (DEA)
A third estimate of health worker needs uses data envelopment analysis (DEA), a non parametric estimation strategy to identify a country’s efficiency in covering the 12 SDG tracer indicators. DEA borrows from tools in economics and operations management to identify groups that maximize the utility of their existing resources to achieve a desired end. In our scenario, countries serve as the “group”, and health workers per 1000 are the “inputs” that produce health service coverage. Countries are then ranked by DEA according to an efficiency score, which is calculated by the maximum number of SDG coverage indicators achieved per health worker in that country.
The DEA analysis, performed with the “dea” command in STATA, ranked all countries. Of the 192 countries with sufficient data to be analysed, we identified the top 20 countries as exemplary in their efficiency. These 20 countries include representation from the Americas, Africa, South-East Asia and the Western Pacific Regions. If we take the maximum value of physicians and nurses/midwives from this list of exemplary countries, we find a total of 2.56 physicians and nurses/midwives per 1000. This result coheres with the notion that DEA seeks efficiency and ranks countries favourably if they attain many SDGs with relatively few health workers.
27Issue 1, 2016
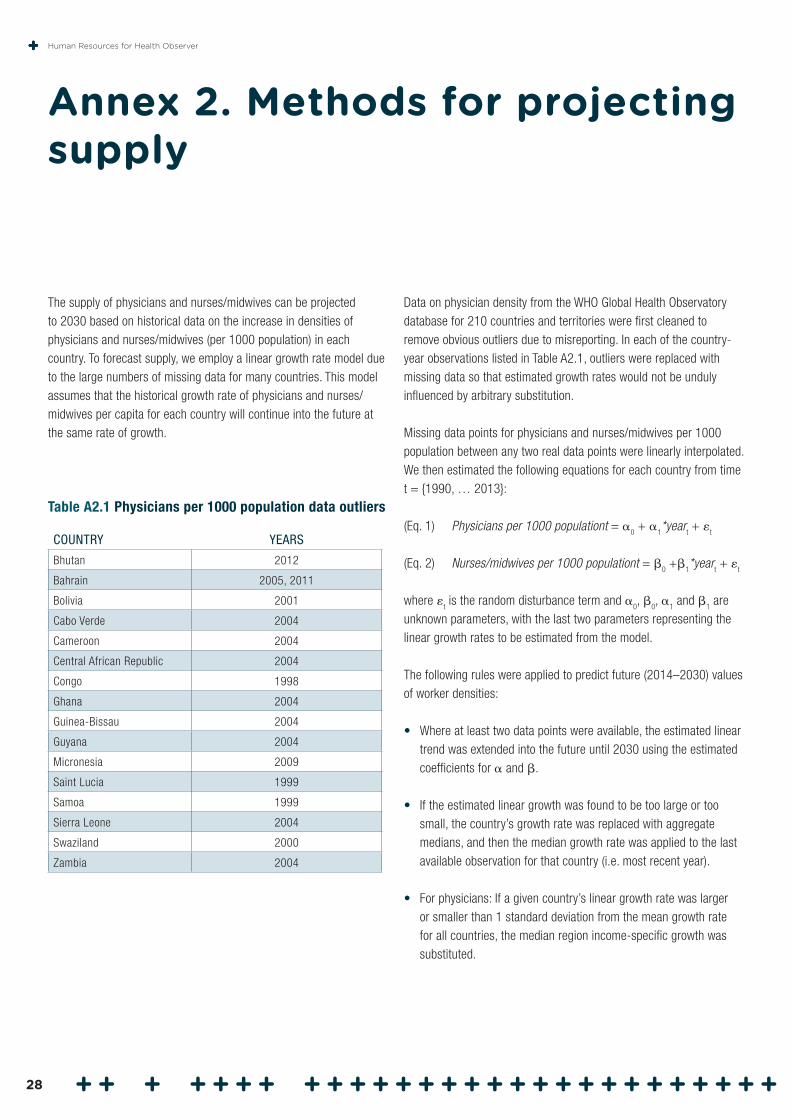
The supply of physicians and nurses/midwives can be projected to 2030 based on historical data on the increase in densities of physicians and nurses/midwives (per 1000 population) in each country. To forecast supply, we employ a linear growth rate model due to the large numbers of missing data for many countries. This model assumes that the historical growth rate of physicians and nurses/midwives per capita for each country will continue into the future at the same rate of growth.
Annex 2. Methods for projecting supply
Data on physician density from the WHO Global Health Observatory database for 210 countries and territories were first cleaned to remove obvious outliers due to misreporting. In each of the country-year observations listed in Table A2.1, outliers were replaced with missing data so that estimated growth rates would not be unduly influenced by arbitrary substitution.
Missing data points for physicians and nurses/midwives per 1000 population between any two real data points were linearly interpolated. We then estimated the following equations for each country from time t = {1990, … 2013}:
(Eq. 1) Physicians per 1000 populationt = 0 +
1*year
t +
t
(Eq. 2) Nurses/midwives per 1000 populationt = 0 +
1*year
t +
t
where t is the random disturbance term and
0,
0,
1 and
1 are
unknown parameters, with the last two parameters representing the linear growth rates to be estimated from the model.
The following rules were applied to predict future (2014–2030) values of worker densities:
• Where at least two data points were available, the estimated linear trend was extended into the future until 2030 using the estimated coefficients for and .
• If the estimated linear growth was found to be too large or too small, the country’s growth rate was replaced with aggregate medians, and then the median growth rate was applied to the last available observation for that country (i.e. most recent year).
• For physicians: If a given country’s linear growth rate was larger or smaller than 1 standard deviation from the mean growth rate for all countries, the median region income-specific growth was substituted.
Table A2.1 Physicians per 1000 population data outliers
COUNTRY YEARS
Bhutan 2012
Bahrain 2005, 2011
Bolivia 2001
Cabo Verde 2004
Cameroon 2004
Central African Republic 2004
Congo 1998
Ghana 2004
Guinea-Bissau 2004
Guyana 2004
Micronesia 2009
Saint Lucia 1999
Samoa 1999
Sierra Leone 2004
Swaziland 2000
Zambia 2004
Human Resources for Health Observer
28
• For nurses/midwives: For nurses, there was large overdispersion of the linear growth rate distribution. Consequently, if a country’s linear growth rate was larger than 80% or smaller than 20% of the growth rate distribution, then the median region income-specific growth was substituted.
• For both physicians and nurse/midwives: If the predicted density in 2030 resulted in a negative number, that country’s growth rate was also replaced with the corresponding median region income-specific growth.
• If there was just one point for a country (and thus linear growth rate could not be estimated), the same median substitution for the growth rate as described above was applied.
• When no observations were available before 2013 (i.e., no empirical data at all for both physicians and nurses/midwives), neither the physicians nor nurse/midwives supply was projected. Instead, the mean 2030 predicted supply density across a comparable group of countries was substituted.
The projected supply of physicians and nurses/midwives per 1000 population for each future year was then multiplied by forecasted population (medium fertility assumptions) in that year to obtain the absolute numbers of physicians and nurses/midwives. We again apply income group-specific multipliers to the combined sum of physicians and nurses/midwives ratios per 1000 to obtain estimates of all other health workers.
29Issue 1, 2016
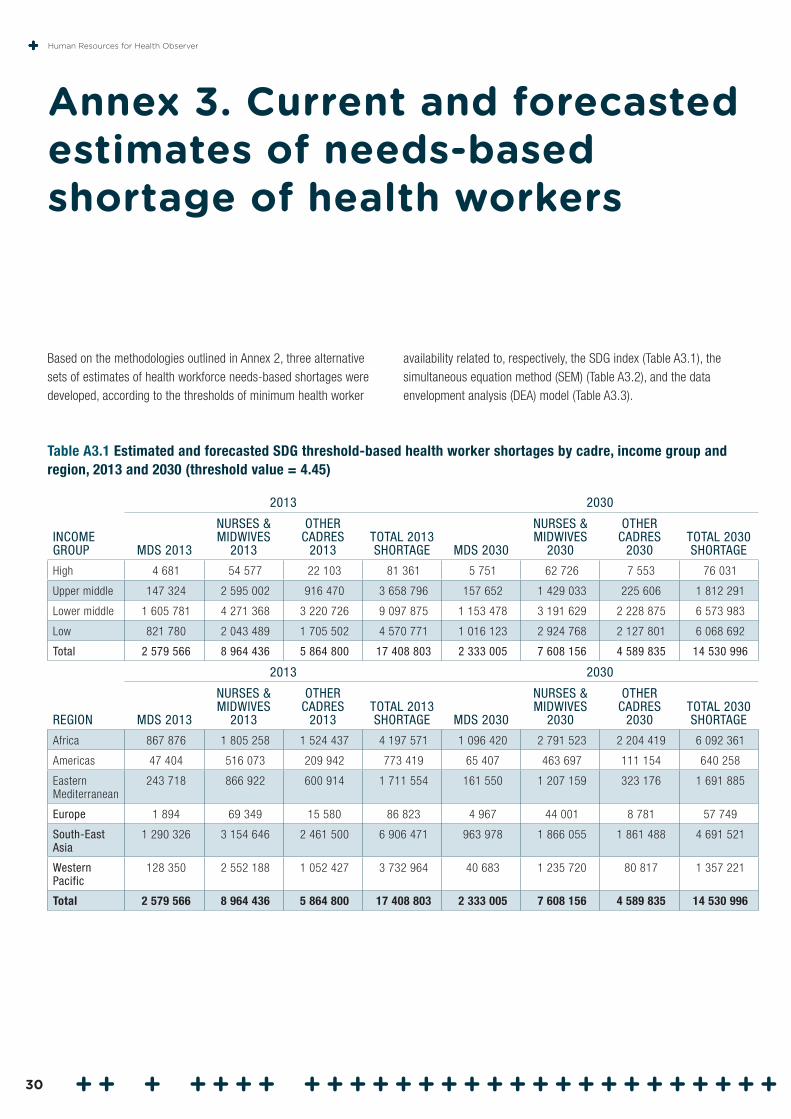
Based on the methodologies outlined in Annex 2, three alternative sets of estimates of health workforce needs-based shortages were developed, according to the thresholds of minimum health worker
Annex 3. Current and forecasted estimates of needs-based shortage of health workers
availability related to, respectively, the SDG index (Table A3.1), the simultaneous equation method (SEM) (Table A3.2), and the data envelopment analysis (DEA) model (Table A3.3).
Table A3.1 Estimated and forecasted SDG threshold-based health worker shortages by cadre, income group and region, 2013 and 2030 (threshold value = 4.45)
INCOME GROUP
2013 2030
MDS 2013
NURSES & MIDWIVES
2013
OTHER CADRES
2013TOTAL 2013 SHORTAGE MDS 2030
NURSES & MIDWIVES
2030
OTHER CADRES
2030TOTAL 2030 SHORTAGE
High 4 681 54 577 22 103 81 361 5 751 62 726 7 553 76 031
Upper middle 147 324 2 595 002 916 470 3 658 796 157 652 1 429 033 225 606 1 812 291
Lower middle 1 605 781 4 271 368 3 220 726 9 097 875 1 153 478 3 191 629 2 228 875 6 573 983
Low 821 780 2 043 489 1 705 502 4 570 771 1 016 123 2 924 768 2 127 801 6 068 692
Total 2 579 566 8 964 436 5 864 800 17 408 803 2 333 005 7 608 156 4 589 835 14 530 996
REGION
2013 2030
MDS 2013
NURSES & MIDWIVES
2013
OTHER CADRES
2013TOTAL 2013 SHORTAGE MDS 2030
NURSES & MIDWIVES
2030
OTHER CADRES
2030TOTAL 2030 SHORTAGE
Africa 867 876 1 805 258 1 524 437 4 197 571 1 096 420 2 791 523 2 204 419 6 092 361
Americas 47 404 516 073 209 942 773 419 65 407 463 697 111 154 640 258
Eastern Mediterranean
243 718 866 922 600 914 1 711 554 161 550 1 207 159 323 176 1 691 885
Europe 1 894 69 349 15 580 86 823 4 967 44 001 8 781 57 749
South-East Asia
1 290 326 3 154 646 2 461 500 6 906 471 963 978 1 866 055 1 861 488 4 691 521
Western Pacific
128 350 2 552 188 1 052 427 3 732 964 40 683 1 235 720 80 817 1 357 221
Total 2 579 566 8 964 436 5 864 800 17 408 803 2 333 005 7 608 156 4 589 835 14 530 996
Human Resources for Health Observer
30
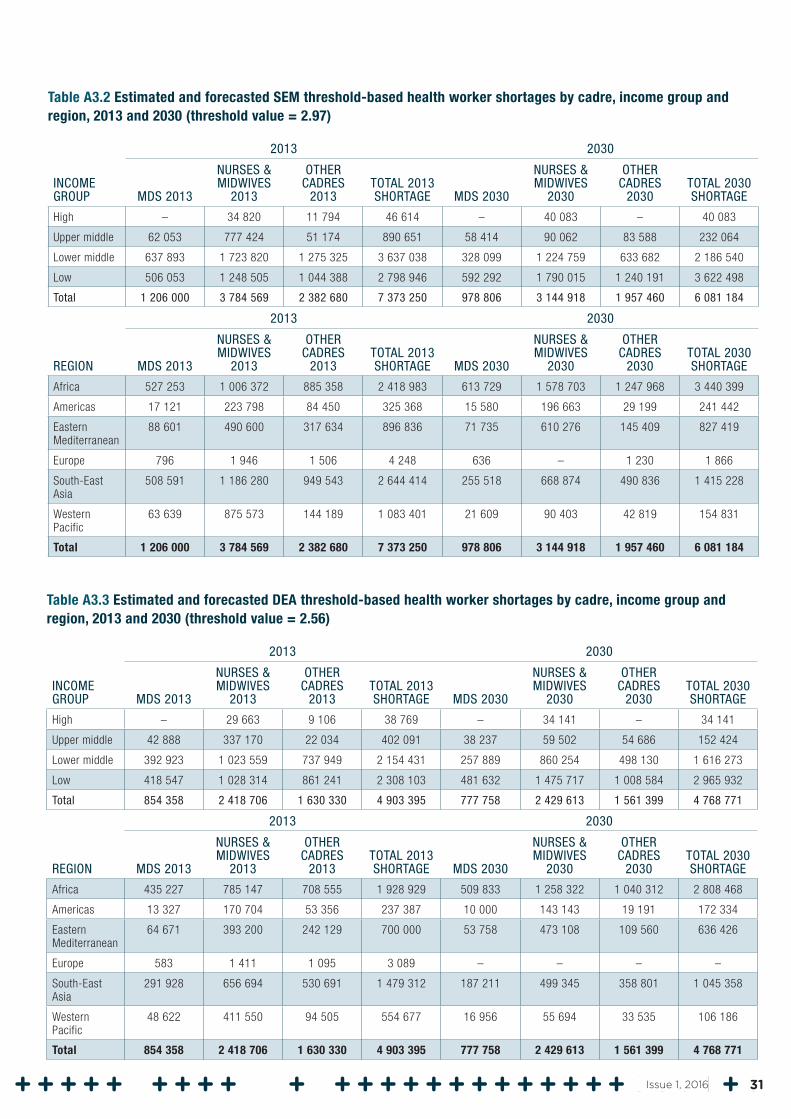
Table A3.2 Estimated and forecasted SEM threshold-based health worker shortages by cadre, income group and region, 2013 and 2030 (threshold value = 2.97)
INCOME GROUP
2013 2030
MDS 2013
NURSES & MIDWIVES
2013
OTHER CADRES
2013TOTAL 2013 SHORTAGE MDS 2030
NURSES & MIDWIVES
2030
OTHER CADRES
2030TOTAL 2030 SHORTAGE
High – 34 820 11 794 46 614 – 40 083 – 40 083
Upper middle 62 053 777 424 51 174 890 651 58 414 90 062 83 588 232 064
Lower middle 637 893 1 723 820 1 275 325 3 637 038 328 099 1 224 759 633 682 2 186 540
Low 506 053 1 248 505 1 044 388 2 798 946 592 292 1 790 015 1 240 191 3 622 498
Total 1 206 000 3 784 569 2 382 680 7 373 250 978 806 3 144 918 1 957 460 6 081 184
REGION
2013 2030
MDS 2013
NURSES & MIDWIVES
2013
OTHER CADRES
2013TOTAL 2013 SHORTAGE MDS 2030
NURSES & MIDWIVES
2030
OTHER CADRES
2030TOTAL 2030 SHORTAGE
Africa 527 253 1 006 372 885 358 2 418 983 613 729 1 578 703 1 247 968 3 440 399
Americas 17 121 223 798 84 450 325 368 15 580 196 663 29 199 241 442
Eastern Mediterranean
88 601 490 600 317 634 896 836 71 735 610 276 145 409 827 419
Europe 796 1 946 1 506 4 248 636 – 1 230 1 866
South-East Asia
508 591 1 186 280 949 543 2 644 414 255 518 668 874 490 836 1 415 228
Western Pacific
63 639 875 573 144 189 1 083 401 21 609 90 403 42 819 154 831
Total 1 206 000 3 784 569 2 382 680 7 373 250 978 806 3 144 918 1 957 460 6 081 184
Table A3.3 Estimated and forecasted DEA threshold-based health worker shortages by cadre, income group and region, 2013 and 2030 (threshold value = 2.56)
INCOME GROUP
2013 2030
MDS 2013
NURSES & MIDWIVES
2013
OTHER CADRES
2013TOTAL 2013 SHORTAGE MDS 2030
NURSES & MIDWIVES
2030
OTHER CADRES
2030TOTAL 2030 SHORTAGE
High – 29 663 9 106 38 769 – 34 141 – 34 141
Upper middle 42 888 337 170 22 034 402 091 38 237 59 502 54 686 152 424
Lower middle 392 923 1 023 559 737 949 2 154 431 257 889 860 254 498 130 1 616 273
Low 418 547 1 028 314 861 241 2 308 103 481 632 1 475 717 1 008 584 2 965 932
Total 854 358 2 418 706 1 630 330 4 903 395 777 758 2 429 613 1 561 399 4 768 771
REGION
2013 2030
MDS 2013
NURSES & MIDWIVES
2013
OTHER CADRES
2013TOTAL 2013 SHORTAGE MDS 2030
NURSES & MIDWIVES
2030
OTHER CADRES
2030TOTAL 2030 SHORTAGE
Africa 435 227 785 147 708 555 1 928 929 509 833 1 258 322 1 040 312 2 808 468
Americas 13 327 170 704 53 356 237 387 10 000 143 143 19 191 172 334
Eastern Mediterranean
64 671 393 200 242 129 700 000 53 758 473 108 109 560 636 426
Europe 583 1 411 1 095 3 089 – – – –
South-East Asia
291 928 656 694 530 691 1 479 312 187 211 499 345 358 801 1 045 358
Western Pacific
48 622 411 550 94 505 554 677 16 956 55 694 33 535 106 186
Total 854 358 2 418 706 1 630 330 4 903 395 777 758 2 429 613 1 561 399 4 768 771
31Issue 1, 2016
1. Campbell J, Dussault G, Buchan J, Pozo-Martin F, Guerra Arias M, Leone C et al. A universal truth: no health without a workforce. Forum report, Third Global Forum on Human Resources for Health, Recife, Brazil. Geneva: Global Health Workforce Alliance and World Health Organization; 2013.
2. Progress for children: a report card on adolescents. Number 10, April 2012. United Nations Children’s Fund; 2012. http://www.unicef.org/publications/index_62280.html.
3. Online consultation on the WHO Global Strategy on Human Resources for Health: Workforce 2030. Geneva: World Health Organization. http://www.who.int/hrh/resources/online_consult-globstrat_hrh/en/.
4. Technical notes: Global Health Workforce Statistics database. Geneva: World Health Organization. http://www.who.int/hrh/statistics/TechnicalNotes.pdf.
5. Bruckner T, Liu J, Scheffler RM. Demands-based and needs-based forecast for healthcare workers. In: Human resources for health labor market toolkit. Washington (DC): World Bank; forthcoming 2016 (Chapter 2).
6. Scheffler RM, Liu JL, Kinfu Y, Dal Poz M. Forecasting the global shortage of physicians: an economic- and needs-based approach. Bulletin of the World Health Organization. 2008;86(7):497–576. http://www.who.int/bulletin/volumes/86/7/07-046474/en/#.
7. Bruckner T, Scheffler R, Shen G, Yoon J, Chisholm D, Morris J et al. The mental health workforce gap in low- and middle-income countries: a needs-based approach. Bulletin of the World Health Organization. 2011;89:184–94.
8. Scheffler R, Bruckner T, Fulton B, Yoon J, Shen G, Chisholm D et al. Human resources for mental health: workforce deficits in low- and middle-income countries. Human Resources for Health Observer. Geneva: World Health Organization; 2011.
References
9. Scheffler R, Fulton B. Needs-based estimates for the health workforce. In: Soucat A, Scheffler R, Ghebreyesus T, editors. The labor market for health workers in Africa: a new look at the crisis. Washington (DC): World Bank; 2013:15–31.
10. Scheil-Adlung X. Health workforce benchmarks for universal health coverage and sustainable development. Bulletin of the World Health Organization. 2013;91:888–9. http://dx.doi.org/10.2471/BLT.13.126953.
11. World social protection report 2014–15. Chapter 5 and Annex II: Measuring social security coverage. Geneva: International Labour Organization; 2014. http://www.ilo.ch/global/research/global-reports/world-social-security-report/2014/lang--en/index.htm.
12. Tracking universal health coverage: first global monitoring report. WHO and World Bank; 2015. http://apps.who.int/iris/bitstream/10665/174536/1/9789241564977_eng.pdf?ua=1.
13. World social security report 2010–2011: providing coverage in times of crisis and beyond. Geneva: International Labour Office; 2011.
14. Bustreo F, Say L, Koblinsky M, Pullum TW, Temmerman M, Pablos-Mendez A. Ending preventable maternal deaths: the time is now. Lancet Global Health. 2013;1(4):e176–7.
15. Scheffler R, Brown Mahoney C, Fulton B, Dal Poz M, Preker A. Estimates of health care professional deficits in sub-Saharan Africa by 2015. Health Affair. 2009 January; 28:w849–w862.
16. World population prospects: the 2015 revision. New York: United Nations Department of Economic and Social Affairs; 2015. http://esa.un.org/wpp/.
17. New report highlights benefits from investments in CHW programs. Office of the UN Secretary-General’s Special Envoy for Health in Agenda 2030 and for Malaria. http://www.mdghealthenvoy.org/new-report-highlights-benefits-from-investments-in-chw-programs/.
Human Resources for Health Observer
32
18. Transforming our world: the 2030 agenda for sustainable development. New York: United Nations Department of Economic and Social Affairs; 2015. https://sustainabledevelopment.un.org/post2015/transformingourworld.
19. Marten R, McIntyre D, Travassos C, Shishkin S, Longde W, Reddy S et al. An assessment of progress towards universal health coverage in Brazil, Russia, India, China and South Africa (BRICS). Lancet. 2014;384(9960):2164–71. doi: 10.1016/S0140-6736(14)60075-1. PubMed PMID: 24793339.
20. Pearce N, Ebrahim S, McKee M, Lamptey P, Barreto ML, Matheson D et al. Global prevention and control of NCDs: limitations of the standard approach. Journal of Public Health Policy. 2015;36(4):408–25. doi: 10.1057/jphp.2015.29. PubMed PMID: 26377446.
21. Mitchell-Fearon K, Waldron N, Laws H, James K, Holder-Nevins D, Willie-Tyndale D et al. Non-communicable diseases in an older, aging population: a developing country perspective (Jamaica). Journal of Health Care for the Poor and Underserved. 2015;26(2):475–87. doi: 10.1353/hpu.2015.0041. PubMed PMID: 25913345.
22. Ethiopia meets MDG 4 by cutting under-5 mortality by two-thirds since 1990. Ethiopia news and events, 13 September 2013. New York: UNICEF; 2013. http://www.unicef.org/ethiopia/events_13459.html.
23. Chowdhury S, Banu LA, Chowdhury TA, Rubayet S, Khatoon S. Achieving Millennium Development Goals 4 and 5 in Bangladesh. Bangladesh Journal of Obstetrics and Gynaecology. 2011;118(Suppl. 2):36–46. doi: 10.1111/j.1471-0528.2011.03111.x. PubMed PMID: 21951501.
24. Ameha A, Karim AM, Erbo A, Ashenafi A, Hailu M, Hailu B et al. Effectiveness of supportive supervision on the consistency of integrated community cases management skills of the health extension workers in 113 districts in Ethiopia. Ethiopian Medical Journal. 2014;52(3):65–71. http://www.ncbi.nlm.nih.gov/pubmed/25845075.
25. WHO Global Code of Practice on the International Recruitment of Health Personnel. Geneva: World Health Organization. http://www.who.int/hrh/migration/code/WHO_global_code_of_practice_EN.pdf.
26. Economic, demographic, and epidemiological transitions and the future of health labour markets. Technical Working Group 1 synthesis paper for the Global Strategy on Human Resources for Health. Global Health Workforce Alliance; 2014. http://www.who.int/workforcealliance/media/news/2014/WG1_SynthesisSept282014.pdf?ua=1.
27. Health at a glance 2015. Paris: Organisation for Economic Co-operation and Development; 2015. http://www.oecd.org/health/health-systems/health-at-a-glance-19991312.htm.
28. Dieleman JL, Templin T, Sadat N, Reidy P, Chapin A, Foreman K et al. National spending on health by source for 184 countries between 2013 and 2040. Lancet. 2016;387(10037):2521–35.
29. Nurse practitioner cost-effectiveness. Austin, Texas: American Association of Nurse Practitioners; 2013 revision. https://www.aanp.org/aanpqa2/images/documents/publications/costeffectiveness.pdf.
30. O’Hare S. Mid-level providers in a changing healthcare workforce. Becker’s Hospital Review. 2010; August 17. http://www.beckershospitalreview.com/compensation-issues/mid-level-providers-in-a-changing-healthcare-workforce.html.
31. The world health report. Health systems financing: the path to universal health coverage. Geneva: World Health Organization; 2010. http://www.who.int/whr/2010/en/.
32. Scheil-Adlung X, Wiskow C. ILO comments on draft papers of TWGs 1, 3, 7 & 8. Submission to the public consultation process on the Global Strategy on Human Resources for Health. Global Health Workforce Alliance; 2014. http://www.who.int/workforcealliance/media/news/2014/GHWA-consultation_ILO-comments.pdf?ua=1.
33. WHO Global Health Estimates. Estimated DALYs (’000) by cause, sex and WHO Member State (1), 2012. Geneva: World Health Organization. http://www.who.int/healthinfo/global_burden_disease/en/.
34. Singh S et al. Adding it up: the costs and benefits of investing in family planning and maternal and newborn health. New York: Guttmacher Institute and United Nations Population Fund; 2009.
35. Adam T et al. Cost effectiveness analysis of strategies for maternal and neonatal health in developing countries. British Medical Journal. 2005;331(7525):1107.
33Issue 1, 2016
36. Prüss A, Kay D, Fewtrell L, Bartram J. Estimating the burden of disease from water, sanitation, and hygiene at a global level. Environmental Health Perspectives. 2002;110:537–42.
37. Ezzati M, Rodgers A, Lopez AD, Vander Hoorn S, Murray C. Mortality and burden of disease attributable to individual risk factors. In: Ezzati M, Lopez AD, Rodgers A, Murray C, editors. Comparative quantification of health risks: global and regional burden of disease attributable to selected major risk factors, Volume II. Geneva: World Health Organization; 2002:2141–66 (Chapter 26). http://www.who.int/healthinfo/global_burden_disease/cra/en/.
38. Management of substance abuse: the global burden. Geneva: World Health Organization. http://www.who.int/substance_abuse/facts/global_burden/en/.
39. Murray, C., Lopez A. Measuring the global burden of disease. New England Journal of Medicine. 2013;369:448–57.
40. Part 4. Burden of disease: DALYs. In: The global burden of disease: 2004 update. Geneva: World Health Organization; 2008. http://www.who.int/healthinfo/global_burden_disease/2004_report_update/en/.
41. Global Initiative for the Elimination of Avoidable Blindness: Action Plan 2006–2011. Geneva: World Health Organization; 2007.
42. Lim S et al. A comparative risk assessment of burden of disease and injury attributable to 67 risk factors and risk factor clusters in 21 regions, 1990–2010: a systematic analysis for the global burden of disease study 2010. Lancet. 2012;380(9859):2224–60.
Human Resources for Health Observer
34

Health Workforce DepartmentWorld Health Organization
20 Avenue AppiaCH1211 Geneva 27 Switzerland
www.who.int/hrh