Embed Size (px)
Citation preview
160 M I N U T E S O L A R V A R I A T I O N S AND T H E 22 YEAR C Y C L E
V. A. K O T O V and T . T . T S A P
Crimean Astrophysical Observatory, Nauchny, Crimea 334413, U.S.S.R.
(Received 5 January, 1990; in revised form 30 March, 1990)
Abstract. Systematic measurements of the differential Doppler velocity of the Sun have been performed in Crimea from 1974 through 1988 (total 987 days, 6197 hours of observations). They confirm the presence of a long-term phase-coherent solar pulsation with a period of 160.010 min. On the other hand, the analysis of new data suggests that solar 160 min pulsation might, in frequency, have a multiplet fine structure. In particular, large changes of amplitude and phase of the pulsation over the years 1982-1986 may indicate that during the last few years we have been observing the solar 160 min oscillation of the 'second portion' of the 22 year solar cycle.
It is further noted that the beat period of the two closely spaced frequencies (periods are 160.0101 and 160.0126 min) equals 19.5 + 1.1 year, which is in good agreement with the average length of the solar magnetic activity cycle, 20-22 years. Being verified, this unpredicted property of the pulsation can offer a novel possibility for probing the Sun's interior and perhaps for the study of the internal rotation and 11(22) year cycle of a star.
1. Introduction
When observing small-amplitude (~ 1 m s - 1 ) variations of the line-of-sight velocity of the solar photosphere, one encounters, with a strong influence of the Earth atmosphere, transparency fluctuations. The observations of the 160 min oscillation (Severny, Kotov, and Tsap, 1976; Brookes, Isaak, and van der Raay, 1976), moreover, get complicated by the closeness of the period to the 9th daily harmonic.
The analysis of about a decade of Crimean measurements of the solar Doppler velocity using the differential (center-to-limb) technique (Kotov, Severny, and Tsap, 1983) has suggested the existence of a statistically significant period of 160.01 min. A periodic variation was found for the velocity difference between the central two-thirds of the solar disk and the surrounding annular region of the solar disk, as measured from the Doppler shift of the Fe I line in the solar spectrum. This finding was later confirmed by independent observations performed in California (Scherrer and Wilcox, 1983) and Antarctic (Grec, Fossat, and Pomerantz, 1980) and also by the (preliminary) reduction of the Tenerife data (Pall6 and Roca Cort6s, 1988).
Recently, however, the solar origin of the 160 min periodicity in the Doppler shift measurements was called into question by new series of observations undertaken at Stanford and Tenerife over the past few years (Henning and Scherrer, 1988; Elsworth et al., 1989). It was reported that the phase stability is no longer present and that the oscillation could be, in general, an artifact caused by differential atmospheric extinction.
Here, we would like to point out that the potential influence of the Earth's atmosphere on the differential (i.e., made according to the principle 'the Sun relative to the Sun') Doppler shift measurements has already been studied in detail (Severny, Kotov, and Tsap, 1980). It is also worth noting that our method of (photospheric) velocity observa-
Solar Physics 128: 269-280, 1990. �9 1990 Kluwer Academic Publishers. Printed in Belgium.

270 v.A. KOTOV AND T. T. TSAP
tion is very different from full-disk observations (Elsworth et al., 1989) based on the resonant-scattering spectroscopy using the Na (or K) line (and which are therefore carried out for the low chromosphere of the Sun). It was stated that neither the amplitude nor the phase of the 160 min oscillation observed over several years can be explained in terms of terrestrial atmospheric disturbances or by the data reduction procedure (see also Koutchmy, Koutchmy, and Kotov, 1980; Kotov, Severny, and Tsap, 1983). The new Crimean observations, made from 1979 through 1982, have fully confirmed the existence of the 160.01 rain periodicity with a nearly-constant initial phase (Kotov, Severny, and Tsap, 1984a).
We would like to point out that there is a great deal more about the Crimean observations of the 160 min oscillation in the present paper than has appeared in the literature so far.
2. The Total Set of the Crimean 1974-1988 Data
We recently reduced the extra 677 hours of the 1983-1984 data set which have been rejected (rather subjectively, by one person of our group) from the earlier analysis (see Kotov, Severny, and Tsap, 1984b; Kotov, 1985). Then we increased the total amount of the 1983-1984 set by a factor of nearly four.
TABLE I
Summary of the Crimean 1974-1988 observations a
Year u Number of A h UT (m s - 1) (maximum)
Days Hours
1974.66 14 76 1.42 _+ 0.21 02 h 15 m _+ 4 m
1975.58 32 171 0.81 + 0.18 02 25 _+ 6
1976.54 32 163 0.36 _+ 0.13 00 09 +9
1977.51 59 280 0.78 _+ 0.19 00 35 +6
1978.56 78 471 0.48 + 0.09 01 24 +5
1979.47 c 60 381 0.56 + 0.15 ~ 01 59 +7 ~
1980.50 c 50 304 0.45 _+ 0.13 c 02 36 +8 c
1981.51 82 522 0.47 + 0.07 00 30 +4
1982.76 66 352 0.69 + 0.15 01 02 +6
1983.66 89 570 0.50 _+ 0.18 00 19 _+9
1984.68 55 338 0.04 _+ 0.14 - 1985.63 84 555 0.28 + 0.09 00 38 _+ 9 1986.54 117 839 0.34 + 0.08 02 31 _+ 7
1987.63 84 590 0.45 • 0.14 00 17 _+ 8
1988.61 85 585 0.23 _+ 0.11 01 01 _+ 10
All 15 years 987 6197 - -
a The amplitudes A h and UT moments are obtained on the basis of the mean harmonic curves for the 160.00 min period. The standard errors are formal and determined from the scattering of average points around the best-fitted sinusoids. The UT moments are given for the interval UT 00 h 00m--02h40 m of a day.
b The central epoch of the data of each year.
~ With the omission of 17 days of observations made during the 1979-1980 winter.
160 MINUTE SOLAR VARIATIONS AND THE 22 YEAR CYCLE 271
Following this, we added new observations carried out over the interval 1985-1988 (with an additional 2569 hours of data). In all, therefore, we here analyse about 6197 hours of Doppler observations (versus the 2786 hours previously considered, see Kotov, Severny, and Tsap, 1984b) made during 987 days, see Table I.
The standard deviation of the complete 15 year time series of the Doppler velocity (a measured differential velocity minus the best-fitted second-order polynomials which approximate slow daily trends) is about 5.4 m s - i for the 5 min integration time interval.
3. The Phase-Diagram
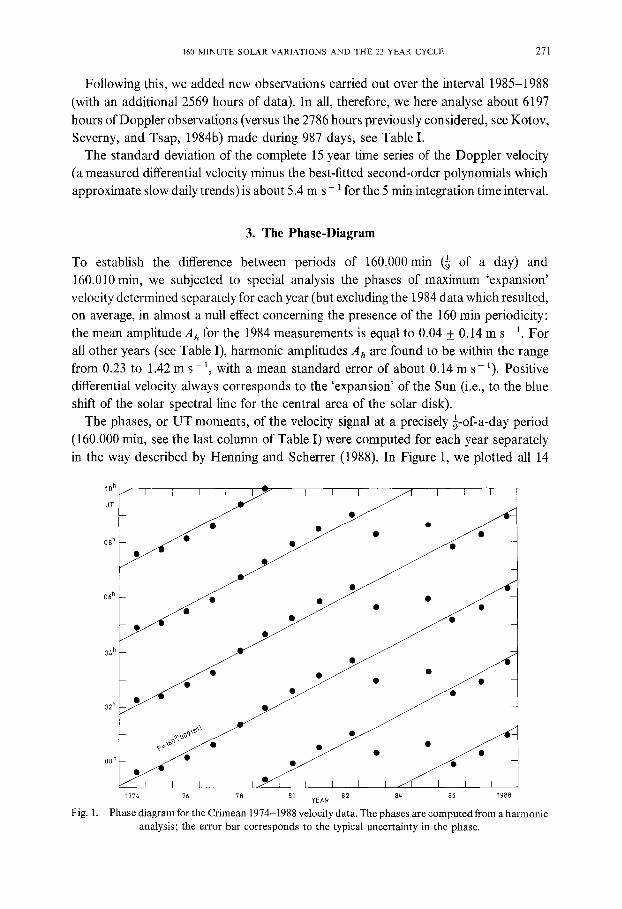
To establish the difference between periods of 160.000 rnin (~ of a day) and 160.010 rain, we subjected to special analysis the phases of maximum 'expansion' velocity determined separately for each year (but excluding the 1984 data which resulted, on average, in almost a null effect concerning the presence of the 160 rain periodicity: the mean arnplitude A h for the 1984 measurements is equal to 0.04 + 0.14 m s- 1. For all other years (see Table I), harmonic amplitudes A h are found to be within the range from 0.23 to 1.42 m s - 1, with a mean standard error of about 0.14 m s- 1). Positive differential velocity always corresponds to the 'expansion' of the Sun (i.e., to the blue shift of the solar spectral line for the central area of the solar disk).
The phases, or UT moments, of the velocity signal at a precisely 1-of-a-day period (160.000 min, see the last column of Table I) were computed for each year separately in the way described by Henning and Scherrer (1988). In Figure 1, we plotted all 14
Fig. 1.
I0 h
UT
08 h
06 h
OZ, h
02 h
O0 h
1971+ 76 78 80 82 8L~ 86 1988 YEAR
Phase diagram for the Crimean 1974-1988 velocity data. The phases are computed from a harmonic analysis; the error bar corresponds to the typical uncertainty in the phase.

272 V.A. KOTOV AND T. T. TSAP
phases (of the maximum 'expansion' velocity) four times, with a vertical separation of 160.000 rain. Then, using the least-square method (Kotov, 1985) we found the best- fitting straight lines exceeding a 30- level of confidence (for the linear regression routine). The analysis was performed for a narrow range of periods (i.e., of various slopes of straight lines), from 159.960 to 160.040 min.
The computations showed that there are only three periods (sloping lines) which have a confidence C > 30-:
(1)P o = 160.009(+ 1) rain, C = 3.80-; (2)P 1 = 160.013(+ 1) rain, C = 3.30-; (3)P 2 = 159.961(+ 1) rain, C = 3.30-.
The number in parentheses indicates the standard error of the last digits. The best period equals 160.009 ( + 1) min and, therefore, coincides, within the limits
of errors, with the period values determined much earlier from the Stanford and Crimean observations: 160.0095(+ 10) and 160.0102(+ 5)rain, respectively, see Scherrer and Wilcox (1983) and Kotov (1985). The slope of the best-fitting straight line (Figure 1) implies that the correct period slightly differs (by about 0.01 min) from the 9th harmonic of a day. One should also notice that period P2 corresponds fairly well to the yearly side lobe of the primary period Po.
4. Power Spectrum
We reduce here quite unevenly spaced data series and, thus, might deal with a strong potential influence of the window sampling effect on the pattern of the computed power spectrum (PS). One should note, in particular, that the data cover only about 5 % of the total 15 yr time interval.
The 'physical' frequency resolution of the data string equals Av o ~ L - I ~ 2 nHz (L = 15 yr). Therefore, the maximal step in frequency for the PS computation should
0.10
z Ah,
(m/s) 2
I 1974-1986
N = 60257
I I
160 .m010(_*1)
0.05
0.00 104.12
Fig. 2.
10/*.16 104.20 V, ~4Hz
Power spectrum of the 1974-1986 observations of the solar velocity.

160 MINUTE SOLAR VARIATIONS AND THE 22 YEAR CYCLE 2 7 3
be, in accordance with usually accepted rule, Avo/2 ~ 1 nHz. So, to get a more or less
'complete' PS - for the period range, for instance, from 70 to 280 rain - one must compute and plot nearly ~ 2 x l0 s different frequencies. This seems to be a quite hard task due to computational and technical reasons.
However, for the goals of the present work, it is not necessary to obtain a 'complete' PS, because (1) we are not looking for the full spectrum of long-period solar g modes, and (2) the most detailed PS has already been computed by Scherrer and Wilcox (1983). There was only one significant peak, 160.010( + 1)min, which is, moreover, different from 160.000 min (1 of a day) by a considerable amount.
The PS of the Crimean solar velocity observations in the years 1974-1986, computed for the limited range near 160 min, is shown in Figure 2 (the step in frequency v is about 0.1 nHz; N = 60257 is the total number of individual velocity measurements made with a 5 min integration time). The strongest peak corresponds to a period of Po = 160.010(_+ 1)rain and has about a 5.7a confidence level. One can also see the presence of two yearly side lobes of Po corresponding to the 160.058 and 159.963 min periods. (The more detailed PS computed for the complete set of measurements, from 1974 through 1988, is presented and discussed in Kotov, Tsap, and Haneychuk (1990).)
Next, very strong evidence in favour of the true solar origin of the 160 rain oscillation was recently obtained from analysis of the time sequence of chromospheric flares.
5. Analysis of Onset Times of Solar Flares
To study this 160 min periodic effect in flares, Kotov and Levitsky (1987) have con- sidered the time series of starts of 18877 ( = Nf) flares of importance, B > 1, observed on the Sun over the 1947-1980 time interval according to the data of the world network of solar patrol observatories. (The starting times of flares listed in the world catalogues are typically defined with an uncertainty of about 1-3 min). This time series of 18877 flare events was subjected to a modified 'power spectrum' analysis based on the superposed epoch routine and computation of the X 2 criterion. The 'power spectrum' that was obtained is shown in Figure 3; the step in frequency ~ 0.02 nHz.
The actual frequency resolution of the flare PS is much better than that of the (harmonic) PS shown in Figure 2 for the solar velocity observations, due to the following two reasons: (1) the total length of the flare data (L = 34 yr) is about 2.3 times larger than the length of the Doppler shift observations (L = 15 yr); (2) the X 2 criterion for flare data was computed for each of 8 independent bins for an arbitrary period P (i.e., for each 20 min phase interval for the period range near 160 min; one should remember that the power (~A 2) is calculated for the whole length of the period for harmonic analysis). Consequently, the 'physical' frequency resolution of the flare Z 2 PS is about 0.1 nHz (i.e., about 18 times better than in the case of the velocity data).
One can see in Figure 3 that the major peak in the 160 min range corresponds to a period of 160.0101 ( _+ 1) min, which is in excellent agreement with the result of Doppler velocity observations.
The flare data also show that significant peaks (within the 160 min range of periods)

?ig.
3.
:2
~00
,00 O0
O0
I I
OLA
R
FLA
RES
, 19
47-1
980
14==
1887
7
o E. c~
o
o E'
m ~
g
E.-
---
o-
04J2
10
4.14
104.16
5-
.n
.-.-4
,o
3,,
0.99
9
04.1
8 10
4.20
V,
(4H
z
['he
Z 2-
'P ow
er s
pect
rum
' co
mpu
ted
for
the
tim
e se
quen
ce o
f 18
877
sola
r fl
ares
obs
erve
d in
194
7-19
80;
F 2
= (%
2)2 b
y de
fini
tion
(af
ter
Kot
ov a
nd L
evit
sky,
19
87).
The
hor
izon
tal
dash
ed l
ine
indi
cate
s a
0.99
9 le
vel
of c
onfi
denc
e.

160 MINUTE SOLAR VARIATIONS AND THE 22 YEAR CYCLE 275
originate as a multiplet structure. It is very interesting to note, in particular, that the
spacing between the two strongest peaks (periods 160.0101 and 160.0056 min) corre- sponds perfectly well to the average length of the solar 11 yr cycle. Moreover, the spacing between the peaks of the other pair of dominant frequencies (periods 160.0101 and 160.0126 min) corresponds to the beat period of 19.5 + 1.1 yr, which is near the length of the 20-22 yr cycle of the magnetic activity of the Sun.
From these results, we find that there could be a significant physical relation between the 160 min oscillation and the flare activity of the Sun as a whole and, further, suppose that the 160 min oscillation may trigger the occurrences of solar flares. (Notice, however,
UT
06 h
02 h
oo h
I I 1974.-1988 P =160,m009 [•
I I I J
@ �9
I I 1 I I I I [
./~J �9
Q
I l I I I I P I
t I I 1 I I I I I F I I I ~ 1976-1987
! P= 160'm010(-*21
fo, . 02h �9 @
ooh b
,F ~ I 1 1 I 1 r 1 P 1 i I 1 I ~974 7~ 78 8o 82 8z, 86 88
YEAR
Fig. 4. The phase-diagram for velocity (a) and brightness (b) measurements . l h c best-fitting sloping lines correspond to periods 160.009( + 1) min (a); 1974-1988 velocity observat ions and 160.010( + 2) min (b); 1976-1987 brightness observat ions (after Kotov, Didkovsky, and Haneychuk, 1990). The error bars show
the typical uncertainties in the phases.

276 v.A. KOTOV AND T. T. TSAP
that this tentative conclusion should be applied statistically only, since the physical reason for this 160 rain modulation in flaring activity of the Sun is still quite obscure.)
6. Brightness Measurements
Independent support for the 160 min oscillation of the Sun was also obtained from the analysis of extended observations of the differential (center-to-limb) brightness variations of the solar photosphere. These data were obtained in the Crimean Astrophy- sical Observatory (partly in collaboration with the Institut d'Astrophysique, Paris) from 1976 through 1987, with the use of four different instruments detecting the temporal changes in the solar limb-darkening function at various spectral pass-bands: solar magnetograph (Kotov, Severny, and Tsap, 1983), near-infrared brightness monitor (Koutchmy etal., 1980) and two photodiode arrays (Kotov, Didkovsky, and Haneychuk, 1990). The reduction of the measurements (487 days, 2661 hours in total) showed the presence of a statistically significant (at about 3 a level of confidence) period of 160.010 (+ 2)min and an average relative harmonic amplitude of the order of 2 x 10 - 5. The latter value corresponds to the relative harmonic amplitude --~4 x 10 - 6 for the total solar irradiance variations (Kotov, Didkovsky, and Haneychuk, 1990). It should be emphasized that the amplitude obtained does not contradict the upper limit of about 5 x 10 .6 placed on the 160 min variations of the solar irradiance by the ACRIM bolometric measurements made on board the SMM satellite (Woodard and Hudson, 1983).
The phase diagram constructed, using 16 epochs of the (maximum) differential brightness of the Sun, is shown in Figure 4(b) (it can be compared with the velocity phase-diagram presented on the top of Figure 4). The slope of the linear regression straight line indicates the presence of a more or less steady phase drift by about 33 min per year, implying a true period of 160.010( + 2)min in the solar brightness.
The authenticity of the true solar origin of the 160.01 min periodicity may also be judged from the inspection of Table II which gives the values of the period inferred from various kinds of independent solar observations.
TABLE II Periods inferred from various observations of the Sun
Observation Observatory Time Period Confidence interval (min)
Doppler shift Crimea 1974-1988 160.009(+ 1) 5.7a Brightness Crimea 1976-1987 160.010 ( + 2) 3a Solar flares World data 1947-1980 160.0101 ( + 1) 4a
7. Changes of the Amplitude
Over the 15 yr interval of the Crimean observations, the amplitude A h of the differential velocity exhibited remarkable variations during an observational season and also from
160 M I N U T E S O L A R V A R I A T I O N S A N D T H E 22 Y E A R C Y C L E 277
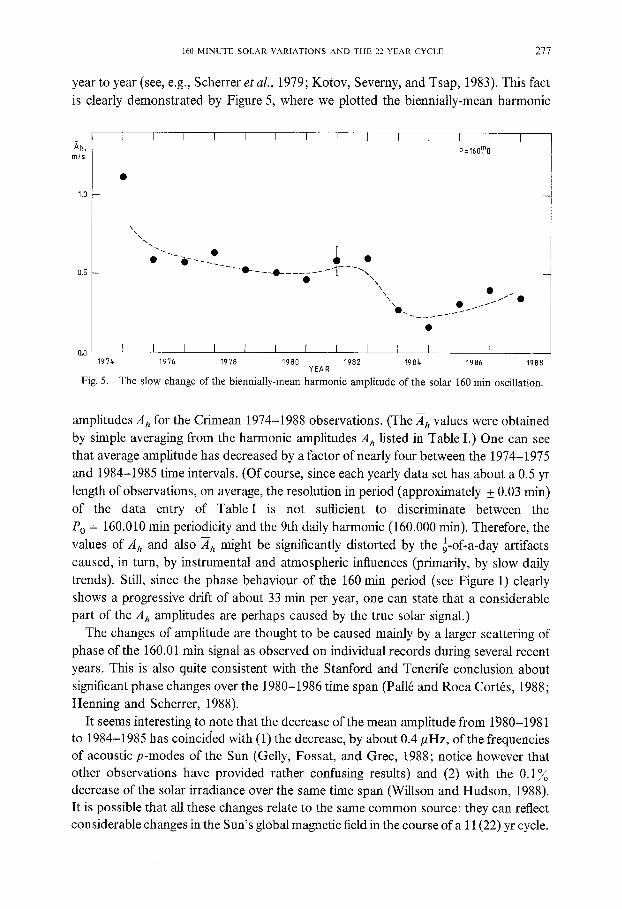
year to year (see, e.g., Scherrer e t al. , 1979; Kotov, Severny, and Tsap, 1983). This fact is clearly demonstrated by Figure 5, where we plotted the biennially-mean harmonic
Ah, rnls
1.0
0.5
L I I I I I I I 1 I I I I I p=16o.mo
\\
�9 O- . . . . . . . .O_ o____O_ _ --~.. \ \
\ ~ �9
0.0 I I I I 1 I I I I f I I t I 1974 1976 1978 1980 1982 1984 1986 1988
YEAR
Fig. 5. The slow change of the biennially-mean harmonic amplitude of the solar 160 min oscillation.
amplitudes Ah for the Crimean 1974-1988 observations. (The Ah values were obtained by simple averaging from the harmonic amplitudes A h listed in Table I.) One can see that average amplitude has decreased by a factor of nearly four between the 1974-1975 and 1984-1985 time intervals. (Of course, since each yearly data set has about a 0.5 yr length of observations, on average, the resolution in period (approximately _+ 0.03 rain) of the data entry of Table I is not sufficient to discriminate between the Po = 160.010 min periodicity and the 9th daily harmonic (160.000 min). Therefore, the values of A h and also Ah might be significantly distorted by the 1-of-a-day artifacts caused, in turn, by instrumental and atmospheric influences (primarily, by slow daily trends). Still, since the phase behaviour of the 160 rain period (see Figure 1) clearly shows a progressive drift of about 33 min per year, one can state that a considerable part of the A h amplitudes are perhaps caused by the true solar signal.)
The changes of amplitude are thought to be caused mainly by a larger scattering of phase of the 160.01 rain signal as observed on individual records during several recent years. This is also quite consistent with the Stanford and Tenerife conclusion about significant phase changes over the 1980-1986 time span (Pall6 and Roca Cortrs, 1988; Henning and Scherrer, 1988).
It seems interesting to note that the decrease of the mean amplitude from 1980-1981 to 1984-1985 has coincided with (1) the decrease, by about 0.4/zHz, of the frequencies of acoustic p-modes of the Sun (Gelly, Fossat, and Grec, 1988; notice however that other observations have provided rather confusing results) and (2) with the 0.1 ~o decrease of the solar irradiance over the same time span (Willson and Hudson, 1988). It is possible that all these changes relate to the same common source: they can reflect considerable changes in the Sun's global magnetic field in the course of a 11 (22) yr cycle.

278 v.A. KOTOV AND T. T. TSAP
8. Analysis of the Average Curves
The average velocity curve for the 160.0101 rain period is shown in Figure 6(a). It can be immediately compared with the 160 rain curve obtained for the changes of the solar
V, cm/s
0.0 Fig. 6.
t O O
\ / / �9 / \ \ / / �9 \ \
�9 \ \ \ \ �9
I I I 1974-1988 N = 7&359 T
25 - ~l-_~. �9
\ \ \ �9 / / \ \
[ / / �9 \~. / / �9 / /
�9 / . - 6 � 9 �9 �9 / / /Q/
-25
L
km 197tr-1988
1
/ � 9 �9 ~0\
/ /
aI. [ I I 10-s 1976-1987
N:31925 t
/ / / 'O // \,.
O/ �9 \\ / / \ \ � 9
b
c
�9 // 0 , / x / "\
/ O \xO / \ O �9 \ \ \ �9 / /
\ \ � 9
-2 �9 �9
i I I O.5 1.0 1.S PHASE (~60~010~
The average curves obtained for velocity (a), radius (b), and differential brightness (c) of the Sun. The dotted lines are sinusoids calculated by the least-square method.
radius (Figure 6b; the latter curve was obtained by a simple integration of the velocity curve under the supposition that we observe only a radial, spherically symmetrical, shift of the solar photosphere, i.e., for the case of degree of the oscillation l = 0), and with the average curve of the differential solar brightness (Figure 6(c)). The parameters of the three curves are presented in Table III.
The observed amplitudes are quite consistent with the theoretical calculations recently performed by Berthomieu and Provost (1989) for the integral intensity and velocity variations of the solar gravity modes (for the frequency range 40 to 130 #Hz and the
160 MINUTE SOLAR VARIATIONS AND THE 22 YEAR CYCLE
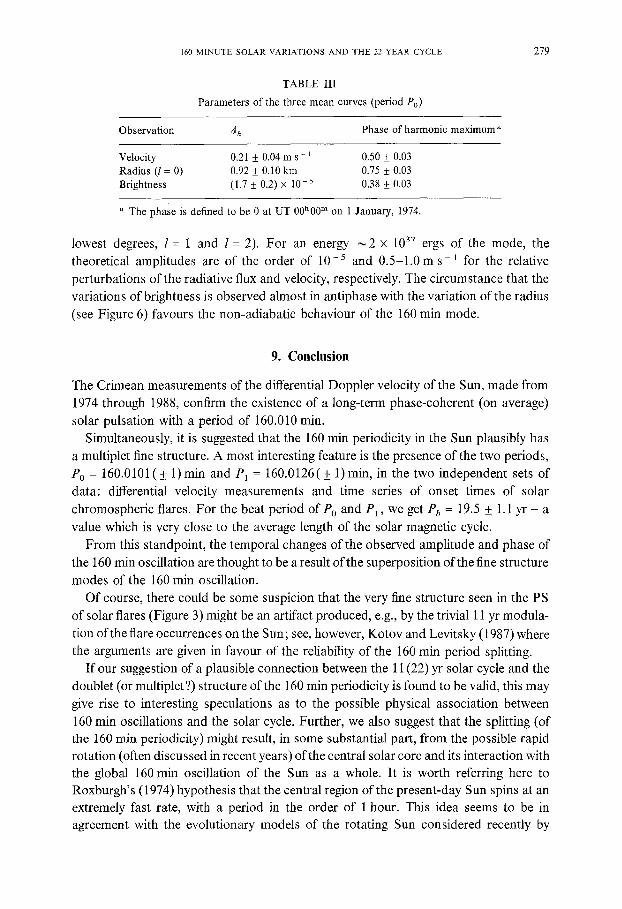
T A B L E III
P a r a m e t e r s o f the th ree m e a n curves (pe r iod Po)
279
Observation A h Phase of harmonic maximum a
Velocity 0.21 _+ 0.04 m s - 1 0.50 + 0.03 Radius (l = 0) 0.92 + 0.10 km 0.75 _+ 0.03 Brightness (1.7 + 0.2) x 10 -5 0.38 + 0.03
a The phase is defined to be 0 at UT 0 0 h 0 0 m o n 1 January, 1974.
lowest degrees, l = 1 and l = 2). For an energy ~ 2 x 1 0 37 ergs of the mode, the theoretical amplitudes are of the order of 10 -5 and 0.5-1.0 m s-1 for the relative
perturbations of the radiative flux and velocity, respectively. The circumstance that the variations of brightness is observed almost in antiphase with the variation of the radius
(see Figure 6) favours the non-adiabatic behaviour of the 160 rain mode.
9. Conclusion
The Crimean measurements of the differential Doppler velocity of the Sun, made from 1974 through 1988, confirm the existence of a long-term phase-coherent (on average)
solar pulsation with a period of 160.010 min. Simultaneously, it is suggested that the 160 min periodicity in the Sun plausibly has
a multiplet fine structure. A most interesting feature is the presence of the two periods,
Po = 160.0101 (+ 1)rain and P1 = 160.0126( + 1)min, in the two independent sets of data: differential velocity measurements and time series of onset times of solar
chromospheric flares. For the beat period o f P o and P1, we get Pb = 19.5 + 1.1 yr - a
value which is very close to the average length of the solar magnetic cycle.
From this standpoint, the temporal changes of the observed amplitude and phase of the 160 min oscillation are thought to be a result of the superposition of the fine structure
modes of the 160 min oscillation. Of course, there could be some suspicion that the very fine structure seen in the PS
of solar flares (Figure 3) might be an artifact produced, e.g., by the trivial 11 yr modula-
tion of the flare occurrences on the Sun; see, however, Kotov and Levitsky (1987) where the arguments are given in favour of the reliability of the 160 rain period splitting.
If our suggestion of a plausible connection between the 11 (22) yr solar cycle and the doublet (or multiplet?) structure of the 160 rain periodicity is found to be valid, this may give rise to interesting speculations as to the possible physical association between
160 min oscillations and the solar cycle. Further, we also suggest that the splitting (of the 160 min periodicity) might result, in some substantial part, from the possible rapid rotation (often discussed in recent years) of the central solar core and its interaction with the global 160 rain oscillation of the Sun as a whole. It is worth referring here to Roxburgh's (1974) hypothesis that the central region of the present-day Sun spins at an extremely fast rate, with a period in the order of 1 hour. This idea seems to be in agreement with the evolutionary models of the rotating Sun considered recently by

280 V.A. KOTOV AND T. T. TSAP
Pinsonneault et al. (1989) and, thus, lends support to the 'rapidly rotating central core' hypothesis advanced more than a decade ago to explain the solar neutrino deficit.
Acknowledgements
We would be remiss in not acknowledging our long collaboration with Prof. A.B. Severny in the study of solar global oscillations. We would also like to thank the anonymous referees for critical remarks and useful comments On the original version of the manuscript which resulted in many improvements.
References
Berthomieu, G. and Provost, J.: 1989, Astron. Astrophys. (submitted). Brookes, J. R., Isaak, G. R., and van der Raay, H. B.: 1976, Nature 259, 92. Elsworth, Y. P., Jefferies, S. M., McLeod, C. P., New, R., Pall6, P. L., van der Raay, H. B., R~gulo, G., and
Roca Cort6s, T.: 1989, Astrophys. J. 338, 557. Gelly, B., Fossat, E., and Grec, G.: 1988, Astron. Astrophys. 200, L29. Grec, G., Fossat, E., and Pomerantz, M.: 1980, Nature 288, 541. Henning, H. M. and Scherrer, P. H.: 1988, in 'Advances in Helio- and Asteroseismology', Proc. IAU Symp.
123, 29. Kotov, V. A.: 1985, Solar Phys. 100, 101. Kotov, V. A. and Levitsky, L. S.: 1987, Izv. Krymsk. Astrofiz. Obs. 77, 51. Kotov, V. A., Severny, A. B., and Tsap, T.T.: 1983, Izv. Krymsk. Astrofiz. Obs. 66, 3. Kotov, V. A., Severny, A. B., and Tsap, T. T.: 1984a, Mem. Soe. Astron. ltal. 55, 117. Kotov, V. A., Severny, A. B., and Tsap, T. T.: 1984b, in 'The Hydromagnetic of the Sun', ESA SP-220, 189. Kotov, V. A., Didkovsky, L. V. and Haneychuk, V.I.: 1990, Izv. Krymsk. Astrofiz. Obs. 83 (in press). Kotov, V. A., Tsap, T. T., and Haneychuk, V. I.: 1990, Solar Phys. (submitted). Koutchmy, S., Koutchmy, O., and Kotov, V. A.: 1980, Astron. Astrophys. 90, 372. Pall6, P. L. and Roca Cort6s, T.: 1988, in 'Advances in Helio- and Asteroseismology', Proc. IAU Symp. 123,
75. Pinsonneault, M. H., Kawaler, S. D., Sofia, S., and Demarque, P.: 1989, Astrophys. Y. 338, 424. Roxburgh, I. W.: 1974, Nature 248, 209. Scherrer, P. H. and Wilcox, J. M.: 1983, Solar Phys. 82, 37. Scherrer, P. H., Wilcox, J. M., Kotov, V. A., Severny, A. B., and Tsap, T. T.: 1979, Nature 277, 635. Severny, A. B., Kotov, V. A., and Tsap, T.T.: 1976, Nature 259, 87. Severny, A. B., Kotov, V. A., and Tsap, T.T.: 1980, Astron. Astrophys. 88, 317. Willson, R. G. and Hudson, H. S.: 1988, Nature 332, 810. Woodard, M. and Hudson, H.: 1983, Solar Phys. 82, 67.

![VARIATIONS GOLDBERG [ARIA et 30 variations] · Title: VARIATIONS GOLDBERG [ARIA et 30 variations] Author: Bach, Johann Sebastian - Arranger: Montreuille, Pierre - Publisher: Montreuille,](https://img.pdfslide.us/doc/110x75/610885d0028fe95f64358299/variations-goldberg-aria-et-30-variations-title-variations-goldberg-aria-et.jpg)