Embed Size (px)
Citation preview

EPD
NYSE
DISTRIBUTION REINVESTMENT PLAN
AVAILABLE TO ALL UNITHOLDERS
OFFERS 5% DISCOUNT ON REINVESTED UNITS
RANKING ON FORTUNE 500..........................
$27.41
595.8%
$1.58/UnitCURRENT ANNUALIZEDDISTRIBUTION.............................
YIELD..........................................................
INVESTOR RELATIONS CONTACTS
Raised cash distributions 47 consecutive quarters
Balanced distribution growth while retaining cash flow
Significant insider ownership with management and a�liates owning approximately 33%
Investment grade credit rating with focus on financial flexibility
EPD UNIT PRICE 5/23/2016................
Moody’s/Standard & Poor’s Baa1/BBB+
FINANCIAL PERFORMANCE
SENIOR UNSECURED DEBT RATINGS
PARTNERSHIP PROFILE
ENTERPRISE PRODUCTS PARTNERS L.P. IS ONE OF THE LARGEST PUBLICLY TRADED PARTNERSHIPS and a leading North American provider of midstream energy services to producers and consumers of natural gas, NGLs, crude oil, petrochemicals and refined products.
1ST QUARTER 2016 FACT SHEET
VISIT THE INVESTOR RELATIONS SECTION FOR DRIP PROSPECTUS.
ENTERPRISEPRODUCTS.COM

LARGEST GROWTH CAPITAL PROJECTS
SEPTEMBER 2011: Duncan Energy Partners L.P.
[“DEP”]. DEP unitholders received 1.01 EPD common
units in exchange for each DEP limited partner unit.
NOVEMBER 2010: Enterprise GP Holdings L.P.
[“EPE”]. EPE unitholders received 1.5 EPD common
units in exchange for each EPE limited partner unit.
OCTOBER 2009: TEPPCO Partners, L.P.
[“TPP”]. TPP unitholders received 1.24 EPD common
units in exchange for each TPP limited partner unit.
SEPTEMBER 2004: The partnership completed
a $6 billion merger with GulfTerra Energy Partners,
L.P. (“GTM”).
AUGUST 2002: The partnership completed a
$1.2 billion acquisition of the MAPL and Seminole NGL
pipelines from Williams.
SEPTEMBER 1999: The partnership completed a
$529 million acquisition of Shell Oil Company’s Louisiana
and Mississippi Midstream NGL business.
1
2
3
4
Enterprise announced plans to build a 400-mile, 24-inch diameter crude oil and condensate pipeline to transport product (in four segregated batches) from Midland, Texas to the Enterprise Sealy storage facility West of Houston. From Sealy, the new pipeline would link to Enterprise’s ECHO terminal through an interconnect with the Rancho II pipeline. Through ECHO, customers will have direct access to every re�nery in Houston, Texas City, Beaumont and Port Arthur, as well as Enterprise’s dock facilities. Commercial service is expected to begin in mid-2018.
CRUDE OIL AND CONDENSATE PIPELINE
MIDLAND TO SEALY PIPELINE.
The new facility, located in Mont Belvieu, Texas, will integrate with the partnership’s existing propylene fractionation facilities, and provide operational reliability and flexibility for both the PDH facility and fractionation facilities. The PDH facility is supported by long-term, fee-based contracts and is expected to be completed during the first quarter of 2017 with commercial service beginning in the second quarter of 2017.
PDH FACILITY
THE PROPANE DEHYDROGENATION (“PDH”) FACILITY IS DESIGNED TOPRODUCE UP TO 1.65 BILLION POUNDS (25,000 BPD) PER YEAR OF POLYMER GRADE PROPYLENE.
The facility which is located at Morgan's Point, will have a combined operating rate of 200,000 BPD across two docks. It currently is 90% contracted under long-term agreements. The ethane will be used by international ethylene crackers as a feedstock and as a potential feedstock for power generation.
ETHANE EXPORT FACILITY
ENTERPRISE IS ON SCHEDULE TO BEGIN SERVICE OF A FULLY REFRIGERATED ETHANE EXPORT FACILITY ON THE HOUSTON SHIP CHANNEL DURING THE THIRD QUARTER OF 2016.
The South Eddy plant, which is supported by long-term fee-based agreements, has processing capacity of 200 million cubic feet per day (“MMcf/d”) of natural gas sourced from the Delaware Basin and is capable of extracting up to 25,000 barrels per day (“BPD”) of natural gas liquids. The partnership, through a 50/50 joint venture with Oxy, is also building a second cryogenic processing facility in the Delaware Basin that is expected to begin service in the third quarter of 2016. The new 150 MMcf/d plant will be capable of extracting up to 20,000 BPD of natural gas liquids. Enterprise will build and operate the plant and related pipelines. Enterprise is committed to capitalizing on increased opportunities for midstream services in the Delaware Basin where production is expected to grow despite the nationwide decrease in rig count.
NATURAL GAS PROCESSING PLANTS
ENTERPRISE BEGAN COMMERCIAL OPERATIONS AT ITS NEW CRYOGENIC, NATURAL GAS PROCESSING FACILITY IN EDDY COUNTY, TEXAS MAY 2016.
FIRST QUARTER 2016 EARNINGS HIGHLIGHTSEnterprise generated distributable cash flow of $1.1 billion for the first quarter of 2016, which provided 1.3 times coverage of the $0.395 cash distribution paid May 6, 2016. The partnership retained $229 million of distributable cash flow, which is available to reinvest in growth capital projects, reduce debt and decrease the need to issue additional equity.
Enterprise reported a 14 percent increase in onshore natural gas liquid transportation (“NGL”) volumes to a record 5.2 million barrels per day (“BPD”) compared to first quarter of 2015. Total NGL, crude oil, refined products and petrochemical marine terminal loading and unloading volumes were 1.3 million BPD this quarter compared to the first quarter of last year. The partner-ship benefited from consistent performance from fee-based businesses, including the EFS Midstream assets acquired last year, contributions from newly constructed assets and record NGL and LPG export volumes. These benefits largely o�set lower earnings from our commodity and spread sensitive businesses, the sale of our o�shore business in 2015, and lower volumes on certain crude oil and natural gas pipelines.
Enterprise completed $300 million of organic growth projects in the first quarter of 2016 and is on schedule to complete and begin commercial service on another $2.2 billion of growth projects during the remainder of 2016. These assets include two natural gas processing plants and related pipelines in the Permian Basin; ethane export terminal on the Houston Ship channel; and additional crude oil storage infrastructure in the Houston and Beaumont, Texas areas. Enterprise has $4.2 billion of growth projects scheduled to be completed in 2017 and 2018.
On July 15, 2014 Enterprise announced a two-for-one split of common units representing limited partner interests. The common unit split was accomplished by distributing one additional common unit for each common unit outstanding.
In November 2010, Enterprise amended its partnership agreement to eliminate the general partner’s IDRs.
ELIMINATED GENERAL PARTNER INCENTIVEDISTRIBUTION RIGHTS (“IDRs”)
On April 11, 2016, Enterprise announced an increase in the partnership’s quarterly cash distribution with respect to the first quarter of 2016 to $0.395 per unit, representing a 5.3 percent increase over the distribution paid with respect to the first quarter of 2015. This was the 56th increase since the initial public o�ering in July 1998 and the 47th consecutive quarterly increase.
DISTRIBUTION ANNOUNCEMENT
TWO–FOR–ONE SPLIT OF COMMON UNITS
FINANCIAL ANNOUNCEMENT
MAJOR MERGERS & ACQUISITIONS

FEBRUARY 2015: Oiltanking Partners, L.P.
(“OILT”). OILT unitholders received 1.3 EPD common
units in exchange for each OILT limited partner unit.
JULY 1, 2015: The partnership completed a
$2.15 billion acquisition of the Eagle Ford Midstream assets
from Pioneer and Reliance.
SEPTEMBER 2011: Duncan Energy Partners L.P.
[“DEP”]. DEP unitholders received 1.01 EPD common
units in exchange for each DEP limited partner unit.
NOVEMBER 2010: Enterprise GP Holdings L.P.
[“EPE”]. EPE unitholders received 1.5 EPD common
units in exchange for each EPE limited partner unit.
PORTFOLIO OF EXISTING ASSETS
1
23
4

ASSET OVERVIEW
25 NATURAL GAS PROCESSING PLANTS
22 NGL AND PROPYLENEFRACTIONATION FACILITIES
≈250 MBBLS OF NGL, CRUDE OIL & PETROCHEMICAL/REFINED PRODUCTS STORAGE CAPACITY
14 BCF OF NATURAL GAS STORAGE CAPACITY
4,191 MILES OF REFINEDPRODUCTS PIPELINES
20,174 MILES OF NGL AND PETROCHEMICAL PIPELINES
19,093 MILES OF NATURAL GAS PIPELINES
5,418 MILES OF CRUDE OIL PIPELINES
116 MBPD OF BUTANEISOMERIZATION CAPACITY(MONT BELVIEU)
20 IMPORT/EXPORT SHIP TERMINALS
10 CONDENSATE DISTILLATION FACILITIES
POWER GENERATION
RESIDENTIAL FUEL
INDUSTRIAL FUEL
CRUDE OILREFINING INDUSTRY
PETROCHEMICALS
MOTOR GASOLINE
PETROCHEMICALS AND INDUSTRIAL/RESIDENTIAL FUEL
GASOLINE ADDITIVES AND PETROCHEMICALS
GASOLINE ADDITIVES AND PETROCHEMICALSTo fractionators for separation
into NGL purity products
Dry Natural Gas(principally methane with ethane)
Mixed NGLS
NGL Fractionation
MIDSTREAM ENERGY SERVICES
NATURAL GAS PROCESSING PLANT
NATURAL GASPIPELINES
NATURAL GASSTORAGE
NGL STORAGE
ETHANE
PROPANE
ISOBUTANE
NORMAL BUTANE
NATURAL GASOLINE
NGLPIPELINE
CRUDE OILPIPELINES
BARGES
TRUCKS
CRUDE OIL REFINING
CRUDE OILSTORAGE
REFINED PRODUCTS STORAGE
NATURAL GASPIPELINES
REFINED PRODUCTS PIPELINES
BARGES
MIXED BUTANES
HOUSTON AREA ASSETS
10 CONDENSATE DISTILLATION FACILITIES
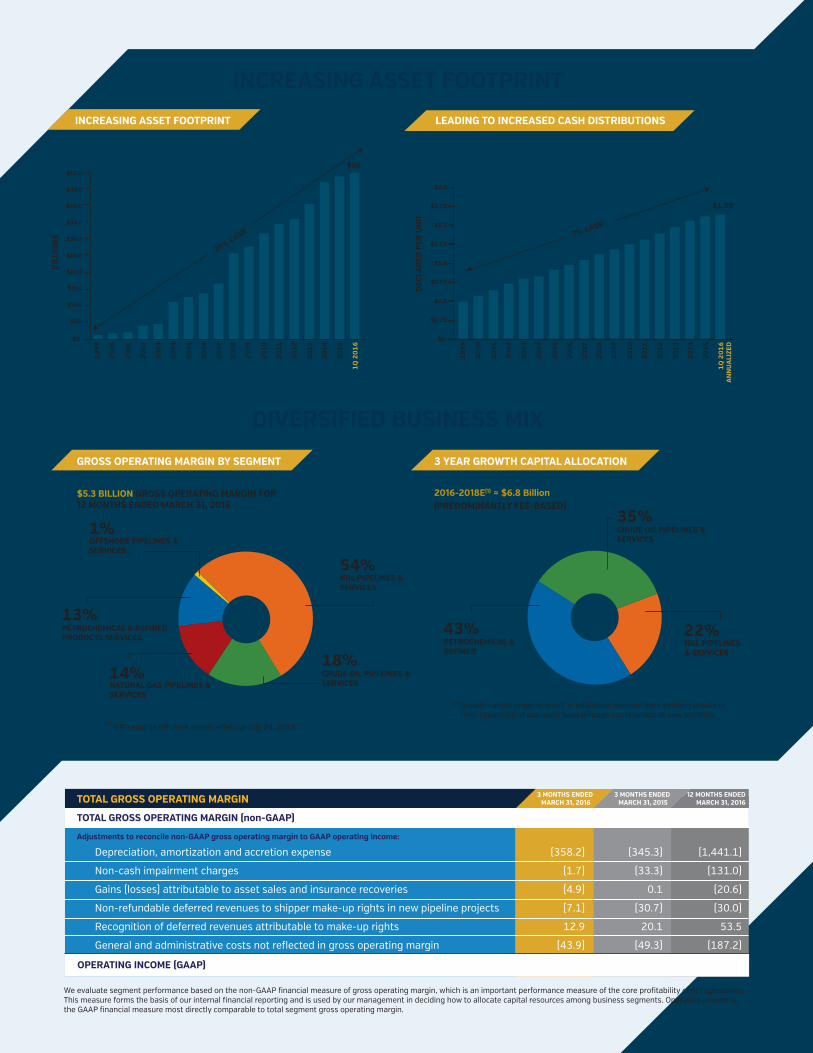
$5.3 BILLION GROSS OPERATING MARGIN FOR 12 MONTHS ENDED MARCH 31, 2016
2016-2018E(1) ≈ $6.8 Billion
(PREDOMINANTLY FEE-BASED)
Growth capital projects result in additional revenue from existing assets or from expansion of our asset base through construction of new facilities.
13%PETROCHEMICAL & REFINED PRODUCTS SERVICES
1%OFFSHORE PIPELINES & SERVICES (1)
54%NGL PIPELINES & SERVICES
18%CRUDE OIL PIPELINES & SERVICES
14%NATURAL GAS PIPELINES & SERVICES
(1)
GROSS OPERATING MARGIN BY SEGMENT 3 YEAR GROWTH CAPITAL ALLOCATION
35%
22%43%NGL PIPELINES & SERVICES
CRUDE OIL PIPELINES & SERVICES
PETROCHEMICAL & REFINED
EPD sold its o�shore assets e�ective July 24, 2015(1)
2013
(345.3)
(33.3)
0.1
(30.7)
20.1
(49.3)
(358.2)
(1.7)
(4.9)
(7.1)
12.9
(43.9)
Depreciation, amortization and accretion expense
Non-cash impairment charges
Gains (losses) attributable to asset sales and insurance recoveries
Non-refundable deferred revenues to shipper make-up rights in new pipeline projects
Recognition of deferred revenues attributable to make-up rights
General and administrative costs not reflected in gross operating margin
1,334.41,318.5TOTAL GROSS OPERATING MARGIN (non-GAAP)
Adjustments to reconcile non-GAAP gross operating margin to GAAP operating income:
5,316.2
(1,441.1)
(131.0)
(20.6)
(30.0)
53.5
(187.2)
$
3 MONTHS ENDED MARCH 31, 2016
3 MONTHS ENDED MARCH 31, 2015
12 MONTHS ENDEDMARCH 31, 2016
We evaluate segment performance based on the non-GAAP financial measure of gross operating margin, which is an important performance measure of the core profitability of our operations. This measure forms the basis of our internal financial reporting and is used by our management in deciding how to allocate capital resources among business segments. Operating income is the GAAP financial measure most directly comparable to total segment gross operating margin.
OPERATING INCOME (GAAP) 896.0 $915.6 $ 3,559.8 $
DIVERSIFIED BUSINESS MIX
INCREASING ASSET FOOTPRINT
TOTAL GROSS OPERATING MARGIN
DEC
LAR
ED P
ER U
NIT
$2.0
$1.0
$0
BIL
LIO
NS
27% CAGR
$45.0
$40.0
$35.0
$30.0
$25.0
$20.0
$15.0
$10.0
$5.0
$50.0
LEADING TO INCREASED CASH DISTRIBUTIONS
$0
$50
$1.58
7% CAGR
INCREASING ASSET FOOTPRINT
19
99
20
00
20
01
20
02
20
03
20
04
20
05
20
06
20
07
20
08
20
09
20
10
20
11
20
12
20
13
20
14
20
15
1Q
20
16
AN
NU
ALI
ZED
19
99
20
00
20
01
20
02
20
03
20
04
20
05
20
06
20
07
20
08
20
09
20
10
20
11
20
12
20
13
20
14
20
15
1Q
20
16
$0.5
$1.5
$1.75
$1.25
$0.75
$0.25

Significant expansion sinceEnterprise Products Partners’ initialpublic o�ering in 1998
PROVEN TRACK RECORD OF EXECUTINGGROWTH STRATEGY
Balanced distribution growth while retaining cash flow
Raised distribution rate 47 consecutive quarters
Significant insider ownership with management and a�liates owning approximately 33%
Investment grade credit rating with focus on financial flexibility
HISTORY OF STRONG FUNDAMENTAL AND FINANCIAL DISCIPLINE WHILE EXECUTING GROWTH STRATEGY AND PROVIDING ATTRACTIVE RETURNS
Connected to 100% of the ethylene steam crackers in the U.S (largest market for NGLs) and connected to ≈90% of the refineries East of the Rockies
STRATEGICALLY LOCATED TO SERVE THE MOST PROLIFIC BASINS FOR NATURAL GAS,CRUDE OIL AND NGLS IN THE UNITED STATES
FOCUS ON LONG-TERM COST OF CAPITAL TO SUPPORT VALUE CREATION
ENTERPRISE IS A PUBLICLY TRADED PARTNERSHIP WHICH OPERATES IN THE FOLLOWING WAYS THAT ARE DIFFERENT FROM A PUBLICLY TRADED STOCK CORPORATION:
Unitholders own limited partnership units and receive cash distributions instead of owning shares of common stock and receiving dividends
A partnership generally is not a taxable entity and does not pay federal income taxes. All of the annual income, gains, losses, deductions or credits flow through the partnership to the unitholders on a per unit basis
Unitholders are required to report their allocated share of these amounts on their income tax returns whether or not any cash distributions are paid by the partnership
Cash distributions paid by a partnership to a unitholder are generally not taxable, unless the amount of any cash distributed is in excess of the unitholder’s adjusted basis in his partnership interest
Enterprise provides each unitholder a Schedule K-1 tax package that includes each unitholder’s allocated share of reportable partnership items and other partnership information necessary to complete their income tax returns. The K-1 provides a unitholder the required tax information for their ownership interest in the partnership, just as a Form 1099-DIV does for a stockholder’s ownership interest in a corporation
This fact sheet includes “forward-looking statements” as defined by the SEC. All statements, other than statements of historical fact, included herein that address activities, events or developments that Enterprise expects, believes or anticipates will or may occur in the future are forward-looking statements. These forward-looking statements are subject to risks and uncertainties that may cause actual results to di�er materially, such as the required approvals by regulatory agencies and the impact of competition, regulation and other risk factors included in the reports filed with the SEC by Enterprise. Readers are cautioned not to place undue reliance on these forward-looking statements, which speak only as of their dates. Except as required by law, Enterprise does not intend to update or revise its forward-looking statements, whether as a result of new information, future events or otherwise.
We evaluate segment performance based on the non-GAAP financial measure of gross operating margin, which is an important performance measure of the core profitability of our operations. This measure forms the basis of our internal financial reporting and is used by our management in deciding how to allocate capital resources among business segments. Operating income is the GAAP financial measure most directly comparable to total segment gross operating margin.
FORWARD-LOOKING STATEMENTS
EXPECT TO GENERATE ADDITIONAL CASH FLOWS IN 2016 - 2018 FROM APPROXI-MATELY $6.8 BILLION OF GROWTH CAPITAL PROJECTS
ATTRACTIVE YIELD AND TAX DEFERRAL
Enterprise Plaza1100 Louisiana Street, 10th FloorHouston, TX 77002-5227
713-381-6500
P.O. Box 4324Houston, TX 77210-4324
RANDY BURKHALTERVice President
JACKIE RICHERTDirector
[email protected] [email protected]
INVESTOR RELATIONS E-MAIL CONTACTS
HEADQUARTERS
MAILING ADDRESS
ENTERPRISE PRODUCTS PARTNERS L.P.
KEY INVESTMENT CONSIDERATIONS
PUBLICLY TRADED PARTNERSHIP ATTRIBUTES
50.7
(0.5)
(139.0)
13.1
59.3
(13.4)
(186.4)
(13.4)
3 MONTHS ENDED MARCH 31
Sustaining capital expenditures
Cash proceeds from asset sales and insurance recoveries
Net e�ect of changes in operating accounts, as applicable
Miscellaneous non-cash and other amounts to reconcile non-GAAP
1,029.71,053.6DISTRIBUTABLE CASH FLOW (non-GAAP)
Adjustments to non-GAAP distributable cash flow to derive GAAP net cash flows provided by operating activities:
954.0899.7NET CASH FLOWS PROVIDED BY OPERATING ACTIVITIES (GAAP)
$
$
2016 2015
Distributable cash flow is a non-GAAP financial measure that indicates our success in generating cash flows at a level that supports our cash distributions. Distributable cash flow is also a quantitative standard used by the investment community with respect to publicly traded partnerships because the value of a partnership unit is, in part, measured by its yield, which is based on the amount of cash distributions a partnership can pay to a unitholder. The GAAP measure most directly comparable to distributable cash flow is net cash flows provided by operating activities.
DISTRIBUTABLE CASH FLOW
WHERE YOU CAN
ENTERPRISEPRODUCTS.COMVISIT ENTERPRISE PRODUCTS PARTNERS L.P. AT ITS WEBSITE OR CALL TOLL FREE:
866-230-0745
Read the latest news releases, listen to the conference calls and view presentations
Sign up for email alerts for upcoming events and new additions to the website
Learn more about the operations, management, financial performance and history of the partnership