Embed Size (px)
Citation preview

16 Effects acid atmospheric deposition on soil and groundwater
N. van Breemen1, J.J.M. van Grins ven2 & W. de Vries3
1 Wageningen Agricultural University, The Netherlands 2 Institute of Public Health and Environment, Bilthoven, The Netherlands 3 DLO Winand Staring Centre, Wageningen, The Netherlands
16.1 Introduction
'Acid atmospheric deposition' refers to wet and dry deposition of acid and potentially acid substances from the atmosphere on the earth's surface. These substances include strong mineral acids dissolved in rain water ('acid rain' sensu stricto), as well as such acids dissolved in aerosols and mist, and gases that can be turned into strong mineral acids after deposition. 'Acid rain' is only a fraction (often between 0.3 and 0.7) of total acid deposition, although the term is often used to indicate all of acid deposition.
Locally, burning of sulfur-rich coal and roasting of sulfidic ores has for centuries been recognized as a problem for the health of people as well as trees. The strong increase in the use of fossil fuel after World War II, and the dilution of the polluting gases by the erection of higher smoke stacks, transformed the problems from local to regional and continental scales. Acid atmospheric deposition became recognized as a problem in relation to acidification of lakes and streams in Scandinavia and Northeastern America in the early seventies (Likens & Bormann 1974). Decline in numbers of salmonid fish were soon found to be associated with low pH and high levels of dissolved aluminium (Schofield & Trofnar 1980). Although some argued that acidification in relation to changes in land use was more important (Rosenqvist 1979), it is now generally recognized that high acidity in precipitation, mainly due to industrial emissions of S02, was the main cause of water acidification and fish decline. Dramatic improvements of surface water quality by decreasing ambient atmospheric acid loads have been demonstrated in small watersheds in southern Norway where precipitation was intercepted by transparant roofs, and replaced by pre-industrial precipitation (Wright et al. 1988). Ulrich et al. (1979) were among the first to call attention to acidification of forest soils from acid atmospheric deposition and its potentially harmful effects on forest ecosystems. The first comprehensive effort to inventory acid rain problems in tropical countries was provided by Rohde & Herrera (1988).
In addition to sulfuric acid from S02 (released during burning of sulfur-rich fossil fuel), nitric acid from NOx (formed during internal combustion) and from NH3 (from intensive cattle production) were recognized as increasingly important contributors to acid deposition in the 1980's.
Elevated atmospheric deposition of nitrogen affects ecosystems not only by acidification, but also by eutrophication. This is one of the reasons why the causal relations between acid deposition and the growth and vitality of plants are extremely complex. It is now generally recognized that acid deposition strongly affects (1) the chemistry of sensitive soils, surface - and groundwaters, and (2) aquatic life in acidified waters. But apart from local tree decline in heavily impacted forests, and from widely observed
239

eutrophication of forests, negative effects of acid deposition on the growth of higher plants have rarely been established unambiguously.
In this text, the following aspects will be treated: - the nature of soil acidification - the nature of acid deposition - the sources of soil acidification - effects of acid deposition on soils and ground water - predicting effects of continuing and decreasing acid deposition - estimating critical loads of acid deposition for soils and ground waters. Whereas the principles discussed here are generally valid, most examples given refer to the situation in The Netherlands.
16.2 The nature of soil acidification
We will illustrate the process of soil acidification by discussing a hypothetical experiment involving adding free protons (H+) to a soil. As will be shown later, such protons can come from natural processes ('natural soil acidification') or from acid deposition driven by air pollution ('anthropogenic soil acidification'). The range of H+
addition normally varies from 0.05 to 20 kmolc' of H+ per ha of land surface per year. Most or practically all of the H+ ions added to the soil normally undergo some reaction with different solid phases present in the soil. By the reaction, such H+ buffering phases are either consumed or lose their capacity to consume H+. Two important characteristics of each phase that consumes H+ are the kinetics of the reaction and the amount of that phase present in the soil. Reactions can be considered 'rapid' if the consumption of H+ per unit time exceeds the rate of addition of H+. The buffer capacity can be considered very small if it is equivalent to only a few to several tens of years of H+ added to the soil. It can be considered very large if it is equivalent to thousands of years of H+ addition.
An example of a rapid reaction is the dissolution of calcium carbonate:
CaC03(s) + 2H+ — > Ca2+ + H20 + C02 (1)
Due to this reaction, protons are removed from solution and replaced by Ca2+, while solid calcium carbonate dissolves. If one or more of the reaction products are removed, e.g. by leaching of the Ca2+, the process has become irreversible, and the buffer capacity of the soil has been lowered. The buffer capacity due to calcium carbonate varies from nil in non-calcareous soils, to very large in calcareous soils. By its rapid neutralization of H+, CaC03 maintains the pH of the soil above 6.5 as long as it is present. In non-calcareous soils, which usually have a pH below 6.5, dissolution or transformation of aluminum silicates can be important in neutralizing H+. The reaction of aluminum silicates with H+ is a much slower process than the dissolution of CaC03. However, because aluminum silicates are a major constituent of most soils, the buffer capacity involved is often large. An example is K-feldspar, which can be transformed to kaolinite as follows:
1 molc refers to moles unit charge, obtained by multyplying molar concentration by ionic charge.
240

2KAlSi3Og(s) + 2H+ + 9H20 — > 2K+ + Al2Si205(OH)4(s) + 4H4SiO, (2)
Cation exchange can also buffer H+ if the pH falls below 6.5. It involves replacement of cations adsorbed to clay and to organic matter by H+. Buffering of H+ by aluminum hydroxide is important in strongly acid soils:
Al(OH)3(s) + 3H+ -> Al3+ + 3H,0 (3)
The reverse raction, whereby Al hydroxide is formed from dissolved Al3+ and water under the formation of H+, can take e.g. when percolating dissolved Al3+ moves into a subsoil with a relatively high pH.
To predict the course of soil acidification, it is important to know the buffer capacity of the phases undergoing rapid reactions with H+, while the buffering rate needs to be known for phases that buffer slowly (Table 16.1).
Table 16.1. Capacity, rate and pH range of important H+ buffering processes in typical Dutch forest soils. From de Vries & Kros 1989.
Buffer mechanism
Carbonate weathering
Silicate weathering
Cation exchange
Al-hydroxide weathering
pH range
>6.5
<6.5
4.0-6.5
<4.0
Buffer capacity kmolc/ha.cm
26 per % CaC03'
45-70
1.95 per % organic matter*; 0.65 per % clay*
5-45
Buffer rate kmolc/ha.a
high
0.1-1
high
high
* Expressed as mass fraction.
Figure 16.1 shows how the pH might change upon addition of H+ to a soil containing all buffering components listed in Table 16.1.
As long as the soil is still calcareous, its pH will hardly change, and will be maintained between 7 and 8. After all CaC03 has been consumed by H+, buffering by silicates will take over. The pH will now decrease because the rate of addition of H+
exceeds the rate of removal of H+. Cation exchange can take place simultaneously with the weathering of silicates. At pH>7 the cation exchange complex is fully saturated with K+, Na+, Ca2+, and Mg2+. By the time the pH has dropped to about 4, these cations have been replaced almost wholly by H+ and Al3+. The fraction of the complex occupied by mono- and divalent metal ions is called 'base saturation'. The term 'base' refers to the fact that K+, Na+, Ca2+, and Mg2+ are derived from easily soluble hydroxides, or strong bases. Finally, continued addition of strong acid will lead to dissolution of aluminum hydroxide according to reaction (3). The exact relationship
241

between the pH and the amount of H+ added depends not only on the composition of the soil, but also on the rate of H+ addition. When a certain amount of strong mineral acid is supplied much more rapidly than it can be neutralized by e.g. silicate minerals (cf Table 16.1), the final pH will be lower than when that same quantity of acid is supplied at a slower rate (Figure 16.1).
6-
5-
4-
3 -
~"̂ * N
\ \
\ \
\ V — S
H added, A ANC Figure 16.1. Hypothetical titration curve of a calcareous clay soil upon slow (broken line) or quick (solid line) acidification.
The hypothetical experiment illustrated in Figure 16.1 resembles soil acidification of an initially calcareous soil. Hundreds or thousands of years of natural soil acidification might be needed to reach a soil pH of about 4. In case of elevated atmospheric inputs of acids resulting from air pollution, less time would be needed to reach the same total acid addition, while the final pH would be lower.
The titration curve in Figure 16.1 could be obtained by adding strong mineral acid to a soil in a closed container. However, soil acidification in the field usually involves removal of reaction products by vertical percolation. A prerequisite for percolation is that, counted over a year, rain plus snowfall exceeds évapotranspiration. In The Netherlands and Belgium, precipitation excess is in the order of 100 to 300 mm, largely depending on the vegetation cover. Removal of the cations released during soil acidification (see equations 1-3) by leaching, moreover, requires the presence of mobile anions. These are in fact derived from the acids involved in soil acidification: S04
2" (derived from H2S04), N03 (derived from HN03), HC03 (derived from H2C03), and organic anions (derived from organic acids).
While the reader will by now have an intuitive grasp of the concept of soil acidification, we still lack a definition of the process. One commonly used definition emphasizes the changes taking place in the soil solution:
Soil acidification is a decrease in the pH of the soil solution (or of an aqueous extract of the soil).
A second definition emphasizes changes in the solid phases of the soil:
242

Soil acidification is a decrease in the acid neutralizing capacity (ANC) of the soil2.
The two definitions differ in that the first one refers to changes along the vertical axis of Figure 16.1, while the second definition refers to the horizontal axis. So, according to the first definition, no soil acidification occurs when a calcareous soil is losing CaC03, while the same process would be termed soil acidification according to the second definition. The decrease in pH emphasized in the first definition measures the change in actual acid intensity, a factor of great ecological significance. The decrease in buffering capacity is of no direct ecological significance (plants do not 'see' how much acid neutralizing capacity is still present), but its quantification is useful when accounting the fate of acid added to a soil.
16.3 The sources of soil acidification
Input of strong acids from the atmosphere due to anthropogenic acid deposition is an obvious source of soil acidification. So is natural strong acid deposition e.g. of S compounds derived from volcanic activity. As indicated above, however, atmospheric acid deposition is relatively unimportant under natural conditions. The major sources of H+ in natural soil acidification are: - weak acids such as C02 or organic acids - higher uptake of cations than of (strong-acid) anions by plants - strong mineral acids (especially HN03) produced as end products of oxidative decom
position of organic N. The weak acids can acidify the soil (according to definition #2) only if the dissociated anions are leached from the soil together with the cations mobilized by the H+
produced during dissociation. This requires annual net percolation of water through the soil. The strong mineral acids can acidify the soil only if the N and S involved are not taken up again by plants or microorganisms, i.e. if the nutrient cycle involving those nutrients is leaky. Finally, excess uptake of cations by plants can lead to permanent soil acidification only if the plant material containing the cations is removed, e.g. .by harvesting of forest products.
The role of weak natural acids, of plant uptake, and of nitrogen compounds in somewhat greater detail will be discussed.
16.3.1 Weak acids
In calcareous soils, C02 derived from root respiration and decomposition of dead plant material, is the dominant acidifying agent. It dissociates into HC03" and H+, dissolving CaC03 as follows:
2 the ANC can be defined as the sum of (the quantitative important) base components minus that of (prevalent) strong acid components present in soil minerals and at the exchange complex: ANC= 6A120 + 2CaO + 2MgO + 2K20 + 2Na20 - 2S03 - 2P205 (4), expressed in moles of these components per volume (or land surface area) of soil. All soil minerals of quantitative importance, plus the exchangeable cations, can be thought of as being made up of these components plus the components Si02, Fe203, C02 and H20. The latter four can be considered as inert, i.e. they do not consume or produce protons when titrating a soil with acid down to a pH of 3, and they are therefore not included in the ANC.
243

CaC03(s) + C02 + H20 — > Ca2+ + 2HC03 (4)
As a result calcium and bicarbonate ions can be leached from the soil. The decrease in ANC as a result of this process in Dutch calcareous soils is in the order of 10 to 20 kmol/ha.a. Dissociation of C02 is important only at pH above 5. It can, therefor, not cause soil pH values much below 5, and can play no role in strongly acid soils.
Many simple aliphatic and phenolic organic acids produced in the course of decomposition of plant remains and soil organic matter do not only deprotonate, but may also form complexes with metal ions such as Al. A hypothetical example is the dissolution of K-feldspar:
KAlSi308(s) + 4 R-COOH(aq) + 4H20 — > K+ + Al(R-COO)(3)(aq) + RCOO.(aq) + 3H4Si04(aq) (5)
Organic acids may be (partly) decomposed by microbes. This will cause precipitation of Al (as hydroxide or solid Al-organic complex), leading to the formation of so-called podzolic soils ( soils characterized by dark illuvial soil horizons of organic compounds and Al). However, most of the mono- and divalent cations will continue to be leached. The decrease in ANC resulting from organic acids is usually in the order of 0.1 to 0.5 kmol/ha.a. (de Vries & Breeuwsma 1986). Many organic acids are stronger than carbonic acids, and may eventually cause soil pH values in the order of 3.5 to 4.
16.3.2 Plant uptake
Plants usually take up more cations than anions, and balance the positive excess charge by exuding protons at their root surface. This is illustrated by uptake of K+:
plant-COOH + K+ — > plant-COOK + H+ (6)
Upon death and decay of the plant, the process is reversed:
R-COOK + H20 — > R-COOH + K+ + OH (7)
so that no net soil acidification takes place. The accumulation over many centuries of cation nutrients in a steady state pool of living biomass, e.g. in an undisturbed primary forest, involves a relatively small soil acidification (in the order of 50 to 100 kmol/ha). By removing these accumulated cations, e.g. by harvesting wood and crops, the soil acidification becomes permanent. Rates of soil acidification resulting from litter raking in forests (a widespread practice to 'collect' fertility before the advent of fertilizers) was in the order of 0.5 kmol/ha.yr. Removal of trees and crop residues increases soil acidification by values in the order of resp. 1 and 3 kmol/ha.yr.
16.3.3 Acidification from N compounds
In terrestrial ecosystems, the bulk of N is normally bound in soil organic matter. As long as this N remains tied up in the organic matter, or stays in the nutrient cycle, no net acidification will take place. However, mineralization of organic N to NH4
+, followed by oxidation of NH4
+ to nitric acid (normally under the influence of autotrophic microbes: nitrification), and by leaching of nitrate, causes strong soil acidi-
244

fication:
NH4+ + 2 02 — > NO3- + 2H+ + H20 (8)
This source of acidification may be important when mineralization of soil organic matter is stimulated, while at the same time the uptake of N by the vegetation is decreased, e.g. during deforestation or drainage of wetlands.
16.3.4 Acid deposition
As discussed before, the main sources of anthropogenic soil acidification are (1) sulfuric acid from S02 produced by burning of sulfur-rich fossil fuel, and (2) nitric acid produced from NOx formed in internal combustion engines and from NH3 emitted from animal excreta in intensive animal production. The sulfur and nitrogen gases can be transported through the atmosphere over distances in the order of 10° to 103 km before they are deposited again on the earth's surface. Deposited N and S are either still in gaseous form, or as dissolved or aerosolic acids or salts, after transformation of S02
and NOx to sulfuric and nitric acids. NH3 readily reacts with these acids to form dissolved or aerosolic ammonium sulfate. With rain and snow the dissolved reaction products can be added directly to the soil. However, dry deposition of gases and aerosols, in particular on vegetation surfaces is quantitatively more important than wet deposition, in particular relatively close to the source (i.e. within 10° to 102 km).
If all of the sulfur and nitrogen originating from S02, NOx, and NH3, deposited on a certain area of land, would be transformed to sulfuric and nitric acid and would be available for leaching of cations, acidification is maximal, and the so-called potential acid deposition (PAD) is realized:
PAD = DS02 + DNOx + DNH3 (9)
In equation (9) Dx stands for total (wet + dry) deposition of compound X in molc.ha" ' .a1. Usually this potential acid deposition is not fully realized because part of the deposition, especially the N compounds, are assimilated into the living biomass, and stored in soil organic matter. In case of acidification by atmospheric ammonium sulfate we can distinguish three cases:
a. The ammonium sulfate is leached without being taken up by plants, or being nitrified. ANC does not change, so there is no soil acidification.
b. All ammonium is taken up by the plant. H2S04 is left behind, and the ANC decreases by 2 mol per mol of (NH4)2S04 deposited. This decrease in ANC can be attributed to the S02 from which the sulfate originated.
c. All ammonium is nitrified and the N03~ formed is leached (equation 9). The ANC decreases by 4 moles per mole of ammonium sulfate. Half of the acidification can be attributed to S02, half to NH3.
Table 16.2 shows calculated values for the depostion of the various components for 'average' land cover and forest for various years and regions in The Netherlands. Table 16.2 illustrates (1) the effect of forest in increasing deposition of S02 and NH3, (2) the link between proximity of refineries and high S02 deposition (in the province of South Holland), and between intensive bio industry and high NH3 deposition (in North Lim-
245

burg), and (3) the effect of a predominance of relatively clean maritime air on total deposition (in North Holland). The lowering in the mean PAD for the whole country from 6700 mol/ha.a in 1980 to 4700 mol2/ha.a in 1989 was mainly due to decreased S02 emissions.
Table 16.2. Deposition fluxes of acidifying substances in 1980 and 1989 in The Netherlands (means for the whole country, for forest within the country and for three provinces). From Erisman & Heij 1991.
Area/Province
Netherlands (mean) Netherlands (mean) Netherlands (forest)
North Holland South Holland North Limburg
Year
1980 1989 1989
1989 1989 1989
so2
3140 1340 1500
1060 2000 1580
NOy
1690 1550 1300
1120 1310 1190
NHZ
molc
2500 2190 2530
1170 1410 4110
Potential Acid Deposition*
dry
ha"1 a'
5000 3300 4000
2100 3100 4900
wet
1700 1700 1400
1200 1300 1900
total
6700 4700 5300
3300 4400 6800
* PAD has been corrected for deposition of bases and is therefore lower than the sum of S02, NOy
and NHT.
PAD values in the central industrialized part of Europe are of the same magnitude as those in The Netherlands, but the contribution of S02 is generally higher and that of NH3 is normally lower than in The Netherlands (Figure 16.2). In southern Scandinavia and northeastern USA, where the effects of acid deposition (on lakes and fish) were noticed first, PAD is generally less, in the order of 1000 to 2000 mol/ha.a, and is mainly due to S02. Natural background levels of PAD are probably about 300 mol/ha.a. (Galloway et al. 1984).
246

flIVffifil ilia H l < 8000 > 8000 <500 < 1000 <2000 <4000 < 6000
Figure 16.2. Potential deposition in Europe in 1988 (molc ha"1.a"1). From Erisman & Heij 1991.
16.4 Effects of acid deposition on soils and groundwater
16.4.1 Forest and heath land versus agricultural land
Natural and anthropogenic atmospheric acidification take place regardless of the type of land use. However, apart from rarely serious direct damage by NH3 and S02 on plant leaves, atmospheric acidification on arable land is of little concern. First, most agricultural land is limed regularly to undo the effects of natural acidification and of crop removal (see section 16.3.2). The extra costs of liming to undo acidification due to atmospheric deposition (50 kg of CaC03 per kmol of acid deposition) for the individual farmer are usually small. Second, forest soils are usually poorer (i.e lower in bases and in weatherable minerals) than most agricultural soils, and are therefore more sensitive to acidification by strong mineral acids. Thirdly, dry deposition is generally higher on trees than on lower vegetations, increasing the acid deposition on forests relative to that on agricultural land. Deposition on forests is increased most strongly along forest edges. This is an important factor in a country such as The Netherlands with its patchwork of woodlands.
247

For the reasons listed above most of the following discussion is related to soil acidification on forests and heath lands.
16.4.2 Measurements of soil acidification
Comparison of ANC values of weathered topsoil compared to unweathered subsoil in soil profiles in homogeneous parent material (e.g. eolian sediments or hard rock) can provide an estimate of the accumulated soil acidification since the beginning of soil formation. If the age of the soil is known, the mean annual rate of soil acidification (AANC) can be calculated. If the soils are relatively old, e.g. in the order of 104 years, the AANC can be attributed wholly to natural soil acidification. For non-calcareous Dutch forest soils, the mean annual AANC ranged from 0.02 to 0.6 kmolc/ha.a (de Vries & Breeuwsma 1986).
Recent soil acidification can be quantified in two ways. The first method involves a comparison of soil samples taken from the same site at different times. There are two problems with this approach. First, the amounts of base cations removed annually during soil acidification are small relative to the amounts present in the solid plus adsorbed form. Second, spatial variability at short distances may be appreciable. To be able to detect changes from analyses of soils samples, therefore, the sampling interval needs to be long, i.e. usually in the order of decades. Comparison of soil samples taken decades ago and taken again in the 1970's and 1980's from the same sites in the FRG (Ulrich et al. 1980; Butzke 1981), Austria (Glatzel & Kazda 1985) and in South Sweden (Tamm & Hallbaecken 1988; Falkengren-Grerup et al. 1987) show indeed that soil pH and base saturation have decreased dramatically throughout the root zone of most forest soils. The most comprehensive study is that by Tamm & Hallbaecken (1988). They accounted for the effect of stand age on soil pH, and showed a strong pH increase in the South, but little change in pH in soils of Northern Sweden, where acid atmospheric deposition is only a fraction of that in the South. Such studies cannot prove that acid deposition is the cause of the observed soil acidification. However, because the acidification is in the same order as that expected from the general level of acid atmospheric deposition on the basis of simulation models (see section 16.6), there can be little doubt about the cause.
The second method, based on an input-output budget, provides a direct link with atmospheric deposition. By measuring or estimating annual inputs of all major inorganic compounds in atmospheric deposition, and outputs by drainage and removal of harvested wood, the rate of soil acidification can be quantified on an annual basis. A great disadvantage is the large number of samples and measurements required to obtain such a budget. Table 16.3 gives an input-output budget for a Scots pine stand in The Netherlands. The ionic fluxes were obtained by (1) estimating monthly water input and drainage fluxes, (2) multiplying those fluxes with measured monthly ionic concentrations in the soil solution, and (3) summing up monthly values to annual values.
The results of Table 16.3 are characteristic for actual soil acidification in Dutch forest soils. Input and output of S04
2" are fairly similar, indicating near-equilibrium between dissolved sulfate and the sorption sites for sulfate in the soil after many years of high deposition of sulfate. The high throughfall input of NH4
+ reflects the high deposition of ammonia, mainly in dry form, on the forest canopy. Only a small part of the ammonium is leached, the remainder being stored in the system (soil plus vegetation) and/or nitrified to HN03. Nitrate output far exceeds nitrate input, which must be attributed indeed to nitrification of ammonium. The strong soil acidification associated with this
248

process (equation (9) is reflected by the dissolution and leaching of Al3+. The soil acidification resulting from atmosferic deposition (AANCDEP)
calculated from: can be
AANCnFP = AH+ + ANH4+ - ANCv AS04
2" AC1- (10)
whereby each term on the righthand side refers to the difference between input and output flux, expressed in molc/ha.a.
The average soil acidification from atmospheric deposition equals 4.9 kmolc/ha.a. (cf. Table 16.3), 30 % of which can be attributed to nitrification of incoming ammonium. The contribution of 'natural' soil acidification is much less: tree growth at Tongbersven decreases ANC annually by 0.5 kmolc/ha.a and dissociation of organic acids by 0.2 kmolc/ha.a. The complete hydrogen ion budget (van Breemen et al. 1984) for the site is given in Table 16.4.
Table 16.3. Hydrochemical input-output budget for a Scots pine stand, Tongbersven, The Netherlands. Input refers to water collected below the tree canopy (throughfall water), output is drainage water below the root zone, at 57 cm depth. The results are mean annual values for the period 1983-1987. From Mulder et al. 1989.
input output
balance
water
cm
80 24
56
H+
-.2 0.2
-.4
A-
0.2
-.2
K+
0.1 0.1
0.0
Na+
1.1 0.8
0.3
Ca2+ Mg2+
kmolc ha"1 a"1
0.3 0.3 0.2 0.3
0.1 0.0
Al3+
0.0 5.3
-5.3
NH4+
3.7 0.7
3.0
CI
1.2 1.2
0.0
N03-
0.6 2.1
-1.5
so42
3.2 4.4
-.8
A refers to organic anions.
Table 16.4. H+ budget of the Tongbersven Scots pine stand, The Netherlands. Mean annual data (kmolc/ha.a) for 1983-1987.
H+ sources
atmospheric deposition net cation uptake by trees organic acid dissociation
totals
4.9 0.5 0.2
5.6
H+ sinks
weathering of Al weathering of bases leaching of H+
5.3 0.1 5.4
5.8
The results of Table 16.4 are typical of forest soils in Central and Western Europe. Together with the low rates of natural soil acidification, they attest to the overwhelming dominance of present-day acid atmospheric deposition over natural acidification in (non-calcareous) forest soils.
249
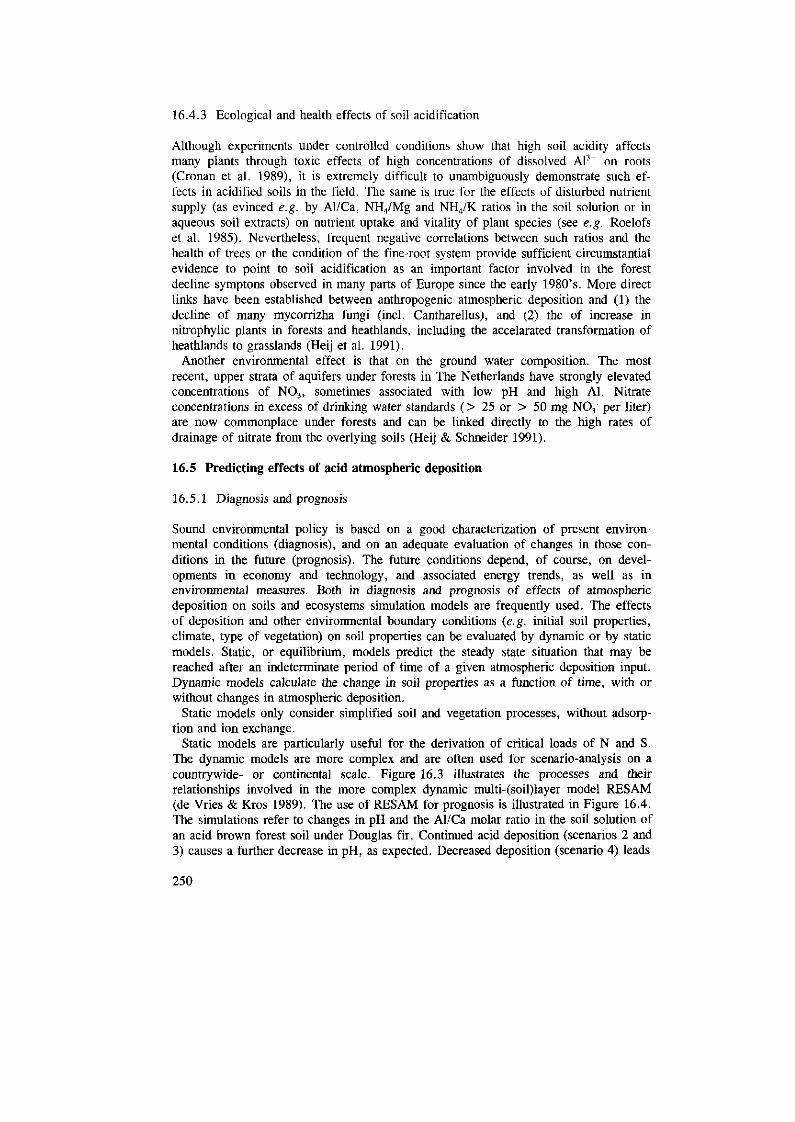
16.4.3 Ecological and health effects of soil acidification
Although experiments under controlled conditions show that high soil acidity affects many plants through toxic effects of high concentrations of dissolved Al3+ on roots (Cronan et al. 1989), it is extremely difficult to unambiguously demonstrate such effects in acidified soils in the field. The same is true for the effects of disturbed nutrient supply (as evinced e.g. by Al/Ca, NH4/Mg and NH4/K ratios in the soil solution or in aqueous soil extracts) on nutrient uptake and vitality of plant species (see e.g. Roelofs et al. 1985). Nevertheless, frequent negative correlations between such ratios and the health of trees or the condition of the fine-root system provide sufficient circumstantial evidence to point to soil acidification as an important factor involved in the forest decline symptons observed in many parts of Europe since the early 1980's. More direct links have been established between anthropogenic atmospheric deposition and (1) the decline of many mycorrizha fungi (incl. Cantharellus), and (2) the of increase in nitrophylic plants in forests and heathlands, including the accelarated transformation of heathlands to grasslands (Heij et al. 1991).
Another environmental effect is that on the ground water composition. The most recent, upper strata of aquifers under forests in The Netherlands have strongly elevated concentrations of N03, sometimes associated with low pH and high Al. Nitrate concentre tions in excess of drinking water standards (> 25 or > 50 mg N03" per liter) are now commonplace under forests and can be linked directly to the high rates of drainage of nitrate from the overlying soils (Heij & Schneider 1991).
16.5 Predicting effects of acid atmospheric deposition
16.5.1 Diagnosis and prognosis
Sound environmental policy is based on a good characterization of present environmental conditions (diagnosis), and on an adequate evaluation of changes in those conditions in the future (prognosis). The future conditions depend, of course, on developments in economy and technology, and associated energy trends, as well as in environmental measures. Both in diagnosis and prognosis of effects of atmospheric deposition on soils and ecosystems simulation models are frequently used. The effects of deposition and other environmental boundary conditions (e.g. initial soil properties, climate, type of vegetation) on soil properties can be evaluated by dynamic or by static models. Static, or equilibrium, models predict the steady state situation that may be reached after an indeterminate period of time of a given atmospheric deposition input. Dynamic models calculate the change in soil properties as a function of time, with or without changes in atmospheric deposition.
Static models only consider simplified soil and vegetation processes, without adsorption and ion exchange.
Static models are particularly useful for the derivation of critical loads of N and S. The dynamic models are more complex and are often used for scenario-analysis on a countrywide- or continental scale. Figure 16.3 illustrates the processes and their relationships involved in the more complex dynamic multi-(soil)layer model RESAM (de Vries & Kros 1989). The use of RESAM for prognosis is illustrated in Figure 16.4. The simulations refer to changes in pH and the Al/Ca molar ratio in the soil solution of an acid brown forest soil under Douglas fir. Continued acid deposition (scenarios 2 and 3) causes a further decrease in pH, as expected. Decreased deposition (scenario 4) leads
250

Idenitrificatioir ^ 1 nitrification ^ f ï
Ê<Ê
, ( \ weathering y Q
K
weathering
aluminium hydroxides
I desorption . ^
n Q | \)f adsorption I
exchange complex
adsorbed sulphate
leaching
( groundwater J
Figure 16.3. Relation diagram of the RESAM model. From de Vries & Kros 1991.
to a (temporary) increase in pH, and decreasing dissolved Al, leading to decreased Al/Ca ratios, also according to intuitive expectation. Quite surprising, however, is that Al/Ca ratios decrease too with strong soil acidification following deposition scenarios 2 and 3. Normally, the elevated solubility of Al3+ with decreasing pH will lead to higher, not lower Al/Ca ratios. The lower Al/Ca ratios are caused by decreasing contents of solid Al phases (mainly organically bound Al), available for buffering of strong acids (Mulder et al. 1989). Results from a nation-wide application of RESAM for The Netherlands (de Vries et al. 1991; Table 16.5) show how a number of chemical soil solution indicators are expected to change with time if total depositon would decrease from 4.4 kmolc/ha.yr in 1990 to 0.7 kmolc/ha.yr in 2050.
Dynamic models are often used also for analysing hydrochemical monitoring data obtained from intensively studied field sites. Figure 16.5 shows results from a similar dynamic model (WATERSTOF) to evaluate long-term monitoring data on the composition of the soil solution in strongly acidified soils under spruce in Soiling, Germany (Wesselink et al in prep.). Model and monitoring data illustrate (1) the pronounced seasonality of sulfate concentrations in the surface soil, and (2) the increase of sulfate concentrations from low to more or less constant high values after saturation of the sulfate sorption capacity of the soil between 1974 and 1979.
251

10000-
8000-
6000-
4000-
2000-
0-
/ v
/ N
/ \ / \ - -/ \
N S
s
— scenario 2
— scenario 4
I960 1980 2000 2020 2040 2060
1960 1980 2000 2020 2040 2060
<
Figure 16.4. Changes in deposition with time for three scenarios (a) and the effect on pH (b) and Al/Ca ratio (c) in the topsoil of a leptic podzol. From de Vries & Kros 1989.
252

Table 16.5. Predicted median values for chemical indicators in soil solution in the surface soil (surf.) and subsoil (subs.) under Douglas (D), Scots Pine (P) and Oak (O), following a drastic decrease in atmospheric deposition. Model results using RESAM. From de Vries et al. 1991.
Chemical indicator
pH Al
Al/Ca NH4/K N03
Unit
molc/m3
mol/mol mol/mol mol/m3
Soil depth
surf. subs. surf. subs. surf. surf. subs.
D
3.6 3.7 0.8 1.7 3.7 2.6 1.1
1990
P
3.6 3.8 0.6 1.3 3.1 2.8 0.7
0
3.8 3.8 0.3 0.8 1.5 2.4 0.5
D
3.9 3.9 0.2 0.6 1.2 2.9 0.4
2010
P
3.9 4.0 0.1 0.4 1.0 3.1 0.2
0
4.2 4.0 0.1 0.3 0.4 2.6 0.2
D
4.4 4.1 0.0 0.1 0.2 1.9 0.1
2050
P
4.4 4.2 0.0 0.1 0.2 2.1 0.1
0
4.5 4.4 0.0 0.1 0.1 1.7 0.0
SO, 0 cm (below litter)
[SOJmin. [SOJmax.
• simulation
year SO, 90 cm
i-, u "o
*= 4-
3-
2-
1-
0.
& '"'
• ° . \
KA*
f*
~\ 1—1 1 1 1 1
• [SOJmin. 0 [SOJmax. — simulation
«
• •
T 1 1 1 1 1 1 1 1 73 75 77 79 81 83 85 87 89 91
Figure 16.5. Measured (symbols) and simulated (lines) concentrations of dissolved sulfate just below the forest floor and at 90 cm depth in an acid brown forest soil under Norway Spruce in Soiling, Germany, between 1973 and 1988. From Wesselink et al. in preparation.
253

16.5.2 Estimating critical loads
A critical load has been defined as 'A quantitative estimate of an exposure to one or more pollutants below which significant harmful effects on specified sensitive elements of the environment do not occur according to present knowledge' (Nilsson & Grenfelt 1988). For determining critical loads of atmospheric deposition the exposure is usually set equal to the annual atmospheric input of potential acidity (PAD) or of total nitrogen. The sensitive element may be a stand of a particular tree species, some other plant or animal species, or it may be the groundwater composition with its suitability for drinking water in mind.
The first step in setting a critical load is to specify threshold values for the most critical chemical properties of e.g. the soil solution, that should not be exceeded so as to prevent significant harmful effects. Table 16.6 shows the threshold values for such properties for forest soils and for ground water, as used in The Netherlands (de Vries 1991). These threshold values are usually based on results of toxicological studies under controlled laboratory or greenhouse conditions, or of epidemiological research.
Table 16.6. Threshold values proposed for chemical indicators that define critical loads for forest soils and for groundwater in The Netherlands.
Chemical indicator
Unit Forests soil Groundwater
Al Al/Ca PH Alkalinity N03
NH4/K
Alkalinity = = [HC03]
molc m"3
mol/mol
mol m"3
mol m"3
mol/mol
+ organic anions •
0.2 1 4.0
-0.3 0.10 5
• [H+] - [Al3+]
0.02 irrelevant 6.0 0.14 0.8 irrelevant
Long-term (static) mass balance models are used to derive critical deposition levels, because it is a safe steady state situation that should be aimed at. Every critical threshold value may lead to another critical load. Table 16.7 shows the estimated critical loads for nitrogen and total potential acidity on coniferous and deciduous trees on non-calcareous sandy soils under Dutch conditions (de Vries & Kros 1991).
One of the most simple static models involved here is the critical load of nitrogen deposition to prevent excessive nitrate in ground water. It is based on the equation
CL (Ndt) = Ngu + Nde + Nim (crit) + N03ile(crit) (ID
in which CL stands for critical load, 'Ndt ' for total (wet plus dry) atmospheric deposition of N, 'gu' stands for growth uptake by trees, 'de' for denitrification, 'im' for immobilisation of N in soil organic matter, and 'le' for leaching to the ground water. The suffix 'crit' refers to a possible threshold value in the N budget. N03 le(crit) depends on the selected critical element or function of the ecosystem. If protection of groundwater for use as drinking water is aimed at, its value can be calculated by multi-
254

Table 16.7. Mean critical loads (molc/ha.a) for nitrogen and total acid on non-calcareous forest soils in The Netherlands.
Type of forest Critical element Deciduous Coniferous
Critical load for total acid
root damage (Al/Ca) depletion of soil Al excessive Al in ground water
1100-1400 1200
500
1400-1700 1500
300
Type of forest Critical element Deciduous Coniferous
Critical load for nitrogen
frost damage/diseases 1500-3000 disturbed nutrition 800-1250 excessive nitrate in ground water 900-1500 1700-2900
plying the excess precipitation over évapotranspiration by the threshold value, e.g. 25 mg/1 of nitrate in drinking water. Nira(crit) is the critical rate for N immobilisation to prevent C/N ratios in soil organic matter from dropping to values that may cause N saturation.
Provided that sufficient spatial information is available, critical loads can be presented by means of maps depicting the percentage of a certain area (usually a grid cell) where a certain critical load is exceeded. This provides additional information useful for making policy decisions. An example is shown in Figure 16.6 (de Vries et al. 1992).
16.5.3 Uncertainty in model calculations
Even though the models discussed here have been partly validated using monitoring data (see e.g. Figure 16.5), the uncertainties can be large due to uncertainties in model input data, model structure, and critical chemical vaulues.
The model itself introduces further uncertainties due to (1) simplifications inherent in modelling, (2) incompleteness of the model (e.g. N fixation, denitrification and complex hydrological processes, such as bypass flow, are not normally included), (3) uncertainties about values for model parameters, and (4) spatial and temporal variability under field conditions. Uncertainties about the critical chemical values are partly due to a large variation in critical values for different species.
Figure 16.7 gives the outcome of a Monte Carlo uncertainly analysis of the change in molar NH4/K ration in the soil solution of an acid forest soil in response to a decreasing atmospheric N input. In the analysis, 75 of the 200 parameter used in RESAM were varied, using 250 Monte Carlo runs. Uncertainties were similar for the Al/Ca ratio, but appreciably less for pH and dissolved N03.
255

Critical load potential acidity
5 percentile value
^ *1Πf^g^ jg
r^^S^
s* jmmmm
^K^^y^H
r ^f~Pi
^ • ' ^ H i o o°- 1 5 0 0
^ ^ ^ H p ! |p| 1500-2000
^ ^ ^ ^ T [**~ 2000 3000
scale 1:3.500.000
Critical load potential acidity median value
G
water
<1000
1000- 1500
1500- 2000
2000 - 3000
>3000
scale 1:3.500.000
Figure 16.6. Five and fifty percent values of critical loads for acid N deposition (mol/ha.a) in The Netherlands for forest soils in 10*10 km grid cells.
256

•g M a
4 -
2 -
97.5 perc. 2.5 perc. mean
. . . . . _ réf. run median
1990 1995 2000 2005 I
2010 time
Figure 16.7. Uncertainty range in of the temporal development of the molar NH4/K ratio in the surface soil of an acid forest soils in response to decreased N input. From de Vries & Kros 1991.
257

16.6 References
Breeuwsma, A. & de Vries, W., 1984. The relative importance of natural production of H+ in soil acidification. Netherland Journal of Agricultural Science 32: 161-163.
Butzke, H., 1988. Zur zeitlichen und kleinraumigen Variabilität des pH-werten in Waldboden Nordrhein-Westfalens. Forst und Holz 43(4): 81-85.
Cronan, CS. , April, R., Bartlett, R.J., Bloom, P.R., Driscoll, CT. , Gherini, S.A., Henderson, G.S., Joslin, J.D., Kelly, J.M., Newton, R.M., Parnell, R.A., Patterson, H.H., Raynall, DJ., Schaedle, M., Schofield, CT. , Sucoff, E.I., Tepper, H.B. & Thornton, F.C., 1989. Aluminium toxicity in forests exposed to acidic deposition. Water Air and Soil Pollution 48: 181-192.
de Vries, W., 1991. Methodologies for the assessment and mapping of critical loads and the impact of abatement strategies on forest soils. Wageningen. The Winand Staring Centre for Integrated Land, Soil and Water Research. Report 46.
de Vries, W. & Breeuwsma, A., 1986. Relative importance of natural and anthropogenic proton sources in soils in the Netherlands. Water Air and Soil Pollution 28: 173-184.
de Vries, W. & Kros, J., 1989. Lange-termijn effecten van verschillende depositiescenario's op representatieve bosbodems in Nederland. Report 30 DLO Winand Staring Centre, Wageningen, The Netherlands. 89 pp.
de Vries, W. & Kros, J., 1991. Assessment of critical load and the impact of deposition scenarios by steady state and dynamic soil acidification models. In: G.J. Heij & T. Schneider (Eds), Acidification research in the Netherlands. Elsevier, Amsterdam. Studies in Environmental Science 46: 569-624.
de Vries, W., Kros, J., van der Salm, C & Voogd, J.C.H., 1991. Effects on forest soils. In: G.J. Heij & T. Schneider (Eds), Acidification Research in the Netherlands. Final Report of the Dutch Priority Programme on Acidification. Elsevier, Amsterdam. Studies in Environmental Science 46: 169-179.
de Vries, W., Kros, J., Hootsmans, R., van Uffelen, G.J. & Voogd, J.C.H., 1992. Critical loads for Dutch forest soils. In: T. Schneider (Ed.), Acidification Research; Evaluation and Policy Application. Elsevier, Amsterdam. Studies in Environmental Science 50: 307-318.
Erisman, J.W. & Heij, G.J., 1991. Concentrations and deposition of acidifying compounds. In: G.J. Heij & T. Schneider (Eds), Acidification research in the Netherlands. Elsevier, Amsterdam. Studies in Environmental Science 46: 51-96.
Falkengren-Grerup, U., Linnermark, N. & Tyler, G., 1987. Changes in acidity and cation pools of South Swedish soils between 1949 and 1985. Chemosphere 16: 2239-2248.
Galloway, J.N., Likens, G.E. & Hawley, M.E., 1984. Acid precipitation: Natural versus anthropogenic components. Science 226: 829-831.
Glatzel, G. & Kazda, M., 1985. Wachstum und Mineral stof fernährung von Buche (Fagus sylvatica) und Spitzahorn (Acer platanoides) auf versauertem und schwermetallbelastetem Bodenmaterial aus dem Einsicherungsbereich. Zeitschrift für Pflanzenernährung und Bodenkunde 148: 429-438.
Heij, G.J., de Vries, W., Posthumus, A.C. & Mohren, G.M.J., 1991. Effects of air pollution and acid deposition on forests and forest soils. In: G.J. Heij & T. Schneider (Eds), Acidification Research in the Netherlands. Final Report of the Dutch Priority Programme on Acidification. Elsevier, Amsterdam. Studies in Environmental Science 46: 97-137.
Kros, J., Janssen, P., de Vries, W. & Bak, C , 1990. Het gebruik van onzekerheidsanalyse bij modelberekeningen: een toepassing op het regionale bodemverzuringsmodel RESAM. Wageningen, Staring Centrum, Rapport 65.
Likens, G.E., & Bormann, F.H., 1974. Acid rain: a serious regional environmental problem. Science 184: 1176-1179.
Mulder, J., van Breemen, N. & Eijck, H.C., 1989. Depletion of soil aluminium by acid deposition and implications for acid neutralization. Nature 337: 247-249.
Nilsson, J. & Grenfelt, P., 1988. Critical loads for sulfur and nitrogen. Miljorapport 1988:15, Nordic Counsil of Ministers, Copenhagen, Danmark. 418 pp.
Roelofs, J.G.M., Kempers, A.J., Houdijk, A.L.F.M. & Jansen, J., 1985. The effect of air-borne ammonium sulphate on Pinus nigra var. maritima in The Netherlands. Plant and Soil 84: 45-86.
258

Rosenqvist, LT., 1983. Acidification of freshwaters in Europe. Water Quality Bulletin 8: 137-142. Schofield, C.L. & Trofnar, J.R., 1980. Aluminum toxicity to Brook trout (Salvelinus fontinalis) in
acidified waters. In: T.Y. Toribara, M.W. Miller & P.E. Morrow (Eds), Polluted rain. Environmental Science Research 17: 341-366.
Tamm, CO. & Hallbaecken, L., 1988. Changes in soil acidity in two forest areas with different acid deposition: 1920s and 1980s. Ambio 17: 56-61
Ulrich, B., Mayer, R. & Khanna, P.K., 1979. Deposition von Luftverunreinigungen und ihre Auswirkungen in Waldökosystemen im Soiling. Schriften aus der Forstlichen Fakultät der Universität Götingen und der Niedersächsischen Forstlichen Versuchsanstalt. Band 58: 291.
Ulrich, B., Mayer, R. & Khanna, P.K., 1980. Chemical changes due to acid precipitation in a loess-derived soil in Central Europe. Soil Science 130: 193-199.
van Breemen, N., Driscoll, C.T. & Mulder, J., 1984. Acid deposition and internal proton sources in acidification of soils and waters. Nature 307: 599-604.
Wright, R.F., Lotse, E. & Semb, A., 1988. Reversibility of acidification shown by whole-catchment experiments. Nature 334: 670-675.
Wesselink, B., Mulder, J. & Matzner, E., in preparation. Modelling seasonal and long term dynamics of water chemistry in and acid forest soil.
259