Embed Size (px)
Citation preview
1
Stanbic IBTC Holdings PLC ANNUAL REPORT 2017
33
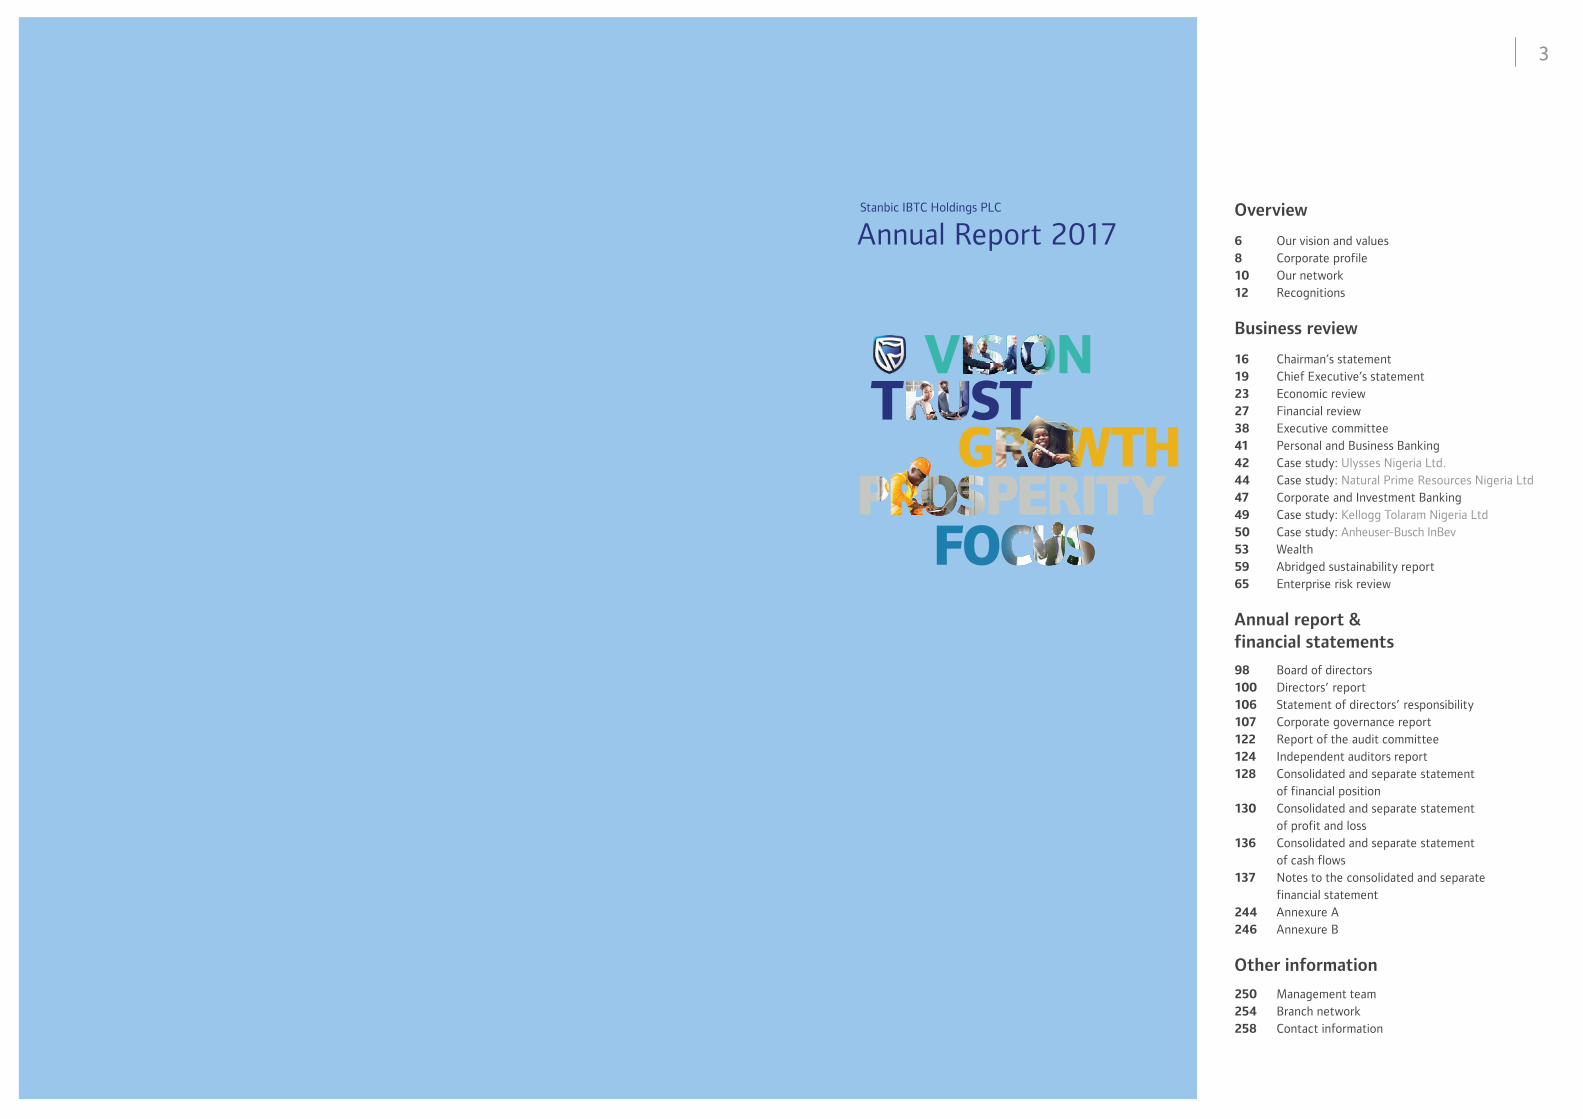
1619232738414244474950535965
Chairman’s statementChief Executive’s statement Economic reviewFinancial review Executive committee Personal and Business Banking Case study: Ulysses Nigeria Ltd.Case study: Natural Prime Resources Nigeria Ltd Corporate and Investment Banking Case study: Kellogg Tolaram Nigeria Ltd Case study: Anheuser-Busch InBevWealth Abridged sustainability reportEnterprise risk review
Business review
250254258
Management teamBranch networkContact information
Other information
98100106107122124128
130
136
137
244246
Board of directorsDirectors’ reportStatement of directors’ responsibilityCorporate governance report Report of the audit committeeIndependent auditors reportConsolidated and separate statement of financial positionConsolidated and separate statement of profit and lossConsolidated and separate statement of cash flowsNotes to the consolidated and separate financial statementAnnexure AAnnexure B
Annual report & financial statements
681012
Our vision and values Corporate profile Our network Recognitions
OverviewStanbic IBTC Holdings PLC
Annual Report 2017

5
to make your Nigeria possible
Having advisors with
681012
Our vision and values Corporate profile Our network Recognitions
Overview
Our collective vision allows our group to make the connections between investors, businesses and inspired ideas. Creating new opportunities, and navigating the financial challenges of a changing economy imaginatively so that we never leave people unsupported or new avenues unexplored.
This is what drives us at Stanbic IBTC

Group results in brief6 7Stanbic IBTC Annual group financial statements for the year ended 31 December 2017 Overview Business review Annual report & financial statements Other information
Vision and values
To be the leading end-to-end financial solutions provider in Nigeria through innovative and customer-focused people.
Serving our customers
We do everything in our power to
ensure that we provide our clients with
the products, services and solutions
to suit their needs, provided that
everything we do for them is based
on sound business principles.
Constantly raising the bar
We have confidence in our ability to achieve
ambitious goals and we celebrate success,
but we are careful never to allow ourselves
to become complacent or arrogant.
Being proactive
We strive to stay ahead by anticipating rather than
reacting, but our actions are always carefully considered.
Upholding the highest
levels of integrity
Our entire business model is based on
trust and integrity as perceived by our
stakeholders, especially our clients.
Delivering to our shareholders
We understand that we earn the right to exist by
providing appropriate long-term returns to our
shareholders. We try extremely hard to meet
our various targets and deliver on
our commitments.
Respecting each other
We have the highest regard for the dignity of all people.
We respect each other and what Stanbic IBTC stands for.
We recognise that there are corresponding obligations
associated with our individual rights.
Growing our people
We encourage and help our people to develop to their
full potential and measure our leaders on how well they
grow and challenge the people they lead.
Working in teams
We, and all aspects of our work, are interdependent.
We appreciate that as teams we can achieve much greater
things than as individuals. We value teams within and
across business units, divisions and countries.
Group results in brief8 9Stanbic IBTC Annual group financial statements for the year ended 31 December 2017 Overview Business review Annual report & financial statements Other information
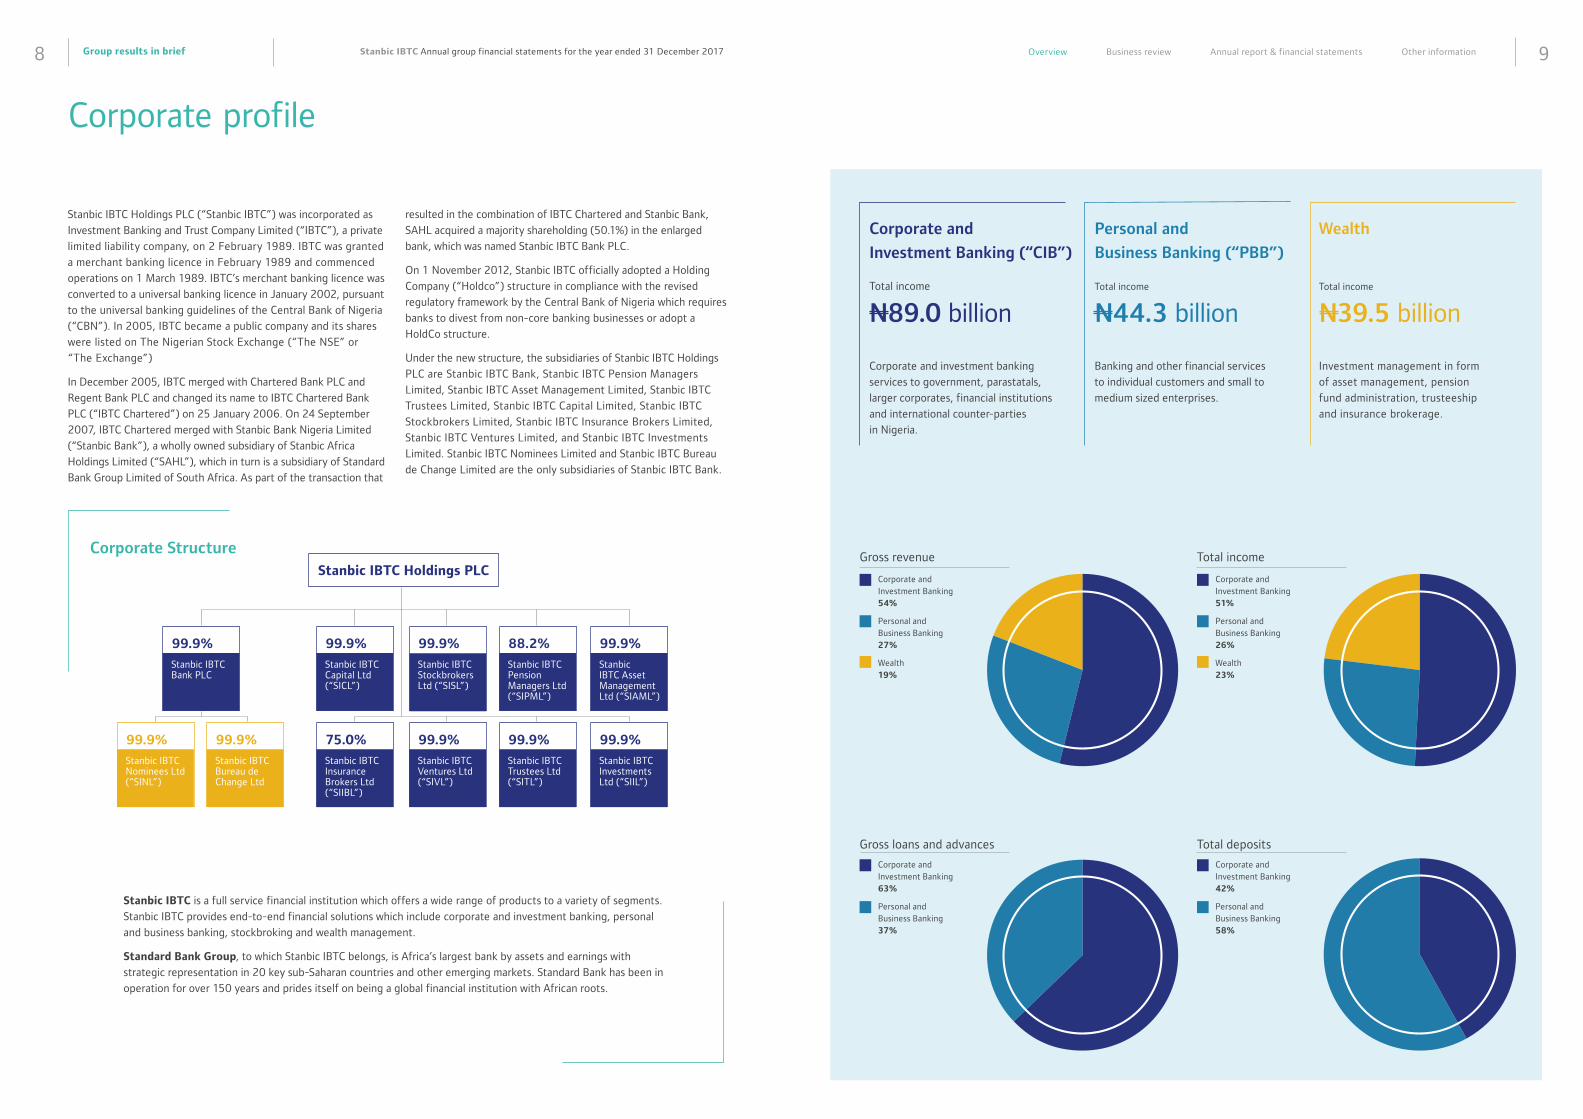
Corporate Structure
Stanbic IBTC Holdings PLC (“Stanbic IBTC”) was incorporated as
Investment Banking and Trust Company Limited (“IBTC”), a private
limited liability company, on 2 February 1989. IBTC was granted
a merchant banking licence in February 1989 and commenced
operations on 1 March 1989. IBTC’s merchant banking licence was
converted to a universal banking licence in January 2002, pursuant
to the universal banking guidelines of the Central Bank of Nigeria
(“CBN”). In 2005, IBTC became a public company and its shares
were listed on The Nigerian Stock Exchange (“The NSE” or
“The Exchange”)
In December 2005, IBTC merged with Chartered Bank PLC and
Regent Bank PLC and changed its name to IBTC Chartered Bank
PLC (“IBTC Chartered”) on 25 January 2006. On 24 September
2007, IBTC Chartered merged with Stanbic Bank Nigeria Limited
(“Stanbic Bank”), a wholly owned subsidiary of Stanbic Africa
Holdings Limited (“SAHL”), which in turn is a subsidiary of Standard
Bank Group Limited of South Africa. As part of the transaction that
resulted in the combination of IBTC Chartered and Stanbic Bank,
SAHL acquired a majority shareholding (50.1%) in the enlarged
bank, which was named Stanbic IBTC Bank PLC.
On 1 November 2012, Stanbic IBTC officially adopted a Holding
Company (“Holdco”) structure in compliance with the revised
regulatory framework by the Central Bank of Nigeria which requires
banks to divest from non-core banking businesses or adopt a
HoldCo structure.
Under the new structure, the subsidiaries of Stanbic IBTC Holdings
PLC are Stanbic IBTC Bank, Stanbic IBTC Pension Managers
Limited, Stanbic IBTC Asset Management Limited, Stanbic IBTC
Trustees Limited, Stanbic IBTC Capital Limited, Stanbic IBTC
Stockbrokers Limited, Stanbic IBTC Insurance Brokers Limited,
Stanbic IBTC Ventures Limited, and Stanbic IBTC Investments
Limited. Stanbic IBTC Nominees Limited and Stanbic IBTC Bureau
de Change Limited are the only subsidiaries of Stanbic IBTC Bank.
Stanbic IBTC is a full service financial institution which offers a wide range of products to a variety of segments.
Stanbic IBTC provides end-to-end financial solutions which include corporate and investment banking, personal
and business banking, stockbroking and wealth management.
Standard Bank Group, to which Stanbic IBTC belongs, is Africa’s largest bank by assets and earnings with
strategic representation in 20 key sub-Saharan countries and other emerging markets. Standard Bank has been in
operation for over 150 years and prides itself on being a global financial institution with African roots.
Gross revenue
Gross loans and advances Total deposits
Corporate and Investment Banking 54%
Personal and Business Banking 27%
Wealth 19%
Corporate and Investment Banking 63%
Personal and Business Banking 37%
Corporate and Investment Banking 42%
Personal and Business Banking 58%
Total income
Corporate and Investment Banking 51%
Personal and Business Banking 26%
Wealth 23%
Stanbic IBTC Nominees Ltd (“SINL”)
Stanbic IBTC Holdings PLC
Stanbic IBTC Pension Managers Ltd (“SIPML”)
Stanbic IBTC Trustees Ltd (“SITL”)
Stanbic IBTC Stockbrokers Ltd (“SISL”)
Stanbic IBTC Ventures Ltd (“SIVL”)
Stanbic IBTC Capital Ltd (“SICL”)
Stanbic IBTC Bank PLC
Stanbic IBTC Insurance Brokers Ltd (“SIIBL”)
Stanbic IBTC Bureau de Change Ltd
Stanbic IBTC Asset Management Ltd (“SIAML”)
Stanbic IBTC Investments Ltd (“SIIL”)
88.2%
99.9%
99.9%
99.9%
99.9%99.9%
75.0%99.9%99.9%
99.9%
99.9%
Personal and
Business Banking (“PBB”)
WealthCorporate and
Investment Banking (“CIB”)
Total income
N44.3 billion
Banking and other financial services
to individual customers and small to
medium sized enterprises.
Total income
N39.5 billion
Investment management in form
of asset management, pension
fund administration, trusteeship
and insurance brokerage.
Total income
N89.0 billion
Corporate and investment banking
services to government, parastatals,
larger corporates, financial institutions
and international counter-parties
in Nigeria.
Corporate profile
Group results in brief10 11Stanbic IBTC Annual group financial statements for the year ended 31 December 2017 Overview Business review Annual report & financial statements Other information
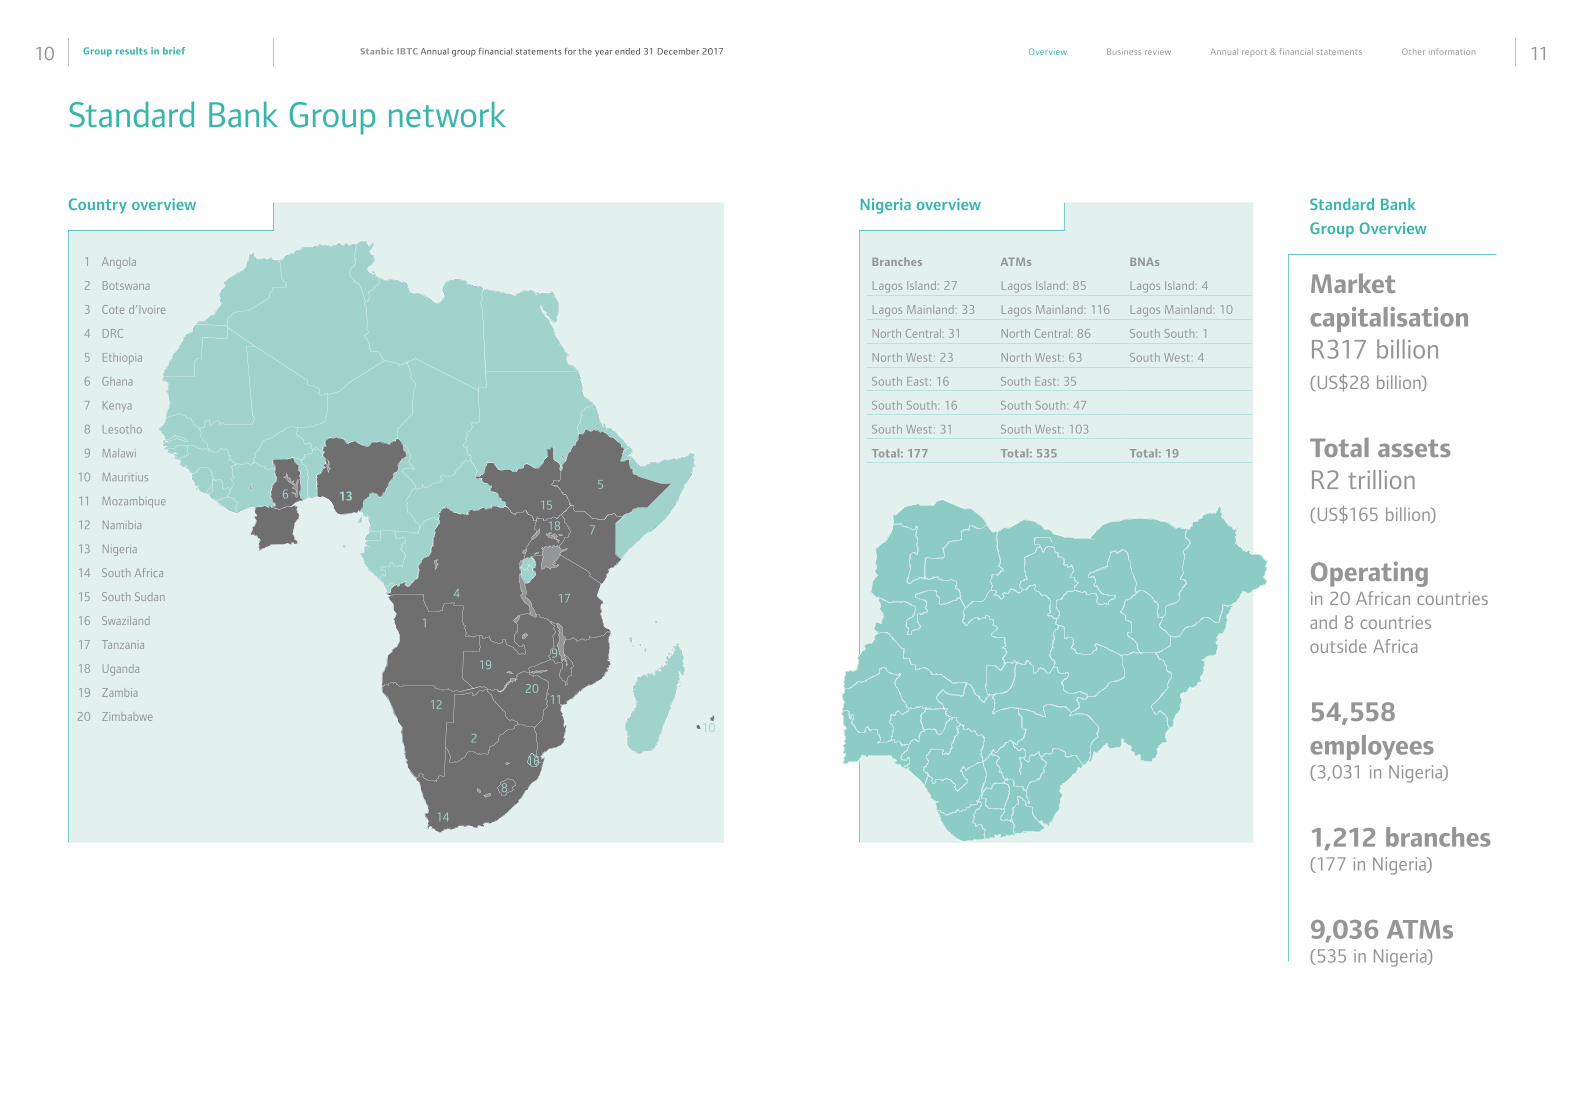
Nigeria overviewCountry overview
1 Angola
2 Botswana
3 Cote d’Ivoire
4 DRC
5 Ethiopia
6 Ghana
7 Kenya
8 Lesotho
9 Malawi
10 Mauritius
11 Mozambique
12 Namibia
13 Nigeria
14 South Africa
15 South Sudan
16 Swaziland
17 Tanzania
18 Uganda
19 Zambia
20 Zimbabwe
Branches ATMs BNAs
Lagos Island: 27 Lagos Island: 85 Lagos Island: 4
Lagos Mainland: 33 Lagos Mainland: 116 Lagos Mainland: 10
North Central: 31 North Central: 86 South South: 1
North West: 23 North West: 63 South West: 4
South East: 16 South East: 35
South South: 16 South South: 47
South West: 31 South West: 103
Total: 177 Total: 535 Total: 19
Standard Bank Group network
Standard Bank
Group Overview
Market capitalisationR317 billion(US$28 billion)
Total assetsR2 trillion (US$165 billion)
Operating in 20 African countries and 8 countries outside Africa
54,558 employees (3,031 in Nigeria)
1,212 branches (177 in Nigeria)
9,036 ATMs (535 in Nigeria)
10
1120
199
174
18 7
5
151363
1
2
12
16
8
14
Group results in brief12 13Stanbic IBTC Annual group financial statements for the year ended 31 December 2017 Overview Business review Annual report & financial statements Other information
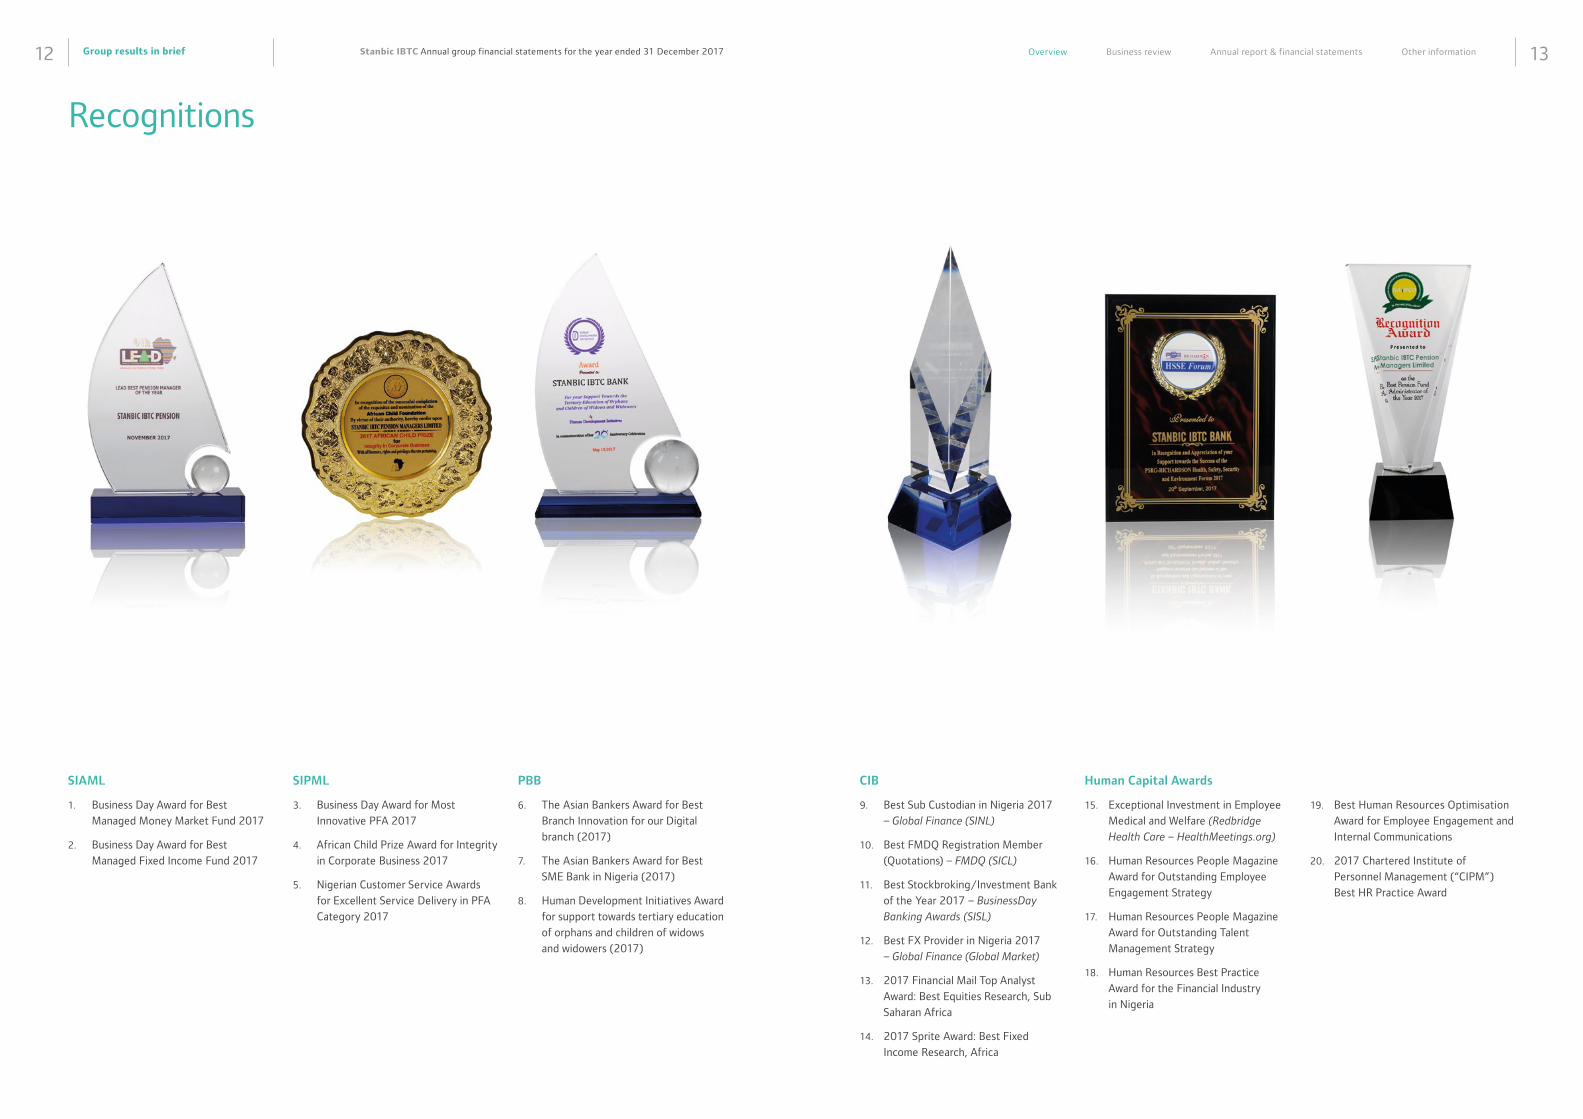
Recognitions
SIAML
1. Business Day Award for Best
Managed Money Market Fund 2017
2. Business Day Award for Best
Managed Fixed Income Fund 2017
SIPML
3. Business Day Award for Most
Innovative PFA 2017
4. African Child Prize Award for Integrity
in Corporate Business 2017
5. Nigerian Customer Service Awards
for Excellent Service Delivery in PFA
Category 2017
PBB
6. The Asian Bankers Award for Best
Branch Innovation for our Digital
branch (2017)
7. The Asian Bankers Award for Best
SME Bank in Nigeria (2017)
8. Human Development Initiatives Award
for support towards tertiary education
of orphans and children of widows
and widowers (2017)
CIB
9. Best Sub Custodian in Nigeria 2017
– Global Finance (SINL)
10. Best FMDQ Registration Member
(Quotations) – FMDQ (SICL)
11. Best Stockbroking/Investment Bank
of the Year 2017 – BusinessDay
Banking Awards (SISL)
12. Best FX Provider in Nigeria 2017
– Global Finance (Global Market)
13. 2017 Financial Mail Top Analyst
Award: Best Equities Research, Sub
Saharan Africa
14. 2017 Sprite Award: Best Fixed
Income Research, Africa
Human Capital Awards
15. Exceptional Investment in Employee
Medical and Welfare (Redbridge
Health Care – HealthMeetings.org)
16. Human Resources People Magazine
Award for Outstanding Employee
Engagement Strategy
17. Human Resources People Magazine
Award for Outstanding Talent
Management Strategy
18. Human Resources Best Practice
Award for the Financial Industry
in Nigeria
19. Best Human Resources Optimisation
Award for Employee Engagement and
Internal Communications
20. 2017 Chartered Institute of
Personnel Management (“CIPM”)
Best HR Practice Award
15
The experience to
in new technologies, ventures and futures
We have seen our country evolve dramatically over the last 29 years, so managing change is not only something we handle with great perspective, we plan for it.
Looking to the future and capitalising on what Nigeria has to offer is key to how we progress. Our investments in communications infrastructure, alternative energy resources and transport links are all testaments to how we can see Nigeria needing more in years to come and making sure we are ahead of the curve.
1619232738414244
4749
50535965
Chairman’s statementChief Executive’s statement Economic reviewFinancial review Executive Committee Personal and Business Banking Case study: Ulysses Nigeria Ltd.Case study: Natural Prime Resources Nigeria Ltd Corporate and Investment Banking Case study: Kellogg Tolaram Nigeria Ltd Case study: Anheuser-Busch InBevWealth Abridged sustainability reportEnterprise risk review
Business review
This is what drives us at Stanbic IBTC
Business review16 17Stanbic IBTC Annual group financial statements for the year ended 31 December 2017 Overview Business review Annual report & financial statements Other information
Chairman’s statement
Fellow shareholders, distinguished
ladies and gentlemen, on behalf of the
Board of Stanbic IBTC Holdings PLC,
I am pleased to welcome you all to this
Annual General Meeting (“AGM”) of our
company being the sixth since it became
a holding company.
Year 2017 turned out to be a year of
synchronised global recovery despite
political volatilities in some parts of the
world. While growth stagnated in the
UK at 1.8% given the stall in EU Brexit
negotiations, China managed to maintain
its rate of expansion, dispelling fears
over a potential sharp slowdown as it
matures after decades of rapid growth.
The Eurozone also staged a recovery
after years of uncertainty. Japan, as well
as other major emerging economies such
as Russia, continued to post solid growth
numbers. However, there was a surge
of political noise during the last quarter.
In Spain, the Catalonia region’s drive for
independence plunged the country into
arguably the biggest political crisis in 40
years, posing a major challenge for the
European Union. Due to irreconcilable
differences among the four political
parties involved, Chancellor Angela
Merkel was unable to form a new three-
way government in Germany, thereby
increasing the chances of a new general
election. In Italy, the campaign for next
year’s general elections revealed
a fragmented picture and a growing
support for anti-establishment parties.
The global oil price was also not left out
as it recovered sharply in 2017, with
Brent crude moving from $56.82 at the
beginning of the year to close at $66.87 at
year end, primarily driven by an agreement
among OPEC and a number of non-
member countries such as Russia to extend
production cuts to the end of 2018 and
also as a result of increasing demand from
factories around the world, particularly in
China, amid a boom in economic activity.
Locally, the World Bank had projected
the country’s economy to grow by 1.0
per cent in 2017 following the carryover
of a sub-zero (about -1.7 per cent) real
Gross Domestic Product (“GDP”) growth
rate from the 2016 recession. The
most important policy challenge for the
Federal Government was, therefore, to
take the country out of recession within
the year; and all this was at a time the
naira traded at N490 against the US
dollar at the Bureau de Change (“BDC”)
while exchanging for N497 at the parallel
(black) market, appreciating from about
N516 per dollar in Q4 2016. External
reserve had plummeted to $25.8 billion
in December 2016 while inflation rate in
January 2017 reached 18.72 per cent.
Nigeria extended its slow climb out of
its first recession in 25 years, as data
from the National Bureau of Statistics
(“NBS”) revealed that the economy grew
by 1.92% year-on-year in the fourth
quarter, being its third consecutive quarter
of growth in 2017 (Q3’17: +1.4% year-on-
year) after five consecutive quarters of
negative growth.
Also, inflation fell to 15.37 per cent in
December 2017, from 18.72 per cent
as of January 2017.
The economic recovery was underpinned
by a rebound in oil production due to the
relative peace in the Niger Delta region,
rising oil prices and foreign exchange
stability as a result of the introduction
of the Investors’ and Exporters’ Foreign
Exchange (“IEFX”) Window by the
Central Bank and the subsequent near
liberalisation of the foreign exchange
market, which brought the value of the
naira in the parallel market from N525/$
to N362/$ in December 2017.
The country’s external reserve
grew significantly to $38.77 billion,
representing a 50 per cent increase
from the $25.84 billion recorded at
the beginning of the year.
The foreign exchange stability impacted
positively on the performance of the
bourse as The Exchange closed the year
on a positive note with year-to-date return
of 42.3%, emerging as one of the top five
best performing stock markets for 2017
among major global stock exchanges.
Positive market sentiments this year have
been largely buoyed by foreign portfolio
inflows into the equities markets since
the introduction of the IEFX window
(especially targeted at blue chip stocks),
impressive corporate earnings releases and
the positive macro-economic data. On a
full year basis, all of the sectoral indices
closed the year on a positive note.
Foreign Portfolio Investment (“FPI”)
increased significantly in 2017. The large
chunk of FPI was invested in equities and
Treasury Bills, which had attractive yield. In
the banking industry, banks demonstrated
resilience amid macro-economic challenges
which weighed on credit expansion, asset
quality and capital adequacy.
Stanbic IBTC Bank PLC and Stanbic IBTC
Holdings PLC retained their AAA national
ratings by Fitch Ratings, reaffirming the
institutions’ strong fundamentals and
stability.
In light of the above, our company made
giant strides, recording several feats on
all fronts. The company grew its Asset
under Custody (“AuC”) to a record high of
N5.6trn thus maintaining its leadership in
the non-pension custodial business. The
company’s share price grew from N15.00
at the beginning of the year to a record
high of N44.30 while closing the year
as the most priced banking stock at
N41.50. The institution also made
quantum leaps in almost all of its
key performance metrics culminating
in an ROE of over 28%.
In recognition of our contribution to
providing excellent solutions for clients
we won several awards during the year
across the group. The awards won include
but not limited to the following: The NSE
CEO award for 2017, (for the sixth year
consecutively), Business Day Award for
Best Managed Fixed Income Fund 2017,
Nigerian Customer Service Awards for
Excellent Service Delivery in PFA Category
2017, The Asian Bankers Award for Best
Branch Innovation for our Digital branch,
Business Day Banking Awards for the
Best Stockbroking/Investment Bank of
the Year 2017 and Best FX Provider in
Nigeria 2017 by Global Finance.
We remain optimistic that in 2018 and
beyond, we are well positioned to sustain
the progress made so far as we continue
to create value for our customers with
our innovative solutions while taking
advantage of any potential upsides in the
economy and in turn provide sustainable
returns to our shareholders.
Balance Sheet
The Group’s total assets increased by
31.6% (N333 billion) from N1,053.5 billion
as at 31 December 2016 to N1,386.4
billion as at 31 December 2017 due to
positive growth in business activities and
change in FX rate for foreign currency
translation. Major growth lines in total
assets are trading securities due to
positions currently held (N151.5 billion),
investment in financial securities (N316.6
billion) and net loans to customers also
2017: A year of synchronised global recovery
Basil Omiyi (con)
Chairman
2017 in numbers
Deposits from customers increased by N192.7billion
Group total assets increased by N333 billion
Group’s net interest income increase
69.6%Group’s profit after tax increase
44.5%
34.3
%
31.6
%
Business review18 19Stanbic IBTC Annual group financial statements for the year ended 31 December 2017 Overview Business review Annual report & financial statements Other information
Chief Executive’s statement
The Year 2017 was impressive in the
history of our company as our business
made giant strides on several fronts
amidst the recessionary trends and
other economic headwinds which
marked activities within the year.
Globally, it was a year of strong growth
that was supported by low-interest rate
stimulus from central banks and a gradual
easing of the crisis that have rocked both
developed and emerging economies in
recent times.
Locally, Nigeria exited the recession as
the economy expanded by 0.83% year-
on-year in 2017, according to the National
Bureau of Statistics (“NBS”). Drivers of
the economic growth were: the significant
increase in the value of capital imported
into the country, which more than doubled
in the third quarter to $4.15 billion, from
$1.8 billion inflow recorded in the second
quarter coupled with higher crude oil
receipts. Nigeria’s annual inflation rate
continued to decline, easing to 15.37%
in December 2017 (lowest rate of price
increases since April 2016 (13.7%)).
The banking sector also contributed to
the activities of the macro economy as
the Central Bank of Nigeria’s (“CBN”)
FX intervention exercise continued
to promote economic activities. The
CBN continued to meet demand for
invisibles; providing FX to Small and
Medium Enterprises (“SMEs”) for eligible
imports, and continued with the special
FX interventions for retail and wholesale
demand. Foreign Exchange liquidity was
also significantly supported by activities of
investors on the new IEFX window bringing
total trades from inception via this medium
to $26.2 billion, with Stanbic IBTC Bank
accounting for approximately 46% of this
amount. The resultant improvement in
USD liquidity had a positive effect on the
naira which further strengthened against
the USD in the parallel market to close
the quarter at N362.00 to USD$1. This
represents a significant appreciation from
the all-time high of N490.00 to USD$1
which the year opened at. Given the lower
FX intervention sales by the CBN, coupled
with higher crude oil receipts, the nation’s
external foreign reserves closed the year
at $38.77 billion, which is the highest
figure recorded since November 2014.
As such, the Monetary Policy Committee
(‘’MPC’’) of the CBN, which met once
(in November) during the last quarter of
the year, agreed to retain the benchmark
Monetary Policy Rate (“MPR”) at 14% per
annum, as well as other monetary policy
parameters (corridor around the MPR, CRR
and Liquidity Ratio) at the same levels they
were since July 2016, in line with market
expectations.
The Stanbic IBTC Bank Nigeria Purchasing
Managers’ Index (“PMI”) jumped in
December, ending the year at a three-year
high. The indicator lies comfortably above
the 50-point threshold that separates
expansion from contraction in business
conditions, pointing to robust growth in
the private sector.
These positive economic indices led to the
success of the country’s fourth Eurobond
issuance during the last quarter. Stanbic
IBTC Capital Limited, our Investment
Banking subsidiary, acted as the sole
Financial Adviser to the Debt Management
Office (“DMO”) in the fund raising
activity, which raised a total of USD3.0
billion within the last quarter of 2017.
A record breaking, pace-setting year in our market
Yinka Sanni
Chief Executive
witnessed marginal growth of 5.4%
(N19.1 billion) to close at N372.1 billion.
In line with the comprehensive risk
management framework of the Group,
there was a significant increase in the
provisions held for loans and advances in
2017. Provisions grew by N9.4 billion or
42.1% from N22.4 billion in 2016 to
N31.8 billion in 2017, representing 7.9%
of gross loan book (2016: 6.0%).
Funding the growth in total asset is an
increase in total liabilities of N288.5 billion
(31.6%) between period end 2016 and
2017. Deposits from customers increased
by N192.7 billion, representing a 34.3%
growth year-on-year. This growth is in
alignment with the bank’s focus on raising
cheap customer liabilities.
Shareholders’ funds grew by N45.0 billion
following the impressive result for the
financial year 2017.
Income Statement
Stanbic IBTC Holdings PLC achieved total
income of N172.8 billion for the financial
period ended 31 December 2017, which is
37.1% above prior period result of N126.1
billion. This growth can be largely adduced
to increase in revenue from government
securities due to high yields and improved
trading revenue following liberalisation
of the FX market and the opening of the
IEFX window.
The group’s net interest income witnessed
a growth of N25.7 billion (44.5%) from
N57.9 billion in 2016 to N83.6 billion in
2017. Non-interest revenue increased by
N21 billion or 31% from N68.2 billion in
2016 to N89.2 billion in 2017 driven by
significant growth in trading revenue of
N13.8 billion. Total expenses increased to
N86.0 billion in 2017 from N69.0 billion
in 2016. Despite the 24.6% growth in
cost, cost to income ratio for 2017 stood
at 49.8% compared to 54.8% in 2016.
Overall, group profit after tax increased
by 69.6% from N28.52 billion in 2016 to
N48.38 billion in 2017.
General
Our Corporate Social Investment (“CSI”)
pillars are centred on education, economic
empowerment and healthcare. These
pillars enhance our brand reputation,
increase employee proposition and present
us as socially responsible and ultimately
grow our market share.
Through our signature CSI programme
“Together4ALimb”, seven (7) children
received artificial limbs and Educational
Trust in 2017 while twenty (20) children
have benefited from the programme since
inception. We have also had over 2,000
staff participate in the annual walks. In
2018, our signature activities would be;
Together4ALimb, Adopted School Project,
Malaria Day, Employee CSI and Global
Fund Partnership.
As a group, we remain committed to the
attainment and maintenance of the highest
standards of corporate governance. We aim
to continue to adopt global best practices
that are applicable and relevant to our
own business environment. At the same
time, we will continue to make significant
investments in our people through training
across board, as we recognise that growing
our people holds the key to our longer
term competitiveness.
Finally, I would like to thank our clients,
shareholders, regulators and staff for
their unwavering support in the course
of the year.
Basil Omiyi (con)
Chairman
1 February 2018
Chairman’s statement (continued)
Business review20 21Stanbic IBTC Annual group financial statements for the year ended 31 December 2017 Overview Business review Annual report & financial statements Other information
On The NSE, the equities market closed
the year with a gain of 42.30% (2016:
-6.17%), its strongest performance since
2013. The NSE sector indices showed
that all sectors closed the year in positive
territory with the banking sector being
the top-performing sector.
In the local fixed income market, yields
remained elevated for the most part of
2017 amidst sticky inflation and a resulting
tight monetary policy environment.
Our business recorded significant strides
despite the recessionary trends and other
economic headwinds, leveraging on our
competencies to provide best-in-class
services to our customers and stakeholders
while deploying efficient cost management
initiatives. In summary, a significant growth
in profitability was recorded largely driven
by very strong performances from our
Corporate and Investment Banking and
Wealth Management businesses.
Total Asset grew by 32%. Our group
posted increases of 37.1% and 69.6%
over the prior year’s performance in
operating income and profit after tax,
respectively, and achieved an ROE of
28.9% compared to 18.9% in the previous
year. You will find included herein detailed
financial reports.
Our Share price reached an all-time high of
N44.30 on 19 October 2017 and closed
at N41.50/share for the year ended 31
December 2017.
Our asset management subsidiary,
Stanbic IBTC Asset Management Limited,
successfully listed a total of 9 Collective
Investment Schemes (“CIS”). These
include the Stanbic IBTC Dollar Fund as
well as SIAML Pension ETF 40, which
mirrors the performance of an index of top
40 listed companies that are permissible
for investment by Pension Fund
Administrators (“PFA”) on The NSE.
We moved up the league table in terms
of client service as evidenced by our 3rd
position ranking on the KPMG Customer
Service Survey (from 4th in 2016) in retail
banking and to 4th ( from 10th in 2016)
in Corporate Banking. On employee
engagement, amongst several other
awards, our Human Capital division was
awarded the CIPM’s Best HR Practice
Awards, Best HR Practice Awards for the
second year running, even as our devoted
staff continue to seek and conduct the
right business the right way; in a socially,
economically and environmentally
sustainable manner.
Our pension business achieved record
assets under management of N2.3 trillion,
making Stanbic IBTC Pension Managers
Limited the largest institutional investment
business in Nigeria.
Stanbic IBTC Stockbrokers Limited, our
stockbroking subsidiary with its high
performance culture, consolidated
its leadership position as the leading
stockbroking firm in terms of transaction
values in 2017. This confirms the goodwill
and execution capability of the firm,
leveraging on the expertise of the Stanbic
IBTC Group, to provide robust services
in the capital market. The firm was again
awarded the 2017 NSE CEO award for
capital market operators as the best
dealing member, being the sixth time
in a row. SISL has been Nigeria’s number
one stockbroking house, posting the
highest turnover for the last nine (9) years
consecutively. The business has retained
the number one spot in fifteen (15) of the
last twenty (20) years.
Our custody business retained its market
leadership and reinforced its role as
the leading non-pension custodial
service provider in Nigeria. This feat was
underscored by a significant growth in
assets under custody by Stanbic IBTC
Nominees Limited (“SINL”) to N5.6 trillion.
In addition, SINL continued to set the pace
within the custody industry; successfully
executing the first commercial securities
lending transaction in Nigeria on 14
December 2017.
The achievement of these milestones was
due to the hard work and dedication of our
staff as well as the loyalty of our esteemed
customers.
Despite the economic, regulatory and
political headwinds, as we enter a pre-
election year that would herald the 2019
general elections, our outlook for the year
remains positive as we leverage on our
competencies to execute flawlessly as a
Universal Financial Services Organisation
providing innovative and best-in-class end-
to-end financial solutions to our customers
in a sustainable manner while creating
value for our shareholders.
Yinka Sanni
Chief Executive
1 February 2018
We are grateful that as an indicator of our leadership in our focus sectors and in
recognition of our efforts to making our company a great place to work, 2017 saw
Stanbic IBTC again receiving a number of accolades and awards, including:
• The Asian Bankers award for Best Branch Innovation for our Digital branch
• The Asian Bankers award for Best SME Bank in Nigeria.
• Best Sub Custodian in Nigeria 2017
- Global Finance
• Best FMDQ Registration Member (Quotations) – FMDQ
• Best Stockbroking/Investment Bank of
the year 2017 – Business Day Banking
Awards
• Best Dealing Member Firm - The NSE CEO Awards
• African Child Prize Award for Integrity in Corporate Business 2017
• Best FX Provider in Nigeria 2017
– Global Finance
• 2017 Financial Mail Top Analyst
Award: Best Equities Research, Sub
Saharan Africa
• 2017 Sprite Award: Best Fixed Income Research, Africa
• Business Day Award for Best Managed Money Market Fund 2017
• Business Day Award for Best Managed Fixed Income Fund 2017
• Business Day Award for Most Innovative PFA 2017
• Nigerian Customer Service Awards for Excellent Service Delivery in PFA Category 2017
• 2017 CIPM Best HR Practice Awards
• Human Development Initiatives
award for support towards tertiary education of orphans and children of widows and widowers
• Exceptional Investment in Employee
Medical & Welfare (Redbridge Health Care - HealthMeetings.org)
• HR People Magazine Award for Outstanding Employee Engagement Strategy
• HR People Magazine Award for Outstanding Talent Management Strategy
• HR Best Practice Award for the Financial Industry in Nigeria
• Best HR Optimisation Award for Employee Engagement and Internal Communication
2017 Accolades
Chief Executive’s statement (continued)
Business review22 23Stanbic IBTC Annual group financial statements for the year ended 31 December 2017 Overview Business review Annual report & financial statements Other information
Economic review
Global economic environment
Will 2018 turn out to be another good
year, with global equities performing
strongly, volatility staying low, the dollar
subdued and bond yields generally calm?
This was the story of 2017. For 2018 to
be a repeat, certain threats or risks need
to remain dormant. What are these risks?
Probably the main threat is an implosion
of riskier assets created not by any
specific shock but instead as a simple
function of stretched valuations. Many
traders and investors will argue that you
need a specific event to materialise to
trigger financial market disarray. This
could come in the arenas of monetary
policy, or geopolitics for example. But
a ‘trigger’ is not necessarily needed,
in our view. With risk assets as strong
as they are and with volatility as low as
it is, asset price implosion could occur
naturally as investors rush to the exits
to protect profits. But how likely is this
in 2018? This is clearly a hard question
to answer but the probability of such a
scenario is well below 50%, in our view.
This then requires a careful analysis of
possible specific threats or risks that
could cause an asset price implosion in
2018. Monetary policy is certainly one
such area but something, in our view,
that is constrained to the United States
of America (“US”). It is hard to see other
central banks like the European Central
Bank (“ECB”) and Bank of Japan (“BoJ”)
falling behind the curve in 2018 and
sparking global panic by catching up with
policy tightening that is way ahead of
current expectations. The US is another
matter for the Federal Reserve Bank
(“FED”) could easily fall behind the
curve; after all, this is what has tended
to happen in the more recent tightening
cycles. However, markets should probably
remain optimistic here as well. The FED’s
rate hike in March was an example of
a hike that was not well discounted by
the market beforehand, meaning that
FED members essentially had to tell the
market to catch up. The fact that this
event failed to derail asset prices leaves
us hopeful that the market can take a
modest FED surprise on board without too
much problem. The key here, of course,
is the word ‘modest’. So if, for instance,
the Federal Open Market Committee
(“FOMC”) median call for 75 bps of rate
hikes in 2018 turns into 100 bps we think
the market will cope. If it is 150 bps or
more it might be a very different story.
Surging US rates might not be a huge
risk this year to global markets. But a
surging dollar could prove to be just as
disruptive. US tax cuts do create some
risk of strong dollar demand from US
firms as they repatriate overseas profits
to benefit from the lowering of the US
tax rate. With USD2.5-USD3tr thought
to be sitting abroad in the form of
foreign profit, repatriation flows could
be substantial. However, the evidence
tends to suggest that the offshore profits
are mainly held in dollar instruments.
Unwinding of these could impact the price
of those instruments but probably not
the value of the dollar too much. Hence,
this issue is unlikely to flare up in 2018.
Among other risks to consider from a
global perspective in 2018, we would
include the end of the North America
Free Trade Agreement (NAFTA), failure
of Brexit talks, a debt-related implosion
in China, the rise of Eurosceptic parties
in Italian elections, North Korean military
conflict, an indictment of some sort to the
current US administration and more. But
are these risks sufficiently high to mean
that markets should stay clear of risk assets
in 2018? The answer is probably ‘no’.
With respect to actual economic
performance, G10 economies seem
robust – with the exception of the United
Kingdom (“UK”) – but lower economic
risk contrasts with some increases in
political risk (Catalonian independence)
and geopolitical risk (North Korea). Growth
looks robust even if inflation in many
countries remains short of central bank
targets. The US is expected to deliver
even stronger growth numbers in 2018,
perhaps growing by 2.7% year-on-year
from an estimate of 2.3% year-on-year
in 2017. On the other hand, the UK is
expected to struggle and grow by only
0.9% year-on-year compared to the 1.3%
it grew by in 2017. Interestingly, Japan
and China are also expected to continue
normalising, growing by 1.0% and 6.3%
year-on-year from the 1.3% and 6.5%
which they grew by in 2017, respectively.
With commodity prices on the rise
(especially crude oil prices), the risks that
face emerging markets in 2018 may prove
to be of a different kind. Towards the tail
end of 2017, the US President boasted
of a “bigger” button than North Korean
leader Kim Jong Un. He was referring to
the alleged nuclear button that sits on
Kim’s desk but we wonder whether the
President’s real power lies in blowing up
the dollar rather than his nuclear capability.
In our view, the threat to the dollar lies in
the confrontational “America First” policy
that does not just take in North Korea but
also the administration’s attitude towards
other issues, such as global security (given
the attacks on NATO members), global
trade, or global climate change with the
withdrawal from the Paris Accord. The
US risks losing global influence and with
this loss could come losses for the dollar.
In just over six months, Brent crude oil
prices have increased by 50% to around
USD69 per barrel. At some stage, US oil
producers, lured by high prices, should
start to boost production, reversing the
falling trend in the number of operating
rigs that we have seen since July 2017,
thus countering the OPEC cuts. Yet, robust
global demand and geopolitical tensions
are likely to keep crude oil prices elevated
for a longer period. This should bode well
for Nigeria as long as the country limits
below the line subsidies to petrol imports,
which has allowed it keep retail petrol
prices unchanged. Other commodities,
especially metals, are set for further gains
in 2018 given the upward revisions to
global economic growth and expectations
of a weaker dollar (generally there is a
negative correlation between the dollar
and spot commodity price indices).
Business review24 25Stanbic IBTC Annual group financial statements for the year ended 31 December 2017 Overview Business review Annual report & financial statements Other information
Economic review (continued)
Political landscape
Aside from the president’s health, perhaps
the most widely debated political issue in
2017 was the proposed “restructuring”
of Nigeria. Over the years, Nigeria has
been criticised for functioning within a
federal political arrangement, comprising
the central “federal” government and
regional “state and local” governments.
The inference is that the current
system misaligns incentives of regional
governments, as they receive resources
from the center without necessarily
putting those resources to the best use.
Unsurprisingly, the distribution of oil
revenues by the federal government to
state and local governments, and the
use (or lack thereof) of those funds
by those regional governments for
the good of the masses, are the basic
tenets of the restructure debate.
The central theme here appears to be
the devolution of powers with the view
to give more economic responsibility to
the state, with respect to both revenues
and expenditures, while the federal
government oversees foreign policy and
defence-related matters. Should the
discourse culminate in actual changes to
the federal system of government, the
immediate losers will likely be those states
that rely solely on the federal government’s
monthly allocations to survive. However,
it can be argued that such a change
may be beneficial in the longer term.
With the 2019 general elections now
barely 12 months away, political attention
will likely now focus on campaigns,
especially as the Independent National
Electoral Commission (“INEC”) recently
published election timelines. The main
question remains: has the current
administration done enough to convince
Nigerians of another term in office? Will
the administration be willing to take tough
decisions which arguably are beneficial
to the country in the medium term such
as allowing a more market reflective
pricing template for petrol and electricity
supply? And also just as important, is
the main opposition organised enough
to mount a credible challenge?
Economic growth
The Nigerian economy contracted and
began its journey towards recovery in
2017, helped mainly by a rebound in
oil prices and oil production as well as
adjustments made to the foreign exchange
market which finally allowed robust levels
of portfolio flows back into the country.
As such, the economy is expected to
continue growing at a modest pace.
However, given the trajectory of oil prices
and our expectation, taking account of
a potential decline in coming months,
they will remain above the 2017 oil price
average, we expect the economy to grow
by around 2.5% year-on-year in 2018.
Favourable upside risks to the outlook
come from a higher than anticipated
oil price environment, a smoother than
expected election campaign cycle,
unchanged positive sentiment from
foreign investors and potentially more
favourable monetary policy stance
taken by the Central Bank of Nigeria.
The implementation of the Economic
Recovery and Growth Plan (“ERGP”)
remains slow. The authorities expect that
implementation of the plan should result
in economic growth reaching 7.0% y/y
in 2020, after their forecast for a rather
optimistic 2.2% y/y in 2017. In order
to ensure structural reform which will
lead to long run economic development,
authorities must implement many parts of
the ERGP. The plan outlines three broad
objectives (restoring growth, investing
in people and building a competitive
economy) and five principles (tackling
constraints to growth, leveraging the
private sector, allowing markets to
function, promoting national cohesion
and inclusion, as well as upholding the
countries core values). Furthermore,
there are five execution priorities (macro-
economic stability, achieving food security,
energy sufficiency, improving transport
infrastructure and Small and Medium
Scale Enterprises (“SME”) development).
National Bureau of Statistics (“NBS”) data
indicates that GDP growth in 2017 rose
by 0.8% year-on-year mainly as a result of
a rebound in the oil sector. The increase
was higher than the contraction of 1.6%
year-on-year in 2016. Although one might
point out that the oil sector makes up
only around 10% of total GDP in Nigeria,
it indirectly accounts for another 65% of
the economy, according to the NBS. The
oil sector grew by 8.4% year-on-year in
the fourth quarter of 2017 from 25.9% in
the preceding quarter, and a contraction
of 17.7% in the fourth quarter of 2016.
However, in the fourth quarter, the non-oil
sector showed some signs of recovery
after being depressed for most of the year.
Specifically, the agriculture sector, which
has been a subject of much attention over
the last two years, appeared to have lost
some momentum, having grown by an
average 3.5% year-on-year in 2017 from
4.1% year-on-year in 2016. This perhaps
suggests that gains from the increased
focus on the sector will probably take
some time given the slow implementation
of structural reforms which are required
to de-risk the sector while improving the
ease of doing business in that sector.
Growth in manufacturing sector continued
to disappoint despite the improvement
in availability of FX for the most parts
of 2017. The sector returned to positive
growth of 0.1% year-on-year in the fourth
quarter of 2017 from a contraction of
2.9% in preceding quarter and 2.5% in
the same quarter of 2016 while averaging
a contraction of 0.2% in 2017. On the
whole, the sector improved in 2017
compared to 2016 when it contracted
by an average of 4.3% year-on-year.
Both the construction and trade sectors
continued to show moderate signs of
improvement, with the trade sector still
remaining in negative growth territory.
In 2017, the construction sector grew
by 1.0% year-on-year compared to a
contraction of 5.9% year-on-year during
the same period in 2016. Surprisingly,
the trade sector actually performed
worse in 2017 than it did in 2016. The
sector delivered an average contraction
of 1.0% year-on-year in 2017 compared
to a contraction of 0.2% in 2016.
This underperformance suggests that
businesses still found it difficult to
access credit, which counteracted the
benefits of having access to more FX.
Also of concern was the performance
of the information and communications
sector. The sector slipped into a
recession for the first time in decades
as lower disposable incomes resulted
in a lagged negative impact on the
sector’s share of the consumer’s
wallet. The sector contracted by an
average 1.0% year-on-year in 2017,
compared to a growth of 1.9% year-
on-year in the same period of 2016.
Fiscal position
Yet again, the authorities have prepared
a 2018 budget that looks very much like
those presented in 2017 and 2016, which
both looked ambitious on the revenue
side. The budgeted deficit, however,
is expected to remain within the fiscal
responsibility rule, below 3.0% of GDP.
The proposed 2018 budget deficit
remains broadly unchanged at around
NGN2.1 trillion (1.6% of GDP) with
around NGN306 billion being privatisation
proceeds. Interestingly, authorities will
attempt to split the funding balance
of NGN1.7 trillion equally between
domestic and foreign sources. The broadly
unchanged net domestic funding proposal
means that the yield curve should remain
supported through most of 2018.
Given that the 2018 budget proposal
is anchored on an exchange rate of
N305.00 it is unlikely that the CBN will
choose to engineer a convergence of the
different segments within the FX market.
Oil production is projected to remain
broadly unchanged at 2.3m bpd, while
real GDP growth is forecast at 3.5% y/y.
Furthermore, the oil price benchmark
is proposed to remain broadly flat at
USD47 per barrel. However, it would not
be surprising if the National Assembly
were to increase the benchmark rate
given current global oil price realities.
With a revenue target of NGN6.6
trillion, we remain concerned about the
government’s ambitious revenue targets.
While the authorities have outlined
some planned revenue boosting reforms,
including implementing the Voluntary
Assets and Income Declaration Scheme
(“VAIDS”) as well as increasing VAT on
‘luxury’ goods, it is still hard to believe
that these would suffice to produce
the 40% y/y jump between what we
anticipate will be the actual non-oil
revenue collected in 2017 and the target
for 2018. NGN2.4 trillion is budgeted
for oil revenues, while NGN4.2 trillion is
expected to come from the non-oil sector.
As such, meeting the NGN8.6 trillion
expenditure target is at risk given
revenue concerns. Assuming we are
correct and the authorities miss their
revenue targets, it is likely that the
fiscal deficit could widen more than the
planned 1.6% of GDP. Should there be a
need to limit expenditure, infrastructure
spending plans may need to be deferred.
Proposed capital expenditure makes up
around 28% of the total expenditure
envelope, while debt servicing takes up
another 23%. It is worthy to note that
no provision has been made for petrol
subsidies in the 2018 budget proposal.
We anticipate that material changes will
be incorporated in the final iteration
of the 2018 budget. Specifically, we
suspect lawmakers will attempt to increase
the oil price benchmark, especially if
international crude oil prices remain
stuck in a USD65-70 per barrel handle.
This could result in some implementation
risks should oil prices decline later in
2018. Furthermore, given that the
budget proposal has been presented
slightly ahead of schedule, it may be
approved earlier than usual, perhaps
around the end of the first quarter.
Finally, yield curve dynamics will
continue being dictated by the central
bank’s liquidity management stance,
especially as supply of Naira-denominated
government paper is unlikely to rise.
That being said, external borrowing will
rise, starting with a possible USD2.5
billion – USD4.0 billion Eurobond issuance
during the course of the next 4 months.
This will follow the issuance of two long
tenured Eurobonds in November 2017,
which resulted in authorities receiving
USD3.0 billion from the proceeds.
Exchange rate and interest rate dynamics
The central bank maintained an effectively
tight monetary policy stance for much
of 2017 without adjusting the formal
policy rate. We expect much of the
same through the course of this year,
albeit with an easing bias towards the
end of the year. Indeed, the CBN has
arguably already influenced yields lower
by momentarily halting Open Market
Operations (“OMO”) aimed at sterilising
Naira in December 2017. The temporary
halt in OMO issuances meant that the
yield curve declined by up to 500
bps in some cases, and while the CBN
has resumed those OMOs once more,
they are now at much lower levels.
The combination of a less hawkish central
bank, lower domestic borrowing by the
fiscal authorities and potentially lower
headline inflation in 2018 should all
mean a downward bias to interest rates,
especially in the later parts of 2018.
This slightly lower interest rate
environment should then result in
improved private sector credit extension
and subsequently a rebound in import
demand growth which should place some
pressure on the currency, particularly
within the investors-and-exporters-
foreign-exchange-window. Furthermore,
the potential for some capital outflows
as some foreign investors exit ahead of
the 2019 elections could exacerbate the
pressure on the exchange rate. However,
FX reserves are in a much better shape
than they were 12 months ago. At USD40
billion, and potentially rising towards
USD45 billion by the second quarter,
the CBN should be able to limit any
disorderly depreciation of the currency.
Business review26 27Stanbic IBTC Annual group financial statements for the year ended 31 December 2017 Overview Business review Annual report & financial statements Other information
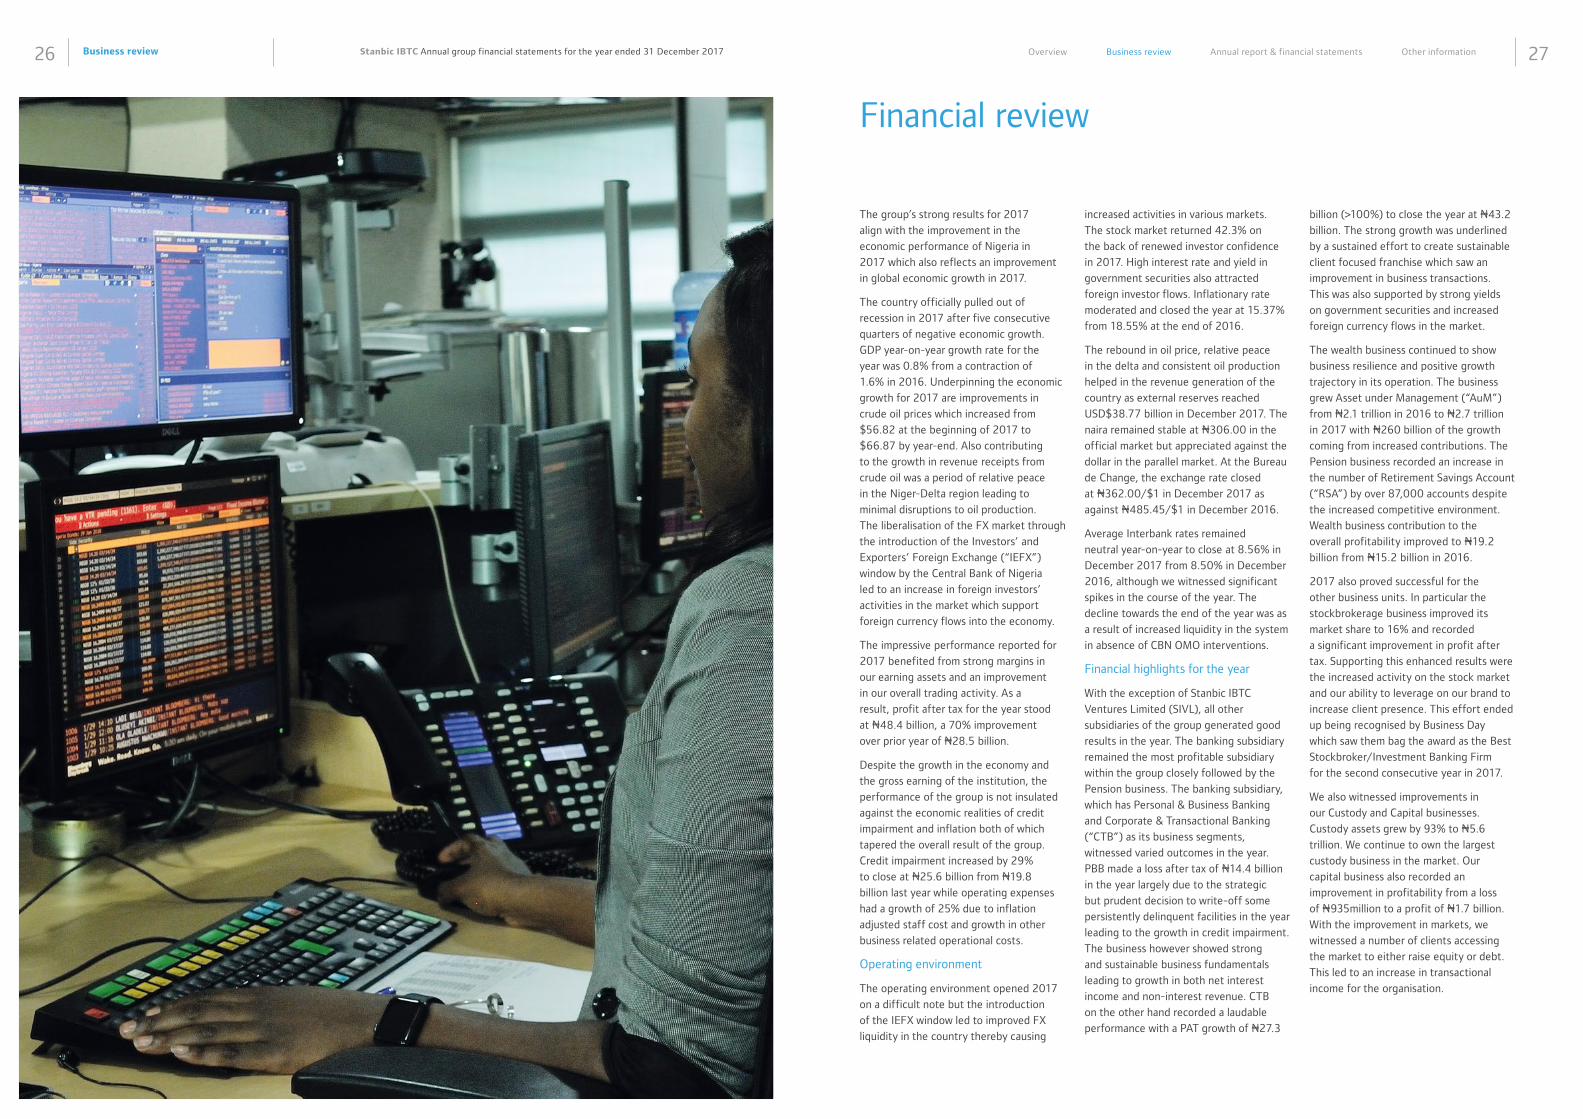
Financial review
The group’s strong results for 2017
align with the improvement in the
economic performance of Nigeria in
2017 which also reflects an improvement
in global economic growth in 2017.
The country officially pulled out of
recession in 2017 after five consecutive
quarters of negative economic growth.
GDP year-on-year growth rate for the
year was 0.8% from a contraction of
1.6% in 2016. Underpinning the economic
growth for 2017 are improvements in
crude oil prices which increased from
$56.82 at the beginning of 2017 to
$66.87 by year-end. Also contributing
to the growth in revenue receipts from
crude oil was a period of relative peace
in the Niger-Delta region leading to
minimal disruptions to oil production.
The liberalisation of the FX market through
the introduction of the Investors’ and
Exporters’ Foreign Exchange (“IEFX”)
window by the Central Bank of Nigeria
led to an increase in foreign investors’
activities in the market which support
foreign currency flows into the economy.
The impressive performance reported for
2017 benefited from strong margins in
our earning assets and an improvement
in our overall trading activity. As a
result, profit after tax for the year stood
at N48.4 billion, a 70% improvement
over prior year of N28.5 billion.
Despite the growth in the economy and
the gross earning of the institution, the
performance of the group is not insulated
against the economic realities of credit
impairment and inflation both of which
tapered the overall result of the group.
Credit impairment increased by 29%
to close at N25.6 billion from N19.8
billion last year while operating expenses
had a growth of 25% due to inflation
adjusted staff cost and growth in other
business related operational costs.
Operating environment
The operating environment opened 2017
on a difficult note but the introduction
of the IEFX window led to improved FX
liquidity in the country thereby causing
increased activities in various markets.
The stock market returned 42.3% on
the back of renewed investor confidence
in 2017. High interest rate and yield in
government securities also attracted
foreign investor flows. Inflationary rate
moderated and closed the year at 15.37%
from 18.55% at the end of 2016.
The rebound in oil price, relative peace
in the delta and consistent oil production
helped in the revenue generation of the
country as external reserves reached
USD$38.77 billion in December 2017. The
naira remained stable at N306.00 in the
official market but appreciated against the
dollar in the parallel market. At the Bureau
de Change, the exchange rate closed
at N362.00/$1 in December 2017 as
against N485.45/$1 in December 2016.
Average Interbank rates remained
neutral year-on-year to close at 8.56% in
December 2017 from 8.50% in December
2016, although we witnessed significant
spikes in the course of the year. The
decline towards the end of the year was as
a result of increased liquidity in the system
in absence of CBN OMO interventions.
Financial highlights for the year
With the exception of Stanbic IBTC
Ventures Limited (SIVL), all other
subsidiaries of the group generated good
results in the year. The banking subsidiary
remained the most profitable subsidiary
within the group closely followed by the
Pension business. The banking subsidiary,
which has Personal & Business Banking
and Corporate & Transactional Banking
(“CTB”) as its business segments,
witnessed varied outcomes in the year.
PBB made a loss after tax of N14.4 billion
in the year largely due to the strategic
but prudent decision to write-off some
persistently delinquent facilities in the year
leading to the growth in credit impairment.
The business however showed strong
and sustainable business fundamentals
leading to growth in both net interest
income and non-interest revenue. CTB
on the other hand recorded a laudable
performance with a PAT growth of N27.3
billion (>100%) to close the year at N43.2
billion. The strong growth was underlined
by a sustained effort to create sustainable
client focused franchise which saw an
improvement in business transactions.
This was also supported by strong yields
on government securities and increased
foreign currency flows in the market.
The wealth business continued to show
business resilience and positive growth
trajectory in its operation. The business
grew Asset under Management (“AuM”)
from N2.1 trillion in 2016 to N2.7 trillion
in 2017 with N260 billion of the growth
coming from increased contributions. The
Pension business recorded an increase in
the number of Retirement Savings Account
(“RSA”) by over 87,000 accounts despite
the increased competitive environment.
Wealth business contribution to the
overall profitability improved to N19.2
billion from N15.2 billion in 2016.
2017 also proved successful for the
other business units. In particular the
stockbrokerage business improved its
market share to 16% and recorded
a significant improvement in profit after
tax. Supporting this enhanced results were
the increased activity on the stock market
and our ability to leverage on our brand to
increase client presence. This effort ended
up being recognised by Business Day
which saw them bag the award as the Best
Stockbroker/Investment Banking Firm
for the second consecutive year in 2017.
We also witnessed improvements in
our Custody and Capital businesses.
Custody assets grew by 93% to N5.6
trillion. We continue to own the largest
custody business in the market. Our
capital business also recorded an
improvement in profitability from a loss
of N935million to a profit of N1.7 billion.
With the improvement in markets, we
witnessed a number of clients accessing
the market to either raise equity or debt.
This led to an increase in transactional
income for the organisation.
Business review28 29Stanbic IBTC Annual group financial statements for the year ended 31 December 2017 Overview Business review Annual report & financial statements Other information
Financial review (continued)
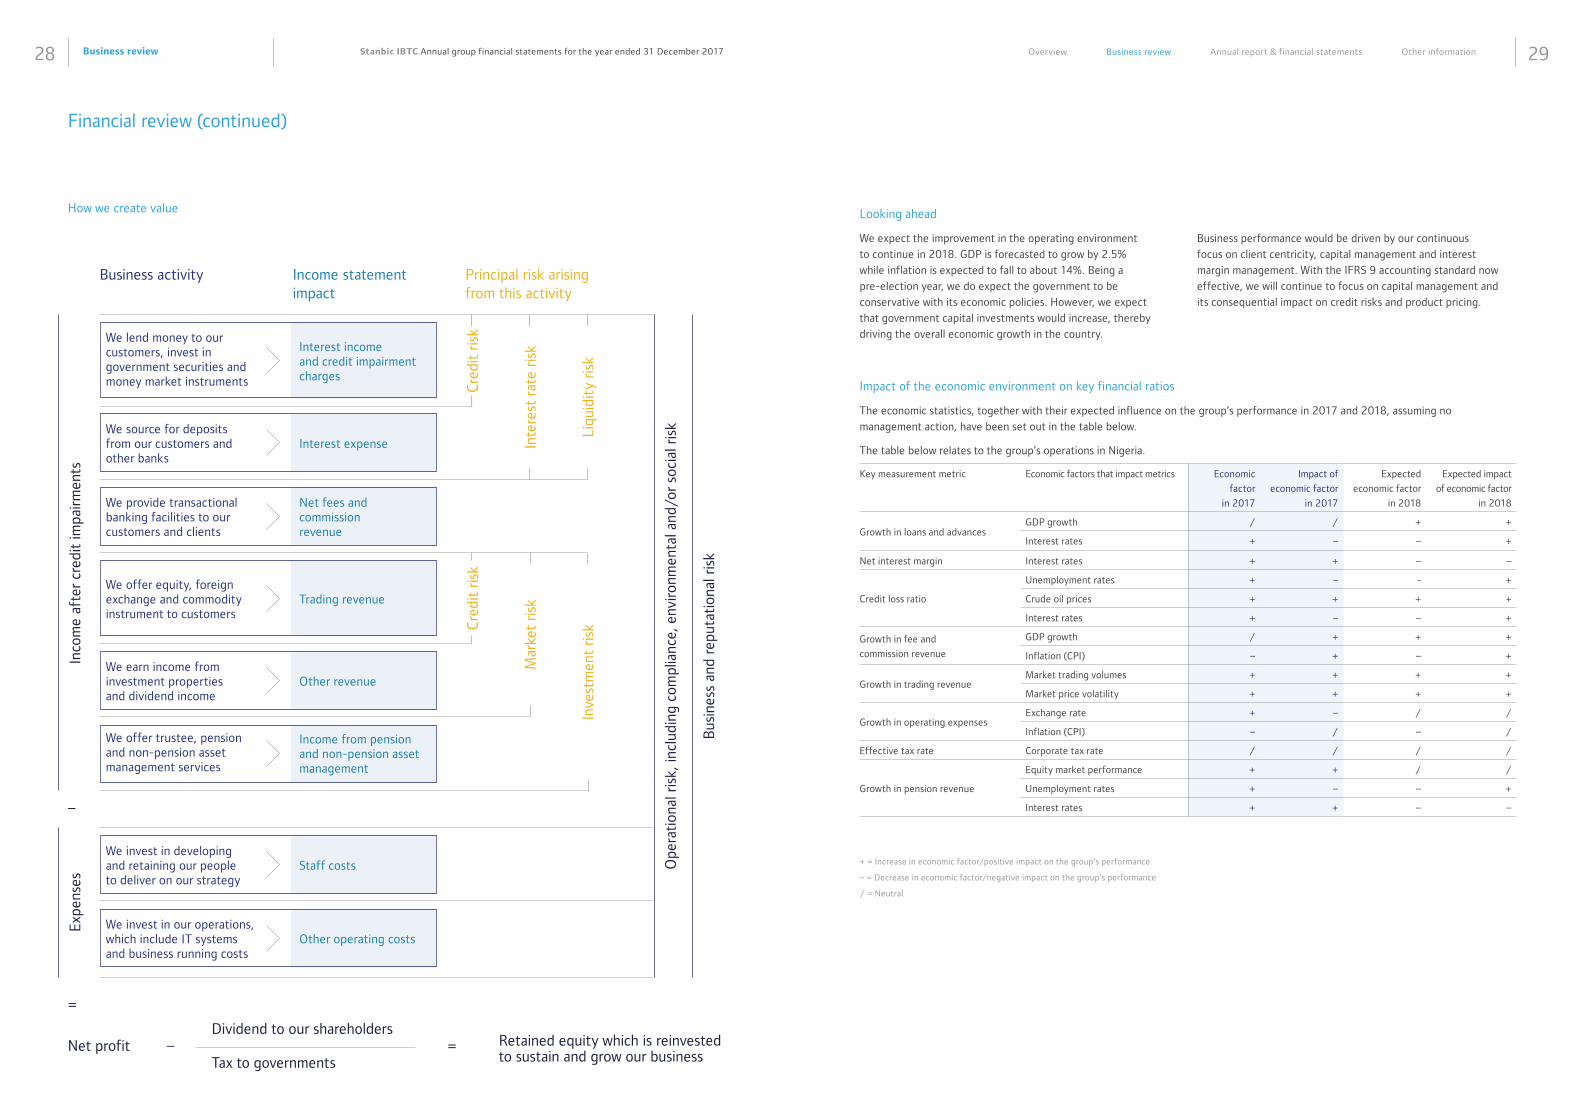
How we create value
Business activity Income statement impact
Principal risk arising from this activity
Inco
me
afte
r cr
edit
impa
irmen
ts
Ope
rati
onal
ris
k, in
clud
ing
com
plia
nce,
env
ironm
enta
l and
/or
soci
al r
isk
Bus
ines
s an
d re
puta
tion
al r
isk
–
–
=
=
Cre
dit
risk
Inte
rest
rat
e ris
k
Liqu
idit
y ris
k
Mar
ket
risk
Inve
stm
ent
risk
Exp
ense
s
Net profit Retained equity which is reinvested to sustain and grow our business
Dividend to our shareholders
Tax to governments
Cre
dit
risk
Interest income and credit impairment charges
We lend money to our customers, invest in government securities and money market instruments
Trading revenueWe offer equity, foreign exchange and commodity instrument to customers
Interest expenseWe source for deposits from our customers and other banks
Net fees and commission revenue
We provide transactional banking facilities to our customers and clients
Other revenueWe earn income from investment properties and dividend income
Income from pension and non-pension asset management
We offer trustee, pension and non-pension asset management services
Staff costsWe invest in developing and retaining our people to deliver on our strategy
Other operating costsWe invest in our operations, which include IT systems and business running costs
Impact of the economic environment on key financial ratios
The economic statistics, together with their expected influence on the group’s performance in 2017 and 2018, assuming no
management action, have been set out in the table below.
The table below relates to the group’s operations in Nigeria.
Key measurement metric Economic factors that impact metrics Economic
factor
in 2017
Impact of
economic factor
in 2017
Expected
economic factor
in 2018
Expected impact
of economic factor
in 2018
Growth in loans and advancesGDP growth / / + +
Interest rates + – – +
Net interest margin Interest rates + + – –
Credit loss ratio
Unemployment rates + – - +
Crude oil prices + + + +
Interest rates + – – +
Growth in fee and
commission revenue
GDP growth / + + +
Inflation (CPI) – + – +
Growth in trading revenueMarket trading volumes + + + +
Market price volatility + + + +
Growth in operating expensesExchange rate + – / /
Inflation (CPI) – / – /
Effective tax rate Corporate tax rate / / / /
Growth in pension revenue
Equity market performance + + / /
Unemployment rates + – – +
Interest rates + + – –
+ = Increase in economic factor/positive impact on the group’s performance
– = Decrease in economic factor/negative impact on the group’s performance
/ = Neutral
Looking ahead
We expect the improvement in the operating environment
to continue in 2018. GDP is forecasted to grow by 2.5%
while inflation is expected to fall to about 14%. Being a
pre-election year, we do expect the government to be
conservative with its economic policies. However, we expect
that government capital investments would increase, thereby
driving the overall economic growth in the country.
Business performance would be driven by our continuous
focus on client centricity, capital management and interest
margin management. With the IFRS 9 accounting standard now
effective, we will continue to focus on capital management and
its consequential impact on credit risks and product pricing.
Business review30 31Stanbic IBTC Annual group financial statements for the year ended 31 December 2017 Overview Business review Annual report & financial statements Other information
Financial review (continued)
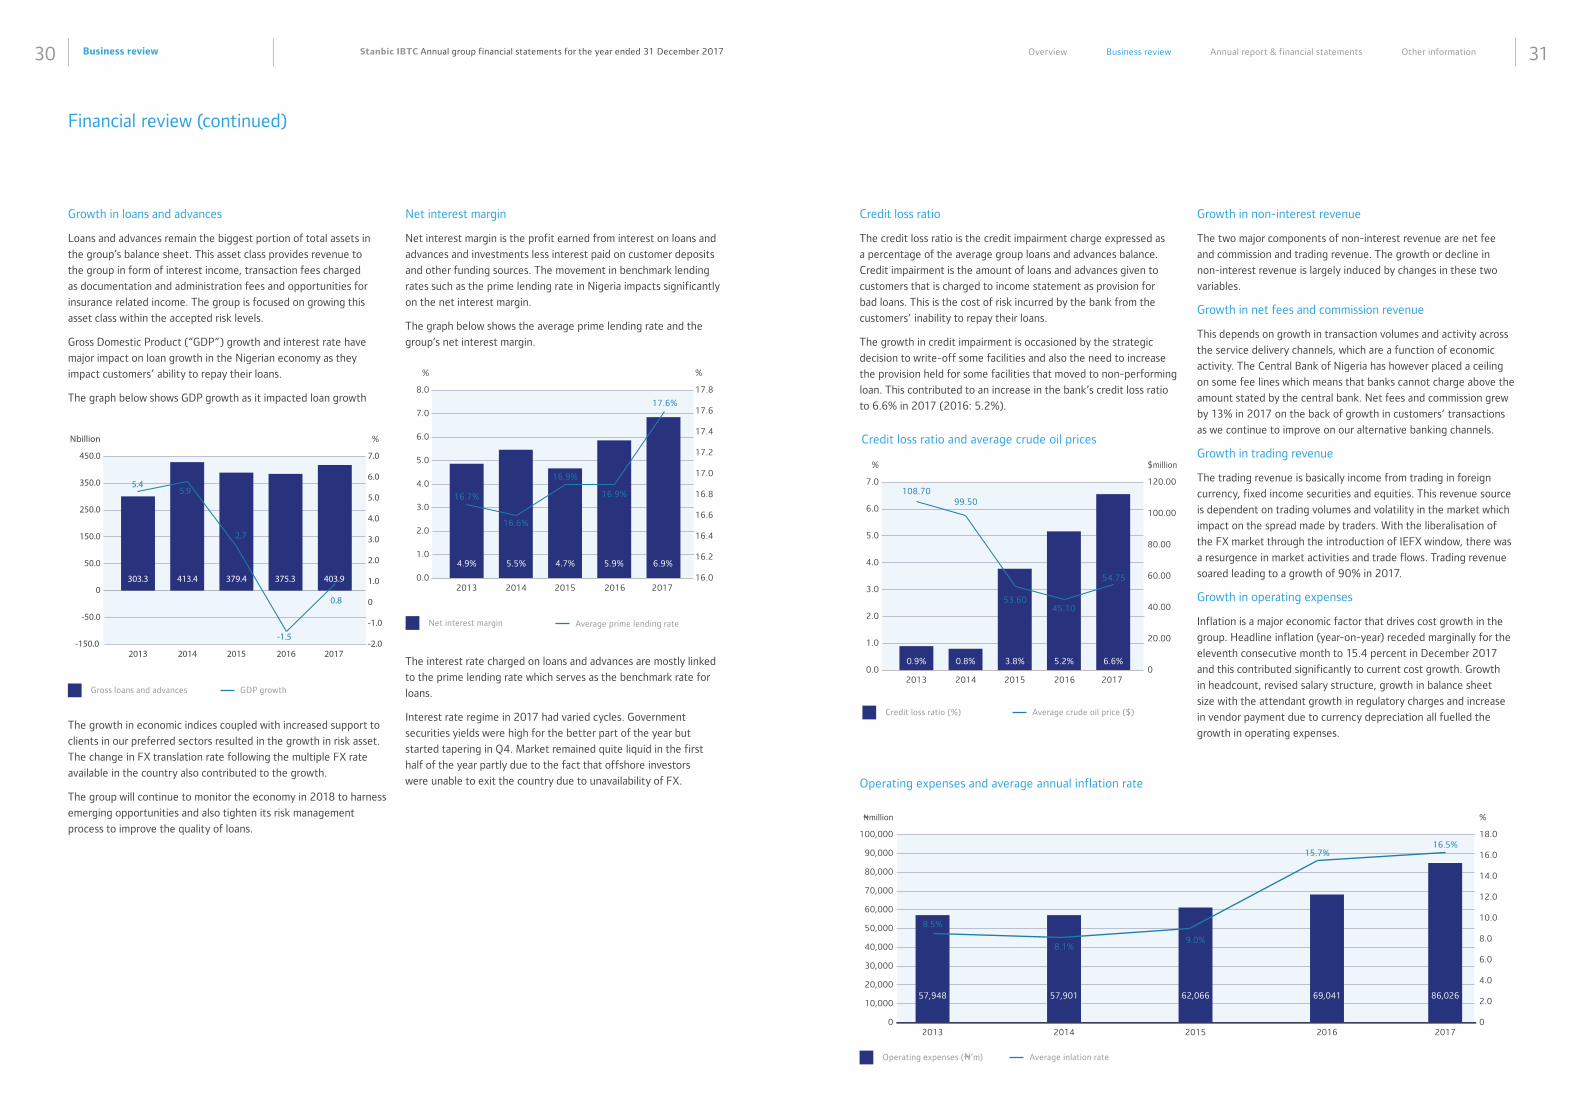
Net interest margin
Net interest margin is the profit earned from interest on loans and
advances and investments less interest paid on customer deposits
and other funding sources. The movement in benchmark lending
rates such as the prime lending rate in Nigeria impacts significantly
on the net interest margin.
The graph below shows the average prime lending rate and the
group’s net interest margin.
The interest rate charged on loans and advances are mostly linked
to the prime lending rate which serves as the benchmark rate for
loans.
Interest rate regime in 2017 had varied cycles. Government
securities yields were high for the better part of the year but
started tapering in Q4. Market remained quite liquid in the first
half of the year partly due to the fact that offshore investors
were unable to exit the country due to unavailability of FX.
Average prime lending rateNet interest margin
0.02013 2014 2015 2016 2017
1.0
3.0
2.0
4.0
8.0
7.0
6.0
5.0
4.9% 5.5% 4.7% 5.9%
17.6%
16.9%
16.9%
16.6%
16.7%
16.0
16.2
16.4
16.8
16.6
17.0
17.4
17.2
17.8
17.6
%%
6.9%
GDP growthGross loans and advances
-150.02013 2014 2015 2016 2017
-50.0
50.0
0
150.0
450.0
350.0
250.0
303.3 413.4 379.4 375.3
5.45.9
2.7
-1.5
0.8
Nbillion
-2.0
-1.0
0
2.0
1.0
3.0
5.0
4.0
7.0
6.0
%
403.9
Growth in loans and advances
Loans and advances remain the biggest portion of total assets in
the group’s balance sheet. This asset class provides revenue to
the group in form of interest income, transaction fees charged
as documentation and administration fees and opportunities for
insurance related income. The group is focused on growing this
asset class within the accepted risk levels.
Gross Domestic Product (“GDP”) growth and interest rate have
major impact on loan growth in the Nigerian economy as they
impact customers’ ability to repay their loans.
The graph below shows GDP growth as it impacted loan growth
The growth in economic indices coupled with increased support to
clients in our preferred sectors resulted in the growth in risk asset.
The change in FX translation rate following the multiple FX rate
available in the country also contributed to the growth.
The group will continue to monitor the economy in 2018 to harness
emerging opportunities and also tighten its risk management
process to improve the quality of loans.
Credit loss ratio and average crude oil prices
Credit loss ratio
The credit loss ratio is the credit impairment charge expressed as
a percentage of the average group loans and advances balance.
Credit impairment is the amount of loans and advances given to
customers that is charged to income statement as provision for
bad loans. This is the cost of risk incurred by the bank from the
customers’ inability to repay their loans.
The growth in credit impairment is occasioned by the strategic
decision to write-off some facilities and also the need to increase
the provision held for some facilities that moved to non-performing
loan. This contributed to an increase in the bank’s credit loss ratio
to 6.6% in 2017 (2016: 5.2%).
Growth in non-interest revenue
The two major components of non-interest revenue are net fee
and commission and trading revenue. The growth or decline in
non-interest revenue is largely induced by changes in these two
variables.
Growth in net fees and commission revenue
This depends on growth in transaction volumes and activity across
the service delivery channels, which are a function of economic
activity. The Central Bank of Nigeria has however placed a ceiling
on some fee lines which means that banks cannot charge above the
amount stated by the central bank. Net fees and commission grew
by 13% in 2017 on the back of growth in customers’ transactions
as we continue to improve on our alternative banking channels.
Growth in trading revenue
The trading revenue is basically income from trading in foreign
currency, fixed income securities and equities. This revenue source
is dependent on trading volumes and volatility in the market which
impact on the spread made by traders. With the liberalisation of
the FX market through the introduction of IEFX window, there was
a resurgence in market activities and trade flows. Trading revenue
soared leading to a growth of 90% in 2017.
Growth in operating expenses
Inflation is a major economic factor that drives cost growth in the
group. Headline inflation (year-on-year) receded marginally for the
eleventh consecutive month to 15.4 percent in December 2017
and this contributed significantly to current cost growth. Growth
in headcount, revised salary structure, growth in balance sheet
size with the attendant growth in regulatory charges and increase
in vendor payment due to currency depreciation all fuelled the
growth in operating expenses.
Average crude oil price ($)Credit loss ratio (%)
Operating expenses and average annual inflation rate
Average inlation rateOperating expenses (N’m)
0.02013 2014 2015 2016 2017
1.0
3.0
2.0
4.0
7.0
6.0
5.0
0.9% 0.8% 3.8% 5.2%
108.7099.50
53.6045.10
54.75
0
20.00
40.00
80.00
60.00
100.00
120.00
$million%
6.6%
0 02013 2014 2015 2016 2017
100,000
90,000
70,000
50,000
30,000
10,000
80,000
60,000
40,000
20,000
Nmillion %
18.0
16.0
14.0
12.0
8.0
10.0
6.0
4.0
2.057,948
8.5%
8.1%9.0%
15.7%16.5%
57,901 62,066 69,041 86,026
Business review32 33Stanbic IBTC Annual group financial statements for the year ended 31 December 2017 Overview Business review Annual report & financial statements Other information
Financial review (continued)
Analysis of the Group’s financial performance
Income statement analysis
The statement of profit or loss reflects the revenue earned by the business and costs incurred in generating the revenue for the year
end 2017.
The profit for the year grew significantly year-on-year by 70%. Below are explanations for significant movements recorded in the year.
Summarised income statement – Group
Change %
2017
Nmillion
2016
Nmillion
Gross earnings 36 212,434 156,425
Net interest income 44 83,587 57,859
Interest income 41 122,911 87,467
Interest expense 33 (39,324) (29,608)
Non-interest revenue 31 89,182 68,194
Net fees and commission revenue 13 59,089 52,154
Fees and commission revenue 12 59,430 52,918
Fees and commission expense (55) (341) (764)
Trading revenue 90 29,148 15,326
Other revenue 32 945 714
Total income 37 172,769 126,053
Credit impairment charges 29 (25,577) (19,803)
Income after credit impairment charges 39 147,192 106,250
Operating expenses 25 (86,026) (69,041)
Staff costs 20 (36,282) (30,173)
Other operating expenses 28 (49,744) (38,868)
Profit before taxation 64 61,166 37,209
Direct taxation 47 (12,785) (8,689)
Profit for the period 70 48,381 28,520
Profit attributable to:
Non-controlling interests (44) 2,186 3,878
Equity holders of the parent 87 46,195 24,642
Profit for the period 70 48,381 28,520
Effective tax rate
Nigeria’s corporate tax rate remained unchanged throughout 2017,
although the government had an increased focus on tax collection.
This is not expected to change in 2018 given the revenue drive of
both state and federal governments.
Growth in revenue from pension and non-pension assets
The growth in revenue from managing pension and non-pension
assets is dependent on equity market performance, money market
interest rates and yields on government securities. Growth in equity
market performance results in higher investment income on assets
under management which in turn increases the net asset value of
the funds. The revenue from the pension and non-pension asset
management business is usually a percentage of the net assets
value of the funds.
The level of unemployment also affects the revenue from pension
business. A decline in unemployment rate means that more people
are getting employed and pension contributions will increase
thereby resulting in increased assets under management, while
an increase in unemployment rate will have an adverse effect
on the revenue of the pension business.
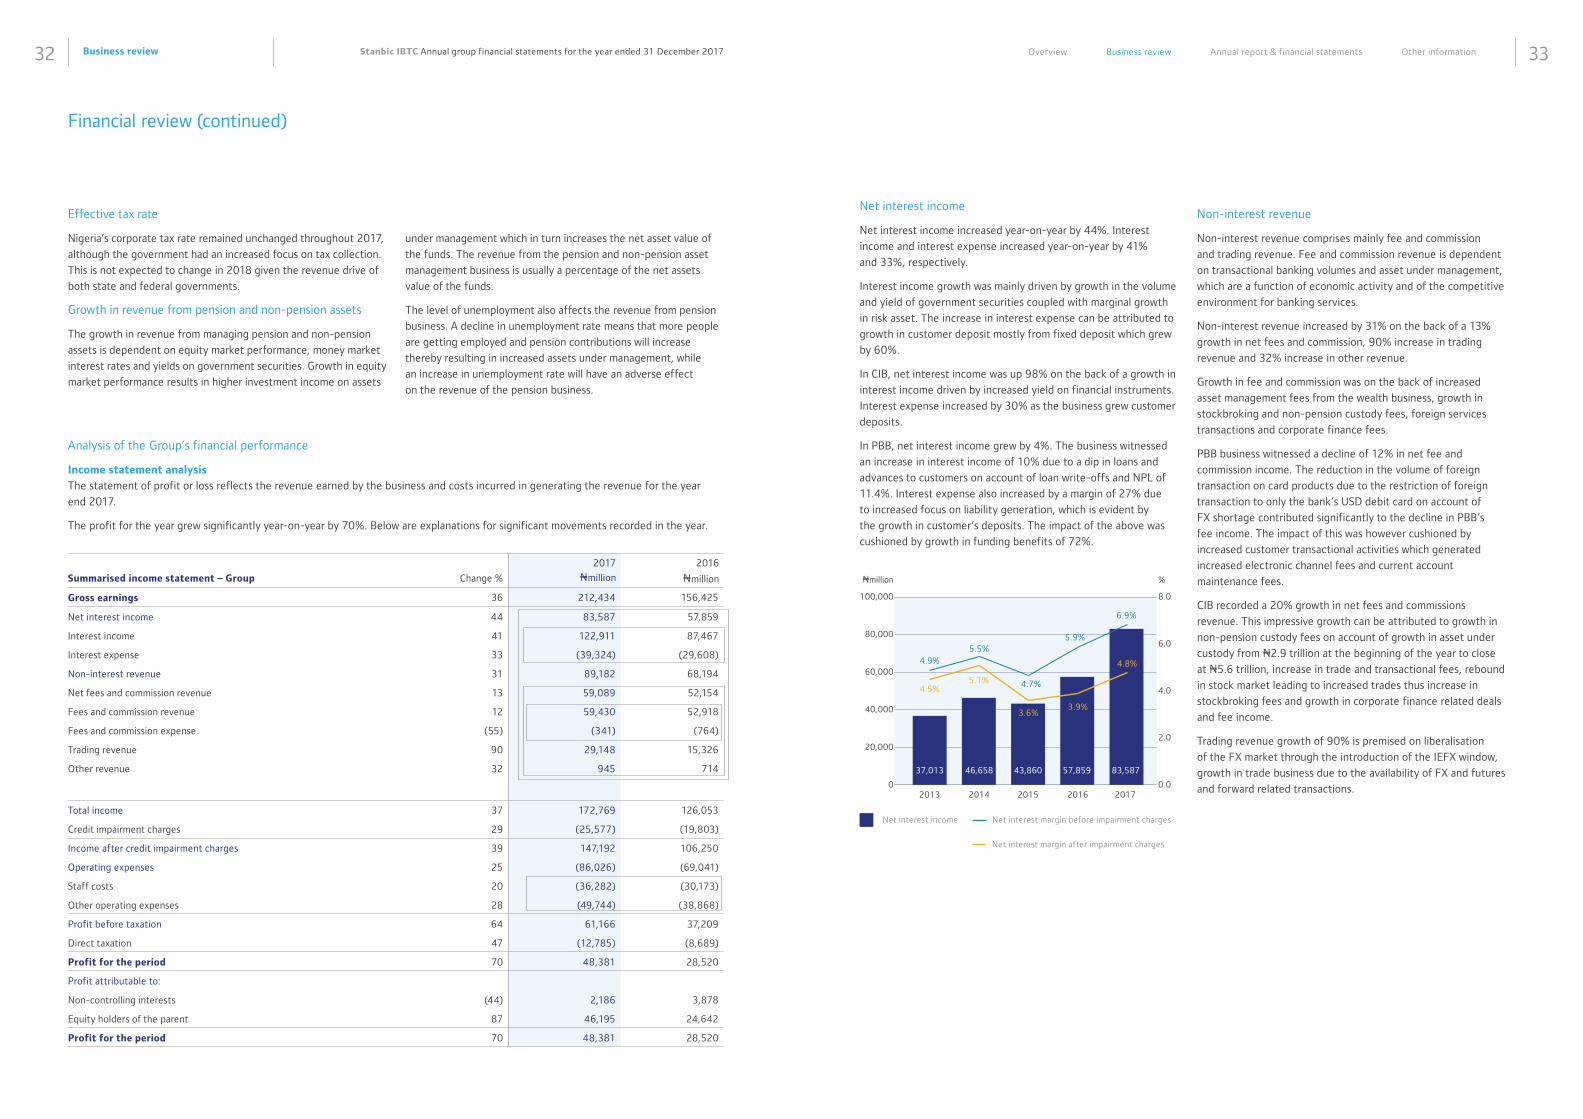
Net interest income
Net interest income increased year-on-year by 44%. Interest
income and interest expense increased year-on-year by 41%
and 33%, respectively.
Interest income growth was mainly driven by growth in the volume
and yield of government securities coupled with marginal growth
in risk asset. The increase in interest expense can be attributed to
growth in customer deposit mostly from fixed deposit which grew
by 60%.
In CIB, net interest income was up 98% on the back of a growth in
interest income driven by increased yield on financial instruments.
Interest expense increased by 30% as the business grew customer
deposits.
In PBB, net interest income grew by 4%. The business witnessed
an increase in interest income of 10% due to a dip in loans and
advances to customers on account of loan write-offs and NPL of
11.4%. Interest expense also increased by a margin of 27% due
to increased focus on liability generation, which is evident by
the growth in customer’s deposits. The impact of the above was
cushioned by growth in funding benefits of 72%.
Net interest margin before impairment charges
Net interest margin after impairment charges
Net interest income
Non-interest revenue
Non-interest revenue comprises mainly fee and commission
and trading revenue. Fee and commission revenue is dependent
on transactional banking volumes and asset under management,
which are a function of economic activity and of the competitive
environment for banking services.
Non-interest revenue increased by 31% on the back of a 13%
growth in net fees and commission, 90% increase in trading
revenue and 32% increase in other revenue.
Growth in fee and commission was on the back of increased
asset management fees from the wealth business, growth in
stockbroking and non-pension custody fees, foreign services
transactions and corporate finance fees.
PBB business witnessed a decline of 12% in net fee and
commission income. The reduction in the volume of foreign
transaction on card products due to the restriction of foreign
transaction to only the bank’s USD debit card on account of
FX shortage contributed significantly to the decline in PBB’s
fee income. The impact of this was however cushioned by
increased customer transactional activities which generated
increased electronic channel fees and current account
maintenance fees.
CIB recorded a 20% growth in net fees and commissions
revenue. This impressive growth can be attributed to growth in
non-pension custody fees on account of growth in asset under
custody from N2.9 trillion at the beginning of the year to close
at N5.6 trillion, increase in trade and transactional fees, rebound
in stock market leading to increased trades thus increase in
stockbroking fees and growth in corporate finance related deals
and fee income.
Trading revenue growth of 90% is premised on liberalisation
of the FX market through the introduction of the IEFX window,
growth in trade business due to the availability of FX and futures
and forward related transactions.02013 2014 2015 2016 2017
100,000
80,000
60,000
40,000
20,000
37,013 46,658 43,860 57,859
4.9%
4.5%5.1%
3.6%3.9%
4.8%
5.5%5.9%
6.9%
4.7%
0.0
4.0
2.0
8.0
6.0
%
83,587
Nmillion
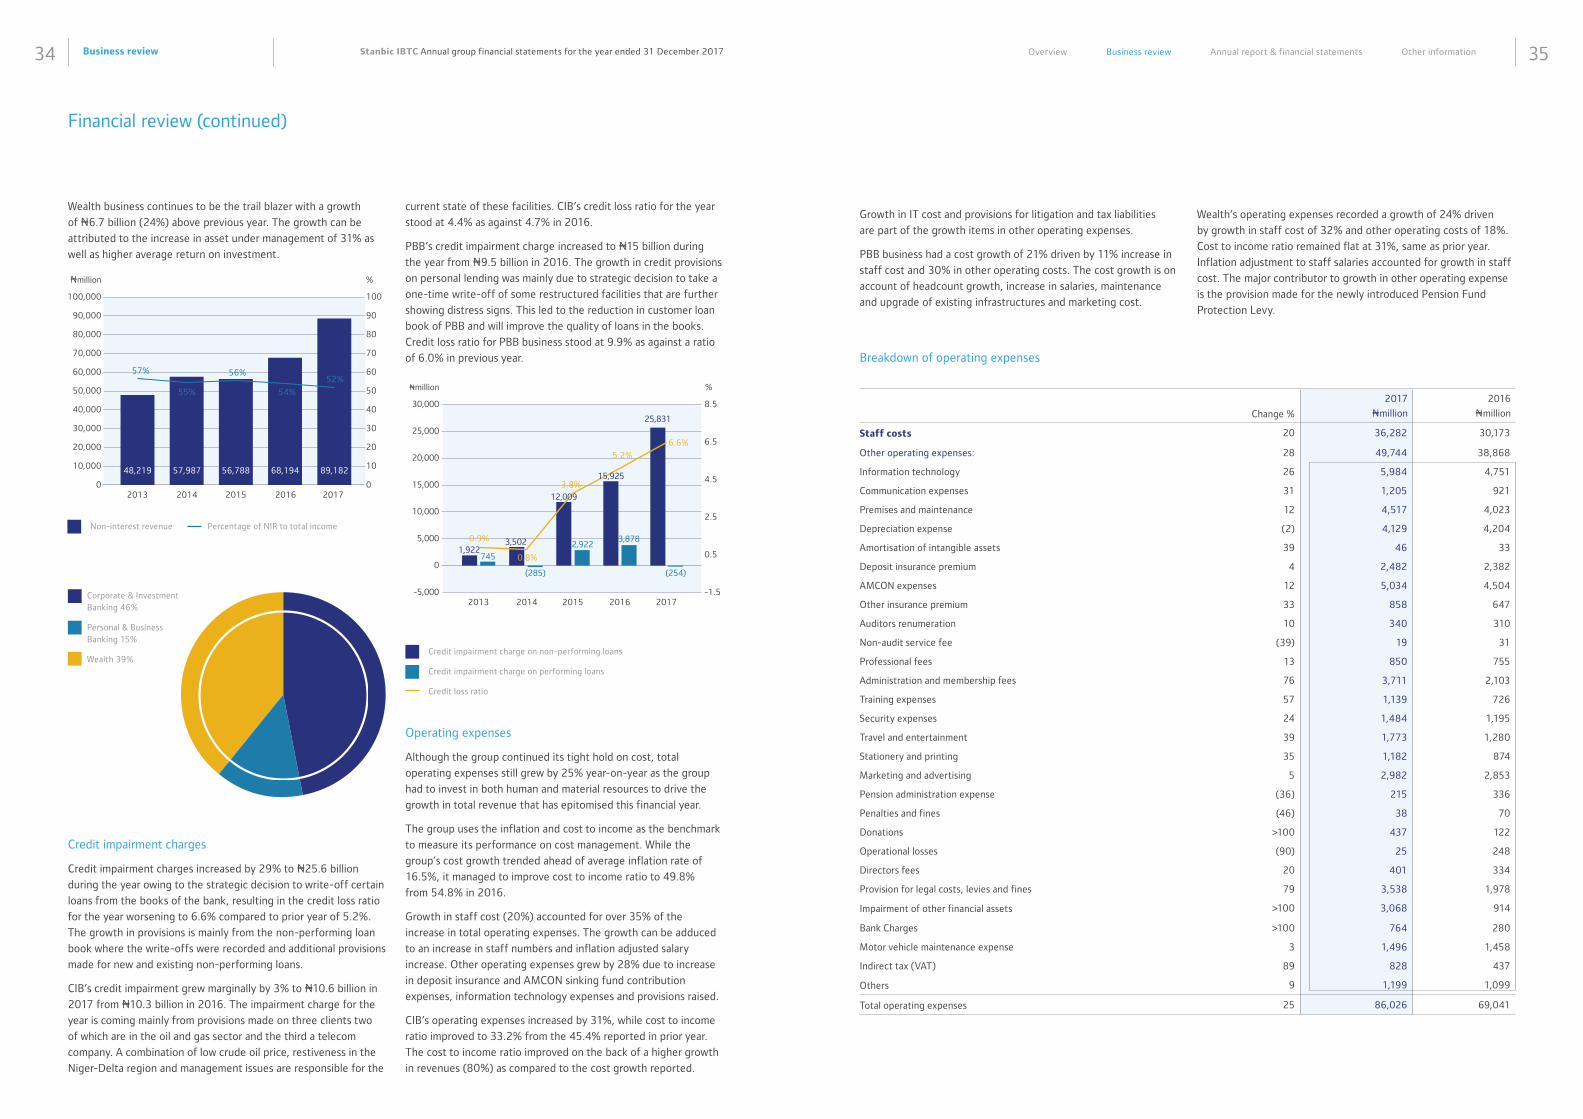
Business review34 35Stanbic IBTC Annual group financial statements for the year ended 31 December 2017 Overview Business review Annual report & financial statements Other information
Financial review (continued)
Credit impairment charges
Credit impairment charges increased by 29% to N25.6 billion
during the year owing to the strategic decision to write-off certain
loans from the books of the bank, resulting in the credit loss ratio
for the year worsening to 6.6% compared to prior year of 5.2%.
The growth in provisions is mainly from the non-performing loan
book where the write-offs were recorded and additional provisions
made for new and existing non-performing loans.
CIB’s credit impairment grew marginally by 3% to N10.6 billion in
2017 from N10.3 billion in 2016. The impairment charge for the
year is coming mainly from provisions made on three clients two
of which are in the oil and gas sector and the third a telecom
company. A combination of low crude oil price, restiveness in the
Niger-Delta region and management issues are responsible for the
Operating expenses
Although the group continued its tight hold on cost, total
operating expenses still grew by 25% year-on-year as the group
had to invest in both human and material resources to drive the
growth in total revenue that has epitomised this financial year.
The group uses the inflation and cost to income as the benchmark
to measure its performance on cost management. While the
group’s cost growth trended ahead of average inflation rate of
16.5%, it managed to improve cost to income ratio to 49.8%
from 54.8% in 2016.
Growth in staff cost (20%) accounted for over 35% of the
increase in total operating expenses. The growth can be adduced
to an increase in staff numbers and inflation adjusted salary
increase. Other operating expenses grew by 28% due to increase
in deposit insurance and AMCON sinking fund contribution
expenses, information technology expenses and provisions raised.
CIB’s operating expenses increased by 31%, while cost to income
ratio improved to 33.2% from the 45.4% reported in prior year.
The cost to income ratio improved on the back of a higher growth
in revenues (80%) as compared to the cost growth reported.
current state of these facilities. CIB’s credit loss ratio for the year
stood at 4.4% as against 4.7% in 2016.
PBB’s credit impairment charge increased to N15 billion during
the year from N9.5 billion in 2016. The growth in credit provisions
on personal lending was mainly due to strategic decision to take a
one-time write-off of some restructured facilities that are further
showing distress signs. This led to the reduction in customer loan
book of PBB and will improve the quality of loans in the books.
Credit loss ratio for PBB business stood at 9.9% as against a ratio
of 6.0% in previous year.
Wealth business continues to be the trail blazer with a growth
of N6.7 billion (24%) above previous year. The growth can be
attributed to the increase in asset under management of 31% as
well as higher average return on investment.
Credit impairment charge on non-performing loans
Credit impairment charge on performing loans
Credit loss ratio
-5,000 -1.52013 2014 2015 2016 2017
30,000
Nmillion %
5,000
0
10,000
20,000
25,000
15,000
8.5
2.5
4.5
0.5
6.5
0.9%1,922
745 0.8%
3.8%
5.2%
6.6%
3,502
12,009
(285) (254)
2,9223,878
15,925
25,831
Corporate & Investment Banking 46%
Personal & Business Banking 15%
Wealth 39%
Percentage of NIR to total incomeNon-interest revenue
02013 2014 2015 2016 2017
100,000
80,000
60,000
40,000
20,000
10,000
30,000
50,000
70,000
90,000
48,219 57,987 56,788 68,194
57%
55% 54%
52%56%
0
40
20
100
60
30
10
70
80
90
50
%
89,182
Nmillion
Wealth’s operating expenses recorded a growth of 24% driven
by growth in staff cost of 32% and other operating costs of 18%.
Cost to income ratio remained flat at 31%, same as prior year.
Inflation adjustment to staff salaries accounted for growth in staff
cost. The major contributor to growth in other operating expense
is the provision made for the newly introduced Pension Fund
Protection Levy.
Growth in IT cost and provisions for litigation and tax liabilities
are part of the growth items in other operating expenses.
PBB business had a cost growth of 21% driven by 11% increase in
staff cost and 30% in other operating costs. The cost growth is on
account of headcount growth, increase in salaries, maintenance
and upgrade of existing infrastructures and marketing cost.
Breakdown of operating expenses
Change %
2017
Nmillion
2016
Nmillion
Staff costs 20 36,282 30,173
Other operating expenses: 28 49,744 38,868
Information technology 26 5,984 4,751
Communication expenses 31 1,205 921
Premises and maintenance 12 4,517 4,023
Depreciation expense (2) 4,129 4,204
Amortisation of intangible assets 39 46 33
Deposit insurance premium 4 2,482 2,382
AMCON expenses 12 5,034 4,504
Other insurance premium 33 858 647
Auditors renumeration 10 340 310
Non-audit service fee (39) 19 31
Professional fees 13 850 755
Administration and membership fees 76 3,711 2,103
Training expenses 57 1,139 726
Security expenses 24 1,484 1,195
Travel and entertainment 39 1,773 1,280
Stationery and printing 35 1,182 874
Marketing and advertising 5 2,982 2,853
Pension administration expense (36) 215 336
Penalties and fines (46) 38 70
Donations >100 437 122
Operational losses (90) 25 248
Directors fees 20 401 334
Provision for legal costs, levies and fines 79 3,538 1,978
Impairment of other financial assets >100 3,068 914
Bank Charges >100 764 280
Motor vehicle maintenance expense 3 1,496 1,458
Indirect tax (VAT) 89 828 437
Others 9 1,199 1,099
Total operating expenses 25 86,026 69,041
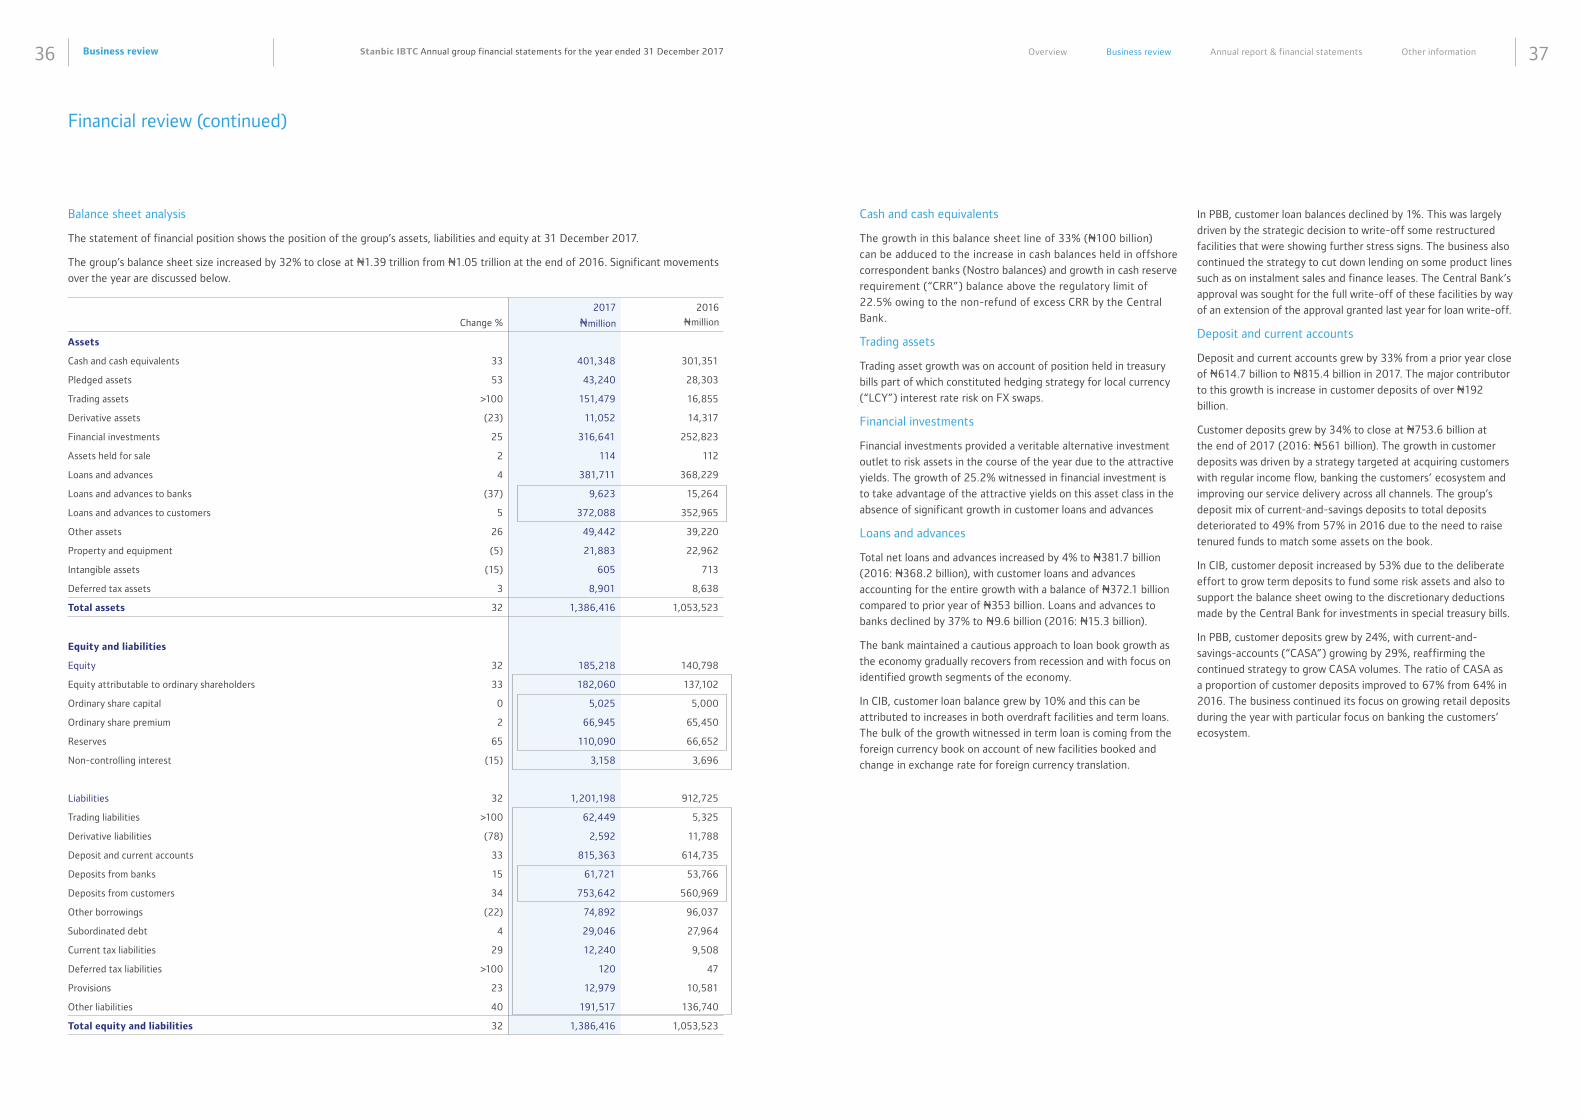
Business review36 37Stanbic IBTC Annual group financial statements for the year ended 31 December 2017 Overview Business review Annual report & financial statements Other information
Financial review (continued)
Balance sheet analysis
The statement of financial position shows the position of the group’s assets, liabilities and equity at 31 December 2017.
The group’s balance sheet size increased by 32% to close at N1.39 trillion from N1.05 trillion at the end of 2016. Significant movements
over the year are discussed below.
Change %
2017
Nmillion
2016
Nmillion
Assets
Cash and cash equivalents 33 401,348 301,351
Pledged assets 53 43,240 28,303
Trading assets >100 151,479 16,855
Derivative assets (23) 11,052 14,317
Financial investments 25 316,641 252,823
Assets held for sale 2 114 112
Loans and advances 4 381,711 368,229
Loans and advances to banks (37) 9,623 15,264
Loans and advances to customers 5 372,088 352,965
Other assets 26 49,442 39,220
Property and equipment (5) 21,883 22,962
Intangible assets (15) 605 713
Deferred tax assets 3 8,901 8,638
Total assets 32 1,386,416 1,053,523
Equity and liabilities
Equity 32 185,218 140,798
Equity attributable to ordinary shareholders 33 182,060 137,102
Ordinary share capital 0 5,025 5,000
Ordinary share premium 2 66,945 65,450
Reserves 65 110,090 66,652
Non-controlling interest (15) 3,158 3,696
Liabilities 32 1,201,198 912,725
Trading liabilities >100 62,449 5,325
Derivative liabilities (78) 2,592 11,788
Deposit and current accounts 33 815,363 614,735
Deposits from banks 15 61,721 53,766
Deposits from customers 34 753,642 560,969
Other borrowings (22) 74,892 96,037
Subordinated debt 4 29,046 27,964
Current tax liabilities 29 12,240 9,508
Deferred tax liabilities >100 120 47
Provisions 23 12,979 10,581
Other liabilities 40 191,517 136,740
Total equity and liabilities 32 1,386,416 1,053,523
Cash and cash equivalents
The growth in this balance sheet line of 33% (N100 billion)
can be adduced to the increase in cash balances held in offshore
correspondent banks (Nostro balances) and growth in cash reserve
requirement (“CRR”) balance above the regulatory limit of
22.5% owing to the non-refund of excess CRR by the Central
Bank.
Trading assets
Trading asset growth was on account of position held in treasury
bills part of which constituted hedging strategy for local currency
(“LCY”) interest rate risk on FX swaps.
Financial investments
Financial investments provided a veritable alternative investment
outlet to risk assets in the course of the year due to the attractive
yields. The growth of 25.2% witnessed in financial investment is
to take advantage of the attractive yields on this asset class in the
absence of significant growth in customer loans and advances
Loans and advances
Total net loans and advances increased by 4% to N381.7 billion
(2016: N368.2 billion), with customer loans and advances
accounting for the entire growth with a balance of N372.1 billion
compared to prior year of N353 billion. Loans and advances to
banks declined by 37% to N9.6 billion (2016: N15.3 billion).
The bank maintained a cautious approach to loan book growth as
the economy gradually recovers from recession and with focus on
identified growth segments of the economy.
In CIB, customer loan balance grew by 10% and this can be
attributed to increases in both overdraft facilities and term loans.
The bulk of the growth witnessed in term loan is coming from the
foreign currency book on account of new facilities booked and
change in exchange rate for foreign currency translation.
In PBB, customer loan balances declined by 1%. This was largely
driven by the strategic decision to write-off some restructured
facilities that were showing further stress signs. The business also
continued the strategy to cut down lending on some product lines
such as on instalment sales and finance leases. The Central Bank’s
approval was sought for the full write-off of these facilities by way
of an extension of the approval granted last year for loan write-off.
Deposit and current accounts
Deposit and current accounts grew by 33% from a prior year close
of N614.7 billion to N815.4 billion in 2017. The major contributor
to this growth is increase in customer deposits of over N192
billion.
Customer deposits grew by 34% to close at N753.6 billion at
the end of 2017 (2016: N561 billion). The growth in customer
deposits was driven by a strategy targeted at acquiring customers
with regular income flow, banking the customers’ ecosystem and
improving our service delivery across all channels. The group’s
deposit mix of current-and-savings deposits to total deposits
deteriorated to 49% from 57% in 2016 due to the need to raise
tenured funds to match some assets on the book.
In CIB, customer deposit increased by 53% due to the deliberate
effort to grow term deposits to fund some risk assets and also to
support the balance sheet owing to the discretionary deductions
made by the Central Bank for investments in special treasury bills.
In PBB, customer deposits grew by 24%, with current-and-
savings-accounts (“CASA”) growing by 29%, reaffirming the
continued strategy to grow CASA volumes. The ratio of CASA as
a proportion of customer deposits improved to 67% from 64% in
2016. The business continued its focus on growing retail deposits
during the year with particular focus on banking the customers’
ecosystem.
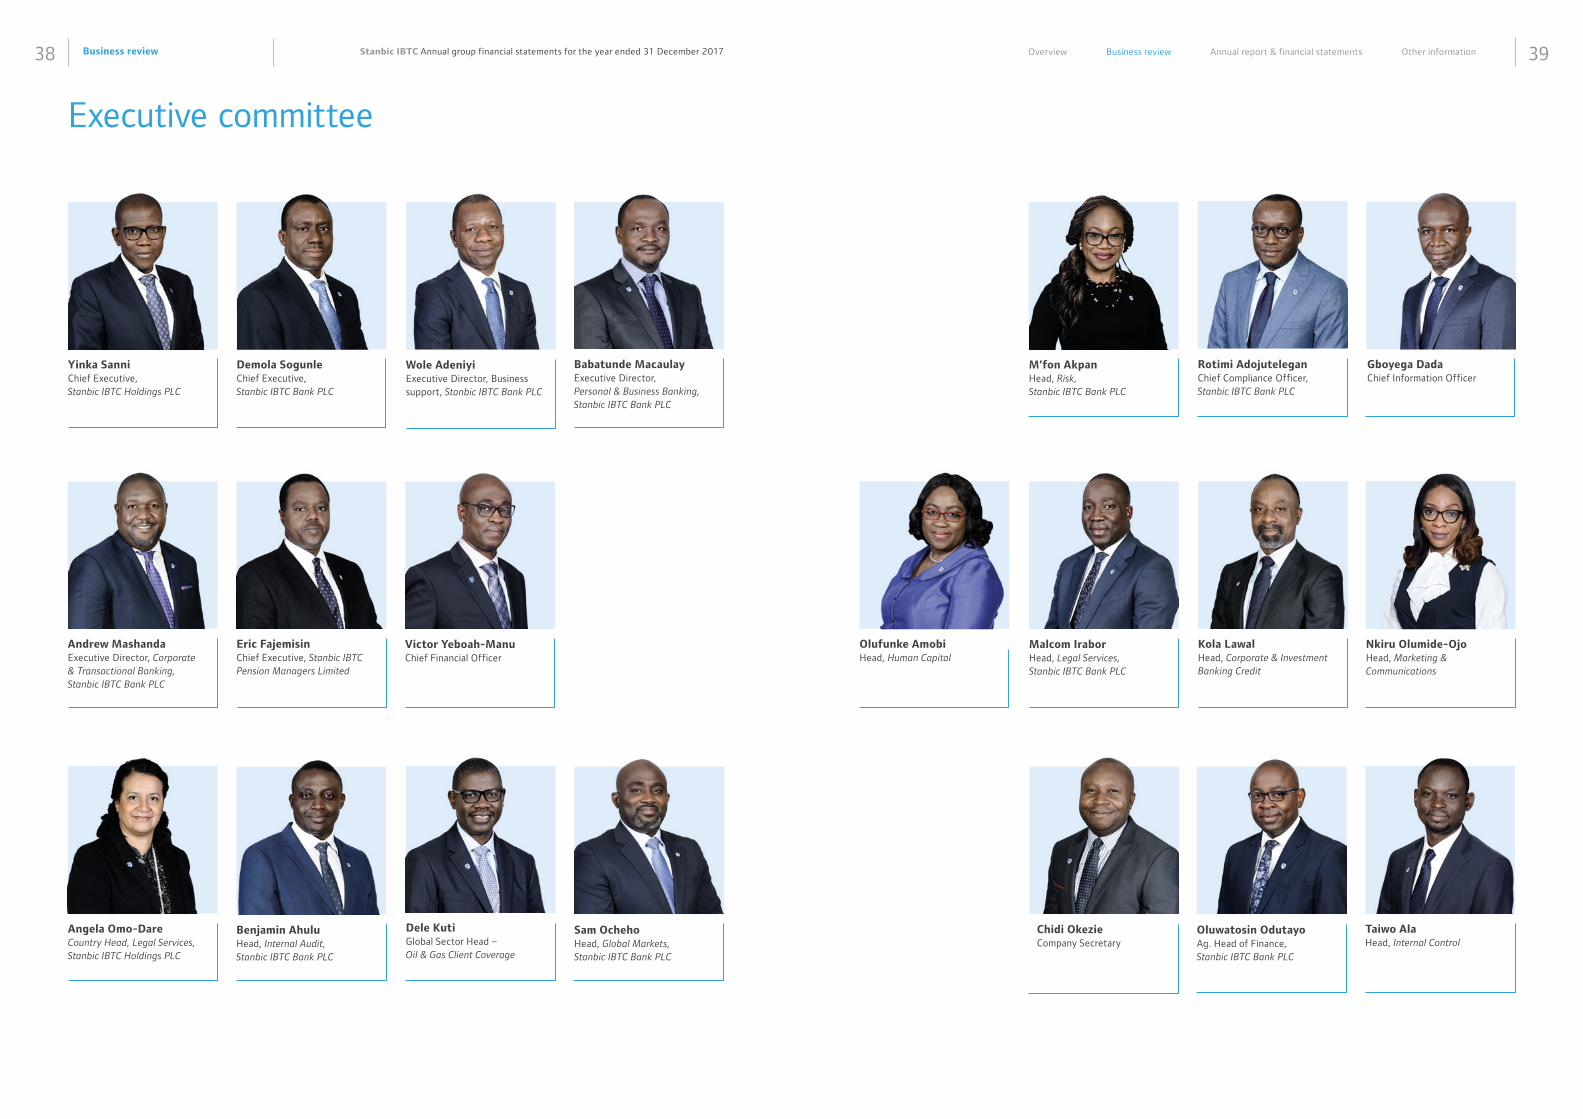
Business review38 39Stanbic IBTC Annual group financial statements for the year ended 31 December 2017 Overview Business review Annual report & financial statements Other information
Executive committee
Wole Adeniyi Executive Director, Business support, Stanbic IBTC Bank PLC
Demola Sogunle Chief Executive, Stanbic IBTC Bank PLC
Yinka Sanni Chief Executive, Stanbic IBTC Holdings PLC
Victor Yeboah-Manu Chief Financial Officer
Eric Fajemisin Chief Executive, Stanbic IBTC Pension Managers Limited
Babatunde Macaulay Executive Director, Personal & Business Banking, Stanbic IBTC Bank PLC
Andrew Mashanda Executive Director, Corporate & Transactional Banking, Stanbic IBTC Bank PLC
Angela Omo-Dare Country Head, Legal Services, Stanbic IBTC Holdings PLC
Kola Lawal Head, Corporate & Investment Banking Credit
M’fon Akpan Head, Risk, Stanbic IBTC Bank PLC
Olufunke Amobi Head, Human Capital
Malcom Irabor Head, Legal Services, Stanbic IBTC Bank PLC
Nkiru Olumide-Ojo Head, Marketing & Communications
Taiwo Ala Head, Internal Control
Oluwatosin Odutayo Ag. Head of Finance, Stanbic IBTC Bank PLC
Rotimi Adojutelegan Chief Compliance Officer, Stanbic IBTC Bank PLC
Benjamin Ahulu Head, Internal Audit, Stanbic IBTC Bank PLC
Sam Ocheho Head, Global Markets, Stanbic IBTC Bank PLC
Dele Kuti Global Sector Head – Oil & Gas Client Coverage
Gboyega Dada Chief Information Officer
Chidi Okezie Company Secretary
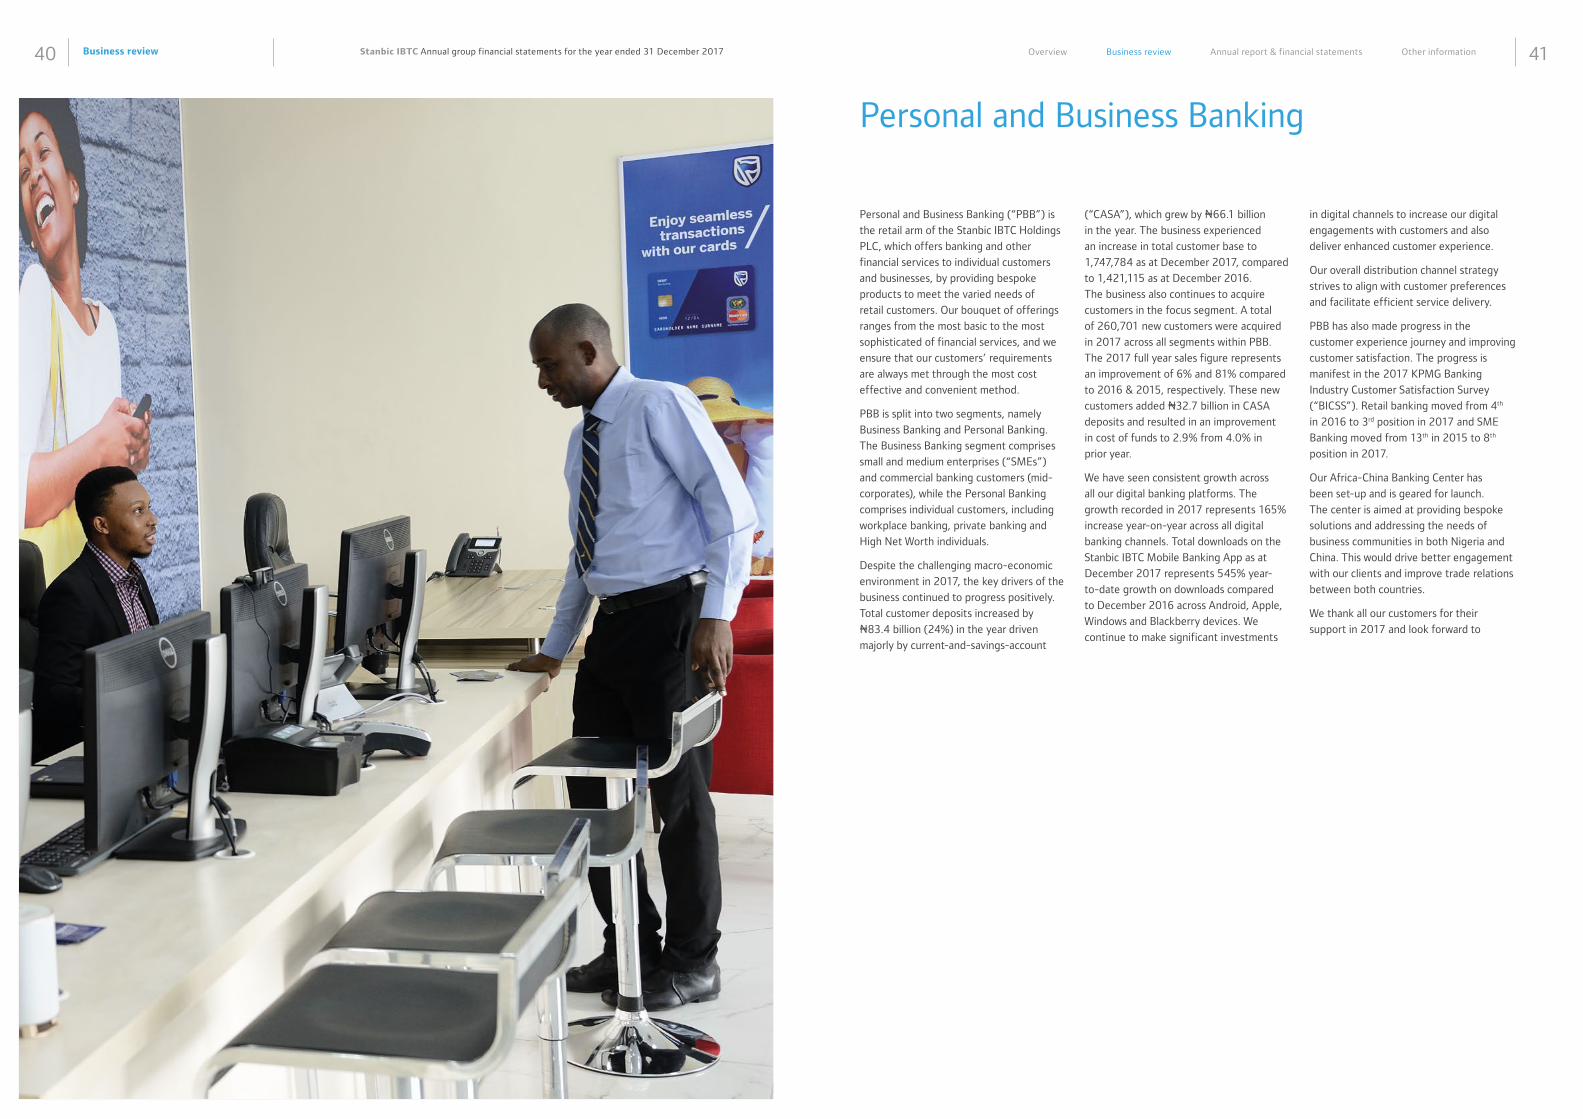
Business review40 41Stanbic IBTC Annual group financial statements for the year ended 31 December 2017 Overview Business review Annual report & financial statements Other information
Personal and Business Banking
Personal and Business Banking (“PBB”) is
the retail arm of the Stanbic IBTC Holdings
PLC, which offers banking and other
financial services to individual customers
and businesses, by providing bespoke
products to meet the varied needs of
retail customers. Our bouquet of offerings
ranges from the most basic to the most
sophisticated of financial services, and we
ensure that our customers’ requirements
are always met through the most cost
effective and convenient method.
PBB is split into two segments, namely
Business Banking and Personal Banking.
The Business Banking segment comprises
small and medium enterprises (“SMEs”)
and commercial banking customers (mid-
corporates), while the Personal Banking
comprises individual customers, including
workplace banking, private banking and
High Net Worth individuals.
Despite the challenging macro-economic
environment in 2017, the key drivers of the
business continued to progress positively.
Total customer deposits increased by
N83.4 billion (24%) in the year driven
majorly by current-and-savings-account
(“CASA”), which grew by N66.1 billion
in the year. The business experienced
an increase in total customer base to
1,747,784 as at December 2017, compared
to 1,421,115 as at December 2016.
The business also continues to acquire
customers in the focus segment. A total
of 260,701 new customers were acquired
in 2017 across all segments within PBB.
The 2017 full year sales figure represents
an improvement of 6% and 81% compared
to 2016 & 2015, respectively. These new
customers added N32.7 billion in CASA
deposits and resulted in an improvement
in cost of funds to 2.9% from 4.0% in
prior year.
We have seen consistent growth across
all our digital banking platforms. The
growth recorded in 2017 represents 165%
increase year-on-year across all digital
banking channels. Total downloads on the
Stanbic IBTC Mobile Banking App as at
December 2017 represents 545% year-
to-date growth on downloads compared
to December 2016 across Android, Apple,
Windows and Blackberry devices. We
continue to make significant investments
in digital channels to increase our digital
engagements with customers and also
deliver enhanced customer experience.
Our overall distribution channel strategy
strives to align with customer preferences
and facilitate efficient service delivery.
PBB has also made progress in the
customer experience journey and improving
customer satisfaction. The progress is
manifest in the 2017 KPMG Banking
Industry Customer Satisfaction Survey
(“BICSS”). Retail banking moved from 4th
in 2016 to 3rd position in 2017 and SME
Banking moved from 13th in 2015 to 8th
position in 2017.
Our Africa-China Banking Center has
been set-up and is geared for launch.
The center is aimed at providing bespoke
solutions and addressing the needs of
business communities in both Nigeria and
China. This would drive better engagement
with our clients and improve trade relations
between both countries.
We thank all our customers for their
support in 2017 and look forward to
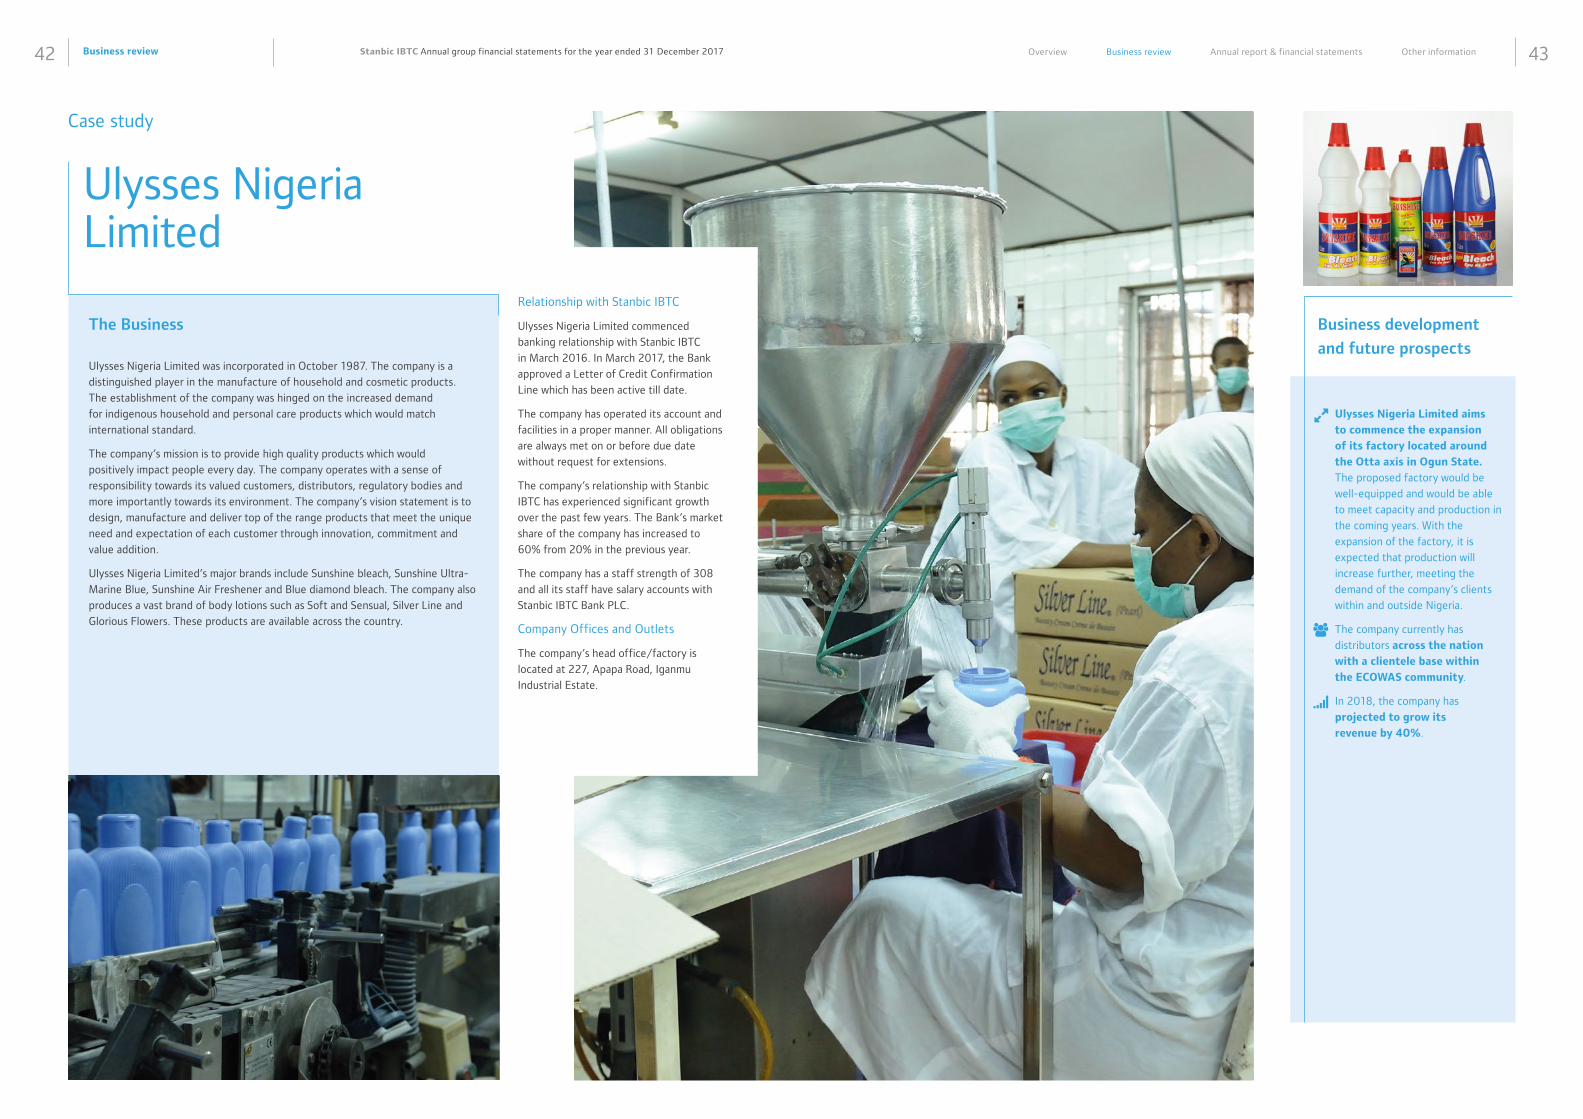
Business review42 43Stanbic IBTC Annual group financial statements for the year ended 31 December 2017 Overview Business review Annual report & financial statements Other information
The Business
Ulysses Nigeria Limited was incorporated in October 1987. The company is a
distinguished player in the manufacture of household and cosmetic products.
The establishment of the company was hinged on the increased demand
for indigenous household and personal care products which would match
international standard.
The company’s mission is to provide high quality products which would
positively impact people every day. The company operates with a sense of
responsibility towards its valued customers, distributors, regulatory bodies and
more importantly towards its environment. The company’s vision statement is to
design, manufacture and deliver top of the range products that meet the unique
need and expectation of each customer through innovation, commitment and
value addition.
Ulysses Nigeria Limited’s major brands include Sunshine bleach, Sunshine Ultra-
Marine Blue, Sunshine Air Freshener and Blue diamond bleach. The company also
produces a vast brand of body lotions such as Soft and Sensual, Silver Line and
Glorious Flowers. These products are available across the country.
Relationship with Stanbic IBTC
Ulysses Nigeria Limited commenced
banking relationship with Stanbic IBTC
in March 2016. In March 2017, the Bank
approved a Letter of Credit Confirmation
Line which has been active till date.
The company has operated its account and
facilities in a proper manner. All obligations
are always met on or before due date
without request for extensions.
The company’s relationship with Stanbic
IBTC has experienced significant growth
over the past few years. The Bank’s market
share of the company has increased to
60% from 20% in the previous year.
The company has a staff strength of 308
and all its staff have salary accounts with
Stanbic IBTC Bank PLC.
Company Offices and Outlets
The company’s head office/factory is
located at 227, Apapa Road, Iganmu
Industrial Estate.
Ulysses Nigeria Limited
Case study
Business development
and future prospects
Ulysses Nigeria Limited aims
to commence the expansion
of its factory located around
the Otta axis in Ogun State.
The proposed factory would be
well-equipped and would be able
to meet capacity and production in
the coming years. With the
expansion of the factory, it is
expected that production will
increase further, meeting the
demand of the company’s clients
within and outside Nigeria.
The company currently has
distributors across the nation
with a clientele base within
the ECOWAS community.
In 2018, the company has
projected to grow its
revenue by 40%.
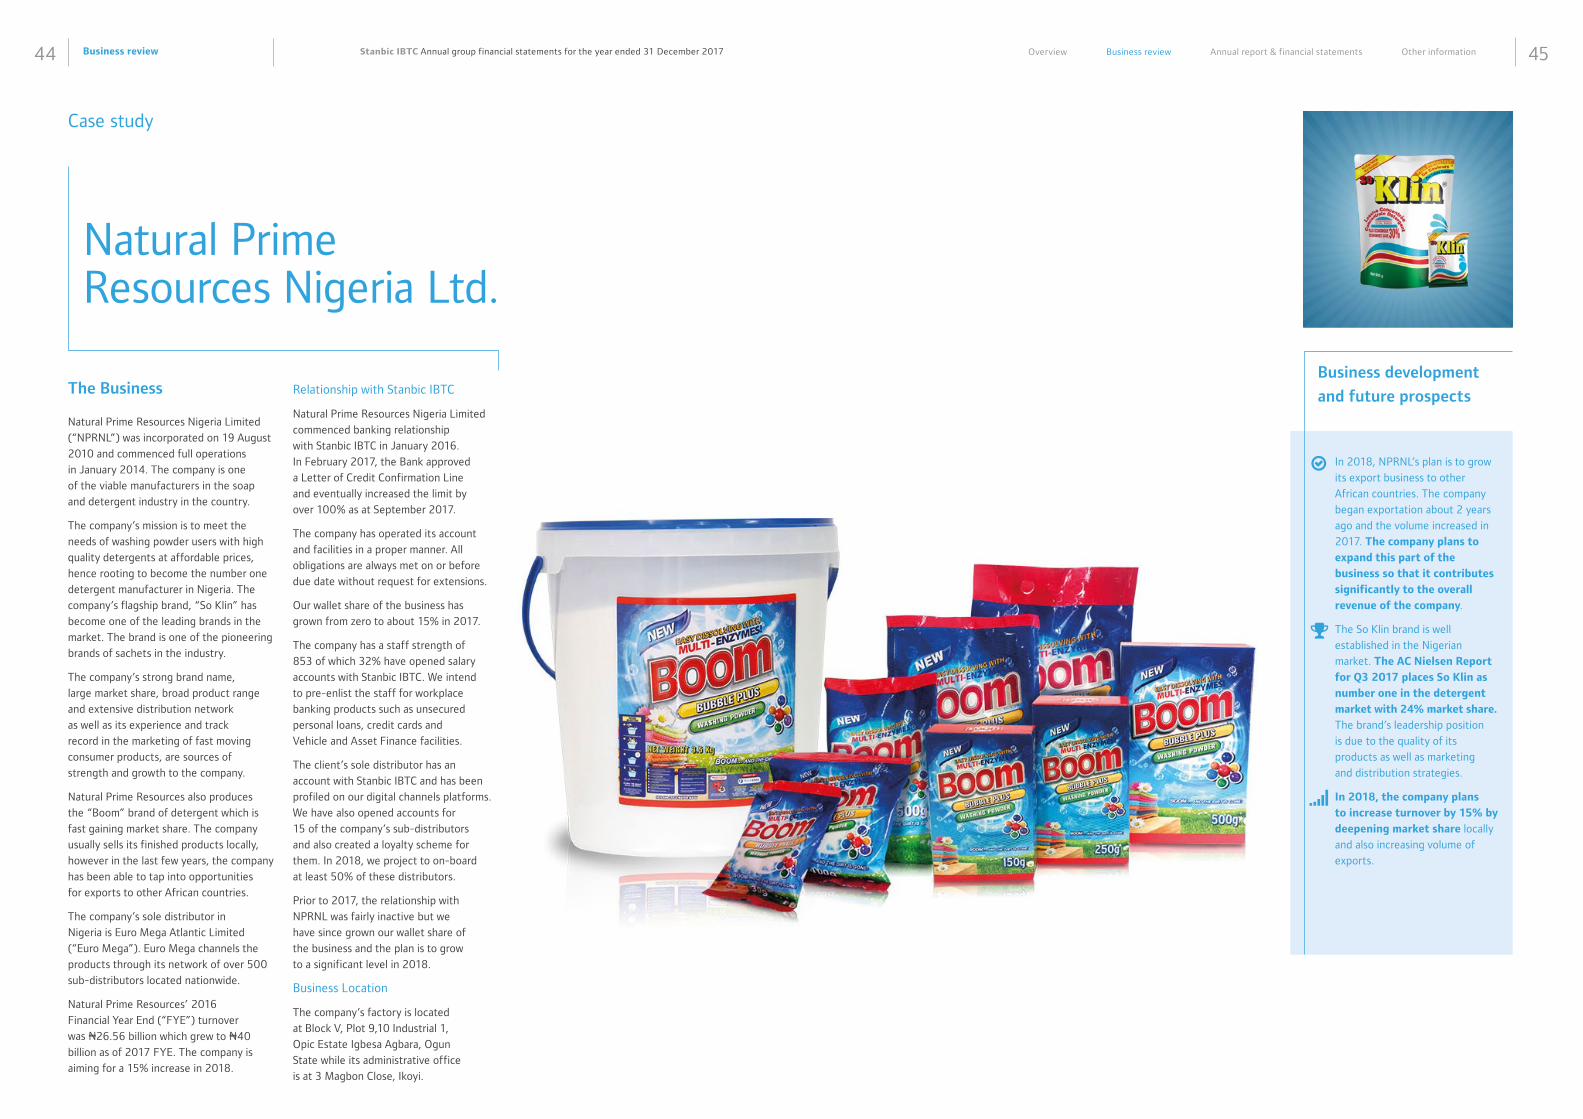
Business review44 45Stanbic IBTC Annual group financial statements for the year ended 31 December 2017 Overview Business review Annual report & financial statements Other information
The Business
Natural Prime Resources Nigeria Limited
(“NPRNL”) was incorporated on 19 August
2010 and commenced full operations
in January 2014. The company is one
of the viable manufacturers in the soap
and detergent industry in the country.
The company’s mission is to meet the
needs of washing powder users with high
quality detergents at affordable prices,
hence rooting to become the number one
detergent manufacturer in Nigeria. The
company’s flagship brand, “So Klin” has
become one of the leading brands in the
market. The brand is one of the pioneering
brands of sachets in the industry.
The company’s strong brand name,
large market share, broad product range
and extensive distribution network
as well as its experience and track
record in the marketing of fast moving
consumer products, are sources of
strength and growth to the company.
Natural Prime Resources also produces
the “Boom” brand of detergent which is
fast gaining market share. The company
usually sells its finished products locally,
however in the last few years, the company
has been able to tap into opportunities
for exports to other African countries.
The company’s sole distributor in
Nigeria is Euro Mega Atlantic Limited
(“Euro Mega”). Euro Mega channels the
products through its network of over 500
sub-distributors located nationwide.
Natural Prime Resources’ 2016
Financial Year End (“FYE”) turnover
was N26.56 billion which grew to N40
billion as of 2017 FYE. The company is
aiming for a 15% increase in 2018.
Relationship with Stanbic IBTC
Natural Prime Resources Nigeria Limited
commenced banking relationship
with Stanbic IBTC in January 2016.
In February 2017, the Bank approved
a Letter of Credit Confirmation Line
and eventually increased the limit by
over 100% as at September 2017.
The company has operated its account
and facilities in a proper manner. All
obligations are always met on or before
due date without request for extensions.
Our wallet share of the business has
grown from zero to about 15% in 2017.
The company has a staff strength of
853 of which 32% have opened salary
accounts with Stanbic IBTC. We intend
to pre-enlist the staff for workplace
banking products such as unsecured
personal loans, credit cards and
Vehicle and Asset Finance facilities.
The client’s sole distributor has an
account with Stanbic IBTC and has been
profiled on our digital channels platforms.
We have also opened accounts for
15 of the company’s sub-distributors
and also created a loyalty scheme for
them. In 2018, we project to on-board
at least 50% of these distributors.
Prior to 2017, the relationship with
NPRNL was fairly inactive but we
have since grown our wallet share of
the business and the plan is to grow
to a significant level in 2018.
Business Location
The company’s factory is located
at Block V, Plot 9,10 Industrial 1,
Opic Estate Igbesa Agbara, Ogun
State while its administrative office
is at 3 Magbon Close, Ikoyi.
Case study
Natural Prime Resources Nigeria Ltd.
Business development
and future prospects
In 2018, NPRNL’s plan is to grow
its export business to other
African countries. The company
began exportation about 2 years
ago and the volume increased in
2017. The company plans to
expand this part of the
business so that it contributes
significantly to the overall
revenue of the company.
The So Klin brand is well
established in the Nigerian
market. The AC Nielsen Report
for Q3 2017 places So Klin as
number one in the detergent
market with 24% market share.
The brand’s leadership position
is due to the quality of its
products as well as marketing
and distribution strategies.
In 2018, the company plans
to increase turnover by 15% by
deepening market share locally
and also increasing volume of
exports.
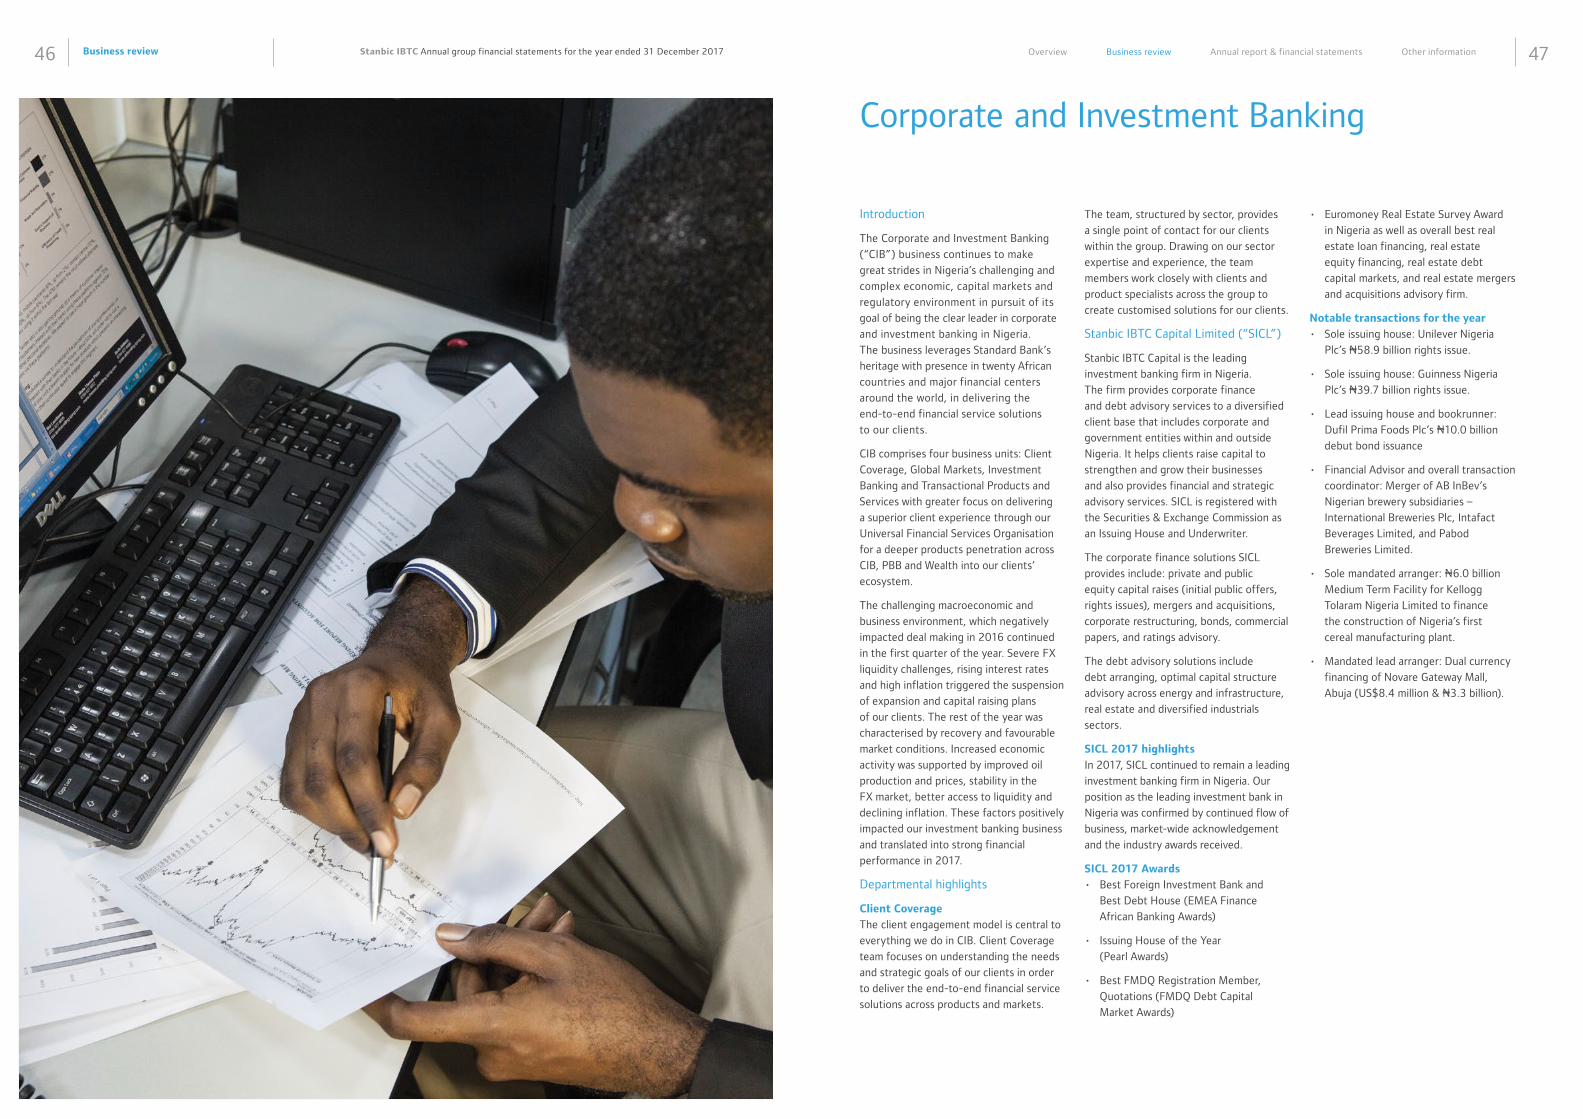
Business review46 47Stanbic IBTC Annual group financial statements for the year ended 31 December 2017 Overview Business review Annual report & financial statements Other information
Corporate and Investment Banking
Introduction
The Corporate and Investment Banking
(“CIB”) business continues to make
great strides in Nigeria’s challenging and
complex economic, capital markets and
regulatory environment in pursuit of its
goal of being the clear leader in corporate
and investment banking in Nigeria.
The business leverages Standard Bank’s
heritage with presence in twenty African
countries and major financial centers
around the world, in delivering the
end-to-end financial service solutions
to our clients.
CIB comprises four business units: Client
Coverage, Global Markets, Investment
Banking and Transactional Products and
Services with greater focus on delivering
a superior client experience through our
Universal Financial Services Organisation
for a deeper products penetration across
CIB, PBB and Wealth into our clients’
ecosystem.
The challenging macroeconomic and
business environment, which negatively
impacted deal making in 2016 continued
in the first quarter of the year. Severe FX
liquidity challenges, rising interest rates
and high inflation triggered the suspension
of expansion and capital raising plans
of our clients. The rest of the year was
characterised by recovery and favourable
market conditions. Increased economic
activity was supported by improved oil
production and prices, stability in the
FX market, better access to liquidity and
declining inflation. These factors positively
impacted our investment banking business
and translated into strong financial
performance in 2017.
Departmental highlights
Client Coverage
The client engagement model is central to
everything we do in CIB. Client Coverage
team focuses on understanding the needs
and strategic goals of our clients in order
to deliver the end-to-end financial service
solutions across products and markets.
The team, structured by sector, provides
a single point of contact for our clients
within the group. Drawing on our sector
expertise and experience, the team
members work closely with clients and
product specialists across the group to
create customised solutions for our clients.
Stanbic IBTC Capital Limited (“SICL”)
Stanbic IBTC Capital is the leading
investment banking firm in Nigeria.
The firm provides corporate finance
and debt advisory services to a diversified
client base that includes corporate and
government entities within and outside
Nigeria. It helps clients raise capital to
strengthen and grow their businesses
and also provides financial and strategic
advisory services. SICL is registered with
the Securities & Exchange Commission as
an Issuing House and Underwriter.
The corporate finance solutions SICL
provides include: private and public
equity capital raises (initial public offers,
rights issues), mergers and acquisitions,
corporate restructuring, bonds, commercial
papers, and ratings advisory.
The debt advisory solutions include
debt arranging, optimal capital structure
advisory across energy and infrastructure,
real estate and diversified industrials
sectors.
SICL 2017 highlights In 2017, SICL continued to remain a leading
investment banking firm in Nigeria. Our
position as the leading investment bank in
Nigeria was confirmed by continued flow of
business, market-wide acknowledgement
and the industry awards received.
SICL 2017 Awards
• Best Foreign Investment Bank and
Best Debt House (EMEA Finance
African Banking Awards)
• Issuing House of the Year
(Pearl Awards)
• Best FMDQ Registration Member,
Quotations (FMDQ Debt Capital
Market Awards)
• Euromoney Real Estate Survey Award
in Nigeria as well as overall best real
estate loan financing, real estate
equity financing, real estate debt
capital markets, and real estate mergers
and acquisitions advisory firm.
Notable transactions for the year
• Sole issuing house: Unilever Nigeria
Plc’s N58.9 billion rights issue.
• Sole issuing house: Guinness Nigeria
Plc’s N39.7 billion rights issue.
• Lead issuing house and bookrunner:
Dufil Prima Foods Plc’s N10.0 billion
debut bond issuance
• Financial Advisor and overall transaction
coordinator: Merger of AB InBev’s
Nigerian brewery subsidiaries –
International Breweries Plc, Intafact
Beverages Limited, and Pabod
Breweries Limited.
• Sole mandated arranger: N6.0 billion
Medium Term Facility for Kellogg
Tolaram Nigeria Limited to finance
the construction of Nigeria’s first
cereal manufacturing plant.
• Mandated lead arranger: Dual currency
financing of Novare Gateway Mall,
Abuja (US$8.4 million & N3.3 billion).
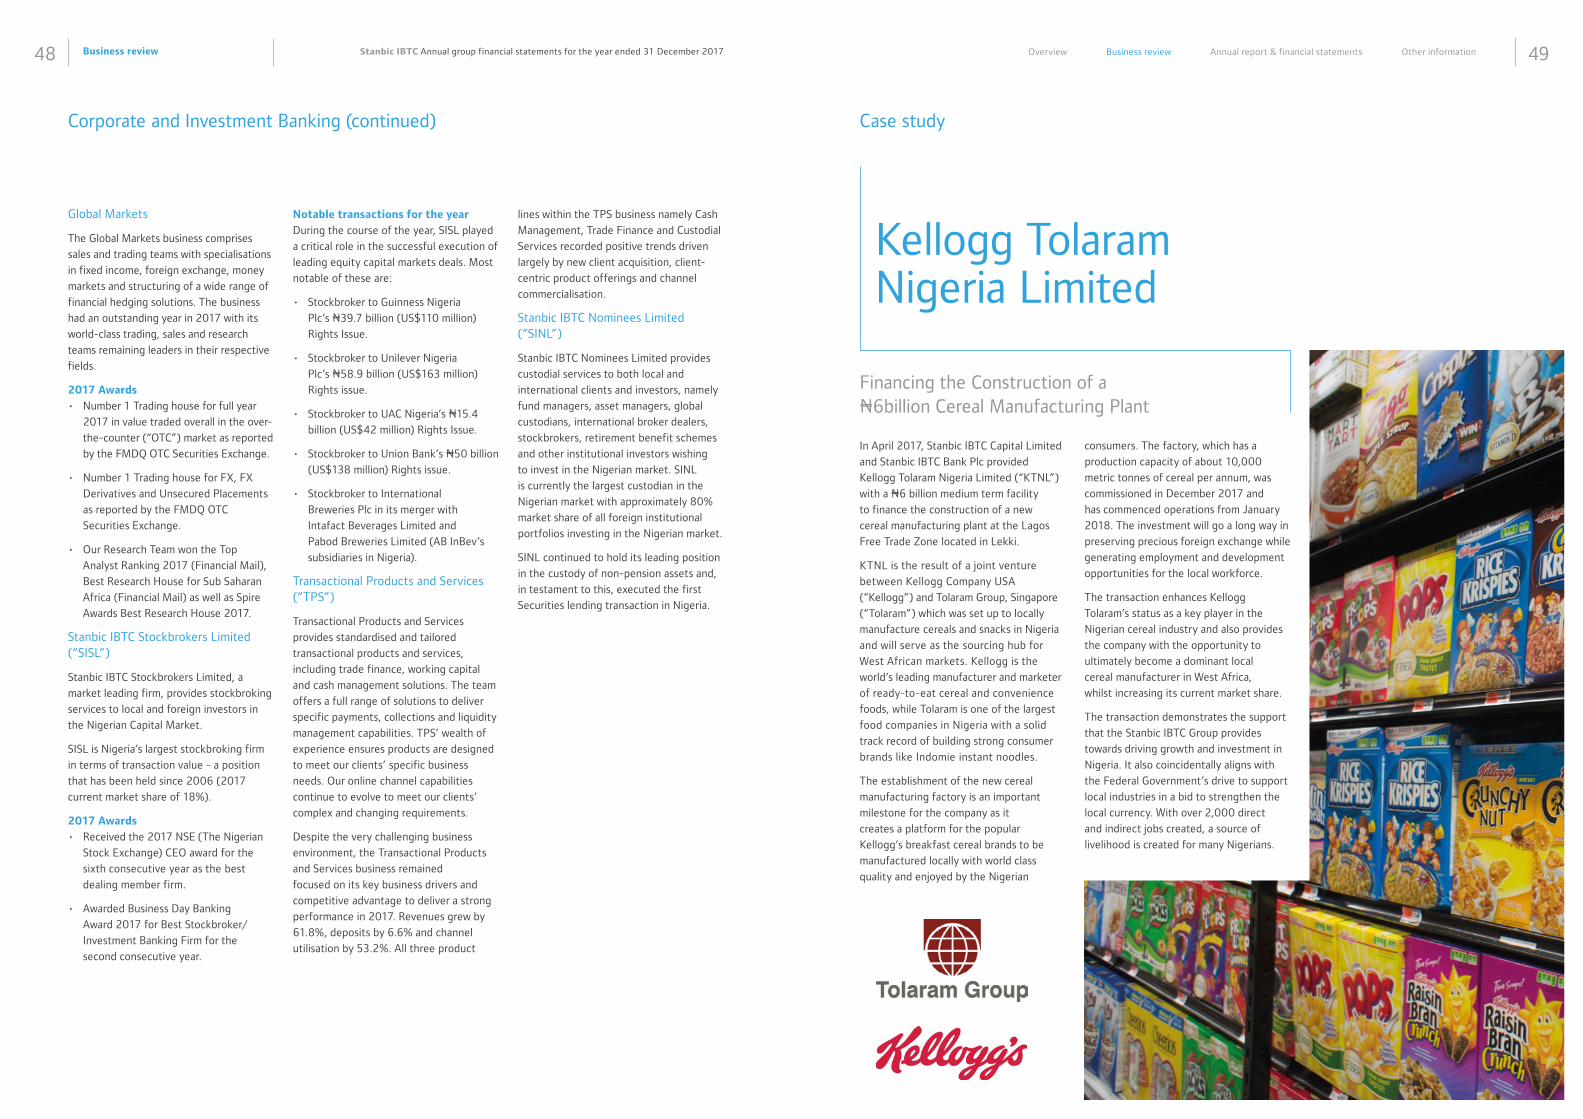
Business review48 49Stanbic IBTC Annual group financial statements for the year ended 31 December 2017 Overview Business review Annual report & financial statements Other information
Corporate and Investment Banking (continued)
Global Markets
The Global Markets business comprises
sales and trading teams with specialisations
in fixed income, foreign exchange, money
markets and structuring of a wide range of
financial hedging solutions. The business
had an outstanding year in 2017 with its
world-class trading, sales and research
teams remaining leaders in their respective
fields.
2017 Awards • Number 1 Trading house for full year
2017 in value traded overall in the over-
the-counter (“OTC”) market as reported
by the FMDQ OTC Securities Exchange.
• Number 1 Trading house for FX, FX
Derivatives and Unsecured Placements
as reported by the FMDQ OTC
Securities Exchange.
• Our Research Team won the Top
Analyst Ranking 2017 (Financial Mail),
Best Research House for Sub Saharan
Africa (Financial Mail) as well as Spire
Awards Best Research House 2017.
Stanbic IBTC Stockbrokers Limited (“SISL”)
Stanbic IBTC Stockbrokers Limited, a
market leading firm, provides stockbroking
services to local and foreign investors in
the Nigerian Capital Market.
SISL is Nigeria’s largest stockbroking firm
in terms of transaction value - a position
that has been held since 2006 (2017
current market share of 18%).
2017 Awards
• Received the 2017 NSE (The Nigerian
Stock Exchange) CEO award for the
sixth consecutive year as the best
dealing member firm.
• Awarded Business Day Banking
Award 2017 for Best Stockbroker/
Investment Banking Firm for the
second consecutive year.
Notable transactions for the year During the course of the year, SISL played
a critical role in the successful execution of
leading equity capital markets deals. Most
notable of these are:
• Stockbroker to Guinness Nigeria
Plc’s N39.7 billion (US$110 million)
Rights Issue.
• Stockbroker to Unilever Nigeria
Plc’s N58.9 billion (US$163 million)
Rights issue.
• Stockbroker to UAC Nigeria’s N15.4
billion (US$42 million) Rights Issue.
• Stockbroker to Union Bank’s N50 billion
(US$138 million) Rights issue.
• Stockbroker to International
Breweries Plc in its merger with
Intafact Beverages Limited and
Pabod Breweries Limited (AB InBev’s
subsidiaries in Nigeria).
Transactional Products and Services (“TPS”)
Transactional Products and Services
provides standardised and tailored
transactional products and services,
including trade finance, working capital
and cash management solutions. The team
offers a full range of solutions to deliver
specific payments, collections and liquidity
management capabilities. TPS’ wealth of
experience ensures products are designed
to meet our clients’ specific business
needs. Our online channel capabilities
continue to evolve to meet our clients’
complex and changing requirements.
Despite the very challenging business
environment, the Transactional Products
and Services business remained
focused on its key business drivers and
competitive advantage to deliver a strong
performance in 2017. Revenues grew by
61.8%, deposits by 6.6% and channel
utilisation by 53.2%. All three product
lines within the TPS business namely Cash
Management, Trade Finance and Custodial
Services recorded positive trends driven
largely by new client acquisition, client-
centric product offerings and channel
commercialisation.
Stanbic IBTC Nominees Limited (“SINL”)
Stanbic IBTC Nominees Limited provides
custodial services to both local and
international clients and investors, namely
fund managers, asset managers, global
custodians, international broker dealers,
stockbrokers, retirement benefit schemes
and other institutional investors wishing
to invest in the Nigerian market. SINL
is currently the largest custodian in the
Nigerian market with approximately 80%
market share of all foreign institutional
portfolios investing in the Nigerian market.
SINL continued to hold its leading position
in the custody of non-pension assets and,
in testament to this, executed the first
Securities lending transaction in Nigeria.
Case study
In April 2017, Stanbic IBTC Capital Limited
and Stanbic IBTC Bank Plc provided
Kellogg Tolaram Nigeria Limited (“KTNL”)
with a N6 billion medium term facility
to finance the construction of a new
cereal manufacturing plant at the Lagos
Free Trade Zone located in Lekki.
KTNL is the result of a joint venture
between Kellogg Company USA
(“Kellogg”) and Tolaram Group, Singapore
(“Tolaram”) which was set up to locally
manufacture cereals and snacks in Nigeria
and will serve as the sourcing hub for
West African markets. Kellogg is the
world’s leading manufacturer and marketer
of ready-to-eat cereal and convenience
foods, while Tolaram is one of the largest
food companies in Nigeria with a solid
track record of building strong consumer
brands like Indomie instant noodles.
The establishment of the new cereal
manufacturing factory is an important
milestone for the company as it
creates a platform for the popular
Kellogg’s breakfast cereal brands to be
manufactured locally with world class
quality and enjoyed by the Nigerian
consumers. The factory, which has a
production capacity of about 10,000
metric tonnes of cereal per annum, was
commissioned in December 2017 and
has commenced operations from January
2018. The investment will go a long way in
preserving precious foreign exchange while
generating employment and development
opportunities for the local workforce.
The transaction enhances Kellogg
Tolaram’s status as a key player in the
Nigerian cereal industry and also provides
the company with the opportunity to
ultimately become a dominant local
cereal manufacturer in West Africa,
whilst increasing its current market share.
The transaction demonstrates the support
that the Stanbic IBTC Group provides
towards driving growth and investment in
Nigeria. It also coincidentally aligns with
the Federal Government’s drive to support
local industries in a bid to strengthen the
local currency. With over 2,000 direct
and indirect jobs created, a source of
livelihood is created for many Nigerians.
Kellogg Tolaram Nigeria Limited
Financing the Construction of a N6billion Cereal Manufacturing Plant
Business review50 51Stanbic IBTC Annual group financial statements for the year ended 31 December 2017 Overview Business review Annual report & financial statements Other information
Case study
Consolidation of Brewery Operations in Nigeria via Merger and US$50 million Debt Financing for Capital Expansion
1. Overall transaction adviser and
financial adviser to Intafact Beverages
Limited and Pabod Breweries Limited;
2. Stockbrokers to International
Breweries Plc; and
3. Sole lender to International Breweries
Plc and Intafact Beverages Limited
Anheuser-Busch InBev SA/NV (AB InBev)
is the largest brewer and multinational
beverage group in the world. Following
AB InBev’s acquisition of SABMiller Plc in
2016, International Breweries Plc, Intafact
Beverages Limited and Pabod Breweries
Limited (the merging companies) became
indirect subsidiaries of AB InBev. The core
business of the merging companies is the
production and distribution of alcoholic
and non-alcoholic beverages in Nigeria.
The intention of the merger was to jointly
create a market leadership position and to
maximise value for stakeholders.
International Breweries, the only listed
company among the three merging
companies, is on The Nigerian Stock
Exchange and has become the top six
listed company by market capitalisation,
up from number 15. The value of the
consideration to shareholders of Intafact
Beverages and Pabod Breweries, in the
form of International Breweries shares,
was US$ 950 million / N291 billion.
This merger has reshaped the competitive
landscape for the Nigerian beverage
sector. It has created the second largest
beer brewer in Nigeria with a combined
installed capacity of 5.65 million
hectolitres. The merger is expected to
lead to administrative efficiencies, cost
reduction and operational synergies
which will be beneficial to shareholders of
the enlarged entity. It also positions the
enlarged company for success in a difficult
competitive market. Tough macroeconomic
conditions in 2016 and 2017 created
significant challenges for FMCG companies
in Nigeria. Consumer purchasing power
declined on account of high inflation and
unemployment. Input and production
costs increased because of challenges
and increased cost of sourcing FX to
buy raw materials.
Stanbic IBTC Capital Limited advised
two of AB InBev’s subsidiaries (Intafact
Beverages Limited and Pabod Breweries
Limited) on their merger with International
Breweries Plc. Stanbic IBTC Stockbrokers
Limited were stockbrokers to International
Breweries Plc.
As overall transaction adviser to the
merger, Stanbic IBTC Capital Limited
supported AB InBev and the merging
entities on key deal parameters and
considerations, including transaction
structuring, regulatory approvals,
shareholder engagement, valuation
and share exchange ratio, and project
management.
In a separate transaction, Stanbic IBTC
Capital Limited and Standard Bank of
South Africa supported AB InBev’s
long term investment plans for Nigeria
by structuring and arranging US$50
million debt financing to fund AB InBev’s
capital expansion and working capital
requirements. AB InBev’s announced
plans for Nigeria include the construction
of a US$250 million brewery in Sagamu,
positioned to be the second largest
brewery in Africa.
This merger and debt financing
transactions represent Stanbic IBTC’s
unique service offering as a full service
corporate and investment bank and
our commitment to assist international
institutions in achieving their strategic
objectives and growing their investments
in Nigeria.
Anheuser-Busch InBev
Business review52 53Stanbic IBTC Annual group financial statements for the year ended 31 December 2017 Overview Business review Annual report & financial statements Other information
Wealth
What we offer
Stanbic IBTC Holding’s Wealth group
comprises four legal entities viz. Stanbic
IBTC Pension Managers Limited (“SIPML”),
Stanbic IBTC Asset Management Limited
(“SIAML”), Stanbic IBTC Trustees Limited
(“SITL”) and Stanbic IBTC Insurance
Brokers Limited (“SIIBL”).
The Wealth franchise being capital light
is focused on annuity type income,
pension administration and management,
private non-pension asset management,
trusteeship and estate planning as well
as insurance brokerage. The businesses
within Wealth underlines SIBTC’s capability
to meet the broader financial needs of
our customers and ensure we provide
protection and preservation of their assets.
It completes the loop in our promise of
being a universal financial services
organisation as we seek to provide solutions
at every stage of an individual’s life.
Overview
Outlined below are the Stanbic IBTC
subsidiaries which make up Wealth;
• Stanbic IBTC Pension Managers Limited
(SIPML) deals with the administration
and management of pension assets,
• Stanbic IBTC Asset Management
Limited (SIAML) deals with the
management of non-pension assets.
Our Wealth & Investment team, experts
who serve as advisors to high net-worth
individuals, sits within this subsidiary.
• Stanbic IBTC Trustees Limited (SITL)
deals with trusteeship and estate
management functions and
• Stanbic IBTC Insurance Brokers Limited
for insurance brokerage and risk
management functions
As at 31 December 2017, Wealth had
N2.71 trillion (US$ 8.62 billion) in assets
under management (“AUM”) and has
remained the leading wealth manager in
Nigeria with the pension business - SIPML
consolidating its pre-eminent position as
the largest Pension Fund Administrator
(“PFA”) in terms of AUM and number of
Retirement Savings Accounts (“RSAs”).
The asset management company, SIAML
also maintained its position as the largest
non-pension assets manager measured by
value of AUM, number and size of mutual
funds and number of customers while
SITL and SIIBL further broadened the
product offering by catering to the needs
of different strata of our clientele with
respect to estate management, trusteeship
and brokerage for various classes of
insurance respectively.
2017 highlights
• Wealth maintained its leading position
as the largest institutional investment
business and number one wealth
manager in Nigeria with assets under
management of N2.71 trillion (US$
8.62 billion).
• Growth of 26% was recorded in
year-on-year net profit.
• Cost efficiency remained stable at
a cost to income ratio of 31.0%.
• Recorded a return on equity (“ROE”)
of 61.8%.
• Stanbic IBTC Money Market fund
defended its position as the largest
mutual fund in Nigeria thereby
maintaining its leadership position.
SIAML now has a market share of
over 40% of the collective investment
schemes (“CIS”) industry.
• SIAML listed a total of nine mutual
funds on The NSE in 2017 to further
improve the visibility of our products.
• The minimum investment amount
for our mutual funds were reduced
to N5,000 and $1,000 for our naira
denominated mutual funds and Stanbic
IBTC dollar fund, respectively, to
accommodate more retail investors.
• Our online platform and mobile app
were upgraded for simpler and more
efficient transaction processing for
mutual fund clients. For instance,
clients can now open instant mutual
fund accounts online and through our
mobile app.
• SIAML also sponsored a workshop for
the adoption of the Global Investment
Performance Standards in Nigeria in a
bid to promote transparency,
professionalism and investor
confidence.
• SITL renamed her flagship estate
planning product, Simple Will to
‘’Legacee’’ after requisite approval
of the patent name registry. This was
done for improved acceptability and a
public launch was also held.
• SITL was appointed joint trustee to the
only Sovereign bond issued in the year.
• SIIBL won significant key mandates
during the year including its
appointment for insurance brokerage
services to the largest shopping Mall
in Nigeria & also large mandates in the
oil & gas sector.
• SIIBL registered a sender ID,
‘’SIBTCInsure’’ with the National
Communication Commission (“NCC”) to
enable us to proactively send automatic
insurance renewal notices to clients. In
addition, a contact centre was set up in
order to improve customer service and
drive our customer centricity strategy.
• Three additional self-service kiosks
were deployed to serve our pension
clients. These were built to enhance
customer experience and ensure easier
accessibility to information by pension
clients. Our customers can also enjoy
self-service for frequently requested
enquiries.
• As part of our customer centricity,
digitisation and cost saving efforts,
we launched an online portal for our
pension clients to submit benefits
applications. Voluntary Contributions
(“VC”) application was used as a pilot
test and the feature is now accessible
to all clients.
• In our bid to drive awareness and
improved education on the contributory
pension scheme, SIPML held employer
forums across six regions (Lagos,
Abuja, Port-Harcourt, Enugu, Ibadan
and Benin). These events were well
attended by up to 3,500 employer
representatives cumulatively.
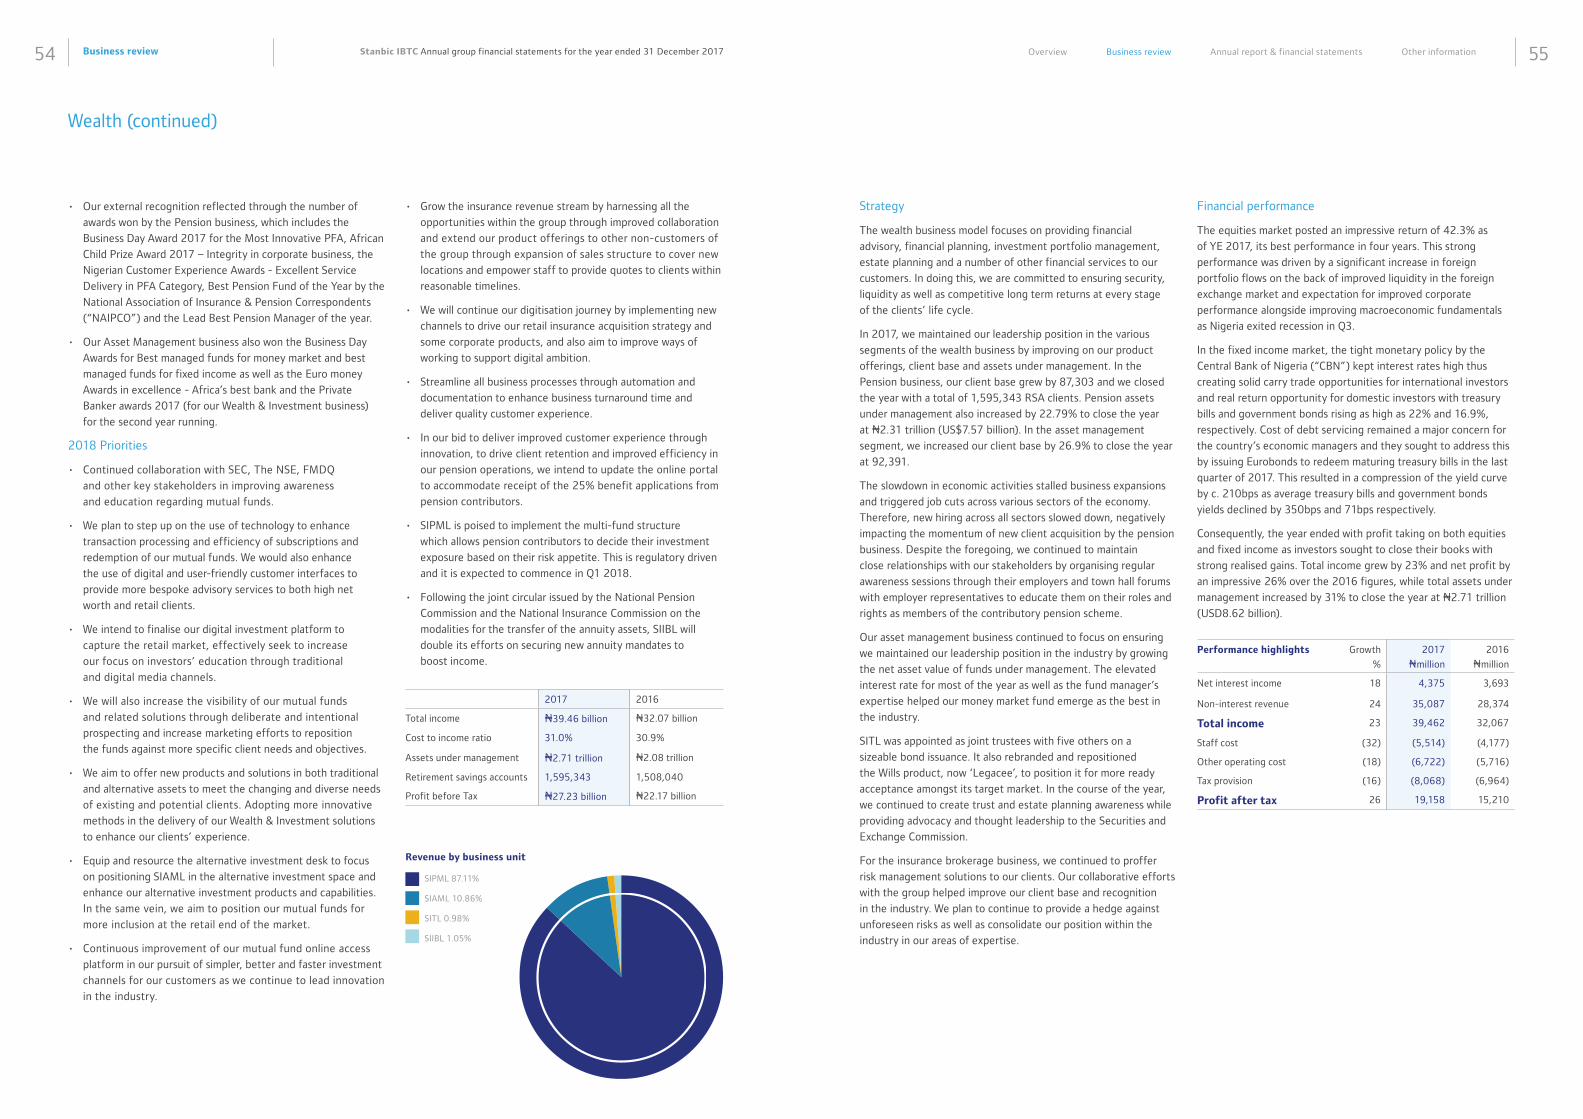
Business review54 55Stanbic IBTC Annual group financial statements for the year ended 31 December 2017 Overview Business review Annual report & financial statements Other information
Wealth (continued)
• Our external recognition reflected through the number of
awards won by the Pension business, which includes the
Business Day Award 2017 for the Most Innovative PFA, African
Child Prize Award 2017 – Integrity in corporate business, the
Nigerian Customer Experience Awards - Excellent Service
Delivery in PFA Category, Best Pension Fund of the Year by the
National Association of Insurance & Pension Correspondents
(“NAIPCO”) and the Lead Best Pension Manager of the year.
• Our Asset Management business also won the Business Day
Awards for Best managed funds for money market and best
managed funds for fixed income as well as the Euro money
Awards in excellence - Africa’s best bank and the Private
Banker awards 2017 (for our Wealth & Investment business)
for the second year running.
2018 Priorities
• Continued collaboration with SEC, The NSE, FMDQ
and other key stakeholders in improving awareness
and education regarding mutual funds.
• We plan to step up on the use of technology to enhance
transaction processing and efficiency of subscriptions and
redemption of our mutual funds. We would also enhance
the use of digital and user-friendly customer interfaces to
provide more bespoke advisory services to both high net
worth and retail clients.
• We intend to finalise our digital investment platform to
capture the retail market, effectively seek to increase
our focus on investors’ education through traditional
and digital media channels.
• We will also increase the visibility of our mutual funds
and related solutions through deliberate and intentional
prospecting and increase marketing efforts to reposition
the funds against more specific client needs and objectives.
• We aim to offer new products and solutions in both traditional
and alternative assets to meet the changing and diverse needs
of existing and potential clients. Adopting more innovative
methods in the delivery of our Wealth & Investment solutions
to enhance our clients’ experience.
• Equip and resource the alternative investment desk to focus
on positioning SIAML in the alternative investment space and
enhance our alternative investment products and capabilities.
In the same vein, we aim to position our mutual funds for
more inclusion at the retail end of the market.
• Continuous improvement of our mutual fund online access
platform in our pursuit of simpler, better and faster investment
channels for our customers as we continue to lead innovation
in the industry.
• Grow the insurance revenue stream by harnessing all the
opportunities within the group through improved collaboration
and extend our product offerings to other non-customers of
the group through expansion of sales structure to cover new
locations and empower staff to provide quotes to clients within
reasonable timelines.
• We will continue our digitisation journey by implementing new
channels to drive our retail insurance acquisition strategy and
some corporate products, and also aim to improve ways of
working to support digital ambition.
• Streamline all business processes through automation and
documentation to enhance business turnaround time and
deliver quality customer experience.
• In our bid to deliver improved customer experience through
innovation, to drive client retention and improved efficiency in
our pension operations, we intend to update the online portal
to accommodate receipt of the 25% benefit applications from
pension contributors.
• SIPML is poised to implement the multi-fund structure
which allows pension contributors to decide their investment
exposure based on their risk appetite. This is regulatory driven
and it is expected to commence in Q1 2018.
• Following the joint circular issued by the National Pension
Commission and the National Insurance Commission on the
modalities for the transfer of the annuity assets, SIIBL will
double its efforts on securing new annuity mandates to
boost income.
2017 2016
Total income N39.46 billion N32.07 billion
Cost to income ratio 31.0% 30.9%
Assets under management N2.71 trillion N2.08 trillion
Retirement savings accounts 1,595,343 1,508,040
Profit before Tax N27.23 billion N22.17 billion
SIPML 87.11%
SIAML 10.86%
SITL 0.98%
SIIBL 1.05%
Revenue by business unit
Strategy
The wealth business model focuses on providing financial
advisory, financial planning, investment portfolio management,
estate planning and a number of other financial services to our
customers. In doing this, we are committed to ensuring security,
liquidity as well as competitive long term returns at every stage
of the clients’ life cycle.
In 2017, we maintained our leadership position in the various
segments of the wealth business by improving on our product
offerings, client base and assets under management. In the
Pension business, our client base grew by 87,303 and we closed
the year with a total of 1,595,343 RSA clients. Pension assets
under management also increased by 22.79% to close the year
at N2.31 trillion (US$7.57 billion). In the asset management
segment, we increased our client base by 26.9% to close the year
at 92,391.
The slowdown in economic activities stalled business expansions
and triggered job cuts across various sectors of the economy.
Therefore, new hiring across all sectors slowed down, negatively
impacting the momentum of new client acquisition by the pension
business. Despite the foregoing, we continued to maintain
close relationships with our stakeholders by organising regular
awareness sessions through their employers and town hall forums
with employer representatives to educate them on their roles and
rights as members of the contributory pension scheme.
Our asset management business continued to focus on ensuring
we maintained our leadership position in the industry by growing
the net asset value of funds under management. The elevated
interest rate for most of the year as well as the fund manager’s
expertise helped our money market fund emerge as the best in
the industry.
SITL was appointed as joint trustees with five others on a
sizeable bond issuance. It also rebranded and repositioned
the Wills product, now ‘Legacee’, to position it for more ready
acceptance amongst its target market. In the course of the year,
we continued to create trust and estate planning awareness while
providing advocacy and thought leadership to the Securities and
Exchange Commission.
For the insurance brokerage business, we continued to proffer
risk management solutions to our clients. Our collaborative efforts
with the group helped improve our client base and recognition
in the industry. We plan to continue to provide a hedge against
unforeseen risks as well as consolidate our position within the
industry in our areas of expertise.
Performance highlights Growth
%
2017
Nmillion
2016
Nmillion
Net interest income 18 4,375 3,693
Non-interest revenue 24 35,087 28,374
Total income 23 39,462 32,067
Staff cost (32) (5,514) (4,177)
Other operating cost (18) (6,722) (5,716)
Tax provision (16) (8,068) (6,964)
Profit after tax 26 19,158 15,210
Financial performance
The equities market posted an impressive return of 42.3% as
of YE 2017, its best performance in four years. This strong
performance was driven by a significant increase in foreign
portfolio flows on the back of improved liquidity in the foreign
exchange market and expectation for improved corporate
performance alongside improving macroeconomic fundamentals
as Nigeria exited recession in Q3.
In the fixed income market, the tight monetary policy by the
Central Bank of Nigeria (“CBN”) kept interest rates high thus
creating solid carry trade opportunities for international investors
and real return opportunity for domestic investors with treasury
bills and government bonds rising as high as 22% and 16.9%,
respectively. Cost of debt servicing remained a major concern for
the country’s economic managers and they sought to address this
by issuing Eurobonds to redeem maturing treasury bills in the last
quarter of 2017. This resulted in a compression of the yield curve
by c. 210bps as average treasury bills and government bonds
yields declined by 350bps and 71bps respectively.
Consequently, the year ended with profit taking on both equities
and fixed income as investors sought to close their books with
strong realised gains. Total income grew by 23% and net profit by
an impressive 26% over the 2016 figures, while total assets under
management increased by 31% to close the year at N2.71 trillion
(USD8.62 billion).
Business review56 57Stanbic IBTC Annual group financial statements for the year ended 31 December 2017 Overview Business review Annual report & financial statements Other information
Wealth (continued)
Looking forward
The global economy is expected to
experience sustained growth in 2018 while
central banks of developed economies
are expected to be less accommodative.
Africa’s key trading partners such as China
and India are expected to grow at 6.50%
and 7.40% in 2018 with positive tailwinds
expected for Sub-Saharan Africa as
stronger external demand should support
commodity prices whilst cyclical recoveries
in oil and agriculture would bolster growth
across a number of countries. Similarly,
the rebound in growth in Nigeria is
expected to pick up pace in 2018 as oil
production recovers, oil prices remain
stable (forecasted to average $59pb in
2018) and government revenues continue
to improve. The key risks to this outlook
are: inclusion of Nigeria in OPEC’s output
cut and resurgence of militant activities in
the delta. Political risk will also remain in
the short term, being a pre-election year,
a period when horse-trading from interest
groups usually takes place. However, in the
medium to long term, sustained efforts to
diversify government FX revenues away
from oil will be key to achieving sustained
capital investment and development.
The 2018 proposed budget of N8.6 trillion
seeks to consolidate on the gains of 2017,
which focused on recovery and growth.
While remaining in line with the Medium
Term Expenditure Framework (MTEF 2018
– 2020), the revenue targets of the budget
seem ambitious partly due to assumptions
used. In addition to seeming unrealistic
assumptions made on the exchange rate
and revenue generation, real GDP growth
is forecasted at 3.5%, significantly higher
than market expectations of over 2%.
With a budget deficit target of N2.0
trillion, the government would have to
strike the right balance between funding
the budget deficit and its goal of lowering
debt servicing costs.
Monetary policy is expected to ease
slightly as the CBN strives to maintain
the handle on inflationary pressures and
Foreign Exchange stability in a pre-
election year. We therefore expect rates
to stay around the mid-teens during the
year. Furthermore, we expect the easing
in monetary policy to also create opening
for corporate issuances at attractive
levels when compared with government
securities.
In equities, we will seek for opportunities
to increase equity allocation in funds
with regular inflow patterns and a long
term outlook thus taking full advantage
of rising economic growth, opportunity
to outperform inflation and accumulate
wealth for beneficiaries of such funds.
Thus, we will focus on companies best
positioned to deliver earnings growth
and strong market performance in the
current phase of the economic cycle.
Fixed income continues to provide income
and liquidity opportunity for funds. Given
our positioning in duration coming into the
year, we would remain focused on taking
advantage of opportunities to boost total
return as they become available.
We will continue to engage actively
with SEC & FMAN to improve
transparency, reporting standards and
investor confidence in the capital
market. We would also aim to expand
the investment universe in order to meet
our clients’ objectives.
We aim for increased investments in
digital solutions to deliver exceptional
client experience while leveraging on
Standard Bank group’s knowledge
sharing platforms and networks for our
alternative investment team.
We keep driving for growth in pension
assets via an increased awareness of
the benefits of contributions into the
scheme through education for employer
compliance, conversion of un-funded
accounts and special focus for new
businesses from contributing employers.
We will also continue to follow up with
employers for pension remittances as it
is in the best interest of our clients and
plan more employer town hall sessions in
2018 to allow for more direct stakeholder
engagement.
The trustees’ business will consolidate on
its mandate acquisition drive for lucrative
transactions with worthwhile revenues
in its attempt to significantly move the
dial and earn appreciable income to
ensure it meets and exceeds its financial
targets. It will be aided by its revamped
outlook, organisational re-design, strategy
adjustment and competency review to
ensure fit for purpose structure and
optimal results.
Improved visibility of our Wealth &
Investment offering with deliberate
collaboration with the group is also
expected to improve as we focus more
on client centricity so our clients can
extract the best value from our universal
offering. We will offer strategic, tailor-
made responses to each client’s need
as we proffer the right solutions and
thoughtful client engagement to ensure
they remain clients for life.
We aim to continue SIIBL’s digitisation
journey with an online sales platform
(subject to regulatory considerations) to
drive retail sales. We also plan to expand
the sales structure to include a sales
agency to enable wider coverage so that
our sales staff will be stationed closer
to source of business and positioned to
work closely with various business units
across Stanbic IBTC subsidiaries. We will
continue in our drive to position the
insurance brokerage business as the firm
of choice and ensure a mutually beneficial
partnership with our key internal and
external stakeholders.
We will stay ready for regulatory changes
which have been highly anticipated in prior
years such as the opening of the much
awaited transfer window in the pension
industry, commencement of the micro
pension scheme and implementation of the
guideline on withdrawal from RSA towards
equity contribution for a mortgage. Despite
the sustained recession for the most part
of 2017 and the resultant challenges, we
will remain steadfast to our core values
and policies which will guide our decisions
throughout the course of the year.
We will continue to focus on positioning the
group as an end-to-end financial services
organisation by collaborating purposefully
with other Stanbic IBTC subsidiaries thus
delivering the entire group to both existing
and new clients. We will leverage on the
group’s position across the value chain of
financial services to deepen existing client
relationships as we unearth opportunities
that will drive real progress for our clients.

Business review58 59Stanbic IBTC Annual group financial statements for the year ended 31 December 2017 Overview Business review Annual report & financial statements Other information
Introduction from the Chief Executive
In 2017, the Nigerian financial services
industry took further steps towards
digitalisation. Data provided by the
Central Bank of Nigeria (“CBN”) showed
a significant uptake in electronic banking.
Competition for e-banking market share
from Financial Technology (“FinTech”)
companies rose with provision of
e-solutions as new players entered the
market. However, banks continue to adopt
newer and better solutions to simplify their
operations and remain nimble.
It was a significant year for the Stanbic
IBTC Group. Following the resolution of
the long-drawn issue with the Financial
Reporting Council of Nigeria late in 2016,
we were able to release our outstanding
financial reports as well as hold our 4th
(2015) and 5th (2016) AGMs. There
was also a change at the board and
management levels. The founder and
chairman, Atedo Peterside, resigned to
take up a new role in the mother brand,
Standard Bank Group of South Africa,
while the Chief Executive of the holding
company, Sola David-Borha, was elevated
to a bigger role as Chief Executive (Rest
of Africa) at the Standard Bank Group.
We continued to be at the forefront of
innovation and experienced some positive
transformational changes and developed
further competencies in other segments
of the financial services industry, like in
retail and personal banking, outside our
well-honed competencies in investment
banking and wealth management. We were
equally able to provide significant support
to government’s fund raising efforts to
finance the 2017 national budget deficit.
We were instrumental to government’s
successful Eurobond Programmes,
Diaspora Bond issue, and FGN Savings
Bond programme and their listing on
both The Nigerian Stock Exchange and
the FMDQ OTC Securities Exchange for
secondary trading.
We realised that our success as a business
is dependent on the success of the
individuals and businesses we serve and
on the economy where we operate from.
Therefore, we are mindful to develop
relevant solutions that not only ensure
Sustainability Report 2017
our success but guarantee the success of
government, businesses and individuals.
We pride ourselves on our rich pedigree
in financial innovation, drawn from our
Standard Bank heritage, which has enabled
us provide solutions that have enhanced
the quality of life of individuals and
boost their financial security; facilitate
business expansion, economic growth
and development in key sectors like oil
and gas, manufacturing, agriculture,
power, healthcare, and real estate, among
others. Our business strategy is to offer
banking services to assist our internal and
external stakeholders manage social and
environmental challenges and invest for
the future. We work hard to build trust in
our operations and establish partnerships
that will be beneficial in the long term.
This Sustainability Report details
our corporate social investments,
environmental and social risk management
and performance as well as our shared
values in 2017. Our priority, going
forward, will be to ensure financial, social
and environmental sustainability in our
operations. We not only want to achieve
financial outcomes, but we also want to
fulfill our purpose of driving the growth
of our economy.
Stanbic IBTC Corporate Profile
Stanbic IBTC Holdings is a full service
financial institution which offers a wide
range of products to a variety of segments.
Stanbic IBTC provides end-to-end
financial solutions which include corporate
and investment banking, personal and
business banking, stockbroking and wealth
management.
Standard Bank Group, to which Stanbic
IBTC belongs, is the largest African bank
by assets with a unique footprint across 20
African countries, including South Africa,
and 12 countries outside Africa, including
key financial centres in Europe, United
States and Asia. Standard Bank has been
in operation for over 154 years and prides
itself on being a global bank with African
roots.
Stanbic IBTC Holdings aims to position
itself as the leading end-to-end financial
services solutions provider in Nigeria in
consonance with our brand and vision
“To be the leading end-to-end financial
solutions provider in Nigeria through
innovative and customer-focused people.”
The group offers expert services in three
business areas - Corporate and Investment
Banking; Personal and Business Banking
and Wealth Management.
We do everything in our power to ensure
that we provide our clients with the
products, services and solutions to suit
their needs, provided that everything we
do for them is based on sound business
principles. We uphold high standards of
corporate governance and are committed
to advancing the principles and practice
of sustainable development. Our success
and growth over the long term is built on
making a difference in the communities in
which we operate.
Stanbic IBTC Holdings has nine
subsidiaries:
• Stanbic IBTC Bank (including Stanbic
IBTC Bureau de Change Ltd and Stanbic
IBTC Nominees Limited)
• Stanbic IBTC Pension Managers Limited
• Stanbic IBTC Asset Management
Limited
• Stanbic IBTC Stockbrokers Limited
• Stanbic IBTC Trustees Limited
• Stanbic IBTC Ventures Limited
• Stanbic IBTC Capital Limited
• Stanbic IBTC Investments Limited
• Stanbic IBTC Insurance Brokers Limited
Our Approach to Sustainability
Our approach to sustainability begins
with our objective to operate an ethical,
professional, accountable and profitable
business. This is couched in our three-
pronged sustainability framework
document. We designed the SEE (Social,
Economic and Environmental) framework
to ensure we support the wellbeing of
communities by delivering value through
the products and services that we provide.
We have a commitment to contribute
to sustainable development. This
commitment is embedded in our core
Business review60 61Stanbic IBTC Annual group financial statements for the year ended 31 December 2017 Overview Business review Annual report & financial statements Other information
Sustainability Report 2017 (continued)
values of integrity, professionalism and
respect for both internal and external
stakeholders as outlined in the SEE
framework.
In implementing the Nigerian Sustainable
Banking Principles in our business activities
and operations, Stanbic IBTC is under the
following three pillars.
• Credit
• Group Real Estate Services (“GRES”)
• Procurement
Credit: Integrate Environmental and Social
Considerations into Credit Decision Making
process by ensuring on boarding of new
business opportunities are E&S compliant
and follows approved credit process,
policy and guidelines for Corporate and
Investment Banking (‘CIB”) and Business
Banking (“BB”).
GRES: Monitor our ecological
footprints with respect to the impact of
our business operations, in terms of Power
maximisation, waste management, carbon
emissions, energy and water efficiency and
building designs and architecture that are
green.
Procurement: Assess, develop and
screen suppliers with a view to ensuring
the sustainability of our vendors and their
ability to meet our procurement needs and
also assist them in mitigating social and
environmental costs.
Corporate Governance
Creating thriving partnerships
Stanbic IBTC has a strong governance
structure, with distinct roles and
responsibilities between the board and
management. These roles are governed by
clearly marked policies and controls. Our
work is governed by internal and external
regulations as well as international best
practices. Corporate governance is a key
part of our entire operation in evaluating,
approving, and monitoring of projects.
Our major CSI objectives remain: support
for strategic and credible projects, in line
with business objectives; deploy scalable
solutions that are beneficial to a higher
number of people; work with credible
partners; and leverage existing business
opportunities.
The Chief Executive of the Group has the
overall responsibility for sustainability
accountability, supported by an executive
committee. However, care is taken to
ensure decisions are cascaded from the
top management level to the individual
employee.
Corporate Social Investment: Business
and Societal Needs
Our priority is to ensure financial, social
and environmental sustainability. Through
our social investments, we hope to boost
the Stanbic IBTC brand reputation,
increase our market share and improve
employee relations in a way to enhance
our long term competitiveness.
For maximum impact, we identified,
using a research-based approach and
by engaging with our stakeholders,
including communities, governments
and individuals, the critical needs of our
business environment. These needs fall
under Education, Health and Economic
Empowerment and form the tripod upon
which our Corporate Social Investment
activities rest. The convergence of
social investment goals and business
helps engender long term benefits and
sustainability.
Sustainable Lending
In providing credit facilities to
conglomerates, multinationals, small and
medium scale enterprises, we continue to
review the environmental and social (E&S)
risk considerations embedded in our credit
approval process. This entails the screening
of credit transactions for E&S risks, as well
as monitoring their activities to ensure our
clients carry out their operations in line
with acceptable environmental and social
standards.
From January 2017, we have assessed
about 330 Business Banking credit
transactions for E&S risks. In our
Corporate and Investment Banking
business, 36 approved credit transactions
were assessed for E&S risks. We also
take pride in providing credit facilities
to Business Banking clients for
environmentally beneficial purposes.
As of June 2017, we had approved credit
facilities of about $2.2million for this area.
Beneficiaries of our sustainable lending
include Dangote Refinery, Indorama Eleme
Petrochemical, Kellogs Tolerams, Lekki
Concession Company, and Presco, among
others.
Environmental and Social Risk
Management
Stanbic IBTC acknowledges that the
development of a corporate culture
whereby environmental sustainability
principles are adhered to both in
its operating environment and with
counterparties is crucial to sustainable
development.
Our impacts on society and the
environment can be both indirect,
arising from the activities of our customers
who we finance, and direct through our
day-to-day operational activities and
the products and services we provide.
These are either internal, affecting
employees or the organisation, or external,
affecting communities, customers,
partners and regulators, among others.
Thus, we go beyond compliance in our
approach to environmental and social risk
management. This approach has helped
us achieve best practice performance
through sound governance structures
and policies, monitoring mechanisms,
strategic partnership, energy efficient
and renewable energy programmes,
supplier development and screening,
employee training and awareness,
products and services that help reduce
carbon emission and green building design.
In line with regulatory stipulation, Stanbic
IBTC complies with the Nigeria Sustainable
Banking Principles (“NSBP”) and through
the Standard Bank Group is a signatory
to the Equator Principles, thereby
adopting international best practice
in Environmental and Sustainability
standards. We adopt a precautionary
approach to environmental management,
striving to anticipate and prevent
environmental degradation in line with
the guidelines set out in the Equator
Principles and the provisions of the
Environmental Laws of Nigeria.
Awareness Creation
Our awareness creation drive increased
across our stakeholder groups, in the
implementation of NSBP. Following the
NSBP adoption, a total of 120 employees
received introductory environmental and
social risk training in 2015 and several
others in 2016. This number rose across
our business units in 2017.
Benefits of Environmental
and Social Risk Management
Appropriately and efficiently managed
environmental and social risks and
opportunities will enhance our:
• Overall risk management which in turn
reduces costs and liabilities;
• Ability to access capital and attract
foreign investors and partners;
• Financial and non-financial
performance;
• Brands and reputations at the individual
organisation as well as sector level;
• Operational efficiencies;
• Ability to attract and retain talents;
• Relationships with our clients by
becoming a trusted advisor; and
• Growth prospects by reaching new
markets and innovating new products
and services.
Empowering our People
We expect an increasingly productive
and highly motivated workforce, one that
constantly exceeds the expectations of
customers. We are continuously engaging
our employees to ensure their growth
through leadership trainings and skills
acquisition, a diversified and conducive
work environment, and well-structured
compensation policy. Higher levels
of employee engagement are linked
to lower levels of absenteeism and
employee turnover. In 2017, employees
formed an important part of our CSI,
helping to create awareness and actively
participating in chosen initiatives,
individually and as a team.
Our organisation is very sensitive to gender
parity and inclusion. As a result, we have
initiatives targeted at the wellbeing and
advancement of women in business and in
paid employment.
• The Stanbic IBTC Blue Women Network
is a platform for female employees of
Stanbic IBTC across all cadres, which
provides opportunities for networking,
development and growth. By default,
all women who join our organisation
become crucial members of the
network.
We also ensure that staff policies targeted
at our female employees address their
needs.
Health
Our employees remain at the heart
of our business; and we believe that
their wellbeing is important to enable
us deliver our promises to our clients
and stakeholders as an organisation.
Therefore, we take matters concerning
their wellbeing to heart and have invested
in a number of wellness programmes to
encourage healthy lifestyles for them.
The wellness initiatives include:
• Weekly on-site aerobics in our four
head office campuses across the group;
• Physical activities encouraged in all
our offices, including our branches
nationwide; these are group walks and
daily exercise-at-the-desk routine for
all employees.
To also encourage physical exercise, we
have instituted a no-lift-day once a week
across the organisation, when staff are
encouraged to opt for the staircases rather
than use the lift.
For our external stakeholders, one of
the key pillars of our CSI initiative is in
the health sector. We have consistently
partnered with an NGO Slum2School to
create awareness on the scourge of malaria
as well as distribute mosquito treated nets
to indigent school children and pregnant
women in underserved and malaria prone
communities. Through our signature CSI
initiative, Together4 A Limb, we provide
prostheses for children with limb losses
as well as replacing these limbs annually
until they are 18 years. So far, we have
20 beneficiaries.
Being an ardent supporter of persons
living with prostheses, our organisation
has constructed wheelchair access ramps
in 33 branches and our major head office
campuses across the group to facilitate
access of physically challenged persons
into our office locations.
We will continue to explore ways to
alleviate the difficulties encountered
by the physically challenged for a more
inclusive banking experience for all our
customers.
Education
Education, through knowledge and skills
acquisition, is an essential ingredient for a
productive workforce. As a result, we are
continuously engaging our employees to
ensure their growth through leadership
trainings and skills acquisition, to
complement a diversified and conducive
work environment, and well-structured
compensation policy.
We continue to invest in the educational
advancements of our communities through
our CSI Initiatives such as the Mentor-a-
Class project, where staff members take
a day off to engage school children in our
adopted school, Lagos Progressive School,
Surulere, on financial literacy, leadership
and analytical skills, among others. Under
our staff volunteerism initiative, a block of
six classrooms was donated to the National
Orthopaedic Special School, Igbobi, Lagos
by the Operation Shared Services Team.
The children we fitted with artificial
limbs were also awarded Stanbic IBTC
Educational Trusts to give them a better
chance at success in life.
Business review62 63Stanbic IBTC Annual group financial statements for the year ended 31 December 2017 Overview Business review Annual report & financial statements Other information
Economic Empowerment
At Stanbic IBTC, we apply sustainable
principles that drive the growth and
development of the industries we finance
and communities in which we operate in. It
gives us satisfaction to deliver value to the
communities we serve by contributing to
their social, economic and environmental
(“SEE”) wellbeing through the services
we provide. Our aim is to improve life for
everyone in Nigeria and beyond. We not
only want to achieve financial outcomes,
but we also want to fulfil our purpose of
driving the country’s growth.
We made donations to orphanages, we
have also made donations to widows
through the Human Development
Initiatives. We have initiatives targeted at
the wellbeing and advancement of women
in business and paid employment in a way
to ensure gender parity and inclusion.
As of June 2017, we had successfully
empowered businesses owned by women
through lending amounting to about
16% of the total loan portfolio for
Stanbic IBTC Bank.
Sustainability Practices
Stanbic IBTC is a member of the
Nigerian Conservation Fund which
supports sustainability related causes.
Our membership further attests to
our commitment to maintain a robust
operation focused on environmental
education, biodiversity conservation,
policy advocacy, public sensitisation
on environmental issues, mitigating
environmental pollution and poverty
reduction.
Our key sustainability practices include:
1. Energy efficiency in operations
Replenishing our sources of energy
remains an important aspect for the
growth of our economy. As a result of this,
we have embarked on energy efficiency
initiatives across Stanbic IBTC Group.
These include:
• Operation Switch Off and UnPlug
(“SOUP”) initiative which encourages
staff members to switch off and unplug
electronic devices at close of business.
• Switch-off initiative which aims to save
energy consumed by elevators and
central air conditioners in our head
office campuses. We also turn-off
power at 6pm in our branches. This
initiative also encourages work-life
balance among our employees, who
remain the drivers of our business.
• Installation of energy saving LED bulbs
across our bank branches and head
office campuses for reduced energy
consumption.
• Installation of motion sensors in
buildings for the control of power.
Use of alternative sources of power for
ATMs and branches – Our Festac and Katin
Kwari branches are partly powered by solar
energy; while ten (10) offsite ATMs are
also powered by alternative sources.
2. Paper reduction and recycling
Across the group, we strive to bring
unnecessary printing to a minimum and
reduce paper usage in our business
operations. As at August 2017, we had
successfully reduced our year-to-date
paper usage (for printing and photocopy)
across the bank by about 30 percent
compared to the same period in 2016.
Measures taken include:
• Installation of Follow-Me Printing on
Printers
• Setting printers to Double Sided
printing by default
• Recycling of paper for printing
• The use of shared folders to document
storage as against printing
• Eliminated the use of paper in 12
branch processes
We are also supportive of paper recycling
and have recently worked with partners
to recycle over nine (9) tons of archived
paper in exchange for tissue papers that
will be used in our offices.
These initiatives serve as one of the
ways we contribute to the reduction in
tree-felling for paper production. A more
balanced ecosystem is achievable if such
practice is encouraged by organisations.
3. Green Branches
In addition to our printing reduction and
paper recycling initiatives, we are also
piloting ‘Green Branches’ within our
organisation where additional sustainability
initiatives and processes will be driven. Our
aim is to run operations in these branches
that ensure minimal paper use, increased
energy and water efficiency.
4. Tree planting in Zaria branch
In line with efforts targeted at preventing
desert encroachment, especially in the
northern part of Nigeria, a substantial part
of our Zaria Branch is being landscaped to
provide greenery and shade for our staff
and customers who use the location.
5. Waste segregation
To address issues of environmental
degradation resulting from indiscriminate
and inappropriate disposal of waste, the
group continues to invest in solid waste
segregation and recycling initiatives
involving the sensitisation of staff and
customers on the need to separate
solid waste for further recycling. The
deployment of waste bins designed for
segregation of solid waste are ongoing in
our head office campuses.
6. Water utilisation
We have implemented eco-friendly water
utilisation measures to reduce wastage by:
• Installing toilet systems with dual flush
knobs
• Installing of taps with motion sensors
in restrooms and kitchens
As a responsible corporate citizen, we
will continue to carry out our business
operations in ways that minimise
any negative social, economic and
environmental impact. We will continue
to review our operational processes and
engage our key stakeholders to achieve
as much involvement in our sustainability
initiatives as possible, for the benefit of
the communities we operate in.
Sustainability Report 2017 (continued)
Employee Volunteerism
At Stanbic IBTC, our vision recognises that
our people are our most important asset,
which makes it imperative to inspire and
engage employees in ongoing CSI efforts
to make a meaningful impact. We see
our employees as our partners in all our
sustainability initiatives. By doing this, not
only do we succeed in getting their active
involvement, but also benefit from the fact
that employees gain a lot of valuable skills
and experiences which make them a better
asset to our organisation.
The sustainability of an idea needs
everyone in every title to be aligned to
our mission of moving forward. We believe
our people and culture will determine our
success in executing our strategy, which
includes our CSI. Our business philosophy
is anchored on and vested in building
relationships and trust with our clients/
customers, employees, shareholders,
regulators, communities and other key
stakeholders. Our values underpin our
legitimacy and are intended to reinforce
the trust our stakeholders have in our
organisation. As such, we endeavor to
carry along and get the buy in of all our
internal and external stakeholders.
We have a culture of staff involvement
and participation in our social investment
initiatives which means that our staff are
not only part of the activation but the
entire process of identifying key areas
where we choose to support, collaborate
or invest. We try as much as possible to
encourage our staff to either as teams or
units voluntarily contribute and participate
through departmental CSI activities.
This initiative has been hugely successful
over the past year. Through staff CSI
volunteerism or contribution alone,
we invested over a N100 million towards
various charitable causes under the health,
education and economic empowerment
portfolios in 2017. Under our staff
volunteerism initiative, a block of
six modern classrooms was built and
donated to the National Orthopaedic
Special School, Igbobi, Lagos.
Sponsorships
Development is key to our deciding
on what sponsorships we undertake.
We continue to identify credible and
impactful initiatives that are compliant
with our sustainability policy to
support through sponsorships. And
our sponsorships cut across the broad
spectrum of sectors which we serve, to
reflect our end-to-end financial services
credentials.
Through our Fine-Arts-and-The-Acts,
Stanbic IBTC is recognised as an active
sponsor and supporter of the creative
industry. The overriding objective of
our arts sponsorship programme is to
nurture and promote the development
of the creative industry, encouraging
engagement and social interaction.
We also sponsored the ArtX Lagos
and the Eat Drink Lagos.
Standards and Codes
Stanbic IBTC’s business sustainability and
international best practices continue to
attract commendations, recognitions and
revalidation through various awards and
certifications.
Stanbic IBTC Bank PLC and its holding
company, Stanbic IBTC Holdings PLC,
both recorded AAA(nga) national
long-term ratings by Fitch Ratings,
which provide a relative measure of
creditworthiness for rated institutions.
According to Fitch Ratings, “AAA is
the highest credit quality. They are
assigned only in cases of exceptionally
strong capacity for payment of financial
commitments. This capacity is highly
unlikely to be adversely affected by
foreseeable events.” Fitch said triple
A “denotes the lowest expectation of
default risk” while the F1+ “indicates
the strongest intrinsic capacity for timely
payment of financial commitments.”
Such regular ratings provide an idea of
the credit worthiness of the institutions
so rated.
The Stanbic IBTC Blue Academy was
accredited by the banking industry
umbrella body, the Chartered Institute of
Bankers of Nigeria, and certification issued
to validate its training standard.
Awards
The stockbroking arm of the Group, Stanbic
IBTC Stockbrokers Limited, received The
Nigerian Stock Exchange CEO award as
the best dealing member firm in 2017,
for a high-performance culture, the sixth
consecutive time it would win the award.
Business review64 65Stanbic IBTC Annual group financial statements for the year ended 31 December 2017 Overview Business review Annual report & financial statements Other information
Enterprise risk review
Overview
Risk Management’s objective continues
to align with the group’s strategic focus
“to be the leading end-to-end financial
solutions provider in Nigeria through
innovative and customer-focused people”.
Effective risk management is fundamental
and essential to the achievement of the
group’s strategic objectives. It is also one
of the pillars of the institution’s strategic
value drivers, which entails supporting
our clients by doing the right business
the right way and maintaining the highest
possible standards of responsible business
practice using the right frameworks that
align with regulatory expectations and
standard business practices as well as
procedures.
The Group Risk function continues its
oversight and advisory responsibilities by
deploying a consistent, comprehensive and
strategic approach to the identification,
measurement, management and reporting
of enterprise-wide risks across the group.
This is executed through proactive risk
management practices which ensure
that the business maintains the right
balance in terms of the risk-return trade
off whilst limiting the negative variations
that could impact the group’s capital,
earnings, risk assets and appetite levels
in a constantly changing and dynamic
operating environment. Furthermore,
Group Risk continues to shape, drive and
monitor the activities relating to risk and
conduct in the institution through various
measures, including strengthening the
risk and control environment, monitoring
risk appetite and governance standards
across the institution and elevating
risk awareness by deploying requisite
compliance training programme for all
Stanbic IBTC employees with a standard
process of monitoring and escalating
deficiencies in meeting the required
standards. This is also in line with the
established code of conduct and ethics
that all members of staff must adhere and
attest to on an annual basis.
The Board sets the tone and risk appetite
for the organisation, including the
tolerance levels for key risks. These risks
are however managed in accordance with a
set of governance standards, frameworks
and policies which align with the global
best practices.
The overarching approach to managing
enterprise-wide risk is based on the
“Three Lines of Defense” principle which
requires the first line (Business risk
owners) to appropriately demonstrate
ownership and accountability for risks
and manage same closest to the point
of incidence; second line (including Risk,
Compliance, and Internal Control) to
review and challenge as well as provide
oversight and advisory functions; and
the third line (Internal Audit) to conduct
assurance that control processes are fit for
purpose, are implemented in accordance
with standard operating procedures, and
operating effectively or as intended.
Risk management framework
Approach and structure
The group’s approach to risk management
is based on governance processes that
rely on both individual responsibility and
collective oversight that is supported
by a tailored Management Information
System (“MIS”). This approach balances
corporate oversight at senior management
level with independent risk management
structures in the business where the
business unit heads, as part of the first line
of defense, are specifically responsible
for the management of risk within
their businesses using appropriate risk
management frameworks that meet
the required group minimum standards.
An important element that underpins the
group’s approach to the management of
all risk is independence and appropriate
segregation of responsibilities between
Business and Risk. Risk officers report
separately to the Head of Risk who
reports to the Chief Executive of Stanbic
IBTC Bank and also through a matrix
reporting line to the Standard Bank
Group (“SBG”).
All principal risks are supported by
the Risk Management department.
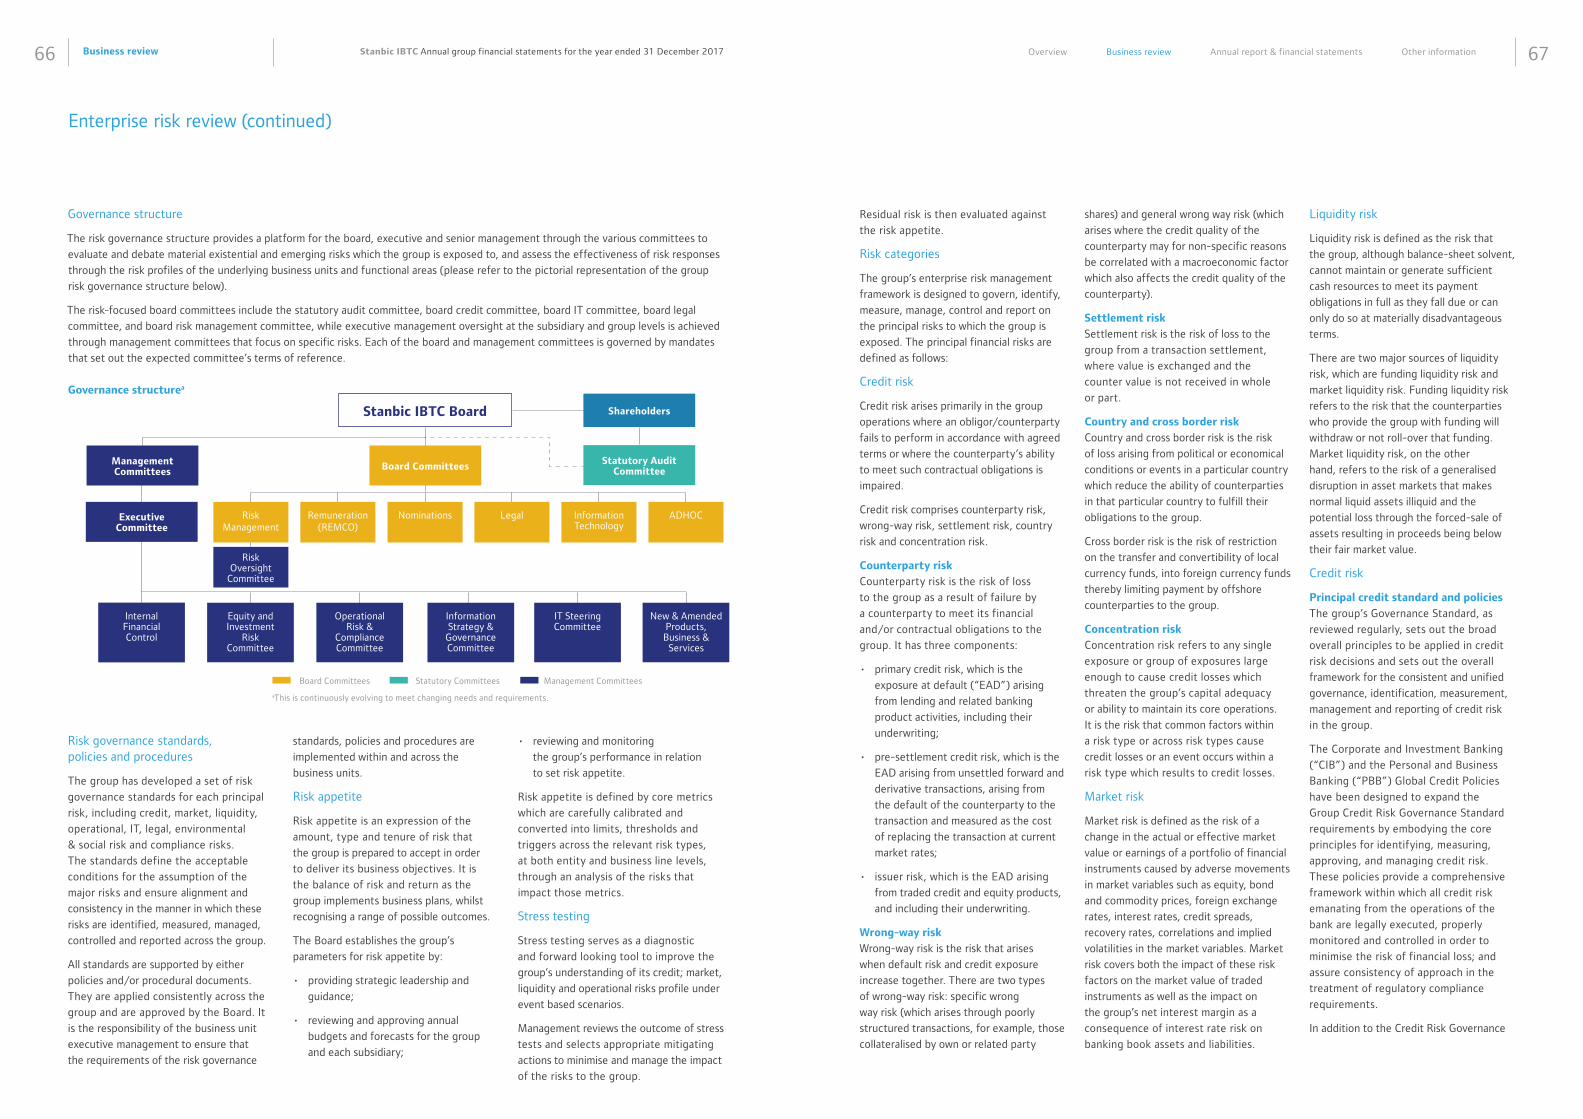
Business review66 67Stanbic IBTC Annual group financial statements for the year ended 31 December 2017 Overview Business review Annual report & financial statements Other information
Enterprise risk review (continued)
Risk governance standards, policies and procedures
The group has developed a set of risk
governance standards for each principal
risk, including credit, market, liquidity,
operational, IT, legal, environmental
& social risk and compliance risks.
The standards define the acceptable
conditions for the assumption of the
major risks and ensure alignment and
consistency in the manner in which these
risks are identified, measured, managed,
controlled and reported across the group.
All standards are supported by either
policies and/or procedural documents.
They are applied consistently across the
group and are approved by the Board. It
is the responsibility of the business unit
executive management to ensure that
the requirements of the risk governance
standards, policies and procedures are
implemented within and across the
business units.
Risk appetite
Risk appetite is an expression of the
amount, type and tenure of risk that
the group is prepared to accept in order
to deliver its business objectives. It is
the balance of risk and return as the
group implements business plans, whilst
recognising a range of possible outcomes.
The Board establishes the group’s
parameters for risk appetite by:
• providing strategic leadership and
guidance;
• reviewing and approving annual
budgets and forecasts for the group
and each subsidiary;
• reviewing and monitoring
the group’s performance in relation
to set risk appetite.
Risk appetite is defined by core metrics
which are carefully calibrated and
converted into limits, thresholds and
triggers across the relevant risk types,
at both entity and business line levels,
through an analysis of the risks that
impact those metrics.
Stress testing
Stress testing serves as a diagnostic
and forward looking tool to improve the
group’s understanding of its credit; market,
liquidity and operational risks profile under
event based scenarios.
Management reviews the outcome of stress
tests and selects appropriate mitigating
actions to minimise and manage the impact
of the risks to the group.
Governance structure
The risk governance structure provides a platform for the board, executive and senior management through the various committees to
evaluate and debate material existential and emerging risks which the group is exposed to, and assess the effectiveness of risk responses
through the risk profiles of the underlying business units and functional areas (please refer to the pictorial representation of the group
risk governance structure below).
The risk-focused board committees include the statutory audit committee, board credit committee, board IT committee, board legal
committee, and board risk management committee, while executive management oversight at the subsidiary and group levels is achieved
through management committees that focus on specific risks. Each of the board and management committees is governed by mandates
that set out the expected committee’s terms of reference.
Governance structurea
Residual risk is then evaluated against
the risk appetite.
Risk categories
The group’s enterprise risk management
framework is designed to govern, identify,
measure, manage, control and report on
the principal risks to which the group is
exposed. The principal financial risks are
defined as follows:
Credit risk
Credit risk arises primarily in the group
operations where an obligor/counterparty
fails to perform in accordance with agreed
terms or where the counterparty’s ability
to meet such contractual obligations is
impaired.
Credit risk comprises counterparty risk,
wrong-way risk, settlement risk, country
risk and concentration risk.
Counterparty risk
Counterparty risk is the risk of loss
to the group as a result of failure by
a counterparty to meet its financial
and/or contractual obligations to the
group. It has three components:
• primary credit risk, which is the
exposure at default (“EAD”) arising
from lending and related banking
product activities, including their
underwriting;
• pre-settlement credit risk, which is the
EAD arising from unsettled forward and
derivative transactions, arising from
the default of the counterparty to the
transaction and measured as the cost
of replacing the transaction at current
market rates;
• issuer risk, which is the EAD arising
from traded credit and equity products,
and including their underwriting.
Wrong-way risk
Wrong-way risk is the risk that arises
when default risk and credit exposure
increase together. There are two types
of wrong-way risk: specific wrong
way risk (which arises through poorly
structured transactions, for example, those
collateralised by own or related party
shares) and general wrong way risk (which
arises where the credit quality of the
counterparty may for non-specific reasons
be correlated with a macroeconomic factor
which also affects the credit quality of the
counterparty).
Settlement risk
Settlement risk is the risk of loss to the
group from a transaction settlement,
where value is exchanged and the
counter value is not received in whole
or part.
Country and cross border risk
Country and cross border risk is the risk
of loss arising from political or economical
conditions or events in a particular country
which reduce the ability of counterparties
in that particular country to fulfill their
obligations to the group.
Cross border risk is the risk of restriction
on the transfer and convertibility of local
currency funds, into foreign currency funds
thereby limiting payment by offshore
counterparties to the group.
Concentration risk
Concentration risk refers to any single
exposure or group of exposures large
enough to cause credit losses which
threaten the group’s capital adequacy
or ability to maintain its core operations.
It is the risk that common factors within
a risk type or across risk types cause
credit losses or an event occurs within a
risk type which results to credit losses.
Market risk
Market risk is defined as the risk of a
change in the actual or effective market
value or earnings of a portfolio of financial
instruments caused by adverse movements
in market variables such as equity, bond
and commodity prices, foreign exchange
rates, interest rates, credit spreads,
recovery rates, correlations and implied
volatilities in the market variables. Market
risk covers both the impact of these risk
factors on the market value of traded
instruments as well as the impact on
the group’s net interest margin as a
consequence of interest rate risk on
banking book assets and liabilities.
Liquidity risk
Liquidity risk is defined as the risk that
the group, although balance-sheet solvent,
cannot maintain or generate sufficient
cash resources to meet its payment
obligations in full as they fall due or can
only do so at materially disadvantageous
terms.
There are two major sources of liquidity
risk, which are funding liquidity risk and
market liquidity risk. Funding liquidity risk
refers to the risk that the counterparties
who provide the group with funding will
withdraw or not roll-over that funding.
Market liquidity risk, on the other
hand, refers to the risk of a generalised
disruption in asset markets that makes
normal liquid assets illiquid and the
potential loss through the forced-sale of
assets resulting in proceeds being below
their fair market value.
Credit risk
Principal credit standard and policies
The group’s Governance Standard, as
reviewed regularly, sets out the broad
overall principles to be applied in credit
risk decisions and sets out the overall
framework for the consistent and unified
governance, identification, measurement,
management and reporting of credit risk
in the group.
The Corporate and Investment Banking
(“CIB”) and the Personal and Business
Banking (“PBB”) Global Credit Policies
have been designed to expand the
Group Credit Risk Governance Standard
requirements by embodying the core
principles for identifying, measuring,
approving, and managing credit risk.
These policies provide a comprehensive
framework within which all credit risk
emanating from the operations of the
bank are legally executed, properly
monitored and controlled in order to
minimise the risk of financial loss; and
assure consistency of approach in the
treatment of regulatory compliance
requirements.
In addition to the Credit Risk Governance
Management Committees
Executive Committee
Stanbic IBTC Board
Statutory Audit CommitteeBoard Committees
Equity and Investment
Risk Committee
Internal Financial Control
Operational Risk &
Compliance Committee
Information Strategy &
Governance Committee
New & Amended Products, Business &
Services
IT Steering Committee
Risk Management
Risk Oversight
Committee
NominationsRemuneration (REMCO)
Legal Information Technology
ADHOC
Board Committees Statutory Committees Management Committees
aThis is continuously evolving to meet changing needs and requirements.
Shareholders
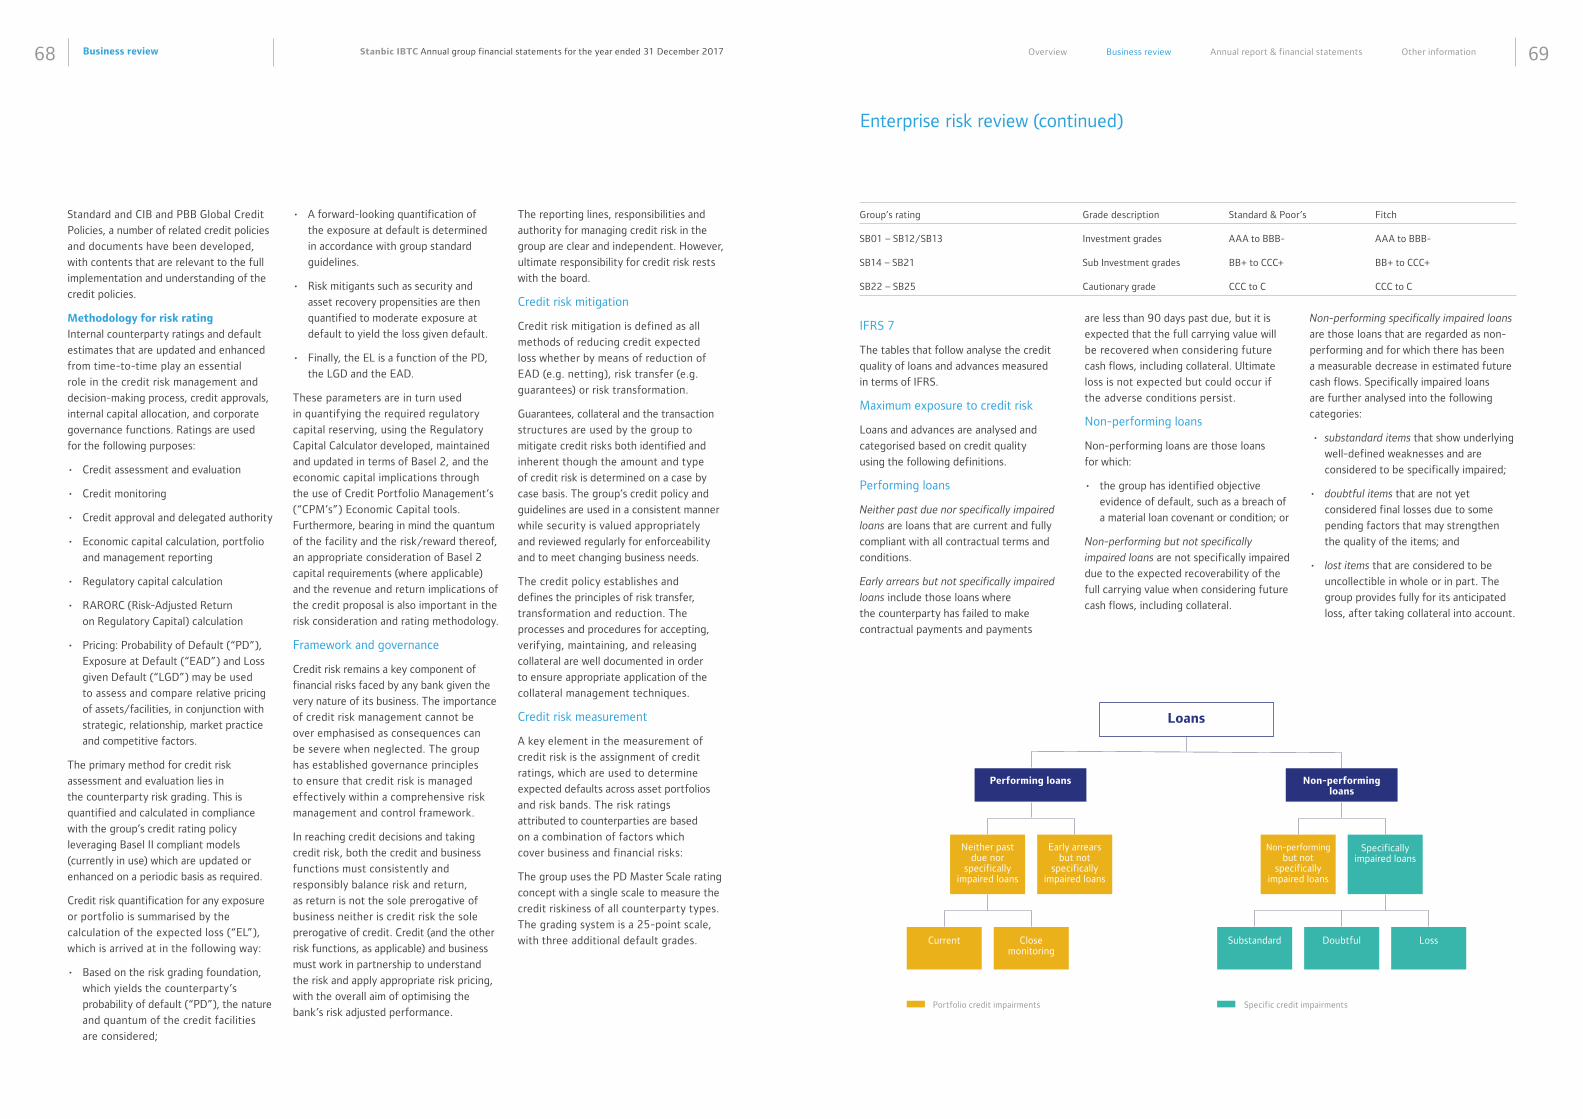
Business review68 69Stanbic IBTC Annual group financial statements for the year ended 31 December 2017 Overview Business review Annual report & financial statements Other information
Standard and CIB and PBB Global Credit
Policies, a number of related credit policies
and documents have been developed,
with contents that are relevant to the full
implementation and understanding of the
credit policies.
Methodology for risk rating
Internal counterparty ratings and default
estimates that are updated and enhanced
from time-to-time play an essential
role in the credit risk management and
decision-making process, credit approvals,
internal capital allocation, and corporate
governance functions. Ratings are used
for the following purposes:
• Credit assessment and evaluation
• Credit monitoring
• Credit approval and delegated authority
• Economic capital calculation, portfolio
and management reporting
• Regulatory capital calculation
• RARORC (Risk-Adjusted Return
on Regulatory Capital) calculation
• Pricing: Probability of Default (“PD”),
Exposure at Default (“EAD”) and Loss
given Default (“LGD”) may be used
to assess and compare relative pricing
of assets/facilities, in conjunction with
strategic, relationship, market practice
and competitive factors.
The primary method for credit risk
assessment and evaluation lies in
the counterparty risk grading. This is
quantified and calculated in compliance
with the group’s credit rating policy
leveraging Basel II compliant models
(currently in use) which are updated or
enhanced on a periodic basis as required.
Credit risk quantification for any exposure
or portfolio is summarised by the
calculation of the expected loss (“EL”),
which is arrived at in the following way:
• Based on the risk grading foundation,
which yields the counterparty’s
probability of default (“PD”), the nature
and quantum of the credit facilities
are considered;
• A forward-looking quantification of
the exposure at default is determined
in accordance with group standard
guidelines.
• Risk mitigants such as security and
asset recovery propensities are then
quantified to moderate exposure at
default to yield the loss given default.
• Finally, the EL is a function of the PD,
the LGD and the EAD.
These parameters are in turn used
in quantifying the required regulatory
capital reserving, using the Regulatory
Capital Calculator developed, maintained
and updated in terms of Basel 2, and the
economic capital implications through
the use of Credit Portfolio Management’s
(“CPM’s”) Economic Capital tools.
Furthermore, bearing in mind the quantum
of the facility and the risk/reward thereof,
an appropriate consideration of Basel 2
capital requirements (where applicable)
and the revenue and return implications of
the credit proposal is also important in the
risk consideration and rating methodology.
Framework and governance
Credit risk remains a key component of
financial risks faced by any bank given the
very nature of its business. The importance
of credit risk management cannot be
over emphasised as consequences can
be severe when neglected. The group
has established governance principles
to ensure that credit risk is managed
effectively within a comprehensive risk
management and control framework.
In reaching credit decisions and taking
credit risk, both the credit and business
functions must consistently and
responsibly balance risk and return,
as return is not the sole prerogative of
business neither is credit risk the sole
prerogative of credit. Credit (and the other
risk functions, as applicable) and business
must work in partnership to understand
the risk and apply appropriate risk pricing,
with the overall aim of optimising the
bank’s risk adjusted performance.
The reporting lines, responsibilities and
authority for managing credit risk in the
group are clear and independent. However,
ultimate responsibility for credit risk rests
with the board.
Credit risk mitigation
Credit risk mitigation is defined as all
methods of reducing credit expected
loss whether by means of reduction of
EAD (e.g. netting), risk transfer (e.g.
guarantees) or risk transformation.
Guarantees, collateral and the transaction
structures are used by the group to
mitigate credit risks both identified and
inherent though the amount and type
of credit risk is determined on a case by
case basis. The group’s credit policy and
guidelines are used in a consistent manner
while security is valued appropriately
and reviewed regularly for enforceability
and to meet changing business needs.
The credit policy establishes and
defines the principles of risk transfer,
transformation and reduction. The
processes and procedures for accepting,
verifying, maintaining, and releasing
collateral are well documented in order
to ensure appropriate application of the
collateral management techniques.
Credit risk measurement
A key element in the measurement of
credit risk is the assignment of credit
ratings, which are used to determine
expected defaults across asset portfolios
and risk bands. The risk ratings
attributed to counterparties are based
on a combination of factors which
cover business and financial risks:
The group uses the PD Master Scale rating
concept with a single scale to measure the
credit riskiness of all counterparty types.
The grading system is a 25-point scale,
with three additional default grades.
Enterprise risk review (continued)
IFRS 7
The tables that follow analyse the credit
quality of loans and advances measured
in terms of IFRS.
Maximum exposure to credit risk
Loans and advances are analysed and
categorised based on credit quality
using the following definitions.
Performing loans
Neither past due nor specifically impaired
loans are loans that are current and fully
compliant with all contractual terms and
conditions.
Early arrears but not specifically impaired
loans include those loans where
the counterparty has failed to make
contractual payments and payments
are less than 90 days past due, but it is
expected that the full carrying value will
be recovered when considering future
cash flows, including collateral. Ultimate
loss is not expected but could occur if
the adverse conditions persist.
Non-performing loans
Non-performing loans are those loans
for which:
• the group has identified objective
evidence of default, such as a breach of
a material loan covenant or condition; or
Non-performing but not specifically
impaired loans are not specifically impaired
due to the expected recoverability of the
full carrying value when considering future
cash flows, including collateral.
Non-performing specifically impaired loans
are those loans that are regarded as non-
performing and for which there has been
a measurable decrease in estimated future
cash flows. Specifically impaired loans
are further analysed into the following
categories:
• substandard items that show underlying
well-defined weaknesses and are
considered to be specifically impaired;
• doubtful items that are not yet
considered final losses due to some
pending factors that may strengthen
the quality of the items; and
• lost items that are considered to be
uncollectible in whole or in part. The
group provides fully for its anticipated
loss, after taking collateral into account.
Group’s rating Grade description Standard & Poor’s Fitch
SB01 – SB12/SB13 Investment grades AAA to BBB- AAA to BBB-
SB14 – SB21 Sub Investment grades BB+ to CCC+ BB+ to CCC+
SB22 – SB25 Cautionary grade CCC to C CCC to C
Performing loans
Loans
Non-performing loans
Neither past due nor
specifically impaired loans
Early arrears but not
specifically impaired loans
Current Close monitoring
Non-performing but not
specifically impaired loans
Substandard Doubtful Loss
Specifically impaired loans
Specific credit impairmentsPortfolio credit impairments
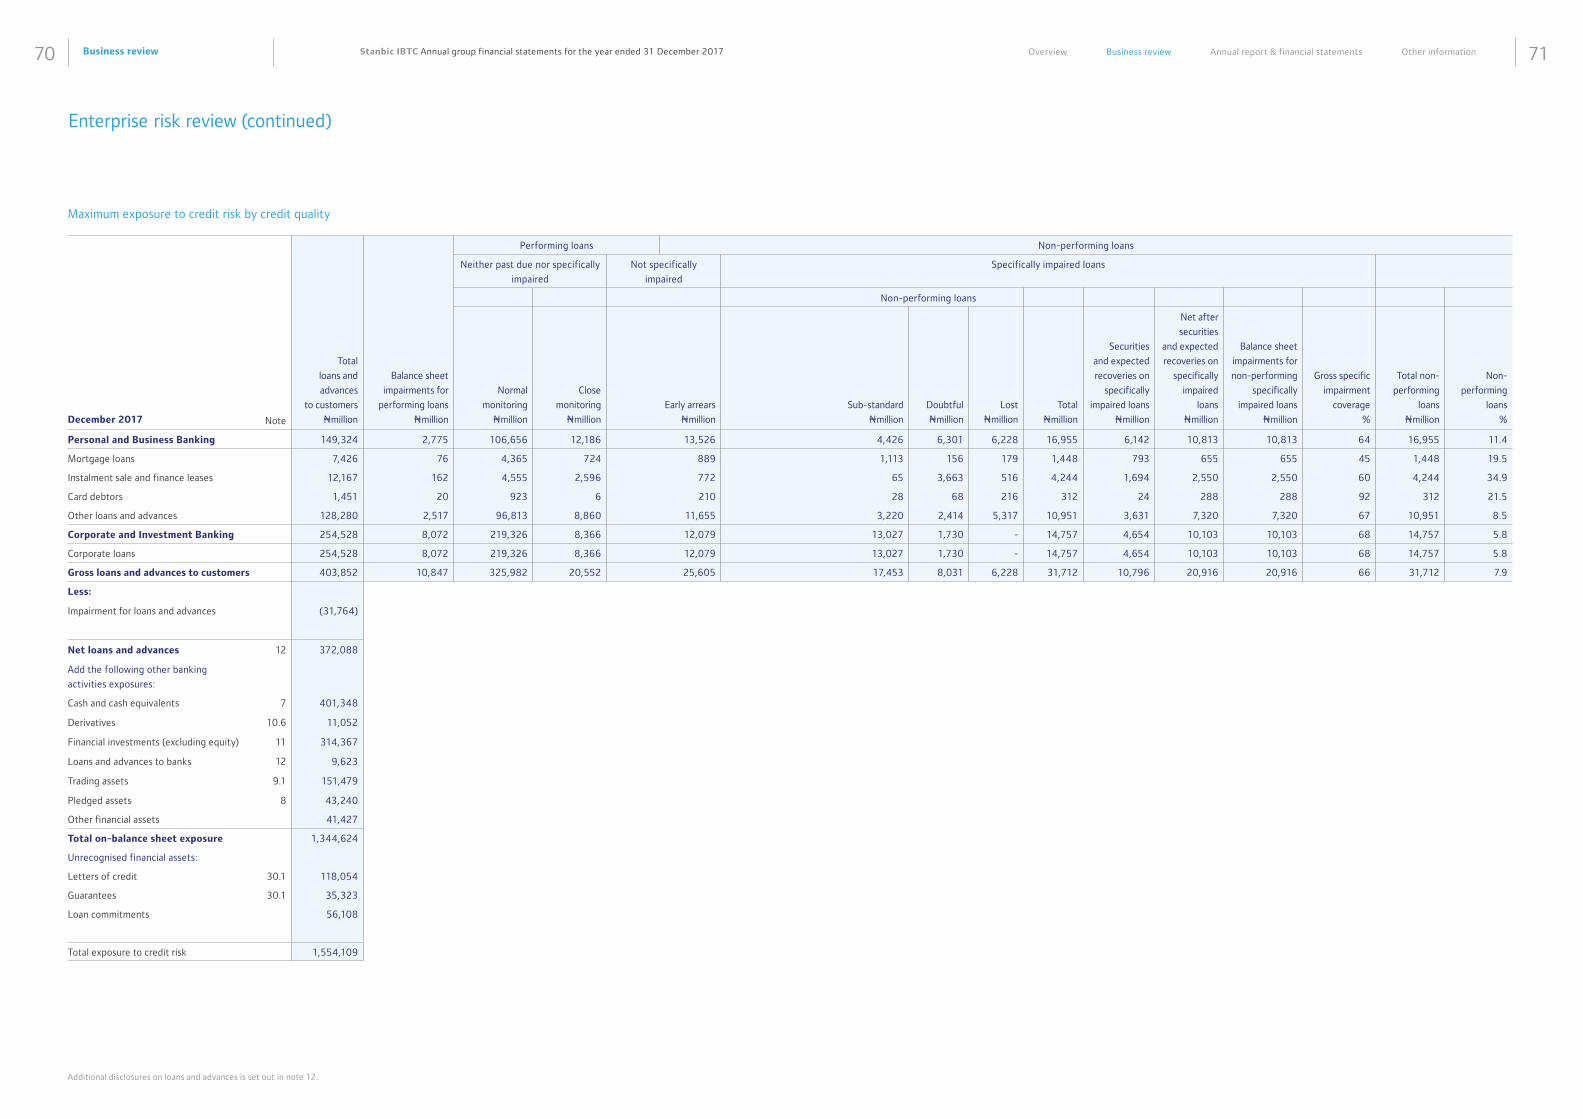
Business review70 71Stanbic IBTC Annual group financial statements for the year ended 31 December 2017 Overview Business review Annual report & financial statements Other information
Enterprise risk review (continued)
Maximum exposure to credit risk by credit quality
Additional disclosures on loans and advances is set out in note 12.
Performing loans Non-performing loans
Neither past due nor specifically
impaired
Not specifically
impaired
Specifically impaired loans
Non-performing loans
December 2017
Note
Total
loans and
advances
to customers
Nmillion
Balance sheet
impairments for
performing loans
Nmillion
Normal
monitoring
Nmillion
Close
monitoring
Nmillion
Early arrears
Nmillion
Sub-standard
Nmillion
Doubtful
Nmillion
Lost
Nmillion
Total
Nmillion
Securities
and expected
recoveries on
specifically
impaired loans
Nmillion
Net after
securities
and expected
recoveries on
specifically
impaired
loans
Nmillion
Balance sheet
impairments for
non-performing
specifically
impaired loans
Nmillion
Gross specific
impairment
coverage
%
Total non-
performing
loans
Nmillion
Non-
performing
loans
%
Personal and Business Banking 149,324 2,775 106,656 12,186 13,526 4,426 6,301 6,228 16,955 6,142 10,813 10,813 64 16,955 11.4
Mortgage loans 7,426 76 4,365 724 889 1,113 156 179 1,448 793 655 655 45 1,448 19.5
Instalment sale and finance leases 12,167 162 4,555 2,596 772 65 3,663 516 4,244 1,694 2,550 2,550 60 4,244 34.9
Card debtors 1,451 20 923 6 210 28 68 216 312 24 288 288 92 312 21.5
Other loans and advances 128,280 2,517 96,813 8,860 11,655 3,220 2,414 5,317 10,951 3,631 7,320 7,320 67 10,951 8.5
Corporate and Investment Banking 254,528 8,072 219,326 8,366 12,079 13,027 1,730 - 14,757 4,654 10,103 10,103 68 14,757 5.8
Corporate loans 254,528 8,072 219,326 8,366 12,079 13,027 1,730 - 14,757 4,654 10,103 10,103 68 14,757 5.8
Gross loans and advances to customers 403,852 10,847 325,982 20,552 25,605 17,453 8,031 6,228 31,712 10,796 20,916 20,916 66 31,712 7.9
Less:
Impairment for loans and advances (31,764)
Net loans and advances 12 372,088
Add the following other banking
activities exposures:
Cash and cash equivalents 7 401,348
Derivatives 10.6 11,052
Financial investments (excluding equity) 11 314,367
Loans and advances to banks 12 9,623
Trading assets 9.1 151,479
Pledged assets 8 43,240
Other financial assets 41,427
Total on-balance sheet exposure 1,344,624
Unrecognised financial assets:
Letters of credit 30.1 118,054
Guarantees 30.1 35,323
Loan commitments 56,108
Total exposure to credit risk 1,554,109
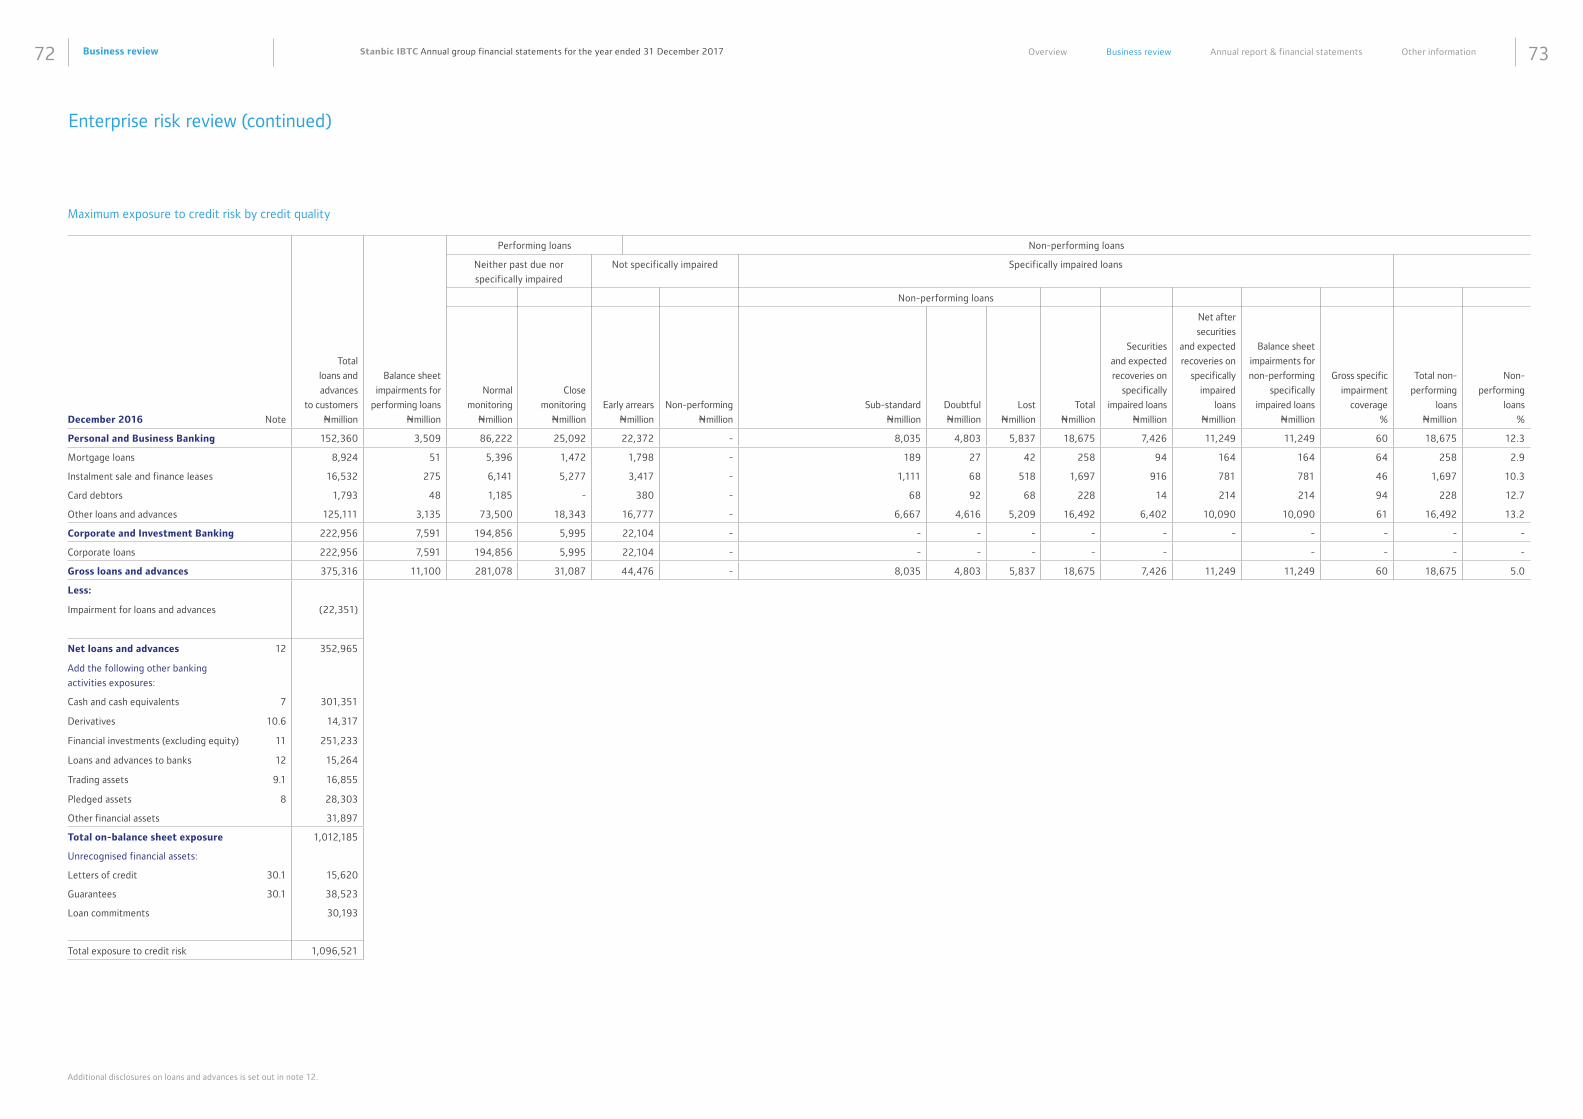
Business review72 73Stanbic IBTC Annual group financial statements for the year ended 31 December 2017 Overview Business review Annual report & financial statements Other information
Enterprise risk review (continued)
Maximum exposure to credit risk by credit quality
Additional disclosures on loans and advances is set out in note 12.
Performing loans Non-performing loans
Neither past due nor
specifically impaired
Not specifically impaired Specifically impaired loans
Non-performing loans
December 2016
Note
Total
loans and
advances
to customers
Nmillion
Balance sheet
impairments for
performing loans
Nmillion
Normal
monitoring
Nmillion
Close
monitoring
Nmillion
Early arrears
Nmillion
Non-performing
Nmillion
Sub-standard
Nmillion
Doubtful
Nmillion
Lost
Nmillion
Total
Nmillion
Securities
and expected
recoveries on
specifically
impaired loans
Nmillion
Net after
securities
and expected
recoveries on
specifically
impaired
loans
Nmillion
Balance sheet
impairments for
non-performing
specifically
impaired loans
Nmillion
Gross specific
impairment
coverage
%
Total non-
performing
loans
Nmillion
Non-
performing
loans
%
Personal and Business Banking 152,360 3,509 86,222 25,092 22,372 - 8,035 4,803 5,837 18,675 7,426 11,249 11,249 60 18,675 12.3
Mortgage loans 8,924 51 5,396 1,472 1,798 - 189 27 42 258 94 164 164 64 258 2.9
Instalment sale and finance leases 16,532 275 6,141 5,277 3,417 - 1,111 68 518 1,697 916 781 781 46 1,697 10.3
Card debtors 1,793 48 1,185 - 380 - 68 92 68 228 14 214 214 94 228 12.7
Other loans and advances 125,111 3,135 73,500 18,343 16,777 - 6,667 4,616 5,209 16,492 6,402 10,090 10,090 61 16,492 13.2
Corporate and Investment Banking 222,956 7,591 194,856 5,995 22,104 - - - - - - - - - - -
Corporate loans 222,956 7,591 194,856 5,995 22,104 - - - - - - - - - -
Gross loans and advances 375,316 11,100 281,078 31,087 44,476 - 8,035 4,803 5,837 18,675 7,426 11,249 11,249 60 18,675 5.0
Less:
Impairment for loans and advances (22,351)
Net loans and advances 12 352,965
Add the following other banking
activities exposures:
Cash and cash equivalents 7 301,351
Derivatives 10.6 14,317
Financial investments (excluding equity) 11 251,233
Loans and advances to banks 12 15,264
Trading assets 9.1 16,855
Pledged assets 8 28,303
Other financial assets 31,897
Total on-balance sheet exposure 1,012,185
Unrecognised financial assets:
Letters of credit 30.1 15,620
Guarantees 30.1 38,523
Loan commitments 30,193
Total exposure to credit risk 1,096,521
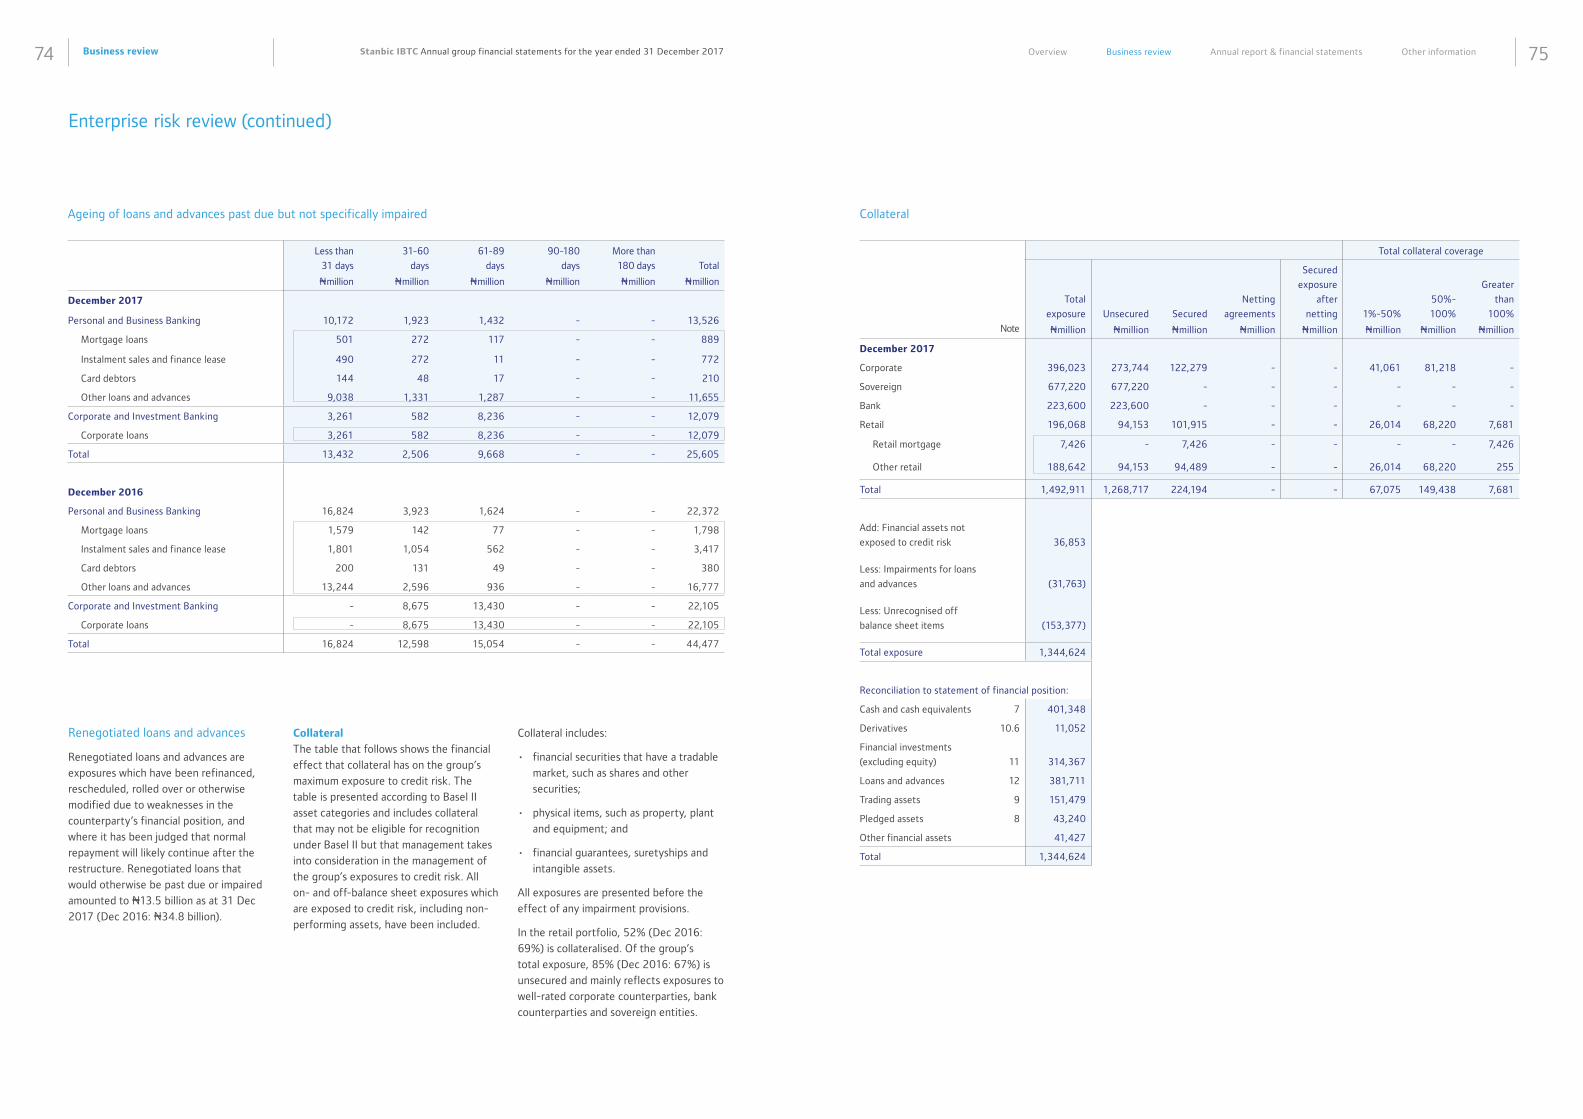
Business review74 75Stanbic IBTC Annual group financial statements for the year ended 31 December 2017 Overview Business review Annual report & financial statements Other information
Enterprise risk review (continued)
Less than
31 days
Nmillion
31-60
days
Nmillion
61-89
days
Nmillion
90-180
days
Nmillion
More than
180 days
Nmillion
Total
Nmillion
December 2017
Personal and Business Banking 10,172 1,923 1,432 - - 13,526
Mortgage loans 501 272 117 - - 889
Instalment sales and finance lease 490 272 11 - - 772
Card debtors 144 48 17 - - 210
Other loans and advances 9,038 1,331 1,287 - - 11,655
Corporate and Investment Banking 3,261 582 8,236 - - 12,079
Corporate loans 3,261 582 8,236 - - 12,079
Total 13,432 2,506 9,668 - - 25,605
December 2016
Personal and Business Banking 16,824 3,923 1,624 - - 22,372
Mortgage loans 1,579 142 77 - - 1,798
Instalment sales and finance lease 1,801 1,054 562 - - 3,417
Card debtors 200 131 49 - - 380
Other loans and advances 13,244 2,596 936 - - 16,777
Corporate and Investment Banking - 8,675 13,430 - - 22,105
Corporate loans - 8,675 13,430 - - 22,105
Total 16,824 12,598 15,054 - - 44,477
Ageing of loans and advances past due but not specifically impaired
Renegotiated loans and advances
Renegotiated loans and advances are
exposures which have been refinanced,
rescheduled, rolled over or otherwise
modified due to weaknesses in the
counterparty’s financial position, and
where it has been judged that normal
repayment will likely continue after the
restructure. Renegotiated loans that
would otherwise be past due or impaired
amounted to N13.5 billion as at 31 Dec
2017 (Dec 2016: N34.8 billion).
Collateral
The table that follows shows the financial
effect that collateral has on the group’s
maximum exposure to credit risk. The
table is presented according to Basel II
asset categories and includes collateral
that may not be eligible for recognition
under Basel II but that management takes
into consideration in the management of
the group’s exposures to credit risk. All
on- and off-balance sheet exposures which
are exposed to credit risk, including non-
performing assets, have been included.
Collateral includes:
• financial securities that have a tradable
market, such as shares and other
securities;
• physical items, such as property, plant
and equipment; and
• financial guarantees, suretyships and
intangible assets.
All exposures are presented before the
effect of any impairment provisions.
In the retail portfolio, 52% (Dec 2016:
69%) is collateralised. Of the group’s
total exposure, 85% (Dec 2016: 67%) is
unsecured and mainly reflects exposures to
well-rated corporate counterparties, bank
counterparties and sovereign entities.
Total collateral coverage
Note
Total
exposure
Nmillion
Unsecured
Nmillion
Secured
Nmillion
Netting
agreements
Nmillion
Secured
exposure
after
netting
Nmillion
1%-50%
Nmillion
50%-
100%
Nmillion
Greater
than
100%
Nmillion
December 2017
Corporate 396,023 273,744 122,279 - - 41,061 81,218 -
Sovereign 677,220 677,220 - - - - - -
Bank 223,600 223,600 - - - - - -
Retail 196,068 94,153 101,915 - - 26,014 68,220 7,681
Retail mortgage 7,426 - 7,426 - - - - 7,426
Other retail 188,642 94,153 94,489 - - 26,014 68,220 255
Total 1,492,911 1,268,717 224,194 - - 67,075 149,438 7,681
Add: Financial assets not
exposed to credit risk
36,853
Less: Impairments for loans
and advances
(31,763)
Less: Unrecognised off
balance sheet items
(153,377)
Total exposure 1,344,624
Reconciliation to statement of financial position:
Cash and cash equivalents 7 401,348
Derivatives 10.6 11,052
Financial investments
(excluding equity)
11
314,367
Loans and advances 12 381,711
Trading assets 9 151,479
Pledged assets 8 43,240
Other financial assets 41,427
Total 1,344,624
Collateral
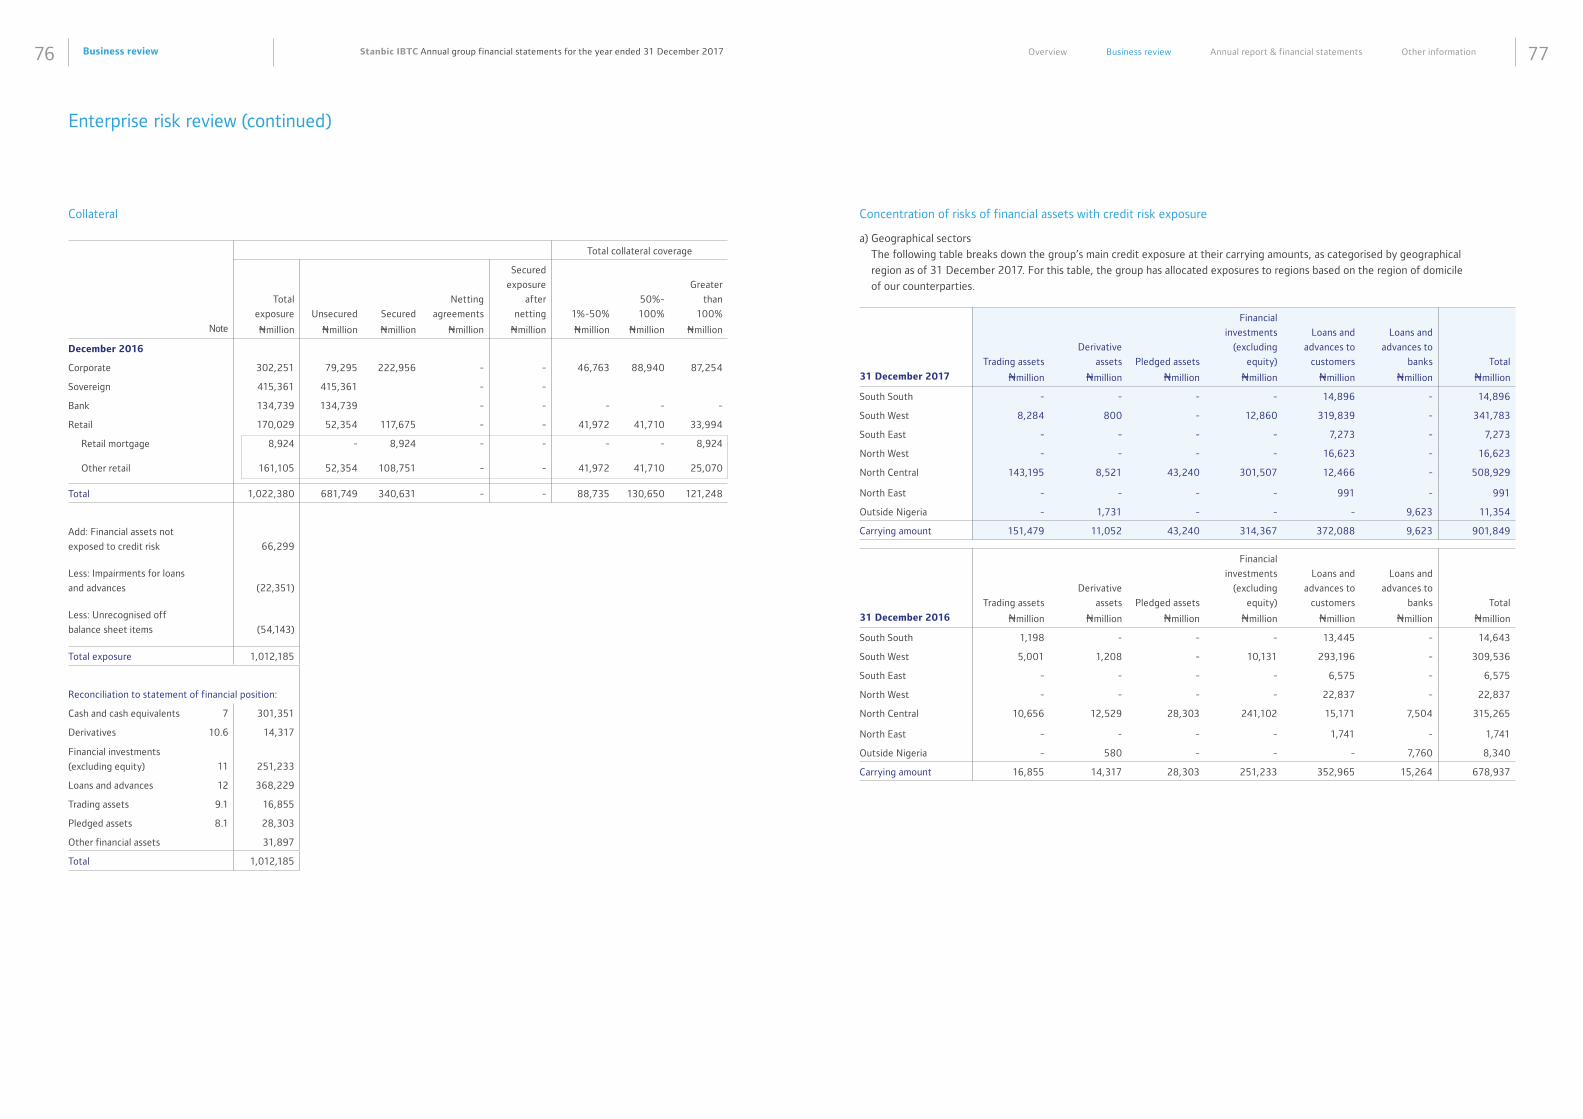
Business review76 77Stanbic IBTC Annual group financial statements for the year ended 31 December 2017 Overview Business review Annual report & financial statements Other information
Enterprise risk review (continued)
Total collateral coverage
Note
Total
exposure
Nmillion
Unsecured
Nmillion
Secured
Nmillion
Netting
agreements
Nmillion
Secured
exposure
after
netting
Nmillion
1%-50%
Nmillion
50%-
100%
Nmillion
Greater
than
100%
Nmillion
December 2016
Corporate 302,251 79,295 222,956 - - 46,763 88,940 87,254
Sovereign 415,361 415,361 - -
Bank 134,739 134,739 - - - - -
Retail 170,029 52,354 117,675 - - 41,972 41,710 33,994
Retail mortgage 8,924 - 8,924 - - - - 8,924
Other retail 161,105 52,354 108,751 - - 41,972 41,710 25,070
Total 1,022,380 681,749 340,631 - - 88,735 130,650 121,248
Add: Financial assets not
exposed to credit risk
66,299
Less: Impairments for loans
and advances
(22,351)
Less: Unrecognised off
balance sheet items
(54,143)
Total exposure 1,012,185
Reconciliation to statement of financial position:
Cash and cash equivalents 7 301,351
Derivatives 10.6 14,317
Financial investments
(excluding equity)
11
251,233
Loans and advances 12 368,229
Trading assets 9.1 16,855
Pledged assets 8.1 28,303
Other financial assets 31,897
Total 1,012,185
Collateral
31 December 2017
Trading assets
Nmillion
Derivative
assets
Nmillion
Pledged assets
Nmillion
Financial
investments
(excluding
equity)
Nmillion
Loans and
advances to
customers
Nmillion
Loans and
advances to
banks
Nmillion
Total
Nmillion
South South - - - - 14,896 - 14,896
South West 8,284 800 - 12,860 319,839 - 341,783
South East - - - - 7,273 - 7,273
North West - - - - 16,623 - 16,623
North Central 143,195 8,521 43,240 301,507 12,466 - 508,929
North East - - - - 991 - 991
Outside Nigeria - 1,731 - - - 9,623 11,354
Carrying amount 151,479 11,052 43,240 314,367 372,088 9,623 901,849
31 December 2016
Trading assets
Nmillion
Derivative
assets
Nmillion
Pledged assets
Nmillion
Financial
investments
(excluding
equity)
Nmillion
Loans and
advances to
customers
Nmillion
Loans and
advances to
banks
Nmillion
Total
Nmillion
South South 1,198 - - - 13,445 - 14,643
South West 5,001 1,208 - 10,131 293,196 - 309,536
South East - - - - 6,575 - 6,575
North West - - - - 22,837 - 22,837
North Central 10,656 12,529 28,303 241,102 15,171 7,504 315,265
North East - - - - 1,741 - 1,741
Outside Nigeria - 580 - - - 7,760 8,340
Carrying amount 16,855 14,317 28,303 251,233 352,965 15,264 678,937
Concentration of risks of financial assets with credit risk exposure
a) Geographical sectors
The following table breaks down the group’s main credit exposure at their carrying amounts, as categorised by geographical
region as of 31 December 2017. For this table, the group has allocated exposures to regions based on the region of domicile
of our counterparties.
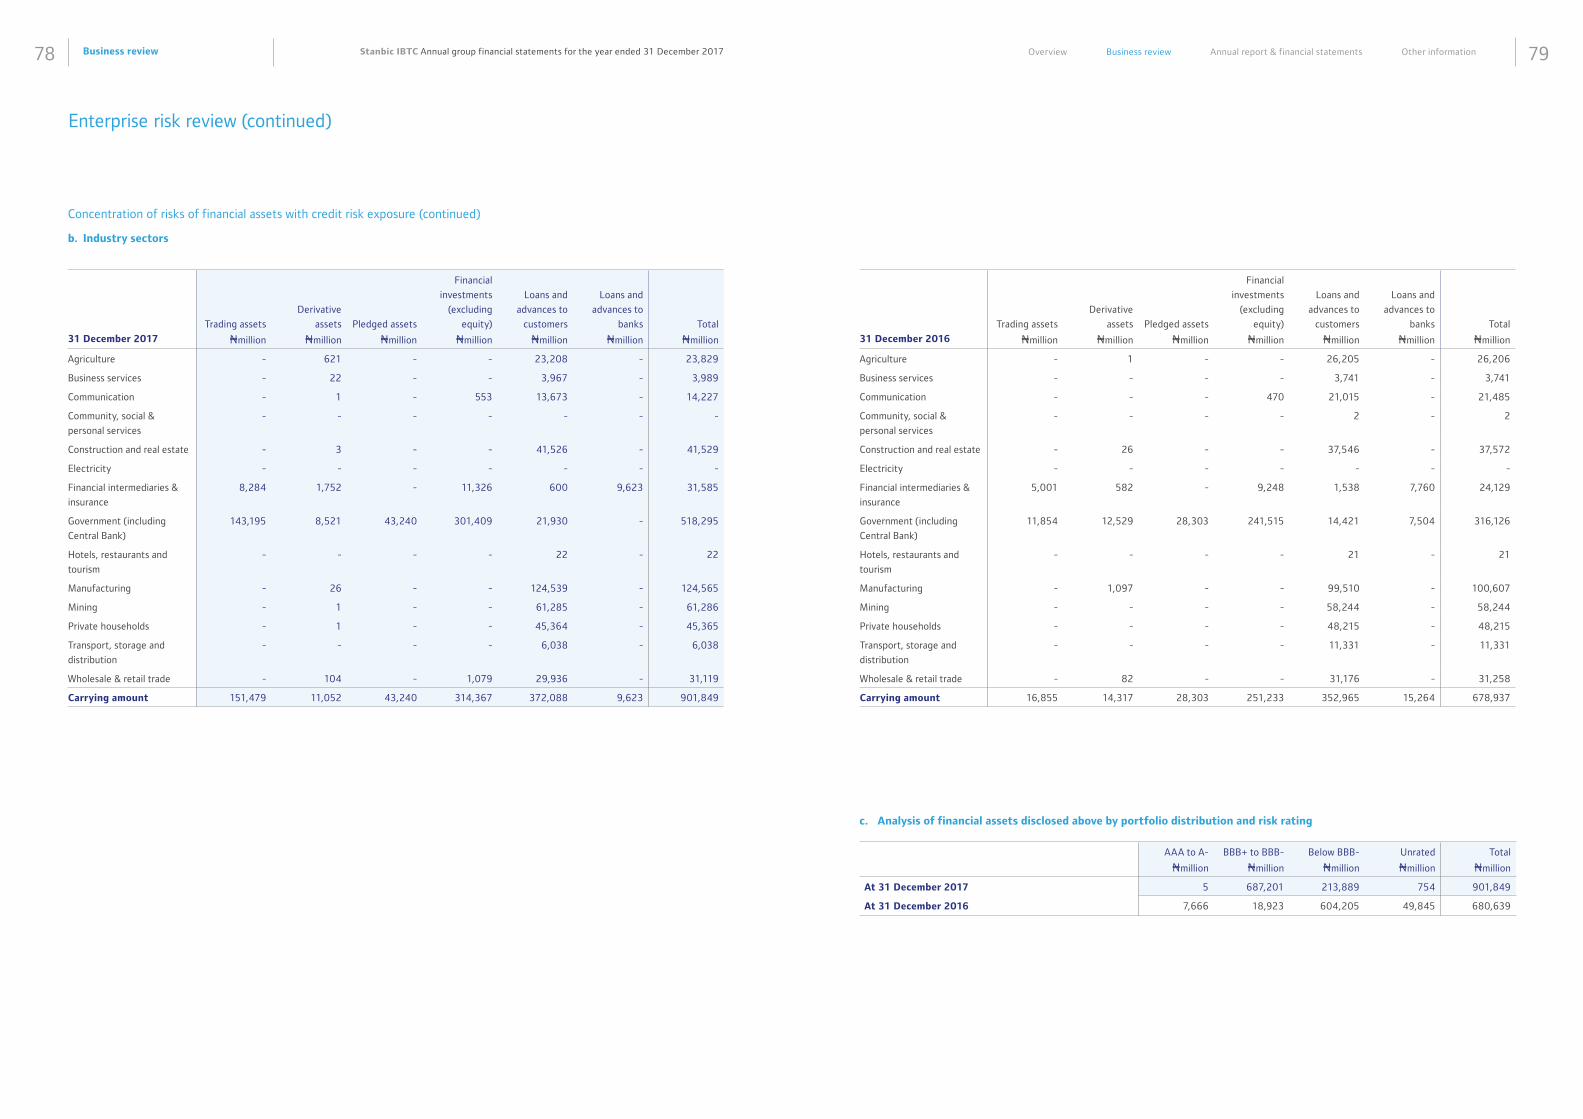
Business review78 79Stanbic IBTC Annual group financial statements for the year ended 31 December 2017 Overview Business review Annual report & financial statements Other information
Enterprise risk review (continued)
31 December 2017
Trading assets
Nmillion
Derivative
assets
Nmillion
Pledged assets
Nmillion
Financial
investments
(excluding
equity)
Nmillion
Loans and
advances to
customers
Nmillion
Loans and
advances to
banks
Nmillion
Total
Nmillion
Agriculture - 621 - - 23,208 - 23,829
Business services - 22 - - 3,967 - 3,989
Communication - 1 - 553 13,673 - 14,227
Community, social &
personal services
- - - - - - -
Construction and real estate - 3 - - 41,526 - 41,529
Electricity - - - - - - -
Financial intermediaries &
insurance
8,284 1,752 - 11,326 600 9,623 31,585
Government (including
Central Bank)
143,195 8,521 43,240 301,409 21,930 - 518,295
Hotels, restaurants and
tourism
- - - - 22 - 22
Manufacturing - 26 - - 124,539 - 124,565
Mining - 1 - - 61,285 - 61,286
Private households - 1 - - 45,364 - 45,365
Transport, storage and
distribution
- - - - 6,038 - 6,038
Wholesale & retail trade - 104 - 1,079 29,936 - 31,119
Carrying amount 151,479 11,052 43,240 314,367 372,088 9,623 901,849
Concentration of risks of financial assets with credit risk exposure (continued)
b. Industry sectors
31 December 2016
Trading assets
Nmillion
Derivative
assets
Nmillion
Pledged assets
Nmillion
Financial
investments
(excluding
equity)
Nmillion
Loans and
advances to
customers
Nmillion
Loans and
advances to
banks
Nmillion
Total
Nmillion
Agriculture - 1 - - 26,205 - 26,206
Business services - - - - 3,741 - 3,741
Communication - - - 470 21,015 - 21,485
Community, social &
personal services
- - - - 2 - 2
Construction and real estate - 26 - - 37,546 - 37,572
Electricity - - - - - - -
Financial intermediaries &
insurance
5,001 582 - 9,248 1,538 7,760 24,129
Government (including
Central Bank)
11,854 12,529 28,303 241,515 14,421 7,504 316,126
Hotels, restaurants and
tourism
- - - - 21 - 21
Manufacturing - 1,097 - - 99,510 - 100,607
Mining - - - - 58,244 - 58,244
Private households - - - - 48,215 - 48,215
Transport, storage and
distribution
- - - - 11,331 - 11,331
Wholesale & retail trade - 82 - - 31,176 - 31,258
Carrying amount 16,855 14,317 28,303 251,233 352,965 15,264 678,937
AAA to A-
Nmillion
BBB+ to BBB-
Nmillion
Below BBB-
Nmillion
Unrated
Nmillion
Total
Nmillion
At 31 December 2017 5 687,201 213,889 754 901,849
At 31 December 2016 7,666 18,923 604,205 49,845 680,639
c. Analysis of financial assets disclosed above by portfolio distribution and risk rating
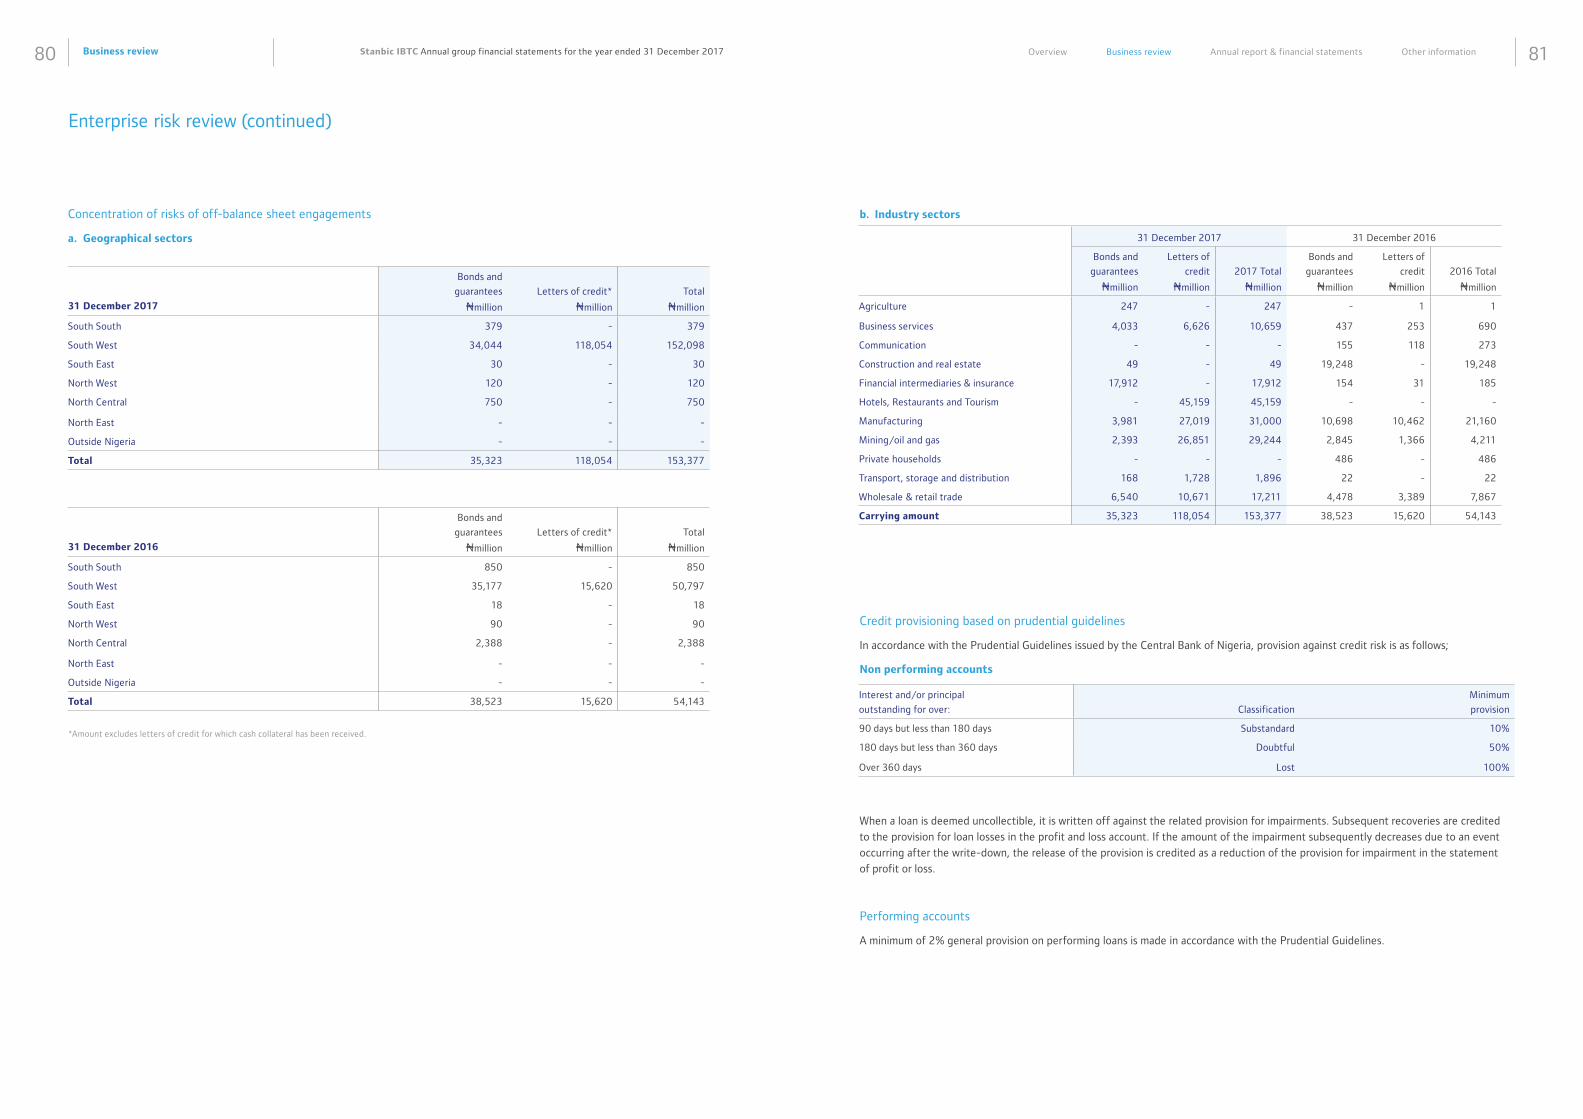
Business review80 81Stanbic IBTC Annual group financial statements for the year ended 31 December 2017 Overview Business review Annual report & financial statements Other information
Enterprise risk review (continued)
Concentration of risks of off-balance sheet engagements
a. Geographical sectors
31 December 2017
Bonds and
guarantees
Nmillion
Letters of credit*
Nmillion
Total
Nmillion
South South 379 - 379
South West 34,044 118,054 152,098
South East 30 - 30
North West 120 - 120
North Central 750 - 750
North East - - -
Outside Nigeria - - -
Total 35,323 118,054 153,377
31 December 2016
Bonds and
guarantees
Nmillion
Letters of credit*
Nmillion
Total
Nmillion
South South 850 - 850
South West 35,177 15,620 50,797
South East 18 - 18
North West 90 - 90
North Central 2,388 - 2,388
North East - - -
Outside Nigeria - - -
Total 38,523 15,620 54,143
*Amount excludes letters of credit for which cash collateral has been received.
31 December 2017 31 December 2016
Bonds and
guarantees
Nmillion
Letters of
credit
Nmillion
2017 Total
Nmillion
Bonds and
guarantees
Nmillion
Letters of
credit
Nmillion
2016 Total
Nmillion
Agriculture 247 - 247 - 1 1
Business services 4,033 6,626 10,659 437 253 690
Communication - - - 155 118 273
Construction and real estate 49 - 49 19,248 - 19,248
Financial intermediaries & insurance 17,912 - 17,912 154 31 185
Hotels, Restaurants and Tourism - 45,159 45,159 - - -
Manufacturing 3,981 27,019 31,000 10,698 10,462 21,160
Mining/oil and gas 2,393 26,851 29,244 2,845 1,366 4,211
Private households - - - 486 - 486
Transport, storage and distribution 168 1,728 1,896 22 - 22
Wholesale & retail trade 6,540 10,671 17,211 4,478 3,389 7,867
Carrying amount 35,323 118,054 153,377 38,523 15,620 54,143
b. Industry sectors
Credit provisioning based on prudential guidelines
In accordance with the Prudential Guidelines issued by the Central Bank of Nigeria, provision against credit risk is as follows;
Non performing accounts
When a loan is deemed uncollectible, it is written off against the related provision for impairments. Subsequent recoveries are credited
to the provision for loan losses in the profit and loss account. If the amount of the impairment subsequently decreases due to an event
occurring after the write-down, the release of the provision is credited as a reduction of the provision for impairment in the statement
of profit or loss.
Performing accounts
A minimum of 2% general provision on performing loans is made in accordance with the Prudential Guidelines.
Interest and/or principal
outstanding for over:
Classification
Minimum
provision
90 days but less than 180 days Substandard 10%
180 days but less than 360 days Doubtful 50%
Over 360 days Lost 100%
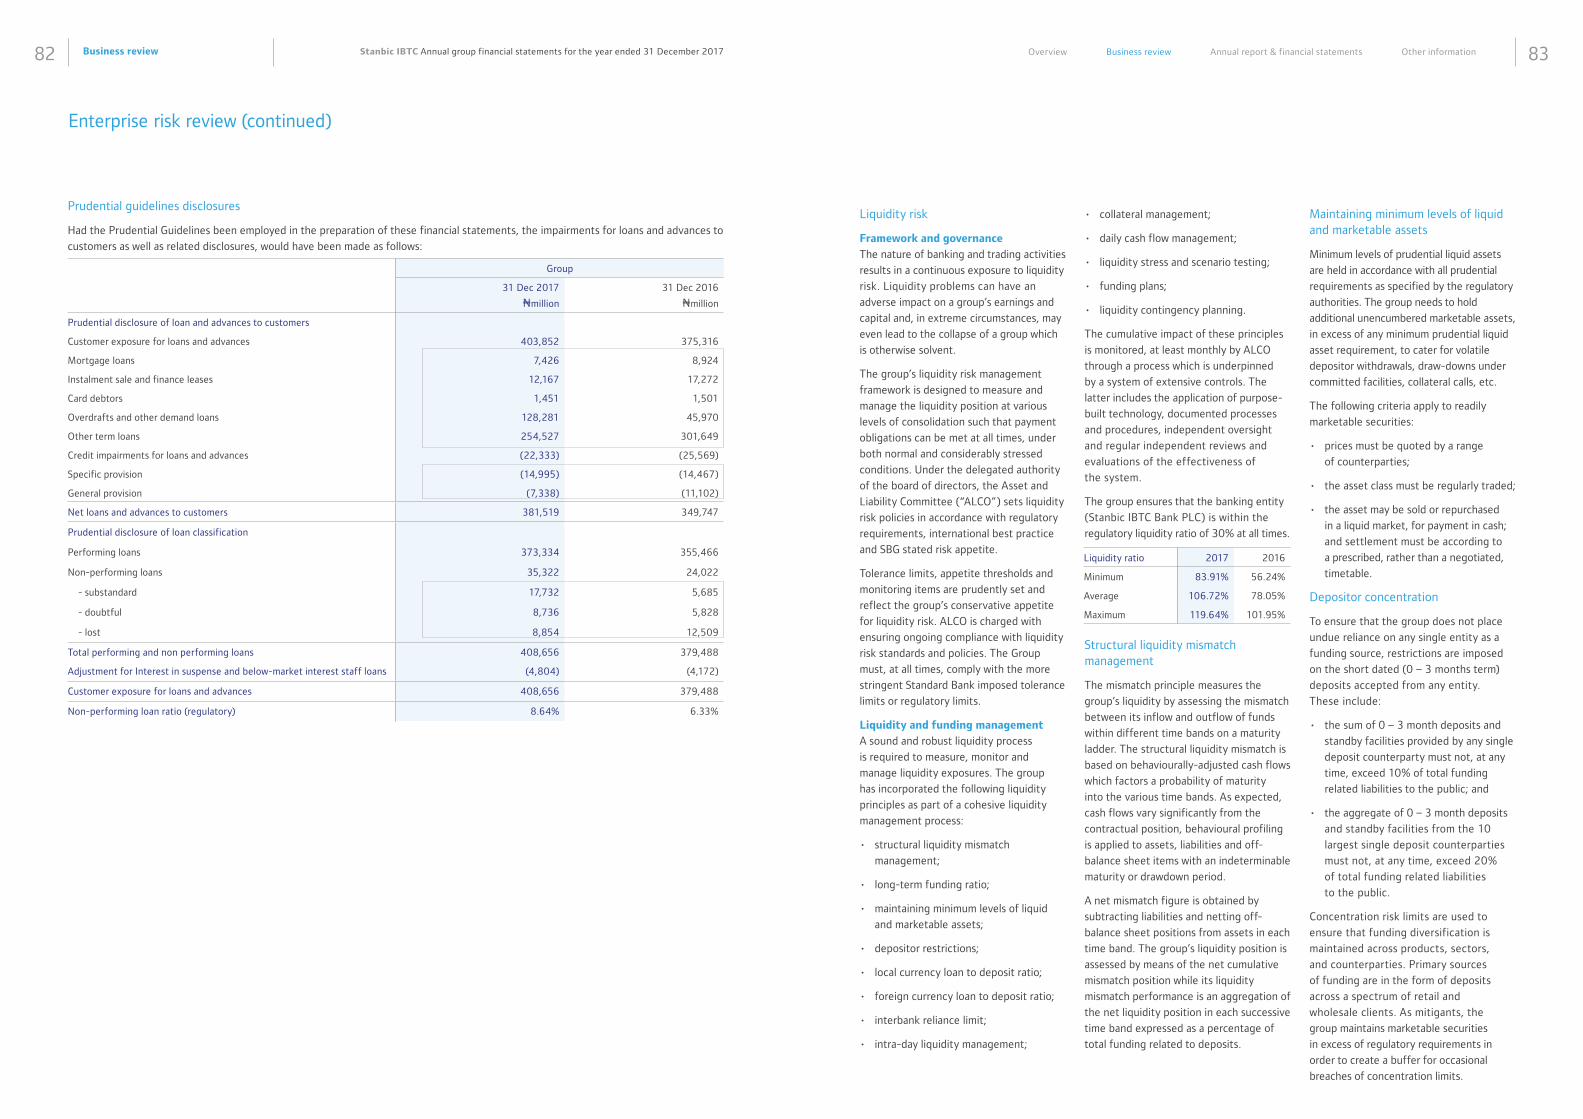
Business review82 83Stanbic IBTC Annual group financial statements for the year ended 31 December 2017 Overview Business review Annual report & financial statements Other information
Enterprise risk review (continued)
Prudential guidelines disclosures
Had the Prudential Guidelines been employed in the preparation of these financial statements, the impairments for loans and advances to
customers as well as related disclosures, would have been made as follows:
Group
31 Dec 2017
Nmillion
31 Dec 2016
Nmillion
Prudential disclosure of loan and advances to customers
Customer exposure for loans and advances 403,852 375,316
Mortgage loans 7,426 8,924
Instalment sale and finance leases 12,167 17,272
Card debtors 1,451 1,501
Overdrafts and other demand loans 128,281 45,970
Other term loans 254,527 301,649
Credit impairments for loans and advances (22,333) (25,569)
Specific provision (14,995) (14,467)
General provision (7,338) (11,102)
Net loans and advances to customers 381,519 349,747
Prudential disclosure of loan classification
Performing loans 373,334 355,466
Non-performing loans 35,322 24,022
- substandard 17,732 5,685
- doubtful 8,736 5,828
- lost 8,854 12,509
Total performing and non performing loans 408,656 379,488
Adjustment for Interest in suspense and below-market interest staff loans (4,804) (4,172)
Customer exposure for loans and advances 408,656 379,488
Non-performing loan ratio (regulatory) 8.64% 6.33%
Liquidity risk
Framework and governance
The nature of banking and trading activities
results in a continuous exposure to liquidity
risk. Liquidity problems can have an
adverse impact on a group’s earnings and
capital and, in extreme circumstances, may
even lead to the collapse of a group which
is otherwise solvent.
The group’s liquidity risk management
framework is designed to measure and
manage the liquidity position at various
levels of consolidation such that payment
obligations can be met at all times, under
both normal and considerably stressed
conditions. Under the delegated authority
of the board of directors, the Asset and
Liability Committee (“ALCO”) sets liquidity
risk policies in accordance with regulatory
requirements, international best practice
and SBG stated risk appetite.
Tolerance limits, appetite thresholds and
monitoring items are prudently set and
reflect the group’s conservative appetite
for liquidity risk. ALCO is charged with
ensuring ongoing compliance with liquidity
risk standards and policies. The Group
must, at all times, comply with the more
stringent Standard Bank imposed tolerance
limits or regulatory limits.
Liquidity and funding management
A sound and robust liquidity process
is required to measure, monitor and
manage liquidity exposures. The group
has incorporated the following liquidity
principles as part of a cohesive liquidity
management process:
• structural liquidity mismatch
management;
• long-term funding ratio;
• maintaining minimum levels of liquid
and marketable assets;
• depositor restrictions;
• local currency loan to deposit ratio;
• foreign currency loan to deposit ratio;
• interbank reliance limit;
• intra-day liquidity management;
• collateral management;
• daily cash flow management;
• liquidity stress and scenario testing;
• funding plans;
• liquidity contingency planning.
The cumulative impact of these principles
is monitored, at least monthly by ALCO
through a process which is underpinned
by a system of extensive controls. The
latter includes the application of purpose-
built technology, documented processes
and procedures, independent oversight
and regular independent reviews and
evaluations of the effectiveness of
the system.
The group ensures that the banking entity
(Stanbic IBTC Bank PLC) is within the
regulatory liquidity ratio of 30% at all times.
Structural liquidity mismatch management
The mismatch principle measures the
group’s liquidity by assessing the mismatch
between its inflow and outflow of funds
within different time bands on a maturity
ladder. The structural liquidity mismatch is
based on behaviourally-adjusted cash flows
which factors a probability of maturity
into the various time bands. As expected,
cash flows vary significantly from the
contractual position, behavioural profiling
is applied to assets, liabilities and off-
balance sheet items with an indeterminable
maturity or drawdown period.
A net mismatch figure is obtained by
subtracting liabilities and netting off-
balance sheet positions from assets in each
time band. The group’s liquidity position is
assessed by means of the net cumulative
mismatch position while its liquidity
mismatch performance is an aggregation of
the net liquidity position in each successive
time band expressed as a percentage of
total funding related to deposits.
Liquidity ratio 2017 2016
Minimum 83.91% 56.24%
Average 106.72% 78.05%
Maximum 119.64% 101.95%
Maintaining minimum levels of liquid and marketable assets
Minimum levels of prudential liquid assets
are held in accordance with all prudential
requirements as specified by the regulatory
authorities. The group needs to hold
additional unencumbered marketable assets,
in excess of any minimum prudential liquid
asset requirement, to cater for volatile
depositor withdrawals, draw-downs under
committed facilities, collateral calls, etc.
The following criteria apply to readily
marketable securities:
• prices must be quoted by a range
of counterparties;
• the asset class must be regularly traded;
• the asset may be sold or repurchased
in a liquid market, for payment in cash;
and settlement must be according to
a prescribed, rather than a negotiated,
timetable.
Depositor concentration
To ensure that the group does not place
undue reliance on any single entity as a
funding source, restrictions are imposed
on the short dated (0 – 3 months term)
deposits accepted from any entity.
These include:
• the sum of 0 – 3 month deposits and
standby facilities provided by any single
deposit counterparty must not, at any
time, exceed 10% of total funding
related liabilities to the public; and
• the aggregate of 0 – 3 month deposits
and standby facilities from the 10
largest single deposit counterparties
must not, at any time, exceed 20%
of total funding related liabilities
to the public.
Concentration risk limits are used to
ensure that funding diversification is
maintained across products, sectors,
and counterparties. Primary sources
of funding are in the form of deposits
across a spectrum of retail and
wholesale clients. As mitigants, the
group maintains marketable securities
in excess of regulatory requirements in
order to create a buffer for occasional
breaches of concentration limits.
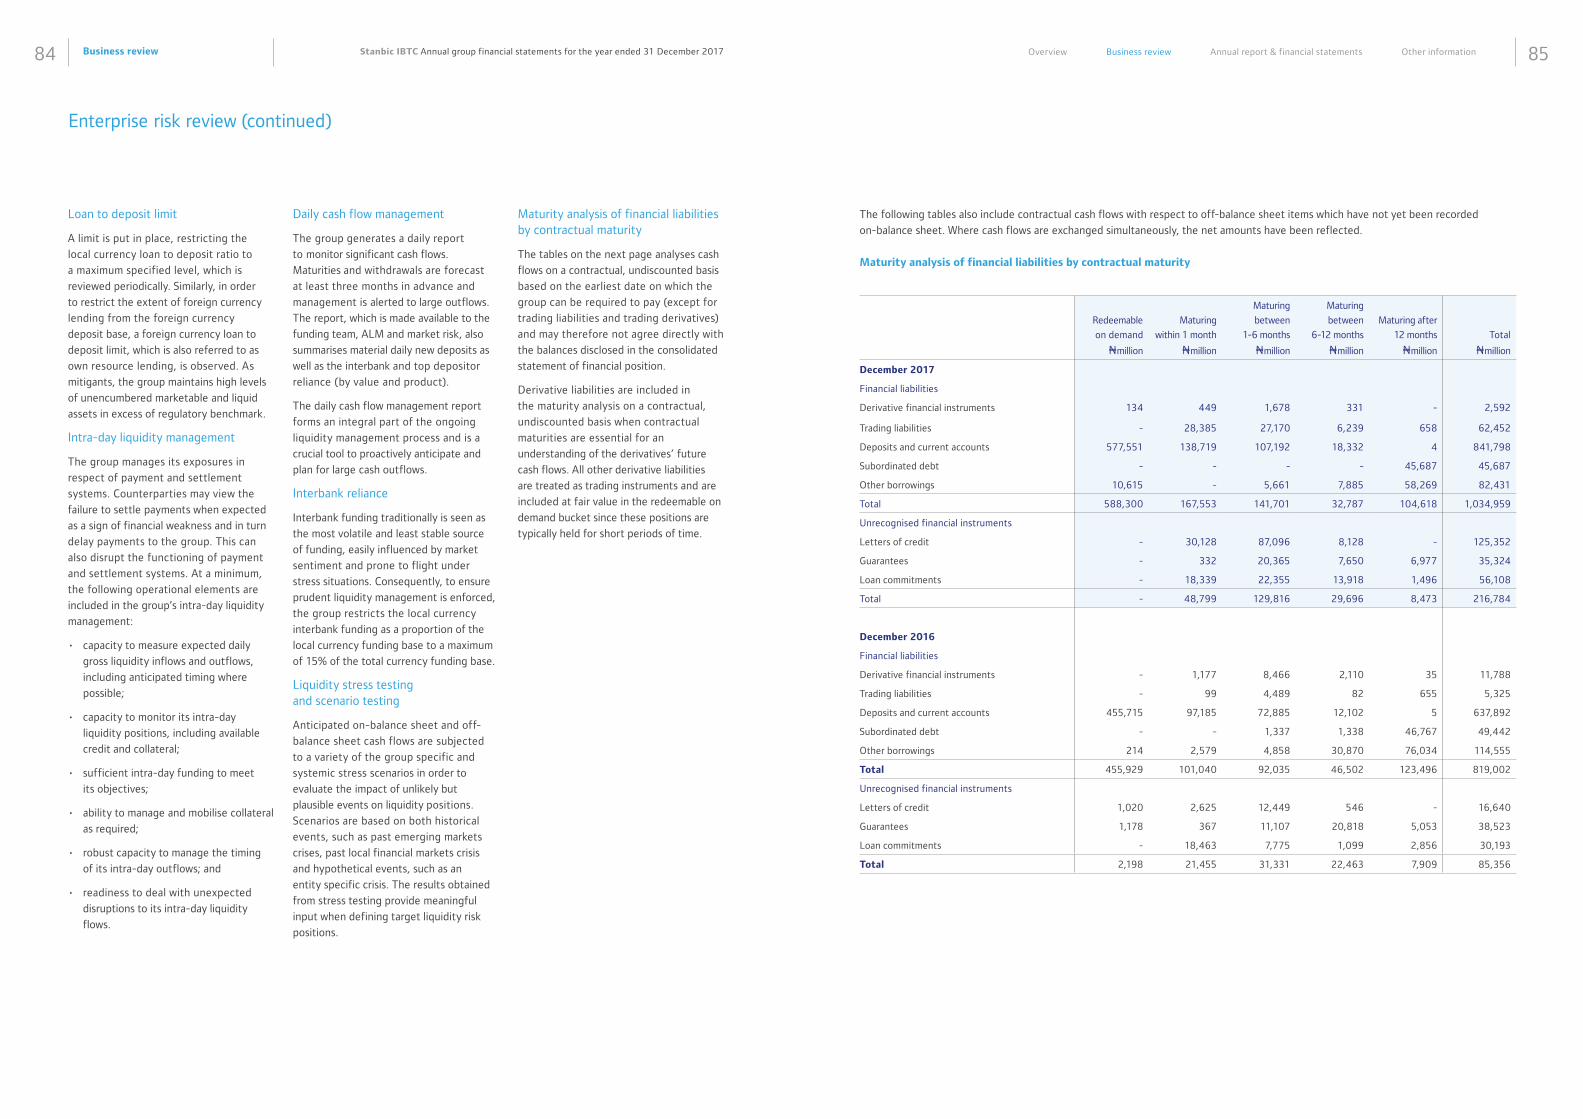
Business review84 85Stanbic IBTC Annual group financial statements for the year ended 31 December 2017 Overview Business review Annual report & financial statements Other information
Enterprise risk review (continued)
Loan to deposit limit
A limit is put in place, restricting the
local currency loan to deposit ratio to
a maximum specified level, which is
reviewed periodically. Similarly, in order
to restrict the extent of foreign currency
lending from the foreign currency
deposit base, a foreign currency loan to
deposit limit, which is also referred to as
own resource lending, is observed. As
mitigants, the group maintains high levels
of unencumbered marketable and liquid
assets in excess of regulatory benchmark.
Intra-day liquidity management
The group manages its exposures in
respect of payment and settlement
systems. Counterparties may view the
failure to settle payments when expected
as a sign of financial weakness and in turn
delay payments to the group. This can
also disrupt the functioning of payment
and settlement systems. At a minimum,
the following operational elements are
included in the group’s intra-day liquidity
management:
• capacity to measure expected daily
gross liquidity inflows and outflows,
including anticipated timing where
possible;
• capacity to monitor its intra-day
liquidity positions, including available
credit and collateral;
• sufficient intra-day funding to meet
its objectives;
• ability to manage and mobilise collateral
as required;
• robust capacity to manage the timing
of its intra-day outflows; and
• readiness to deal with unexpected
disruptions to its intra-day liquidity
flows.
Daily cash flow management
The group generates a daily report
to monitor significant cash flows.
Maturities and withdrawals are forecast
at least three months in advance and
management is alerted to large outflows.
The report, which is made available to the
funding team, ALM and market risk, also
summarises material daily new deposits as
well as the interbank and top depositor
reliance (by value and product).
The daily cash flow management report
forms an integral part of the ongoing
liquidity management process and is a
crucial tool to proactively anticipate and
plan for large cash outflows.
Interbank reliance
Interbank funding traditionally is seen as
the most volatile and least stable source
of funding, easily influenced by market
sentiment and prone to flight under
stress situations. Consequently, to ensure
prudent liquidity management is enforced,
the group restricts the local currency
interbank funding as a proportion of the
local currency funding base to a maximum
of 15% of the total currency funding base.
Liquidity stress testing and scenario testing
Anticipated on-balance sheet and off-
balance sheet cash flows are subjected
to a variety of the group specific and
systemic stress scenarios in order to
evaluate the impact of unlikely but
plausible events on liquidity positions.
Scenarios are based on both historical
events, such as past emerging markets
crises, past local financial markets crisis
and hypothetical events, such as an
entity specific crisis. The results obtained
from stress testing provide meaningful
input when defining target liquidity risk
positions.
Maturity analysis of financial liabilities by contractual maturity
The tables on the next page analyses cash
flows on a contractual, undiscounted basis
based on the earliest date on which the
group can be required to pay (except for
trading liabilities and trading derivatives)
and may therefore not agree directly with
the balances disclosed in the consolidated
statement of financial position.
Derivative liabilities are included in
the maturity analysis on a contractual,
undiscounted basis when contractual
maturities are essential for an
understanding of the derivatives’ future
cash flows. All other derivative liabilities
are treated as trading instruments and are
included at fair value in the redeemable on
demand bucket since these positions are
typically held for short periods of time.
The following tables also include contractual cash flows with respect to off-balance sheet items which have not yet been recorded
on-balance sheet. Where cash flows are exchanged simultaneously, the net amounts have been reflected.
Maturity analysis of financial liabilities by contractual maturity
Redeemable
on demand
Nmillion
Maturing
within 1 month
Nmillion
Maturing
between
1-6 months
Nmillion
Maturing
between
6-12 months
Nmillion
Maturing after
12 months
Nmillion
Total
Nmillion
December 2017
Financial liabilities
Derivative financial instruments 134 449 1,678 331 - 2,592
Trading liabilities - 28,385 27,170 6,239 658 62,452
Deposits and current accounts 577,551 138,719 107,192 18,332 4 841,798
Subordinated debt - - - - 45,687 45,687
Other borrowings 10,615 - 5,661 7,885 58,269 82,431
Total 588,300 167,553 141,701 32,787 104,618 1,034,959
Unrecognised financial instruments
Letters of credit - 30,128 87,096 8,128 - 125,352
Guarantees - 332 20,365 7,650 6,977 35,324
Loan commitments - 18,339 22,355 13,918 1,496 56,108
Total - 48,799 129,816 29,696 8,473 216,784
December 2016
Financial liabilities
Derivative financial instruments - 1,177 8,466 2,110 35 11,788
Trading liabilities - 99 4,489 82 655 5,325
Deposits and current accounts 455,715 97,185 72,885 12,102 5 637,892
Subordinated debt - - 1,337 1,338 46,767 49,442
Other borrowings 214 2,579 4,858 30,870 76,034 114,555
Total 455,929 101,040 92,035 46,502 123,496 819,002
Unrecognised financial instruments
Letters of credit 1,020 2,625 12,449 546 - 16,640
Guarantees 1,178 367 11,107 20,818 5,053 38,523
Loan commitments - 18,463 7,775 1,099 2,856 30,193
Total 2,198 21,455 31,331 22,463 7,909 85,356
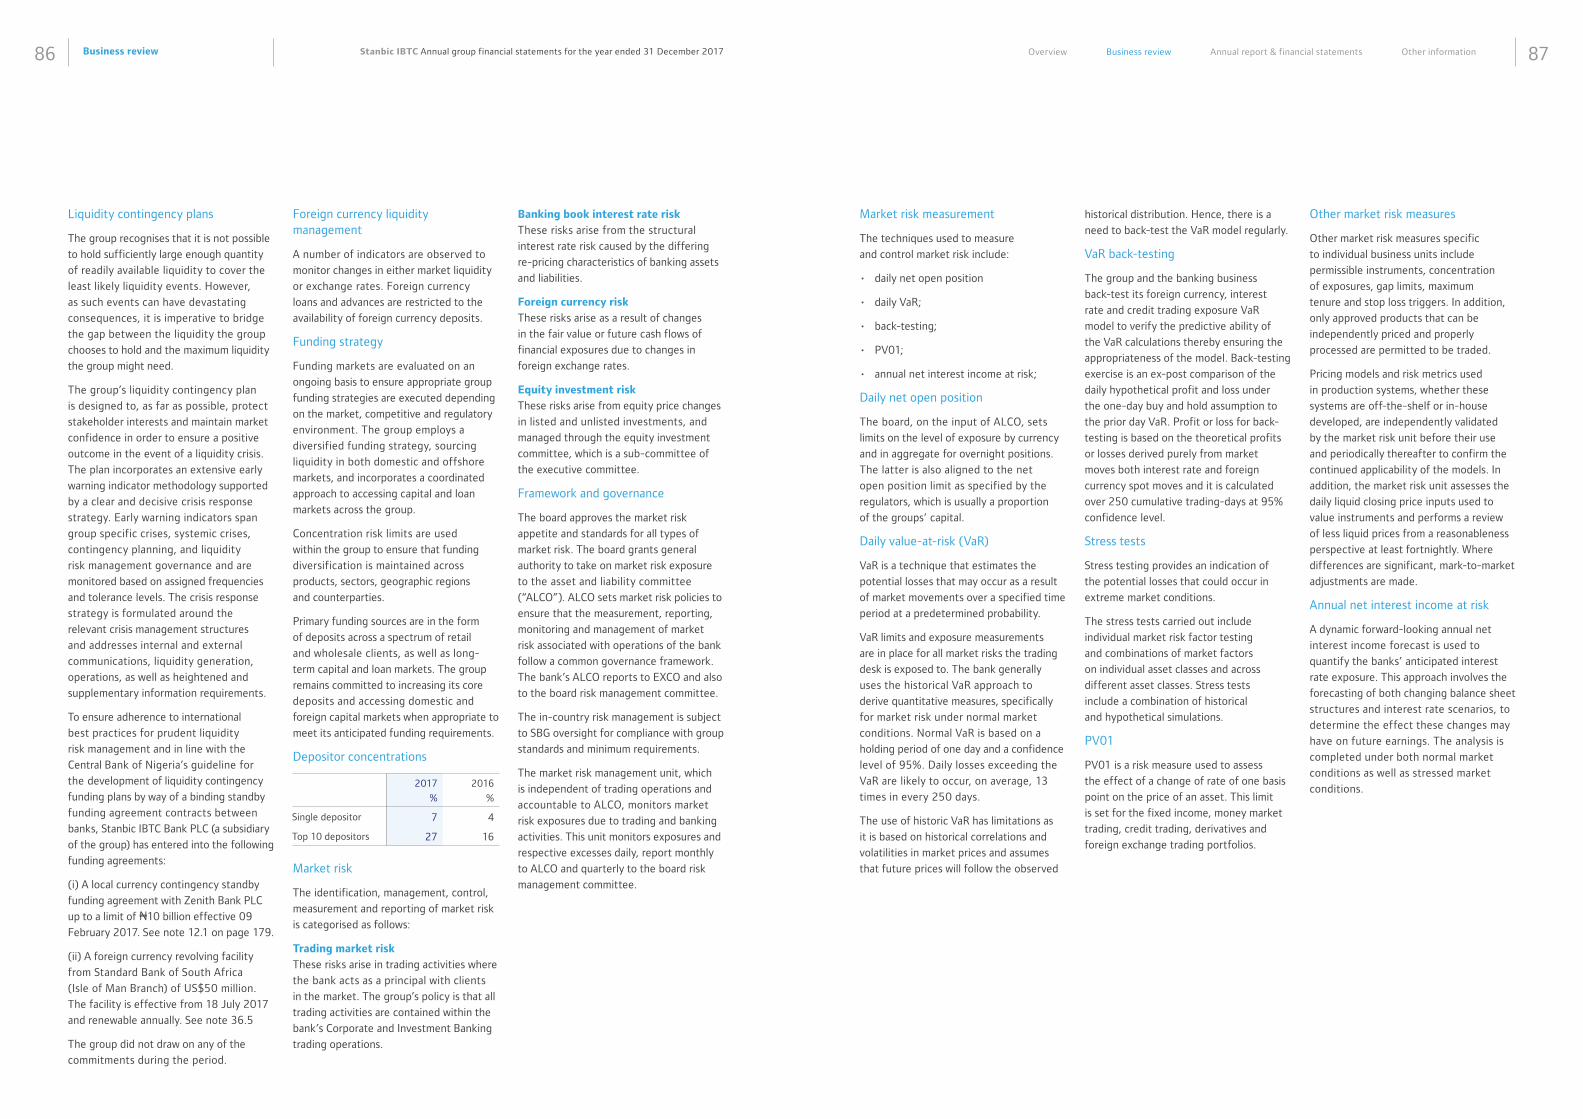
Business review86 87Stanbic IBTC Annual group financial statements for the year ended 31 December 2017 Overview Business review Annual report & financial statements Other information
Foreign currency liquidity management
A number of indicators are observed to
monitor changes in either market liquidity
or exchange rates. Foreign currency
loans and advances are restricted to the
availability of foreign currency deposits.
Funding strategy
Funding markets are evaluated on an
ongoing basis to ensure appropriate group
funding strategies are executed depending
on the market, competitive and regulatory
environment. The group employs a
diversified funding strategy, sourcing
liquidity in both domestic and offshore
markets, and incorporates a coordinated
approach to accessing capital and loan
markets across the group.
Concentration risk limits are used
within the group to ensure that funding
diversification is maintained across
products, sectors, geographic regions
and counterparties.
Primary funding sources are in the form
of deposits across a spectrum of retail
and wholesale clients, as well as long-
term capital and loan markets. The group
remains committed to increasing its core
deposits and accessing domestic and
foreign capital markets when appropriate to
meet its anticipated funding requirements.
Depositor concentrations
Market risk
The identification, management, control,
measurement and reporting of market risk
is categorised as follows:
Trading market risk
These risks arise in trading activities where
the bank acts as a principal with clients
in the market. The group’s policy is that all
trading activities are contained within the
bank’s Corporate and Investment Banking
trading operations.
2017
%
2016
%
Single depositor 7 4
Top 10 depositors 27 16
Liquidity contingency plans
The group recognises that it is not possible
to hold sufficiently large enough quantity
of readily available liquidity to cover the
least likely liquidity events. However,
as such events can have devastating
consequences, it is imperative to bridge
the gap between the liquidity the group
chooses to hold and the maximum liquidity
the group might need.
The group’s liquidity contingency plan
is designed to, as far as possible, protect
stakeholder interests and maintain market
confidence in order to ensure a positive
outcome in the event of a liquidity crisis.
The plan incorporates an extensive early
warning indicator methodology supported
by a clear and decisive crisis response
strategy. Early warning indicators span
group specific crises, systemic crises,
contingency planning, and liquidity
risk management governance and are
monitored based on assigned frequencies
and tolerance levels. The crisis response
strategy is formulated around the
relevant crisis management structures
and addresses internal and external
communications, liquidity generation,
operations, as well as heightened and
supplementary information requirements.
To ensure adherence to international
best practices for prudent liquidity
risk management and in line with the
Central Bank of Nigeria’s guideline for
the development of liquidity contingency
funding plans by way of a binding standby
funding agreement contracts between
banks, Stanbic IBTC Bank PLC (a subsidiary
of the group) has entered into the following
funding agreements:
(i) A local currency contingency standby
funding agreement with Zenith Bank PLC
up to a limit of N10 billion effective 09
February 2017. See note 12.1 on page 179.
(ii) A foreign currency revolving facility
from Standard Bank of South Africa
(Isle of Man Branch) of US$50 million.
The facility is effective from 18 July 2017
and renewable annually. See note 36.5
The group did not draw on any of the
commitments during the period.
Banking book interest rate risk
These risks arise from the structural
interest rate risk caused by the differing
re-pricing characteristics of banking assets
and liabilities.
Foreign currency risk
These risks arise as a result of changes
in the fair value or future cash flows of
financial exposures due to changes in
foreign exchange rates.
Equity investment risk
These risks arise from equity price changes
in listed and unlisted investments, and
managed through the equity investment
committee, which is a sub-committee of
the executive committee.
Framework and governance
The board approves the market risk
appetite and standards for all types of
market risk. The board grants general
authority to take on market risk exposure
to the asset and liability committee
(“ALCO”). ALCO sets market risk policies to
ensure that the measurement, reporting,
monitoring and management of market
risk associated with operations of the bank
follow a common governance framework.
The bank’s ALCO reports to EXCO and also
to the board risk management committee.
The in-country risk management is subject
to SBG oversight for compliance with group
standards and minimum requirements.
The market risk management unit, which
is independent of trading operations and
accountable to ALCO, monitors market
risk exposures due to trading and banking
activities. This unit monitors exposures and
respective excesses daily, report monthly
to ALCO and quarterly to the board risk
management committee.
Market risk measurement
The techniques used to measure
and control market risk include:
• daily net open position
• daily VaR;
• back-testing;
• PV01;
• annual net interest income at risk;
Daily net open position
The board, on the input of ALCO, sets
limits on the level of exposure by currency
and in aggregate for overnight positions.
The latter is also aligned to the net
open position limit as specified by the
regulators, which is usually a proportion
of the groups’ capital.
Daily value-at-risk (VaR)
VaR is a technique that estimates the
potential losses that may occur as a result
of market movements over a specified time
period at a predetermined probability.
VaR limits and exposure measurements
are in place for all market risks the trading
desk is exposed to. The bank generally
uses the historical VaR approach to
derive quantitative measures, specifically
for market risk under normal market
conditions. Normal VaR is based on a
holding period of one day and a confidence
level of 95%. Daily losses exceeding the
VaR are likely to occur, on average, 13
times in every 250 days.
The use of historic VaR has limitations as
it is based on historical correlations and
volatilities in market prices and assumes
that future prices will follow the observed
historical distribution. Hence, there is a
need to back-test the VaR model regularly.
VaR back-testing
The group and the banking business
back-test its foreign currency, interest
rate and credit trading exposure VaR
model to verify the predictive ability of
the VaR calculations thereby ensuring the
appropriateness of the model. Back-testing
exercise is an ex-post comparison of the
daily hypothetical profit and loss under
the one-day buy and hold assumption to
the prior day VaR. Profit or loss for back-
testing is based on the theoretical profits
or losses derived purely from market
moves both interest rate and foreign
currency spot moves and it is calculated
over 250 cumulative trading-days at 95%
confidence level.
Stress tests
Stress testing provides an indication of
the potential losses that could occur in
extreme market conditions.
The stress tests carried out include
individual market risk factor testing
and combinations of market factors
on individual asset classes and across
different asset classes. Stress tests
include a combination of historical
and hypothetical simulations.
PV01
PV01 is a risk measure used to assess
the effect of a change of rate of one basis
point on the price of an asset. This limit
is set for the fixed income, money market
trading, credit trading, derivatives and
foreign exchange trading portfolios.
Other market risk measures
Other market risk measures specific
to individual business units include
permissible instruments, concentration
of exposures, gap limits, maximum
tenure and stop loss triggers. In addition,
only approved products that can be
independently priced and properly
processed are permitted to be traded.
Pricing models and risk metrics used
in production systems, whether these
systems are off-the-shelf or in-house
developed, are independently validated
by the market risk unit before their use
and periodically thereafter to confirm the
continued applicability of the models. In
addition, the market risk unit assesses the
daily liquid closing price inputs used to
value instruments and performs a review
of less liquid prices from a reasonableness
perspective at least fortnightly. Where
differences are significant, mark-to-market
adjustments are made.
Annual net interest income at risk
A dynamic forward-looking annual net
interest income forecast is used to
quantify the banks’ anticipated interest
rate exposure. This approach involves the
forecasting of both changing balance sheet
structures and interest rate scenarios, to
determine the effect these changes may
have on future earnings. The analysis is
completed under both normal market
conditions as well as stressed market
conditions.
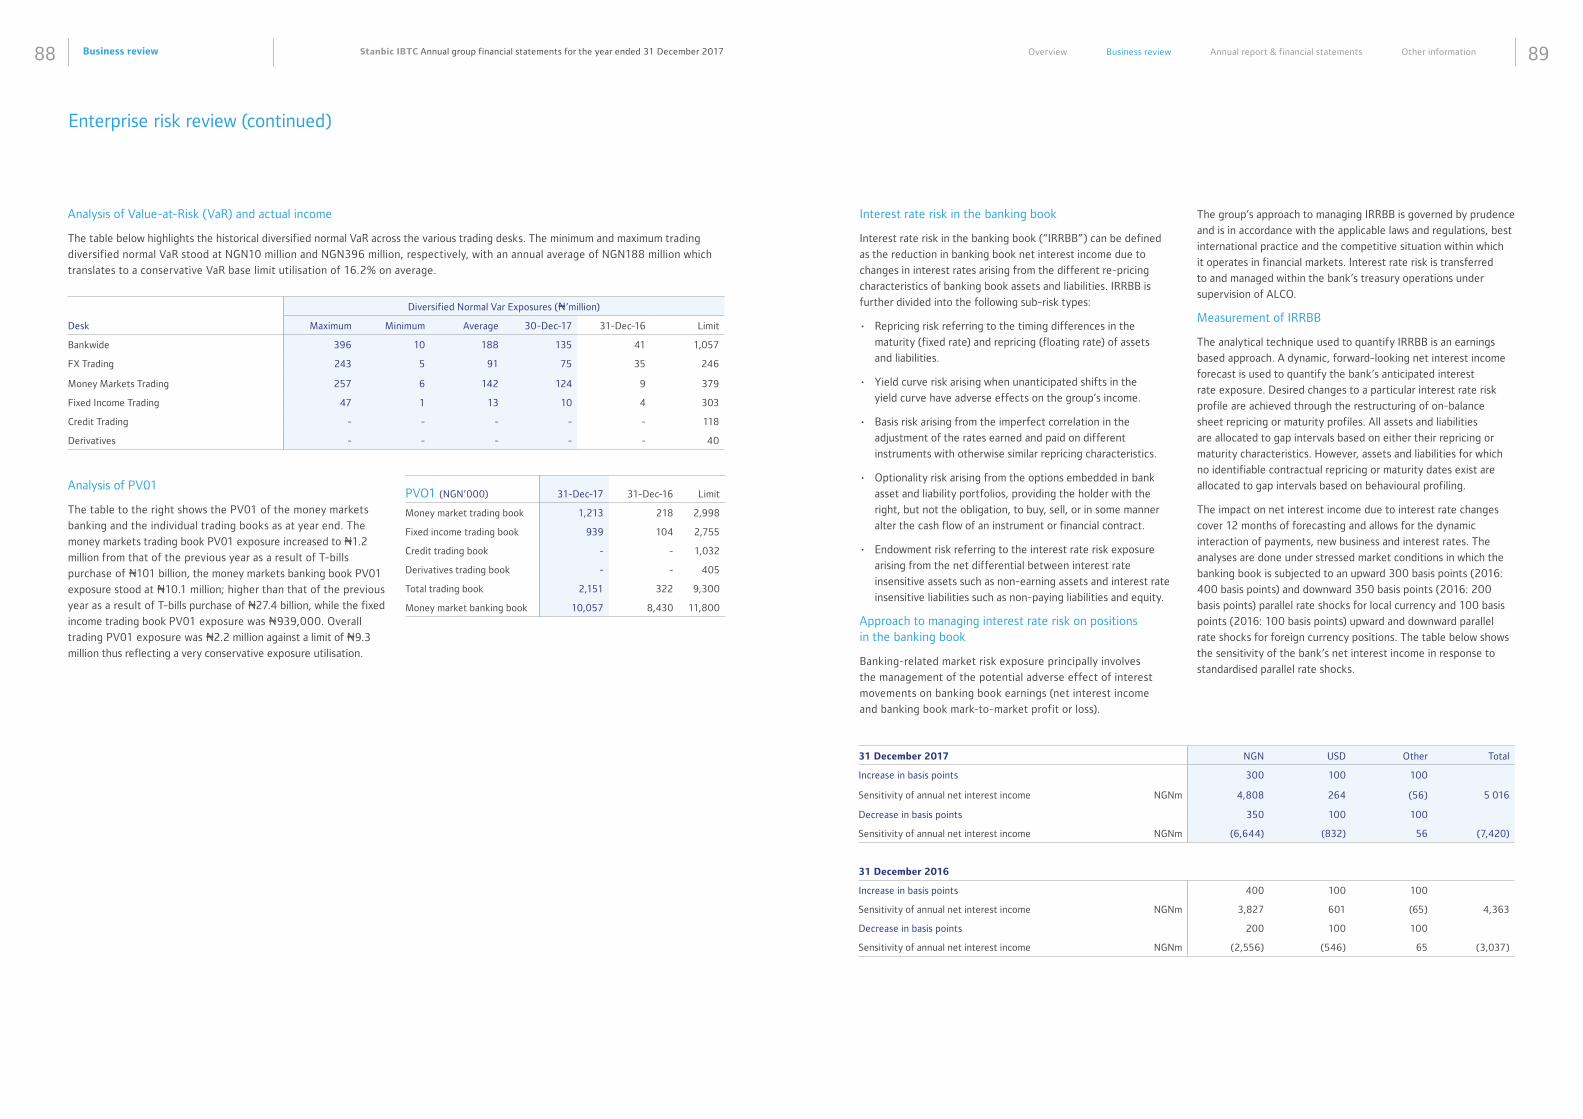
Business review88 89Stanbic IBTC Annual group financial statements for the year ended 31 December 2017 Overview Business review Annual report & financial statements Other information
Enterprise risk review (continued)
Diversified Normal Var Exposures (N’million)
Desk Maximum Minimum Average 30-Dec-17 31-Dec-16 Limit
Bankwide 396 10 188 135 41 1,057
FX Trading 243 5 91 75 35 246
Money Markets Trading 257 6 142 124 9 379
Fixed Income Trading 47 1 13 10 4 303
Credit Trading - - - - - 118
Derivatives - - - - - 40
PVO1 (NGN’000) 31-Dec-17 31-Dec-16 Limit
Money market trading book 1,213 218 2,998
Fixed income trading book 939 104 2,755
Credit trading book - - 1,032
Derivatives trading book - - 405
Total trading book 2,151 322 9,300
Money market banking book 10,057 8,430 11,800
Analysis of PV01
The table to the right shows the PV01 of the money markets
banking and the individual trading books as at year end. The
money markets trading book PV01 exposure increased to N1.2
million from that of the previous year as a result of T-bills
purchase of N101 billion, the money markets banking book PV01
exposure stood at N10.1 million; higher than that of the previous
year as a result of T-bills purchase of N27.4 billion, while the fixed
income trading book PV01 exposure was N939,000. Overall
trading PV01 exposure was N2.2 million against a limit of N9.3
million thus reflecting a very conservative exposure utilisation.
Analysis of Value-at-Risk (VaR) and actual income
The table below highlights the historical diversified normal VaR across the various trading desks. The minimum and maximum trading
diversified normal VaR stood at NGN10 million and NGN396 million, respectively, with an annual average of NGN188 million which
translates to a conservative VaR base limit utilisation of 16.2% on average.
Interest rate risk in the banking book
Interest rate risk in the banking book (“IRRBB”) can be defined
as the reduction in banking book net interest income due to
changes in interest rates arising from the different re-pricing
characteristics of banking book assets and liabilities. IRRBB is
further divided into the following sub-risk types:
• Repricing risk referring to the timing differences in the
maturity (fixed rate) and repricing (floating rate) of assets
and liabilities.
• Yield curve risk arising when unanticipated shifts in the
yield curve have adverse effects on the group’s income.
• Basis risk arising from the imperfect correlation in the
adjustment of the rates earned and paid on different
instruments with otherwise similar repricing characteristics.
• Optionality risk arising from the options embedded in bank
asset and liability portfolios, providing the holder with the
right, but not the obligation, to buy, sell, or in some manner
alter the cash flow of an instrument or financial contract.
• Endowment risk referring to the interest rate risk exposure
arising from the net differential between interest rate
insensitive assets such as non-earning assets and interest rate
insensitive liabilities such as non-paying liabilities and equity.
Approach to managing interest rate risk on positions in the banking book
Banking-related market risk exposure principally involves
the management of the potential adverse effect of interest
movements on banking book earnings (net interest income
and banking book mark-to-market profit or loss).
31 December 2017 NGN USD Other Total
Increase in basis points 300 100 100
Sensitivity of annual net interest income NGNm 4,808 264 (56) 5 016
Decrease in basis points 350 100 100
Sensitivity of annual net interest income NGNm (6,644) (832) 56 (7,420)
31 December 2016
Increase in basis points 400 100 100
Sensitivity of annual net interest income NGNm 3,827 601 (65) 4,363
Decrease in basis points 200 100 100
Sensitivity of annual net interest income NGNm (2,556) (546) 65 (3,037)
The group’s approach to managing IRRBB is governed by prudence
and is in accordance with the applicable laws and regulations, best
international practice and the competitive situation within which
it operates in financial markets. Interest rate risk is transferred
to and managed within the bank’s treasury operations under
supervision of ALCO.
Measurement of IRRBB
The analytical technique used to quantify IRRBB is an earnings
based approach. A dynamic, forward-looking net interest income
forecast is used to quantify the bank’s anticipated interest
rate exposure. Desired changes to a particular interest rate risk
profile are achieved through the restructuring of on-balance
sheet repricing or maturity profiles. All assets and liabilities
are allocated to gap intervals based on either their repricing or
maturity characteristics. However, assets and liabilities for which
no identifiable contractual repricing or maturity dates exist are
allocated to gap intervals based on behavioural profiling.
The impact on net interest income due to interest rate changes
cover 12 months of forecasting and allows for the dynamic
interaction of payments, new business and interest rates. The
analyses are done under stressed market conditions in which the
banking book is subjected to an upward 300 basis points (2016:
400 basis points) and downward 350 basis points (2016: 200
basis points) parallel rate shocks for local currency and 100 basis
points (2016: 100 basis points) upward and downward parallel
rate shocks for foreign currency positions. The table below shows
the sensitivity of the bank’s net interest income in response to
standardised parallel rate shocks.
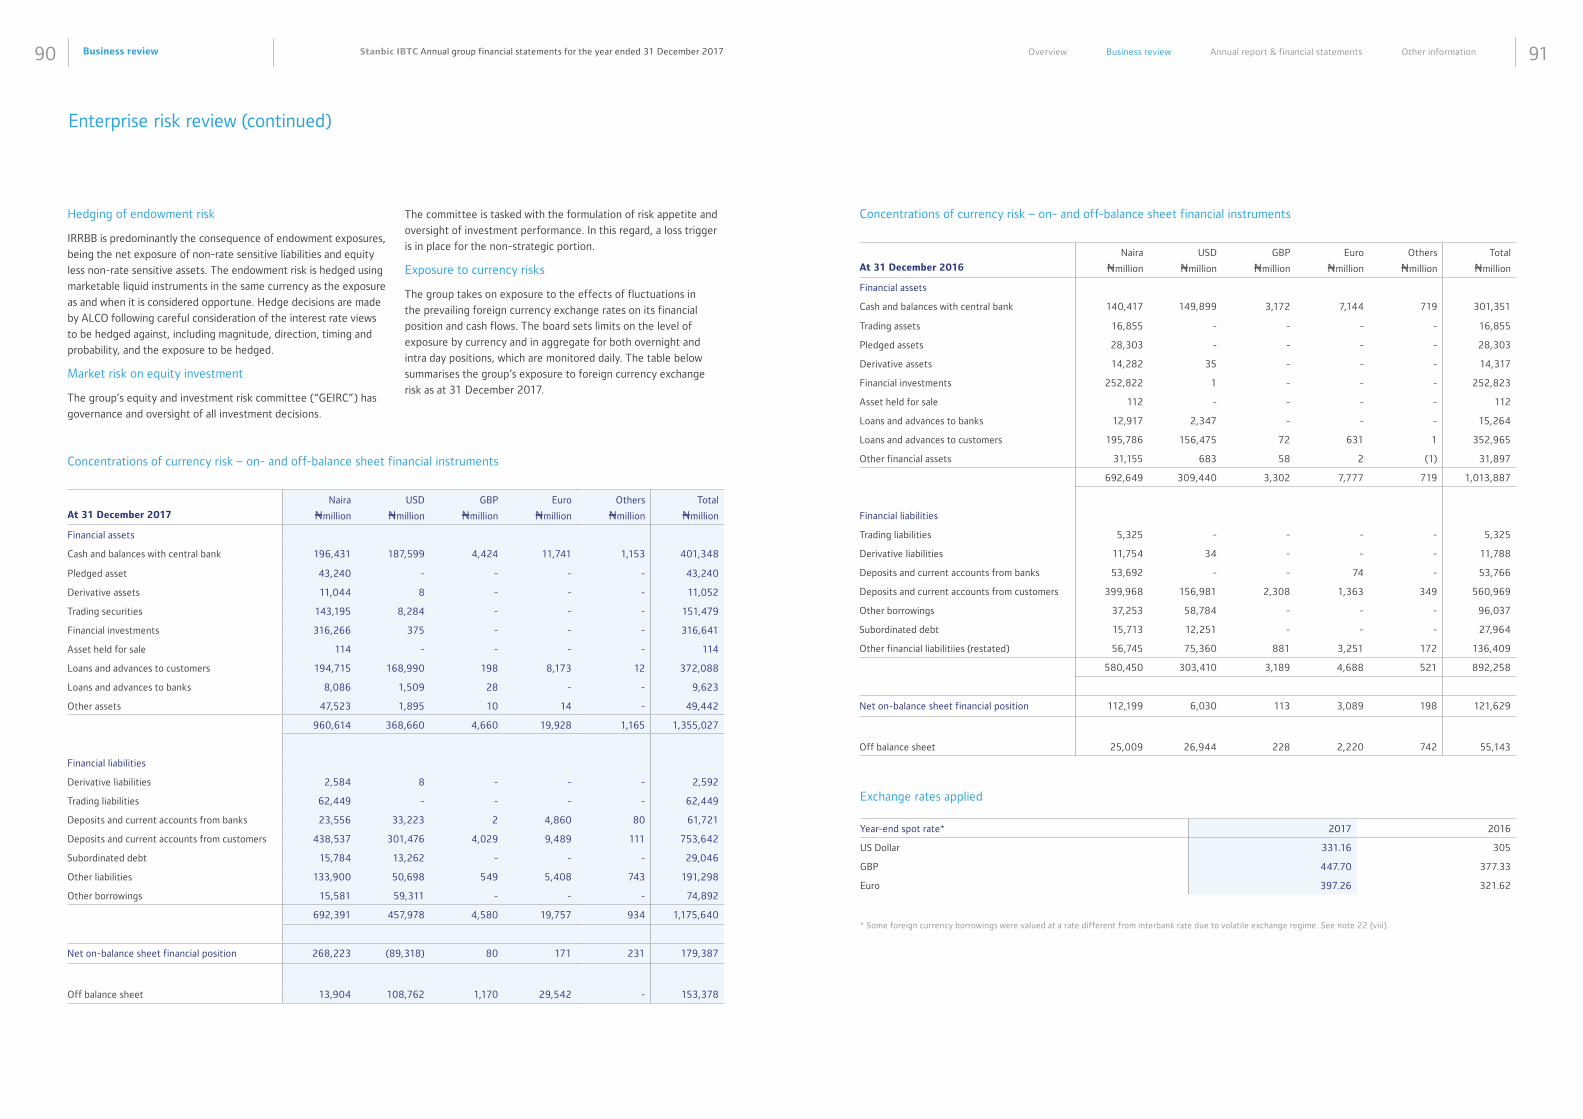
Business review90 91Stanbic IBTC Annual group financial statements for the year ended 31 December 2017 Overview Business review Annual report & financial statements Other information
Enterprise risk review (continued)
Concentrations of currency risk – on- and off-balance sheet financial instruments
At 31 December 2017
Naira
Nmillion
USD
Nmillion
GBP
Nmillion
Euro
Nmillion
Others
Nmillion
Total
Nmillion
Financial assets
Cash and balances with central bank 196,431 187,599 4,424 11,741 1,153 401,348
Pledged asset 43,240 - - - - 43,240
Derivative assets 11,044 8 - - - 11,052
Trading securities 143,195 8,284 - - - 151,479
Financial investments 316,266 375 - - - 316,641
Asset held for sale 114 - - - - 114
Loans and advances to customers 194,715 168,990 198 8,173 12 372,088
Loans and advances to banks 8,086 1,509 28 - - 9,623
Other assets 47,523 1,895 10 14 - 49,442
960,614 368,660 4,660 19,928 1,165 1,355,027
Financial liabilities
Derivative liabilities 2,584 8 - - - 2,592
Trading liabilities 62,449 - - - - 62,449
Deposits and current accounts from banks 23,556 33,223 2 4,860 80 61,721
Deposits and current accounts from customers 438,537 301,476 4,029 9,489 111 753,642
Subordinated debt 15,784 13,262 - - - 29,046
Other liabilities 133,900 50,698 549 5,408 743 191,298
Other borrowings 15,581 59,311 - - - 74,892
692,391 457,978 4,580 19,757 934 1,175,640
Net on-balance sheet financial position 268,223 (89,318) 80 171 231 179,387
Off balance sheet 13,904 108,762 1,170 29,542 - 153,378
Hedging of endowment risk
IRRBB is predominantly the consequence of endowment exposures,
being the net exposure of non-rate sensitive liabilities and equity
less non-rate sensitive assets. The endowment risk is hedged using
marketable liquid instruments in the same currency as the exposure
as and when it is considered opportune. Hedge decisions are made
by ALCO following careful consideration of the interest rate views
to be hedged against, including magnitude, direction, timing and
probability, and the exposure to be hedged.
Market risk on equity investment
The group’s equity and investment risk committee (“GEIRC”) has
governance and oversight of all investment decisions.
The committee is tasked with the formulation of risk appetite and
oversight of investment performance. In this regard, a loss trigger
is in place for the non-strategic portion.
Exposure to currency risks
The group takes on exposure to the effects of fluctuations in
the prevailing foreign currency exchange rates on its financial
position and cash flows. The board sets limits on the level of
exposure by currency and in aggregate for both overnight and
intra day positions, which are monitored daily. The table below
summarises the group’s exposure to foreign currency exchange
risk as at 31 December 2017.
Concentrations of currency risk – on- and off-balance sheet financial instruments
At 31 December 2016
Naira
Nmillion
USD
Nmillion
GBP
Nmillion
Euro
Nmillion
Others
Nmillion
Total
Nmillion
Financial assets
Cash and balances with central bank 140,417 149,899 3,172 7,144 719 301,351
Trading assets 16,855 - - - - 16,855
Pledged assets 28,303 - - - - 28,303
Derivative assets 14,282 35 - - - 14,317
Financial investments 252,822 1 - - - 252,823
Asset held for sale 112 - - - - 112
Loans and advances to banks 12,917 2,347 - - - 15,264
Loans and advances to customers 195,786 156,475 72 631 1 352,965
Other financial assets 31,155 683 58 2 (1) 31,897
692,649 309,440 3,302 7,777 719 1,013,887
Financial liabilities
Trading liabilities 5,325 - - - - 5,325
Derivative liabilities 11,754 34 - - - 11,788
Deposits and current accounts from banks 53,692 - - 74 - 53,766
Deposits and current accounts from customers 399,968 156,981 2,308 1,363 349 560,969
Other borrowings 37,253 58,784 - - - 96,037
Subordinated debt 15,713 12,251 - - - 27,964
Other financial liabilitiies (restated) 56,745 75,360 881 3,251 172 136,409
580,450 303,410 3,189 4,688 521 892,258
Net on-balance sheet financial position 112,199 6,030 113 3,089 198 121,629
Off balance sheet 25,009 26,944 228 2,220 742 55,143
Year-end spot rate* 2017 2016
US Dollar 331.16 305
GBP 447.70 377.33
Euro 397.26 321.62
Exchange rates applied
* Some foreign currency borrowings were valued at a rate different from interbank rate due to volatile exchange regime. See note 22 (viii).
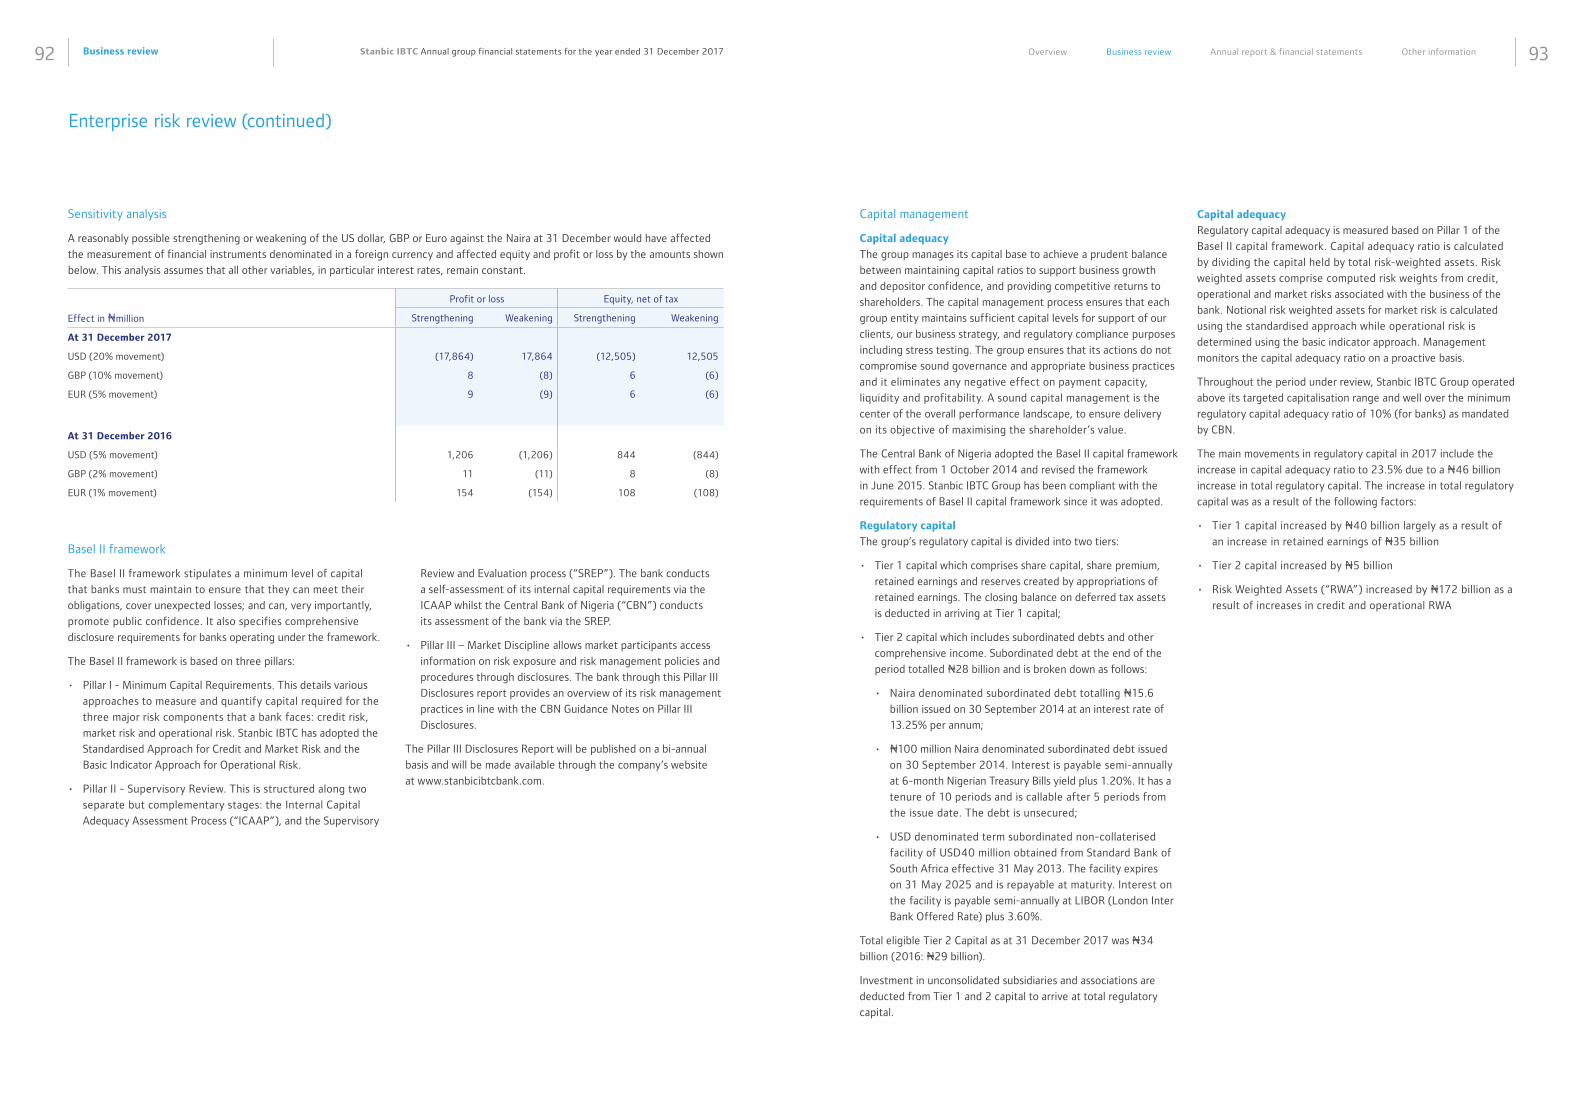
Business review92 93Stanbic IBTC Annual group financial statements for the year ended 31 December 2017 Overview Business review Annual report & financial statements Other information
Enterprise risk review (continued)
Profit or loss Equity, net of tax
Effect in Nmillion Strengthening Weakening Strengthening Weakening
At 31 December 2017
USD (20% movement) (17,864) 17,864 (12,505) 12,505
GBP (10% movement) 8 (8) 6 (6)
EUR (5% movement) 9 (9) 6 (6)
At 31 December 2016
USD (5% movement) 1,206 (1,206) 844 (844)
GBP (2% movement) 11 (11) 8 (8)
EUR (1% movement) 154 (154) 108 (108)
Sensitivity analysis
A reasonably possible strengthening or weakening of the US dollar, GBP or Euro against the Naira at 31 December would have affected
the measurement of financial instruments denominated in a foreign currency and affected equity and profit or loss by the amounts shown
below. This analysis assumes that all other variables, in particular interest rates, remain constant.
Basel II framework
The Basel II framework stipulates a minimum level of capital
that banks must maintain to ensure that they can meet their
obligations, cover unexpected losses; and can, very importantly,
promote public confidence. It also specifies comprehensive
disclosure requirements for banks operating under the framework.
The Basel II framework is based on three pillars:
• Pillar I - Minimum Capital Requirements. This details various
approaches to measure and quantify capital required for the
three major risk components that a bank faces: credit risk,
market risk and operational risk. Stanbic IBTC has adopted the
Standardised Approach for Credit and Market Risk and the
Basic Indicator Approach for Operational Risk.
• Pillar II - Supervisory Review. This is structured along two
separate but complementary stages: the Internal Capital
Adequacy Assessment Process (“ICAAP”), and the Supervisory
Review and Evaluation process (“SREP”). The bank conducts
a self-assessment of its internal capital requirements via the
ICAAP whilst the Central Bank of Nigeria (“CBN”) conducts
its assessment of the bank via the SREP.
• Pillar III – Market Discipline allows market participants access
information on risk exposure and risk management policies and
procedures through disclosures. The bank through this Pillar III
Disclosures report provides an overview of its risk management
practices in line with the CBN Guidance Notes on Pillar III
Disclosures.
The Pillar III Disclosures Report will be published on a bi-annual
basis and will be made available through the company’s website
at www.stanbicibtcbank.com.
Capital management
Capital adequacy
The group manages its capital base to achieve a prudent balance
between maintaining capital ratios to support business growth
and depositor confidence, and providing competitive returns to
shareholders. The capital management process ensures that each
group entity maintains sufficient capital levels for support of our
clients, our business strategy, and regulatory compliance purposes
including stress testing. The group ensures that its actions do not
compromise sound governance and appropriate business practices
and it eliminates any negative effect on payment capacity,
liquidity and profitability. A sound capital management is the
center of the overall performance landscape, to ensure delivery
on its objective of maximising the shareholder’s value.
The Central Bank of Nigeria adopted the Basel II capital framework
with effect from 1 October 2014 and revised the framework
in June 2015. Stanbic IBTC Group has been compliant with the
requirements of Basel II capital framework since it was adopted.
Regulatory capital
The group’s regulatory capital is divided into two tiers:
• Tier 1 capital which comprises share capital, share premium,
retained earnings and reserves created by appropriations of
retained earnings. The closing balance on deferred tax assets
is deducted in arriving at Tier 1 capital;
• Tier 2 capital which includes subordinated debts and other
comprehensive income. Subordinated debt at the end of the
period totalled N28 billion and is broken down as follows:
• Naira denominated subordinated debt totalling N15.6
billion issued on 30 September 2014 at an interest rate of
13.25% per annum;
• N100 million Naira denominated subordinated debt issued
on 30 September 2014. Interest is payable semi-annually
at 6-month Nigerian Treasury Bills yield plus 1.20%. It has a
tenure of 10 periods and is callable after 5 periods from
the issue date. The debt is unsecured;
• USD denominated term subordinated non-collaterised
facility of USD40 million obtained from Standard Bank of
South Africa effective 31 May 2013. The facility expires
on 31 May 2025 and is repayable at maturity. Interest on
the facility is payable semi-annually at LIBOR (London Inter
Bank Offered Rate) plus 3.60%.
Total eligible Tier 2 Capital as at 31 December 2017 was N34
billion (2016: N29 billion).
Investment in unconsolidated subsidiaries and associations are
deducted from Tier 1 and 2 capital to arrive at total regulatory
capital.
Capital adequacy
Regulatory capital adequacy is measured based on Pillar 1 of the
Basel II capital framework. Capital adequacy ratio is calculated
by dividing the capital held by total risk-weighted assets. Risk
weighted assets comprise computed risk weights from credit,
operational and market risks associated with the business of the
bank. Notional risk weighted assets for market risk is calculated
using the standardised approach while operational risk is
determined using the basic indicator approach. Management
monitors the capital adequacy ratio on a proactive basis.
Throughout the period under review, Stanbic IBTC Group operated
above its targeted capitalisation range and well over the minimum
regulatory capital adequacy ratio of 10% (for banks) as mandated
by CBN.
The main movements in regulatory capital in 2017 include the
increase in capital adequacy ratio to 23.5% due to a N46 billion
increase in total regulatory capital. The increase in total regulatory
capital was as a result of the following factors:
• Tier 1 capital increased by N40 billion largely as a result of
an increase in retained earnings of N35 billion
• Tier 2 capital increased by N5 billion
• Risk Weighted Assets (“RWA”) increased by N172 billion as a
result of increases in credit and operational RWA
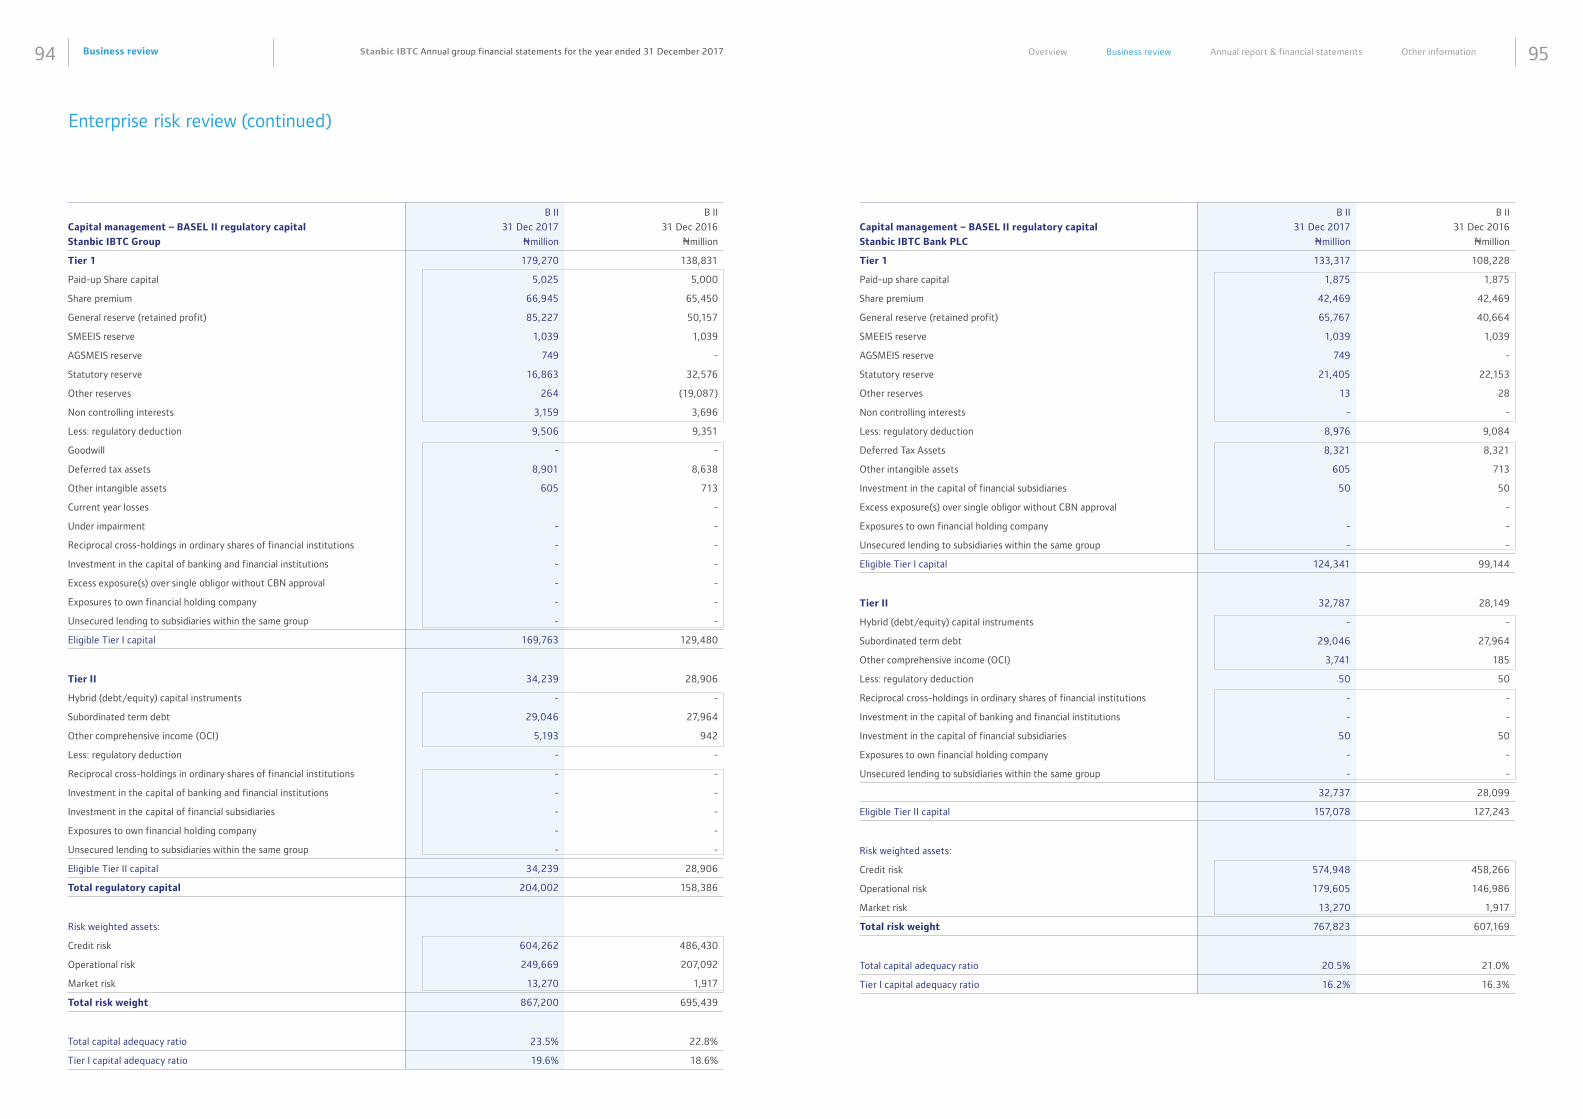
Business review94 95Stanbic IBTC Annual group financial statements for the year ended 31 December 2017 Overview Business review Annual report & financial statements Other information
Enterprise risk review (continued)
Capital management – BASEL II regulatory capital
Stanbic IBTC Group
B II
31 Dec 2017
Nmillion
B II
31 Dec 2016
Nmillion
Tier 1 179,270 138,831
Paid-up Share capital 5,025 5,000
Share premium 66,945 65,450
General reserve (retained profit) 85,227 50,157
SMEEIS reserve 1,039 1,039
AGSMEIS reserve 749 -
Statutory reserve 16,863 32,576
Other reserves 264 (19,087)
Non controlling interests 3,159 3,696
Less: regulatory deduction 9,506 9,351
Goodwill - -
Deferred tax assets 8,901 8,638
Other intangible assets 605 713
Current year losses -
Under impairment - -
Reciprocal cross-holdings in ordinary shares of financial institutions - -
Investment in the capital of banking and financial institutions - -
Excess exposure(s) over single obligor without CBN approval - -
Exposures to own financial holding company - -
Unsecured lending to subsidiaries within the same group - -
Eligible Tier I capital 169,763 129,480
Tier II 34,239 28,906
Hybrid (debt/equity) capital instruments - -
Subordinated term debt 29,046 27,964
Other comprehensive income (OCI) 5,193 942
Less: regulatory deduction - -
Reciprocal cross-holdings in ordinary shares of financial institutions - -
Investment in the capital of banking and financial institutions - -
Investment in the capital of financial subsidiaries - -
Exposures to own financial holding company - -
Unsecured lending to subsidiaries within the same group - -
Eligible Tier II capital 34,239 28,906
Total regulatory capital 204,002 158,386
Risk weighted assets:
Credit risk 604,262 486,430
Operational risk 249,669 207,092
Market risk 13,270 1,917
Total risk weight 867,200 695,439
Total capital adequacy ratio 23.5% 22.8%
Tier I capital adequacy ratio 19.6% 18.6%
Capital management – BASEL II regulatory capital
Stanbic IBTC Bank PLC
B II
31 Dec 2017
Nmillion
B II
31 Dec 2016
Nmillion
Tier 1 133,317 108,228
Paid-up share capital 1,875 1,875
Share premium 42,469 42,469
General reserve (retained profit) 65,767 40,664
SMEEIS reserve 1,039 1,039
AGSMEIS reserve 749 -
Statutory reserve 21,405 22,153
Other reserves 13 28
Non controlling interests - -
Less: regulatory deduction 8,976 9,084
Deferred Tax Assets 8,321 8,321
Other intangible assets 605 713
Investment in the capital of financial subsidiaries 50 50
Excess exposure(s) over single obligor without CBN approval -
Exposures to own financial holding company - -
Unsecured lending to subsidiaries within the same group - -
Eligible Tier I capital 124,341 99,144
Tier II 32,787 28,149
Hybrid (debt/equity) capital instruments - -
Subordinated term debt 29,046 27,964
Other comprehensive income (OCI) 3,741 185
Less: regulatory deduction 50 50
Reciprocal cross-holdings in ordinary shares of financial institutions - -
Investment in the capital of banking and financial institutions - -
Investment in the capital of financial subsidiaries 50 50
Exposures to own financial holding company - -
Unsecured lending to subsidiaries within the same group - -
32,737 28,099
Eligible Tier II capital 157,078 127,243
Risk weighted assets:
Credit risk 574,948 458,266
Operational risk 179,605 146,986
Market risk 13,270 1,917
Total risk weight 767,823 607,169
Total capital adequacy ratio 20.5% 21.0%
Tier I capital adequacy ratio 16.2% 16.3%

97
Foundations designed for
in our people, skills and strengthsWe know the soundest investment is one that is based in people, for people. Which is why we invest in everyone in different ways, because we believe that knowledge and its empowerment is pivotal to our success.
Be it through our Assets management experts, our Youth Leadership Series, the schools we have donated to for the betterment of young Nigerians or even podcasts for our customers on how they can save, invest or simply learn more about how banking works, we want everyone to grow with us.
This is what drives us at Stanbic IBTC
98100106107122124128
130
136
137
244246
Board of directorsDirectors’ reportStatement of directors’ responsibilityCorporate governance report Report of the audit committeeIndependent auditors reportConsolidated and separate statement of financial positionConsolidated and separate statement of profit and lossConsolidated and separate statement of cash flowsNotes to the consolidated and separate financial statementAnnexure AAnnexure B
Annual report & financial statements
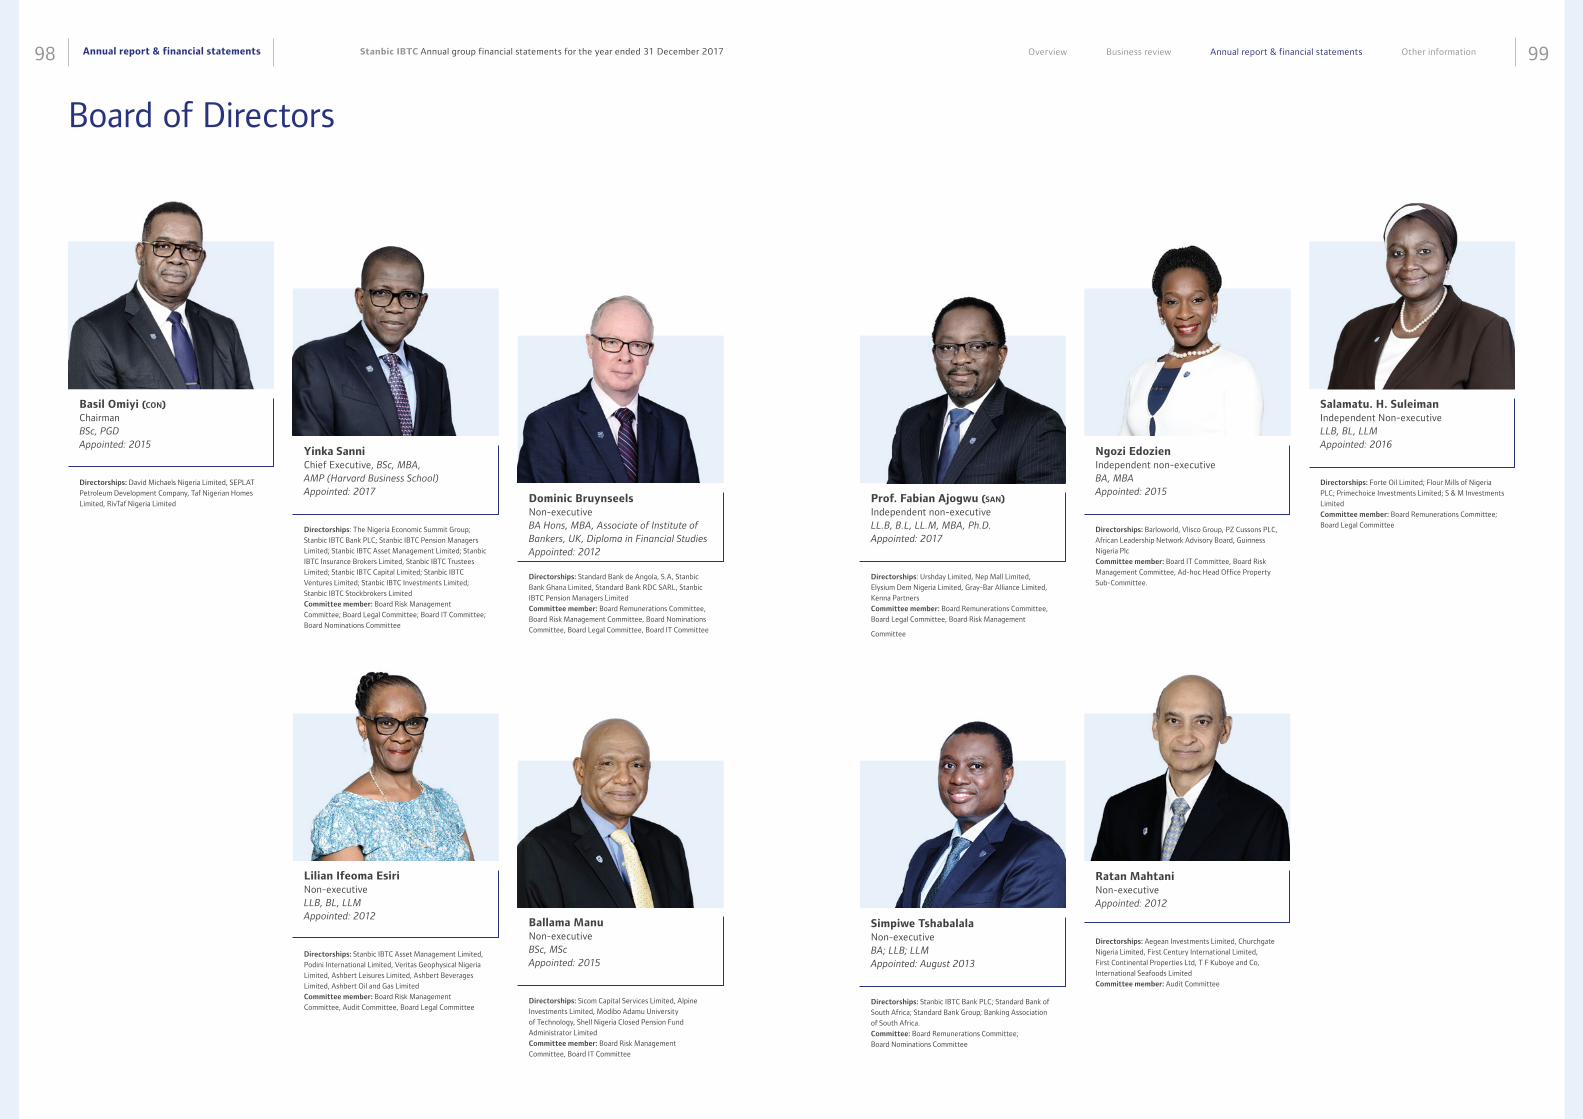
Annual report & financial statements98 99Stanbic IBTC Annual group financial statements for the year ended 31 December 2017 Overview Business review Annual report & financial statements Other information
Basil Omiyi (con) Chairman BSc, PGD Appointed: 2015 Directorships: David Michaels Nigeria Limited, SEPLAT
Petroleum Development Company, Taf Nigerian Homes
Limited, RivTaf Nigeria Limited
Yinka Sanni Chief Executive, BSc, MBA, AMP (Harvard Business School) Appointed: 2017 Directorships: The Nigeria Economic Summit Group;
Stanbic IBTC Bank PLC; Stanbic IBTC Pension Managers
Limited; Stanbic IBTC Asset Management Limited; Stanbic
IBTC Insurance Brokers Limited, Stanbic IBTC Trustees
Limited; Stanbic IBTC Capital Limited; Stanbic IBTC
Ventures Limited; Stanbic IBTC Investments Limited;
Stanbic IBTC Stockbrokers Limited
Committee member: Board Risk Management
Committee; Board Legal Committee; Board IT Committee;
Board Nominations Committee
Lilian Ifeoma Esiri Non-executive LLB, BL, LLM Appointed: 2012 Directorships: Stanbic IBTC Asset Management Limited,
Podini International Limited, Veritas Geophysical Nigeria
Limited, Ashbert Leisures Limited, Ashbert Beverages
Limited, Ashbert Oil and Gas Limited
Committee member: Board Risk Management
Committee, Audit Committee, Board Legal Committee
Dominic Bruynseels Non-executive BA Hons, MBA, Associate of Institute of Bankers, UK, Diploma in Financial Studies Appointed: 2012 Directorships: Standard Bank de Angola, S.A, Stanbic
Bank Ghana Limited, Standard Bank RDC SARL, Stanbic
IBTC Pension Managers Limited
Committee member: Board Remunerations Committee,
Board Risk Management Committee, Board Nominations
Committee, Board Legal Committee, Board IT Committee
Ballama Manu Non-executive BSc, MSc Appointed: 2015 Directorships: Sicom Capital Services Limited, Alpine
Investments Limited, Modibo Adamu University
of Technology, Shell Nigeria Closed Pension Fund
Administrator Limited
Committee member: Board Risk Management
Committee, Board IT Committee
Board of Directors
Prof. Fabian Ajogwu (san) Independent non-executive LL.B, B.L, LL.M, MBA, Ph.D. Appointed: 2017 Directorships: Urshday Limited, Nep Mall Limited,
Elysium Dem Nigeria Limited, Gray-Bar Alliance Limited,
Kenna Partners
Committee member: Board Remunerations Committee,
Board Legal Committee, Board Risk Management
Committee
Simpiwe Tshabalala Non-executive BA; LLB; LLM Appointed: August 2013 Directorships: Stanbic IBTC Bank PLC; Standard Bank of
South Africa; Standard Bank Group; Banking Association
of South Africa.
Committee: Board Remunerations Committee;
Board Nominations Committee
Ngozi Edozien Independent non-executive BA, MBA Appointed: 2015 Directorships: Barloworld, Vlisco Group, PZ Cussons PLC,
African Leadership Network Advisory Board, Guinness
Nigeria Plc
Committee member: Board IT Committee, Board Risk
Management Committee, Ad-hoc Head Office Property
Sub-Committee.
Ratan Mahtani Non-executive Appointed: 2012 Directorships: Aegean Investments Limited, Churchgate
Nigeria Limited, First Century International Limited,
First Continental Properties Ltd, T F Kuboye and Co,
International Seafoods Limited
Committee member: Audit Committee
Salamatu. H. Suleiman Independent Non-executive LLB, BL, LLM Appointed: 2016 Directorships: Forte Oil Limited; Flour Mills of Nigeria
PLC; Primechoice Investments Limited; S & M Investments
Limited
Committee member: Board Remunerations Committee;
Board Legal Committee
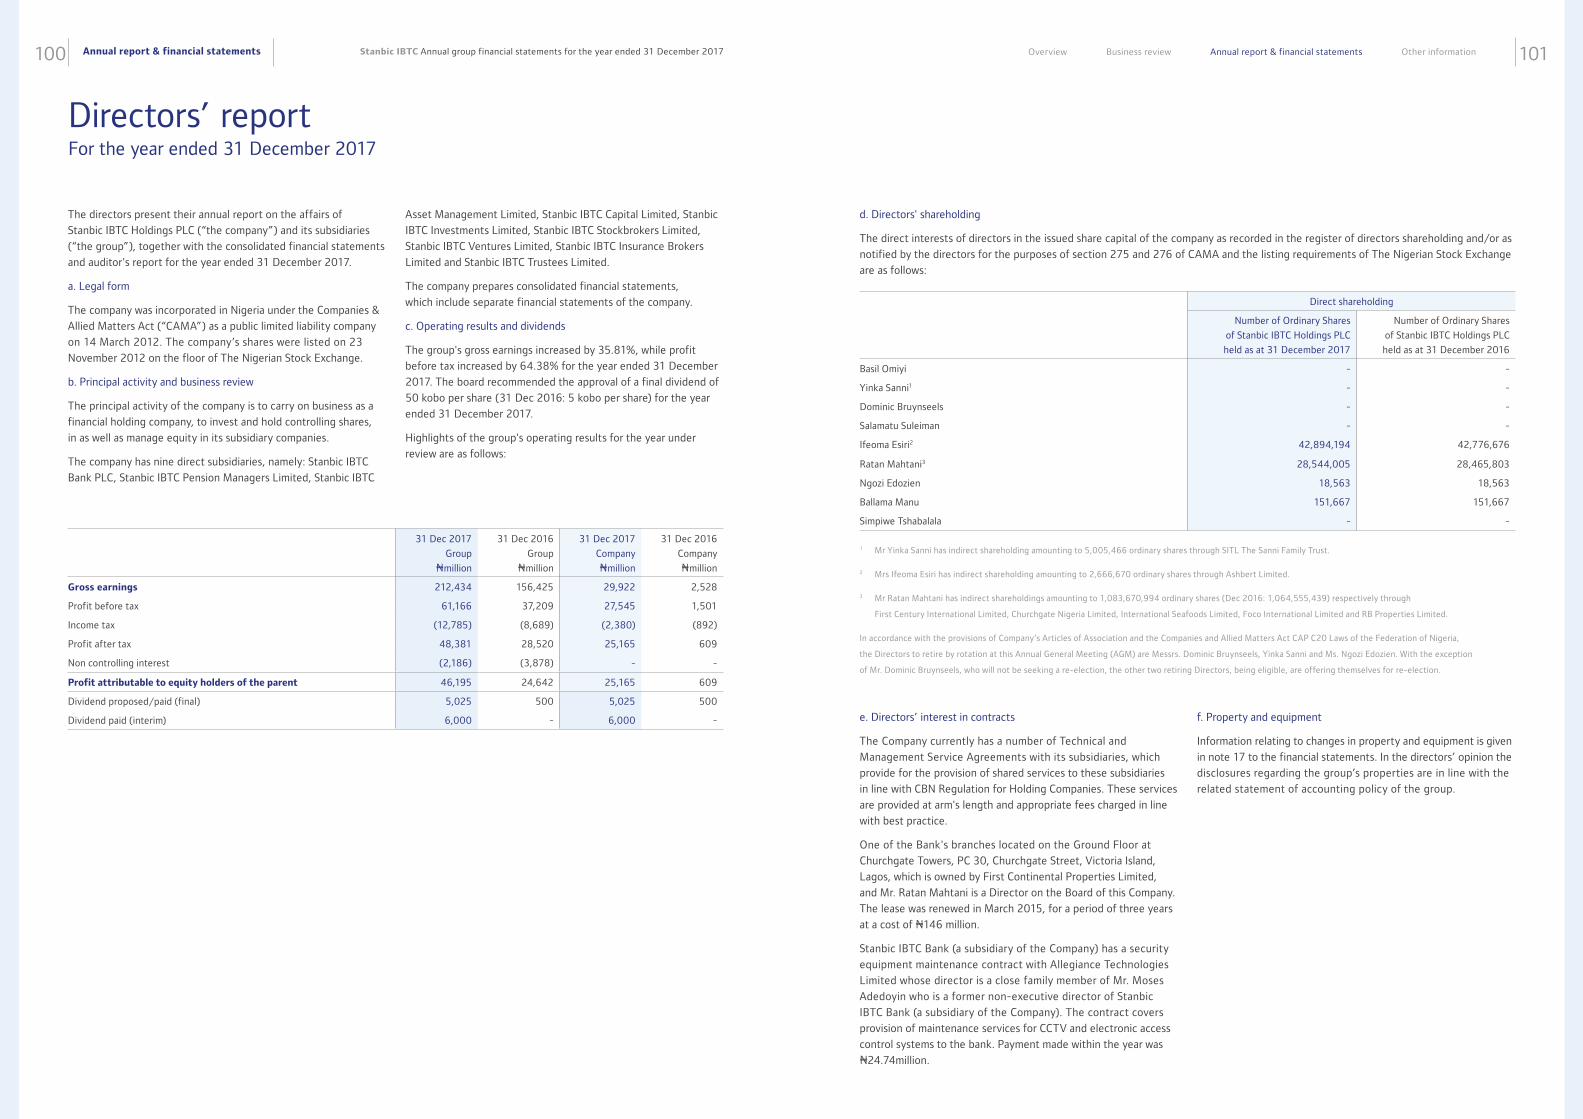
Annual report & financial statements100 101Stanbic IBTC Annual group financial statements for the year ended 31 December 2017 Overview Business review Annual report & financial statements Other information
31 Dec 2017
Group
Nmillion
31 Dec 2016
Group
Nmillion
31 Dec 2017
Company
Nmillion
31 Dec 2016
Company
Nmillion
Gross earnings 212,434 156,425 29,922 2,528
Profit before tax 61,166 37,209 27,545 1,501
Income tax (12,785) (8,689) (2,380) (892)
Profit after tax 48,381 28,520 25,165 609
Non controlling interest (2,186) (3,878) - -
Profit attributable to equity holders of the parent 46,195 24,642 25,165 609
Dividend proposed/paid (final) 5,025 500 5,025 500
Dividend paid (interim) 6,000 - 6,000 -
The directors present their annual report on the affairs of
Stanbic IBTC Holdings PLC (“the company”) and its subsidiaries
(“the group”), together with the consolidated financial statements
and auditor's report for the year ended 31 December 2017.
a. Legal form
The company was incorporated in Nigeria under the Companies &
Allied Matters Act (“CAMA”) as a public limited liability company
on 14 March 2012. The company’s shares were listed on 23
November 2012 on the floor of The Nigerian Stock Exchange.
b. Principal activity and business review
The principal activity of the company is to carry on business as a
financial holding company, to invest and hold controlling shares,
in as well as manage equity in its subsidiary companies.
The company has nine direct subsidiaries, namely: Stanbic IBTC
Bank PLC, Stanbic IBTC Pension Managers Limited, Stanbic IBTC
For the year ended 31 December 2017
Asset Management Limited, Stanbic IBTC Capital Limited, Stanbic
IBTC Investments Limited, Stanbic IBTC Stockbrokers Limited,
Stanbic IBTC Ventures Limited, Stanbic IBTC Insurance Brokers
Limited and Stanbic IBTC Trustees Limited.
The company prepares consolidated financial statements,
which include separate financial statements of the company.
c. Operating results and dividends
The group's gross earnings increased by 35.81%, while profit
before tax increased by 64.38% for the year ended 31 December
2017. The board recommended the approval of a final dividend of
50 kobo per share (31 Dec 2016: 5 kobo per share) for the year
ended 31 December 2017.
Highlights of the group's operating results for the year under
review are as follows:
Directors’ report
1 Mr Yinka Sanni has indirect shareholding amounting to 5,005,466 ordinary shares through SITL The Sanni Family Trust.
2 Mrs Ifeoma Esiri has indirect shareholding amounting to 2,666,670 ordinary shares through Ashbert Limited.
3 Mr Ratan Mahtani has indirect shareholdings amounting to 1,083,670,994 ordinary shares (Dec 2016: 1,064,555,439) respectively through
First Century International Limited, Churchgate Nigeria Limited, International Seafoods Limited, Foco International Limited and RB Properties Limited.
In accordance with the provisions of Company’s Articles of Association and the Companies and Allied Matters Act CAP C20 Laws of the Federation of Nigeria,
the Directors to retire by rotation at this Annual General Meeting (AGM) are Messrs. Dominic Bruynseels, Yinka Sanni and Ms. Ngozi Edozien. With the exception
of Mr. Dominic Bruynseels, who will not be seeking a re-election, the other two retiring Directors, being eligible, are offering themselves for re-election.
Direct shareholding
Number of Ordinary Shares
of Stanbic IBTC Holdings PLC
held as at 31 December 2017
Number of Ordinary Shares
of Stanbic IBTC Holdings PLC
held as at 31 December 2016
Basil Omiyi - -
Yinka Sanni1 - -
Dominic Bruynseels - -
Salamatu Suleiman - -
Ifeoma Esiri2 42,894,194 42,776,676
Ratan Mahtani3 28,544,005 28,465,803
Ngozi Edozien 18,563 18,563
Ballama Manu 151,667 151,667
Simpiwe Tshabalala - -
d. Directors' shareholding
The direct interests of directors in the issued share capital of the company as recorded in the register of directors shareholding and/or as
notified by the directors for the purposes of section 275 and 276 of CAMA and the listing requirements of The Nigerian Stock Exchange
are as follows:
e. Directors’ interest in contracts
The Company currently has a number of Technical and
Management Service Agreements with its subsidiaries, which
provide for the provision of shared services to these subsidiaries
in line with CBN Regulation for Holding Companies. These services
are provided at arm's length and appropriate fees charged in line
with best practice.
One of the Bank's branches located on the Ground Floor at
Churchgate Towers, PC 30, Churchgate Street, Victoria Island,
Lagos, which is owned by First Continental Properties Limited,
and Mr. Ratan Mahtani is a Director on the Board of this Company.
The lease was renewed in March 2015, for a period of three years
at a cost of N146 million.
Stanbic IBTC Bank (a subsidiary of the Company) has a security
equipment maintenance contract with Allegiance Technologies
Limited whose director is a close family member of Mr. Moses
Adedoyin who is a former non-executive director of Stanbic
IBTC Bank (a subsidiary of the Company). The contract covers
provision of maintenance services for CCTV and electronic access
control systems to the bank. Payment made within the year was
N24.74million.
f. Property and equipment
Information relating to changes in property and equipment is given
in note 17 to the financial statements. In the directors’ opinion the
disclosures regarding the group’s properties are in line with the
related statement of accounting policy of the group.
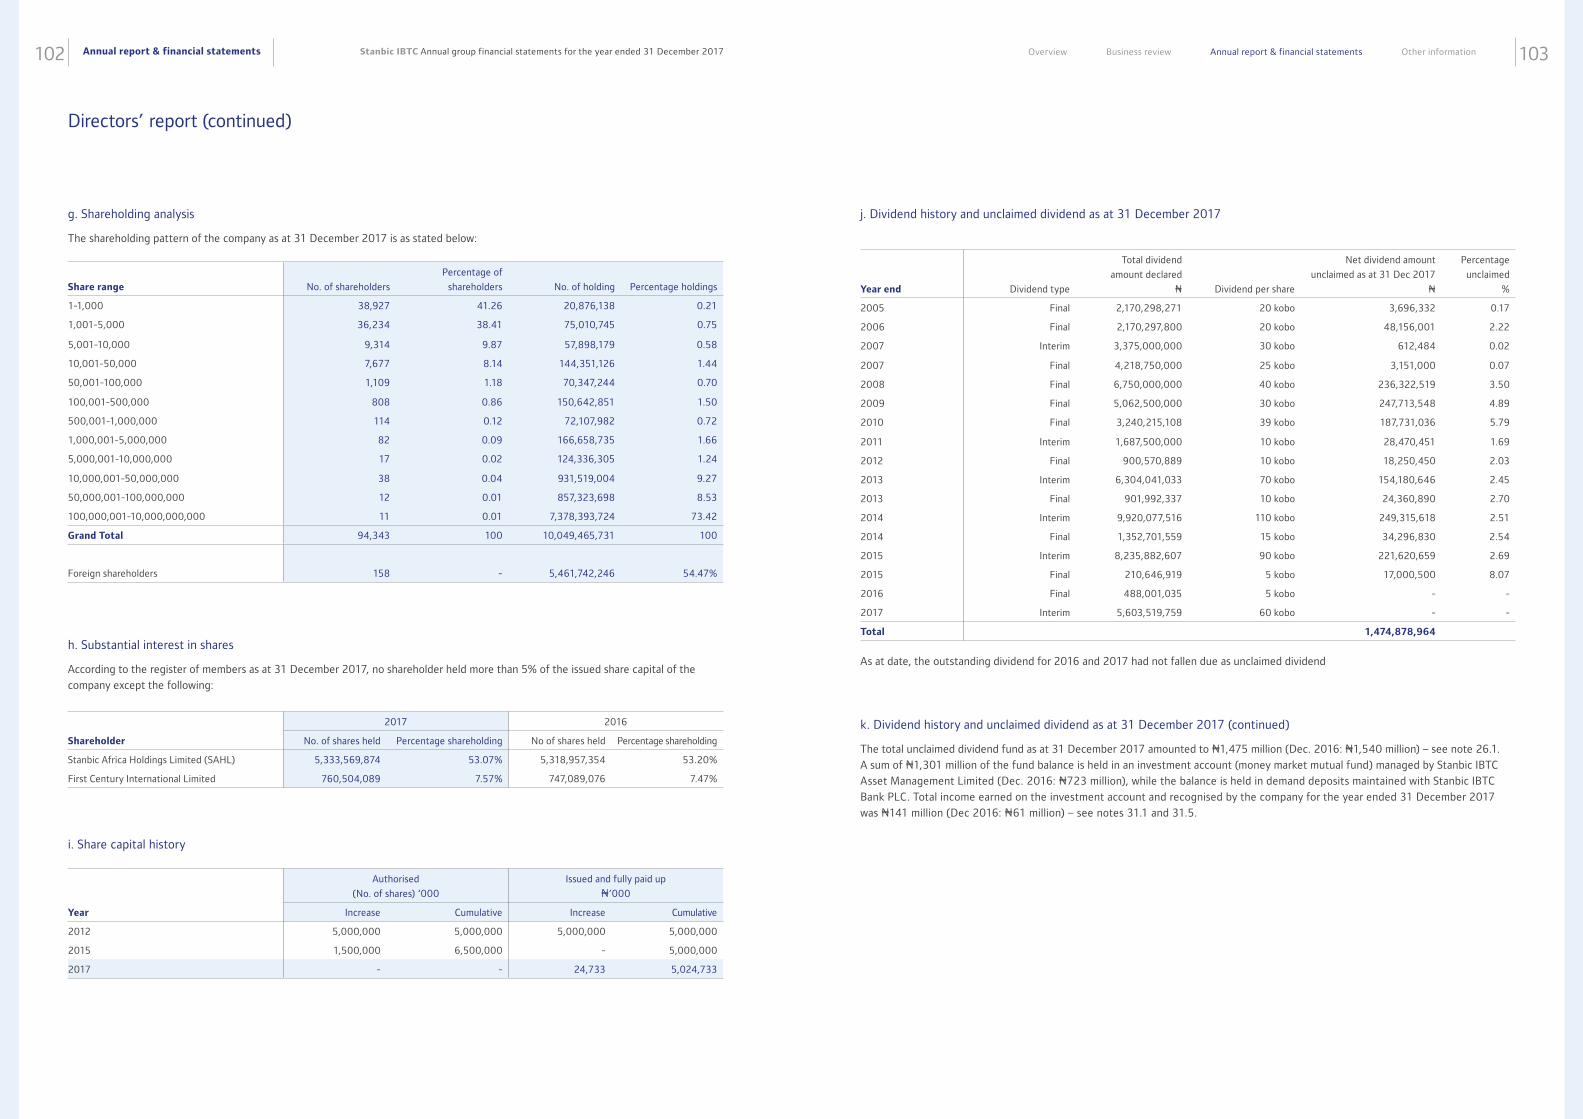
Annual report & financial statements102 103Stanbic IBTC Annual group financial statements for the year ended 31 December 2017 Overview Business review Annual report & financial statements Other information
Directors’ report (continued)
g. Shareholding analysis
The shareholding pattern of the company as at 31 December 2017 is as stated below:
h. Substantial interest in shares
According to the register of members as at 31 December 2017, no shareholder held more than 5% of the issued share capital of the
company except the following:
i. Share capital history
Share range
No. of shareholders
Percentage of
shareholders
No. of holding
Percentage holdings
1-1,000 38,927 41.26 20,876,138 0.21
1,001-5,000 36,234 38.41 75,010,745 0.75
5,001-10,000 9,314 9.87 57,898,179 0.58
10,001-50,000 7,677 8.14 144,351,126 1.44
50,001-100,000 1,109 1.18 70,347,244 0.70
100,001-500,000 808 0.86 150,642,851 1.50
500,001-1,000,000 114 0.12 72,107,982 0.72
1,000,001-5,000,000 82 0.09 166,658,735 1.66
5,000,001-10,000,000 17 0.02 124,336,305 1.24
10,000,001-50,000,000 38 0.04 931,519,004 9.27
50,000,001-100,000,000 12 0.01 857,323,698 8.53
100,000,001-10,000,000,000 11 0.01 7,378,393,724 73.42
Grand Total 94,343 100 10,049,465,731 100
Foreign shareholders 158 - 5,461,742,246 54.47%
2017 2016
Shareholder No. of shares held Percentage shareholding No of shares held Percentage shareholding
Stanbic Africa Holdings Limited (SAHL) 5,333,569,874 53.07% 5,318,957,354 53.20%
First Century International Limited 760,504,089 7.57% 747,089,076 7.47%
Authorised
(No. of shares) ‘000
Issued and fully paid up
N’000
Year Increase Cumulative Increase Cumulative
2012 5,000,000 5,000,000 5,000,000 5,000,000
2015 1,500,000 6,500,000 - 5,000,000
2017 - - 24,733 5,024,733
k. Dividend history and unclaimed dividend as at 31 December 2017 (continued)
The total unclaimed dividend fund as at 31 December 2017 amounted to N1,475 million (Dec. 2016: N1,540 million) – see note 26.1.
A sum of N1,301 million of the fund balance is held in an investment account (money market mutual fund) managed by Stanbic IBTC
Asset Management Limited (Dec. 2016: N723 million), while the balance is held in demand deposits maintained with Stanbic IBTC
Bank PLC. Total income earned on the investment account and recognised by the company for the year ended 31 December 2017
was N141 million (Dec 2016: N61 million) – see notes 31.1 and 31.5.
As at date, the outstanding dividend for 2016 and 2017 had not fallen due as unclaimed dividend
j. Dividend history and unclaimed dividend as at 31 December 2017
Year end
Dividend type
Total dividend
amount declared
N
Dividend per share
Net dividend amount
unclaimed as at 31 Dec 2017
N
Percentage
unclaimed
%
2005 Final 2,170,298,271 20 kobo 3,696,332 0.17
2006 Final 2,170,297,800 20 kobo 48,156,001 2.22
2007 Interim 3,375,000,000 30 kobo 612,484 0.02
2007 Final 4,218,750,000 25 kobo 3,151,000 0.07
2008 Final 6,750,000,000 40 kobo 236,322,519 3.50
2009 Final 5,062,500,000 30 kobo 247,713,548 4.89
2010 Final 3,240,215,108 39 kobo 187,731,036 5.79
2011 Interim 1,687,500,000 10 kobo 28,470,451 1.69
2012 Final 900,570,889 10 kobo 18,250,450 2.03
2013 Interim 6,304,041,033 70 kobo 154,180,646 2.45
2013 Final 901,992,337 10 kobo 24,360,890 2.70
2014 Interim 9,920,077,516 110 kobo 249,315,618 2.51
2014 Final 1,352,701,559 15 kobo 34,296,830 2.54
2015 Interim 8,235,882,607 90 kobo 221,620,659 2.69
2015 Final 210,646,919 5 kobo 17,000,500 8.07
2016 Final 488,001,035 5 kobo - -
2017 Interim 5,603,519,759 60 kobo - -
Total 1,474,878,964
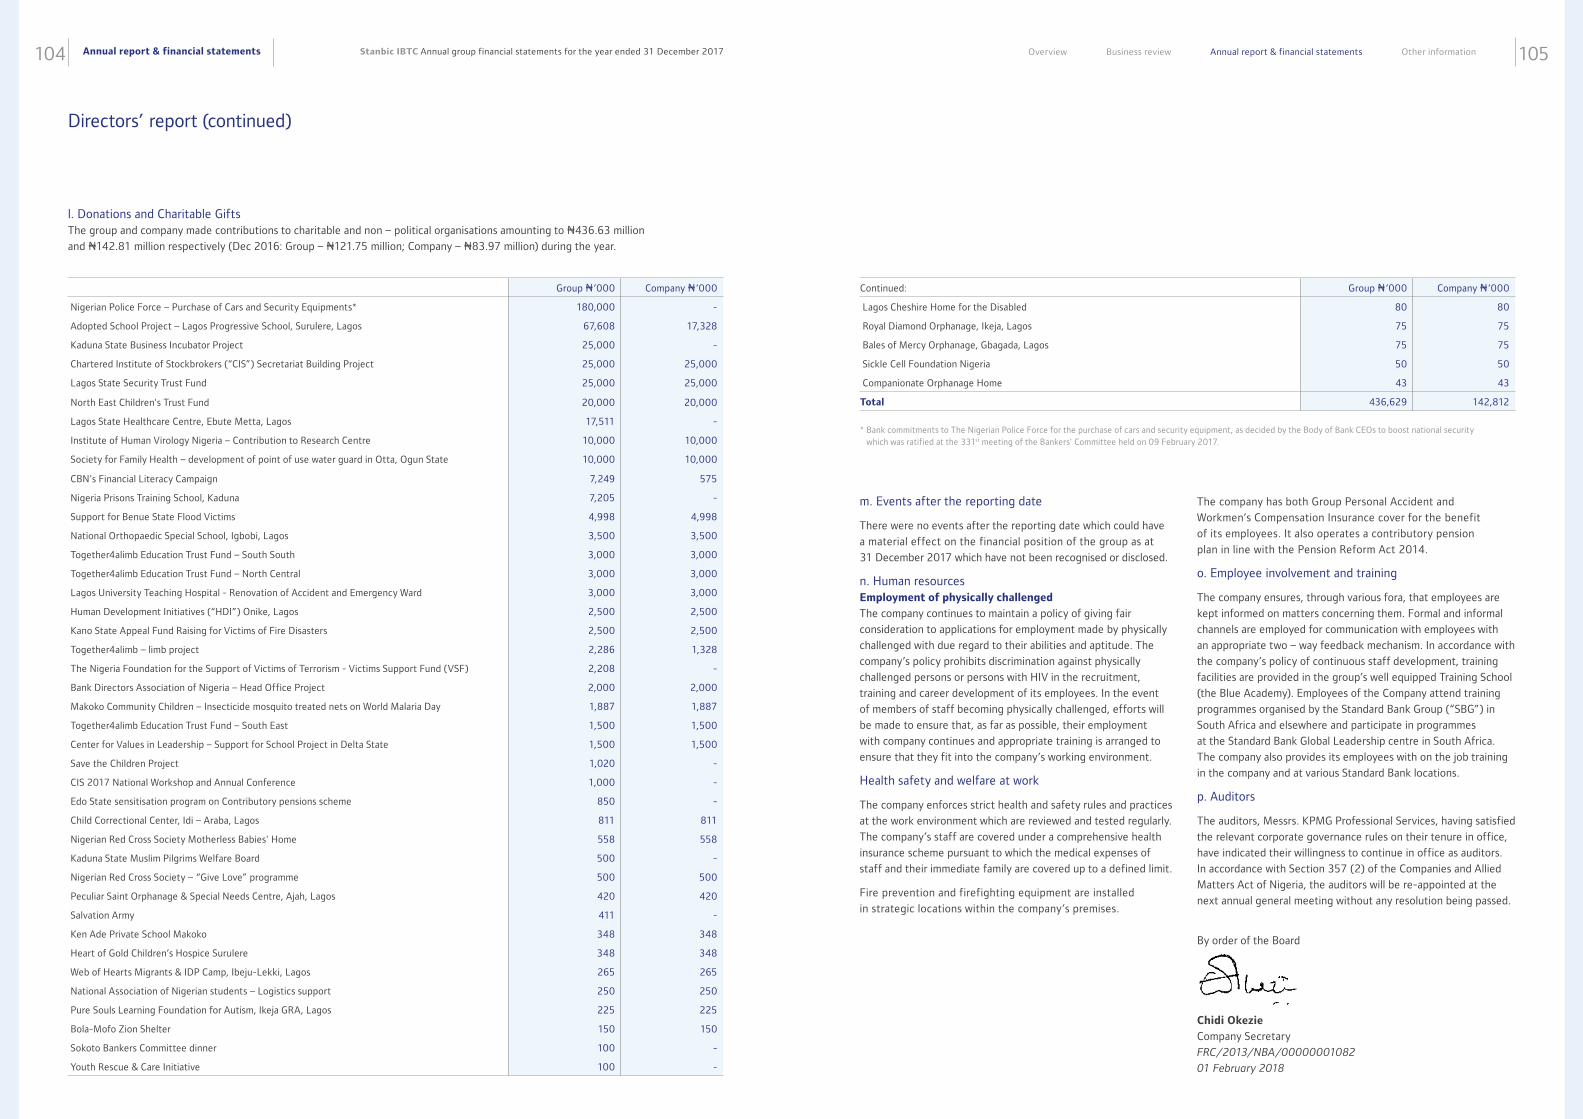
Annual report & financial statements104 105Stanbic IBTC Annual group financial statements for the year ended 31 December 2017 Overview Business review Annual report & financial statements Other information
Directors’ report (continued)
l. Donations and Charitable Gifts The group and company made contributions to charitable and non – political organisations amounting to N436.63 million
and N142.81 million respectively (Dec 2016: Group – N121.75 million; Company – N83.97 million) during the year.
Group N‘000 Company N‘000
Nigerian Police Force – Purchase of Cars and Security Equipments* 180,000 -
Adopted School Project – Lagos Progressive School, Surulere, Lagos 67,608 17,328
Kaduna State Business Incubator Project 25,000 -
Chartered Institute of Stockbrokers (“CIS”) Secretariat Building Project 25,000 25,000
Lagos State Security Trust Fund 25,000 25,000
North East Children's Trust Fund 20,000 20,000
Lagos State Healthcare Centre, Ebute Metta, Lagos 17,511 -
Institute of Human Virology Nigeria – Contribution to Research Centre 10,000 10,000
Society for Family Health – development of point of use water guard in Otta, Ogun State 10,000 10,000
CBN's Financial Literacy Campaign 7,249 575
Nigeria Prisons Training School, Kaduna 7,205 -
Support for Benue State Flood Victims 4,998 4,998
National Orthopaedic Special School, Igbobi, Lagos 3,500 3,500
Together4alimb Education Trust Fund – South South 3,000 3,000
Together4alimb Education Trust Fund – North Central 3,000 3,000
Lagos University Teaching Hospital - Renovation of Accident and Emergency Ward 3,000 3,000
Human Development Initiatives (“HDI”) Onike, Lagos 2,500 2,500
Kano State Appeal Fund Raising for Victims of Fire Disasters 2,500 2,500
Together4alimb – limb project 2,286 1,328
The Nigeria Foundation for the Support of Victims of Terrorism - Victims Support Fund (VSF) 2,208 -
Bank Directors Association of Nigeria – Head Office Project 2,000 2,000
Makoko Community Children – Insecticide mosquito treated nets on World Malaria Day 1,887 1,887
Together4alimb Education Trust Fund – South East 1,500 1,500
Center for Values in Leadership – Support for School Project in Delta State 1,500 1,500
Save the Children Project 1,020 -
CIS 2017 National Workshop and Annual Conference 1,000 -
Edo State sensitisation program on Contributory pensions scheme 850 -
Child Correctional Center, Idi – Araba, Lagos 811 811
Nigerian Red Cross Society Motherless Babies' Home 558 558
Kaduna State Muslim Pilgrims Welfare Board 500 -
Nigerian Red Cross Society – “Give Love” programme 500 500
Peculiar Saint Orphanage & Special Needs Centre, Ajah, Lagos 420 420
Salvation Army 411 -
Ken Ade Private School Makoko 348 348
Heart of Gold Children’s Hospice Surulere 348 348
Web of Hearts Migrants & IDP Camp, Ibeju-Lekki, Lagos 265 265
National Association of Nigerian students – Logistics support 250 250
Pure Souls Learning Foundation for Autism, Ikeja GRA, Lagos 225 225
Bola-Mofo Zion Shelter 150 150
Sokoto Bankers Committee dinner 100 -
Youth Rescue & Care Initiative 100 -
Continued: Group N‘000 Company N‘000
Lagos Cheshire Home for the Disabled 80 80
Royal Diamond Orphanage, Ikeja, Lagos 75 75
Bales of Mercy Orphanage, Gbagada, Lagos 75 75
Sickle Cell Foundation Nigeria 50 50
Companionate Orphanage Home 43 43
Total 436,629 142,812
* Bank commitments to The Nigerian Police Force for the purchase of cars and security equipment, as decided by the Body of Bank CEOs to boost national security which was ratified at the 331st meeting of the Bankers' Committee held on 09 February 2017.
m. Events after the reporting date
There were no events after the reporting date which could have
a material effect on the financial position of the group as at
31 December 2017 which have not been recognised or disclosed.
n. Human resources Employment of physically challenged
The company continues to maintain a policy of giving fair
consideration to applications for employment made by physically
challenged with due regard to their abilities and aptitude. The
company’s policy prohibits discrimination against physically
challenged persons or persons with HIV in the recruitment,
training and career development of its employees. In the event
of members of staff becoming physically challenged, efforts will
be made to ensure that, as far as possible, their employment
with company continues and appropriate training is arranged to
ensure that they fit into the company’s working environment.
Health safety and welfare at work
The company enforces strict health and safety rules and practices
at the work environment which are reviewed and tested regularly.
The company’s staff are covered under a comprehensive health
insurance scheme pursuant to which the medical expenses of
staff and their immediate family are covered up to a defined limit.
Fire prevention and firefighting equipment are installed
in strategic locations within the company’s premises.
The company has both Group Personal Accident and
Workmen’s Compensation Insurance cover for the benefit
of its employees. It also operates a contributory pension
plan in line with the Pension Reform Act 2014.
o. Employee involvement and training
The company ensures, through various fora, that employees are
kept informed on matters concerning them. Formal and informal
channels are employed for communication with employees with
an appropriate two – way feedback mechanism. In accordance with
the company’s policy of continuous staff development, training
facilities are provided in the group’s well equipped Training School
(the Blue Academy). Employees of the Company attend training
programmes organised by the Standard Bank Group (“SBG”) in
South Africa and elsewhere and participate in programmes
at the Standard Bank Global Leadership centre in South Africa.
The company also provides its employees with on the job training
in the company and at various Standard Bank locations.
p. Auditors
The auditors, Messrs. KPMG Professional Services, having satisfied
the relevant corporate governance rules on their tenure in office,
have indicated their willingness to continue in office as auditors.
In accordance with Section 357 (2) of the Companies and Allied
Matters Act of Nigeria, the auditors will be re-appointed at the
next annual general meeting without any resolution being passed.
By order of the Board
Chidi Okezie
Company Secretary
FRC/2013/NBA/00000001082
01 February 2018
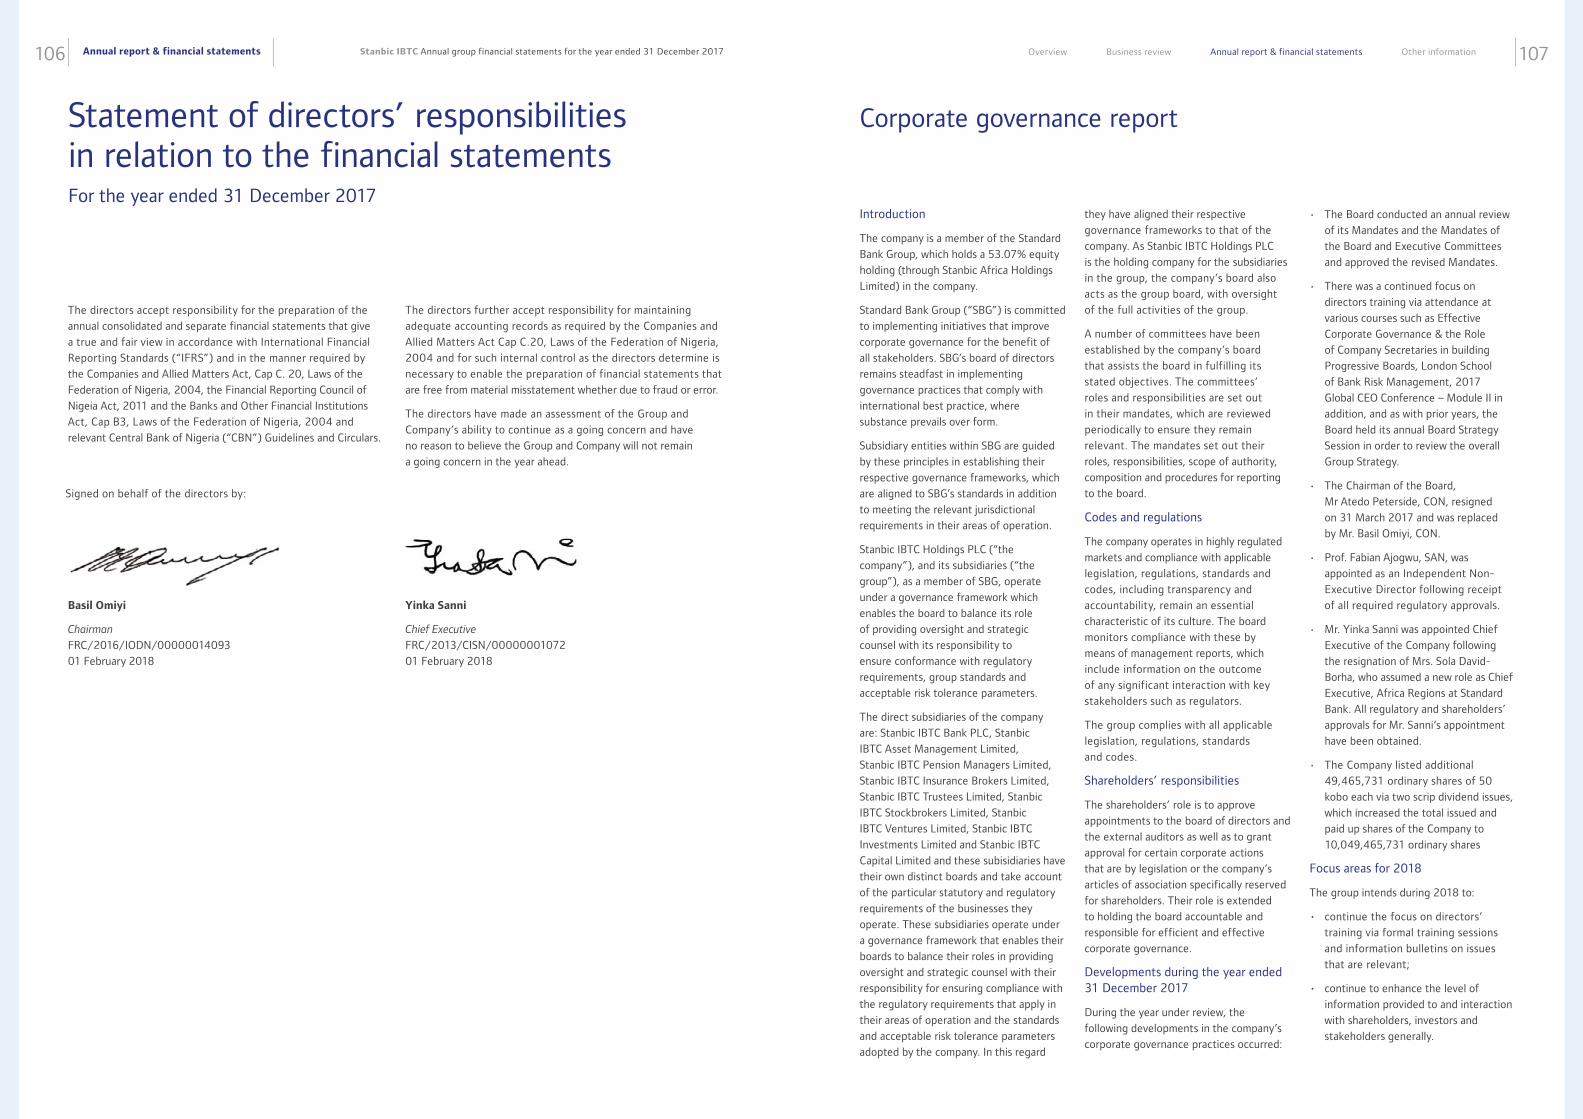
Annual report & financial statements106 107Stanbic IBTC Annual group financial statements for the year ended 31 December 2017 Overview Business review Annual report & financial statements Other information
The directors accept responsibility for the preparation of the
annual consolidated and separate financial statements that give
a true and fair view in accordance with International Financial
Reporting Standards (“IFRS”) and in the manner required by
the Companies and Allied Matters Act, Cap C. 20, Laws of the
Federation of Nigeria, 2004, the Financial Reporting Council of
Nigeia Act, 2011 and the Banks and Other Financial Institutions
Act, Cap B3, Laws of the Federation of Nigeria, 2004 and
relevant Central Bank of Nigeria (“CBN”) Guidelines and Circulars.
The directors further accept responsibility for maintaining
adequate accounting records as required by the Companies and
Allied Matters Act Cap C.20, Laws of the Federation of Nigeria,
2004 and for such internal control as the directors determine is
necessary to enable the preparation of financial statements that
are free from material misstatement whether due to fraud or error.
The directors have made an assessment of the Group and
Company’s ability to continue as a going concern and have
no reason to believe the Group and Company will not remain
a going concern in the year ahead.
Signed on behalf of the directors by:
Basil Omiyi
Chairman
FRC/2016/IODN/00000014093
01 February 2018
Yinka Sanni
Chief Executive
FRC/2013/CISN/00000001072
01 February 2018
Statement of directors’ responsibilities in relation to the financial statementsFor the year ended 31 December 2017
Corporate governance report
Introduction
The company is a member of the Standard
Bank Group, which holds a 53.07% equity
holding (through Stanbic Africa Holdings
Limited) in the company.
Standard Bank Group (“SBG”) is committed
to implementing initiatives that improve
corporate governance for the benefit of
all stakeholders. SBG’s board of directors
remains steadfast in implementing
governance practices that comply with
international best practice, where
substance prevails over form.
Subsidiary entities within SBG are guided
by these principles in establishing their
respective governance frameworks, which
are aligned to SBG’s standards in addition
to meeting the relevant jurisdictional
requirements in their areas of operation.
Stanbic IBTC Holdings PLC (“the
company”), and its subsidiaries (“the
group”), as a member of SBG, operate
under a governance framework which
enables the board to balance its role
of providing oversight and strategic
counsel with its responsibility to
ensure conformance with regulatory
requirements, group standards and
acceptable risk tolerance parameters.
The direct subsidiaries of the company
are: Stanbic IBTC Bank PLC, Stanbic
IBTC Asset Management Limited,
Stanbic IBTC Pension Managers Limited,
Stanbic IBTC Insurance Brokers Limited,
Stanbic IBTC Trustees Limited, Stanbic
IBTC Stockbrokers Limited, Stanbic
IBTC Ventures Limited, Stanbic IBTC
Investments Limited and Stanbic IBTC
Capital Limited and these subisidiaries have
their own distinct boards and take account
of the particular statutory and regulatory
requirements of the businesses they
operate. These subsidiaries operate under
a governance framework that enables their
boards to balance their roles in providing
oversight and strategic counsel with their
responsibility for ensuring compliance with
the regulatory requirements that apply in
their areas of operation and the standards
and acceptable risk tolerance parameters
adopted by the company. In this regard
they have aligned their respective
governance frameworks to that of the
company. As Stanbic IBTC Holdings PLC
is the holding company for the subsidiaries
in the group, the company’s board also
acts as the group board, with oversight
of the full activities of the group.
A number of committees have been
established by the company’s board
that assists the board in fulfilling its
stated objectives. The committees’
roles and responsibilities are set out
in their mandates, which are reviewed
periodically to ensure they remain
relevant. The mandates set out their
roles, responsibilities, scope of authority,
composition and procedures for reporting
to the board.
Codes and regulations
The company operates in highly regulated
markets and compliance with applicable
legislation, regulations, standards and
codes, including transparency and
accountability, remain an essential
characteristic of its culture. The board
monitors compliance with these by
means of management reports, which
include information on the outcome
of any significant interaction with key
stakeholders such as regulators.
The group complies with all applicable
legislation, regulations, standards
and codes.
Shareholders’ responsibilities
The shareholders’ role is to approve
appointments to the board of directors and
the external auditors as well as to grant
approval for certain corporate actions
that are by legislation or the company’s
articles of association specifically reserved
for shareholders. Their role is extended
to holding the board accountable and
responsible for efficient and effective
corporate governance.
Developments during the year ended 31 December 2017
During the year under review, the
following developments in the company’s
corporate governance practices occurred:
• The Board conducted an annual review
of its Mandates and the Mandates of
the Board and Executive Committees
and approved the revised Mandates.
• There was a continued focus on
directors training via attendance at
various courses such as Effective
Corporate Governance & the Role
of Company Secretaries in building
Progressive Boards, London School
of Bank Risk Management, 2017
Global CEO Conference – Module II in
addition, and as with prior years, the
Board held its annual Board Strategy
Session in order to review the overall
Group Strategy.
• The Chairman of the Board,
Mr Atedo Peterside, CON, resigned
on 31 March 2017 and was replaced
by Mr. Basil Omiyi, CON.
• Prof. Fabian Ajogwu, SAN, was
appointed as an Independent Non-
Executive Director following receipt
of all required regulatory approvals.
• Mr. Yinka Sanni was appointed Chief
Executive of the Company following
the resignation of Mrs. Sola David-
Borha, who assumed a new role as Chief
Executive, Africa Regions at Standard
Bank. All regulatory and shareholders’
approvals for Mr. Sanni’s appointment
have been obtained.
• The Company listed additional
49,465,731 ordinary shares of 50
kobo each via two scrip dividend issues,
which increased the total issued and
paid up shares of the Company to
10,049,465,731 ordinary shares
Focus areas for 2018
The group intends during 2018 to:
• continue the focus on directors’
training via formal training sessions
and information bulletins on issues
that are relevant;
• continue to enhance the level of
information provided to and interaction
with shareholders, investors and
stakeholders generally.
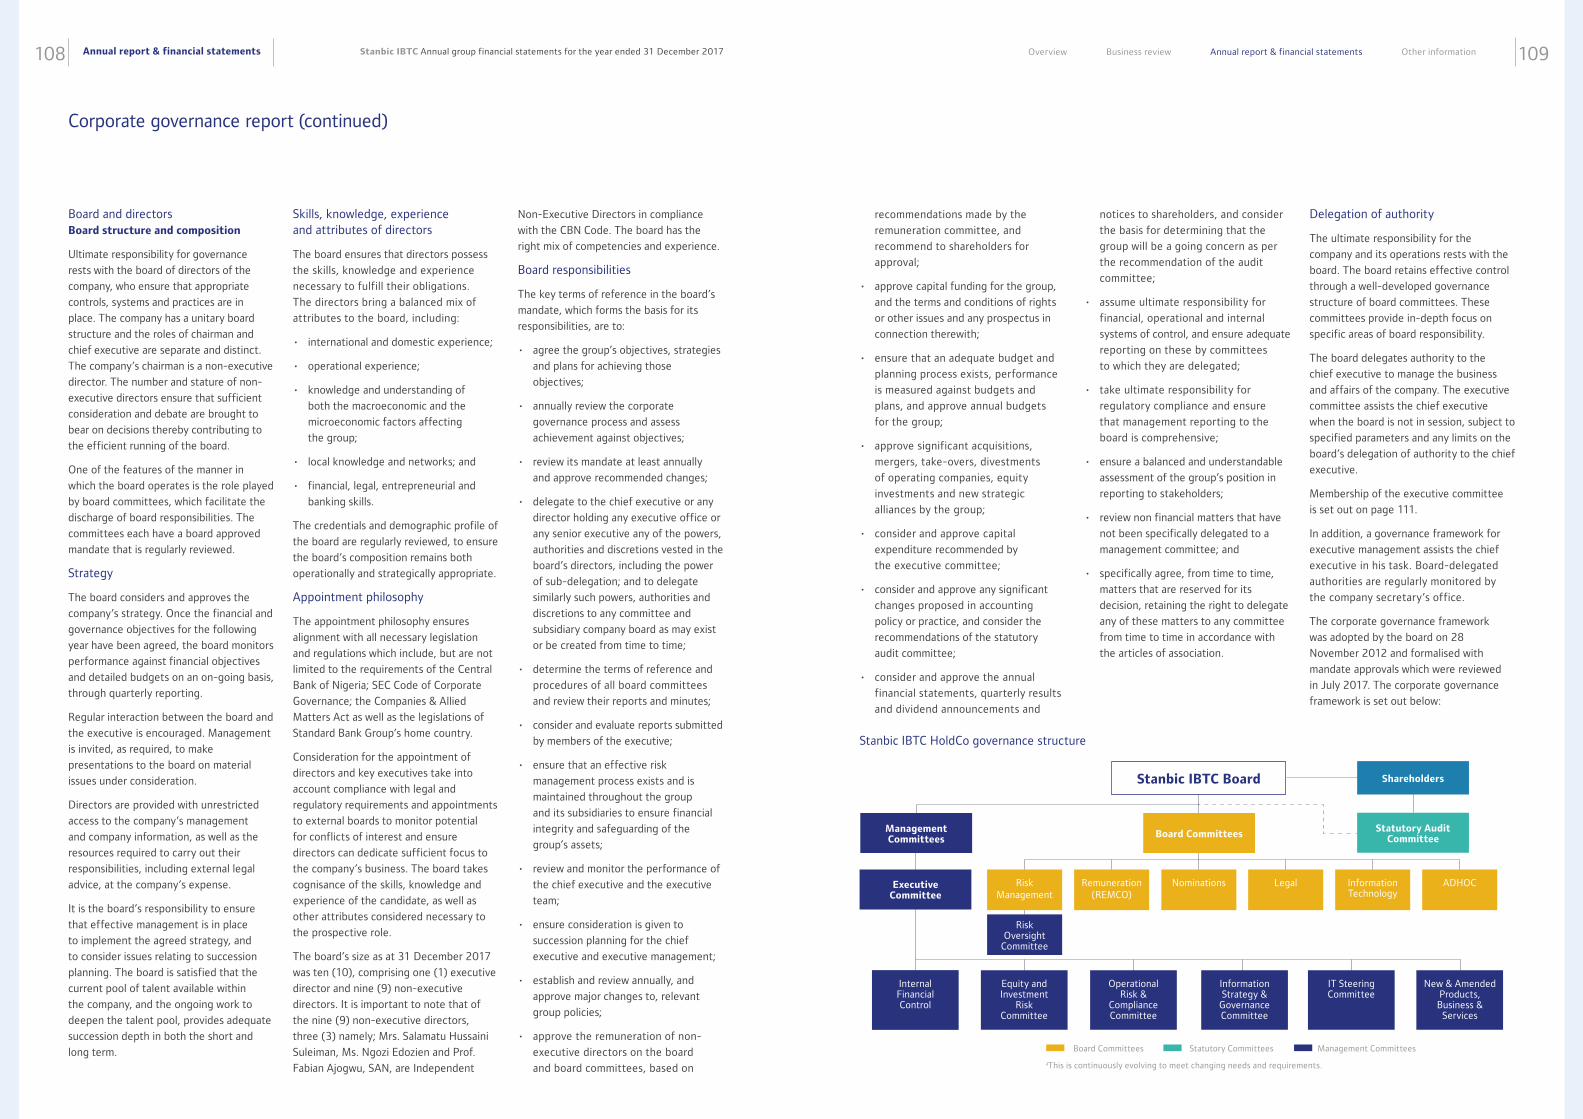
Annual report & financial statements108 109Stanbic IBTC Annual group financial statements for the year ended 31 December 2017 Overview Business review Annual report & financial statements Other information
Board and directors
Board structure and composition
Ultimate responsibility for governance
rests with the board of directors of the
company, who ensure that appropriate
controls, systems and practices are in
place. The company has a unitary board
structure and the roles of chairman and
chief executive are separate and distinct.
The company’s chairman is a non-executive
director. The number and stature of non-
executive directors ensure that sufficient
consideration and debate are brought to
bear on decisions thereby contributing to
the efficient running of the board.
One of the features of the manner in
which the board operates is the role played
by board committees, which facilitate the
discharge of board responsibilities. The
committees each have a board approved
mandate that is regularly reviewed.
Strategy
The board considers and approves the
company’s strategy. Once the financial and
governance objectives for the following
year have been agreed, the board monitors
performance against financial objectives
and detailed budgets on an on-going basis,
through quarterly reporting.
Regular interaction between the board and
the executive is encouraged. Management
is invited, as required, to make
presentations to the board on material
issues under consideration.
Directors are provided with unrestricted
access to the company’s management
and company information, as well as the
resources required to carry out their
responsibilities, including external legal
advice, at the company’s expense.
It is the board’s responsibility to ensure
that effective management is in place
to implement the agreed strategy, and
to consider issues relating to succession
planning. The board is satisfied that the
current pool of talent available within
the company, and the ongoing work to
deepen the talent pool, provides adequate
succession depth in both the short and
long term.
Skills, knowledge, experience and attributes of directors
The board ensures that directors possess
the skills, knowledge and experience
necessary to fulfill their obligations.
The directors bring a balanced mix of
attributes to the board, including:
• international and domestic experience;
• operational experience;
• knowledge and understanding of
both the macroeconomic and the
microeconomic factors affecting
the group;
• local knowledge and networks; and
• financial, legal, entrepreneurial and
banking skills.
The credentials and demographic profile of
the board are regularly reviewed, to ensure
the board’s composition remains both
operationally and strategically appropriate.
Appointment philosophy
The appointment philosophy ensures
alignment with all necessary legislation
and regulations which include, but are not
limited to the requirements of the Central
Bank of Nigeria; SEC Code of Corporate
Governance; the Companies & Allied
Matters Act as well as the legislations of
Standard Bank Group’s home country.
Consideration for the appointment of
directors and key executives take into
account compliance with legal and
regulatory requirements and appointments
to external boards to monitor potential
for conflicts of interest and ensure
directors can dedicate sufficient focus to
the company’s business. The board takes
cognisance of the skills, knowledge and
experience of the candidate, as well as
other attributes considered necessary to
the prospective role.
The board’s size as at 31 December 2017
was ten (10), comprising one (1) executive
director and nine (9) non-executive
directors. It is important to note that of
the nine (9) non-executive directors,
three (3) namely; Mrs. Salamatu Hussaini
Suleiman, Ms. Ngozi Edozien and Prof.
Fabian Ajogwu, SAN, are Independent
Non-Executive Directors in compliance
with the CBN Code. The board has the
right mix of competencies and experience.
Board responsibilities
The key terms of reference in the board’s
mandate, which forms the basis for its
responsibilities, are to:
• agree the group’s objectives, strategies
and plans for achieving those
objectives;
• annually review the corporate
governance process and assess
achievement against objectives;
• review its mandate at least annually
and approve recommended changes;
• delegate to the chief executive or any
director holding any executive office or
any senior executive any of the powers,
authorities and discretions vested in the
board’s directors, including the power
of sub-delegation; and to delegate
similarly such powers, authorities and
discretions to any committee and
subsidiary company board as may exist
or be created from time to time;
• determine the terms of reference and
procedures of all board committees
and review their reports and minutes;
• consider and evaluate reports submitted
by members of the executive;
• ensure that an effective risk
management process exists and is
maintained throughout the group
and its subsidiaries to ensure financial
integrity and safeguarding of the
group’s assets;
• review and monitor the performance of
the chief executive and the executive
team;
• ensure consideration is given to
succession planning for the chief
executive and executive management;
• establish and review annually, and
approve major changes to, relevant
group policies;
• approve the remuneration of non-
executive directors on the board
and board committees, based on
Corporate governance report (continued)
recommendations made by the
remuneration committee, and
recommend to shareholders for
approval;
• approve capital funding for the group,
and the terms and conditions of rights
or other issues and any prospectus in
connection therewith;
• ensure that an adequate budget and
planning process exists, performance
is measured against budgets and
plans, and approve annual budgets
for the group;
• approve significant acquisitions,
mergers, take-overs, divestments
of operating companies, equity
investments and new strategic
alliances by the group;
• consider and approve capital
expenditure recommended by
the executive committee;
• consider and approve any significant
changes proposed in accounting
policy or practice, and consider the
recommendations of the statutory
audit committee;
• consider and approve the annual
financial statements, quarterly results
and dividend announcements and
notices to shareholders, and consider
the basis for determining that the
group will be a going concern as per
the recommendation of the audit
committee;
• assume ultimate responsibility for
financial, operational and internal
systems of control, and ensure adequate
reporting on these by committees
to which they are delegated;
• take ultimate responsibility for
regulatory compliance and ensure
that management reporting to the
board is comprehensive;
• ensure a balanced and understandable
assessment of the group’s position in
reporting to stakeholders;
• review non financial matters that have
not been specifically delegated to a
management committee; and
• specifically agree, from time to time,
matters that are reserved for its
decision, retaining the right to delegate
any of these matters to any committee
from time to time in accordance with
the articles of association.
Delegation of authority
The ultimate responsibility for the
company and its operations rests with the
board. The board retains effective control
through a well-developed governance
structure of board committees. These
committees provide in-depth focus on
specific areas of board responsibility.
The board delegates authority to the
chief executive to manage the business
and affairs of the company. The executive
committee assists the chief executive
when the board is not in session, subject to
specified parameters and any limits on the
board’s delegation of authority to the chief
executive.
Membership of the executive committee
is set out on page 111.
In addition, a governance framework for
executive management assists the chief
executive in his task. Board-delegated
authorities are regularly monitored by
the company secretary’s office.
The corporate governance framework
was adopted by the board on 28
November 2012 and formalised with
mandate approvals which were reviewed
in July 2017. The corporate governance
framework is set out below:
Stanbic IBTC HoldCo governance structure
Management Committees
Executive Committee
Stanbic IBTC Board
Statutory Audit CommitteeBoard Committees
Equity and Investment
Risk Committee
Internal Financial Control
Operational Risk &
Compliance Committee
Information Strategy &
Governance Committee
New & Amended Products, Business &
Services
IT Steering Committee
Risk Management
Risk Oversight
Committee
NominationsRemuneration (REMCO)
Legal Information Technology
ADHOC
Board Committees Statutory Committees Management Committees
aThis is continuously evolving to meet changing needs and requirements.
Shareholders
Annual report & financial statements110 111Stanbic IBTC Annual group financial statements for the year ended 31 December 2017 Overview Business review Annual report & financial statements Other information
10 April 2018
The Chairman
Stanbic IBTC Holdings PLC
The Head Office, IBTC Place
Walter Carrington Crescent
Victoria Island, Lagos.
Dear Sir,
Report to the Directors of Stanbic IBTC Holdings PLC on the outcome of the 2017 Board Performance Assessment
PricewaterhouseCoopers Limited (“PWC”) was engaged to carry out an evaluation of the Board of Directors of Stanbic IBTC
Holdings PLC. (“the Company”) as required by Section 15.1 of the Securities and Exchange Commission (“SEC”) Code of Corporate
Governance for Public Companies in Nigeria (“the Code or “SEC Code”). The evaluation covers the Board’s structure, composition,
responsibilities, processes, relationships and performance of the committees for the year ended 31 December 2017.
The Board is responsible for the preparation and presentation of information relevant to its performance. Our responsibility is to reach
a conclusion on the Board’s performance based on work carried out within the scope of our engagement as contained in our letter
of engagement. In carrying out the assessment, we have relied on representations made by the Directors and on the documents
provided for our review.
The Board has complied to a large extent with the provisions of the Code. Areas of compliance include establishment of an Audit
Committee, participation at Board training, adequate oversight of the audit plan, robust succession planning and implementation
of the succession plan. Also, the Board has adequate oversight of the Company’s risk exposures.
We have identified some areas for improvement. The Chairmen of the Company’s Board Committees should ensure they attend
the Annual General Meeting. Further details of our findings are contained in the full report.
We also facilitated a Self and Peer-assessment of each Director’s performance in the year under review. This assessment covered
the Director’s time commitment to the business of the Company, commitment to continuous learning and development and a self
& peer assessment. Each individual Director’s Assessment report was prepared and made available to them respectively while
a consolidated report of the performance of all Directors was also submitted to the Board Chairman.
Yours faithfully
For: PricewaterhouseCoopers Limited
Femi Osinubi
FRC/2017/ICAN/00000016659
PricewaterhouseCoopers Limited Landmark Towers, 5B Water Corporation Road, Victoria Island, PO Box 2419, Lagos, Nigeria
T: +234 (1) 271 1700, www.pwc.com/ng TIN: 00290010-0001 RC 39418
Directors: S Abu, O Adekoya, J.Adeola, W Adetokunbo-Ajayi, UN Akpata, E Agbeyi, O Alakhume, I Aruofor , K Asante-Poku (Ghanian), C Azobu, R Eastaugh (South African), E Erhie, K Erikume, A Eriksson (Kenyan), I Ezeuko, M Iwelumo, D McGraw (American), A Nevin (Canadian), (British), P Obianwa, B Odiaka, T Ogundipe, C. Ojechi, D. Oladipo, M. Olajide, P Omontuemhen, T Oputa, O Osinubi, T Oyedele, AB Rahji, O Ubah, A Ugarov (American), C. Uwaegbute
Report of the external consultants on board effectiveness and evaluation
Induction and training
An induction programme designed to meet the needs of each
new director is being implemented. One-on-one meetings are
scheduled with management to introduce new directors to the
company and its operations. The company secretary manages
the induction programme. The CBN Code of Conduct as well
as the Securities & Exchange Commission’s code of corporate
governance is provided to new directors on their appointment.
Directors are kept abreast of all relevant legislation and regulations
as well as sector developments leading to changing risks to the
organisation on an on-going basis. This is achieved by way
of management reporting and quarterly board meetings,
which are structured to form part of ongoing training.
Directors attended various trainings at different periods during
the year that included trainings on Risk Management; enhancing
Board performance, Change Management, and Financial
Reporting. These trainings were aimed at enhancing the
understanding of key issues, and skills of directors.
Corporate governance report (continued)
S/N Name Responsibility
i Yinka Sanni Chief Executive, Stanbic IBTC Holdings PLC
ii Demola Sogunle Chief Executive, Stanbic IBTC Bank PLC
iii Wole Adeniyi Executive Director, Business support, Stanbic IBTC Bank PLC
iv Babatunde Macaulay Executive Director, Personal & Business Banking, Stanbic IBTC Bank PLC
v Andrew Mashanda Executive Director, Corporate & Transactional Banking, Stanbic IBTC Bank PLC
vi Eric Fajemisin Chief Executive, Stanbic IBTC Pension Managers Limited
vii Victor Yeboah-Manu Chief Financial Officer
viii Angela Omo-Dare Country Head, Legal Services, Stanbic IBTC Holdings PLC
ix Benjamin Ahulu Head, Internal Audit, Stanbic IBTC Bank PLC
x Dele Kuti Global Sector Head - Oil & Gas Client Coverage
xi Sam Ocheho Head, Global Markets, Stanbic IBTC Bank PLC
xii M'fon Akpan Head, Risk, Stanbic IBTC Bank PLC
xiii Rotimi Adojutelegan Chief Compliance Officer, Stanbic IBTC Bank PLC
xiv Gboyega Dada Chief Information Officer
xv Olufunke Amobi Head, Human Capital
xvi Malcom Irabor Head, Legal Services, Stanbic IBTC Bank PLC
xvii Kola Lawal Head, Corporate & Investment Banking Credit
xviii Nkiru Olumide-Ojo Head, Marketing & Communications
xix Chidi Okezie Company Secretary
xx Oluwatosin Odutayo Ag. Financial Controller, Stanbic IBTC Bank PLC
xxi Taiwo Ala Head, Internal Control
Executive committee members
As at 31 December 2017, the Group Executive committee comprised 21 members drawn from key functions within the Company
as well as its subsidiaries
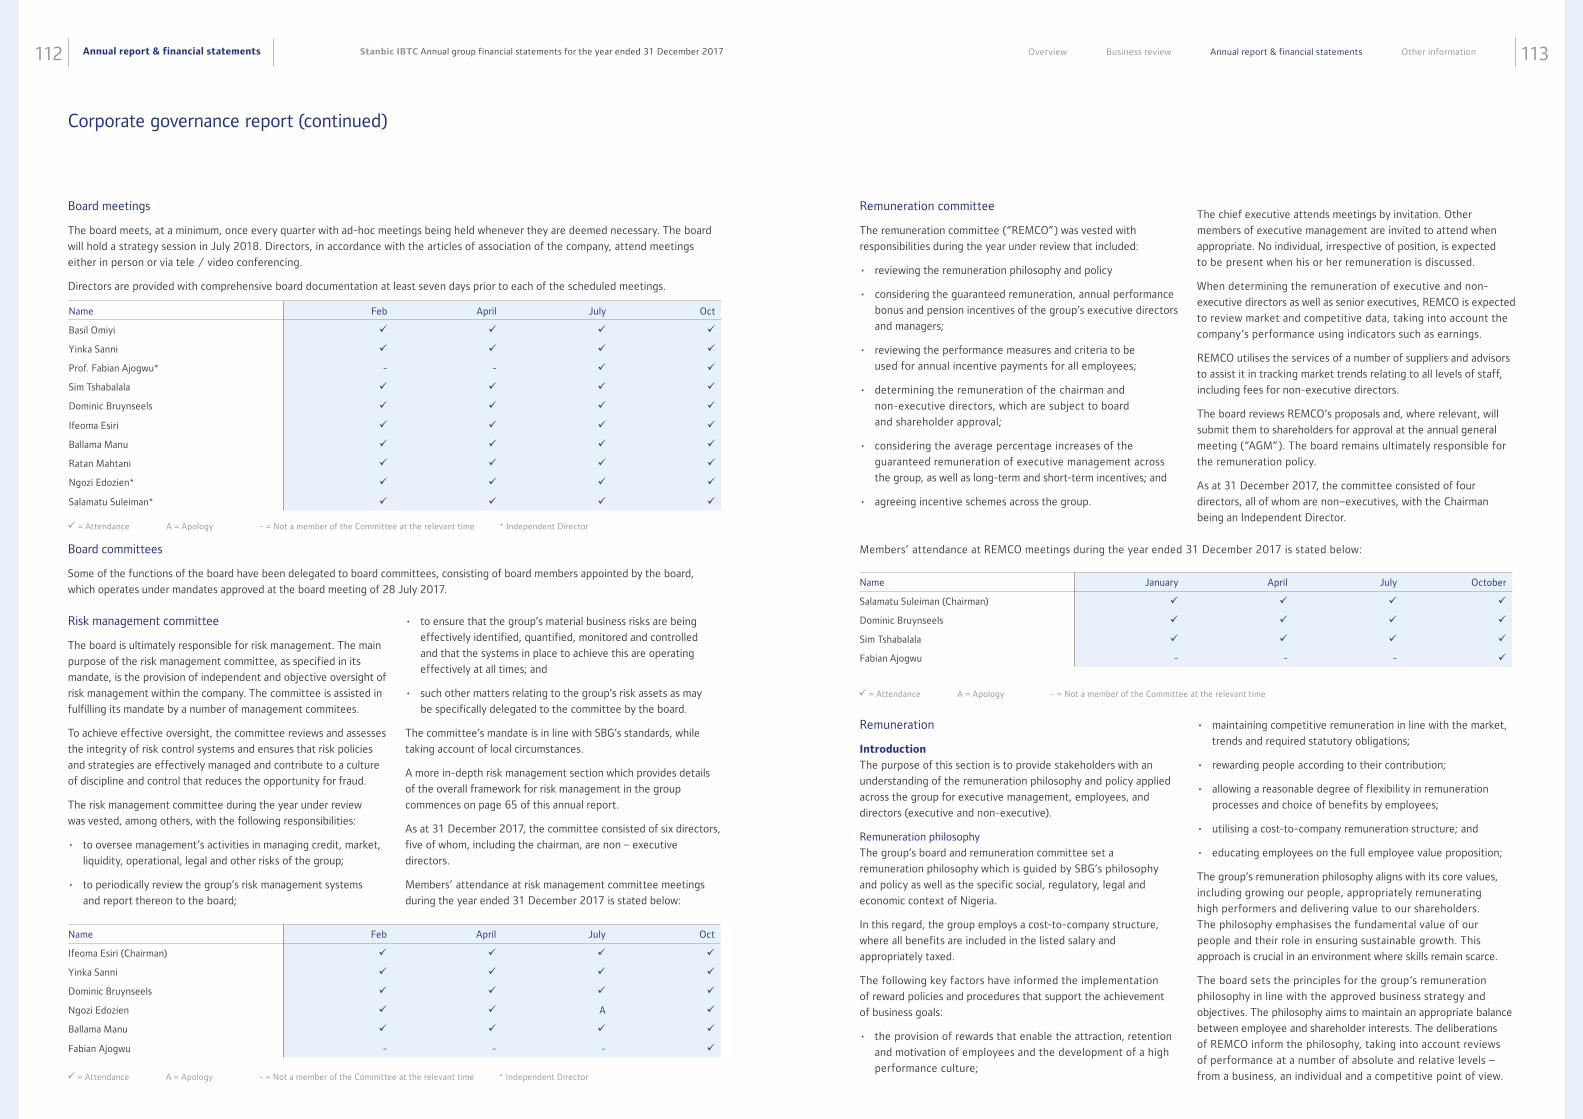
Annual report & financial statements112 113Stanbic IBTC Annual group financial statements for the year ended 31 December 2017 Overview Business review Annual report & financial statements Other information
Risk management committee
The board is ultimately responsible for risk management. The main
purpose of the risk management committee, as specified in its
mandate, is the provision of independent and objective oversight of
risk management within the company. The committee is assisted in
fulfilling its mandate by a number of management commitees.
To achieve effective oversight, the committee reviews and assesses
the integrity of risk control systems and ensures that risk policies
and strategies are effectively managed and contribute to a culture
of discipline and control that reduces the opportunity for fraud.
The risk management committee during the year under review
was vested, among others, with the following responsibilities:
• to oversee management’s activities in managing credit, market,
liquidity, operational, legal and other risks of the group;
• to periodically review the group’s risk management systems
and report thereon to the board;
• to ensure that the group’s material business risks are being
effectively identified, quantified, monitored and controlled
and that the systems in place to achieve this are operating
effectively at all times; and
• such other matters relating to the group’s risk assets as may
be specifically delegated to the committee by the board.
The committee’s mandate is in line with SBG’s standards, while
taking account of local circumstances.
A more in-depth risk management section which provides details
of the overall framework for risk management in the group
commences on page 65 of this annual report.
As at 31 December 2017, the committee consisted of six directors,
five of whom, including the chairman, are non – executive
directors.
Members’ attendance at risk management committee meetings
during the year ended 31 December 2017 is stated below:
Name Feb April July Oct
Ifeoma Esiri (Chairman)
Yinka Sanni
Dominic Bruynseels
Ngozi Edozien A
Ballama Manu
Fabian Ajogwu - - -
Name January April July October
Salamatu Suleiman (Chairman)
Dominic Bruynseels
Sim Tshabalala
Fabian Ajogwu - - -
= Attendance A = Apology - = Not a member of the Committee at the relevant time * Independent Director
= Attendance A = Apology - = Not a member of the Committee at the relevant time
Remuneration committee
The remuneration committee (“REMCO”) was vested with
responsibilities during the year under review that included:
• reviewing the remuneration philosophy and policy
• considering the guaranteed remuneration, annual performance
bonus and pension incentives of the group’s executive directors
and managers;
• reviewing the performance measures and criteria to be
used for annual incentive payments for all employees;
• determining the remuneration of the chairman and
non-executive directors, which are subject to board
and shareholder approval;
• considering the average percentage increases of the
guaranteed remuneration of executive management across
the group, as well as long-term and short-term incentives; and
• agreeing incentive schemes across the group.
The chief executive attends meetings by invitation. Other
members of executive management are invited to attend when
appropriate. No individual, irrespective of position, is expected
to be present when his or her remuneration is discussed.
When determining the remuneration of executive and non-
executive directors as well as senior executives, REMCO is expected
to review market and competitive data, taking into account the
company’s performance using indicators such as earnings.
REMCO utilises the services of a number of suppliers and advisors
to assist it in tracking market trends relating to all levels of staff,
including fees for non-executive directors.
The board reviews REMCO’s proposals and, where relevant, will
submit them to shareholders for approval at the annual general
meeting (“AGM”). The board remains ultimately responsible for
the remuneration policy.
As at 31 December 2017, the committee consisted of four
directors, all of whom are non–executives, with the Chairman
being an Independent Director.
Remuneration
Introduction
The purpose of this section is to provide stakeholders with an
understanding of the remuneration philosophy and policy applied
across the group for executive management, employees, and
directors (executive and non-executive).
Remuneration philosophy
The group’s board and remuneration committee set a
remuneration philosophy which is guided by SBG’s philosophy
and policy as well as the specific social, regulatory, legal and
economic context of Nigeria.
In this regard, the group employs a cost-to-company structure,
where all benefits are included in the listed salary and
appropriately taxed.
The following key factors have informed the implementation
of reward policies and procedures that support the achievement
of business goals:
• the provision of rewards that enable the attraction, retention
and motivation of employees and the development of a high
performance culture;
• maintaining competitive remuneration in line with the market,
trends and required statutory obligations;
• rewarding people according to their contribution;
• allowing a reasonable degree of flexibility in remuneration
processes and choice of benefits by employees;
• utilising a cost-to-company remuneration structure; and
• educating employees on the full employee value proposition;
The group’s remuneration philosophy aligns with its core values,
including growing our people, appropriately remunerating
high performers and delivering value to our shareholders.
The philosophy emphasises the fundamental value of our
people and their role in ensuring sustainable growth. This
approach is crucial in an environment where skills remain scarce.
The board sets the principles for the group‘s remuneration
philosophy in line with the approved business strategy and
objectives. The philosophy aims to maintain an appropriate balance
between employee and shareholder interests. The deliberations
of REMCO inform the philosophy, taking into account reviews
of performance at a number of absolute and relative levels –
from a business, an individual and a competitive point of view.
Corporate governance report (continued)
Members’ attendance at REMCO meetings during the year ended 31 December 2017 is stated below:
Name Feb April July Oct
Basil Omiyi
Yinka Sanni
Prof. Fabian Ajogwu* - -
Sim Tshabalala
Dominic Bruynseels
Ifeoma Esiri
Ballama Manu
Ratan Mahtani
Ngozi Edozien*
Salamatu Suleiman*
= Attendance A = Apology - = Not a member of the Committee at the relevant time * Independent Director
Board meetings
The board meets, at a minimum, once every quarter with ad-hoc meetings being held whenever they are deemed necessary. The board
will hold a strategy session in July 2018. Directors, in accordance with the articles of association of the company, attend meetings
either in person or via tele / video conferencing.
Directors are provided with comprehensive board documentation at least seven days prior to each of the scheduled meetings.
Board committees
Some of the functions of the board have been delegated to board committees, consisting of board members appointed by the board,
which operates under mandates approved at the board meeting of 28 July 2017.
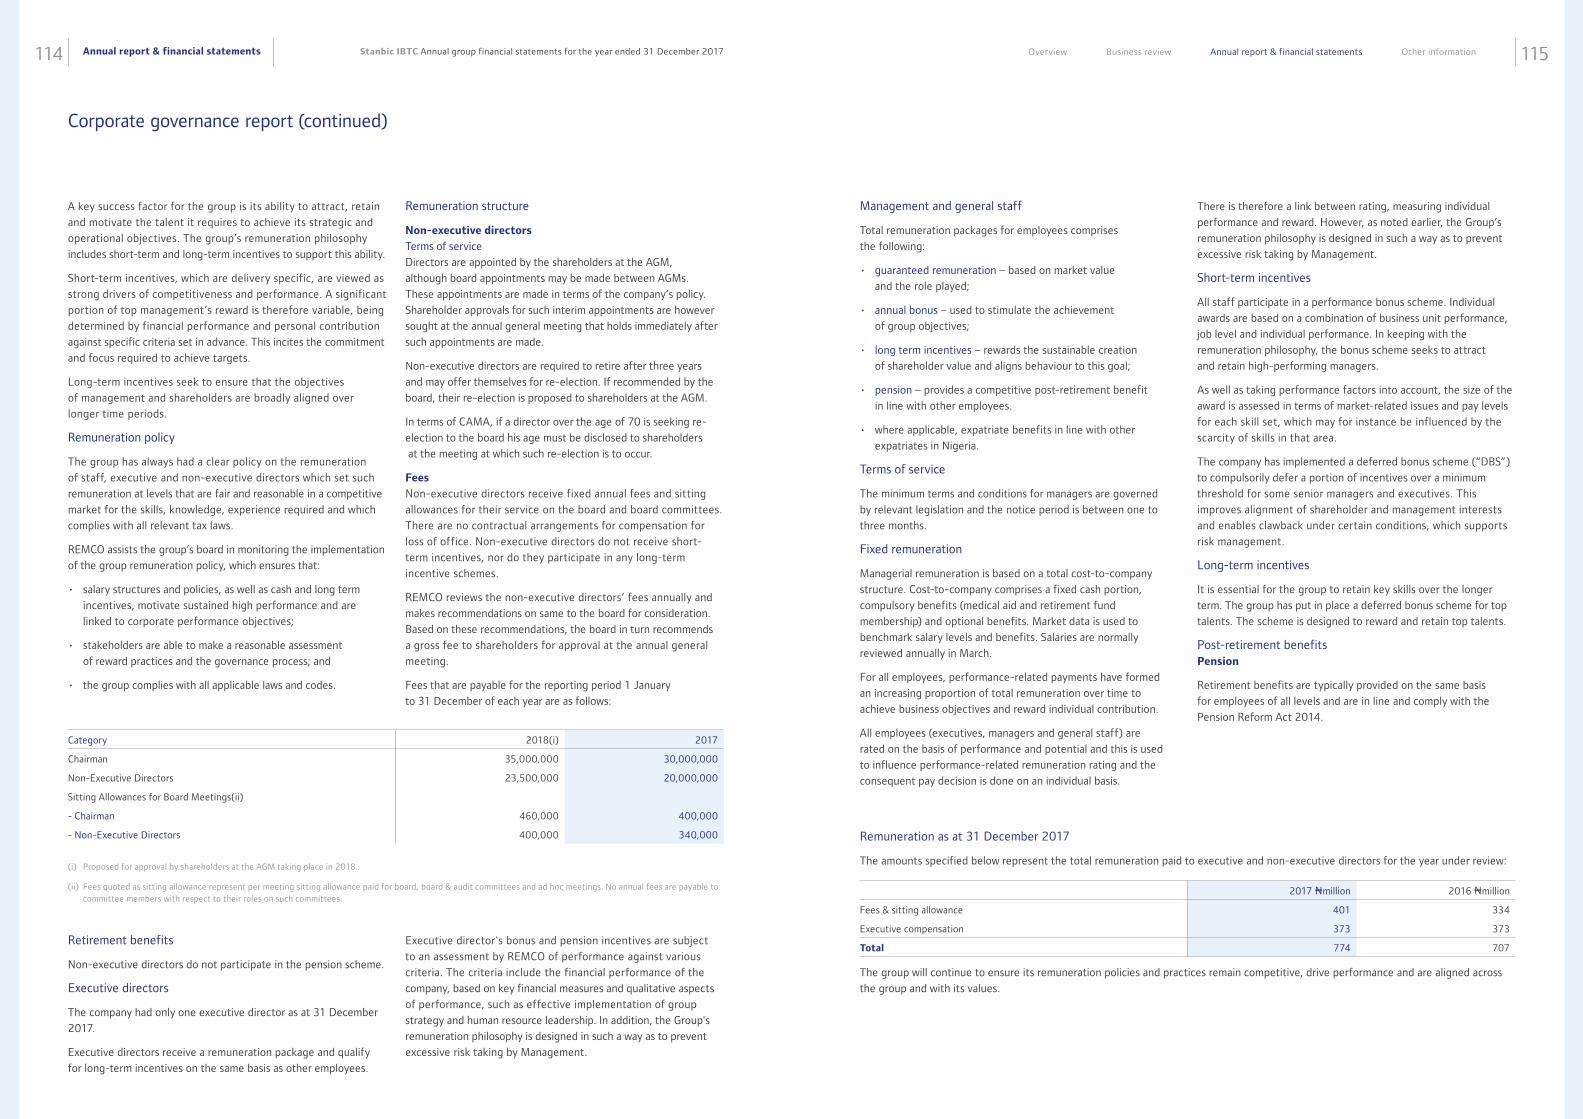
Annual report & financial statements114 115Stanbic IBTC Annual group financial statements for the year ended 31 December 2017 Overview Business review Annual report & financial statements Other information
Category 2018(i) 2017
Chairman 35,000,000 30,000,000
Non-Executive Directors 23,500,000 20,000,000
Sitting Allowances for Board Meetings(ii)
- Chairman 460,000 400,000
- Non-Executive Directors 400,000 340,000
(i) Proposed for approval by shareholders at the AGM taking place in 2018.
(ii) Fees quoted as sitting allowance represent per meeting sitting allowance paid for board, board & audit committees and ad hoc meetings. No annual fees are payable to committee members with respect to their roles on such committees.
Management and general staff
Total remuneration packages for employees comprises
the following:
• guaranteed remuneration – based on market value
and the role played;
• annual bonus – used to stimulate the achievement
of group objectives;
• long term incentives – rewards the sustainable creation
of shareholder value and aligns behaviour to this goal;
• pension – provides a competitive post-retirement benefit
in line with other employees.
• where applicable, expatriate benefits in line with other
expatriates in Nigeria.
Terms of service
The minimum terms and conditions for managers are governed
by relevant legislation and the notice period is between one to
three months.
Fixed remuneration
Managerial remuneration is based on a total cost-to-company
structure. Cost-to-company comprises a fixed cash portion,
compulsory benefits (medical aid and retirement fund
membership) and optional benefits. Market data is used to
benchmark salary levels and benefits. Salaries are normally
reviewed annually in March.
For all employees, performance-related payments have formed
an increasing proportion of total remuneration over time to
achieve business objectives and reward individual contribution.
All employees (executives, managers and general staff) are
rated on the basis of performance and potential and this is used
to influence performance-related remuneration rating and the
consequent pay decision is done on an individual basis.
There is therefore a link between rating, measuring individual
performance and reward. However, as noted earlier, the Group’s
remuneration philosophy is designed in such a way as to prevent
excessive risk taking by Management.
Short-term incentives
All staff participate in a performance bonus scheme. Individual
awards are based on a combination of business unit performance,
job level and individual performance. In keeping with the
remuneration philosophy, the bonus scheme seeks to attract
and retain high-performing managers.
As well as taking performance factors into account, the size of the
award is assessed in terms of market-related issues and pay levels
for each skill set, which may for instance be influenced by the
scarcity of skills in that area.
The company has implemented a deferred bonus scheme (“DBS”)
to compulsorily defer a portion of incentives over a minimum
threshold for some senior managers and executives. This
improves alignment of shareholder and management interests
and enables clawback under certain conditions, which supports
risk management.
Long-term incentives
It is essential for the group to retain key skills over the longer
term. The group has put in place a deferred bonus scheme for top
talents. The scheme is designed to reward and retain top talents.
Post-retirement benefits Pension
Retirement benefits are typically provided on the same basis
for employees of all levels and are in line and comply with the
Pension Reform Act 2014.
Corporate governance report (continued)
A key success factor for the group is its ability to attract, retain
and motivate the talent it requires to achieve its strategic and
operational objectives. The group’s remuneration philosophy
includes short-term and long-term incentives to support this ability.
Short-term incentives, which are delivery specific, are viewed as
strong drivers of competitiveness and performance. A significant
portion of top management’s reward is therefore variable, being
determined by financial performance and personal contribution
against specific criteria set in advance. This incites the commitment
and focus required to achieve targets.
Long-term incentives seek to ensure that the objectives
of management and shareholders are broadly aligned over
longer time periods.
Remuneration policy
The group has always had a clear policy on the remuneration
of staff, executive and non-executive directors which set such
remuneration at levels that are fair and reasonable in a competitive
market for the skills, knowledge, experience required and which
complies with all relevant tax laws.
REMCO assists the group’s board in monitoring the implementation
of the group remuneration policy, which ensures that:
• salary structures and policies, as well as cash and long term
incentives, motivate sustained high performance and are
linked to corporate performance objectives;
• stakeholders are able to make a reasonable assessment
of reward practices and the governance process; and
• the group complies with all applicable laws and codes.
Remuneration structure
Non-executive directors
Terms of service
Directors are appointed by the shareholders at the AGM,
although board appointments may be made between AGMs.
These appointments are made in terms of the company’s policy.
Shareholder approvals for such interim appointments are however
sought at the annual general meeting that holds immediately after
such appointments are made.
Non-executive directors are required to retire after three years
and may offer themselves for re-election. If recommended by the
board, their re-election is proposed to shareholders at the AGM.
In terms of CAMA, if a director over the age of 70 is seeking re-
election to the board his age must be disclosed to shareholders
at the meeting at which such re-election is to occur.
Fees
Non-executive directors receive fixed annual fees and sitting
allowances for their service on the board and board committees.
There are no contractual arrangements for compensation for
loss of office. Non-executive directors do not receive short-
term incentives, nor do they participate in any long-term
incentive schemes.
REMCO reviews the non-executive directors’ fees annually and
makes recommendations on same to the board for consideration.
Based on these recommendations, the board in turn recommends
a gross fee to shareholders for approval at the annual general
meeting.
Fees that are payable for the reporting period 1 January
to 31 December of each year are as follows:
Retirement benefits
Non-executive directors do not participate in the pension scheme.
Executive directors
The company had only one executive director as at 31 December
2017.
Executive directors receive a remuneration package and qualify
for long-term incentives on the same basis as other employees.
Executive director's bonus and pension incentives are subject
to an assessment by REMCO of performance against various
criteria. The criteria include the financial performance of the
company, based on key financial measures and qualitative aspects
of performance, such as effective implementation of group
strategy and human resource leadership. In addition, the Group's
remuneration philosophy is designed in such a way as to prevent
excessive risk taking by Management.
2017 Nmillion 2016 Nmillion
Fees & sitting allowance 401 334
Executive compensation 373 373
Total 774 707
Remuneration as at 31 December 2017
The amounts specified below represent the total remuneration paid to executive and non-executive directors for the year under review:
The group will continue to ensure its remuneration policies and practices remain competitive, drive performance and are aligned across
the group and with its values.
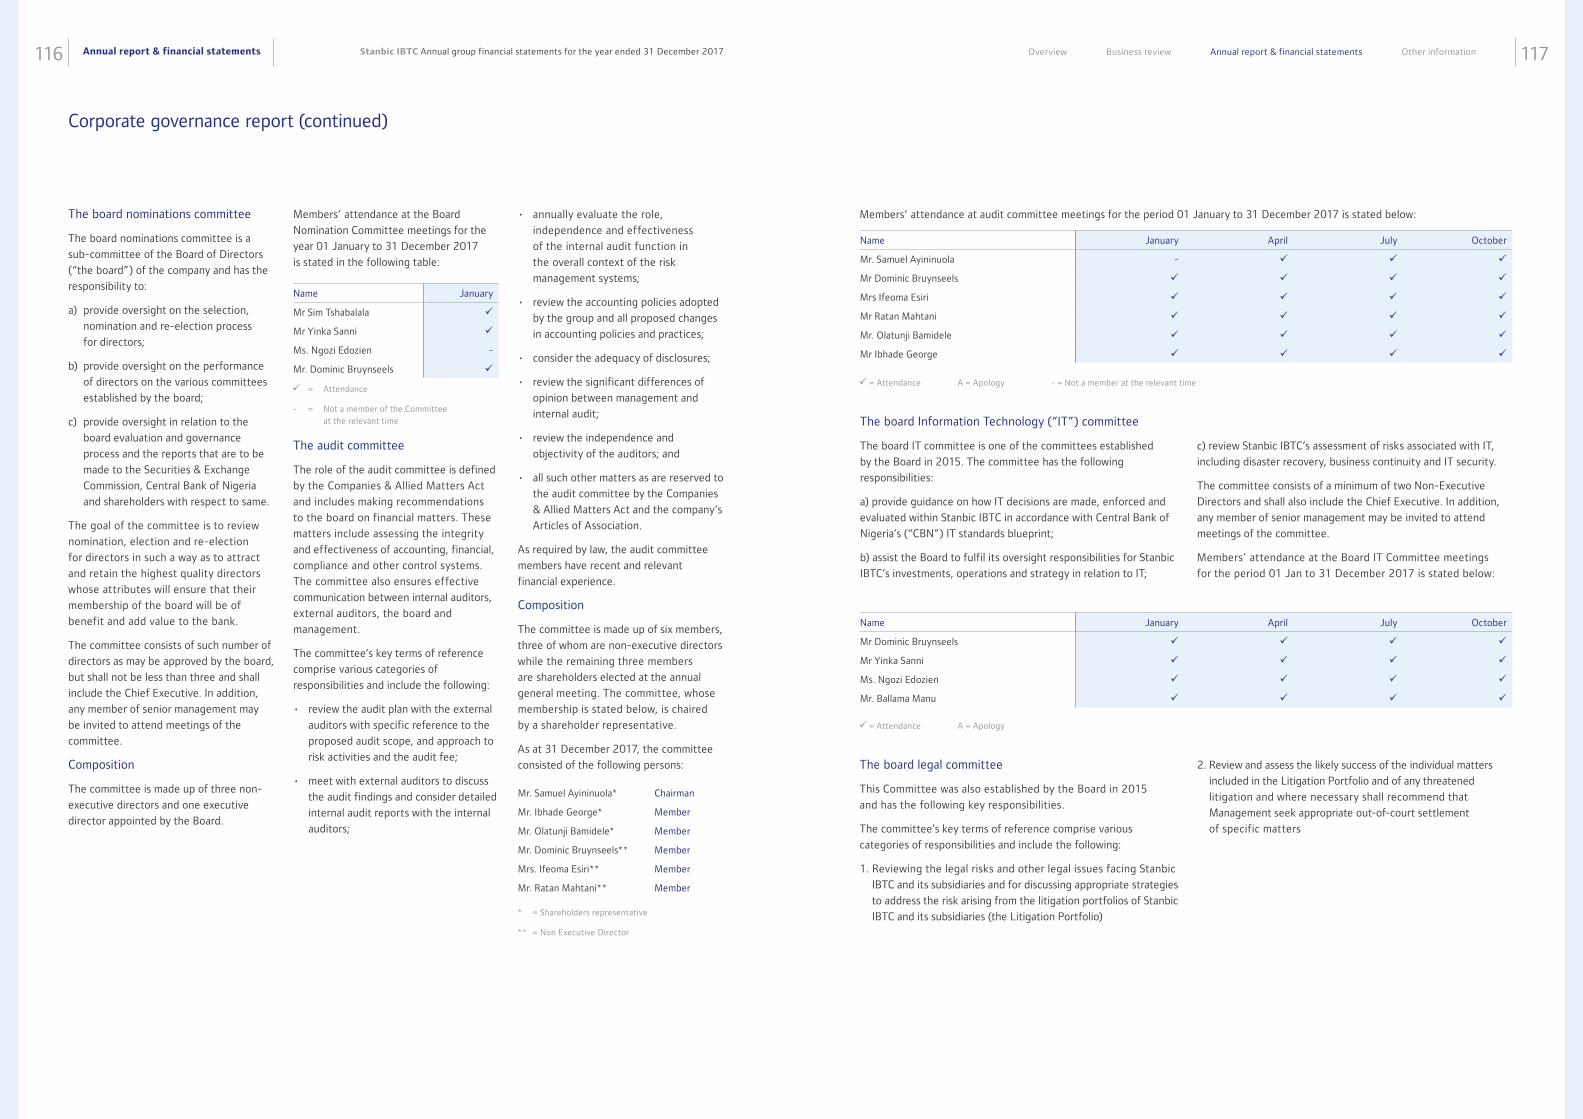
Annual report & financial statements116 117Stanbic IBTC Annual group financial statements for the year ended 31 December 2017 Overview Business review Annual report & financial statements Other information
Name January April July October
Mr. Samuel Ayininuola -
Mr Dominic Bruynseels
Mrs Ifeoma Esiri
Mr Ratan Mahtani
Mr. Olatunji Bamidele
Mr Ibhade George
= Attendance A = Apology - = Not a member at the relevant time
Members’ attendance at audit committee meetings for the period 01 January to 31 December 2017 is stated below:
Name January April July October
Mr Dominic Bruynseels
Mr Yinka Sanni
Ms. Ngozi Edozien
Mr. Ballama Manu
= Attendance A = Apology
The board Information Technology (“IT”) committee
The board IT committee is one of the committees established
by the Board in 2015. The committee has the following
responsibilities:
a) provide guidance on how IT decisions are made, enforced and
evaluated within Stanbic IBTC in accordance with Central Bank of
Nigeria’s (“CBN”) IT standards blueprint;
b) assist the Board to fulfil its oversight responsibilities for Stanbic
IBTC’s investments, operations and strategy in relation to IT;
c) review Stanbic IBTC’s assessment of risks associated with IT,
including disaster recovery, business continuity and IT security.
The committee consists of a minimum of two Non-Executive
Directors and shall also include the Chief Executive. In addition,
any member of senior management may be invited to attend
meetings of the committee.
Members’ attendance at the Board IT Committee meetings
for the period 01 Jan to 31 December 2017 is stated below:
Corporate governance report (continued)
• annually evaluate the role,
independence and effectiveness
of the internal audit function in
the overall context of the risk
management systems;
• review the accounting policies adopted
by the group and all proposed changes
in accounting policies and practices;
• consider the adequacy of disclosures;
• review the significant differences of
opinion between management and
internal audit;
• review the independence and
objectivity of the auditors; and
• all such other matters as are reserved to
the audit committee by the Companies
& Allied Matters Act and the company’s
Articles of Association.
As required by law, the audit committee
members have recent and relevant
financial experience.
Composition
The committee is made up of six members,
three of whom are non-executive directors
while the remaining three members
are shareholders elected at the annual
general meeting. The committee, whose
membership is stated below, is chaired
by a shareholder representative.
As at 31 December 2017, the committee
consisted of the following persons:
Mr. Samuel Ayininuola* Chairman
Mr. Ibhade George* Member
Mr. Olatunji Bamidele* Member
Mr. Dominic Bruynseels** Member
Mrs. Ifeoma Esiri** Member
Mr. Ratan Mahtani** Member
* = Shareholders representative
** = Non Executive Director
The board nominations committee
The board nominations committee is a
sub-committee of the Board of Directors
(“the board”) of the company and has the
responsibility to:
a) provide oversight on the selection,
nomination and re-election process
for directors;
b) provide oversight on the performance
of directors on the various committees
established by the board;
c) provide oversight in relation to the
board evaluation and governance
process and the reports that are to be
made to the Securities & Exchange
Commission, Central Bank of Nigeria
and shareholders with respect to same.
The goal of the committee is to review
nomination, election and re-election
for directors in such a way as to attract
and retain the highest quality directors
whose attributes will ensure that their
membership of the board will be of
benefit and add value to the bank.
The committee consists of such number of
directors as may be approved by the board,
but shall not be less than three and shall
include the Chief Executive. In addition,
any member of senior management may
be invited to attend meetings of the
committee.
Composition
The committee is made up of three non-
executive directors and one executive
director appointed by the Board.
Name January
Mr Sim Tshabalala
Mr Yinka Sanni
Ms. Ngozi Edozien -
Mr. Dominic Bruynseels
= Attendance
- = Not a member of the Committee at the relevant time
The audit committee
The role of the audit committee is defined
by the Companies & Allied Matters Act
and includes making recommendations
to the board on financial matters. These
matters include assessing the integrity
and effectiveness of accounting, financial,
compliance and other control systems.
The committee also ensures effective
communication between internal auditors,
external auditors, the board and
management.
The committee’s key terms of reference
comprise various categories of
responsibilities and include the following:
• review the audit plan with the external
auditors with specific reference to the
proposed audit scope, and approach to
risk activities and the audit fee;
• meet with external auditors to discuss
the audit findings and consider detailed
internal audit reports with the internal
auditors;
Members’ attendance at the Board
Nomination Committee meetings for the
year 01 January to 31 December 2017
is stated in the following table:
The board legal committee
This Committee was also established by the Board in 2015
and has the following key responsibilities.
The committee’s key terms of reference comprise various
categories of responsibilities and include the following:
1. Reviewing the legal risks and other legal issues facing Stanbic
IBTC and its subsidiaries and for discussing appropriate strategies
to address the risk arising from the litigation portfolios of Stanbic
IBTC and its subsidiaries (the Litigation Portfolio)
2. Review and assess the likely success of the individual matters
included in the Litigation Portfolio and of any threatened
litigation and where necessary shall recommend that
Management seek appropriate out-of-court settlement
of specific matters
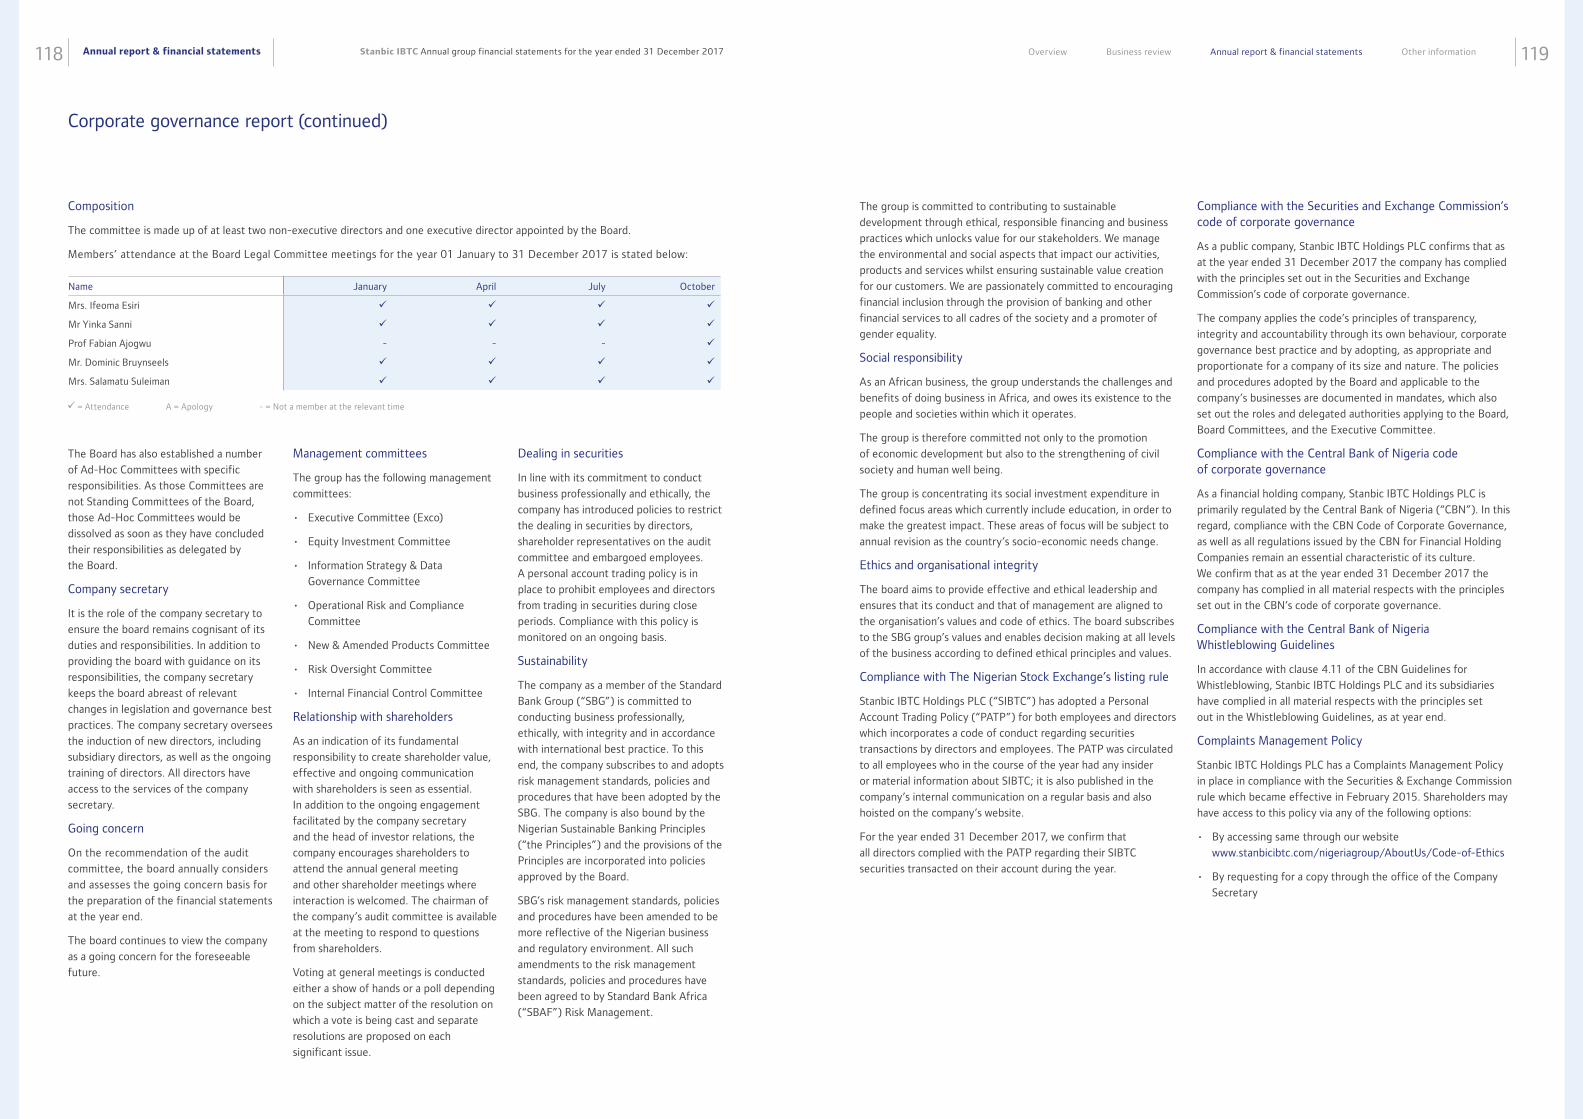
Annual report & financial statements118 119Stanbic IBTC Annual group financial statements for the year ended 31 December 2017 Overview Business review Annual report & financial statements Other information
Name January April July October
Mrs. Ifeoma Esiri
Mr Yinka Sanni
Prof Fabian Ajogwu - - -
Mr. Dominic Bruynseels
Mrs. Salamatu Suleiman
= Attendance A = Apology - = Not a member at the relevant time
The Board has also established a number
of Ad-Hoc Committees with specific
responsibilities. As those Committees are
not Standing Committees of the Board,
those Ad-Hoc Committees would be
dissolved as soon as they have concluded
their responsibilities as delegated by
the Board.
Company secretary
It is the role of the company secretary to
ensure the board remains cognisant of its
duties and responsibilities. In addition to
providing the board with guidance on its
responsibilities, the company secretary
keeps the board abreast of relevant
changes in legislation and governance best
practices. The company secretary oversees
the induction of new directors, including
subsidiary directors, as well as the ongoing
training of directors. All directors have
access to the services of the company
secretary.
Going concern
On the recommendation of the audit
committee, the board annually considers
and assesses the going concern basis for
the preparation of the financial statements
at the year end.
The board continues to view the company
as a going concern for the foreseeable
future.
Management committees
The group has the following management
committees:
• Executive Committee (Exco)
• Equity Investment Committee
• Information Strategy & Data
Governance Committee
• Operational Risk and Compliance
Committee
• New & Amended Products Committee
• Risk Oversight Committee
• Internal Financial Control Committee
Relationship with shareholders
As an indication of its fundamental
responsibility to create shareholder value,
effective and ongoing communication
with shareholders is seen as essential.
In addition to the ongoing engagement
facilitated by the company secretary
and the head of investor relations, the
company encourages shareholders to
attend the annual general meeting
and other shareholder meetings where
interaction is welcomed. The chairman of
the company’s audit committee is available
at the meeting to respond to questions
from shareholders.
Voting at general meetings is conducted
either a show of hands or a poll depending
on the subject matter of the resolution on
which a vote is being cast and separate
resolutions are proposed on each
significant issue.
Dealing in securities
In line with its commitment to conduct
business professionally and ethically, the
company has introduced policies to restrict
the dealing in securities by directors,
shareholder representatives on the audit
committee and embargoed employees.
A personal account trading policy is in
place to prohibit employees and directors
from trading in securities during close
periods. Compliance with this policy is
monitored on an ongoing basis.
Sustainability
The company as a member of the Standard
Bank Group (“SBG”) is committed to
conducting business professionally,
ethically, with integrity and in accordance
with international best practice. To this
end, the company subscribes to and adopts
risk management standards, policies and
procedures that have been adopted by the
SBG. The company is also bound by the
Nigerian Sustainable Banking Principles
(“the Principles”) and the provisions of the
Principles are incorporated into policies
approved by the Board.
SBG’s risk management standards, policies
and procedures have been amended to be
more reflective of the Nigerian business
and regulatory environment. All such
amendments to the risk management
standards, policies and procedures have
been agreed to by Standard Bank Africa
(“SBAF”) Risk Management.
Composition
The committee is made up of at least two non-executive directors and one executive director appointed by the Board.
Members’ attendance at the Board Legal Committee meetings for the year 01 January to 31 December 2017 is stated below:
Corporate governance report (continued)
The group is committed to contributing to sustainable
development through ethical, responsible financing and business
practices which unlocks value for our stakeholders. We manage
the environmental and social aspects that impact our activities,
products and services whilst ensuring sustainable value creation
for our customers. We are passionately committed to encouraging
financial inclusion through the provision of banking and other
financial services to all cadres of the society and a promoter of
gender equality.
Social responsibility
As an African business, the group understands the challenges and
benefits of doing business in Africa, and owes its existence to the
people and societies within which it operates.
The group is therefore committed not only to the promotion
of economic development but also to the strengthening of civil
society and human well being.
The group is concentrating its social investment expenditure in
defined focus areas which currently include education, in order to
make the greatest impact. These areas of focus will be subject to
annual revision as the country’s socio-economic needs change.
Ethics and organisational integrity
The board aims to provide effective and ethical leadership and
ensures that its conduct and that of management are aligned to
the organisation’s values and code of ethics. The board subscribes
to the SBG group’s values and enables decision making at all levels
of the business according to defined ethical principles and values.
Compliance with The Nigerian Stock Exchange’s listing rule
Stanbic IBTC Holdings PLC (“SIBTC”) has adopted a Personal
Account Trading Policy (“PATP”) for both employees and directors
which incorporates a code of conduct regarding securities
transactions by directors and employees. The PATP was circulated
to all employees who in the course of the year had any insider
or material information about SIBTC; it is also published in the
company’s internal communication on a regular basis and also
hoisted on the company’s website.
For the year ended 31 December 2017, we confirm that
all directors complied with the PATP regarding their SIBTC
securities transacted on their account during the year.
Compliance with the Securities and Exchange Commission’s code of corporate governance
As a public company, Stanbic IBTC Holdings PLC confirms that as
at the year ended 31 December 2017 the company has complied
with the principles set out in the Securities and Exchange
Commission’s code of corporate governance.
The company applies the code’s principles of transparency,
integrity and accountability through its own behaviour, corporate
governance best practice and by adopting, as appropriate and
proportionate for a company of its size and nature. The policies
and procedures adopted by the Board and applicable to the
company’s businesses are documented in mandates, which also
set out the roles and delegated authorities applying to the Board,
Board Committees, and the Executive Committee.
Compliance with the Central Bank of Nigeria code of corporate governance
As a financial holding company, Stanbic IBTC Holdings PLC is
primarily regulated by the Central Bank of Nigeria (“CBN”). In this
regard, compliance with the CBN Code of Corporate Governance,
as well as all regulations issued by the CBN for Financial Holding
Companies remain an essential characteristic of its culture.
We confirm that as at the year ended 31 December 2017 the
company has complied in all material respects with the principles
set out in the CBN’s code of corporate governance.
Compliance with the Central Bank of Nigeria Whistleblowing Guidelines
In accordance with clause 4.11 of the CBN Guidelines for
Whistleblowing, Stanbic IBTC Holdings PLC and its subsidiaries
have complied in all material respects with the principles set
out in the Whistleblowing Guidelines, as at year end.
Complaints Management Policy
Stanbic IBTC Holdings PLC has a Complaints Management Policy
in place in compliance with the Securities & Exchange Commission
rule which became effective in February 2015. Shareholders may
have access to this policy via any of the following options:
• By accessing same through our website
www.stanbicibtc.com/nigeriagroup/AboutUs/Code-of-Ethics
• By requesting for a copy through the office of the Company
Secretary
Annual report & financial statements120 121Stanbic IBTC Annual group financial statements for the year ended 31 December 2017 Overview Business review Annual report & financial statements Other information
The group is an equal opportunity employer that is committed to maintaining a positive work environment that facilitates high level of
professional efficiency at all times. The group’s policy prohibits discrimination against gender, physically challenged persons or persons
with HIV in the recruitment, training and career development of its employees.
i) Physically challenged persons:
The group continues to maintain a policy of giving fair consideration to applications for employment made by physically challenged
persons with due regard to their abilities and aptitude.
ii) Gender diversity within the group
31 Dec 2017 31 Dec 2016
Workforce % of gender composition Workforce % of gender composition
Total workforce:
Women 1,285 42% 1,241 42%
Men 1,746 58% 1,685 58%
3,031 100% 2,926 100%
Recruitments made during the period:
Women 168 41% 214 44%
Men 242 59% 275 56%
410 100% 489 100%
Diversity of members of board of directors
– Number of Board members:
Women 3 30% 3 30%
Men 7 70% 7 70%
10 100% 10 100%
Diversity of board executives – Number of
Executive directors to Chief executive officer:
Women - 0% 1 100%
Men 1 100% 0%
1 100% 1 100%
Diversity of senior management team – Number of
Assistant General Manager to General Manager
Women 30 33% 29 32%
Men 61 67% 63 68%
91 100% 92 100%
Disclosure on diversity in employment
Chidi Okezie
Company Secretary
FRC/2013/NBA/00000001082
01 February 2018
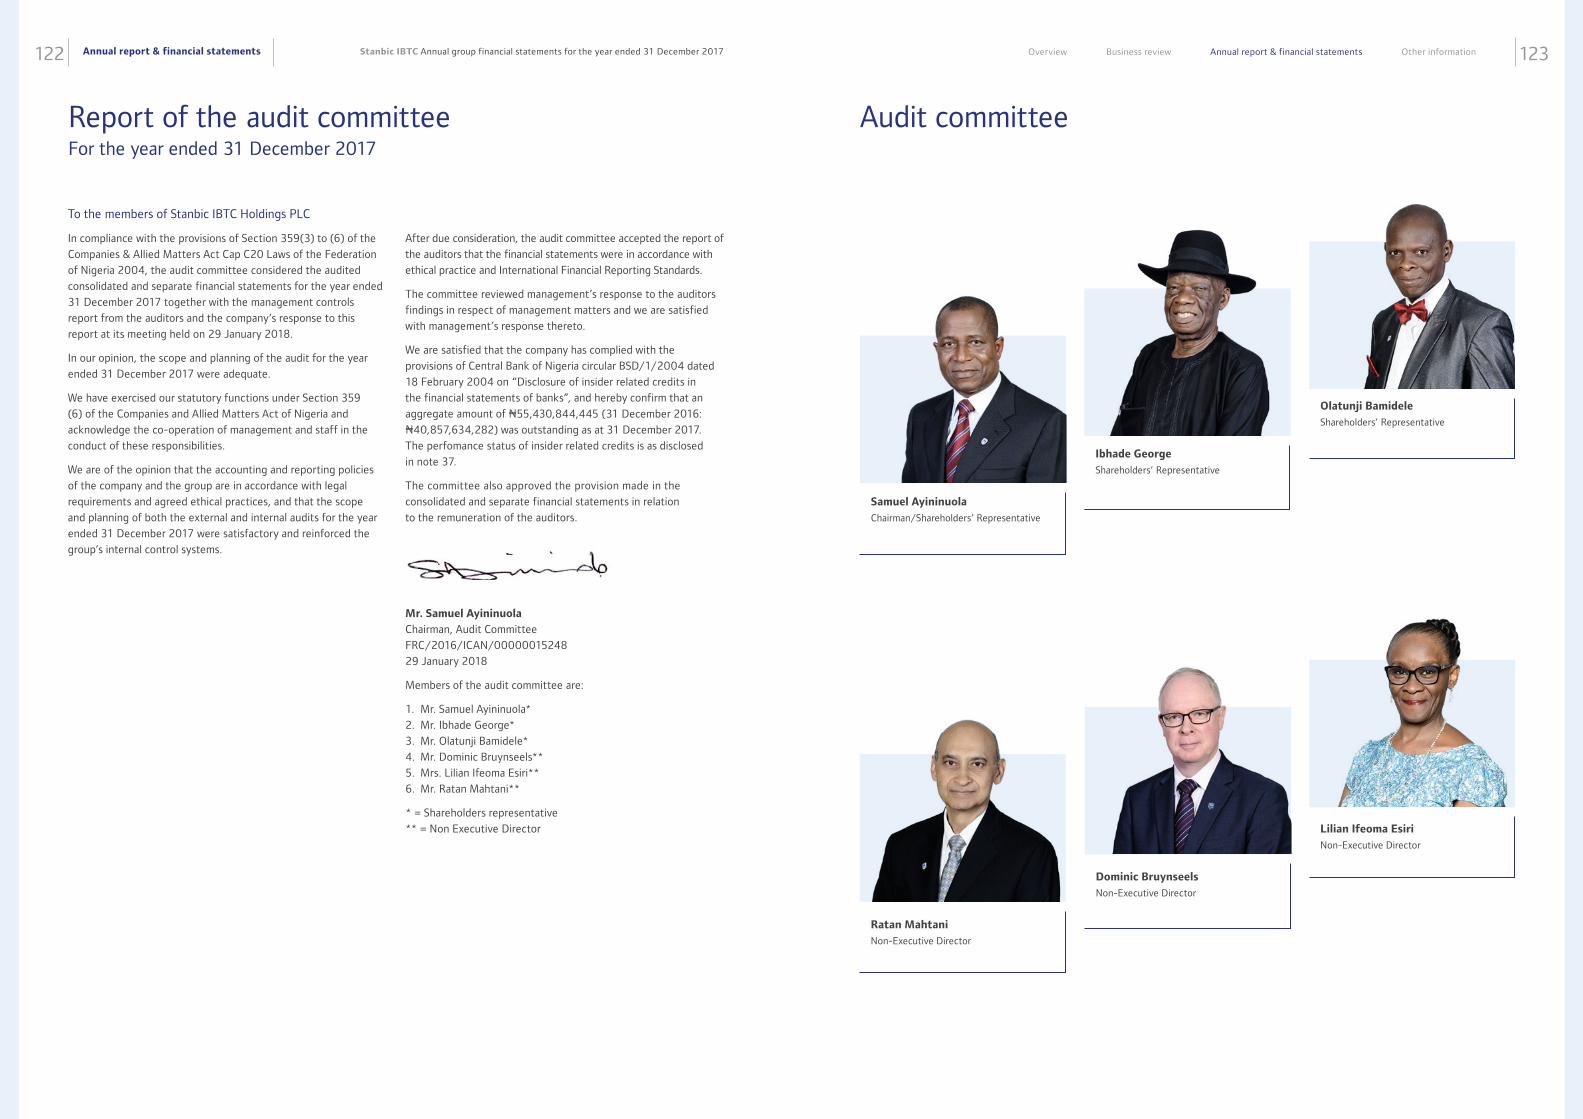
Annual report & financial statements122 123Stanbic IBTC Annual group financial statements for the year ended 31 December 2017 Overview Business review Annual report & financial statements Other information
Report of the audit committeeFor the year ended 31 December 2017
To the members of Stanbic IBTC Holdings PLC
In compliance with the provisions of Section 359(3) to (6) of the
Companies & Allied Matters Act Cap C20 Laws of the Federation
of Nigeria 2004, the audit committee considered the audited
consolidated and separate financial statements for the year ended
31 December 2017 together with the management controls
report from the auditors and the company’s response to this
report at its meeting held on 29 January 2018.
In our opinion, the scope and planning of the audit for the year
ended 31 December 2017 were adequate.
We have exercised our statutory functions under Section 359
(6) of the Companies and Allied Matters Act of Nigeria and
acknowledge the co-operation of management and staff in the
conduct of these responsibilities.
We are of the opinion that the accounting and reporting policies
of the company and the group are in accordance with legal
requirements and agreed ethical practices, and that the scope
and planning of both the external and internal audits for the year
ended 31 December 2017 were satisfactory and reinforced the
group’s internal control systems.
After due consideration, the audit committee accepted the report of
the auditors that the financial statements were in accordance with
ethical practice and International Financial Reporting Standards.
The committee reviewed management’s response to the auditors
findings in respect of management matters and we are satisfied
with management’s response thereto.
We are satisfied that the company has complied with the
provisions of Central Bank of Nigeria circular BSD/1/2004 dated
18 February 2004 on “Disclosure of insider related credits in
the financial statements of banks”, and hereby confirm that an
aggregate amount of N55,430,844,445 (31 December 2016:
N40,857,634,282) was outstanding as at 31 December 2017.
The perfomance status of insider related credits is as disclosed
in note 37.
The committee also approved the provision made in the
consolidated and separate financial statements in relation
to the remuneration of the auditors.
Mr. Samuel Ayininuola
Chairman, Audit Committee
FRC/2016/ICAN/00000015248
29 January 2018
Members of the audit committee are:
1. Mr. Samuel Ayininuola*
2. Mr. Ibhade George*
3. Mr. Olatunji Bamidele*
4. Mr. Dominic Bruynseels**
5. Mrs. Lilian Ifeoma Esiri**
6. Mr. Ratan Mahtani**
* = Shareholders representative
** = Non Executive Director
Audit committee
Samuel Ayininuola
Chairman/Shareholders’ Representative
Ratan Mahtani
Non-Executive Director
Ibhade George
Shareholders’ Representative
Dominic Bruynseels
Non-Executive Director
Olatunji Bamidele
Shareholders’ Representative
Lilian Ifeoma Esiri
Non-Executive Director
Annual report & financial statements124 125Stanbic IBTC Annual group financial statements for the year ended 31 December 2017 Overview Business review Annual report & financial statements Other information
To the Shareholders of Stanbic IBTC Holdings Plc
Report on the Audit of the Consolidated and Separate Financial Statements
Opinion
We have audited the consolidated and
separate financial statements of Stanbic
IBTC Holdings Plc (“the Company”) and its
subsidiaries (together, “the group”), which
comprise the consolidated and separate
statement of financial position as at 31
December, 2017, and the consolidated
and separate statement of profit or loss
and other comprehensive income, the
consolidated and separate statement of
changes in equity and the consolidated
and separate statement of cash flows for
the year then ended, and a summary of
significant accounting policies and other
explanatory information, as set out on
pages 128 to 247.
In our opinion, the accompanying
consolidated and separate financial
statements give a true and fair view of
the consolidated and separate financial
position of the Group and its subsidiaries
as at 31 December 2017, and of its
consolidated and separate financial
performance and its consolidated and
separate cash flows for the year then
ended in accordance with International
Financial Reporting Standards (“IFRSs”)
and in the manner required by the
Companies and Allied Matters Act, Cap
C.20, Laws of the Federation of Nigeria,
2004 and the Financial Reporting Council
of Nigeria Act, 2011 and the Banks and
other Financial Institutions Act, Cap B3,
Laws of the Federation of Nigeria, 2004
and relevant Central Bank of Nigeria
(“CBN”) Guidelines and Circulars.
Basis for Opinion
We conducted our audit in accordance
with International Standards on Auditing
(“ISAs”). Our responsibilities under those
standards are further described in the
Auditor’s Responsibilities for the Audit of
the Consolidated and Separate Financial
Independent auditors report
Statements section of our report. We are
independent of the Group and Company
in accordance with the International Ethics
Standards Board for Accountants’ Code
of Ethics for Professional Accountants
(“IESBA Code”) together with the ethical
requirements that are relevant to our audit
of the consolidated and separate financial
statements in Nigeria and we have
fulfilled our other ethical responsibilities
in accordance with these requirements
and the IESBA Code. We believe that
the audit evidence we have obtained
is sufficient and appropriate to provide
a basis for our opinion.
Key Audit Matters
Key audit matters are those matters
that, in our professional judgment, were
of most significance in our audit of the
consolidated and separate financial
statements of the current period. These
matters were addressed in the context of
our audit of the financial statements as a
whole, and in forming our opinion thereon,
and we do not provide a separate opinion
on these matters.
Credit impairment of loans
and advances to customers
The impairment of loans and advances
to customers is inherently a significant
and judgmental area for the Group.
Management makes complex and
subjective judgments over both the timing
of recognition and the estimation of the
size of impairment.
The credit impairment recognised for loans
and advances to customers represents
management’s best estimate of the
impairment within the loan portfolios at
the reporting date and is determined on an
individual basis for loans and advances to
customers that exceed specific thresholds,
and on a collective basis for a portfolio of
loans of a similar nature.
For individual specific credit impairments
on significant corporate and retail
loans and advances to customers, key
assumptions, judgments and estimates
made by the Directors include: the
adequacy and recoverability of collateral;
expected future cash flows and the timing
of the cash flows.
For collective credit impairment on retail
loans and advances, a statistical model is
applied, which approximates the losses
inherent in the credit portfolios. The key
assumptions, estimates and judgments
made by management include: the
probability of default; the loss given
default; and the emergence periods.
For collective impairments on corporate
loans a credit risk grade is allocated to the
exposures based on a pre-specified scale
that reflects the underlying credit risk for
a given exposure. These grades determine
the probability of defaults and explain
management’s perspective of the credit
risk of the obligors/exposures.
How the matter was addressed in our audit
Our audit procedures in this area included
the following:
• For the corporate loans and advances,
we tested controls over management
review of data inputted in the risk
grading system as well as timing of
reviews of risk grades allocated to
counterparties.
• We tested controls over the accuracy
of credit data such as management
review and approval of loan parameters
inputted into the software, used in the
loans and advances impairment process
both for retail and corporate loans and
advances.
• We performed substantive procedures
which included validating loans and
advances by sector, type and currency
in order to identify credit exposures
with a higher risk on a sample basis.
• We re-calculated management’s
discounted cash flow for specific
credit impairments on corporate
loans and advances and assessed
the reasonableness of the cash
flow forecasts and the valuation of
collaterals against customer information
in the credit files and the historical
experience on realisation.
• For corporate and retail portfolio
loans and advances we challenged
management’s assumptions used
in calculating the collective credit
impairment by recalculating and testing
key parameters such as probability of
default, emergence period and loss
given default.
The Group’s accounting policy on credit
impairment and related disclosures on
credit impairments and risks are shown in
notes 4.3, 6.1, 12.3 and 41 respectively.
Provisions for legal and tax matters
In the normal course of business, the
Group is exposed to the risk of litigation
and claims from third parties. Management
makes significant estimates in determining
the provisions to be recorded in the
financial statements with respect to claims
and judgments against the Group.
We focused on this area due to the range
of potential outcomes, number and
amount claimed against the Group as well
as the considerable uncertainties around
timing and probability of various litigations
and claims against the Group.
In addition, the Group was subjected
to significant tax assessments from
the relevant tax authorities during the
year. Tax laws are subject to varying
interpretations in determining the
amounts that should be recognised and
therefore provisions for tax are subject to
management’s estimation and judgment.
Management’s judgment includes
consideration and application of
regulations by various tax authorities
with respect to the relevant tax positions.
Where there is uncertainty, management
makes provisions for tax based on the
most probable outcome. We focused on
this area due to the significance of these
estimations, uncertainties and judgments
applied by management.
How the matter was addressed in our audit
Our procedures included the following:
With respect to provision for legal claims:
• We inspected a sample of significant
litigations and claims to substantiate the
information provided by management
on the nature of the claims.
• We challenged management’s
assessment of the possible outcome
for significant litigation and claims
and the related provisions by
inspecting correspondence with
the Group’s solicitors and obtaining
direct confirmations from the Group’s
solicitors to test for completeness and
the likelihood of the Group’s success in
defending the claims.
• We obtained from independent
solicitors other than those handling the
claims, their opinion on the likelihood of
the success in respect of claims where
the Group has appealed.
• We assessed whether the Group’s
disclosures relating to significant legal
proceedings adequately disclosed the
potential liabilities to the Group.
With respect to tax provisions:
• We inspected correspondences with
relevant tax authorities to understand
the nature and management’s
consideration of tax assessments.
• We engaged our Tax Specialists to
evaluate the assumptions applied by
the Group in the determination of tax
provisions, based on their knowledge
and experience of the Group’s
operations and of the application of
the relevant tax legislation by the
respective authorities.
• We evaluated the adequacy of the
Group’s disclosures regarding current
taxes and tax provisions.
The Group’s policy on current tax and legal
provisions as well as related disclosures
and notes to the financial statements on
provisions are contained in note 4.10, 6.9
and 25.
Recoverability of deferred tax assets
The Group had recognised deferred tax
assets of N8.9 billion (2016: N8.6 billion)
which arose from historic tax losses,
unutilised capital allowances and other
deductible temporary differences. An
assessment is required as to when and
whether sufficient future taxable profits
are likely to be generated to support the
recoverability of the deferred tax assets
recognised.
We focused on this area due to the
significant judgments involved in the
estimation of future taxable profits.
How the matter was addressed in our audit
Our procedures included the following:
• We tested the recoverability
assessment including calculations to
check that the recorded amount of the
deferred asset is adequate based on the
temporary differences identified, the
timing of the estimated future taxable
profits and the tax rate applied.
• We challenged management
assessment of the recoverable amounts,
including the estimated future taxable
profits and the underlying assumptions
including forecasts and projections by
using our knowledge of the business,
industry and past performance.
• We checked whether historic tax losses,
unutilised capital allowance and other
deductible temporary differences were
determined in accordance with the
relevant tax laws.
The Group’s accounting policy on deferred
tax and related disclosures are shown in
notes 4.11, 6.6 and note 16 respectively.
Valuation of derivatives
The Group’s derivative instruments
comprise foreign currency swaps and
foreign exchange forward contracts, which
are used to manage foreign exchange risk.
Management uses a complex valuation
methodology involving multiple inputs
including discount rates, exchange
rates, earning yields and adjustments to
estimate the fair value of these derivative
instruments.
We focused on this area due to the
significance of these derivatives and
the related estimation uncertainty.
Annual report & financial statements126 127Stanbic IBTC Annual group financial statements for the year ended 31 December 2017 Overview Business review Annual report & financial statements Other information
Independent auditors report (continued)
How the matter was addressed in our audit
Our procedures included the following:
• We evaluated the design,
implementation and operating
effectiveness of key controls over the
inputs used in determining the Group’s
valuation of derivative instruments.
• We inspected derivative contracts on a
sample basis to obtain an understanding
of the respective transactions.
• We engaged our Valuation Specialists
to evaluate the appropriateness of the
methodology and assumptions used
by management including correlation
factors, volatilities in determining fair
value and accounting for the derivative
positions to assess whether the
valuation model used by the Group was
in line with acceptable market practice.
• We carried out substantive test to
ascertain the accuracy of the fair value
of derivative assets and liabilities by
obtaining quoted rates and compared
these rates to the mark-to-market rates
used by management.
• We recomputed the fair value of the
instruments using validated inputs.
The Group’s accounting policy on
derivative instruments and relevant
financial risk disclosures are shown in
notes) 4.3, 4.5, 6.2, 10, 28, and note
41 respectively.
Information Other than the Financial
Statements and Audit Report thereon
The Directors are responsible for the
other information which comprises the
Chairman’s statement, Chief Executive’s
statement, Economic review, Financial
review, Directors’ report, Statement of
Directors’ responsibilities, Corporate
governance, Report of the Audit
Committee, Other national disclosures,
the Overview, Business Review and the
overviews of Management team, Branch
network, Abridged sustainability report
and contact information but does not
include the consolidated and separate
financial statements and our audit report
thereon. We obtained prior to the date of
this auditor’s report the Directors’ report,
Statement of Directors’ responsibilities,
corporate governance report, Report of
the Audit Committee and Other national
disclosures. The Chairman’s statement,
Chief Executive’s statement, Economic
review, Financial review, the Overview,
Business review and the reviews of the
management team, Branch network,
Abridged sustainability report and
contact information is expected to
be made available to us after that date.
Our opinion on the consolidated and
separate financial statements does not
cover the other information and we do
not express any form of assurance
conclusion thereon.
In connection with our audit of the
consolidated and separate financial
statements, our responsibility is to read
the other information and in doing so,
consider whether the other information
is materially inconsistent with the
consolidated and separate financial
statements or our knowledge obtained
in the audit or otherwise appears to be
materially misstated. If, based on the
work we have performed, we conclude
that there is a material misstatement of
this other information, we are required to
report that fact. We have nothing to report
in this regard.
When we read the reports, which have not
been made available to us at the date of
this report, if we conclude that there is
a material misstatements therein, we are
required to communicate the matter to
those charged with governance
Responsibilities of the Directors for
the Consolidated and Separate
Financial Statements
The Directors are responsible for the
preparation of consolidated and separate
financial statements that give a true and
fair view in accordance with IFRSs and in
the manner required by the Companies
and Allied Matters Act, Cap C.20, Laws of
the Federation of Nigeria, 2004 and the
Financial Reporting Council of Nigeria Act,
2011 and the Banks and other Financial
Institutions Act, Cap B3, Laws of the
Federation of Nigeria, 2004 and relevant
Central Bank of Nigeria (“CBN”) Guidelines
and Circulars and for such internal control
as the directors determine is necessary
to enable the preparation of financial
statements that are free from material
misstatement, whether due to fraud
or error.
In preparing the consolidated and separate
financial statements, the directors are
responsible for assessing the Group (and
Company’s) ability to continue as a going
concern, disclosing, as applicable, matters
related to going concern and using the
going concern basis of accounting unless
the directors either intend to liquidate
the Group (and Company) or to cease
operations, or have no realistic alternative
but to do so.
Auditor’s Responsibilities for the Audit
of the Consolidated and separate
Financial Statements
Our objectives are to obtain reasonable
assurance about whether the consolidated
and separate financial statements as a
whole are free from material misstatement,
whether due to fraud or error, and to
issue an auditor’s report that includes
our opinion. Reasonable assurance is
a high level of assurance, but is not a
guarantee that an audit conducted in
accordance with ISAs will always detect
a material misstatement when it exists.
Misstatements can arise from fraud or
error and are considered material if,
individually or in the aggregate, they could
reasonably be expected to influence the
economic decisions of users taken on the
basis of these financial statements.
As part of an audit in accordance with
ISAs, we exercise professional judgment
and maintain professional skepticism
throughout the audit. We also:
• Identify and assess the risks of material
misstatement of the consolidated
and separate financial statements,
whether due to fraud or error,
design and perform audit procedures
responsive to those risks, and obtain
audit evidence that is sufficient and
appropriate to provide a basis for our
opinion. The risk of not detecting a
material misstatement resulting from
fraud is higher than for one resulting
from error, as fraud may involve
collusion, forgery, intentional omissions,
misrepresentations, or the override of
internal control.
• Obtain an understanding of internal
control relevant to the audit in order
to design audit procedures that are
appropriate in the circumstances, but
not for the purpose of expressing an
opinion on the effectiveness of the
Group (and Company’s) internal control.
• Evaluate the appropriateness of
accounting policies used and the
reasonableness of accounting estimates
and related disclosures made by the
directors.
• Conclude on the appropriateness of
directors’ use of the going concern
basis of accounting and, based on the
audit evidence obtained, whether a
material uncertainty exists related
to events or conditions that may
cast significant doubt on the Group
(and Company’s) ability to continue
as a going concern. If we conclude
that a material uncertainty exists,
we are required to draw attention in
our auditor’s report to the related
disclosures in the consolidated and
separate financial statements or, if
such disclosures are inadequate, to
modify our opinion. Our conclusions are
based on the audit evidence obtained
up to the date of our auditor’s report.
However, future events or conditions
may cause the Group (and Company) to
cease to continue as a going concern.
• Evaluate the overall presentation,
structure and content of the
consolidated and separate financial
statements, including the disclosures,
and whether the consolidated and
separate financial statements represent
the underlying transactions and events
in a manner that achieves
fair presentation.
• Obtain sufficient appropriate audit
evidence regarding the financial
information of the entities or business
activities within the Group to express
an opinion on the consolidated financial
statements. We are responsible for the
direction, supervision and performance
of the group audit. We remain solely
responsible for our audit opinion.
We communicate with the Board of
Directors and the Audit Committee
regarding, among other matters, the
planned scope and timing of the audit and
significant audit findings, including any
significant deficiencies in internal control
that we identify during our audit.
We also provide the Board of Directors and
the Audit Committee with a statement that
we have complied with relevant ethical
requirements regarding independence, and
to communicate with them all relationships
and other matters that may reasonably be
thought to bear on our independence, and
where applicable, related safeguards.
From the matters communicated with
the Board of Directors and the Audit
Committee, we determine those matters
that were of most significance in the audit
of the consolidated and separate financial
statements of the current period and
are therefore the key audit matters. We
describe these matters in our auditor’s
report unless law or regulation precludes
public disclosure about the matter or
when, in extremely rare circumstances,
we determine that a matter should not
be communicated in our report because
the adverse consequences of doing so
would reasonably be expected to outweigh
the public interest benefits of such
communication.
Report on Other Legal and
Regulatory Requirements
Compliance with the requirements of
Schedule 6 of the Companies and Allied
Matters Act, Cap C.20, Laws of the
Federation of Nigeria, 2004.
In our opinion, proper books of account
have been kept by the Group, so far as
appears from our examination of those
books and the Bank’s statement of financial
position and statement of profit or loss
and other comprehensive income are
in agreement with the books of account.
Compliance with Section 27 (2) of the
Banks and the other Financial Institutions
Act Cap B3, Laws of the Federation of
Nigeria, 2004 and Central Bank of Nigeria
circular BSD/1/2004.
i. The Group paid penalties in respect
of contravention of the Central Bank
of Nigeria guidelines during the year
ended 31 December 2017. Details
of penalties paid are disclosed in note
40 to the financial statements.
ii. Related party transactions and
balances are disclosed in note 36 to
the financial statements in compliance
with the Central Bank of Nigeria
circular BSD/1/2004.
Kabir O. Okunlola
FRC/2012/ ICAN/00000000428
For: KPMG Professional Services
Chartered Accountants
12 February 2018.
Lagos, Nigeria
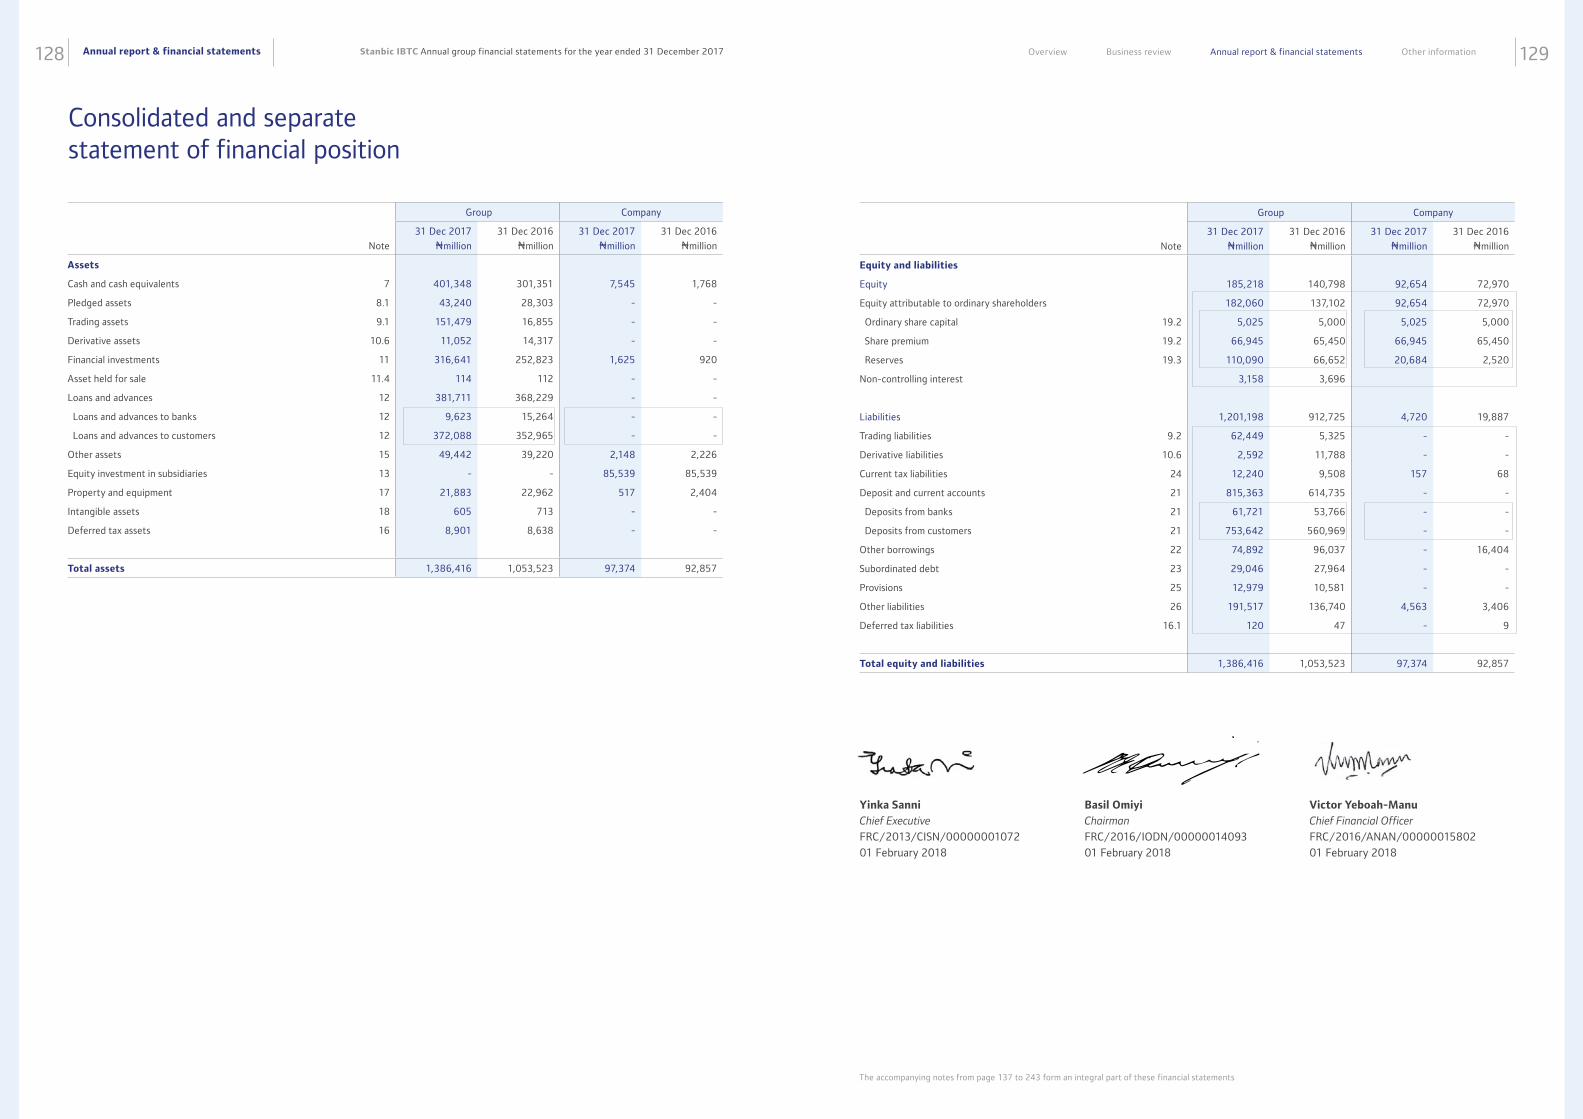
Annual report & financial statements128 129Stanbic IBTC Annual group financial statements for the year ended 31 December 2017 Overview Business review Annual report & financial statements Other information
Consolidated and separate statement of financial position
Group Company
Note
31 Dec 2017
Nmillion
31 Dec 2016
Nmillion
31 Dec 2017
Nmillion
31 Dec 2016
Nmillion
Assets
Cash and cash equivalents 7 401,348 301,351 7,545 1,768
Pledged assets 8.1 43,240 28,303 - -
Trading assets 9.1 151,479 16,855 - -
Derivative assets 10.6 11,052 14,317 - -
Financial investments 11 316,641 252,823 1,625 920
Asset held for sale 11.4 114 112 - -
Loans and advances 12 381,711 368,229 - -
Loans and advances to banks 12 9,623 15,264 - -
Loans and advances to customers 12 372,088 352,965 - -
Other assets 15 49,442 39,220 2,148 2,226
Equity investment in subsidiaries 13 - - 85,539 85,539
Property and equipment 17 21,883 22,962 517 2,404
Intangible assets 18 605 713 - -
Deferred tax assets 16 8,901 8,638 - -
Total assets 1,386,416 1,053,523 97,374 92,857
Group Company
Note
31 Dec 2017
Nmillion
31 Dec 2016
Nmillion
31 Dec 2017
Nmillion
31 Dec 2016
Nmillion
Equity and liabilities
Equity 185,218 140,798 92,654 72,970
Equity attributable to ordinary shareholders 182,060 137,102 92,654 72,970
Ordinary share capital 19.2 5,025 5,000 5,025 5,000
Share premium 19.2 66,945 65,450 66,945 65,450
Reserves 19.3 110,090 66,652 20,684 2,520
Non-controlling interest 3,158 3,696
Liabilities 1,201,198 912,725 4,720 19,887
Trading liabilities 9.2 62,449 5,325 - -
Derivative liabilities 10.6 2,592 11,788 - -
Current tax liabilities 24 12,240 9,508 157 68
Deposit and current accounts 21 815,363 614,735 - -
Deposits from banks 21 61,721 53,766 - -
Deposits from customers 21 753,642 560,969 - -
Other borrowings 22 74,892 96,037 - 16,404
Subordinated debt 23 29,046 27,964 - -
Provisions 25 12,979 10,581 - -
Other liabilities 26 191,517 136,740 4,563 3,406
Deferred tax liabilities 16.1 120 47 - 9
Total equity and liabilities 1,386,416 1,053,523 97,374 92,857
Basil Omiyi
Chairman
FRC/2016/IODN/00000014093
01 February 2018
Victor Yeboah-Manu
Chief Financial Officer
FRC/2016/ANAN/00000015802
01 February 2018
Yinka Sanni
Chief Executive
FRC/2013/CISN/00000001072
01 February 2018
The accompanying notes from page 137 to 243 form an integral part of these financial statements
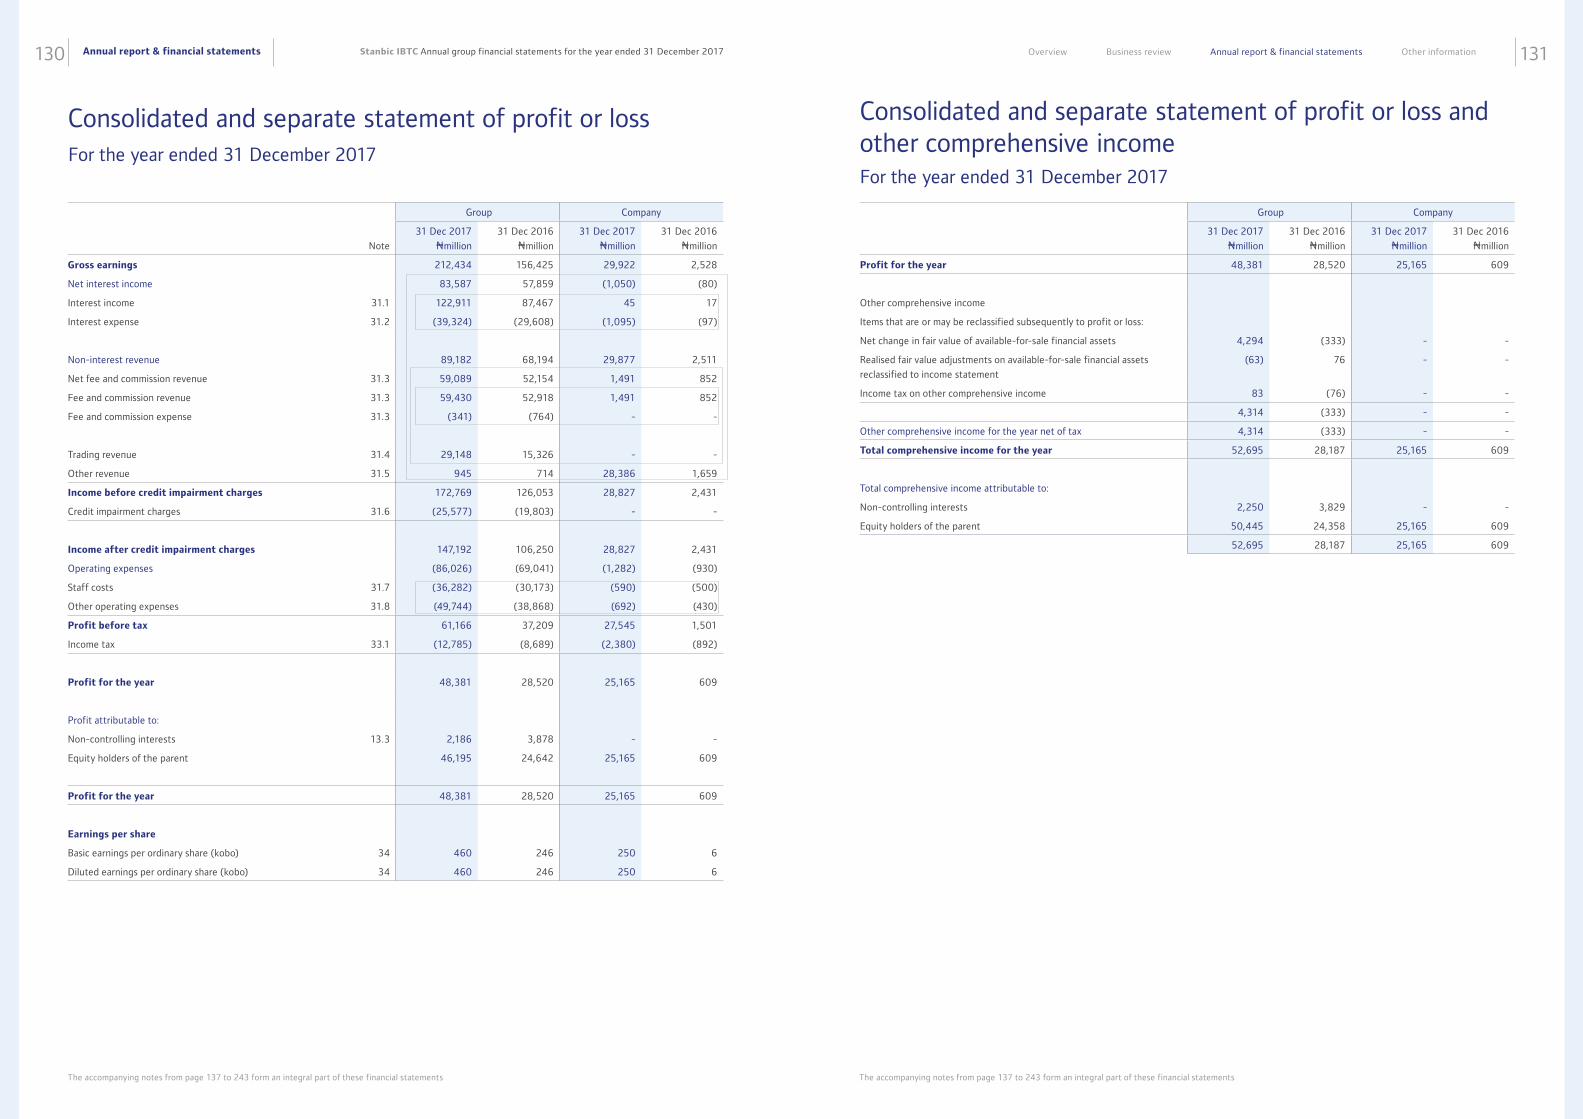
Annual report & financial statements130 131Stanbic IBTC Annual group financial statements for the year ended 31 December 2017 Overview Business review Annual report & financial statements Other information
Consolidated and separate statement of profit or loss
Group Company
Note
31 Dec 2017
Nmillion
31 Dec 2016
Nmillion
31 Dec 2017
Nmillion
31 Dec 2016
Nmillion
Gross earnings 212,434 156,425 29,922 2,528
Net interest income 83,587 57,859 (1,050) (80)
Interest income 31.1 122,911 87,467 45 17
Interest expense 31.2 (39,324) (29,608) (1,095) (97)
Non-interest revenue 89,182 68,194 29,877 2,511
Net fee and commission revenue 31.3 59,089 52,154 1,491 852
Fee and commission revenue 31.3 59,430 52,918 1,491 852
Fee and commission expense 31.3 (341) (764) - -
Trading revenue 31.4 29,148 15,326 - -
Other revenue 31.5 945 714 28,386 1,659
Income before credit impairment charges 172,769 126,053 28,827 2,431
Credit impairment charges 31.6 (25,577) (19,803) - -
Income after credit impairment charges 147,192 106,250 28,827 2,431
Operating expenses (86,026) (69,041) (1,282) (930)
Staff costs 31.7 (36,282) (30,173) (590) (500)
Other operating expenses 31.8 (49,744) (38,868) (692) (430)
Profit before tax 61,166 37,209 27,545 1,501
Income tax 33.1 (12,785) (8,689) (2,380) (892)
Profit for the year 48,381 28,520 25,165 609
Profit attributable to:
Non-controlling interests 13.3 2,186 3,878 - -
Equity holders of the parent 46,195 24,642 25,165 609
Profit for the year 48,381 28,520 25,165 609
Earnings per share
Basic earnings per ordinary share (kobo) 34 460 246 250 6
Diluted earnings per ordinary share (kobo) 34 460 246 250 6
For the year ended 31 December 2017
Consolidated and separate statement of profit or loss and other comprehensive income
Group Company
31 Dec 2017
Nmillion
31 Dec 2016
Nmillion
31 Dec 2017
Nmillion
31 Dec 2016
Nmillion
Profit for the year 48,381 28,520 25,165 609
Other comprehensive income
Items that are or may be reclassified subsequently to profit or loss:
Net change in fair value of available-for-sale financial assets 4,294 (333) - -
Realised fair value adjustments on available-for-sale financial assets
reclassified to income statement
(63) 76 - -
Income tax on other comprehensive income 83 (76) - -
4,314 (333) - -
Other comprehensive income for the year net of tax 4,314 (333) - -
Total comprehensive income for the year 52,695 28,187 25,165 609
Total comprehensive income attributable to:
Non-controlling interests 2,250 3,829 - -
Equity holders of the parent 50,445 24,358 25,165 609
52,695 28,187 25,165 609
For the year ended 31 December 2017
The accompanying notes from page 137 to 243 form an integral part of these financial statementsThe accompanying notes from page 137 to 243 form an integral part of these financial statements
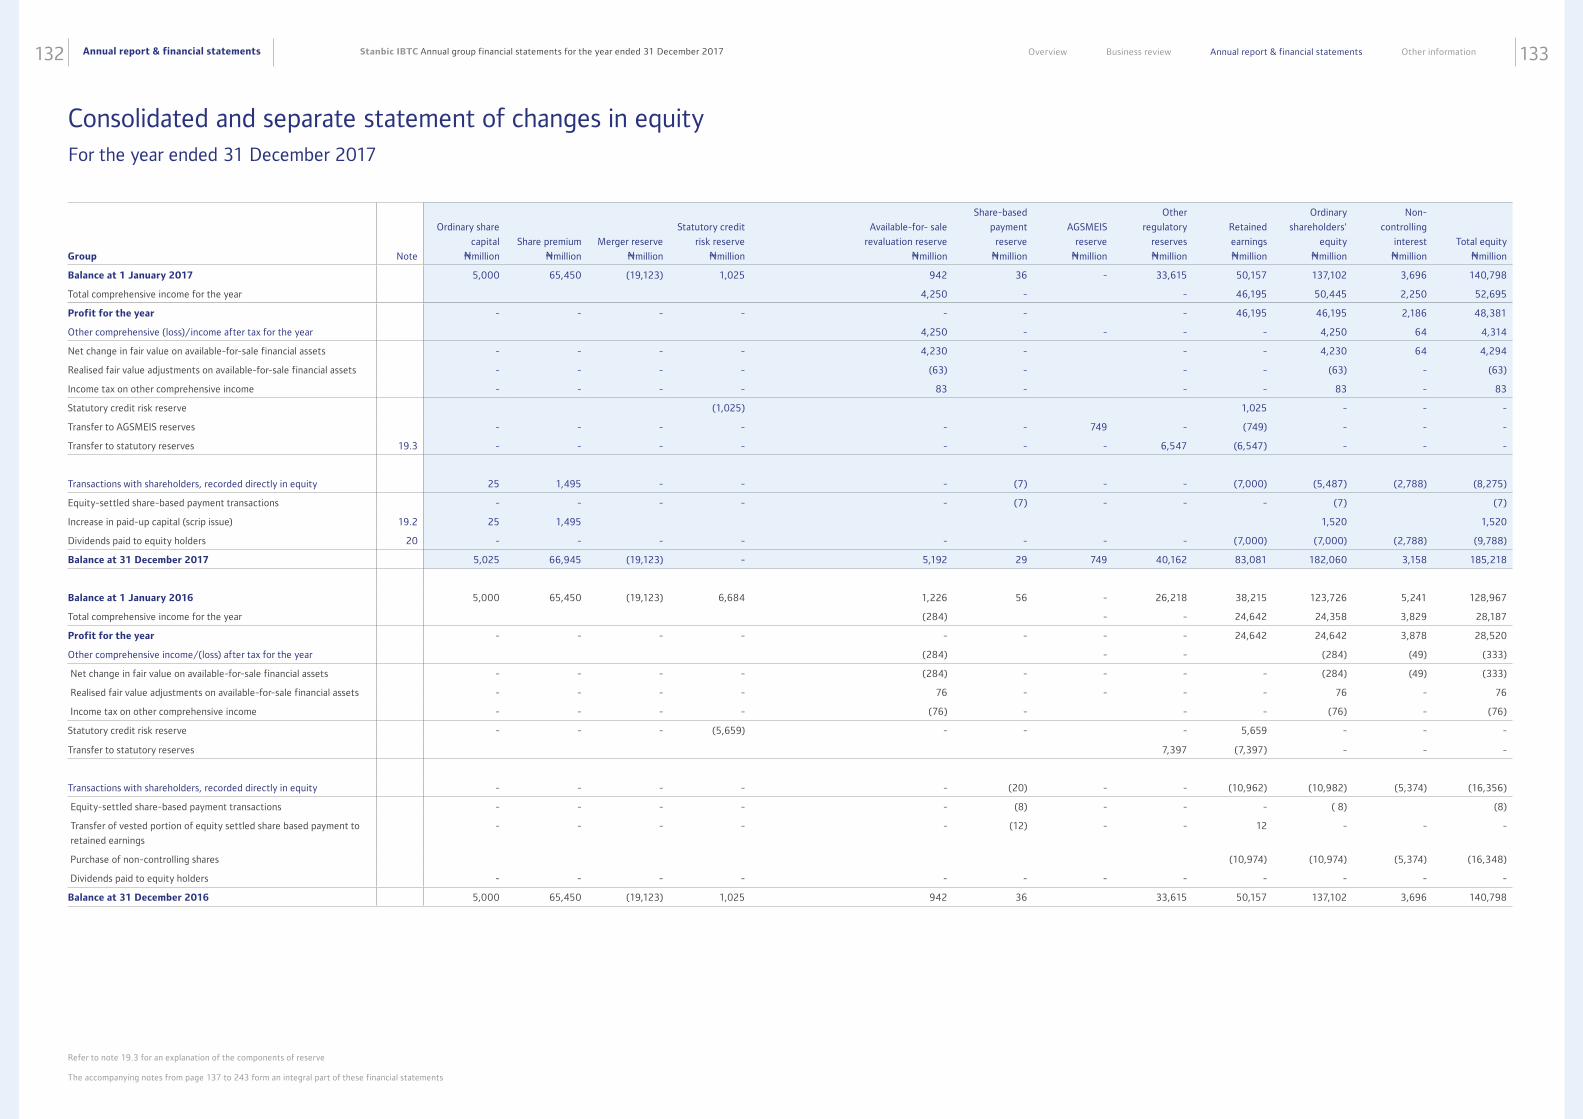
Annual report & financial statements132 133Stanbic IBTC Annual group financial statements for the year ended 31 December 2017 Overview Business review Annual report & financial statements Other information
Refer to note 19.3 for an explanation of the components of reserve
The accompanying notes from page 137 to 243 form an integral part of these financial statements
Consolidated and separate statement of changes in equity
Group
Note
Ordinary share
capital
Nmillion
Share premium
Nmillion
Merger reserve
Nmillion
Statutory credit
risk reserve
Nmillion
Available-for- sale
revaluation reserve
Nmillion
Share-based
payment
reserve
Nmillion
AGSMEIS
reserve
Nmillion
Other
regulatory
reserves
Nmillion
Retained
earnings
Nmillion
Ordinary
shareholders'
equity
Nmillion
Non-
controlling
interest
Nmillion
Total equity
Nmillion
Balance at 1 January 2017 5,000 65,450 (19,123) 1,025 942 36 - 33,615 50,157 137,102 3,696 140,798
Total comprehensive income for the year 4,250 - - 46,195 50,445 2,250 52,695
Profit for the year - - - - - - - 46,195 46,195 2,186 48,381
Other comprehensive (loss)/income after tax for the year 4,250 - - - - 4,250 64 4,314
Net change in fair value on available-for-sale financial assets - - - - 4,230 - - - 4,230 64 4,294
Realised fair value adjustments on available-for-sale financial assets - - - - (63) - - - (63) - (63)
Income tax on other comprehensive income - - - - 83 - - - 83 - 83
Statutory credit risk reserve (1,025) 1,025 - - -
Transfer to AGSMEIS reserves - - - - - - 749 - (749) - - -
Transfer to statutory reserves 19.3 - - - - - - - 6,547 (6,547) - - -
Transactions with shareholders, recorded directly in equity 25 1,495 - - - (7) - - (7,000) (5,487) (2,788) (8,275)
Equity-settled share-based payment transactions - - - - - (7) - - - (7) (7)
Increase in paid-up capital (scrip issue) 19.2 25 1,495 1,520 1,520
Dividends paid to equity holders 20 - - - - - - - - (7,000) (7,000) (2,788) (9,788)
Balance at 31 December 2017 5,025 66,945 (19,123) - 5,192 29 749 40,162 83,081 182,060 3,158 185,218
Balance at 1 January 2016 5,000 65,450 (19,123) 6,684 1,226 56 - 26,218 38,215 123,726 5,241 128,967
Total comprehensive income for the year (284) - - 24,642 24,358 3,829 28,187
Profit for the year - - - - - - - - 24,642 24,642 3,878 28,520
Other comprehensive income/(loss) after tax for the year (284) - - (284) (49) (333)
Net change in fair value on available-for-sale financial assets - - - - (284) - - - - (284) (49) (333)
Realised fair value adjustments on available-for-sale financial assets - - - - 76 - - - - 76 - 76
Income tax on other comprehensive income - - - - (76) - - - (76) - (76)
Statutory credit risk reserve - - - (5,659) - - - 5,659 - - -
Transfer to statutory reserves 7,397 (7,397) - - -
Transactions with shareholders, recorded directly in equity - - - - - (20) - - (10,962) (10,982) (5,374) (16,356)
Equity-settled share-based payment transactions - - - - - (8) - - - ( 8) (8)
Transfer of vested portion of equity settled share based payment to
retained earnings
- - - - - (12) - - 12 - - -
Purchase of non-controlling shares (10,974) (10,974) (5,374) (16,348)
Dividends paid to equity holders - - - - - - - - - - - -
Balance at 31 December 2016 5,000 65,450 (19,123) 1,025 942 36 33,615 50,157 137,102 3,696 140,798
For the year ended 31 December 2017
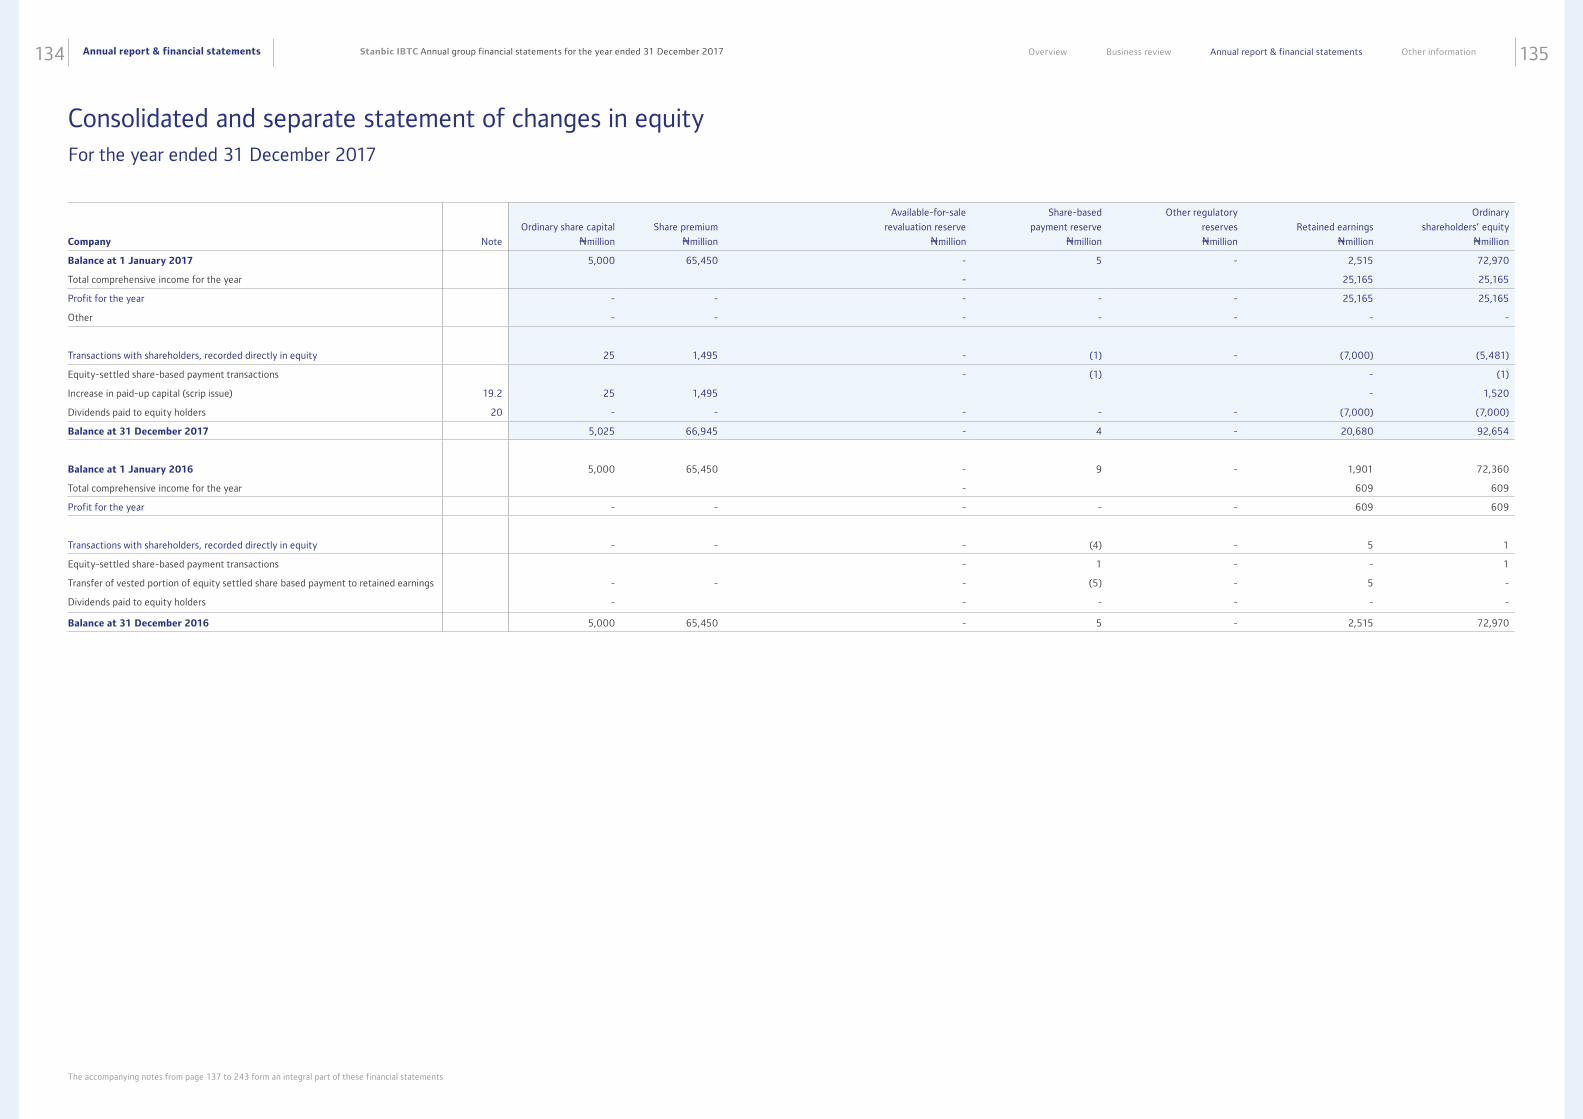
Annual report & financial statements134 135Stanbic IBTC Annual group financial statements for the year ended 31 December 2017 Overview Business review Annual report & financial statements Other information
Company
Note
Ordinary share capital
Nmillion
Share premium
Nmillion
Available-for-sale
revaluation reserve
Nmillion
Share-based
payment reserve
Nmillion
Other regulatory
reserves
Nmillion
Retained earnings
Nmillion
Ordinary
shareholders’ equity
Nmillion
Balance at 1 January 2017 5,000 65,450 - 5 - 2,515 72,970
Total comprehensive income for the year - 25,165 25,165
Profit for the year - - - - - 25,165 25,165
Other - - - - - - -
Transactions with shareholders, recorded directly in equity 25 1,495 - (1) - (7,000) (5,481)
Equity-settled share-based payment transactions - (1) - (1)
Increase in paid-up capital (scrip issue) 19.2 25 1,495 - 1,520
Dividends paid to equity holders 20 - - - - - (7,000) (7,000)
Balance at 31 December 2017 5,025 66,945 - 4 - 20,680 92,654
Balance at 1 January 2016 5,000 65,450 - 9 - 1,901 72,360
Total comprehensive income for the year - 609 609
Profit for the year - - - - - 609 609
Transactions with shareholders, recorded directly in equity - - - (4) - 5 1
Equity-settled share-based payment transactions - 1 - - 1
Transfer of vested portion of equity settled share based payment to retained earnings - - - (5) - 5 -
Dividends paid to equity holders - - - - - -
Balance at 31 December 2016 5,000 65,450 - 5 - 2,515 72,970
The accompanying notes from page 137 to 243 form an integral part of these financial statements
Consolidated and separate statement of changes in equityFor the year ended 31 December 2017
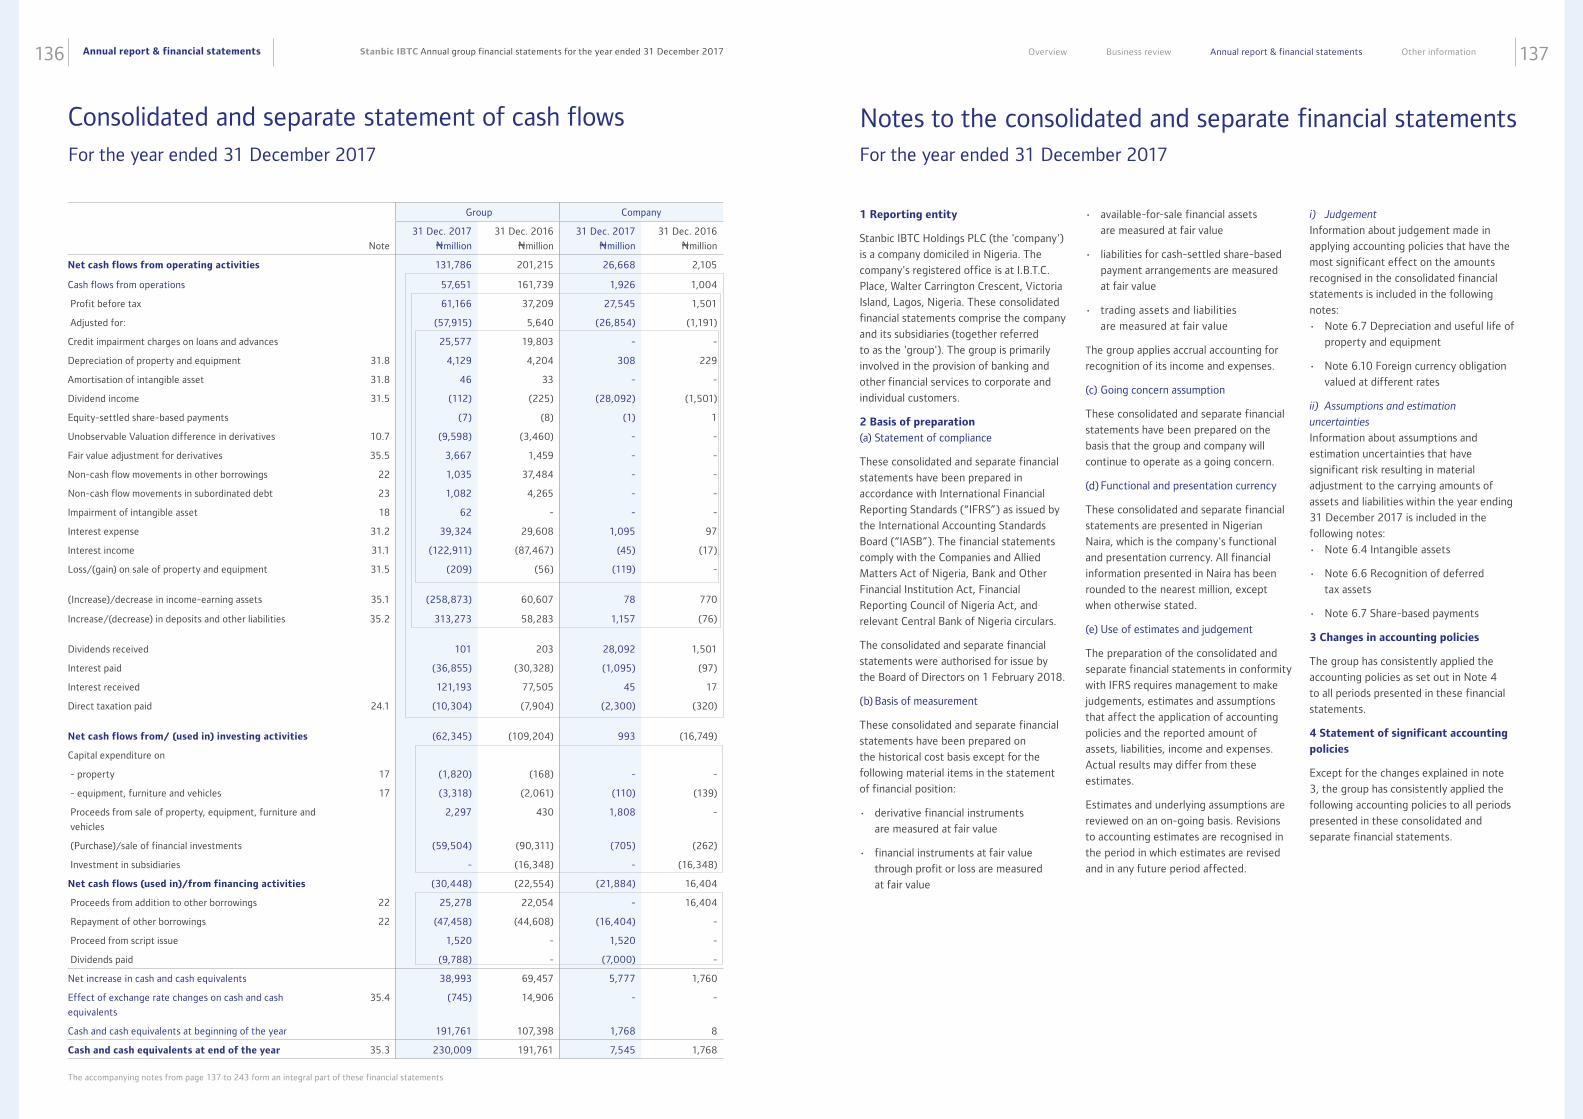
Annual report & financial statements136 137Stanbic IBTC Annual group financial statements for the year ended 31 December 2017 Overview Business review Annual report & financial statements Other information
Consolidated and separate statement of cash flows
Group Company
Note
31 Dec. 2017
Nmillion
31 Dec. 2016
Nmillion
31 Dec. 2017
Nmillion
31 Dec. 2016
Nmillion
Net cash flows from operating activities 131,786 201,215 26,668 2,105
Cash flows from operations 57,651 161,739 1,926 1,004
Profit before tax 61,166 37,209 27,545 1,501
Adjusted for: (57,915) 5,640 (26,854) (1,191)
Credit impairment charges on loans and advances 25,577 19,803 - -
Depreciation of property and equipment 31.8 4,129 4,204 308 229
Amortisation of intangible asset 31.8 46 33 - -
Dividend income 31.5 (112) (225) (28,092) (1,501)
Equity-settled share-based payments (7) (8) (1) 1
Unobservable Valuation difference in derivatives 10.7 (9,598) (3,460) - -
Fair value adjustment for derivatives 35.5 3,667 1,459 - -
Non-cash flow movements in other borrowings 22 1,035 37,484 - -
Non-cash flow movements in subordinated debt 23 1,082 4,265 - -
Impairment of intangible asset 18 62 - - -
Interest expense 31.2 39,324 29,608 1,095 97
Interest income 31.1 (122,911) (87,467) (45) (17)
Loss/(gain) on sale of property and equipment 31.5 (209) (56) (119) -
(Increase)/decrease in income-earning assets 35.1 (258,873) 60,607 78 770
Increase/(decrease) in deposits and other liabilities 35.2 313,273 58,283 1,157 (76)
Dividends received 101 203 28,092 1,501
Interest paid (36,855) (30,328) (1,095) (97)
Interest received 121,193 77,505 45 17
Direct taxation paid 24.1 (10,304) (7,904) (2,300) (320)
Net cash flows from/ (used in) investing activities (62,345) (109,204) 993 (16,749)
Capital expenditure on
- property 17 (1,820) (168) - -
- equipment, furniture and vehicles 17 (3,318) (2,061) (110) (139)
Proceeds from sale of property, equipment, furniture and
vehicles
2,297 430 1,808 -
(Purchase)/sale of financial investments (59,504) (90,311) (705) (262)
Investment in subsidiaries - (16,348) - (16,348)
Net cash flows (used in)/from financing activities (30,448) (22,554) (21,884) 16,404
Proceeds from addition to other borrowings 22 25,278 22,054 - 16,404
Repayment of other borrowings 22 (47,458) (44,608) (16,404) -
Proceed from script issue 1,520 - 1,520 -
Dividends paid (9,788) - (7,000) -
Net increase in cash and cash equivalents 38,993 69,457 5,777 1,760
Effect of exchange rate changes on cash and cash
equivalents
35.4 (745) 14,906 - -
Cash and cash equivalents at beginning of the year 191,761 107,398 1,768 8
Cash and cash equivalents at end of the year 35.3 230,009 191,761 7,545 1,768
The accompanying notes from page 137 to 243 form an integral part of these financial statements
For the year ended 31 December 2017
Notes to the consolidated and separate financial statements
1 Reporting entity
Stanbic IBTC Holdings PLC (the 'company')
is a company domiciled in Nigeria. The
company's registered office is at I.B.T.C.
Place, Walter Carrington Crescent, Victoria
Island, Lagos, Nigeria. These consolidated
financial statements comprise the company
and its subsidiaries (together referred
to as the 'group'). The group is primarily
involved in the provision of banking and
other financial services to corporate and
individual customers.
2 Basis of preparation
(a) Statement of compliance
These consolidated and separate financial
statements have been prepared in
accordance with International Financial
Reporting Standards (“IFRS”) as issued by
the International Accounting Standards
Board (“IASB”). The financial statements
comply with the Companies and Allied
Matters Act of Nigeria, Bank and Other
Financial Institution Act, Financial
Reporting Council of Nigeria Act, and
relevant Central Bank of Nigeria circulars.
The consolidated and separate financial
statements were authorised for issue by
the Board of Directors on 1 February 2018.
(b) Basis of measurement
These consolidated and separate financial
statements have been prepared on
the historical cost basis except for the
following material items in the statement
of financial position:
• derivative financial instruments
are measured at fair value
• financial instruments at fair value
through profit or loss are measured
at fair value
• available-for-sale financial assets
are measured at fair value
• liabilities for cash-settled share-based
payment arrangements are measured
at fair value
• trading assets and liabilities
are measured at fair value
The group applies accrual accounting for
recognition of its income and expenses.
(c) Going concern assumption
These consolidated and separate financial
statements have been prepared on the
basis that the group and company will
continue to operate as a going concern.
(d) Functional and presentation currency
These consolidated and separate financial
statements are presented in Nigerian
Naira, which is the company's functional
and presentation currency. All financial
information presented in Naira has been
rounded to the nearest million, except
when otherwise stated.
(e) Use of estimates and judgement
The preparation of the consolidated and
separate financial statements in conformity
with IFRS requires management to make
judgements, estimates and assumptions
that affect the application of accounting
policies and the reported amount of
assets, liabilities, income and expenses.
Actual results may differ from these
estimates.
Estimates and underlying assumptions are
reviewed on an on-going basis. Revisions
to accounting estimates are recognised in
the period in which estimates are revised
and in any future period affected.
i) Judgement
Information about judgement made in
applying accounting policies that have the
most significant effect on the amounts
recognised in the consolidated financial
statements is included in the following
notes:
• Note 6.7 Depreciation and useful life of
property and equipment
• Note 6.10 Foreign currency obligation
valued at different rates
ii) Assumptions and estimation
uncertainties
Information about assumptions and
estimation uncertainties that have
significant risk resulting in material
adjustment to the carrying amounts of
assets and liabilities within the year ending
31 December 2017 is included in the
following notes:
• Note 6.4 Intangible assets
• Note 6.6 Recognition of deferred
tax assets
• Note 6.7 Share-based payments
3 Changes in accounting policies
The group has consistently applied the
accounting policies as set out in Note 4
to all periods presented in these financial
statements.
4 Statement of significant accounting
policies
Except for the changes explained in note
3, the group has consistently applied the
following accounting policies to all periods
presented in these consolidated and
separate financial statements.
For the year ended 31 December 2017
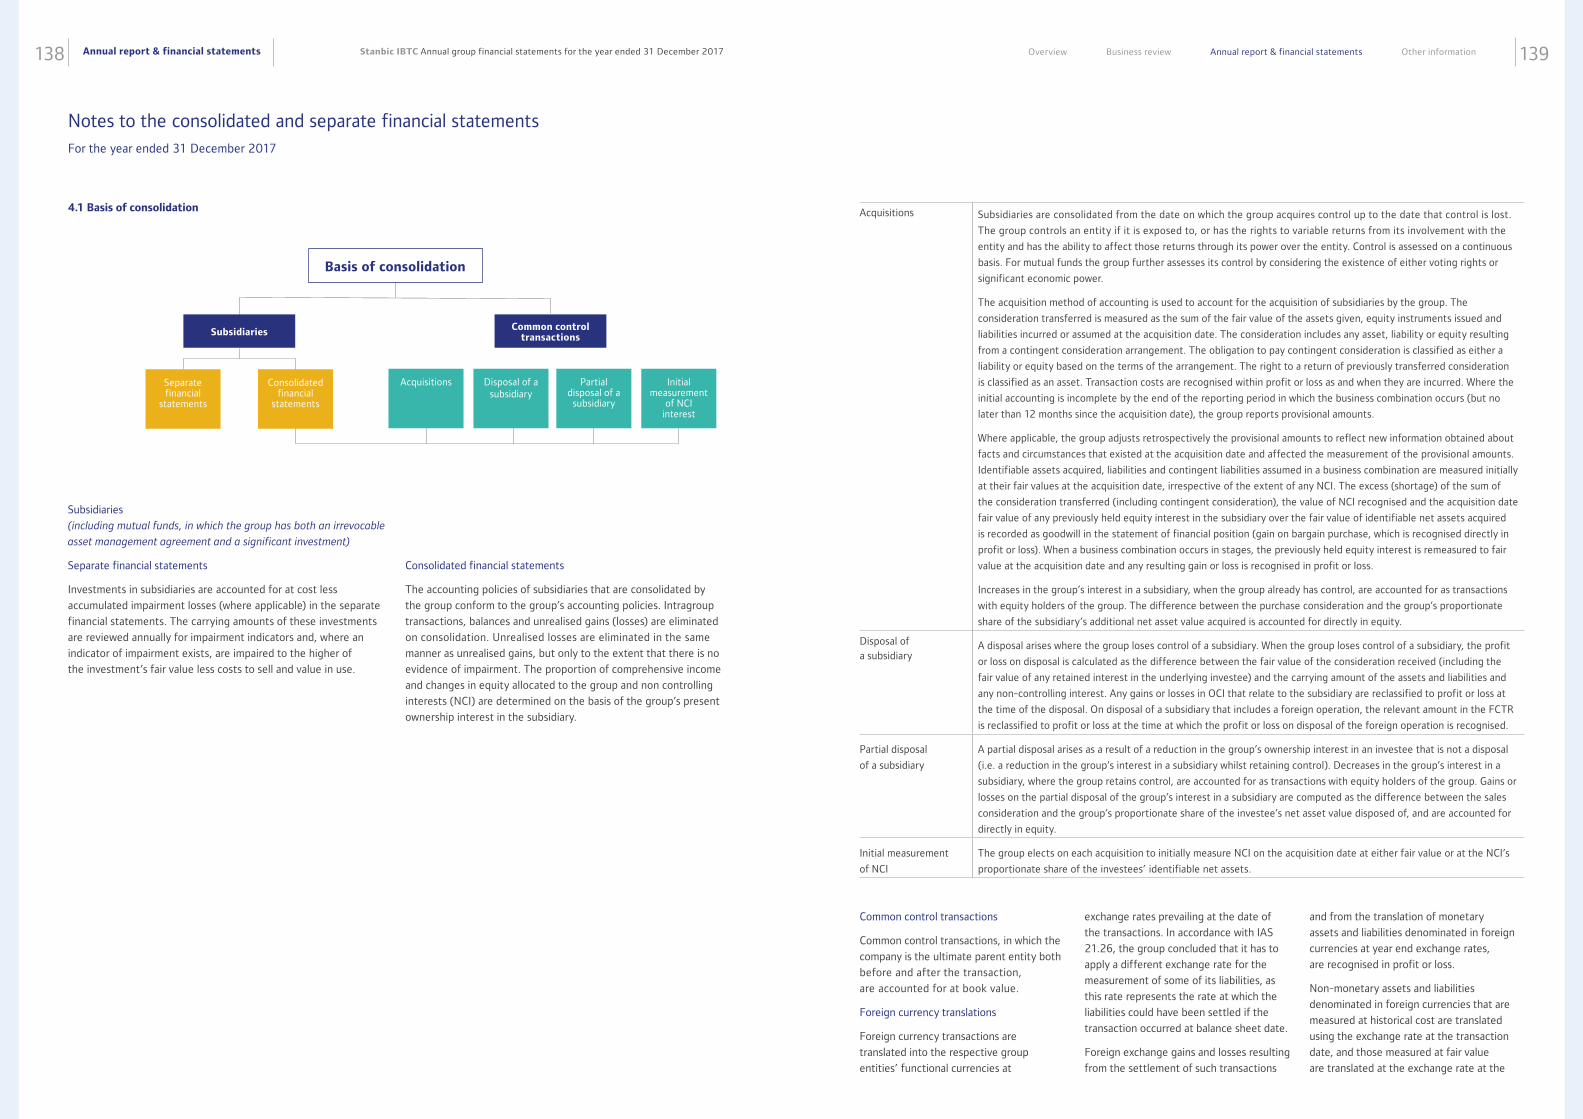
Annual report & financial statements138 139Stanbic IBTC Annual group financial statements for the year ended 31 December 2017 Overview Business review Annual report & financial statements Other information
Notes to the consolidated and separate financial statements For the year ended 31 December 2017
4.1 Basis of consolidation
Subsidiaries
Basis of consolidation
Common control transactions
AcquisitionsSeparate financial
statements
Consolidated financial
statements
Partial disposal of a subsidiary
Disposal of a subsidiary
Initial measurement
of NCI interest
Subsidiaries (including mutual funds, in which the group has both an irrevocable
asset management agreement and a significant investment)
Separate financial statements
Investments in subsidiaries are accounted for at cost less
accumulated impairment losses (where applicable) in the separate
financial statements. The carrying amounts of these investments
are reviewed annually for impairment indicators and, where an
indicator of impairment exists, are impaired to the higher of
the investment’s fair value less costs to sell and value in use.
Consolidated financial statements
The accounting policies of subsidiaries that are consolidated by
the group conform to the group’s accounting policies. Intragroup
transactions, balances and unrealised gains (losses) are eliminated
on consolidation. Unrealised losses are eliminated in the same
manner as unrealised gains, but only to the extent that there is no
evidence of impairment. The proportion of comprehensive income
and changes in equity allocated to the group and non controlling
interests (NCI) are determined on the basis of the group’s present
ownership interest in the subsidiary.
Acquisitions Subsidiaries are consolidated from the date on which the group acquires control up to the date that control is lost.
The group controls an entity if it is exposed to, or has the rights to variable returns from its involvement with the
entity and has the ability to affect those returns through its power over the entity. Control is assessed on a continuous
basis. For mutual funds the group further assesses its control by considering the existence of either voting rights or
significant economic power.
The acquisition method of accounting is used to account for the acquisition of subsidiaries by the group. The
consideration transferred is measured as the sum of the fair value of the assets given, equity instruments issued and
liabilities incurred or assumed at the acquisition date. The consideration includes any asset, liability or equity resulting
from a contingent consideration arrangement. The obligation to pay contingent consideration is classified as either a
liability or equity based on the terms of the arrangement. The right to a return of previously transferred consideration
is classified as an asset. Transaction costs are recognised within profit or loss as and when they are incurred. Where the
initial accounting is incomplete by the end of the reporting period in which the business combination occurs (but no
later than 12 months since the acquisition date), the group reports provisional amounts.
Where applicable, the group adjusts retrospectively the provisional amounts to reflect new information obtained about
facts and circumstances that existed at the acquisition date and affected the measurement of the provisional amounts.
Identifiable assets acquired, liabilities and contingent liabilities assumed in a business combination are measured initially
at their fair values at the acquisition date, irrespective of the extent of any NCI. The excess (shortage) of the sum of
the consideration transferred (including contingent consideration), the value of NCI recognised and the acquisition date
fair value of any previously held equity interest in the subsidiary over the fair value of identifiable net assets acquired
is recorded as goodwill in the statement of financial position (gain on bargain purchase, which is recognised directly in
profit or loss). When a business combination occurs in stages, the previously held equity interest is remeasured to fair
value at the acquisition date and any resulting gain or loss is recognised in profit or loss.
Increases in the group’s interest in a subsidiary, when the group already has control, are accounted for as transactions
with equity holders of the group. The difference between the purchase consideration and the group’s proportionate
share of the subsidiary’s additional net asset value acquired is accounted for directly in equity.
Disposal of a subsidiary
A disposal arises where the group loses control of a subsidiary. When the group loses control of a subsidiary, the profit
or loss on disposal is calculated as the difference between the fair value of the consideration received (including the
fair value of any retained interest in the underlying investee) and the carrying amount of the assets and liabilities and
any non-controlling interest. Any gains or losses in OCI that relate to the subsidiary are reclassified to profit or loss at
the time of the disposal. On disposal of a subsidiary that includes a foreign operation, the relevant amount in the FCTR
is reclassified to profit or loss at the time at which the profit or loss on disposal of the foreign operation is recognised.
Partial disposal
of a subsidiary
A partial disposal arises as a result of a reduction in the group’s ownership interest in an investee that is not a disposal
(i.e. a reduction in the group’s interest in a subsidiary whilst retaining control). Decreases in the group’s interest in a
subsidiary, where the group retains control, are accounted for as transactions with equity holders of the group. Gains or
losses on the partial disposal of the group’s interest in a subsidiary are computed as the difference between the sales
consideration and the group’s proportionate share of the investee’s net asset value disposed of, and are accounted for
directly in equity.
Initial measurement
of NCI
The group elects on each acquisition to initially measure NCI on the acquisition date at either fair value or at the NCI’s
proportionate share of the investees’ identifiable net assets.
Common control transactions
Common control transactions, in which the
company is the ultimate parent entity both
before and after the transaction,
are accounted for at book value.
Foreign currency translations
Foreign currency transactions are
translated into the respective group
entities’ functional currencies at
exchange rates prevailing at the date of
the transactions. In accordance with IAS
21.26, the group concluded that it has to
apply a different exchange rate for the
measurement of some of its liabilities, as
this rate represents the rate at which the
liabilities could have been settled if the
transaction occurred at balance sheet date.
Foreign exchange gains and losses resulting
from the settlement of such transactions
and from the translation of monetary
assets and liabilities denominated in foreign
currencies at year end exchange rates,
are recognised in profit or loss.
Non-monetary assets and liabilities
denominated in foreign currencies that are
measured at historical cost are translated
using the exchange rate at the transaction
date, and those measured at fair value
are translated at the exchange rate at the
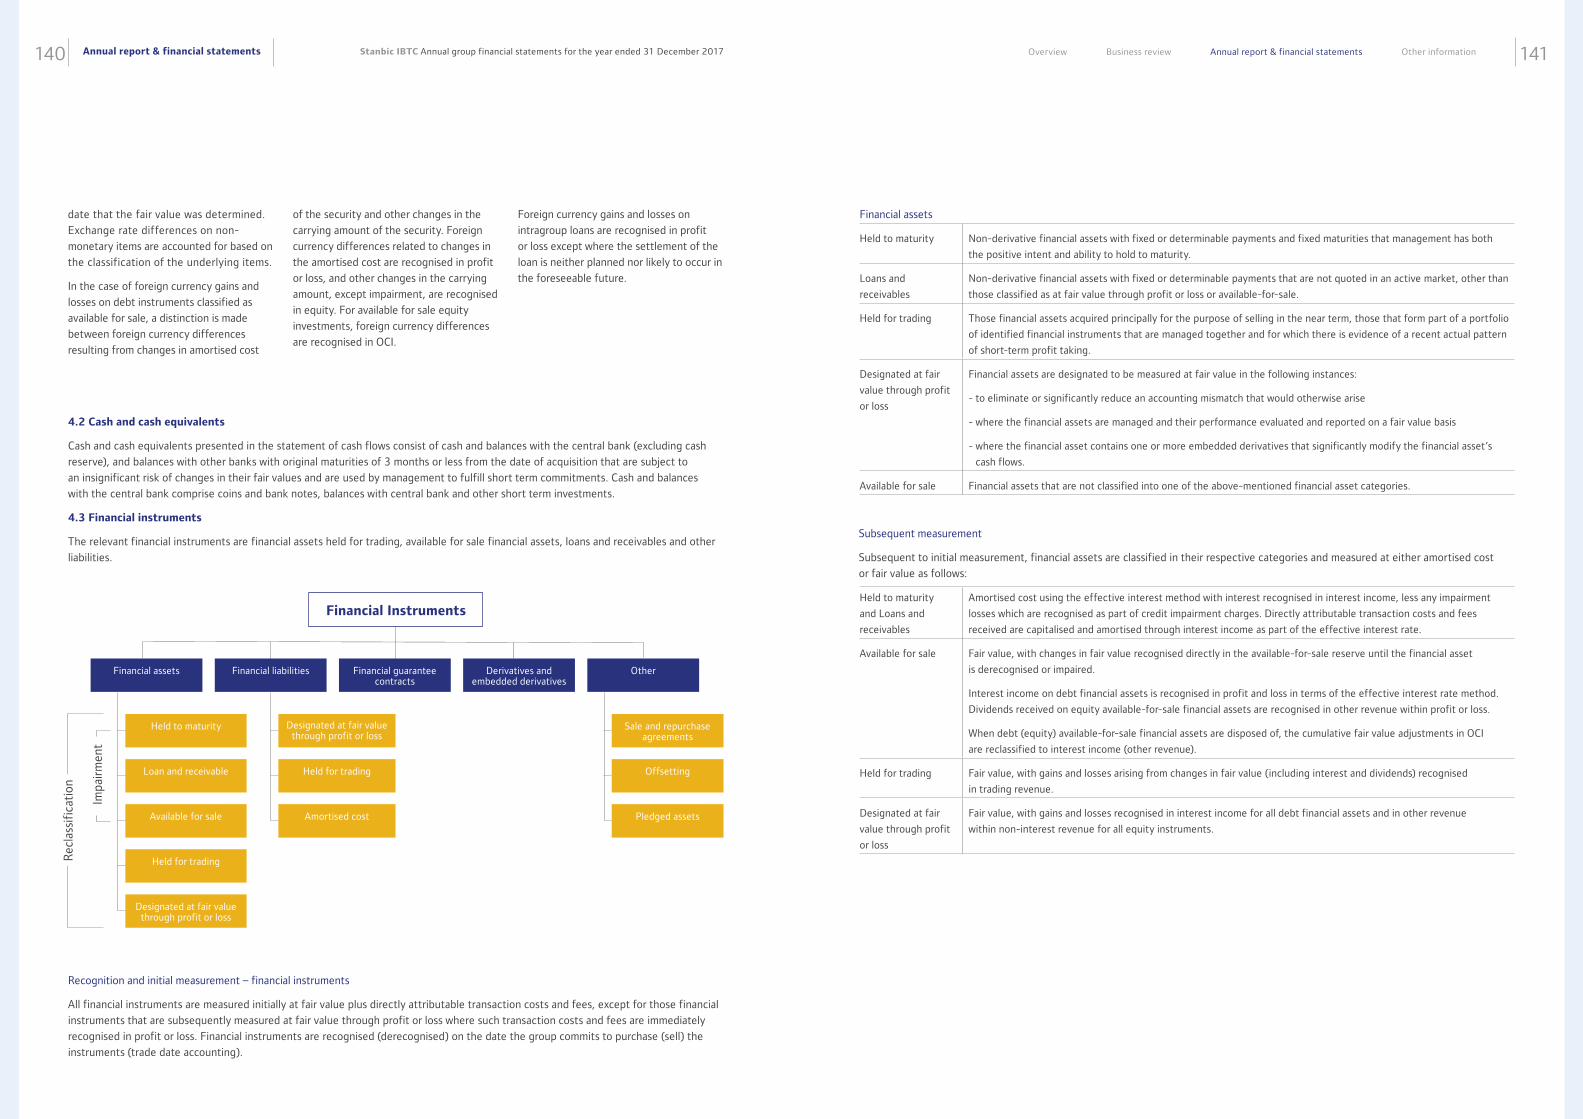
Annual report & financial statements140 141Stanbic IBTC Annual group financial statements for the year ended 31 December 2017 Overview Business review Annual report & financial statements Other information
4.2 Cash and cash equivalents
Cash and cash equivalents presented in the statement of cash flows consist of cash and balances with the central bank (excluding cash
reserve), and balances with other banks with original maturities of 3 months or less from the date of acquisition that are subject to
an insignificant risk of changes in their fair values and are used by management to fulfill short term commitments. Cash and balances
with the central bank comprise coins and bank notes, balances with central bank and other short term investments.
4.3 Financial instruments
The relevant financial instruments are financial assets held for trading, available for sale financial assets, loans and receivables and other
liabilities.
Financial liabilities Derivatives and embedded derivatives
OtherFinancial assets Financial guarantee contracts
Financial Instruments
Held to maturity
Loan and receivable
Available for sale
Held for trading
Designated at fair value through profit or loss
Designated at fair value through profit or loss
Held for trading
Amortised cost
Sale and repurchase agreements
Offsetting
Pledged assets
Impa
irm
ent
Rec
lass
ific
atio
n
Recognition and initial measurement – financial instruments
All financial instruments are measured initially at fair value plus directly attributable transaction costs and fees, except for those financial
instruments that are subsequently measured at fair value through profit or loss where such transaction costs and fees are immediately
recognised in profit or loss. Financial instruments are recognised (derecognised) on the date the group commits to purchase (sell) the
instruments (trade date accounting).
date that the fair value was determined.
Exchange rate differences on non-
monetary items are accounted for based on
the classification of the underlying items.
In the case of foreign currency gains and
losses on debt instruments classified as
available for sale, a distinction is made
between foreign currency differences
resulting from changes in amortised cost
of the security and other changes in the
carrying amount of the security. Foreign
currency differences related to changes in
the amortised cost are recognised in profit
or loss, and other changes in the carrying
amount, except impairment, are recognised
in equity. For available for sale equity
investments, foreign currency differences
are recognised in OCI.
Foreign currency gains and losses on
intragroup loans are recognised in profit
or loss except where the settlement of the
loan is neither planned nor likely to occur in
the foreseeable future.
Subsequent measurement
Subsequent to initial measurement, financial assets are classified in their respective categories and measured at either amortised cost
or fair value as follows:
Financial assets
Held to maturity Non-derivative financial assets with fixed or determinable payments and fixed maturities that management has both
the positive intent and ability to hold to maturity.
Loans and
receivables
Non-derivative financial assets with fixed or determinable payments that are not quoted in an active market, other than
those classified as at fair value through profit or loss or available-for-sale.
Held for trading Those financial assets acquired principally for the purpose of selling in the near term, those that form part of a portfolio
of identified financial instruments that are managed together and for which there is evidence of a recent actual pattern
of short-term profit taking.
Designated at fair
value through profit
or loss
Financial assets are designated to be measured at fair value in the following instances:
- to eliminate or significantly reduce an accounting mismatch that would otherwise arise
- where the financial assets are managed and their performance evaluated and reported on a fair value basis
- where the financial asset contains one or more embedded derivatives that significantly modify the financial asset’s
cash flows.
Available for sale Financial assets that are not classified into one of the above-mentioned financial asset categories.
Held to maturity
and Loans and
receivables
Amortised cost using the effective interest method with interest recognised in interest income, less any impairment
losses which are recognised as part of credit impairment charges. Directly attributable transaction costs and fees
received are capitalised and amortised through interest income as part of the effective interest rate.
Available for sale Fair value, with changes in fair value recognised directly in the available-for-sale reserve until the financial asset
is derecognised or impaired.
Interest income on debt financial assets is recognised in profit and loss in terms of the effective interest rate method.
Dividends received on equity available-for-sale financial assets are recognised in other revenue within profit or loss.
When debt (equity) available-for-sale financial assets are disposed of, the cumulative fair value adjustments in OCI
are reclassified to interest income (other revenue).
Held for trading Fair value, with gains and losses arising from changes in fair value (including interest and dividends) recognised
in trading revenue.
Designated at fair
value through profit
or loss
Fair value, with gains and losses recognised in interest income for all debt financial assets and in other revenue
within non-interest revenue for all equity instruments.
Annual report & financial statements142 143Stanbic IBTC Annual group financial statements for the year ended 31 December 2017 Overview Business review Annual report & financial statements Other information
Impairment
A financial asset is impaired if objective evidence indicates that a loss event has occurred after initial recognition which has a negative
effect on the estimated future cash flows of the financial asset that can be estimated reliably. The group assesses at each reporting date
whether there is objective evidence that a financial asset, which is either carried at amortised cost or classified as available-for-sale, is
impaired as follows:
Notes to the consolidated and separate financial statements For the year ended 31 December 2017
Held to maturity and
Loans and
receivables
The following criteria are used by the group in determining whether there is objective evidence of impairment for loans
or groups of loans include:
• known cash flow difficulties experienced by the borrower;
• a breach of contract, such as default or delinquency in interest and/or principal payments;
• breaches of loan covenants or conditions;
• it becoming probable that the borrower will enter bankruptcy or other financial reorganisation; and
• where the group, for economic or legal reasons relating to the borrower’s financial difficulty, grants the borrower
a concession that the group would not otherwise consider.
The group first assesses whether there is objective evidence of impairment individually for loans that are individually
significant, and individually or collectively for loans that are not individually significant. Non-performing loans
include those loans for which the group has identified objective evidence of default, such as a breach of a material
loan covenant or condition as well as those loans for which instalments are due and unpaid for 90 days or more.
The impairment of non-performing loans takes into account past loss experience adjusted for changes in economic
conditions and the nature and level of risk exposure since the recording of the historic losses.
When a loan carried at amortised cost has been identified as specifically impaired, the carrying amount of the loan is
reduced to an amount equal to the present value of its estimated future cash flows, including the recoverable amount
of any collateral, discounted at the financial asset’s original effective interest rate. The carrying amount of the loan
is reduced through the use of a specific credit impairment account and the loss is recognised as a credit impairment
charge in profit or loss.
Increases in loan impairments and any subsequent reversals thereof, or recoveries of amounts previously impaired
(including loans that have been written off), are reflected within credit impairment charges in profit or loss.
Subsequent to impairment, the effects of discounting unwind over time as interest income.
The calculation of the present value of the estimated future cash flows of collateralised financial assets recognised
on an amortised cost basis includes cash flows that may result from foreclosure less costs of obtaining and selling
the collateral, whether or not foreclosure is probable.
If the group determines that no objective evidence of impairment exists for an individually assessed loan, whether
significant or not, it includes the loan in a group of financial loans with similar credit risk characteristics and collectively
assesses for impairment. Loans that are individually assessed for impairment and for which an impairment loss is
recognised are not included in a collective assessment for impairment.
Impairment of groups of loans that are assessed collectively is recognised where there is objective evidence that a loss
event has occurred after the initial recognition of the group of loans but before the reporting date. In order to provide
for latent losses in a group of loans that have not yet been identified as specifically impaired, a credit impairment for
incurred but not reported losses is recognised based on historic loss patterns and estimated emergence periods (time
period between the loss trigger events and the date on which the group identifies the losses). Groups of loans are also
impaired when adverse economic conditions develop after initial recognition, which may impact future cash flows. The
carrying amount of groups of loans is reduced through the use of a portfolio credit impairment account and the loss is
recognised as a credit impairment charge in profit or loss.
Previously impaired loans are written off once all reasonable attempts at collection have been made and there is no
realistic prospect of recovering outstanding amounts.
Reclassification
Reclassifications of financial assets are permitted only in the following instances:
Held to maturity Where the group is to sell more than an insignificant amount of held-to-maturity investments, the entire category
would be tainted and reclassified from held-to-maturity to available-for-sale assets with the difference between
amortised cost and fair value being accounted for in OCI.
Loans and
receivables
The group may choose to reclassify financial assets from loans and receivables to held to maturity if the group, at the
date of reclassification, has the intention and ability to hold these financial assets for the foreseeable future or until
maturity.
Held for trading The group may choose to reclassify held for trading non-derivative financial assets to another category of financial
assets in the following instances:
• non-derivative trading assets out of the held-for-trading category if the financial asset is no longer held for the
purpose of selling it in the near term.
• non-derivative trading assets that would not otherwise have met the definition of loans and receivables are permitted
to be reclassified only in rare circumstances.
• non-derivative trading assets that would meet the definition of loans and receivables if the group, at the date of
reclassification, has the intention and ability to hold these financial assets for the foreseeable future or until maturity.
Reclassifications are made at fair value as of the reclassification date. Effective interest rates for financial assets reclassified to loans
and receivables, held-to-maturity and available-for-sale categories are determined at the reclassification date. Subsequent changes
in estimates of cash flows (other than credit impairment changes) adjust the financial asset’s effective interest rates prospectively.
On reclassification of a trading asset, all embedded derivatives are reassessed and, if necessary, accounted for separately.
Financial Liabilities
Nature
Held for trading Those financial liabilities incurred principally for the purpose of re-purchasing in the near term, those that form part
of a portfolio of identified financial instruments that are managed together and for which there is evidence of a recent
actual pattern of short-term profit taking.
Designated at fair
value through profit
or loss
Financial liabilities are designated to be measured at fair value in the following instances:
• to eliminate or significantly reduce an accounting mismatch that would otherwise arise
• where the financial liabilities are managed and their performance evaluated and reported on a fair value basis
• where the financial liability contains one or more embedded derivatives that significantly modify the financial
liability’s cash flows.
At amortised cost All other financial liabilities not included the above categories.
Available for sale Available-for-sale debt instruments are impaired when there has been an adverse effect in fair value of the instrument
below its cost and for equity instruments where there is information about significant or prolonged changes with an
adverse effect on the environment in which the issuer operates that indicates that the cost of the investment in the
equity instrument may not be recovered.
When an available for sale asset has been identified as impaired, the cumulative loss, measured as the difference
between the acquisition price and the current fair value, less any previously recognised impairment losses on that
financial asset, is reclassified from OCI to profit or loss.
If, in a subsequent period, the amount relating to an impairment loss decreases and the decrease can be linked
objectively to an event occurring after the impairment loss was recognised, where the instrument is a debt instrument,
the impairment loss is reversed through profit or loss. An impairment loss in respect of an equity instrument classified
as available-for-sale is not reversed through profit or loss but accounted for directly in OCI.
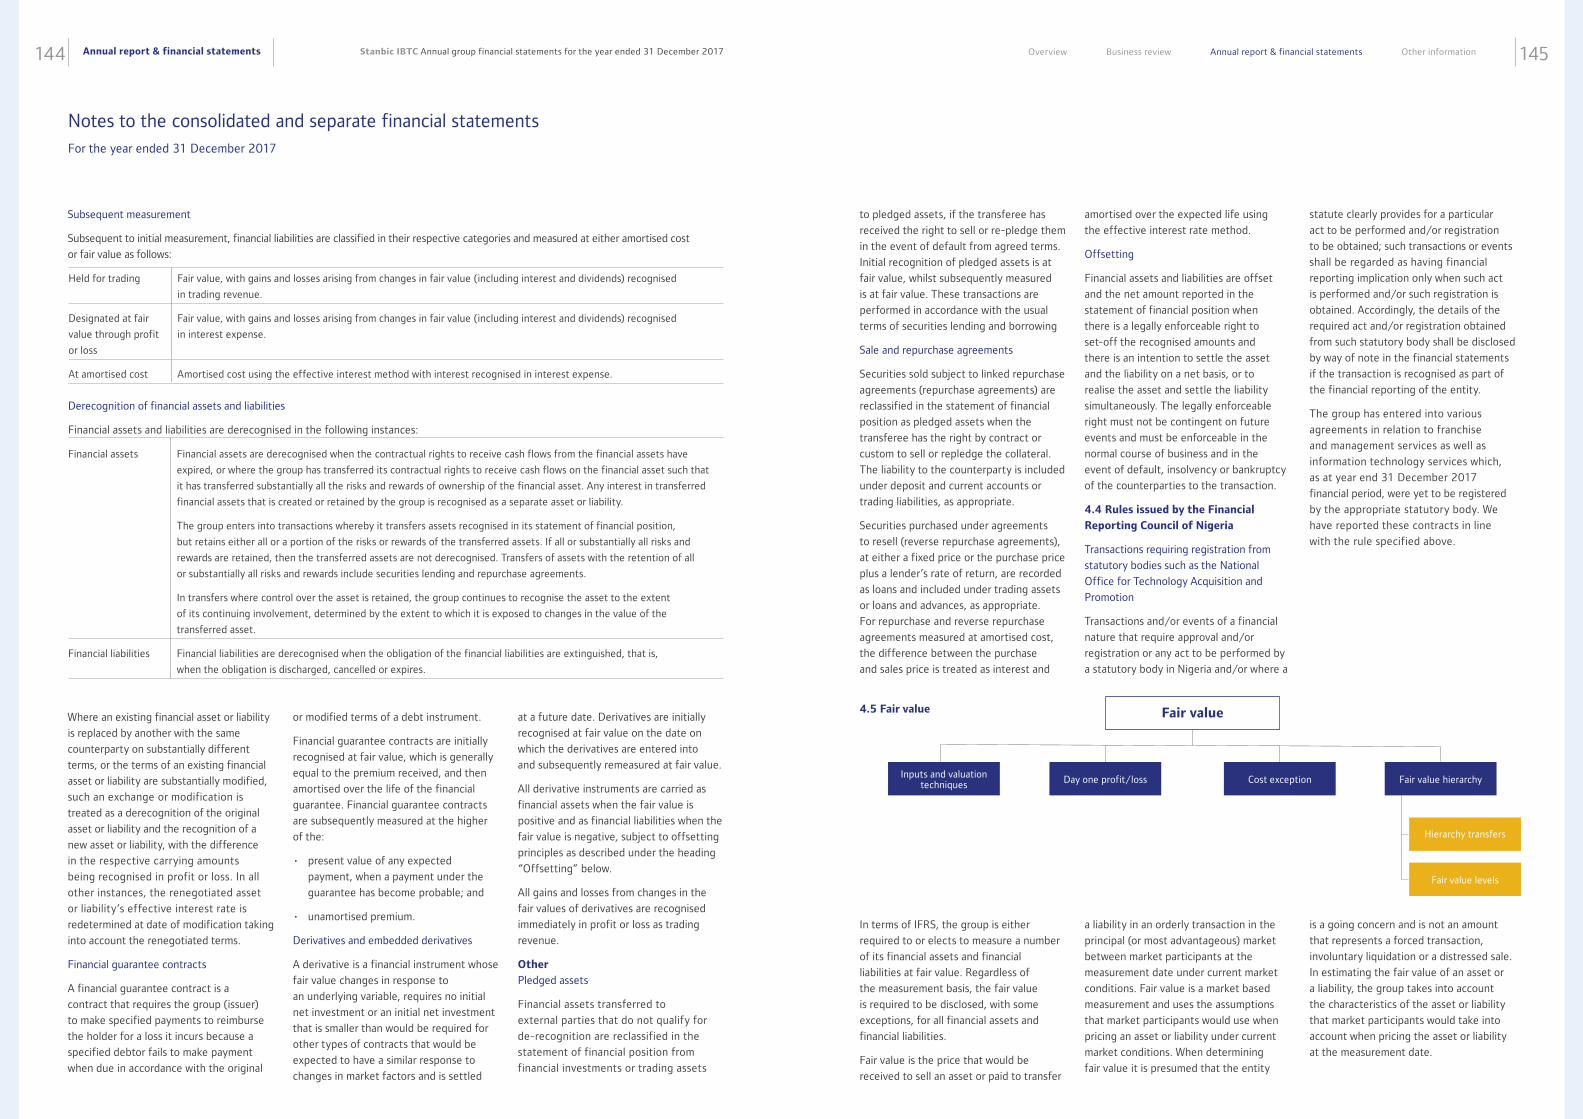
Annual report & financial statements144 145Stanbic IBTC Annual group financial statements for the year ended 31 December 2017 Overview Business review Annual report & financial statements Other information
Subsequent measurement
Subsequent to initial measurement, financial liabilities are classified in their respective categories and measured at either amortised cost
or fair value as follows:
Held for trading Fair value, with gains and losses arising from changes in fair value (including interest and dividends) recognised
in trading revenue.
Designated at fair
value through profit
or loss
Fair value, with gains and losses arising from changes in fair value (including interest and dividends) recognised
in interest expense.
At amortised cost Amortised cost using the effective interest method with interest recognised in interest expense.
Derecognition of financial assets and liabilities
Financial assets and liabilities are derecognised in the following instances:
Financial assets Financial assets are derecognised when the contractual rights to receive cash flows from the financial assets have
expired, or where the group has transferred its contractual rights to receive cash flows on the financial asset such that
it has transferred substantially all the risks and rewards of ownership of the financial asset. Any interest in transferred
financial assets that is created or retained by the group is recognised as a separate asset or liability.
The group enters into transactions whereby it transfers assets recognised in its statement of financial position,
but retains either all or a portion of the risks or rewards of the transferred assets. If all or substantially all risks and
rewards are retained, then the transferred assets are not derecognised. Transfers of assets with the retention of all
or substantially all risks and rewards include securities lending and repurchase agreements.
In transfers where control over the asset is retained, the group continues to recognise the asset to the extent
of its continuing involvement, determined by the extent to which it is exposed to changes in the value of the
transferred asset.
Financial liabilities Financial liabilities are derecognised when the obligation of the financial liabilities are extinguished, that is,
when the obligation is discharged, cancelled or expires.
Where an existing financial asset or liability
is replaced by another with the same
counterparty on substantially different
terms, or the terms of an existing financial
asset or liability are substantially modified,
such an exchange or modification is
treated as a derecognition of the original
asset or liability and the recognition of a
new asset or liability, with the difference
in the respective carrying amounts
being recognised in profit or loss. In all
other instances, the renegotiated asset
or liability’s effective interest rate is
redetermined at date of modification taking
into account the renegotiated terms.
Financial guarantee contracts
A financial guarantee contract is a
contract that requires the group (issuer)
to make specified payments to reimburse
the holder for a loss it incurs because a
specified debtor fails to make payment
when due in accordance with the original
or modified terms of a debt instrument.
Financial guarantee contracts are initially
recognised at fair value, which is generally
equal to the premium received, and then
amortised over the life of the financial
guarantee. Financial guarantee contracts
are subsequently measured at the higher
of the:
• present value of any expected
payment, when a payment under the
guarantee has become probable; and
• unamortised premium.
Derivatives and embedded derivatives
A derivative is a financial instrument whose
fair value changes in response to
an underlying variable, requires no initial
net investment or an initial net investment
that is smaller than would be required for
other types of contracts that would be
expected to have a similar response to
changes in market factors and is settled
at a future date. Derivatives are initially
recognised at fair value on the date on
which the derivatives are entered into
and subsequently remeasured at fair value.
All derivative instruments are carried as
financial assets when the fair value is
positive and as financial liabilities when the
fair value is negative, subject to offsetting
principles as described under the heading
“Offsetting” below.
All gains and losses from changes in the
fair values of derivatives are recognised
immediately in profit or loss as trading
revenue.
Other
Pledged assets
Financial assets transferred to
external parties that do not qualify for
de-recognition are reclassified in the
statement of financial position from
financial investments or trading assets
Notes to the consolidated and separate financial statements For the year ended 31 December 2017
to pledged assets, if the transferee has
received the right to sell or re-pledge them
in the event of default from agreed terms.
Initial recognition of pledged assets is at
fair value, whilst subsequently measured
is at fair value. These transactions are
performed in accordance with the usual
terms of securities lending and borrowing
Sale and repurchase agreements
Securities sold subject to linked repurchase
agreements (repurchase agreements) are
reclassified in the statement of financial
position as pledged assets when the
transferee has the right by contract or
custom to sell or repledge the collateral.
The liability to the counterparty is included
under deposit and current accounts or
trading liabilities, as appropriate.
Securities purchased under agreements
to resell (reverse repurchase agreements),
at either a fixed price or the purchase price
plus a lender’s rate of return, are recorded
as loans and included under trading assets
or loans and advances, as appropriate.
For repurchase and reverse repurchase
agreements measured at amortised cost,
the difference between the purchase
and sales price is treated as interest and
amortised over the expected life using
the effective interest rate method.
Offsetting
Financial assets and liabilities are offset
and the net amount reported in the
statement of financial position when
there is a legally enforceable right to
set-off the recognised amounts and
there is an intention to settle the asset
and the liability on a net basis, or to
realise the asset and settle the liability
simultaneously. The legally enforceable
right must not be contingent on future
events and must be enforceable in the
normal course of business and in the
event of default, insolvency or bankruptcy
of the counterparties to the transaction.
4.4 Rules issued by the Financial
Reporting Council of Nigeria
Transactions requiring registration from
statutory bodies such as the National
Office for Technology Acquisition and
Promotion
Transactions and/or events of a financial
nature that require approval and/or
registration or any act to be performed by
a statutory body in Nigeria and/or where a
statute clearly provides for a particular
act to be performed and/or registration
to be obtained; such transactions or events
shall be regarded as having financial
reporting implication only when such act
is performed and/or such registration is
obtained. Accordingly, the details of the
required act and/or registration obtained
from such statutory body shall be disclosed
by way of note in the financial statements
if the transaction is recognised as part of
the financial reporting of the entity.
The group has entered into various
agreements in relation to franchise
and management services as well as
information technology services which,
as at year end 31 December 2017
financial period, were yet to be registered
by the appropriate statutory body. We
have reported these contracts in line
with the rule specified above.
4.5 Fair value
Inputs and valuation techniques Day one profit/loss Cost exception Fair value hierarchy
Fair value
Hierarchy transfers
Fair value levels
In terms of IFRS, the group is either
required to or elects to measure a number
of its financial assets and financial
liabilities at fair value. Regardless of
the measurement basis, the fair value
is required to be disclosed, with some
exceptions, for all financial assets and
financial liabilities.
Fair value is the price that would be
received to sell an asset or paid to transfer
a liability in an orderly transaction in the
principal (or most advantageous) market
between market participants at the
measurement date under current market
conditions. Fair value is a market based
measurement and uses the assumptions
that market participants would use when
pricing an asset or liability under current
market conditions. When determining
fair value it is presumed that the entity
is a going concern and is not an amount
that represents a forced transaction,
involuntary liquidation or a distressed sale.
In estimating the fair value of an asset or
a liability, the group takes into account
the characteristics of the asset or liability
that market participants would take into
account when pricing the asset or liability
at the measurement date.
Annual report & financial statements146 147Stanbic IBTC Annual group financial statements for the year ended 31 December 2017 Overview Business review Annual report & financial statements Other information
Inputs and valuation techniques
Fair value is measured based on quoted market prices or dealer
price quotations for identical assets and liabilities that are traded
in active markets, which can be accessed at the measurement
date, and where those quoted prices represent fair value. If the
market for an asset or liability is not active or the instrument is
not quoted in an active market, the fair value is determined using
other applicable valuation techniques that maximise the use of
relevant observable inputs and minimises the use of unobservable
inputs. These include the use of recent arm’s length transactions,
discounted cash flow analyses, pricing models and other valuation
techniques commonly used by market participants.
Fair value measurements are categorised into level 1, 2 or 3 within
the fair value hierarchy based on the degree to which the inputs to
the fair value measurements are observable and the significance
of the inputs to the fair value measurement.
Where discounted cash flow analyses are used, estimated future
cash flows are based on management’s best estimates and a
market related discount rate at the reporting date for an asset
or liability with similar terms and conditions.
If an asset or a liability measured at fair value has both a bid
and an ask price, the price within the bid-ask spread that is
most representative of fair value is used to measure fair value.
The group’s valuation control framework governs internal control
standards, methodologies, and procedures over its valuation
processes, which include the following valuation techniques
and main inputs and assumptions per type of instrument:
Item Description Valuation technique Main inputs and assumptions
(Level 2 and 3 fair value hierarchy
items)
Derivative financial
instruments
Derivative financial instruments
comprise foreign exchange, and
interest rate.
Standard derivative contracts are valued
using market accepted models and
quoted parameter inputs. More complex
derivative contracts are modelled using
more sophisticated modelling techniques
applicable to the instrument. Techniques
include:
• Discounted cash flow model
• Black-Scholes model
• Discount rate*
• Spot prices of the underlying
assets
• Correlation factors
• Volatilities
• Dividend yields
• Earnings yield
• Valuation multiples
Trading assets and
Trading liabilities
Trading assets and liabilities
comprise instruments which are
part of the group’s underlying
trading activities. These
instruments primarily include
sovereign and corporate debt, and
collateral.
Where there are no recent market
transactions in the specific instrument,
fair value is derived from the last available
market price adjusted for changes in risks
and information since that date.
Pledged assets Pledged assets comprise
instruments that may be sold
or repledged by the group’s
counterparty in the absence of
default by the group. Pledged
assets include sovereign debt
(government treasury bills and
bonds) pledged in terms of
repurchase agreements.
Where a proxy instrument is quoted in an
active market, the fair value is determined
by adjusting the proxy fair value for
differences between the proxy instrument
and the financial investment being fair
valued. Where proxies are not available, the
fair value is estimated using more complex
modelling techniques. These techniques
include discounted cash flow and Black-
Scholes models using current market rates
for credit, interest, liquidity, volatility and
other risks. Combination techniques are
used to value unlisted equity securities and
include inputs such as earnings and dividend
yields of the underlying entity.
• Discount rate*
• Spot prices of the underlying
• Correlation factors
• Volatilities
• Dividend yields
• Earnings yield
• Valuation multiples
Financial investments Financial investments are non-
trading financial assets and
primarily comprise of sovereign
and corporate debt, unlisted
equity instruments, investments
in mutual fund investments and
unit-linked investments.
Notes to the consolidated and separate financial statements For the year ended 31 December 2017
* Discount rates, where applicable, include the risk-free rate, risk premiums, liquidity spreads, credit risk (own and counterparty as appropriate), timing of settlement, storage/service costs, prepayment and surrender risk assumptions and recovery rates/loss given default.
Item Description Valuation technique Main inputs and assumptions
(Level 2 and 3 fair value hierarchy
items)
Loans and advances
to banks and
customers
Loans and advances comprise:
• Loans and advances to banks:
call loans, loans granted
under resale agreements
and balances held with other
banks.
• Loans and advances to
customers: mortgage loans
(home loans and commercial
mortgages), other asset-based
loans, including collateralised
debt obligations (instalment
sale and finance leases), and
other secured and unsecured
loans (card debtors, overdrafts,
other demand lending, term
lending and loans granted
under resale agreements).
For certain loans fair value may be
determined from the market price of a
recently occurring transaction adjusted for
changes in risks and information between
the transaction and valuation dates. Loans
and advances are reviewed for observed
and verified changes in credit risk and the
credit spread is adjusted at subsequent
dates if there has been an observable
change in credit risk relating to a particular
loan or advance. In the absence of an
observable market for these instruments,
discounted cash flow models are used to
determine fair value. Discounted cash flow
models incorporate parameter inputs for
interest rate risk, foreign exchange risk,
liquidity and credit risk, as appropriate. For
credit risk, probability of default and loss
given default parameters are determined
using the relevant terms of the loan and
loan counterparty such as the industry
classification and subordination of the loan.
• Discount rate
• Probability of default
• Loss given default
Deposits from bank
and customers
Deposits from banks and
customers comprise amounts
owed to banks and customers,
deposits under repurchase
agreements, negotiable
certificates of deposit, credit-
linked deposits and other
deposits.
For certain deposits, fair value may be
determined from the market price on a
recently occurring transaction adjusted for
all changes in risks and information between
the transaction and valuation dates. In the
absence of an observable market for these
instruments discounted cash flow models
are used to determine fair value based on
the contractual cash flows related to the
instrument. The fair value measurement
incorporates all market risk factors including
a measure of the group’s credit risk relevant
for that financial liability. The market risk
parameters are valued consistently to similar
instruments held as assets stated in the
section above. For collateralised deposits
that are designated to be measured at
fair value through profit or loss, such as
securities repurchase agreements, the credit
enhancement is incorporated into the fair
valuation of the liability.
• Discount rate
• Probability of default
• Loss given default
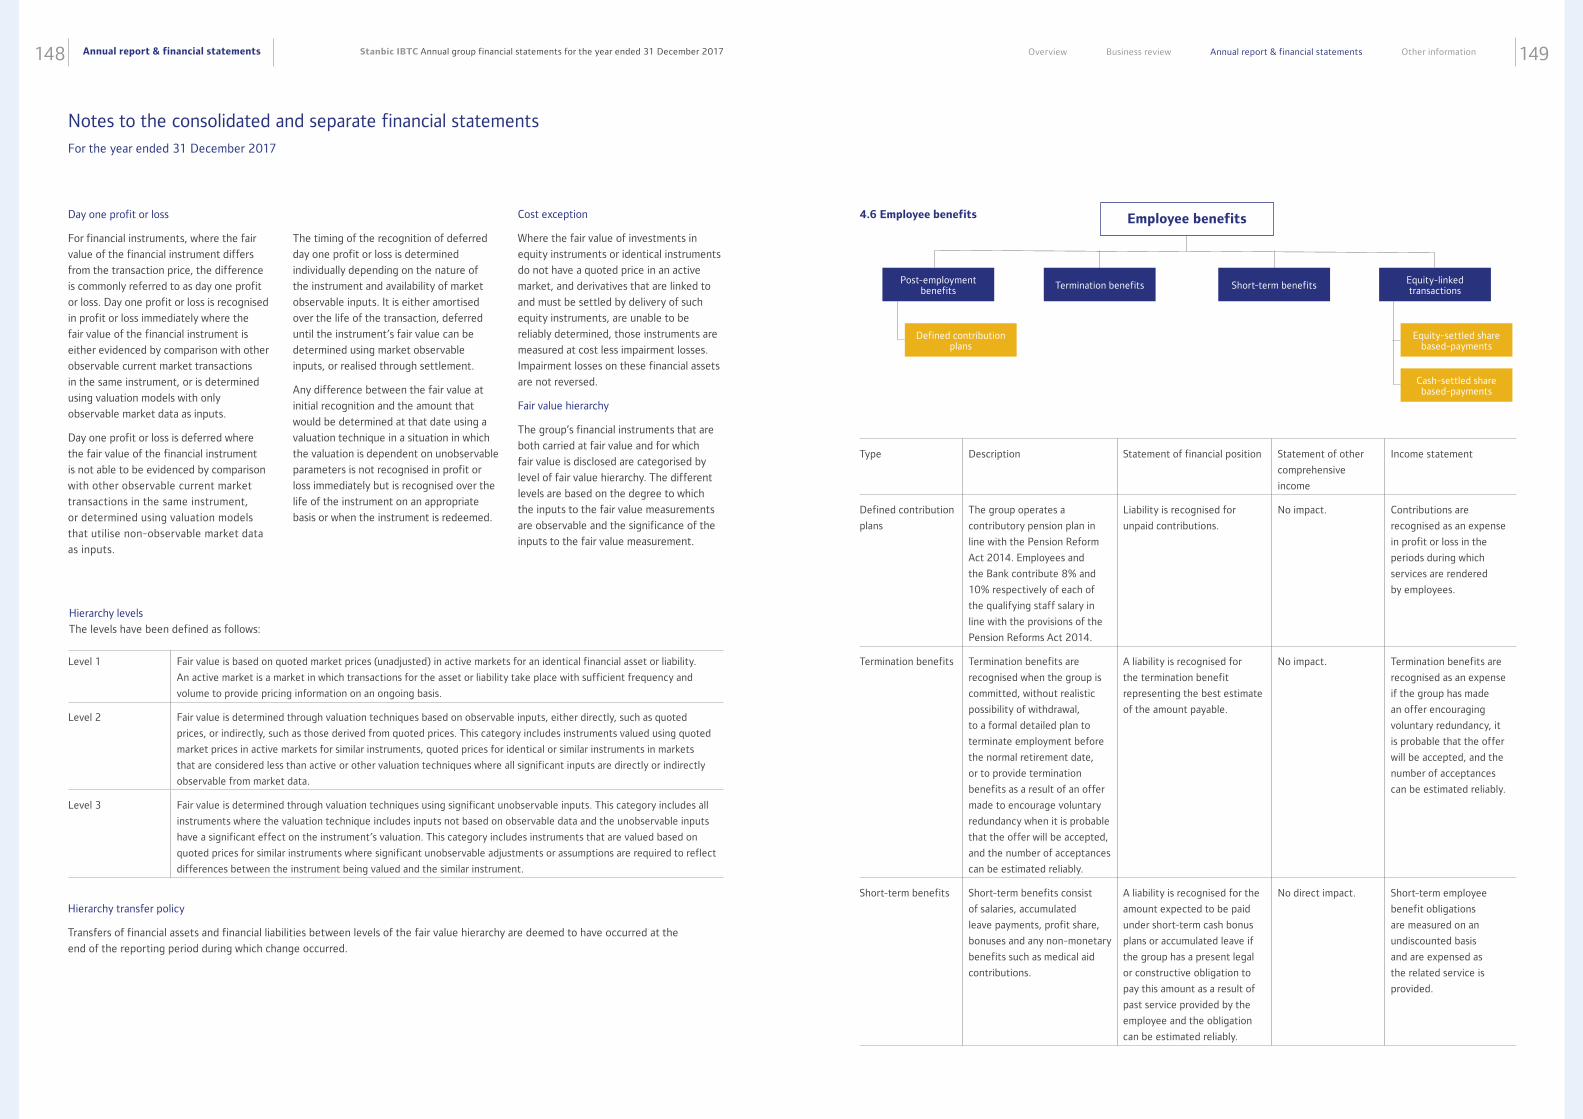
Annual report & financial statements148 149Stanbic IBTC Annual group financial statements for the year ended 31 December 2017 Overview Business review Annual report & financial statements Other information
Hierarchy transfer policy
Transfers of financial assets and financial liabilities between levels of the fair value hierarchy are deemed to have occurred at the
end of the reporting period during which change occurred.
Level 1 Fair value is based on quoted market prices (unadjusted) in active markets for an identical financial asset or liability.
An active market is a market in which transactions for the asset or liability take place with sufficient frequency and
volume to provide pricing information on an ongoing basis.
Level 2 Fair value is determined through valuation techniques based on observable inputs, either directly, such as quoted
prices, or indirectly, such as those derived from quoted prices. This category includes instruments valued using quoted
market prices in active markets for similar instruments, quoted prices for identical or similar instruments in markets
that are considered less than active or other valuation techniques where all significant inputs are directly or indirectly
observable from market data.
Level 3 Fair value is determined through valuation techniques using significant unobservable inputs. This category includes all
instruments where the valuation technique includes inputs not based on observable data and the unobservable inputs
have a significant effect on the instrument’s valuation. This category includes instruments that are valued based on
quoted prices for similar instruments where significant unobservable adjustments or assumptions are required to reflect
differences between the instrument being valued and the similar instrument.
Day one profit or loss
For financial instruments, where the fair
value of the financial instrument differs
from the transaction price, the difference
is commonly referred to as day one profit
or loss. Day one profit or loss is recognised
in profit or loss immediately where the
fair value of the financial instrument is
either evidenced by comparison with other
observable current market transactions
in the same instrument, or is determined
using valuation models with only
observable market data as inputs.
Day one profit or loss is deferred where
the fair value of the financial instrument
is not able to be evidenced by comparison
with other observable current market
transactions in the same instrument,
or determined using valuation models
that utilise non-observable market data
as inputs.
The timing of the recognition of deferred
day one profit or loss is determined
individually depending on the nature of
the instrument and availability of market
observable inputs. It is either amortised
over the life of the transaction, deferred
until the instrument’s fair value can be
determined using market observable
inputs, or realised through settlement.
Any difference between the fair value at
initial recognition and the amount that
would be determined at that date using a
valuation technique in a situation in which
the valuation is dependent on unobservable
parameters is not recognised in profit or
loss immediately but is recognised over the
life of the instrument on an appropriate
basis or when the instrument is redeemed.
Cost exception
Where the fair value of investments in
equity instruments or identical instruments
do not have a quoted price in an active
market, and derivatives that are linked to
and must be settled by delivery of such
equity instruments, are unable to be
reliably determined, those instruments are
measured at cost less impairment losses.
Impairment losses on these financial assets
are not reversed.
Fair value hierarchy
The group’s financial instruments that are
both carried at fair value and for which
fair value is disclosed are categorised by
level of fair value hierarchy. The different
levels are based on the degree to which
the inputs to the fair value measurements
are observable and the significance of the
inputs to the fair value measurement.
Hierarchy levels
The levels have been defined as follows:
Notes to the consolidated and separate financial statements For the year ended 31 December 2017
4.6 Employee benefits
Post-employment benefits Termination benefits Short-term benefits Equity-linked
transactions
Employee benefits
Equity-settled share based-payments
Cash-settled share based-payments
Defined contribution plans
Type Description Statement of financial position Statement of other
comprehensive
income
Income statement
Defined contribution
plans
The group operates a
contributory pension plan in
line with the Pension Reform
Act 2014. Employees and
the Bank contribute 8% and
10% respectively of each of
the qualifying staff salary in
line with the provisions of the
Pension Reforms Act 2014.
Liability is recognised for
unpaid contributions.
No impact. Contributions are
recognised as an expense
in profit or loss in the
periods during which
services are rendered
by employees.
Termination benefits Termination benefits are
recognised when the group is
committed, without realistic
possibility of withdrawal,
to a formal detailed plan to
terminate employment before
the normal retirement date,
or to provide termination
benefits as a result of an offer
made to encourage voluntary
redundancy when it is probable
that the offer will be accepted,
and the number of acceptances
can be estimated reliably.
A liability is recognised for
the termination benefit
representing the best estimate
of the amount payable.
No impact. Termination benefits are
recognised as an expense
if the group has made
an offer encouraging
voluntary redundancy, it
is probable that the offer
will be accepted, and the
number of acceptances
can be estimated reliably.
Short-term benefits Short-term benefits consist
of salaries, accumulated
leave payments, profit share,
bonuses and any non-monetary
benefits such as medical aid
contributions.
A liability is recognised for the
amount expected to be paid
under short-term cash bonus
plans or accumulated leave if
the group has a present legal
or constructive obligation to
pay this amount as a result of
past service provided by the
employee and the obligation
can be estimated reliably.
No direct impact. Short-term employee
benefit obligations
are measured on an
undiscounted basis
and are expensed as
the related service is
provided.
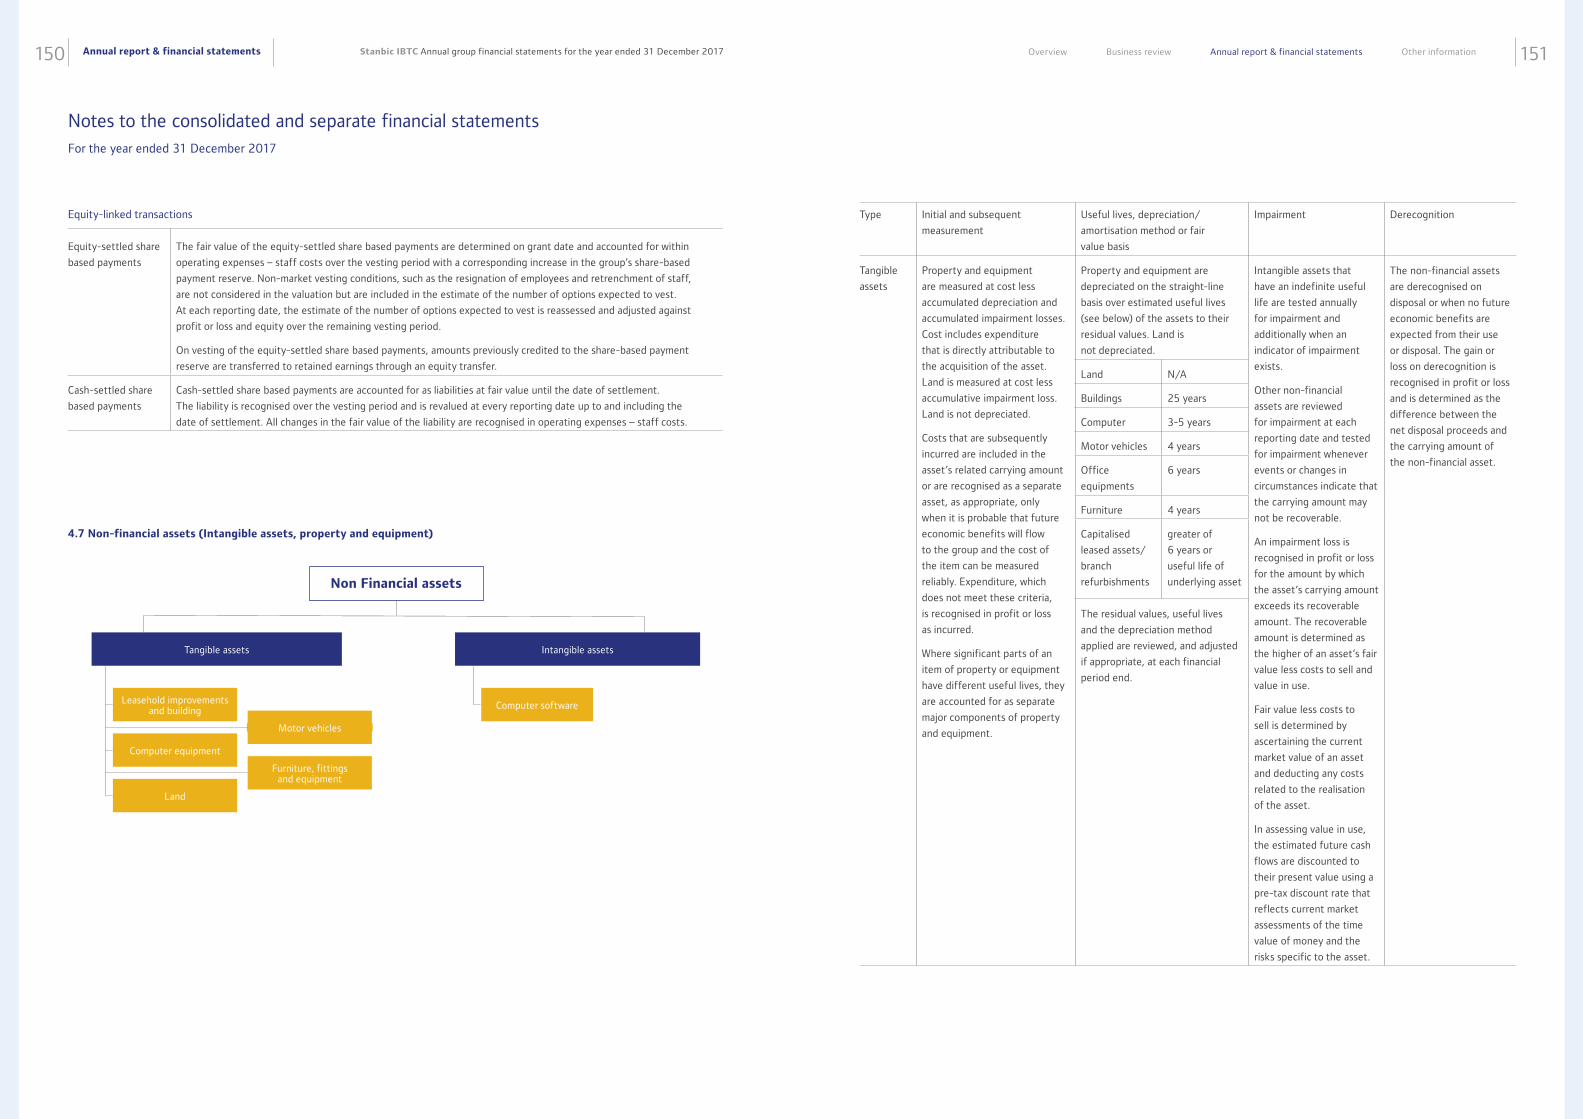
Annual report & financial statements150 151Stanbic IBTC Annual group financial statements for the year ended 31 December 2017 Overview Business review Annual report & financial statements Other information
4.7 Non-financial assets (Intangible assets, property and equipment)
Tangible assets Intangible assets
Non Financial assets
Leasehold improvements and building
Motor vehicles
Computer equipment
Furniture, fittings and equipment
Land
Computer software
Notes to the consolidated and separate financial statements For the year ended 31 December 2017
Equity-linked transactions
Equity-settled share
based payments
The fair value of the equity-settled share based payments are determined on grant date and accounted for within
operating expenses – staff costs over the vesting period with a corresponding increase in the group’s share-based
payment reserve. Non-market vesting conditions, such as the resignation of employees and retrenchment of staff,
are not considered in the valuation but are included in the estimate of the number of options expected to vest.
At each reporting date, the estimate of the number of options expected to vest is reassessed and adjusted against
profit or loss and equity over the remaining vesting period.
On vesting of the equity-settled share based payments, amounts previously credited to the share-based payment
reserve are transferred to retained earnings through an equity transfer.
Cash-settled share
based payments
Cash-settled share based payments are accounted for as liabilities at fair value until the date of settlement.
The liability is recognised over the vesting period and is revalued at every reporting date up to and including the
date of settlement. All changes in the fair value of the liability are recognised in operating expenses – staff costs.
Type Initial and subsequent
measurement
Useful lives, depreciation/
amortisation method or fair
value basis
Impairment Derecognition
Tangible
assets
Property and equipment
are measured at cost less
accumulated depreciation and
accumulated impairment losses.
Cost includes expenditure
that is directly attributable to
the acquisition of the asset.
Land is measured at cost less
accumulative impairment loss.
Land is not depreciated.
Costs that are subsequently
incurred are included in the
asset’s related carrying amount
or are recognised as a separate
asset, as appropriate, only
when it is probable that future
economic benefits will flow
to the group and the cost of
the item can be measured
reliably. Expenditure, which
does not meet these criteria,
is recognised in profit or loss
as incurred.
Where significant parts of an
item of property or equipment
have different useful lives, they
are accounted for as separate
major components of property
and equipment.
Property and equipment are
depreciated on the straight-line
basis over estimated useful lives
(see below) of the assets to their
residual values. Land is
not depreciated.
Intangible assets that
have an indefinite useful
life are tested annually
for impairment and
additionally when an
indicator of impairment
exists.
Other non-financial
assets are reviewed
for impairment at each
reporting date and tested
for impairment whenever
events or changes in
circumstances indicate that
the carrying amount may
not be recoverable.
An impairment loss is
recognised in profit or loss
for the amount by which
the asset’s carrying amount
exceeds its recoverable
amount. The recoverable
amount is determined as
the higher of an asset’s fair
value less costs to sell and
value in use.
Fair value less costs to
sell is determined by
ascertaining the current
market value of an asset
and deducting any costs
related to the realisation
of the asset.
In assessing value in use,
the estimated future cash
flows are discounted to
their present value using a
pre-tax discount rate that
reflects current market
assessments of the time
value of money and the
risks specific to the asset.
The non-financial assets
are derecognised on
disposal or when no future
economic benefits are
expected from their use
or disposal. The gain or
loss on derecognition is
recognised in profit or loss
and is determined as the
difference between the
net disposal proceeds and
the carrying amount of
the non-financial asset.
Land N/A
Buildings 25 years
Computer 3-5 years
Motor vehicles 4 years
Office
equipments
6 years
Furniture 4 years
Capitalised
leased assets/
branch
refurbishments
greater of
6 years or
useful life of
underlying asset
The residual values, useful lives
and the depreciation method
applied are reviewed, and adjusted
if appropriate, at each financial
period end.
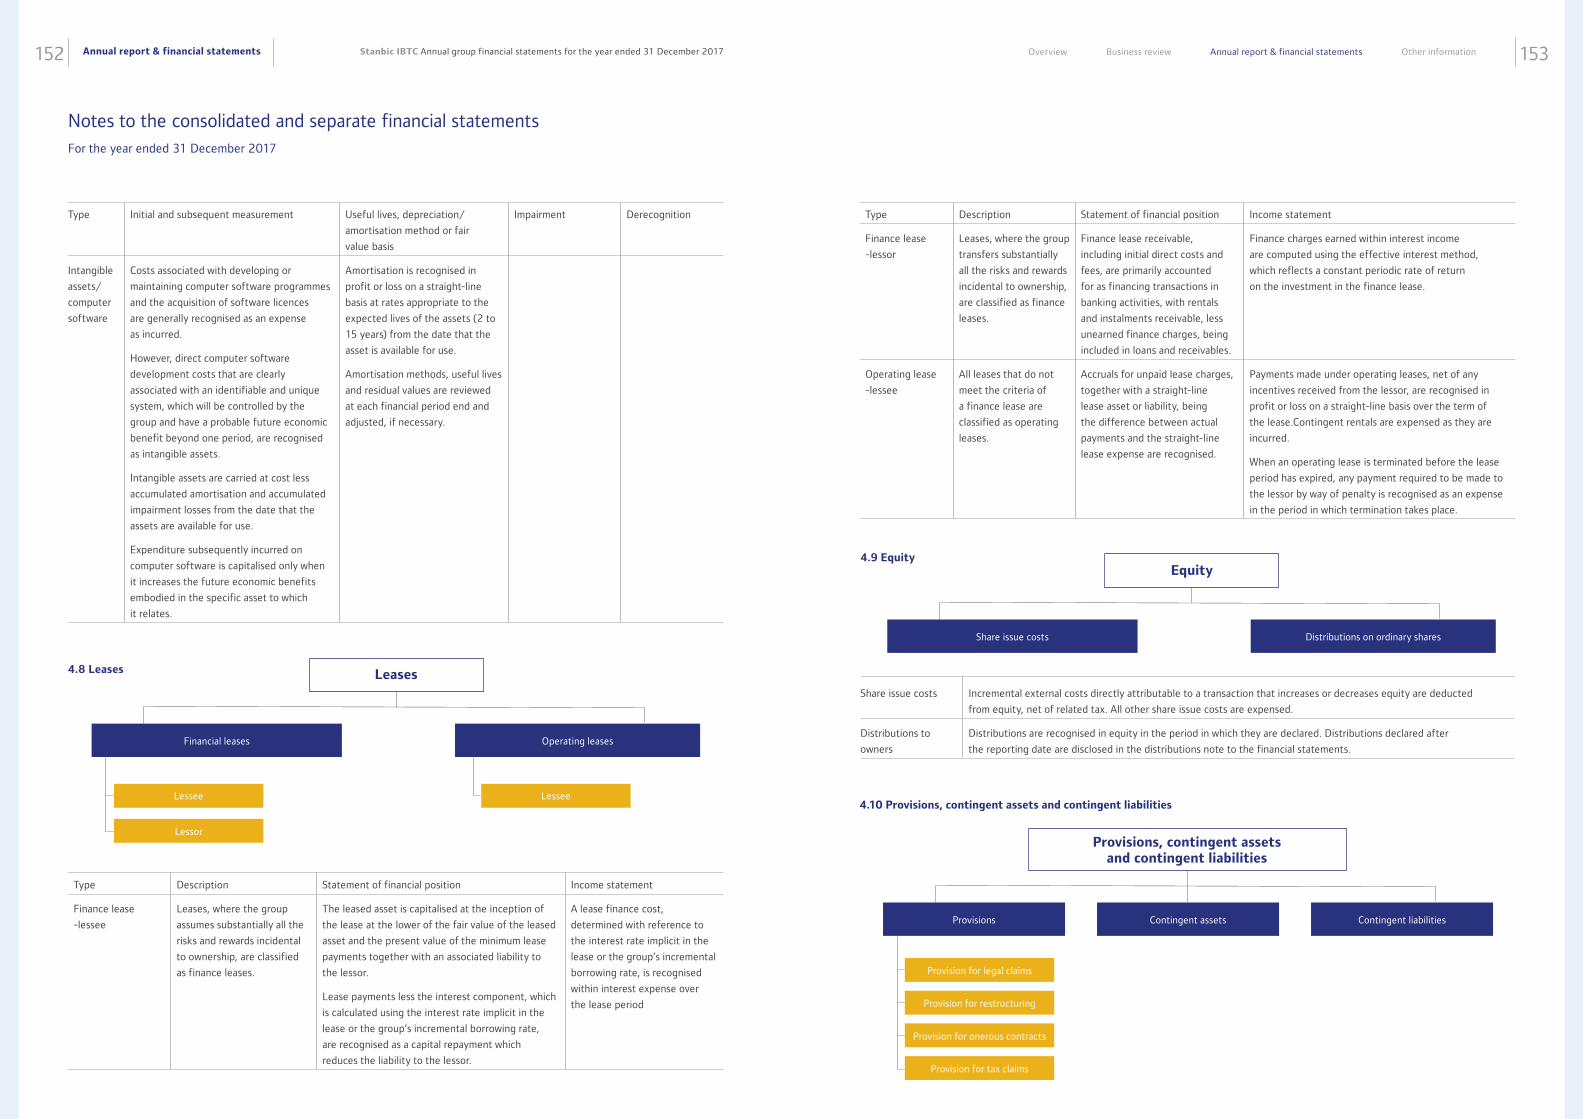
Annual report & financial statements152 153Stanbic IBTC Annual group financial statements for the year ended 31 December 2017 Overview Business review Annual report & financial statements Other information
Type Initial and subsequent measurement Useful lives, depreciation/
amortisation method or fair
value basis
Impairment Derecognition
Intangible
assets/
computer
software
Costs associated with developing or
maintaining computer software programmes
and the acquisition of software licences
are generally recognised as an expense
as incurred.
However, direct computer software
development costs that are clearly
associated with an identifiable and unique
system, which will be controlled by the
group and have a probable future economic
benefit beyond one period, are recognised
as intangible assets.
Intangible assets are carried at cost less
accumulated amortisation and accumulated
impairment losses from the date that the
assets are available for use.
Expenditure subsequently incurred on
computer software is capitalised only when
it increases the future economic benefits
embodied in the specific asset to which
it relates.
Amortisation is recognised in
profit or loss on a straight-line
basis at rates appropriate to the
expected lives of the assets (2 to
15 years) from the date that the
asset is available for use.
Amortisation methods, useful lives
and residual values are reviewed
at each financial period end and
adjusted, if necessary.
Type Description Statement of financial position Income statement
Finance lease
-lessee
Leases, where the group
assumes substantially all the
risks and rewards incidental
to ownership, are classified
as finance leases.
The leased asset is capitalised at the inception of
the lease at the lower of the fair value of the leased
asset and the present value of the minimum lease
payments together with an associated liability to
the lessor.
Lease payments less the interest component, which
is calculated using the interest rate implicit in the
lease or the group’s incremental borrowing rate,
are recognised as a capital repayment which
reduces the liability to the lessor.
A lease finance cost,
determined with reference to
the interest rate implicit in the
lease or the group’s incremental
borrowing rate, is recognised
within interest expense over
the lease period
4.8 Leases
Financial leases Operating leases
Leases
Lessee Lessee
Lessor
Notes to the consolidated and separate financial statements For the year ended 31 December 2017
Type Description Statement of financial position Income statement
Finance lease
-lessor
Leases, where the group
transfers substantially
all the risks and rewards
incidental to ownership,
are classified as finance
leases.
Finance lease receivable,
including initial direct costs and
fees, are primarily accounted
for as financing transactions in
banking activities, with rentals
and instalments receivable, less
unearned finance charges, being
included in loans and receivables.
Finance charges earned within interest income
are computed using the effective interest method,
which reflects a constant periodic rate of return
on the investment in the finance lease.
Operating lease
-lessee
All leases that do not
meet the criteria of
a finance lease are
classified as operating
leases.
Accruals for unpaid lease charges,
together with a straight-line
lease asset or liability, being
the difference between actual
payments and the straight-line
lease expense are recognised.
Payments made under operating leases, net of any
incentives received from the lessor, are recognised in
profit or loss on a straight-line basis over the term of
the lease.Contingent rentals are expensed as they are
incurred.
When an operating lease is terminated before the lease
period has expired, any payment required to be made to
the lessor by way of penalty is recognised as an expense
in the period in which termination takes place.
Share issue costs Incremental external costs directly attributable to a transaction that increases or decreases equity are deducted
from equity, net of related tax. All other share issue costs are expensed.
Distributions to
owners
Distributions are recognised in equity in the period in which they are declared. Distributions declared after
the reporting date are disclosed in the distributions note to the financial statements.
4.9 Equity
Share issue costs Distributions on ordinary shares
Equity
4.10 Provisions, contingent assets and contingent liabilities
Provisions Contingent assets Contingent liabilities
Provisions, contingent assets and contingent liabilities
Provision for legal claims
Provision for restructuring
Provision for onerous contracts
Provision for tax claims
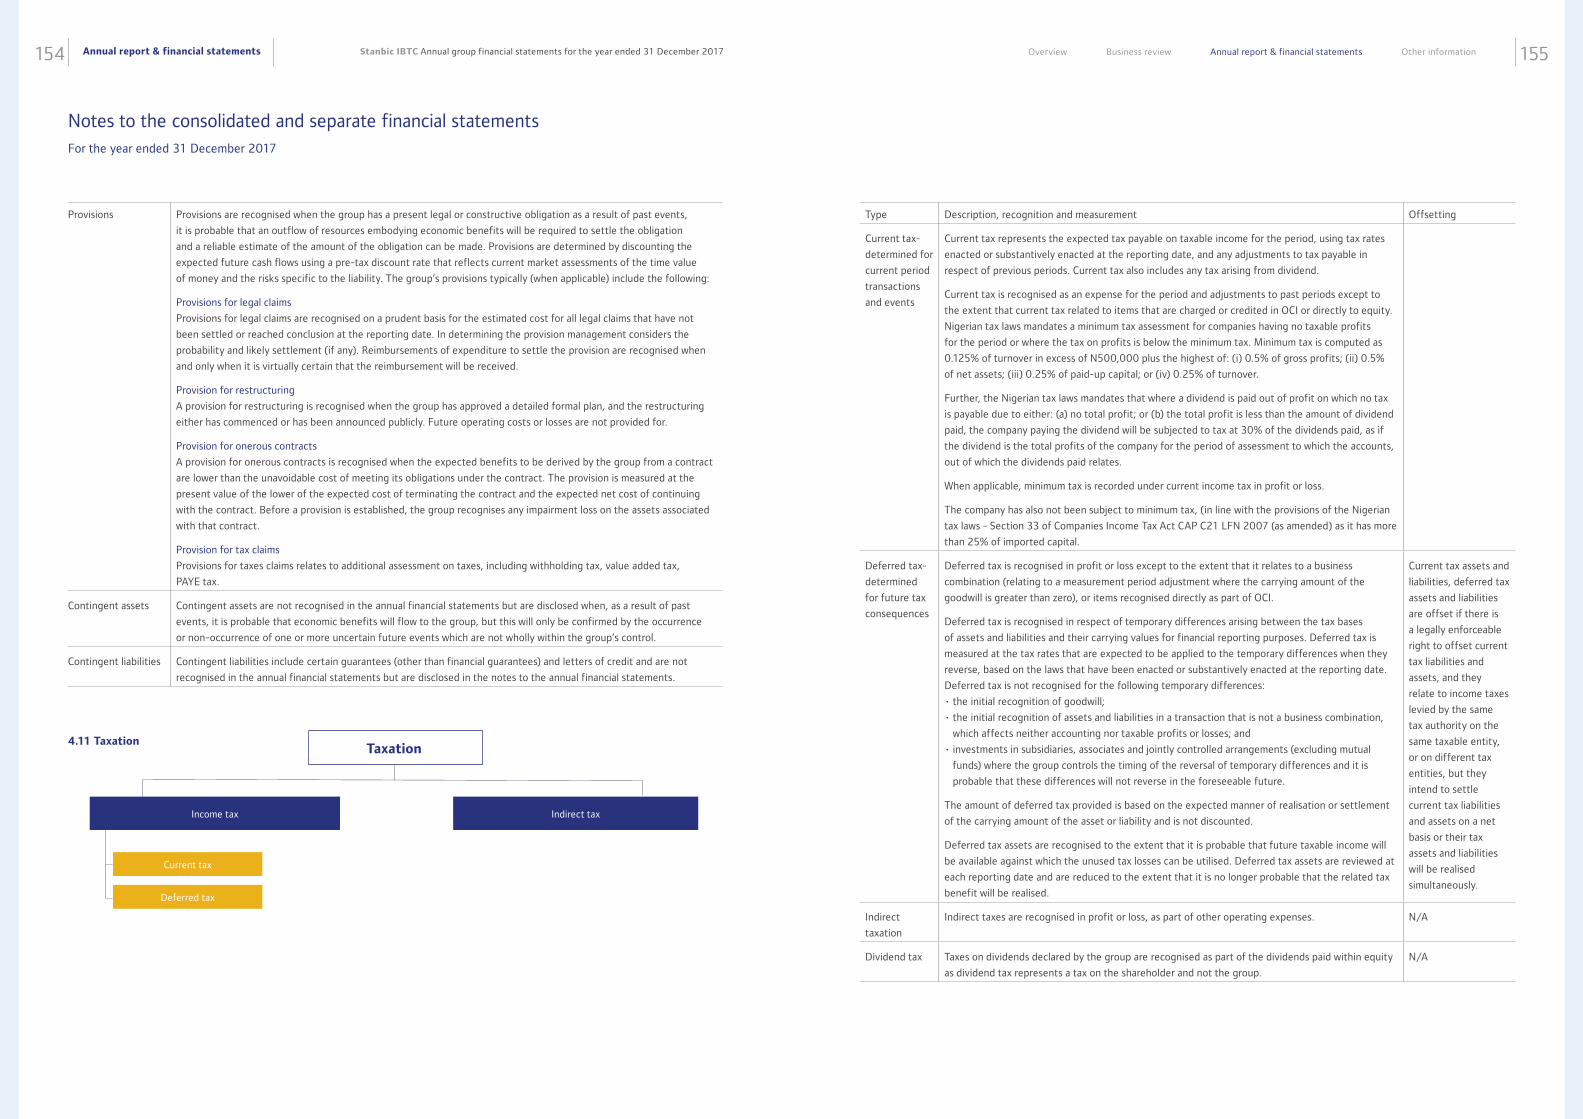
Annual report & financial statements154 155Stanbic IBTC Annual group financial statements for the year ended 31 December 2017 Overview Business review Annual report & financial statements Other information
Provisions Provisions are recognised when the group has a present legal or constructive obligation as a result of past events,
it is probable that an outflow of resources embodying economic benefits will be required to settle the obligation
and a reliable estimate of the amount of the obligation can be made. Provisions are determined by discounting the
expected future cash flows using a pre-tax discount rate that reflects current market assessments of the time value
of money and the risks specific to the liability. The group’s provisions typically (when applicable) include the following:
Provisions for legal claims
Provisions for legal claims are recognised on a prudent basis for the estimated cost for all legal claims that have not
been settled or reached conclusion at the reporting date. In determining the provision management considers the
probability and likely settlement (if any). Reimbursements of expenditure to settle the provision are recognised when
and only when it is virtually certain that the reimbursement will be received.
Provision for restructuring
A provision for restructuring is recognised when the group has approved a detailed formal plan, and the restructuring
either has commenced or has been announced publicly. Future operating costs or losses are not provided for.
Provision for onerous contracts
A provision for onerous contracts is recognised when the expected benefits to be derived by the group from a contract
are lower than the unavoidable cost of meeting its obligations under the contract. The provision is measured at the
present value of the lower of the expected cost of terminating the contract and the expected net cost of continuing
with the contract. Before a provision is established, the group recognises any impairment loss on the assets associated
with that contract.
Provision for tax claims
Provisions for taxes claims relates to additional assessment on taxes, including withholding tax, value added tax,
PAYE tax.
Contingent assets Contingent assets are not recognised in the annual financial statements but are disclosed when, as a result of past
events, it is probable that economic benefits will flow to the group, but this will only be confirmed by the occurrence
or non-occurrence of one or more uncertain future events which are not wholly within the group’s control.
Contingent liabilities Contingent liabilities include certain guarantees (other than financial guarantees) and letters of credit and are not
recognised in the annual financial statements but are disclosed in the notes to the annual financial statements.
4.11 TaxationTaxation
Current tax
Deferred tax
Income tax Indirect tax
Notes to the consolidated and separate financial statements For the year ended 31 December 2017
Type Description, recognition and measurement Offsetting
Current tax-
determined for
current period
transactions
and events
Current tax represents the expected tax payable on taxable income for the period, using tax rates
enacted or substantively enacted at the reporting date, and any adjustments to tax payable in
respect of previous periods. Current tax also includes any tax arising from dividend.
Current tax is recognised as an expense for the period and adjustments to past periods except to
the extent that current tax related to items that are charged or credited in OCI or directly to equity.
Nigerian tax laws mandates a minimum tax assessment for companies having no taxable profits
for the period or where the tax on profits is below the minimum tax. Minimum tax is computed as
0.125% of turnover in excess of N500,000 plus the highest of: (i) 0.5% of gross profits; (ii) 0.5%
of net assets; (iii) 0.25% of paid-up capital; or (iv) 0.25% of turnover.
Further, the Nigerian tax laws mandates that where a dividend is paid out of profit on which no tax
is payable due to either: (a) no total profit; or (b) the total profit is less than the amount of dividend
paid, the company paying the dividend will be subjected to tax at 30% of the dividends paid, as if
the dividend is the total profits of the company for the period of assessment to which the accounts,
out of which the dividends paid relates.
When applicable, minimum tax is recorded under current income tax in profit or loss.
The company has also not been subject to minimum tax, (in line with the provisions of the Nigerian
tax laws - Section 33 of Companies Income Tax Act CAP C21 LFN 2007 (as amended) as it has more
than 25% of imported capital.
Deferred tax-
determined
for future tax
consequences
Deferred tax is recognised in profit or loss except to the extent that it relates to a business
combination (relating to a measurement period adjustment where the carrying amount of the
goodwill is greater than zero), or items recognised directly as part of OCI.
Deferred tax is recognised in respect of temporary differences arising between the tax bases
of assets and liabilities and their carrying values for financial reporting purposes. Deferred tax is
measured at the tax rates that are expected to be applied to the temporary differences when they
reverse, based on the laws that have been enacted or substantively enacted at the reporting date.
Deferred tax is not recognised for the following temporary differences:
• the initial recognition of goodwill;
• the initial recognition of assets and liabilities in a transaction that is not a business combination,
which affects neither accounting nor taxable profits or losses; and
• investments in subsidiaries, associates and jointly controlled arrangements (excluding mutual
funds) where the group controls the timing of the reversal of temporary differences and it is
probable that these differences will not reverse in the foreseeable future.
The amount of deferred tax provided is based on the expected manner of realisation or settlement
of the carrying amount of the asset or liability and is not discounted.
Deferred tax assets are recognised to the extent that it is probable that future taxable income will
be available against which the unused tax losses can be utilised. Deferred tax assets are reviewed at
each reporting date and are reduced to the extent that it is no longer probable that the related tax
benefit will be realised.
Current tax assets and
liabilities, deferred tax
assets and liabilities
are offset if there is
a legally enforceable
right to offset current
tax liabilities and
assets, and they
relate to income taxes
levied by the same
tax authority on the
same taxable entity,
or on different tax
entities, but they
intend to settle
current tax liabilities
and assets on a net
basis or their tax
assets and liabilities
will be realised
simultaneously.
Indirect
taxation
Indirect taxes are recognised in profit or loss, as part of other operating expenses. N/A
Dividend tax Taxes on dividends declared by the group are recognised as part of the dividends paid within equity
as dividend tax represents a tax on the shareholder and not the group.
N/A
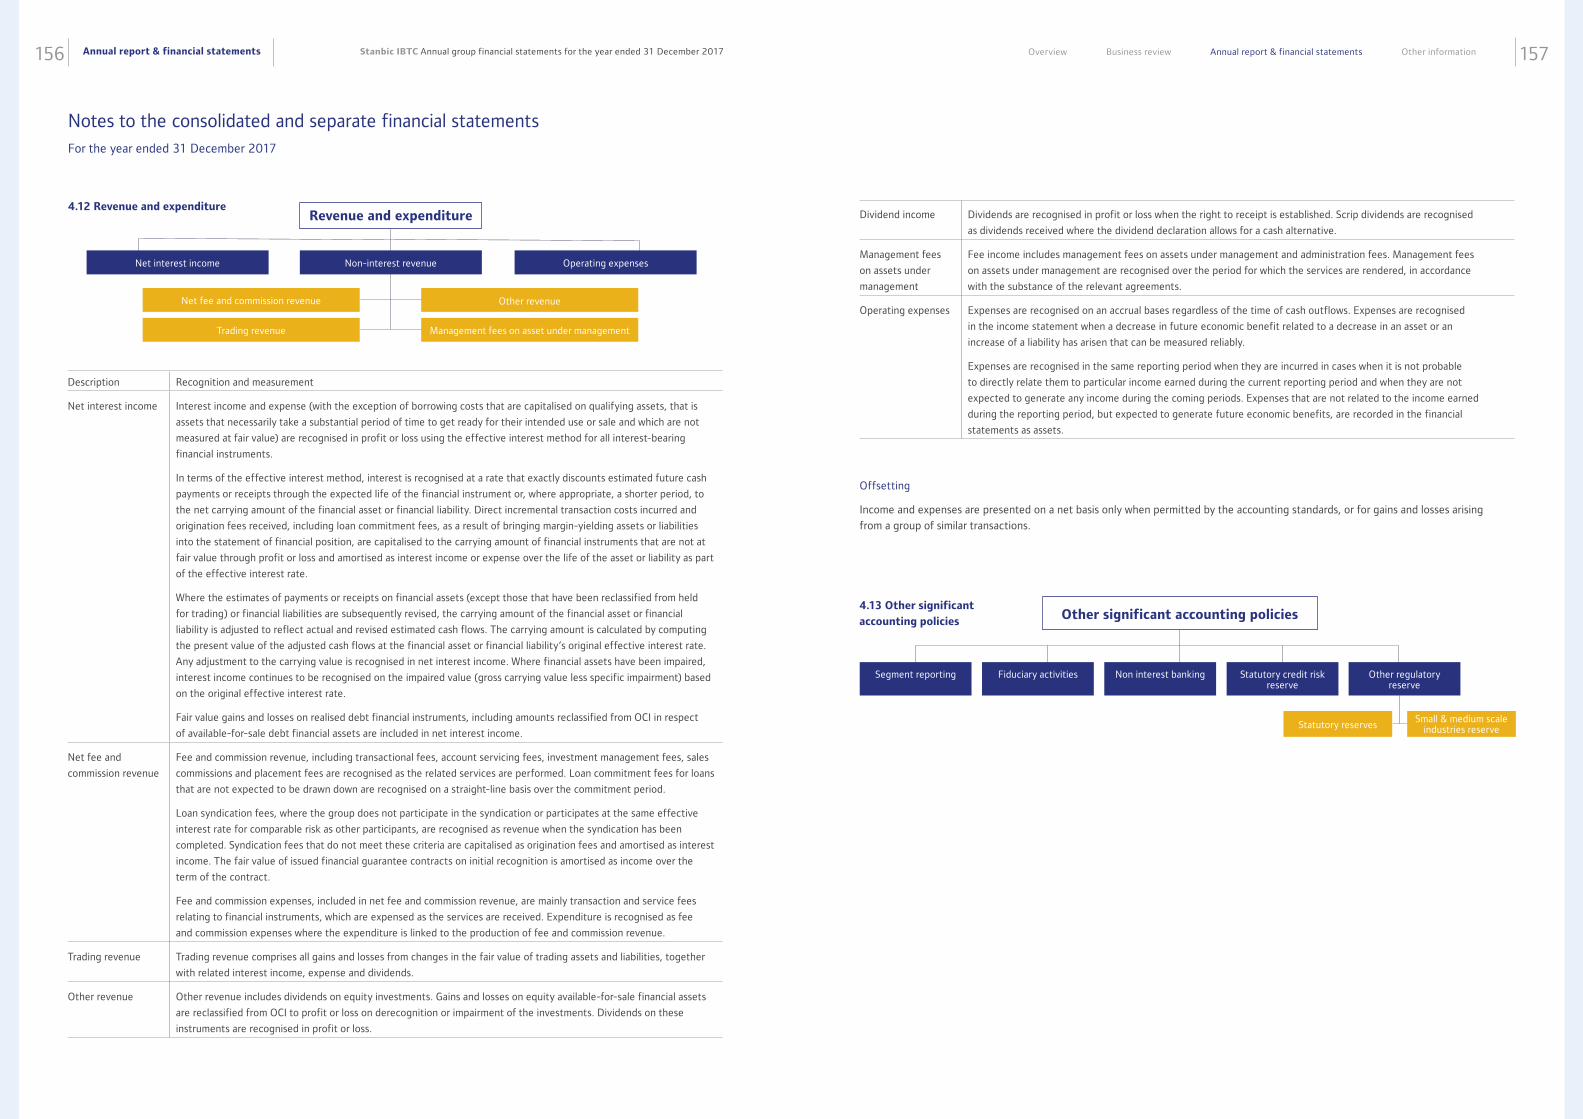
Annual report & financial statements156 157Stanbic IBTC Annual group financial statements for the year ended 31 December 2017 Overview Business review Annual report & financial statements Other information
Description Recognition and measurement
Net interest income Interest income and expense (with the exception of borrowing costs that are capitalised on qualifying assets, that is
assets that necessarily take a substantial period of time to get ready for their intended use or sale and which are not
measured at fair value) are recognised in profit or loss using the effective interest method for all interest-bearing
financial instruments.
In terms of the effective interest method, interest is recognised at a rate that exactly discounts estimated future cash
payments or receipts through the expected life of the financial instrument or, where appropriate, a shorter period, to
the net carrying amount of the financial asset or financial liability. Direct incremental transaction costs incurred and
origination fees received, including loan commitment fees, as a result of bringing margin-yielding assets or liabilities
into the statement of financial position, are capitalised to the carrying amount of financial instruments that are not at
fair value through profit or loss and amortised as interest income or expense over the life of the asset or liability as part
of the effective interest rate.
Where the estimates of payments or receipts on financial assets (except those that have been reclassified from held
for trading) or financial liabilities are subsequently revised, the carrying amount of the financial asset or financial
liability is adjusted to reflect actual and revised estimated cash flows. The carrying amount is calculated by computing
the present value of the adjusted cash flows at the financial asset or financial liability’s original effective interest rate.
Any adjustment to the carrying value is recognised in net interest income. Where financial assets have been impaired,
interest income continues to be recognised on the impaired value (gross carrying value less specific impairment) based
on the original effective interest rate.
Fair value gains and losses on realised debt financial instruments, including amounts reclassified from OCI in respect
of available-for-sale debt financial assets are included in net interest income.
Net fee and
commission revenue
Fee and commission revenue, including transactional fees, account servicing fees, investment management fees, sales
commissions and placement fees are recognised as the related services are performed. Loan commitment fees for loans
that are not expected to be drawn down are recognised on a straight-line basis over the commitment period.
Loan syndication fees, where the group does not participate in the syndication or participates at the same effective
interest rate for comparable risk as other participants, are recognised as revenue when the syndication has been
completed. Syndication fees that do not meet these criteria are capitalised as origination fees and amortised as interest
income. The fair value of issued financial guarantee contracts on initial recognition is amortised as income over the
term of the contract.
Fee and commission expenses, included in net fee and commission revenue, are mainly transaction and service fees
relating to financial instruments, which are expensed as the services are received. Expenditure is recognised as fee
and commission expenses where the expenditure is linked to the production of fee and commission revenue.
Trading revenue Trading revenue comprises all gains and losses from changes in the fair value of trading assets and liabilities, together
with related interest income, expense and dividends.
Other revenue Other revenue includes dividends on equity investments. Gains and losses on equity available-for-sale financial assets
are reclassified from OCI to profit or loss on derecognition or impairment of the investments. Dividends on these
instruments are recognised in profit or loss.
4.12 Revenue and expenditureRevenue and expenditure
Net fee and commission revenue
Trading revenue
Other revenue
Management fees on asset under management
Net interest income Non-interest revenue Operating expenses
Notes to the consolidated and separate financial statements For the year ended 31 December 2017
Offsetting
Income and expenses are presented on a net basis only when permitted by the accounting standards, or for gains and losses arising
from a group of similar transactions.
Dividend income Dividends are recognised in profit or loss when the right to receipt is established. Scrip dividends are recognised
as dividends received where the dividend declaration allows for a cash alternative.
Management fees
on assets under
management
Fee income includes management fees on assets under management and administration fees. Management fees
on assets under management are recognised over the period for which the services are rendered, in accordance
with the substance of the relevant agreements.
Operating expenses Expenses are recognised on an accrual bases regardless of the time of cash outflows. Expenses are recognised
in the income statement when a decrease in future economic benefit related to a decrease in an asset or an
increase of a liability has arisen that can be measured reliably.
Expenses are recognised in the same reporting period when they are incurred in cases when it is not probable
to directly relate them to particular income earned during the current reporting period and when they are not
expected to generate any income during the coming periods. Expenses that are not related to the income earned
during the reporting period, but expected to generate future economic benefits, are recorded in the financial
statements as assets.
4.13 Other significant
accounting policies
Segment reporting Fiduciary activities Non interest banking Statutory credit risk reserve
Other regulatory reserve
Other significant accounting policies
Statutory reservesSmall & medium scale
industries reserve
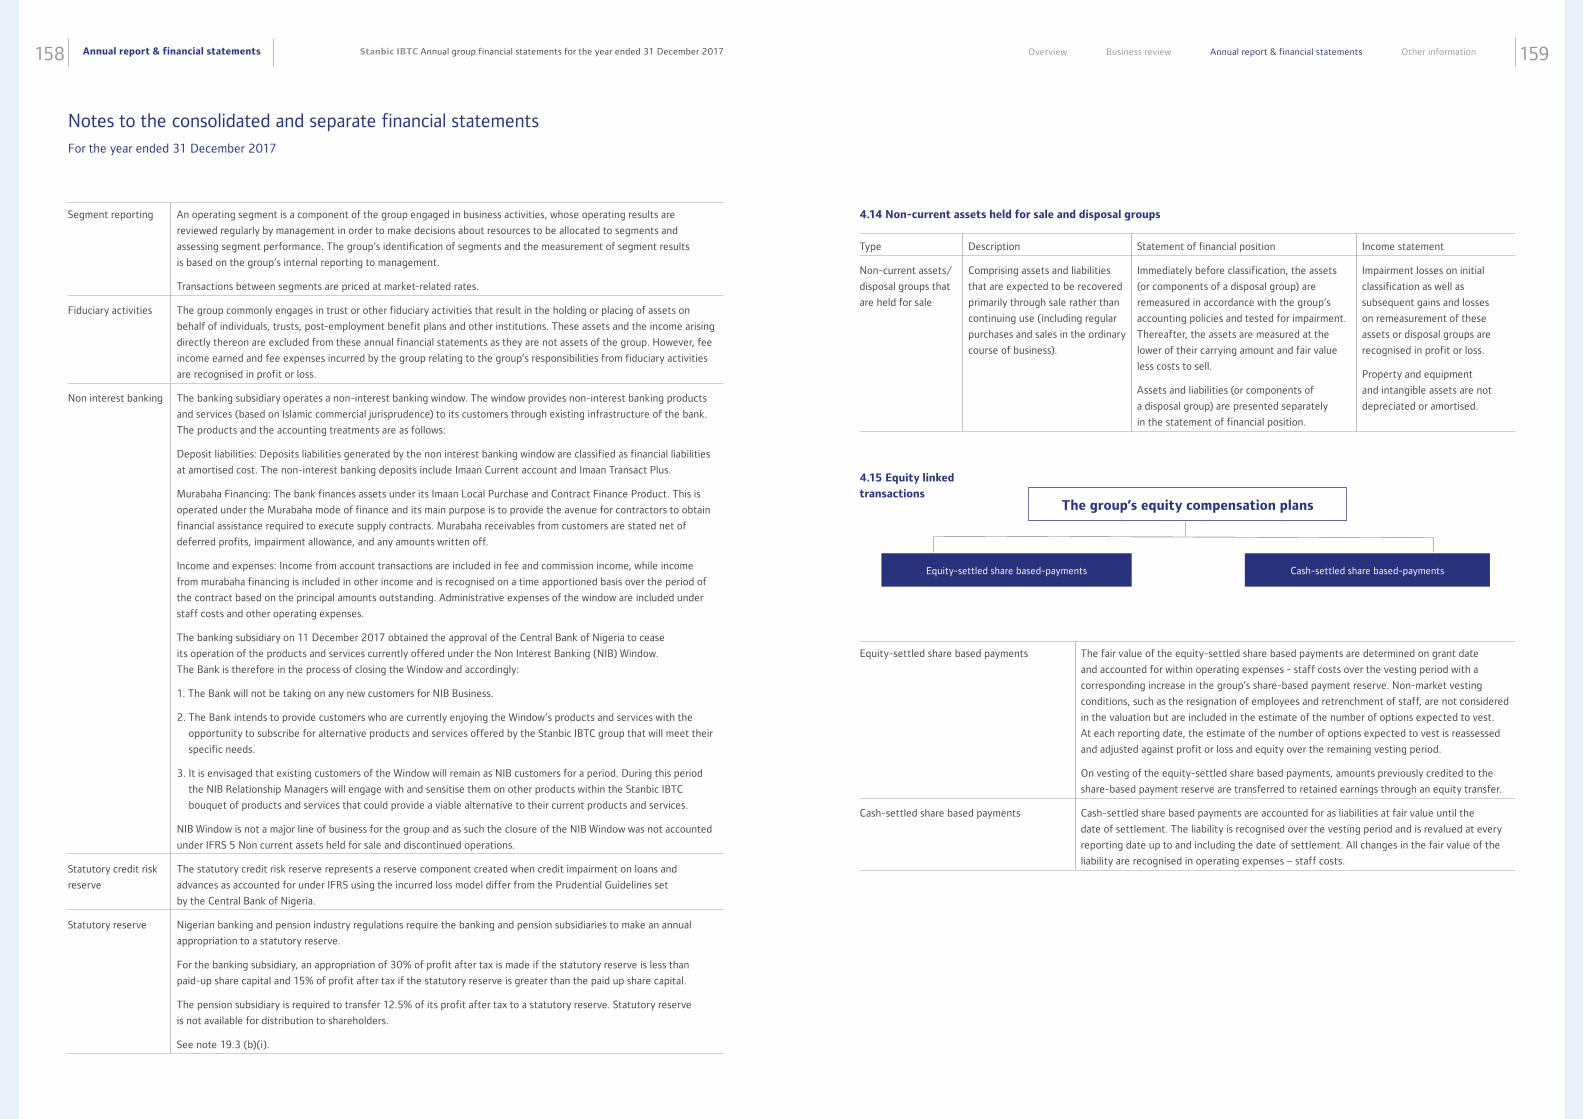
Annual report & financial statements158 159Stanbic IBTC Annual group financial statements for the year ended 31 December 2017 Overview Business review Annual report & financial statements Other information
Segment reporting An operating segment is a component of the group engaged in business activities, whose operating results are
reviewed regularly by management in order to make decisions about resources to be allocated to segments and
assessing segment performance. The group’s identification of segments and the measurement of segment results
is based on the group’s internal reporting to management.
Transactions between segments are priced at market-related rates.
Fiduciary activities The group commonly engages in trust or other fiduciary activities that result in the holding or placing of assets on
behalf of individuals, trusts, post-employment benefit plans and other institutions. These assets and the income arising
directly thereon are excluded from these annual financial statements as they are not assets of the group. However, fee
income earned and fee expenses incurred by the group relating to the group’s responsibilities from fiduciary activities
are recognised in profit or loss.
Non interest banking The banking subsidiary operates a non-interest banking window. The window provides non-interest banking products
and services (based on Islamic commercial jurisprudence) to its customers through existing infrastructure of the bank.
The products and the accounting treatments are as follows:
Deposit liabilities: Deposits liabilities generated by the non interest banking window are classified as financial liabilities
at amortised cost. The non-interest banking deposits include Imaan Current account and Imaan Transact Plus.
Murabaha Financing: The bank finances assets under its Imaan Local Purchase and Contract Finance Product. This is
operated under the Murabaha mode of finance and its main purpose is to provide the avenue for contractors to obtain
financial assistance required to execute supply contracts. Murabaha receivables from customers are stated net of
deferred profits, impairment allowance, and any amounts written off.
Income and expenses: Income from account transactions are included in fee and commission income, while income
from murabaha financing is included in other income and is recognised on a time apportioned basis over the period of
the contract based on the principal amounts outstanding. Administrative expenses of the window are included under
staff costs and other operating expenses.
The banking subsidiary on 11 December 2017 obtained the approval of the Central Bank of Nigeria to cease
its operation of the products and services currently offered under the Non Interest Banking (NIB) Window.
The Bank is therefore in the process of closing the Window and accordingly:
1. The Bank will not be taking on any new customers for NIB Business.
2. The Bank intends to provide customers who are currently enjoying the Window’s products and services with the
opportunity to subscribe for alternative products and services offered by the Stanbic IBTC group that will meet their
specific needs.
3. It is envisaged that existing customers of the Window will remain as NIB customers for a period. During this period
the NIB Relationship Managers will engage with and sensitise them on other products within the Stanbic IBTC
bouquet of products and services that could provide a viable alternative to their current products and services.
NIB Window is not a major line of business for the group and as such the closure of the NIB Window was not accounted
under IFRS 5 Non current assets held for sale and discontinued operations.
Statutory credit risk
reserve
The statutory credit risk reserve represents a reserve component created when credit impairment on loans and
advances as accounted for under IFRS using the incurred loss model differ from the Prudential Guidelines set
by the Central Bank of Nigeria.
Statutory reserve Nigerian banking and pension industry regulations require the banking and pension subsidiaries to make an annual
appropriation to a statutory reserve.
For the banking subsidiary, an appropriation of 30% of profit after tax is made if the statutory reserve is less than
paid-up share capital and 15% of profit after tax if the statutory reserve is greater than the paid up share capital.
The pension subsidiary is required to transfer 12.5% of its profit after tax to a statutory reserve. Statutory reserve
is not available for distribution to shareholders.
See note 19.3 (b)(i).
Notes to the consolidated and separate financial statements For the year ended 31 December 2017
4.14 Non-current assets held for sale and disposal groups
4.15 Equity linked
transactions
Type Description Statement of financial position Income statement
Non-current assets/
disposal groups that
are held for sale
Comprising assets and liabilities
that are expected to be recovered
primarily through sale rather than
continuing use (including regular
purchases and sales in the ordinary
course of business).
Immediately before classification, the assets
(or components of a disposal group) are
remeasured in accordance with the group’s
accounting policies and tested for impairment.
Thereafter, the assets are measured at the
lower of their carrying amount and fair value
less costs to sell.
Assets and liabilities (or components of
a disposal group) are presented separately
in the statement of financial position.
Impairment losses on initial
classification as well as
subsequent gains and losses
on remeasurement of these
assets or disposal groups are
recognised in profit or loss.
Property and equipment
and intangible assets are not
depreciated or amortised.
Equity-settled share based payments The fair value of the equity-settled share based payments are determined on grant date
and accounted for within operating expenses - staff costs over the vesting period with a
corresponding increase in the group’s share-based payment reserve. Non-market vesting
conditions, such as the resignation of employees and retrenchment of staff, are not considered
in the valuation but are included in the estimate of the number of options expected to vest.
At each reporting date, the estimate of the number of options expected to vest is reassessed
and adjusted against profit or loss and equity over the remaining vesting period.
On vesting of the equity-settled share based payments, amounts previously credited to the
share-based payment reserve are transferred to retained earnings through an equity transfer.
Cash-settled share based payments Cash-settled share based payments are accounted for as liabilities at fair value until the
date of settlement. The liability is recognised over the vesting period and is revalued at every
reporting date up to and including the date of settlement. All changes in the fair value of the
liability are recognised in operating expenses – staff costs.
The group’s equity compensation plans
Equity-settled share based-payments Cash-settled share based-payments
Annual report & financial statements160 161Stanbic IBTC Annual group financial statements for the year ended 31 December 2017 Overview Business review Annual report & financial statements Other information
4.16 New standards and interpretations not yet effective
The following new or revised standards, amendments and interpretations are not yet effective for the year ended 31 December 2017
and have not been applied in preparing these annual financial statements.
Notes to the consolidated and separate financial statements For the year ended 31 December 2017
Pronouncement
Title IFRS 9 Financial Instruments
Background
IFRS 9 Financial Instruments (“IFRS 9”) will replace the existing standard dealing with the accounting treatment for financial
instruments IAS 39 Financial Instruments: Recognition and Measurement (“IAS 39”) from 1 January 2018.
IFRS 9 consists of the following key areas which represent changes from that of IAS 39:
• Revised requirements for the classification and measurement of financial assets and consequential changes in the
classification and measurement of financial liabilities, mainly relating to the recognition of changes in fair value due
to changes in own credit risk on fair value designated financial liabilities in OCI as opposed to the income statement.
• An expected credit loss (“ECL”) impairment model.
• Revised requirements and simplifications for hedge accounting.
IFRS 9 is required to be adopted retrospectively from 1 January 2018, with the exception of IFRS 9’s hedge accounting
requirements where the standard permits an entity to choose as its accounting policy to continue to apply with IAS 39
hedge accounting requirements instead of the requirements in Chapter 6 of IFRS 9.
The group has elected to not restate its comparative financial statements. Accordingly, the difference between the previous
IAS 39 and new IFRS 9 carrying values will be recognised in the group’s opening retained earnings as at 1 January 2018.
IFRS 9 requirements
The following is a summary of IFRS 9’s key requirements and the estimated impact on the group (it should be noted that
the group’s final transition impact was, at the time of the preparation of these financial statements, being determined.
Accordingly, the estimated impact set out below, may change as a result of changes in the group’s size and nature of its
assets and liabilities as well as changes in the risk rating and expected loss input variables (including forward looking
macroeconomic factors) of its assets):
Classification of financial assets and liabilities
IFRS 9 requires all financial assets to be classified and measured on the basis of the entity’s business model for managing the
financial assets and its contractual cash flow characteristics.
The accounting for financial assets differs in various other areas to existing requirements such as embedded derivatives and
the recognition of fair value adjustments in OCI.
All changes in the fair value of financial liabilities that are designated at fair value through profit or loss due to changes in own
credit risk will be required to be recognised in OCI with no subsequent recognition in the income statement.
Whilst IFRS 9’s classification and measurement requirements are expected to have a negligible net impact on the group’s
reserves as at 1 January 2018, there were instances in which the classification and measurement of financial assets changed
from fair value to amortised cost. There was no impact on the group’s reserve in respect of classification requirements for
financial liabilities IFRS 9 largely retains the existing requirements in IAS 39 for the classification of financial liabilities.
Pronouncement
Title IFRS 9 Financial Instruments (continued)
Expected credit loss (ECL) impairment model
IFRS 9’s ECL impairment model’s requirements will represent the most material IFRS 9 impact.
The IASB developed the IFRS 9 ECL impairment model with the objective of transitioning from an incurred loss approach to
an expected loss model which will require entities to recognise impairment losses in advance of an exposure having objective
evidence of impairment. The ECL model will apply to financial assets measured at either amortised cost or at fair value through
OCI, as well as loan commitments when there is present commitment to extend credit (unless these are measured at fair value
through profit or loss).
With the exception of purchased or originated credit impaired financial assets, expected credit losses are required to be
measured through a loss allowance at an amount equal to either 12-month expected credit losses or full lifetime expected
credit losses. A loss allowance for full lifetime expected credit losses is recognised for a financial asset where the credit risk of
that financial asset increased significantly since initial recognition (unless the financial asset is exposed to a low level of credit
risk) as well as for certain contract assets and trade receivables or where the exposure is classified as in default. For all other
financial instruments, expected credit losses are measured at an amount equal to 12-month expected credit losses.
Significant increase in credit risk or low credit risk
The assessment of significant increase in credit risk for the group’s PBB exposures will be based on changes in a customer’s
credit score and for the group’s CIB exposures on changes in internal credit ratings, together with the expected outlook for
the specific sector and industry and other relevant available information. For both the group’s PBB and CIB exposures, the
determination will be set to identify significant deterioration in credit risk before the exposure reaches a past due status of
30 days. Exposures for which there is a significant increase in credit risk but for which the credit risk is low remain in stage
one. Exposures are generally considered to have a low credit risk where there is a low risk of default, the exposure has a strong
capacity to meet its contractual cash flow obligations and adverse changes in economic and business conditions are unlikely
to reduce the exposure’s ability to fulfil its contractual obligations.
Forward-looking information
In determining whether there has been a significant increase in credit risk and in determining the expected credit loss
calculation, IFRS 9 requires the consideration of forward-looking information. The determination of significant increase
in credit risk is required to include consideration of all reasonable and supportable information available without undue
cost or effort. This information will typically include forward-looking information based on expected macro-economic
conditions and specific factors that are expected to impact individual portfolios.
The incorporation of forward-looking information represents a significant change from existing accounting requirements which
are based on observable events. The use of such forward-looking information will increase the use of management judgement
and is expected to increase the volatility of impairment provisions as a result of continuous changes in future expectations. The
forward-looking framework will be based on the group’s economic expectations, industry and sub-sector-specific expectations,
as well as expert management judgement.
Default
While default is not specifically defined by IFRS 9, the group has aligned the determination of default with its existing internal
credit risk management definitions and approaches. Default is determined as occurring at the earlier of:
• when either, based on objective evidence, the counterparty is considered to be unlikely to pay amounts due on the due date
or shortly thereafter without recourse to actions such as realisation of security; or
• when the counterparty is past due for more than 90 days (or, in the case of overdraft facilities in excess of the current limit).
In some cases, additional specific criteria are set according to the nature of the lending product.
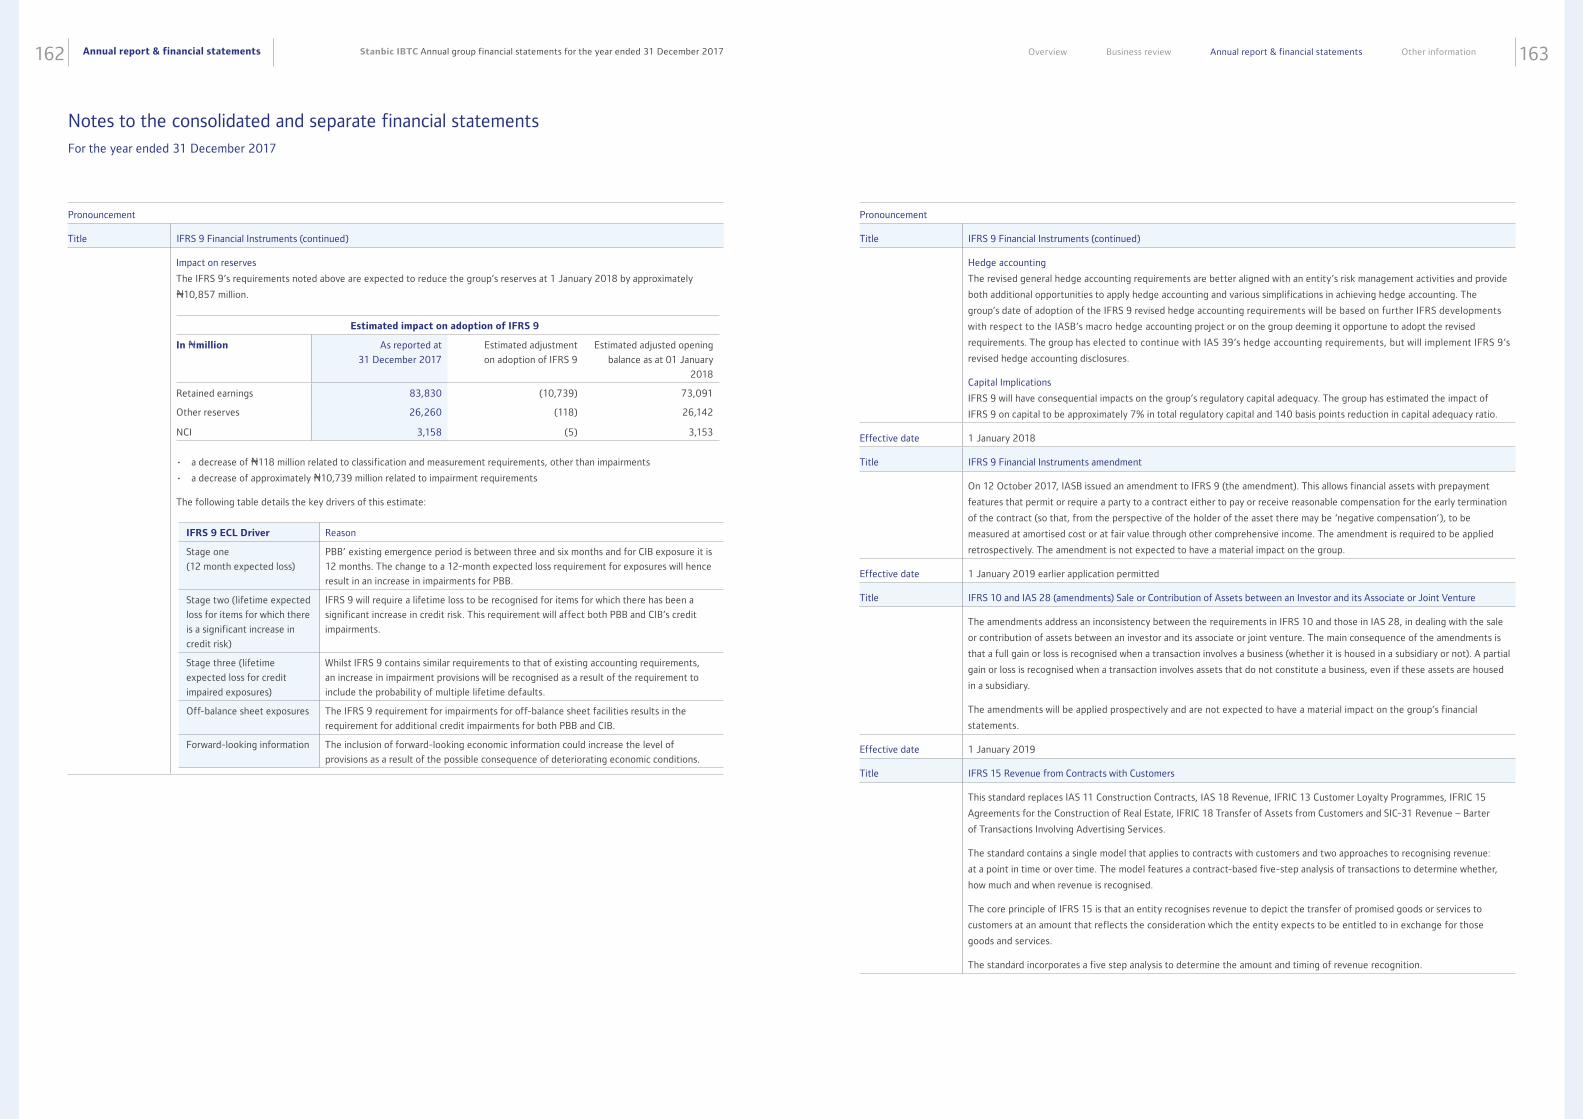
Annual report & financial statements162 163Stanbic IBTC Annual group financial statements for the year ended 31 December 2017 Overview Business review Annual report & financial statements Other information
Notes to the consolidated and separate financial statements For the year ended 31 December 2017
Pronouncement
Title IFRS 9 Financial Instruments (continued)
Impact on reserves
The IFRS 9’s requirements noted above are expected to reduce the group’s reserves at 1 January 2018 by approximately
N10,857 million.
• a decrease of N118 million related to classification and measurement requirements, other than impairments
• a decrease of approximately N10,739 million related to impairment requirements
The following table details the key drivers of this estimate:
Estimated impact on adoption of IFRS 9
In Nmillion As reported at
31 December 2017
Estimated adjustment
on adoption of IFRS 9
Estimated adjusted opening
balance as at 01 January
2018
Retained earnings 83,830 (10,739) 73,091
Other reserves 26,260 (118) 26,142
NCI 3,158 (5) 3,153
IFRS 9 ECL Driver Reason
Stage one
(12 month expected loss)
PBB’ existing emergence period is between three and six months and for CIB exposure it is
12 months. The change to a 12-month expected loss requirement for exposures will hence
result in an increase in impairments for PBB.
Stage two (lifetime expected
loss for items for which there
is a significant increase in
credit risk)
IFRS 9 will require a lifetime loss to be recognised for items for which there has been a
significant increase in credit risk. This requirement will affect both PBB and CIB’s credit
impairments.
Stage three (lifetime
expected loss for credit
impaired exposures)
Whilst IFRS 9 contains similar requirements to that of existing accounting requirements,
an increase in impairment provisions will be recognised as a result of the requirement to
include the probability of multiple lifetime defaults.
Off-balance sheet exposures The IFRS 9 requirement for impairments for off-balance sheet facilities results in the
requirement for additional credit impairments for both PBB and CIB.
Forward-looking information The inclusion of forward-looking economic information could increase the level of
provisions as a result of the possible consequence of deteriorating economic conditions.
Pronouncement
Title IFRS 9 Financial Instruments (continued)
Hedge accounting
The revised general hedge accounting requirements are better aligned with an entity’s risk management activities and provide
both additional opportunities to apply hedge accounting and various simplifications in achieving hedge accounting. The
group’s date of adoption of the IFRS 9 revised hedge accounting requirements will be based on further IFRS developments
with respect to the IASB’s macro hedge accounting project or on the group deeming it opportune to adopt the revised
requirements. The group has elected to continue with IAS 39’s hedge accounting requirements, but will implement IFRS 9’s
revised hedge accounting disclosures.
Capital Implications
IFRS 9 will have consequential impacts on the group’s regulatory capital adequacy. The group has estimated the impact of
IFRS 9 on capital to be approximately 7% in total regulatory capital and 140 basis points reduction in capital adequacy ratio.
Effective date 1 January 2018
Title IFRS 9 Financial Instruments amendment
On 12 October 2017, IASB issued an amendment to IFRS 9 (the amendment). This allows financial assets with prepayment
features that permit or require a party to a contract either to pay or receive reasonable compensation for the early termination
of the contract (so that, from the perspective of the holder of the asset there may be ‘negative compensation’), to be
measured at amortised cost or at fair value through other comprehensive income. The amendment is required to be applied
retrospectively. The amendment is not expected to have a material impact on the group.
Effective date 1 January 2019 earlier application permitted
Title IFRS 10 and IAS 28 (amendments) Sale or Contribution of Assets between an Investor and its Associate or Joint Venture
The amendments address an inconsistency between the requirements in IFRS 10 and those in IAS 28, in dealing with the sale
or contribution of assets between an investor and its associate or joint venture. The main consequence of the amendments is
that a full gain or loss is recognised when a transaction involves a business (whether it is housed in a subsidiary or not). A partial
gain or loss is recognised when a transaction involves assets that do not constitute a business, even if these assets are housed
in a subsidiary.
The amendments will be applied prospectively and are not expected to have a material impact on the group’s financial
statements.
Effective date 1 January 2019
Title IFRS 15 Revenue from Contracts with Customers
This standard replaces IAS 11 Construction Contracts, IAS 18 Revenue, IFRIC 13 Customer Loyalty Programmes, IFRIC 15
Agreements for the Construction of Real Estate, IFRIC 18 Transfer of Assets from Customers and SIC-31 Revenue – Barter
of Transactions Involving Advertising Services.
The standard contains a single model that applies to contracts with customers and two approaches to recognising revenue:
at a point in time or over time. The model features a contract-based five-step analysis of transactions to determine whether,
how much and when revenue is recognised.
The core principle of IFRS 15 is that an entity recognises revenue to depict the transfer of promised goods or services to
customers at an amount that reflects the consideration which the entity expects to be entitled to in exchange for those
goods and services.
The standard incorporates a five step analysis to determine the amount and timing of revenue recognition.
Annual report & financial statements164 165Stanbic IBTC Annual group financial statements for the year ended 31 December 2017 Overview Business review Annual report & financial statements Other information
Notes to the consolidated and separate financial statements For the year ended 31 December 2017
Pronouncement
Title IFRS 15 Revenue from Contracts with Customers (continued)
The group has analysed the nature of its fees as follows:
i) Bank transaction fees: This includes electronic banking charges, account transaction fee, custody fees among others. There
will be no changes to the current account treatment of these fees.
ii) Asset management fee: Fee is based on daily net asset of the fund or performance of the fund at the end of the quarter.
There will be no changes to the current account treatment of these fees.
iii) Insurance fees and commission: This includes administrative and brokerages fees charges on insurance related products.
There will be no changes to the current account treatment of these fees.
Based on the analysis done to date, the impact on the annual financial statements is not expected to be significant.
Effective date 1 January 2018
Title IAS 40 Investment Property amendment
The amendments clarify the requirements on transfers to, or from, investment property when, and only when, there is a
change in use. A change in use occurs when the property meets, or ceases to meet, the definition of investment property and
there is evidence of the change in use.
The standard is not expected to have a significant impact on the group as the group does not have investment property.
Effective date 1 January 2018
Title IFRIC 22 Foreign Currency Transactions and Advance Consideration
The IFRIC provides guidance on how to determine the date of the transaction for the purpose of determining the exchange
rate to use on initial recognition of the related asset, expense or income (or part of it) on the derecognition of a non-monetary
asset or non-monetary liability arising from the payment or receipt of advance consideration in a foreign currency. The IFRIC
will be applied retrospectively or prospectively. The group has identified and reviewed the contracts and transaction that are
within the scope of this interpretation which indicate that this IFRIC will not materially impact the annual financial statements.
Effective date 1 January 2018
Title IFRS 17 Insurance Contracts
This standard replaces the existing accounting standard IFRS 4 Insurance Contracts which gave entities dispensation to account
for insurance contracts (particularly measurement) using local actuarial practice, resulting in a multitude of different approaches.
The overall objective of IFRS 17 is to provide a more useful and consistent accounting model for insurance contracts among
entities issuing insurance contracts globally. The standard requires an entity to measure insurance contracts using updated
estimates and assumptions that reflect the timing of cash flows and any uncertainty relating to insurance contracts. A general
measurement model (GMM) will be applied to long-term insurance contracts, and is based on a fulfilment objective (risk-
adjusted present value of best estimate future cash flows) and uses current estimates, informed by actual trends and investment
markets. IFRS 17 establishes what is called a contractual service margin (CSM) in the initial measurement of the liability which
represents the unearned profit on the contract and results in no gain on initial recognition. The CSM is released over the life of
the contract, but interest on the CSM is locked in at inception rates. The CSM will be utilised as a “shock absorber” in the event
of changes to best estimate cash flows. On loss making (onerous) contracts, no CSM is set up and the full loss is recognised at
the point of contract inception. The GMM is modified for contracts which have participation features.
Pronouncement
Title IFRS 17 Insurance Contracts (continued)
An optional simplified premium allocation approach (PAA) is available for all contracts that are less than 12 months at
inception. The PAA is similar to the current unearned premium reserve profile over time. The requirement to eliminate all
treasury shares has been amended such that treasury shares held as underlying items for a group of direct participating
contracts or investment funds are not required to be eliminated and can be accounted for as financial assets.
These requirement will provide transparent reporting about an entities’ financial position and risk and will provide metrics that
can be used to evaluate the performance of insurers and how that performance changes over time. An entity may re-assess its
classification and designation of financial instruments under IFRS 9, on adoption of IFRS 17.
The standard will be applied retrospectively. The impact on the annual financial statements has not yet been fully determined.
Effective date 1 January 2021 earlier application permitted
Title IFRIC 23 Uncertainty over Income Tax Treatments
This Interpretation clarifies how to apply the recognition and measurement requirements in IAS 12 when there is uncertainty
over income tax treatments. In such a circumstance, an entity shall recognise and measure its current or deferred tax asset or
liability applying the requirements in IAS 12 based on taxable profit (tax loss), tax bases, unused tax losses, unused tax credits
and tax rates determined applying this Interpretation. This Interpretation addresses: whether an entity considers uncertain tax
treatments separately; the assumptions an entity makes about the examination of tax treatments by taxation authorities; how
an entity determines taxable profit (tax loss), tax bases, unused tax losses, unused tax credits and tax rates; and how an entity
considers changes in facts and circumstances. The IFRIC will be applied retrospectively. The impact on the annual financial
statements has not yet been fully determined.
Effective date 1 January 2019 earlier application permitted
Title IFRS 2 Share-based Payment amendment
The amendments are intended to eliminate diversity in practice in three main areas of the classification and measurement of
share based payment transactions are: the effects of vesting conditions on the measurement of a cash-settled share based
payment transaction; the classification of a share-based payment transaction with net settlement features for withholding tax
obligations; the accounting where a modification to the terms and conditions of a share-based payment transaction changes its
classification from cash-settled to equity-settled.
The amendments will be applied prospectively. The impact on the annual financial statements is not expected to be significant.
Effective date 1 January 2018
Title IAS 28 Interest in Associates and Joint Ventures (amendment)
This amendment clarifies that an entity should apply IFRS 9, including its impairment requirements, to long-term interests in an
associate or joint venture that form part of the net investment in the associate or joint venture only when the equity method is
not applied. The amendments will be applied retrospectively. The impact on the annual financial statements is not expected to
have a significant impact on the annual financial statements.
Effective date 1 January 2019 earlier application permitted
Annual report & financial statements166 167Stanbic IBTC Annual group financial statements for the year ended 31 December 2017 Overview Business review Annual report & financial statements Other information
Notes to the consolidated and separate financial statements For the year ended 31 December 2017
Pronouncement
Title Annual improvements 2015-2017 cycle
The IASB has issued various amendments and clarifications to existing IFRS, none of which is expected to have a significant
impact on the group’s annual financial statements.
Effective date 1 January 2019 earlier application permitted
Title IFRS 16 Leases
This standard will replace the existing standard IAS 17 Leases as well as the related interpretations and sets out the principles
for the recognition, measurement, presentation and disclosure of leases for both parties to a contract, being the lessee
(customer) and the lessor (supplier).
The core principle of this standard is that the lessee and lessor should recognise all rights and obligations arising from leasing
arrangements on balance sheet.
The most significant change pertaining to the accounting treatment of operating leases is from the lessees’ perspective. IFRS
16 eliminates the classification of leases as either operating leases or finance leases as is required by IAS 17 and introduces
a single lessee accounting model, where a right of use (ROU) asset together with a liability for the future payments is to be
recognised for all leases with a term of more than 12 months, unless the underlying asset is of low value.
The lessor accounting requirements in IAS 17 has not changed substantially in terms of this standard as a result a lessor
continues to classify its leases as operating leases or finance leases and accounts for these as it is currently done in terms of
IAS 17. In addition, the standard requires lessor to provide enhanced disclosures about its leasing activities and in particular
about its exposure to residual value risk and how it is managed.
The standard will be applied retrospectively. The impact on the annual financial statements has not yet been fully determined.
However, the group has formed an IFRS 16 working group and detailed project plan, identifying key responsibilities and
milestones of the project. The group is in the process of determining the estimated impact as well as discussing the system
requirements to accommodate IFRS 16’s principles.
Effective date 1 January 2019 earlier application permitted
Title IFRS 4 (amendment) Insurance Contracts
The amendment to applying IFRS 9 Financial Instruments with IFRS 4 Insurance Contracts introduces two approaches: an
overlay approach and a deferral approach. The amended Standard will give all companies that issue insurance contracts the
option to recognise in other comprehensive income, rather than profit or loss, the volatility that could arise when IFRS 9
is applied before the new insurance contracts standard is issued; and give companies whose activities are predominantly
connected with insurance an optional temporary exemption from applying IFRS 9 until 2021. The entities that defer the
application of IFRS 9 will continue to apply the existing financial instruments Standard IAS 39. The amendments to IFRS 4
supplement existing options in the Standard that can already be used to address the temporary volatility.
The amendments will have no material impact on the activities of the group as the group has no insurance contract as at
reporting date and has no intention to issue insurance contract in the coming year.
Effective date 1 January 2019 earlier application permitted
5. Segment reporting
The group is organised on the basis of products and services, and the segments have been identified on this basis. The principal business
units in the group are as follows:
Business unit
Personal and
Business
Banking
Banking and other financial services to individual customers and small-to-medium-sized enterprises.
Mortgage lending – Provides residential accommodation loans to mainly personal market customers.
Instalment sale and finance leases – Provides instalments finance to personal market customers and
finance of vehicles and equipment in the business market.
Card products – Provides credit and debit card facilities for individuals and businesses.
Transactional and lending products – Transactions in products associated with the various points of contact channels such as ATMs,
internet, telephone banking and branches. This includes deposit taking activities, electronic banking, cheque accounts and other
lending products coupled with debit card facilities to both personal and business market customers.
Corporate and
Investment
Banking
Corporate and investment banking services to larger corporates, financial institutions and international counterparties.
Global markets – Includes foreign exchange, fixed income, interest rates, and equity trading.
Transactional and lending products – Includes corporate lending and transactional banking businesses, custodial services, trade
finance business and property-related lending.
Investment banking – Include project finance, structured finance, equity investments, advisory, corporate lending,
primary market acquisition, leverage finance and structured trade finance.
Wealth The wealth group is made up of the company’s subsidiaries, whose activities involve investment management,
pension management, portfolio management, unit trust/funds management, and trusteeship.
An operating segment is a component of the group engaged in business activities from which it can earn revenues, whose operating
results are regularly reviewed by the group's executive management in order to make decisions about resources to be allocated to
segments and assessing segment performance. The group’s identification of segments and the measurement of segment results is
based on the group’s internal reporting to management. Segment results include customer-facing activities and support functions.
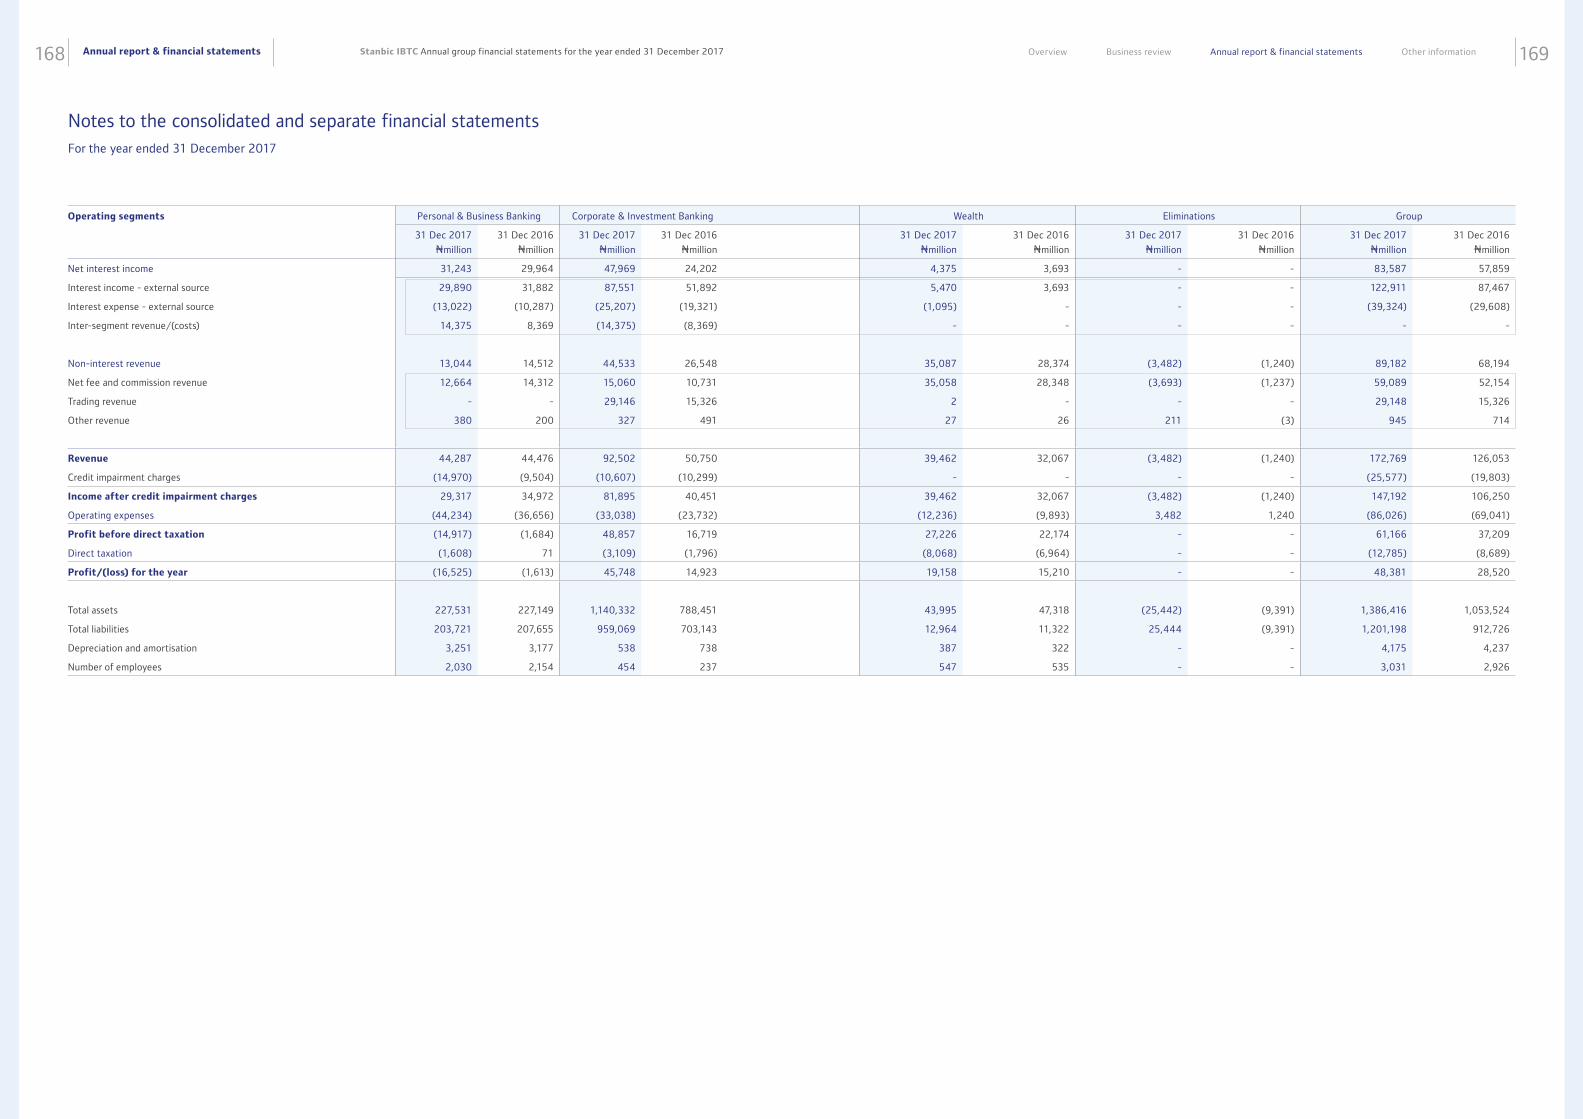
Annual report & financial statements168 169Stanbic IBTC Annual group financial statements for the year ended 31 December 2017 Overview Business review Annual report & financial statements Other information
Operating segments Personal & Business Banking Corporate & Investment Banking Wealth Eliminations Group
31 Dec 2017
Nmillion
31 Dec 2016
Nmillion
31 Dec 2017
Nmillion
31 Dec 2016
Nmillion
31 Dec 2017
Nmillion
31 Dec 2016
Nmillion
31 Dec 2017
Nmillion
31 Dec 2016
Nmillion
31 Dec 2017
Nmillion
31 Dec 2016
Nmillion
Net interest income 31,243 29,964 47,969 24,202 4,375 3,693 - - 83,587 57,859
Interest income - external source 29,890 31,882 87,551 51,892 5,470 3,693 - - 122,911 87,467
Interest expense - external source (13,022) (10,287) (25,207) (19,321) (1,095) - - - (39,324) (29,608)
Inter-segment revenue/(costs) 14,375 8,369 (14,375) (8,369) - - - - - -
Non-interest revenue 13,044 14,512 44,533 26,548 35,087 28,374 (3,482) (1,240) 89,182 68,194
Net fee and commission revenue 12,664 14,312 15,060 10,731 35,058 28,348 (3,693) (1,237) 59,089 52,154
Trading revenue - - 29,146 15,326 2 - - - 29,148 15,326
Other revenue 380 200 327 491 27 26 211 (3) 945 714
Revenue 44,287 44,476 92,502 50,750 39,462 32,067 (3,482) (1,240) 172,769 126,053
Credit impairment charges (14,970) (9,504) (10,607) (10,299) - - - - (25,577) (19,803)
Income after credit impairment charges 29,317 34,972 81,895 40,451 39,462 32,067 (3,482) (1,240) 147,192 106,250
Operating expenses (44,234) (36,656) (33,038) (23,732) (12,236) (9,893) 3,482 1,240 (86,026) (69,041)
Profit before direct taxation (14,917) (1,684) 48,857 16,719 27,226 22,174 - - 61,166 37,209
Direct taxation (1,608) 71 (3,109) (1,796) (8,068) (6,964) - - (12,785) (8,689)
Profit/(loss) for the year (16,525) (1,613) 45,748 14,923 19,158 15,210 - - 48,381 28,520
Total assets 227,531 227,149 1,140,332 788,451 43,995 47,318 (25,442) (9,391) 1,386,416 1,053,524
Total liabilities 203,721 207,655 959,069 703,143 12,964 11,322 25,444 (9,391) 1,201,198 912,726
Depreciation and amortisation 3,251 3,177 538 738 387 322 - - 4,175 4,237
Number of employees 2,030 2,154 454 237 547 535 - - 3,031 2,926
Notes to the consolidated and separate financial statements For the year ended 31 December 2017
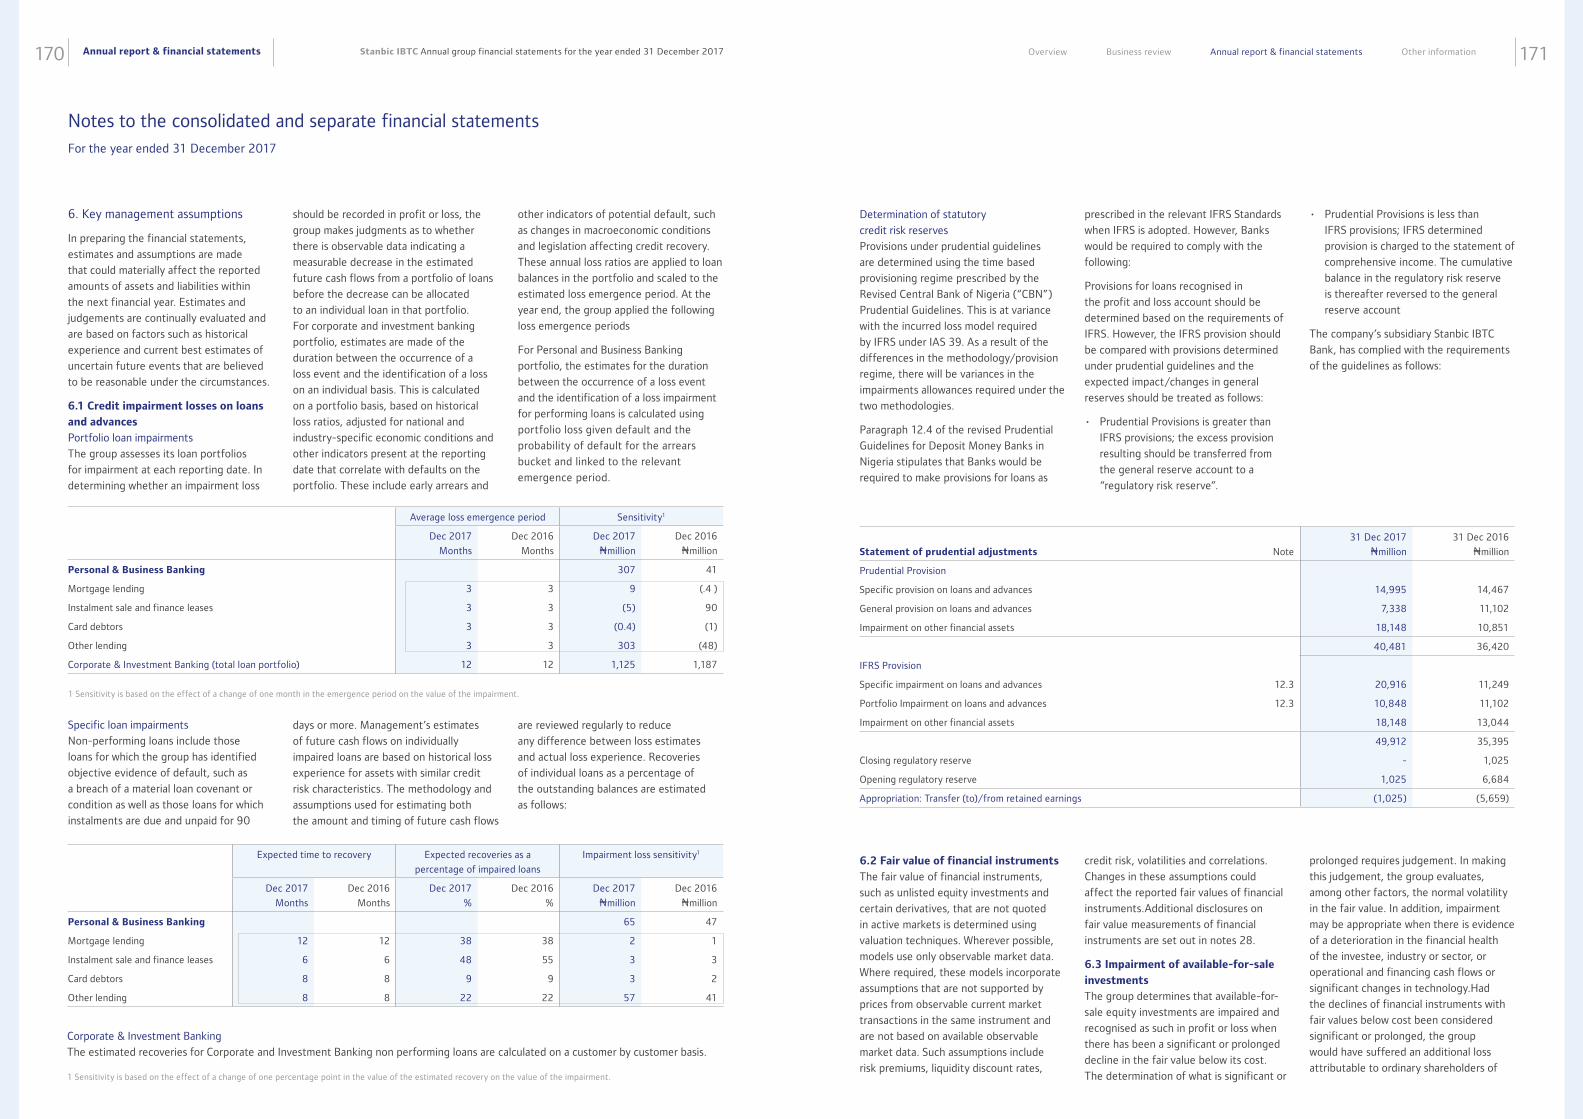
Annual report & financial statements170 171Stanbic IBTC Annual group financial statements for the year ended 31 December 2017 Overview Business review Annual report & financial statements Other information
6. Key management assumptions
In preparing the financial statements,
estimates and assumptions are made
that could materially affect the reported
amounts of assets and liabilities within
the next financial year. Estimates and
judgements are continually evaluated and
are based on factors such as historical
experience and current best estimates of
uncertain future events that are believed
to be reasonable under the circumstances.
6.1 Credit impairment losses on loans
and advances
Portfolio loan impairments
The group assesses its loan portfolios
for impairment at each reporting date. In
determining whether an impairment loss
should be recorded in profit or loss, the
group makes judgments as to whether
there is observable data indicating a
measurable decrease in the estimated
future cash flows from a portfolio of loans
before the decrease can be allocated
to an individual loan in that portfolio.
For corporate and investment banking
portfolio, estimates are made of the
duration between the occurrence of a
loss event and the identification of a loss
on an individual basis. This is calculated
on a portfolio basis, based on historical
loss ratios, adjusted for national and
industry-specific economic conditions and
other indicators present at the reporting
date that correlate with defaults on the
portfolio. These include early arrears and
other indicators of potential default, such
as changes in macroeconomic conditions
and legislation affecting credit recovery.
These annual loss ratios are applied to loan
balances in the portfolio and scaled to the
estimated loss emergence period. At the
year end, the group applied the following
loss emergence periods
For Personal and Business Banking
portfolio, the estimates for the duration
between the occurrence of a loss event
and the identification of a loss impairment
for performing loans is calculated using
portfolio loss given default and the
probability of default for the arrears
bucket and linked to the relevant
emergence period.
Specific loan impairments
Non-performing loans include those
loans for which the group has identified
objective evidence of default, such as
a breach of a material loan covenant or
condition as well as those loans for which
instalments are due and unpaid for 90
Corporate & Investment Banking
The estimated recoveries for Corporate and Investment Banking non performing loans are calculated on a customer by customer basis.
Average loss emergence period Sensitivity1
Dec 2017
Months
Dec 2016
Months
Dec 2017
Nmillion
Dec 2016
Nmillion
Personal & Business Banking 307 41
Mortgage lending 3 3 9 (.4 )
Instalment sale and finance leases 3 3 (5) 90
Card debtors 3 3 (0.4) (1)
Other lending 3 3 303 (48)
Corporate & Investment Banking (total loan portfolio) 12 12 1,125 1,187
1 Sensitivity is based on the effect of a change of one month in the emergence period on the value of the impairment.
1 Sensitivity is based on the effect of a change of one percentage point in the value of the estimated recovery on the value of the impairment.
days or more. Management’s estimates
of future cash flows on individually
impaired loans are based on historical loss
experience for assets with similar credit
risk characteristics. The methodology and
assumptions used for estimating both
the amount and timing of future cash flows
are reviewed regularly to reduce
any difference between loss estimates
and actual loss experience. Recoveries
of individual loans as a percentage of
the outstanding balances are estimated
as follows:
Expected time to recovery Expected recoveries as a
percentage of impaired loans
Impairment loss sensitivity1
Dec 2017
Months
Dec 2016
Months
Dec 2017
%
Dec 2016
%
Dec 2017
Nmillion
Dec 2016
Nmillion
Personal & Business Banking 65 47
Mortgage lending 12 12 38 38 2 1
Instalment sale and finance leases 6 6 48 55 3 3
Card debtors 8 8 9 9 3 2
Other lending 8 8 22 22 57 41
Determination of statutory
credit risk reserves
Provisions under prudential guidelines
are determined using the time based
provisioning regime prescribed by the
Revised Central Bank of Nigeria (“CBN”)
Prudential Guidelines. This is at variance
with the incurred loss model required
by IFRS under IAS 39. As a result of the
differences in the methodology/provision
regime, there will be variances in the
impairments allowances required under the
two methodologies.
Paragraph 12.4 of the revised Prudential
Guidelines for Deposit Money Banks in
Nigeria stipulates that Banks would be
required to make provisions for loans as
6.2 Fair value of financial instruments
The fair value of financial instruments,
such as unlisted equity investments and
certain derivatives, that are not quoted
in active markets is determined using
valuation techniques. Wherever possible,
models use only observable market data.
Where required, these models incorporate
assumptions that are not supported by
prices from observable current market
transactions in the same instrument and
are not based on available observable
market data. Such assumptions include
risk premiums, liquidity discount rates,
prescribed in the relevant IFRS Standards
when IFRS is adopted. However, Banks
would be required to comply with the
following:
Provisions for loans recognised in
the profit and loss account should be
determined based on the requirements of
IFRS. However, the IFRS provision should
be compared with provisions determined
under prudential guidelines and the
expected impact/changes in general
reserves should be treated as follows:
• Prudential Provisions is greater than
IFRS provisions; the excess provision
resulting should be transferred from
the general reserve account to a
“regulatory risk reserve”.
credit risk, volatilities and correlations.
Changes in these assumptions could
affect the reported fair values of financial
instruments.Additional disclosures on
fair value measurements of financial
instruments are set out in notes 28.
6.3 Impairment of available-for-sale
investments
The group determines that available-for-
sale equity investments are impaired and
recognised as such in profit or loss when
there has been a significant or prolonged
decline in the fair value below its cost.
The determination of what is significant or
• Prudential Provisions is less than
IFRS provisions; IFRS determined
provision is charged to the statement of
comprehensive income. The cumulative
balance in the regulatory risk reserve
is thereafter reversed to the general
reserve account
The company’s subsidiary Stanbic IBTC
Bank, has complied with the requirements
of the guidelines as follows:
prolonged requires judgement. In making
this judgement, the group evaluates,
among other factors, the normal volatility
in the fair value. In addition, impairment
may be appropriate when there is evidence
of a deterioration in the financial health
of the investee, industry or sector, or
operational and financing cash flows or
significant changes in technology.Had
the declines of financial instruments with
fair values below cost been considered
significant or prolonged, the group
would have suffered an additional loss
attributable to ordinary shareholders of
Statement of prudential adjustments
Note
31 Dec 2017
Nmillion
31 Dec 2016
Nmillion
Prudential Provision
Specific provision on loans and advances 14,995 14,467
General provision on loans and advances 7,338 11,102
Impairment on other financial assets 18,148 10,851
40,481 36,420
IFRS Provision
Specific impairment on loans and advances 12.3 20,916 11,249
Portfolio Impairment on loans and advances 12.3 10,848 11,102
Impairment on other financial assets 18,148 13,044
49,912 35,395
Closing regulatory reserve - 1,025
Opening regulatory reserve 1,025 6,684
Appropriation: Transfer (to)/from retained earnings (1,025) (5,659)
Notes to the consolidated and separate financial statements For the year ended 31 December 2017
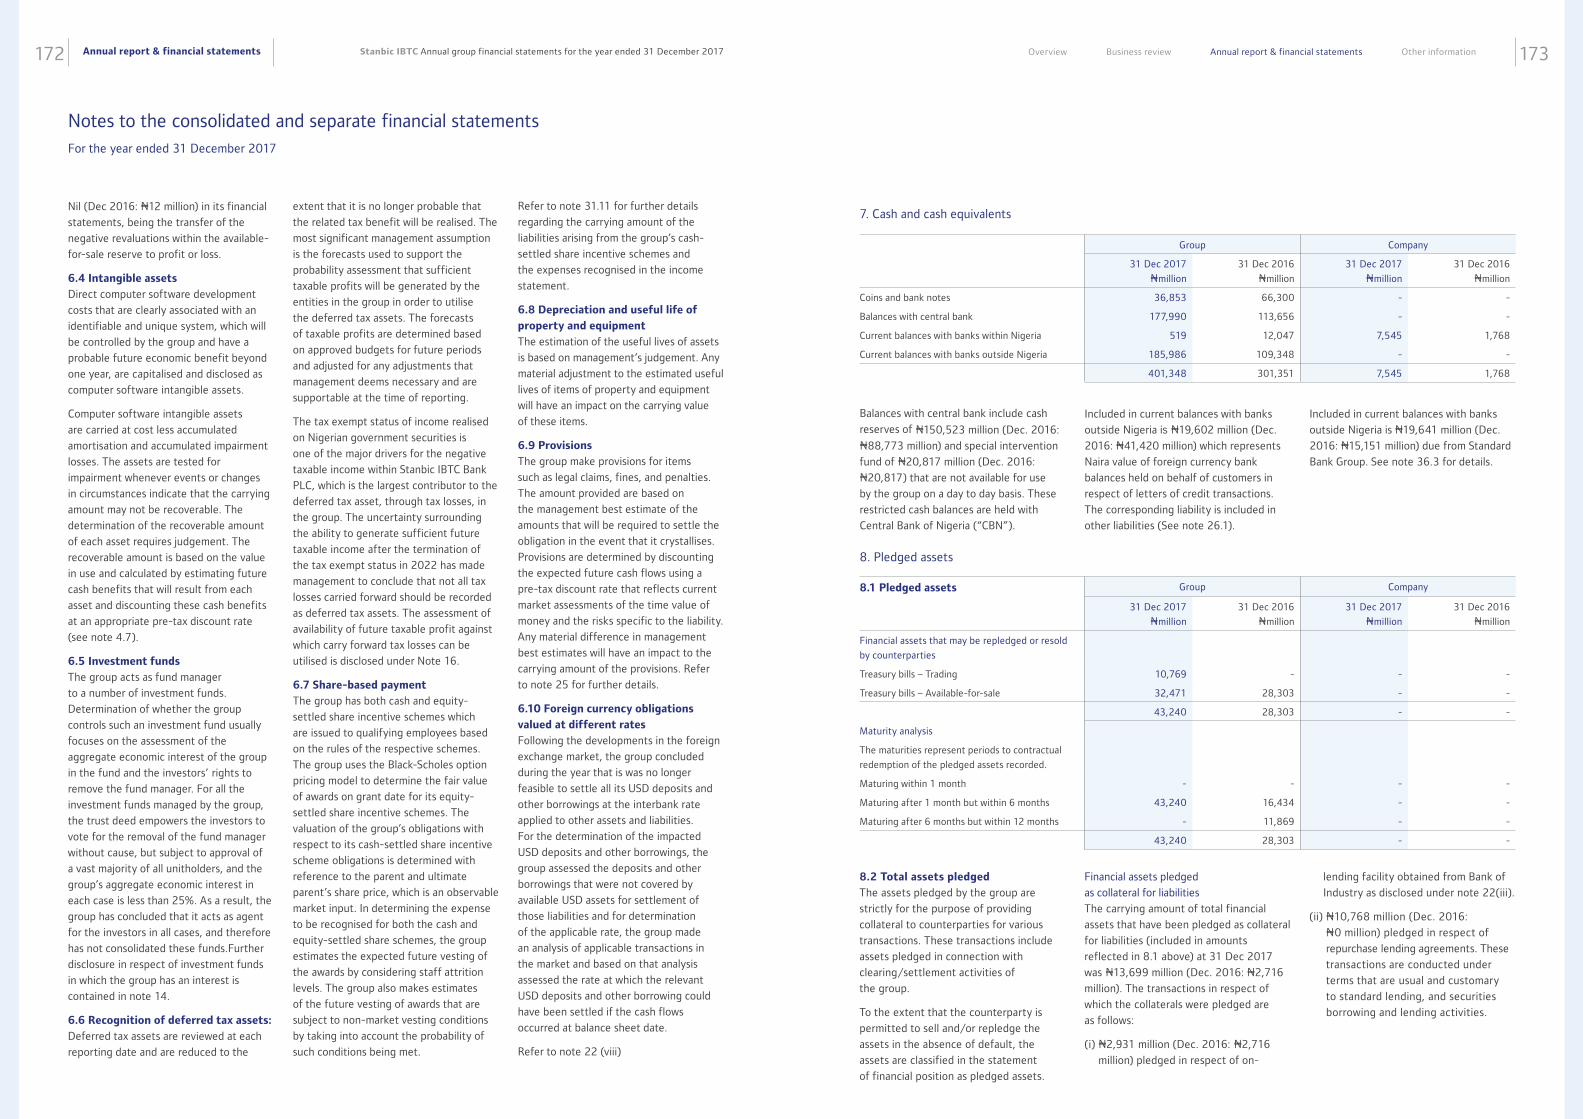
Annual report & financial statements172 173Stanbic IBTC Annual group financial statements for the year ended 31 December 2017 Overview Business review Annual report & financial statements Other information
Nil (Dec 2016: N12 million) in its financial
statements, being the transfer of the
negative revaluations within the available-
for-sale reserve to profit or loss.
6.4 Intangible assets
Direct computer software development
costs that are clearly associated with an
identifiable and unique system, which will
be controlled by the group and have a
probable future economic benefit beyond
one year, are capitalised and disclosed as
computer software intangible assets.
Computer software intangible assets
are carried at cost less accumulated
amortisation and accumulated impairment
losses. The assets are tested for
impairment whenever events or changes
in circumstances indicate that the carrying
amount may not be recoverable. The
determination of the recoverable amount
of each asset requires judgement. The
recoverable amount is based on the value
in use and calculated by estimating future
cash benefits that will result from each
asset and discounting these cash benefits
at an appropriate pre-tax discount rate
(see note 4.7).
6.5 Investment funds
The group acts as fund manager
to a number of investment funds.
Determination of whether the group
controls such an investment fund usually
focuses on the assessment of the
aggregate economic interest of the group
in the fund and the investors’ rights to
remove the fund manager. For all the
investment funds managed by the group,
the trust deed empowers the investors to
vote for the removal of the fund manager
without cause, but subject to approval of
a vast majority of all unitholders, and the
group’s aggregate economic interest in
each case is less than 25%. As a result, the
group has concluded that it acts as agent
for the investors in all cases, and therefore
has not consolidated these funds.Further
disclosure in respect of investment funds
in which the group has an interest is
contained in note 14.
6.6 Recognition of deferred tax assets:
Deferred tax assets are reviewed at each
reporting date and are reduced to the
extent that it is no longer probable that
the related tax benefit will be realised. The
most significant management assumption
is the forecasts used to support the
probability assessment that sufficient
taxable profits will be generated by the
entities in the group in order to utilise
the deferred tax assets. The forecasts
of taxable profits are determined based
on approved budgets for future periods
and adjusted for any adjustments that
management deems necessary and are
supportable at the time of reporting.
The tax exempt status of income realised
on Nigerian government securities is
one of the major drivers for the negative
taxable income within Stanbic IBTC Bank
PLC, which is the largest contributor to the
deferred tax asset, through tax losses, in
the group. The uncertainty surrounding
the ability to generate sufficient future
taxable income after the termination of
the tax exempt status in 2022 has made
management to conclude that not all tax
losses carried forward should be recorded
as deferred tax assets. The assessment of
availability of future taxable profit against
which carry forward tax losses can be
utilised is disclosed under Note 16.
6.7 Share-based payment
The group has both cash and equity-
settled share incentive schemes which
are issued to qualifying employees based
on the rules of the respective schemes.
The group uses the Black-Scholes option
pricing model to determine the fair value
of awards on grant date for its equity-
settled share incentive schemes. The
valuation of the group’s obligations with
respect to its cash-settled share incentive
scheme obligations is determined with
reference to the parent and ultimate
parent’s share price, which is an observable
market input. In determining the expense
to be recognised for both the cash and
equity-settled share schemes, the group
estimates the expected future vesting of
the awards by considering staff attrition
levels. The group also makes estimates
of the future vesting of awards that are
subject to non-market vesting conditions
by taking into account the probability of
such conditions being met.
Refer to note 31.11 for further details
regarding the carrying amount of the
liabilities arising from the group’s cash-
settled share incentive schemes and
the expenses recognised in the income
statement.
6.8 Depreciation and useful life of
property and equipment
The estimation of the useful lives of assets
is based on management’s judgement. Any
material adjustment to the estimated useful
lives of items of property and equipment
will have an impact on the carrying value
of these items.
6.9 Provisions
The group make provisions for items
such as legal claims, fines, and penalties.
The amount provided are based on
the management best estimate of the
amounts that will be required to settle the
obligation in the event that it crystallises.
Provisions are determined by discounting
the expected future cash flows using a
pre-tax discount rate that reflects current
market assessments of the time value of
money and the risks specific to the liability.
Any material difference in management
best estimates will have an impact to the
carrying amount of the provisions. Refer
to note 25 for further details.
6.10 Foreign currency obligations
valued at different rates
Following the developments in the foreign
exchange market, the group concluded
during the year that is was no longer
feasible to settle all its USD deposits and
other borrowings at the interbank rate
applied to other assets and liabilities.
For the determination of the impacted
USD deposits and other borrowings, the
group assessed the deposits and other
borrowings that were not covered by
available USD assets for settlement of
those liabilities and for determination
of the applicable rate, the group made
an analysis of applicable transactions in
the market and based on that analysis
assessed the rate at which the relevant
USD deposits and other borrowing could
have been settled if the cash flows
occurred at balance sheet date.
Refer to note 22 (viii)
Balances with central bank include cash
reserves of N150,523 million (Dec. 2016:
N88,773 million) and special intervention
fund of N20,817 million (Dec. 2016:
N20,817) that are not available for use
by the group on a day to day basis. These
restricted cash balances are held with
Central Bank of Nigeria (“CBN”).
8.2 Total assets pledged
The assets pledged by the group are
strictly for the purpose of providing
collateral to counterparties for various
transactions. These transactions include
assets pledged in connection with
clearing/settlement activities of
the group.
To the extent that the counterparty is
permitted to sell and/or repledge the
assets in the absence of default, the
assets are classified in the statement
of financial position as pledged assets.
7. Cash and cash equivalents
8. Pledged assets
Group Company
31 Dec 2017
Nmillion
31 Dec 2016
Nmillion
31 Dec 2017
Nmillion
31 Dec 2016
Nmillion
Coins and bank notes 36,853 66,300 - -
Balances with central bank 177,990 113,656 - -
Current balances with banks within Nigeria 519 12,047 7,545 1,768
Current balances with banks outside Nigeria 185,986 109,348 - -
401,348 301,351 7,545 1,768
Included in current balances with banks
outside Nigeria is N19,602 million (Dec.
2016: N41,420 million) which represents
Naira value of foreign currency bank
balances held on behalf of customers in
respect of letters of credit transactions.
The corresponding liability is included in
other liabilities (See note 26.1).
Financial assets pledged
as collateral for liabilities
The carrying amount of total financial
assets that have been pledged as collateral
for liabilities (included in amounts
reflected in 8.1 above) at 31 Dec 2017
was N13,699 million (Dec. 2016: N2,716
million). The transactions in respect of
which the collaterals were pledged are
as follows:
(i) N2,931 million (Dec. 2016: N2,716
million) pledged in respect of on-
Included in current balances with banks
outside Nigeria is N19,641 million (Dec.
2016: N15,151 million) due from Standard
Bank Group. See note 36.3 for details.
lending facility obtained from Bank of
Industry as disclosed under note 22(iii).
(ii) N10,768 million (Dec. 2016:
N0 million) pledged in respect of
repurchase lending agreements. These
transactions are conducted under
terms that are usual and customary
to standard lending, and securities
borrowing and lending activities.
8.1 Pledged assets Group Company
31 Dec 2017
Nmillion
31 Dec 2016
Nmillion
31 Dec 2017
Nmillion
31 Dec 2016
Nmillion
Financial assets that may be repledged or resold
by counterparties
Treasury bills – Trading 10,769 - - -
Treasury bills – Available-for-sale 32,471 28,303 - -
43,240 28,303 - -
Maturity analysis
The maturities represent periods to contractual
redemption of the pledged assets recorded.
Maturing within 1 month - - - -
Maturing after 1 month but within 6 months 43,240 16,434 - -
Maturing after 6 months but within 12 months - 11,869 - -
43,240 28,303 - -
Notes to the consolidated and separate financial statements For the year ended 31 December 2017
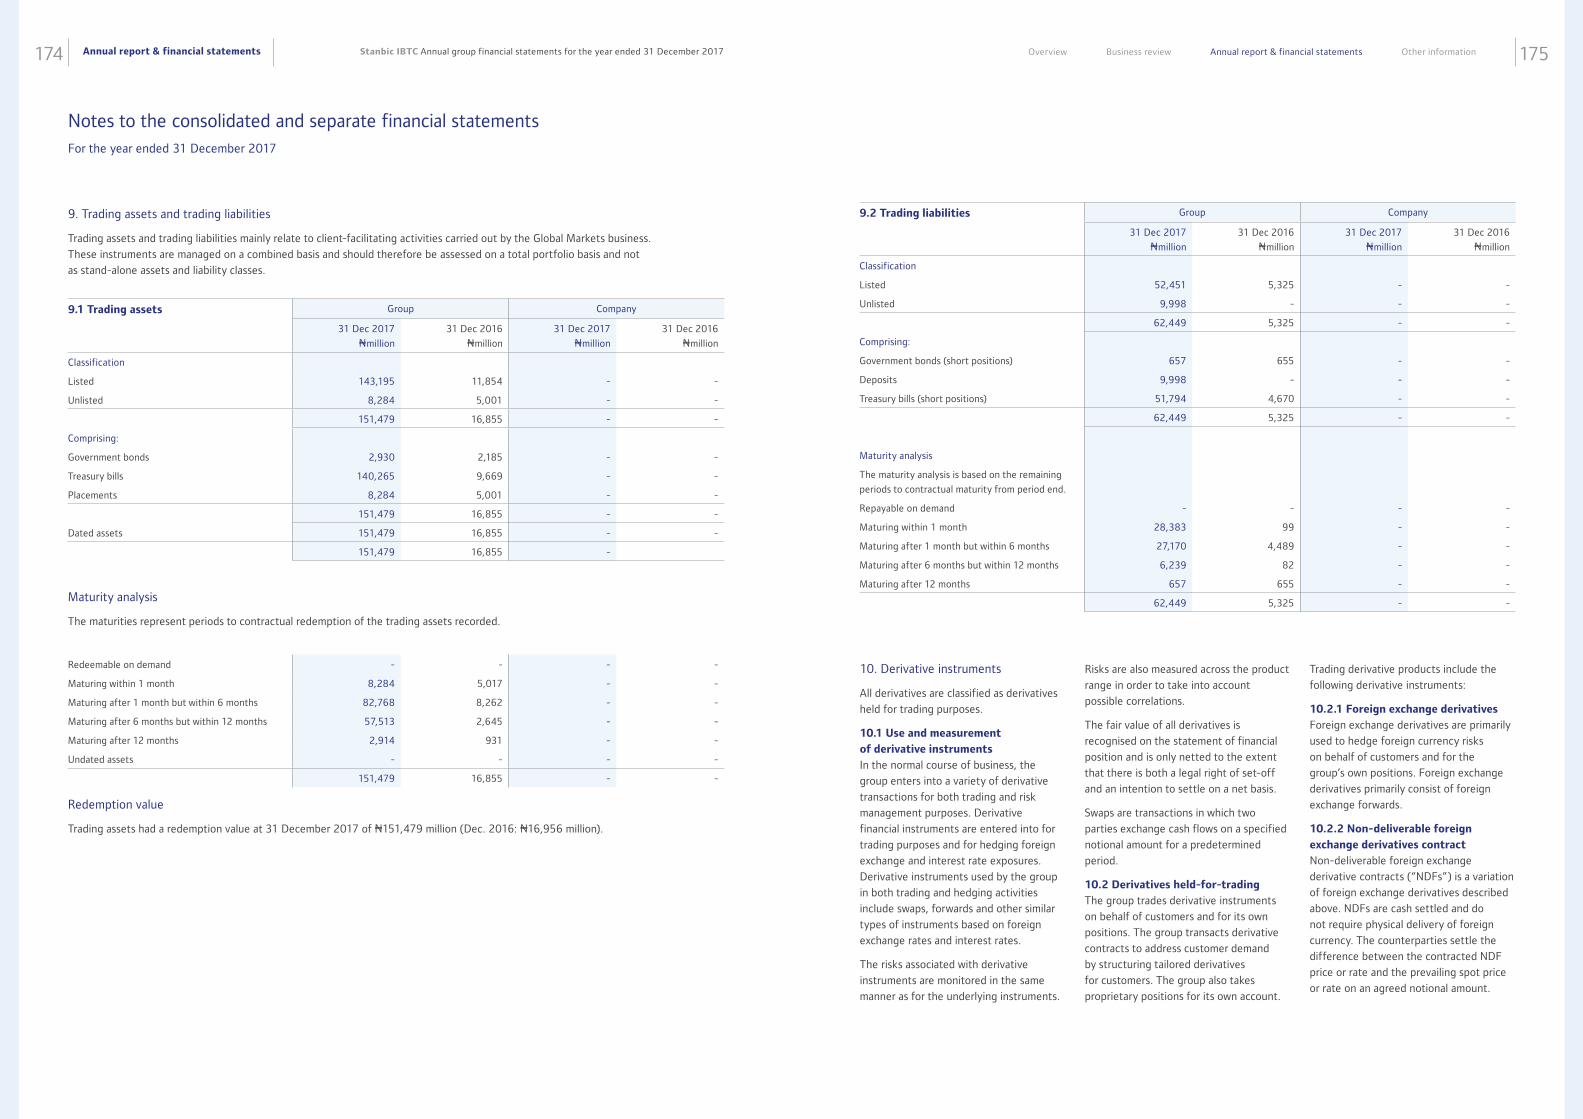
Annual report & financial statements174 175Stanbic IBTC Annual group financial statements for the year ended 31 December 2017 Overview Business review Annual report & financial statements Other information
9. Trading assets and trading liabilities
Trading assets and trading liabilities mainly relate to client-facilitating activities carried out by the Global Markets business.
These instruments are managed on a combined basis and should therefore be assessed on a total portfolio basis and not
as stand-alone assets and liability classes.
Maturity analysis
The maturities represent periods to contractual redemption of the trading assets recorded.
Redeemable on demand - - - -
Maturing within 1 month 8,284 5,017 - -
Maturing after 1 month but within 6 months 82,768 8,262 - -
Maturing after 6 months but within 12 months 57,513 2,645 - -
Maturing after 12 months 2,914 931 - -
Undated assets - - - -
151,479 16,855 - -
Redemption value
Trading assets had a redemption value at 31 December 2017 of N151,479 million (Dec. 2016: N16,956 million).
9.1 Trading assets Group Company
31 Dec 2017
Nmillion
31 Dec 2016
Nmillion
31 Dec 2017
Nmillion
31 Dec 2016
Nmillion
Classification
Listed 143,195 11,854 - -
Unlisted 8,284 5,001 - -
151,479 16,855 - -
Comprising:
Government bonds 2,930 2,185 - -
Treasury bills 140,265 9,669 - -
Placements 8,284 5,001 - -
151,479 16,855 - -
Dated assets 151,479 16,855 - -
151,479 16,855 -
9.2 Trading liabilities Group Company
31 Dec 2017
Nmillion
31 Dec 2016
Nmillion
31 Dec 2017
Nmillion
31 Dec 2016
Nmillion
Classification
Listed 52,451 5,325 - -
Unlisted 9,998 - - -
62,449 5,325 - -
Comprising:
Government bonds (short positions) 657 655 - -
Deposits 9,998 - - -
Treasury bills (short positions) 51,794 4,670 - -
62,449 5,325 - -
Maturity analysis
The maturity analysis is based on the remaining
periods to contractual maturity from period end.
Repayable on demand - - - -
Maturing within 1 month 28,383 99 - -
Maturing after 1 month but within 6 months 27,170 4,489 - -
Maturing after 6 months but within 12 months 6,239 82 - -
Maturing after 12 months 657 655 - -
62,449 5,325 - -
10. Derivative instruments
All derivatives are classified as derivatives
held for trading purposes.
10.1 Use and measurement
of derivative instruments
In the normal course of business, the
group enters into a variety of derivative
transactions for both trading and risk
management purposes. Derivative
financial instruments are entered into for
trading purposes and for hedging foreign
exchange and interest rate exposures.
Derivative instruments used by the group
in both trading and hedging activities
include swaps, forwards and other similar
types of instruments based on foreign
exchange rates and interest rates.
The risks associated with derivative
instruments are monitored in the same
manner as for the underlying instruments.
Risks are also measured across the product
range in order to take into account
possible correlations.
The fair value of all derivatives is
recognised on the statement of financial
position and is only netted to the extent
that there is both a legal right of set-off
and an intention to settle on a net basis.
Swaps are transactions in which two
parties exchange cash flows on a specified
notional amount for a predetermined
period.
10.2 Derivatives held-for-trading
The group trades derivative instruments
on behalf of customers and for its own
positions. The group transacts derivative
contracts to address customer demand
by structuring tailored derivatives
for customers. The group also takes
proprietary positions for its own account.
Trading derivative products include the
following derivative instruments:
10.2.1 Foreign exchange derivatives
Foreign exchange derivatives are primarily
used to hedge foreign currency risks
on behalf of customers and for the
group’s own positions. Foreign exchange
derivatives primarily consist of foreign
exchange forwards.
10.2.2 Non-deliverable foreign
exchange derivatives contract
Non-deliverable foreign exchange
derivative contracts (“NDFs”) is a variation
of foreign exchange derivatives described
above. NDFs are cash settled and do
not require physical delivery of foreign
currency. The counterparties settle the
difference between the contracted NDF
price or rate and the prevailing spot price
or rate on an agreed notional amount.
Notes to the consolidated and separate financial statements For the year ended 31 December 2017
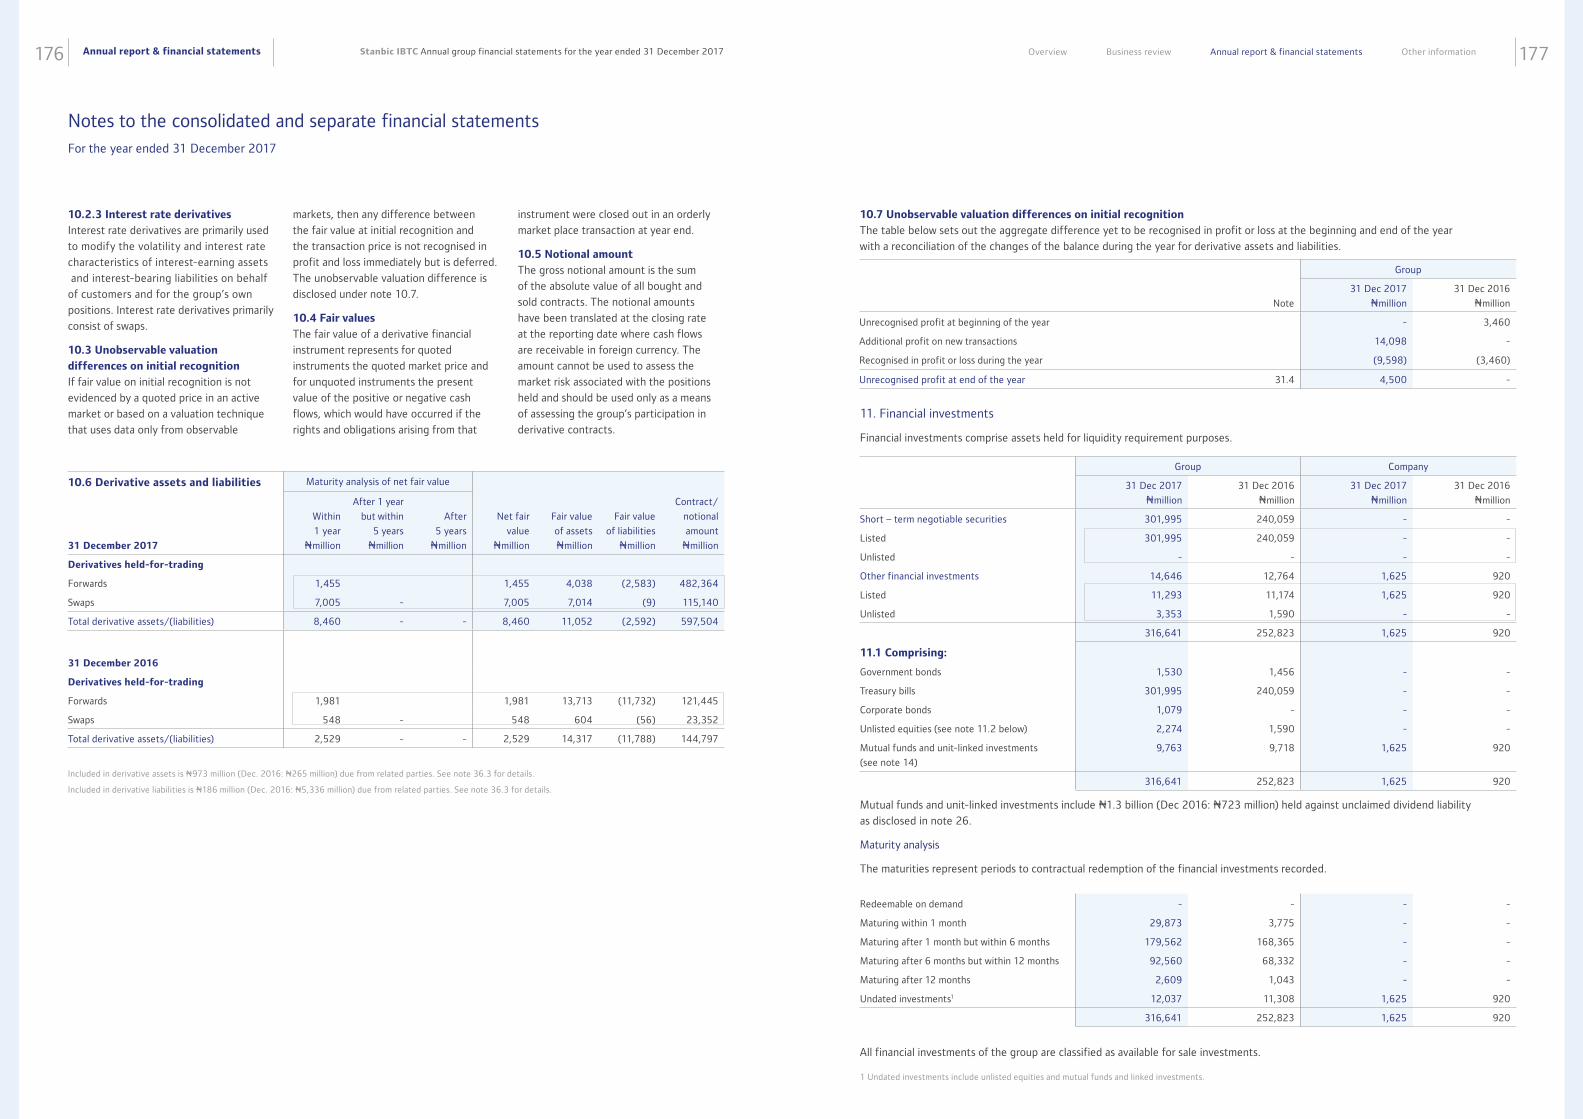
Annual report & financial statements176 177Stanbic IBTC Annual group financial statements for the year ended 31 December 2017 Overview Business review Annual report & financial statements Other information
10.2.3 Interest rate derivatives
Interest rate derivatives are primarily used
to modify the volatility and interest rate
characteristics of interest-earning assets
and interest-bearing liabilities on behalf
of customers and for the group’s own
positions. Interest rate derivatives primarily
consist of swaps.
10.3 Unobservable valuation
differences on initial recognition
If fair value on initial recognition is not
evidenced by a quoted price in an active
market or based on a valuation technique
that uses data only from observable
markets, then any difference between
the fair value at initial recognition and
the transaction price is not recognised in
profit and loss immediately but is deferred.
The unobservable valuation difference is
disclosed under note 10.7.
10.4 Fair values
The fair value of a derivative financial
instrument represents for quoted
instruments the quoted market price and
for unquoted instruments the present
value of the positive or negative cash
flows, which would have occurred if the
rights and obligations arising from that
instrument were closed out in an orderly
market place transaction at year end.
10.5 Notional amount
The gross notional amount is the sum
of the absolute value of all bought and
sold contracts. The notional amounts
have been translated at the closing rate
at the reporting date where cash flows
are receivable in foreign currency. The
amount cannot be used to assess the
market risk associated with the positions
held and should be used only as a means
of assessing the group’s participation in
derivative contracts.
10.6 Derivative assets and liabilities Maturity analysis of net fair value
31 December 2017
Within
1 year
Nmillion
After 1 year
but within
5 years
Nmillion
After
5 years
Nmillion
Net fair
value
Nmillion
Fair value
of assets
Nmillion
Fair value
of liabilities
Nmillion
Contract/
notional
amount
Nmillion
Derivatives held-for-trading
Forwards 1,455 1,455 4,038 (2,583) 482,364
Swaps 7,005 - 7,005 7,014 (9) 115,140
Total derivative assets/(liabilities) 8,460 - - 8,460 11,052 (2,592) 597,504
31 December 2016
Derivatives held-for-trading
Forwards 1,981 1,981 13,713 (11,732) 121,445
Swaps 548 - 548 604 (56) 23,352
Total derivative assets/(liabilities) 2,529 - - 2,529 14,317 (11,788) 144,797
Included in derivative assets is N973 million (Dec. 2016: N265 million) due from related parties. See note 36.3 for details.
Included in derivative liabilities is N186 million (Dec. 2016: N5,336 million) due from related parties. See note 36.3 for details.
10.7 Unobservable valuation differences on initial recognition
The table below sets out the aggregate difference yet to be recognised in profit or loss at the beginning and end of the year
with a reconciliation of the changes of the balance during the year for derivative assets and liabilities.
Group
Note
31 Dec 2017
Nmillion
31 Dec 2016
Nmillion
Unrecognised profit at beginning of the year - 3,460
Additional profit on new transactions 14,098 -
Recognised in profit or loss during the year (9,598) (3,460)
Unrecognised profit at end of the year 31.4 4,500 -
Group Company
31 Dec 2017
Nmillion
31 Dec 2016
Nmillion
31 Dec 2017
Nmillion
31 Dec 2016
Nmillion
Short – term negotiable securities 301,995 240,059 - -
Listed 301,995 240,059 - -
Unlisted - - - -
Other financial investments 14,646 12,764 1,625 920
Listed 11,293 11,174 1,625 920
Unlisted 3,353 1,590 - -
316,641 252,823 1,625 920
11.1 Comprising:
Government bonds 1,530 1,456 - -
Treasury bills 301,995 240,059 - -
Corporate bonds 1,079 - - -
Unlisted equities (see note 11.2 below) 2,274 1,590 - -
Mutual funds and unit-linked investments
(see note 14)
9,763 9,718 1,625 920
316,641 252,823 1,625 920
Mutual funds and unit-linked investments include N1.3 billion (Dec 2016: N723 million) held against unclaimed dividend liability
as disclosed in note 26.
Maturity analysis
The maturities represent periods to contractual redemption of the financial investments recorded.
Redeemable on demand - - - -
Maturing within 1 month 29,873 3,775 - -
Maturing after 1 month but within 6 months 179,562 168,365 - -
Maturing after 6 months but within 12 months 92,560 68,332 - -
Maturing after 12 months 2,609 1,043 - -
Undated investments1 12,037 11,308 1,625 920
316,641 252,823 1,625 920
11. Financial investments
Financial investments comprise assets held for liquidity requirement purposes.
All financial investments of the group are classified as available for sale investments.
1 Undated investments include unlisted equities and mutual funds and linked investments.
Notes to the consolidated and separate financial statements For the year ended 31 December 2017
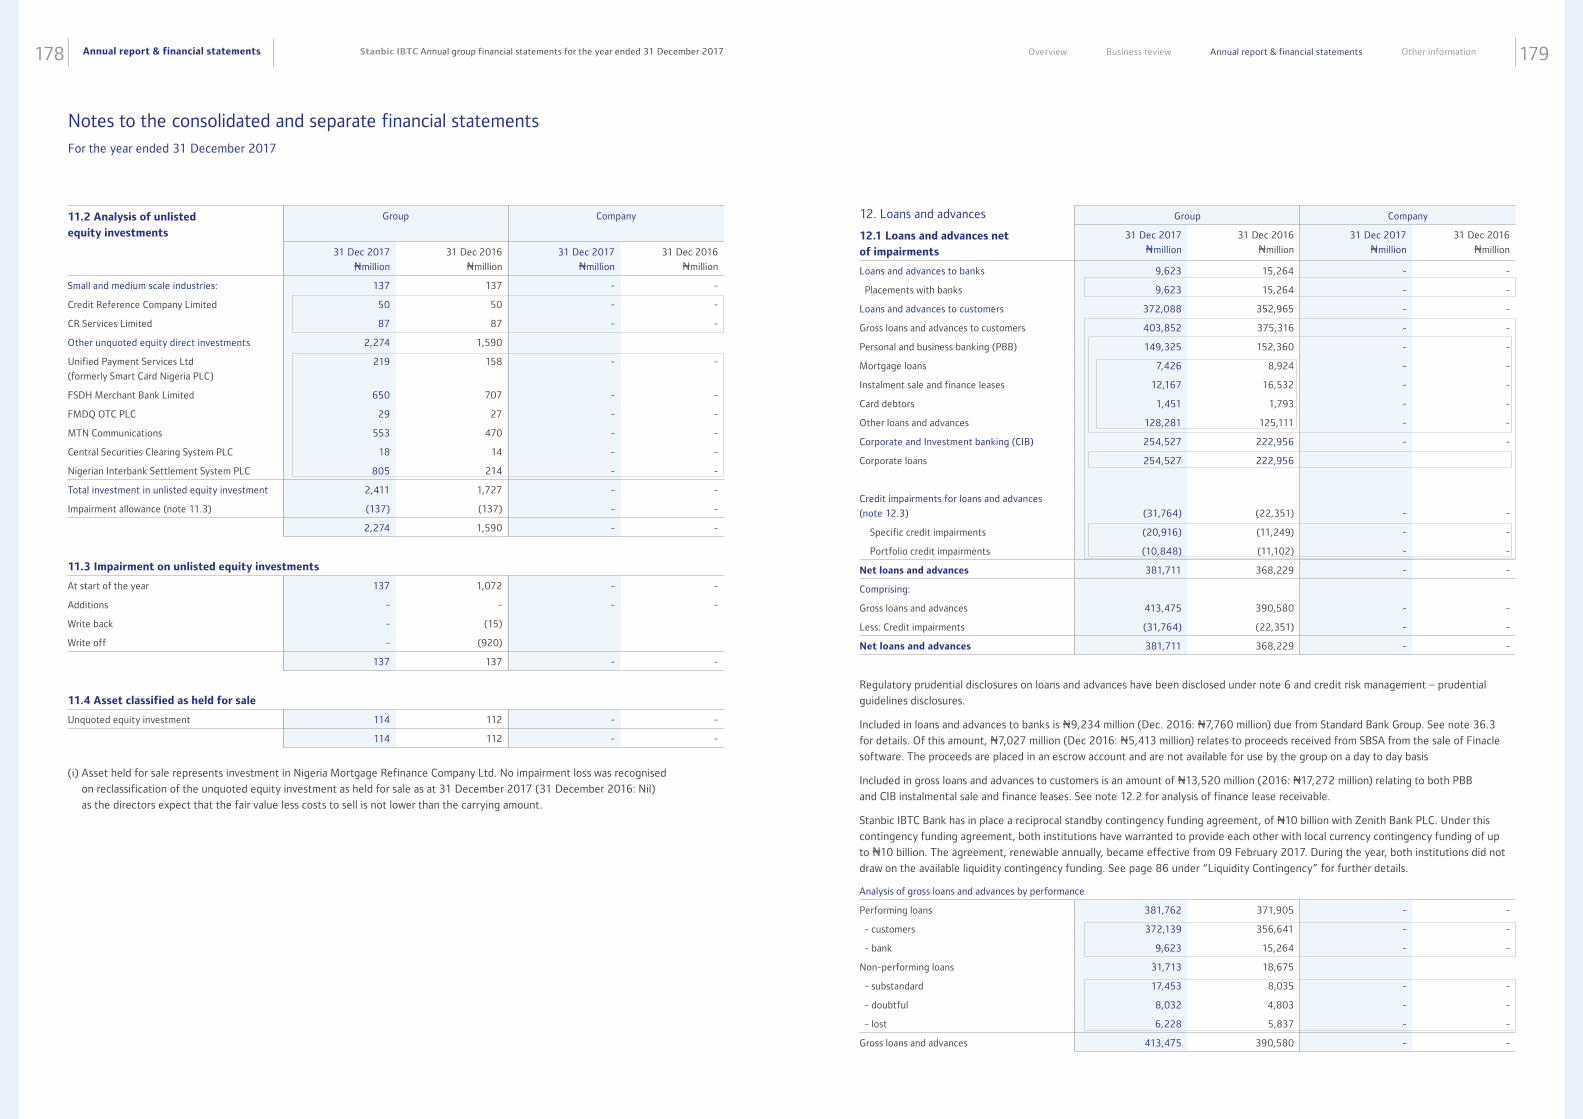
Annual report & financial statements178 179Stanbic IBTC Annual group financial statements for the year ended 31 December 2017 Overview Business review Annual report & financial statements Other information
11.2 Analysis of unlisted
equity investments
Group Company
31 Dec 2017
Nmillion
31 Dec 2016
Nmillion
31 Dec 2017
Nmillion
31 Dec 2016
Nmillion
Small and medium scale industries: 137 137 - -
Credit Reference Company Limited 50 50 - -
CR Services Limited 87 87 - -
Other unquoted equity direct investments 2,274 1,590
Unified Payment Services Ltd
(formerly Smart Card Nigeria PLC)
219 158 - -
FSDH Merchant Bank Limited 650 707 - -
FMDQ OTC PLC 29 27 - -
MTN Communications 553 470 - -
Central Securities Clearing System PLC 18 14 - -
Nigerian Interbank Settlement System PLC 805 214 - -
Total investment in unlisted equity investment 2,411 1,727 - -
Impairment allowance (note 11.3) (137) (137) - -
2,274 1,590 - -
11.3 Impairment on unlisted equity investments
At start of the year 137 1,072 - -
Additions - - - -
Write back - (15)
Write off - (920)
137 137 - -
11.4 Asset classified as held for sale
Unquoted equity investment 114 112 - -
114 112 - -
(i) Asset held for sale represents investment in Nigeria Mortgage Refinance Company Ltd. No impairment loss was recognised
on reclassification of the unquoted equity investment as held for sale as at 31 December 2017 (31 December 2016: Nil)
as the directors expect that the fair value less costs to sell is not lower than the carrying amount.
Group Company
12.1 Loans and advances net
of impairments
31 Dec 2017
Nmillion
31 Dec 2016
Nmillion
31 Dec 2017
Nmillion
31 Dec 2016
Nmillion
Loans and advances to banks 9,623 15,264 - -
Placements with banks 9,623 15,264 - -
Loans and advances to customers 372,088 352,965 - -
Gross loans and advances to customers 403,852 375,316 - -
Personal and business banking (PBB) 149,325 152,360 - -
Mortgage loans 7,426 8,924 - -
Instalment sale and finance leases 12,167 16,532 - -
Card debtors 1,451 1,793 - -
Other loans and advances 128,281 125,111 - -
Corporate and Investment banking (CIB) 254,527 222,956 - -
Corporate loans 254,527 222,956
Credit impairments for loans and advances
(note 12.3)
(31,764)
(22,351)
-
-
Specific credit impairments (20,916) (11,249) - -
Portfolio credit impairments (10,848) (11,102) - -
Net loans and advances 381,711 368,229 - -
Comprising:
Gross loans and advances 413,475 390,580 - -
Less: Credit impairments (31,764) (22,351) - -
Net loans and advances 381,711 368,229 - -
Regulatory prudential disclosures on loans and advances have been disclosed under note 6 and credit risk management – prudential
guidelines disclosures.
Included in loans and advances to banks is N9,234 million (Dec. 2016: N7,760 million) due from Standard Bank Group. See note 36.3
for details. Of this amount, N7,027 million (Dec 2016: N5,413 million) relates to proceeds received from SBSA from the sale of Finacle
software. The proceeds are placed in an escrow account and are not available for use by the group on a day to day basis
Included in gross loans and advances to customers is an amount of N13,520 million (2016: N17,272 million) relating to both PBB
and CIB instalmental sale and finance leases. See note 12.2 for analysis of finance lease receivable.
Stanbic IBTC Bank has in place a reciprocal standby contingency funding agreement, of N10 billion with Zenith Bank PLC. Under this
contingency funding agreement, both institutions have warranted to provide each other with local currency contingency funding of up
to N10 billion. The agreement, renewable annually, became effective from 09 February 2017. During the year, both institutions did not
draw on the available liquidity contingency funding. See page 86 under “Liquidity Contingency” for further details.
Analysis of gross loans and advances by performance
Performing loans 381,762 371,905 - -
- customers 372,139 356,641 - -
- bank 9,623 15,264 - -
Non-performing loans 31,713 18,675
- substandard 17,453 8,035 - -
- doubtful 8,032 4,803 - -
- lost 6,228 5,837 - -
Gross loans and advances 413,475 390,580 - -
12. Loans and advances
Notes to the consolidated and separate financial statements For the year ended 31 December 2017
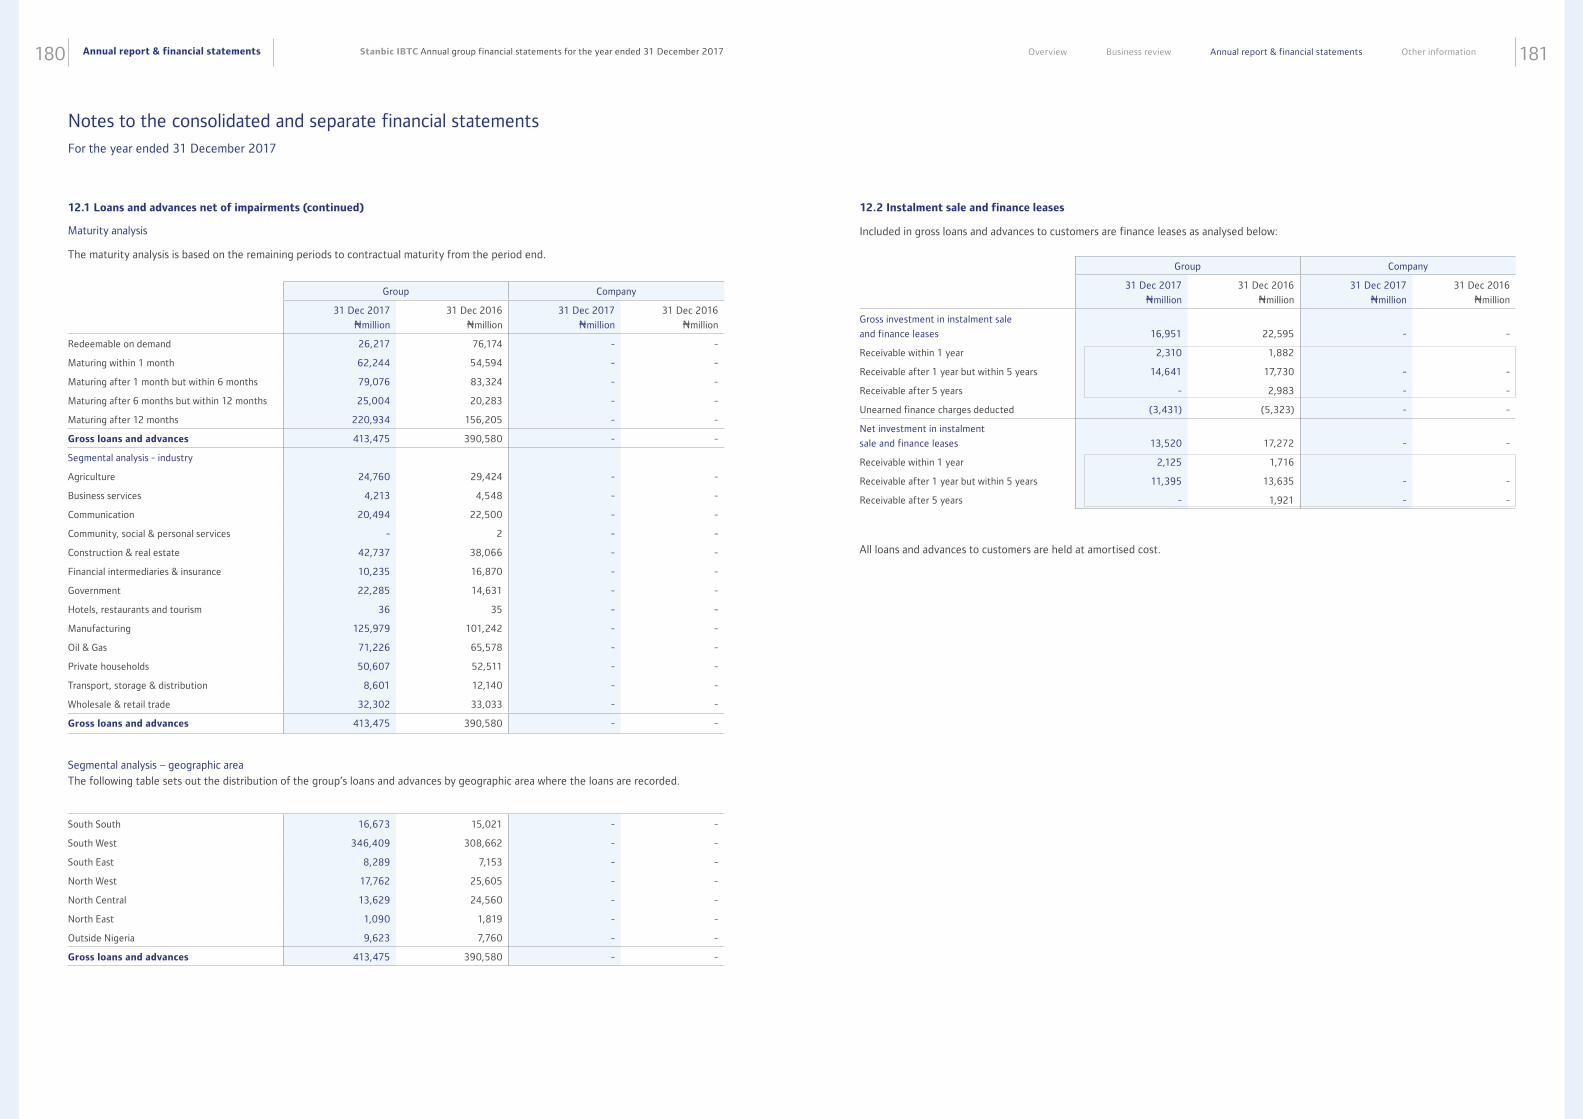
Annual report & financial statements180 181Stanbic IBTC Annual group financial statements for the year ended 31 December 2017 Overview Business review Annual report & financial statements Other information
Group Company
31 Dec 2017
Nmillion
31 Dec 2016
Nmillion
31 Dec 2017
Nmillion
31 Dec 2016
Nmillion
Redeemable on demand 26,217 76,174 - -
Maturing within 1 month 62,244 54,594 - -
Maturing after 1 month but within 6 months 79,076 83,324 - -
Maturing after 6 months but within 12 months 25,004 20,283 - -
Maturing after 12 months 220,934 156,205 - -
Gross loans and advances 413,475 390,580 - -
Segmental analysis - industry
Agriculture 24,760 29,424 - -
Business services 4,213 4,548 - -
Communication 20,494 22,500 - -
Community, social & personal services - 2 - -
Construction & real estate 42,737 38,066 - -
Financial intermediaries & insurance 10,235 16,870 - -
Government 22,285 14,631 - -
Hotels, restaurants and tourism 36 35 - -
Manufacturing 125,979 101,242 - -
Oil & Gas 71,226 65,578 - -
Private households 50,607 52,511 - -
Transport, storage & distribution 8,601 12,140 - -
Wholesale & retail trade 32,302 33,033 - -
Gross loans and advances 413,475 390,580 - -
Segmental analysis – geographic area
The following table sets out the distribution of the group’s loans and advances by geographic area where the loans are recorded.
South South 16,673 15,021 - -
South West 346,409 308,662 - -
South East 8,289 7,153 - -
North West 17,762 25,605 - -
North Central 13,629 24,560 - -
North East 1,090 1,819 - -
Outside Nigeria 9,623 7,760 - -
Gross loans and advances 413,475 390,580 - -
12.1 Loans and advances net of impairments (continued)
Maturity analysis
The maturity analysis is based on the remaining periods to contractual maturity from the period end.Group Company
31 Dec 2017
Nmillion
31 Dec 2016
Nmillion
31 Dec 2017
Nmillion
31 Dec 2016
Nmillion
Gross investment in instalment sale
and finance leases
16,951
22,595
-
-
Receivable within 1 year 2,310 1,882
Receivable after 1 year but within 5 years 14,641 17,730 - -
Receivable after 5 years - 2,983 - -
Unearned finance charges deducted (3,431) (5,323) - -
Net investment in instalment
sale and finance leases
13,520
17,272
-
-
Receivable within 1 year 2,125 1,716
Receivable after 1 year but within 5 years 11,395 13,635 - -
Receivable after 5 years - 1,921 - -
12.2 Instalment sale and finance leases
Included in gross loans and advances to customers are finance leases as analysed below:
All loans and advances to customers are held at amortised cost.
Notes to the consolidated and separate financial statements For the year ended 31 December 2017
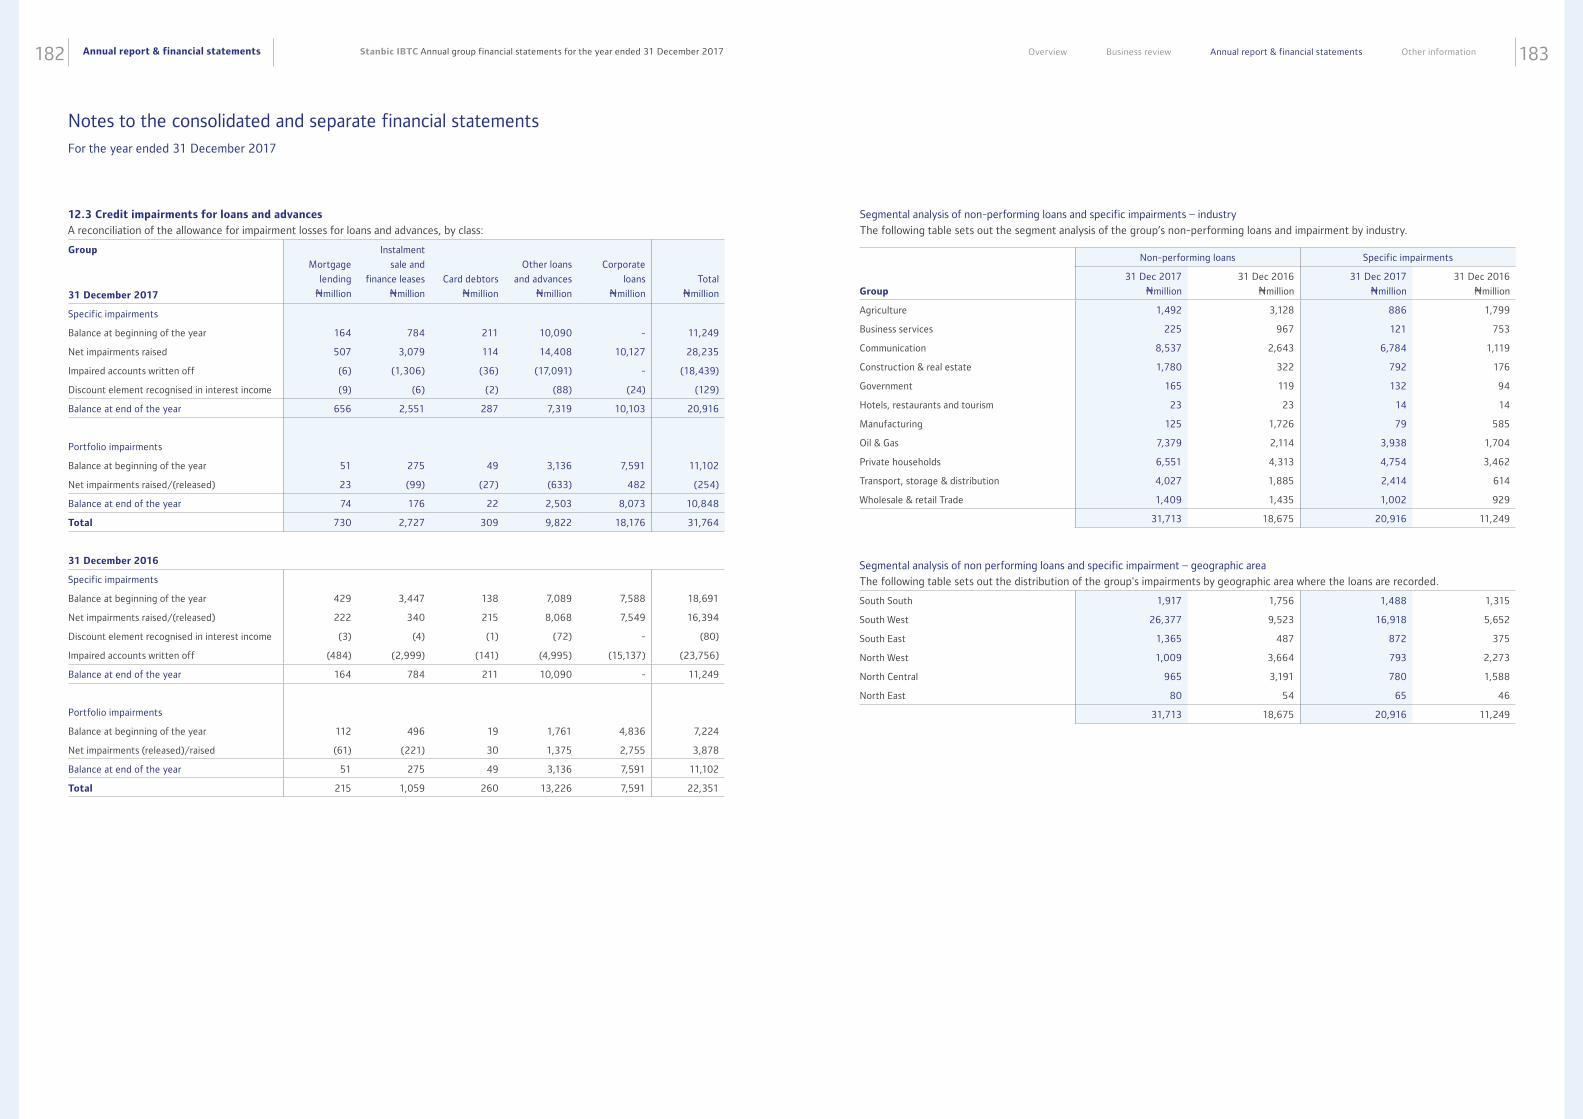
Annual report & financial statements182 183Stanbic IBTC Annual group financial statements for the year ended 31 December 2017 Overview Business review Annual report & financial statements Other information
Group
31 December 2017
Mortgage
lending
Nmillion
Instalment
sale and
finance leases
Nmillion
Card debtors
Nmillion
Other loans
and advances
Nmillion
Corporate
loans
Nmillion
Total
Nmillion
Specific impairments
Balance at beginning of the year 164 784 211 10,090 - 11,249
Net impairments raised 507 3,079 114 14,408 10,127 28,235
Impaired accounts written off (6) (1,306) (36) (17,091) - (18,439)
Discount element recognised in interest income (9) (6) (2) (88) (24) (129)
Balance at end of the year 656 2,551 287 7,319 10,103 20,916
Portfolio impairments
Balance at beginning of the year 51 275 49 3,136 7,591 11,102
Net impairments raised/(released) 23 (99) (27) (633) 482 (254)
Balance at end of the year 74 176 22 2,503 8,073 10,848
Total 730 2,727 309 9,822 18,176 31,764
31 December 2016
Specific impairments
Balance at beginning of the year 429 3,447 138 7,089 7,588 18,691
Net impairments raised/(released) 222 340 215 8,068 7,549 16,394
Discount element recognised in interest income (3) (4) (1) (72) - (80)
Impaired accounts written off (484) (2,999) (141) (4,995) (15,137) (23,756)
Balance at end of the year 164 784 211 10,090 - 11,249
Portfolio impairments
Balance at beginning of the year 112 496 19 1,761 4,836 7,224
Net impairments (released)/raised (61) (221) 30 1,375 2,755 3,878
Balance at end of the year 51 275 49 3,136 7,591 11,102
Total 215 1,059 260 13,226 7,591 22,351
12.3 Credit impairments for loans and advances
A reconciliation of the allowance for impairment losses for loans and advances, by class:
Non-performing loans Specific impairments
Group
31 Dec 2017
Nmillion
31 Dec 2016
Nmillion
31 Dec 2017
Nmillion
31 Dec 2016
Nmillion
Agriculture 1,492 3,128 886 1,799
Business services 225 967 121 753
Communication 8,537 2,643 6,784 1,119
Construction & real estate 1,780 322 792 176
Government 165 119 132 94
Hotels, restaurants and tourism 23 23 14 14
Manufacturing 125 1,726 79 585
Oil & Gas 7,379 2,114 3,938 1,704
Private households 6,551 4,313 4,754 3,462
Transport, storage & distribution 4,027 1,885 2,414 614
Wholesale & retail Trade 1,409 1,435 1,002 929
31,713 18,675 20,916 11,249
Segmental analysis of non performing loans and specific impairment – geographic area
The following table sets out the distribution of the group's impairments by geographic area where the loans are recorded.
South South 1,917 1,756 1,488 1,315
South West 26,377 9,523 16,918 5,652
South East 1,365 487 872 375
North West 1,009 3,664 793 2,273
North Central 965 3,191 780 1,588
North East 80 54 65 46
31,713 18,675 20,916 11,249
Segmental analysis of non-performing loans and specific impairments – industry
The following table sets out the segment analysis of the group’s non-performing loans and impairment by industry.
Notes to the consolidated and separate financial statements For the year ended 31 December 2017
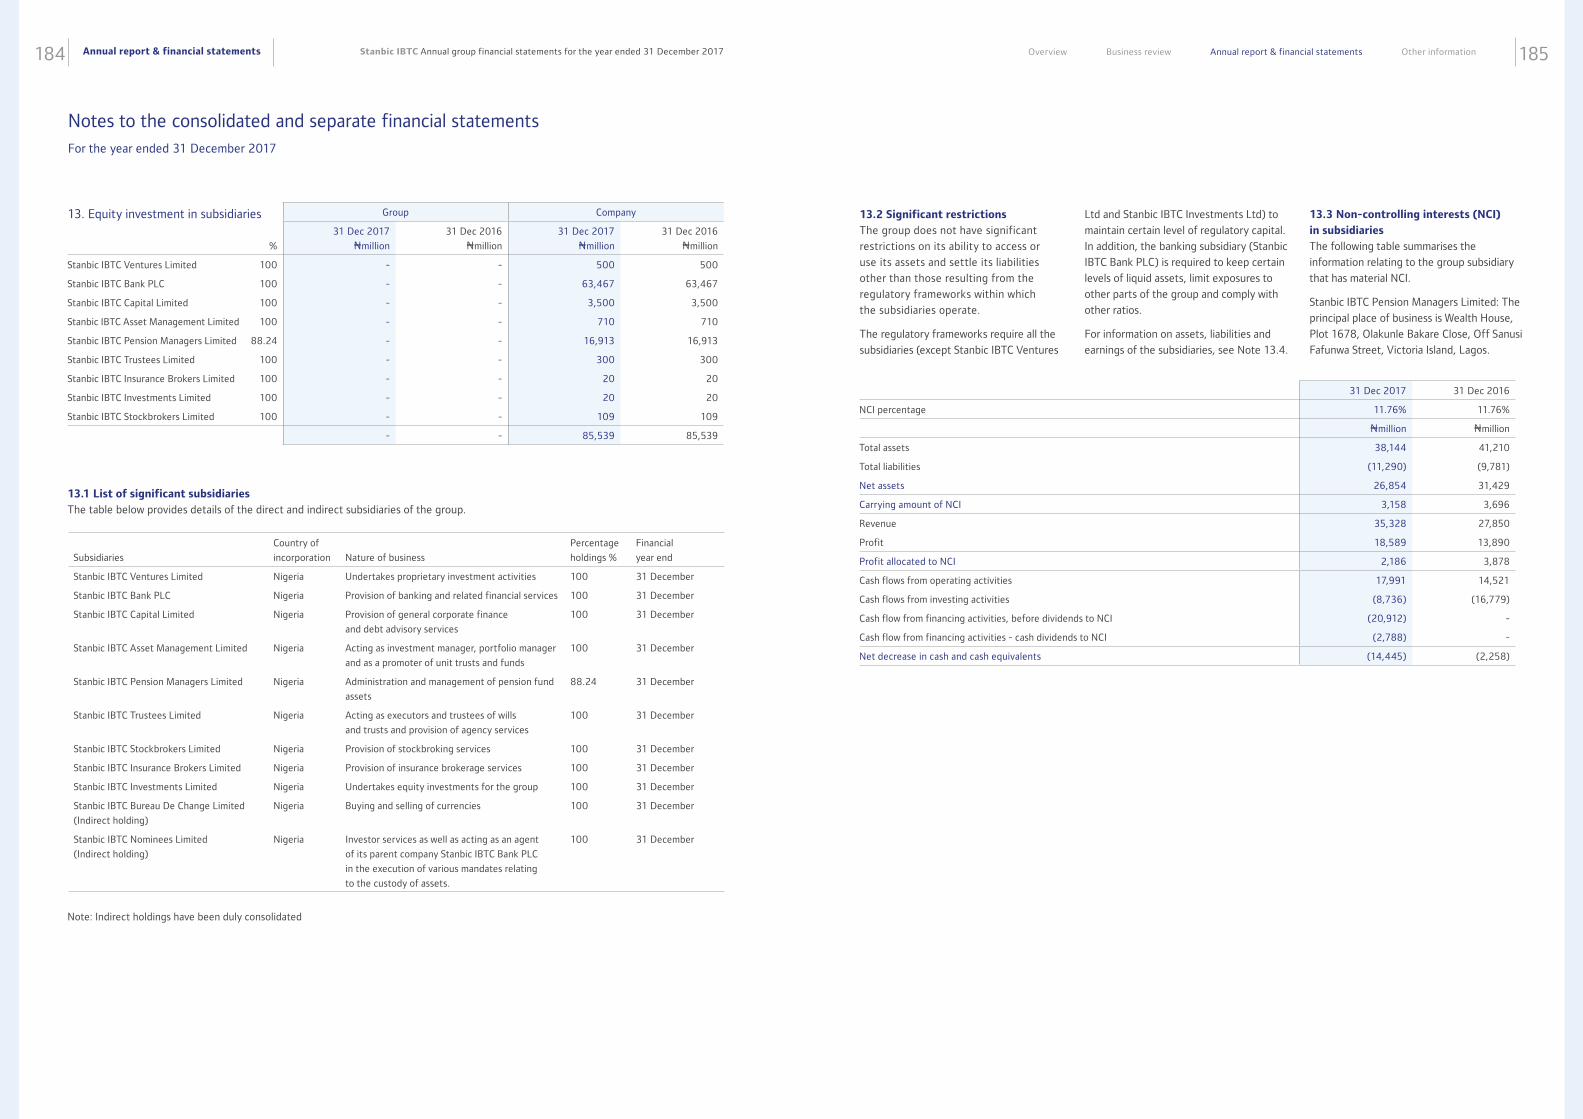
Annual report & financial statements184 185Stanbic IBTC Annual group financial statements for the year ended 31 December 2017 Overview Business review Annual report & financial statements Other information
Group Company
%
31 Dec 2017
Nmillion
31 Dec 2016
Nmillion
31 Dec 2017
Nmillion
31 Dec 2016
Nmillion
Stanbic IBTC Ventures Limited 100 - - 500 500
Stanbic IBTC Bank PLC 100 - - 63,467 63,467
Stanbic IBTC Capital Limited 100 - - 3,500 3,500
Stanbic IBTC Asset Management Limited 100 - - 710 710
Stanbic IBTC Pension Managers Limited 88.24 - - 16,913 16,913
Stanbic IBTC Trustees Limited 100 - - 300 300
Stanbic IBTC Insurance Brokers Limited 100 - - 20 20
Stanbic IBTC Investments Limited 100 - - 20 20
Stanbic IBTC Stockbrokers Limited 100 - - 109 109
- - 85,539 85,539
13. Equity investment in subsidiaries
Subsidiaries
Country of
incorporation Nature of business
Percentage
holdings %
Financial
year end
Stanbic IBTC Ventures Limited Nigeria Undertakes proprietary investment activities 100 31 December
Stanbic IBTC Bank PLC Nigeria Provision of banking and related financial services 100 31 December
Stanbic IBTC Capital Limited Nigeria Provision of general corporate finance
and debt advisory services
100 31 December
Stanbic IBTC Asset Management Limited Nigeria Acting as investment manager, portfolio manager
and as a promoter of unit trusts and funds
100 31 December
Stanbic IBTC Pension Managers Limited Nigeria Administration and management of pension fund
assets
88.24 31 December
Stanbic IBTC Trustees Limited Nigeria Acting as executors and trustees of wills
and trusts and provision of agency services
100 31 December
Stanbic IBTC Stockbrokers Limited Nigeria Provision of stockbroking services 100 31 December
Stanbic IBTC Insurance Brokers Limited Nigeria Provision of insurance brokerage services 100 31 December
Stanbic IBTC Investments Limited Nigeria Undertakes equity investments for the group 100 31 December
Stanbic IBTC Bureau De Change Limited
(Indirect holding)
Nigeria Buying and selling of currencies 100 31 December
Stanbic IBTC Nominees Limited
(Indirect holding)
Nigeria Investor services as well as acting as an agent
of its parent company Stanbic IBTC Bank PLC
in the execution of various mandates relating
to the custody of assets.
100 31 December
13.1 List of significant subsidiaries
The table below provides details of the direct and indirect subsidiaries of the group.
13.2 Significant restrictions
The group does not have significant
restrictions on its ability to access or
use its assets and settle its liabilities
other than those resulting from the
regulatory frameworks within which
the subsidiaries operate.
The regulatory frameworks require all the
subsidiaries (except Stanbic IBTC Ventures
Ltd and Stanbic IBTC Investments Ltd) to
maintain certain level of regulatory capital.
In addition, the banking subsidiary (Stanbic
IBTC Bank PLC) is required to keep certain
levels of liquid assets, limit exposures to
other parts of the group and comply with
other ratios.
For information on assets, liabilities and
earnings of the subsidiaries, see Note 13.4.
13.3 Non-controlling interests (NCI)
in subsidiaries
The following table summarises the
information relating to the group subsidiary
that has material NCI.
Stanbic IBTC Pension Managers Limited: The
principal place of business is Wealth House,
Plot 1678, Olakunle Bakare Close, Off Sanusi
Fafunwa Street, Victoria Island, Lagos.
31 Dec 2017 31 Dec 2016
NCI percentage 11.76% 11.76%
Nmillion Nmillion
Total assets 38,144 41,210
Total liabilities (11,290) (9,781)
Net assets 26,854 31,429
Carrying amount of NCI 3,158 3,696
Revenue 35,328 27,850
Profit 18,589 13,890
Profit allocated to NCI 2,186 3,878
Cash flows from operating activities 17,991 14,521
Cash flows from investing activities (8,736) (16,779)
Cash flow from financing activities, before dividends to NCI (20,912) -
Cash flow from financing activities - cash dividends to NCI (2,788) -
Net decrease in cash and cash equivalents (14,445) (2,258)
Note: Indirect holdings have been duly consolidated
Notes to the consolidated and separate financial statements For the year ended 31 December 2017
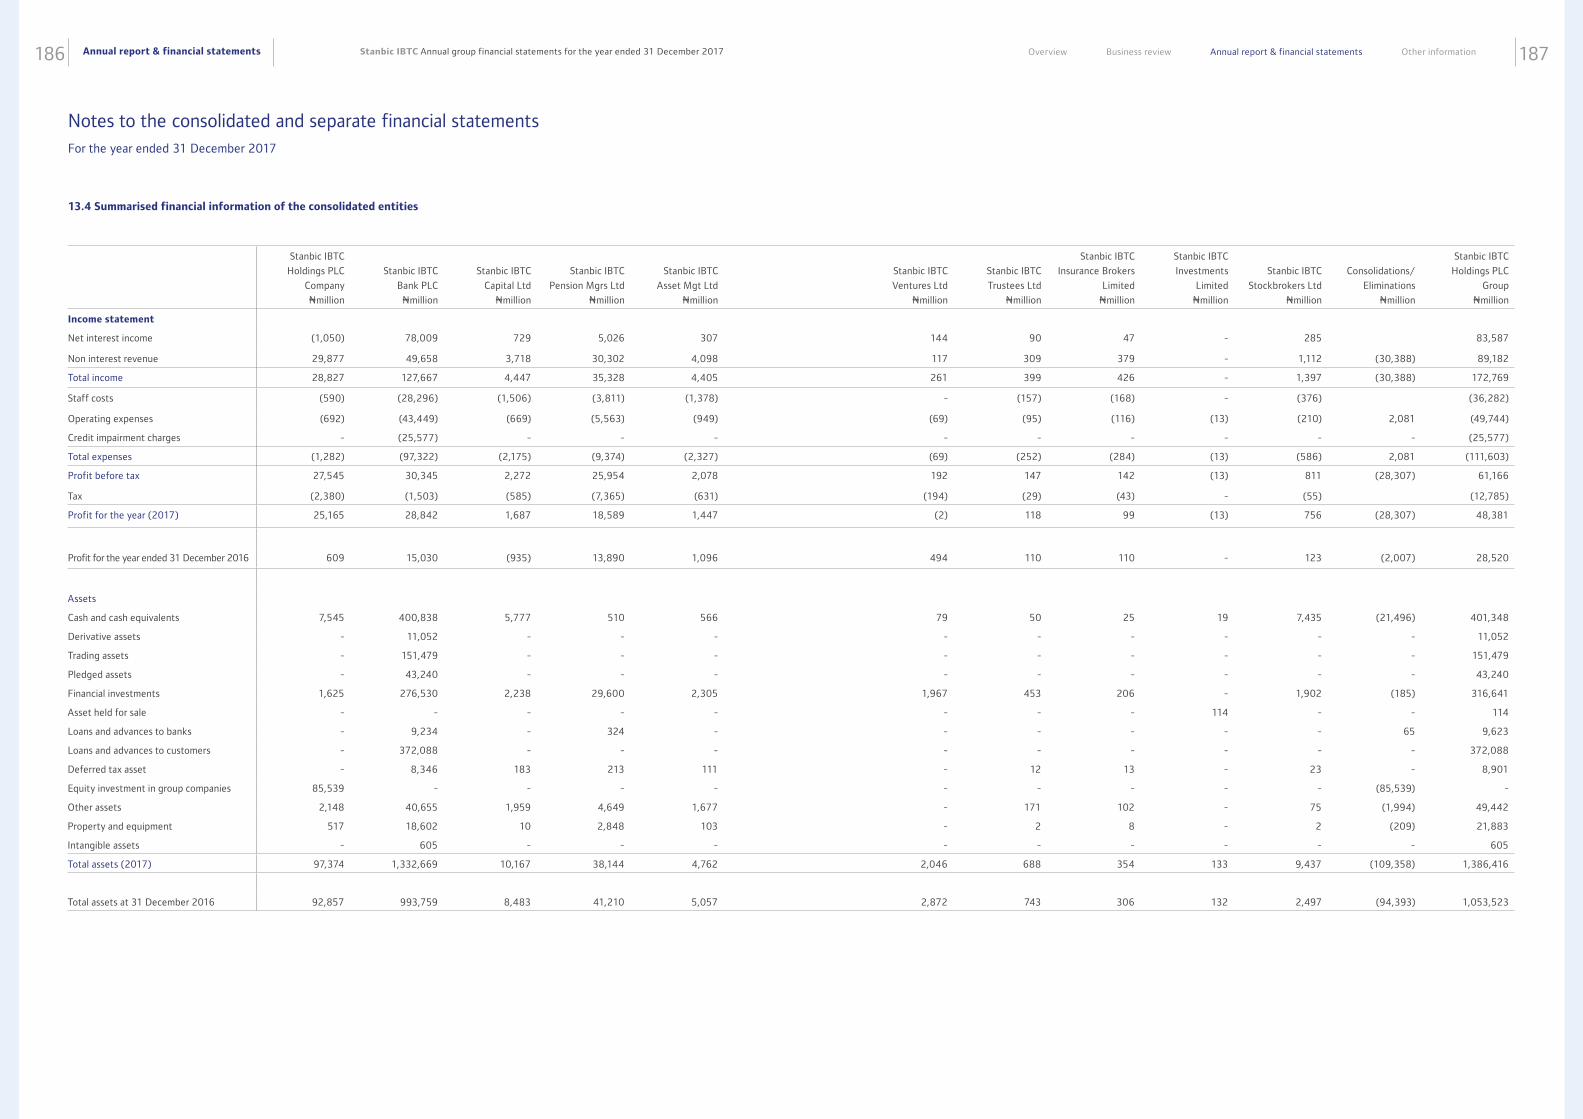
Annual report & financial statements186 187Stanbic IBTC Annual group financial statements for the year ended 31 December 2017 Overview Business review Annual report & financial statements Other information
13.4 Summarised financial information of the consolidated entities
Stanbic IBTC
Holdings PLC
Company
Nmillion
Stanbic IBTC
Bank PLC
Nmillion
Stanbic IBTC
Capital Ltd
Nmillion
Stanbic IBTC
Pension Mgrs Ltd
Nmillion
Stanbic IBTC
Asset Mgt Ltd
Nmillion
Stanbic IBTC
Ventures Ltd
Nmillion
Stanbic IBTC
Trustees Ltd
Nmillion
Stanbic IBTC
Insurance Brokers
Limited
Nmillion
Stanbic IBTC
Investments
Limited
Nmillion
Stanbic IBTC
Stockbrokers Ltd
Nmillion
Consolidations/
Eliminations
Nmillion
Stanbic IBTC
Holdings PLC
Group
Nmillion
Income statement
Net interest income (1,050) 78,009 729 5,026 307 144 90 47 - 285 83,587
Non interest revenue 29,877 49,658 3,718 30,302 4,098 117 309 379 - 1,112 (30,388) 89,182
Total income 28,827 127,667 4,447 35,328 4,405 261 399 426 - 1,397 (30,388) 172,769
Staff costs (590) (28,296) (1,506) (3,811) (1,378) - (157) (168) - (376) (36,282)
Operating expenses (692) (43,449) (669) (5,563) (949) (69) (95) (116) (13) (210) 2,081 (49,744)
Credit impairment charges - (25,577) - - - - - - - - - (25,577)
Total expenses (1,282) (97,322) (2,175) (9,374) (2,327) (69) (252) (284) (13) (586) 2,081 (111,603)
Profit before tax 27,545 30,345 2,272 25,954 2,078 192 147 142 (13) 811 (28,307) 61,166
Tax (2,380) (1,503) (585) (7,365) (631) (194) (29) (43) - (55) (12,785)
Profit for the year (2017) 25,165 28,842 1,687 18,589 1,447 (2) 118 99 (13) 756 (28,307) 48,381
Profit for the year ended 31 December 2016 609 15,030 (935) 13,890 1,096 494 110 110 - 123 (2,007) 28,520
Assets
Cash and cash equivalents 7,545 400,838 5,777 510 566 79 50 25 19 7,435 (21,496) 401,348
Derivative assets - 11,052 - - - - - - - - - 11,052
Trading assets - 151,479 - - - - - - - - - 151,479
Pledged assets - 43,240 - - - - - - - - - 43,240
Financial investments 1,625 276,530 2,238 29,600 2,305 1,967 453 206 - 1,902 (185) 316,641
Asset held for sale - - - - - - - - 114 - - 114
Loans and advances to banks - 9,234 - 324 - - - - - - 65 9,623
Loans and advances to customers - 372,088 - - - - - - - - - 372,088
Deferred tax asset - 8,346 183 213 111 - 12 13 - 23 - 8,901
Equity investment in group companies 85,539 - - - - - - - - - (85,539) -
Other assets 2,148 40,655 1,959 4,649 1,677 - 171 102 - 75 (1,994) 49,442
Property and equipment 517 18,602 10 2,848 103 - 2 8 - 2 (209) 21,883
Intangible assets - 605 - - - - - - - - - 605
Total assets (2017) 97,374 1,332,669 10,167 38,144 4,762 2,046 688 354 133 9,437 (109,358) 1,386,416
Total assets at 31 December 2016 92,857 993,759 8,483 41,210 5,057 2,872 743 306 132 2,497 (94,393) 1,053,523
Notes to the consolidated and separate financial statements For the year ended 31 December 2017
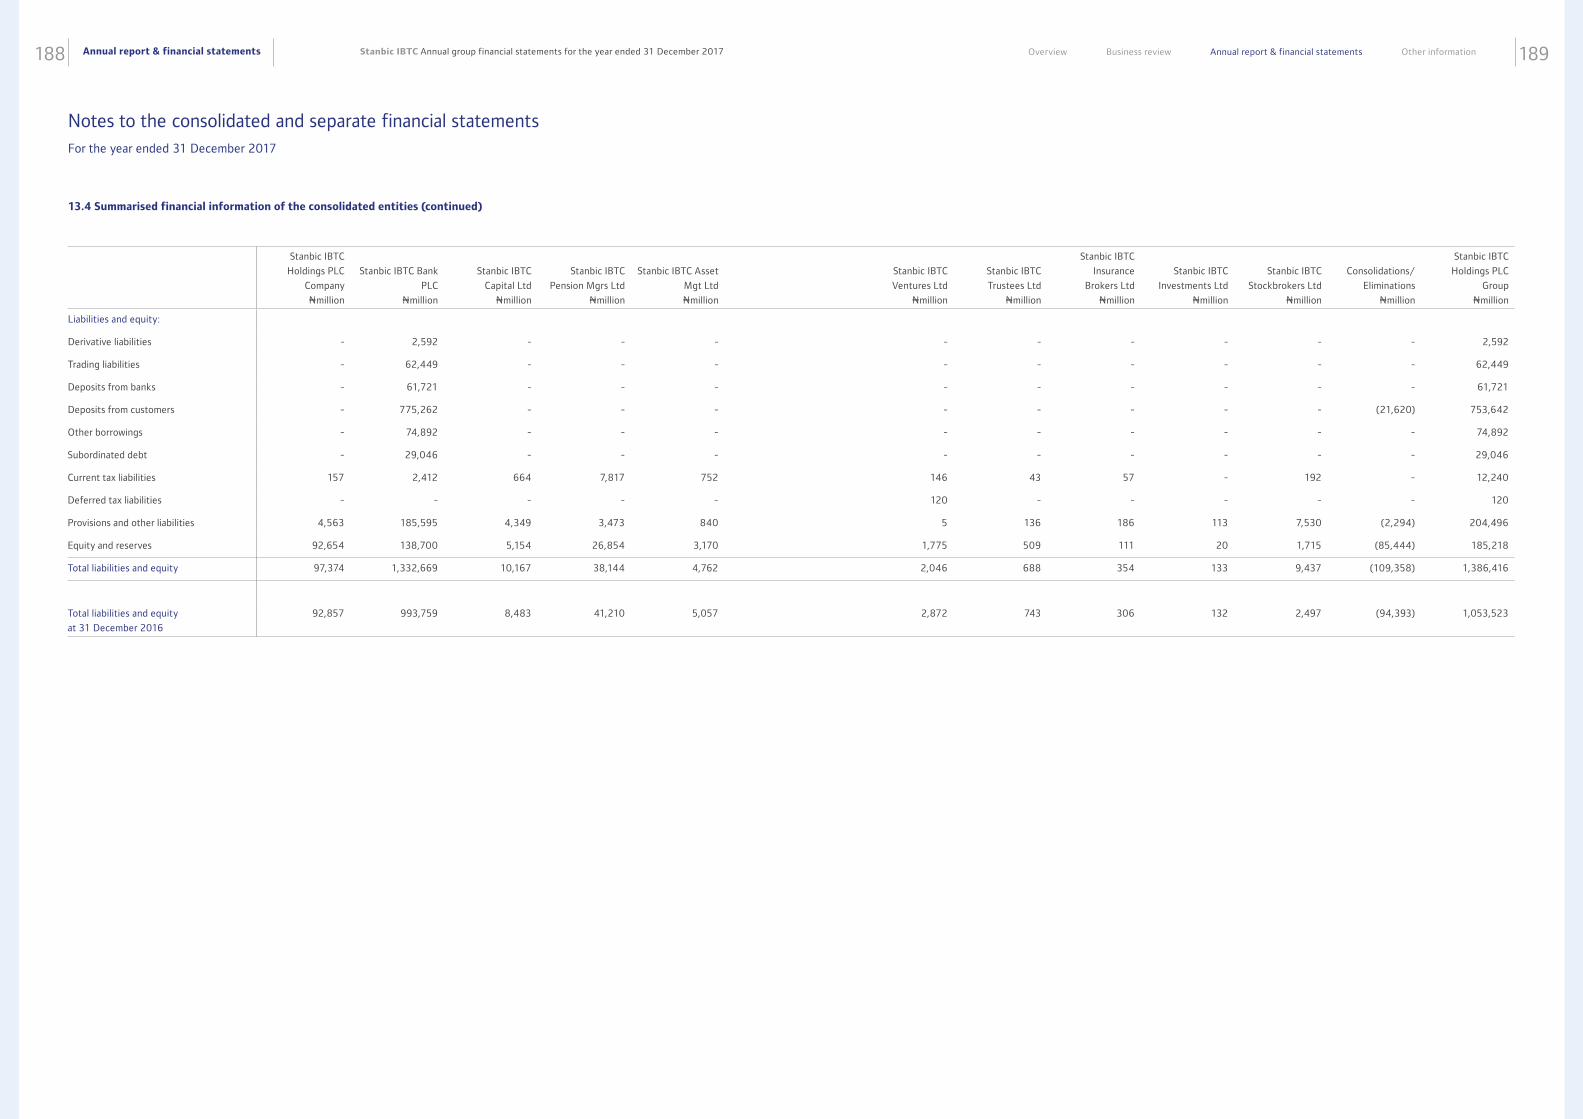
Annual report & financial statements188 189Stanbic IBTC Annual group financial statements for the year ended 31 December 2017 Overview Business review Annual report & financial statements Other information
13.4 Summarised financial information of the consolidated entities (continued)
Stanbic IBTC
Holdings PLC
Company
Nmillion
Stanbic IBTC Bank
PLC
Nmillion
Stanbic IBTC
Capital Ltd
Nmillion
Stanbic IBTC
Pension Mgrs Ltd
Nmillion
Stanbic IBTC Asset
Mgt Ltd
Nmillion
Stanbic IBTC
Ventures Ltd
Nmillion
Stanbic IBTC
Trustees Ltd
Nmillion
Stanbic IBTC
Insurance
Brokers Ltd
Nmillion
Stanbic IBTC
Investments Ltd
Nmillion
Stanbic IBTC
Stockbrokers Ltd
Nmillion
Consolidations/
Eliminations
Nmillion
Stanbic IBTC
Holdings PLC
Group
Nmillion
Liabilities and equity:
Derivative liabilities - 2,592 - - - - - - - - - 2,592
Trading liabilities - 62,449 - - - - - - - - - 62,449
Deposits from banks - 61,721 - - - - - - - - - 61,721
Deposits from customers - 775,262 - - - - - - - - (21,620) 753,642
Other borrowings - 74,892 - - - - - - - - - 74,892
Subordinated debt - 29,046 - - - - - - - - - 29,046
Current tax liabilities 157 2,412 664 7,817 752 146 43 57 - 192 - 12,240
Deferred tax liabilities - - - - - 120 - - - - - 120
Provisions and other liabilities 4,563 185,595 4,349 3,473 840 5 136 186 113 7,530 (2,294) 204,496
Equity and reserves 92,654 138,700 5,154 26,854 3,170 1,775 509 111 20 1,715 (85,444) 185,218
Total liabilities and equity 97,374 1,332,669 10,167 38,144 4,762 2,046 688 354 133 9,437 (109,358) 1,386,416
Total liabilities and equity
at 31 December 2016
92,857 993,759 8,483 41,210 5,057 2,872 743 306 132 2,497 (94,393) 1,053,523
Notes to the consolidated and separate financial statements For the year ended 31 December 2017
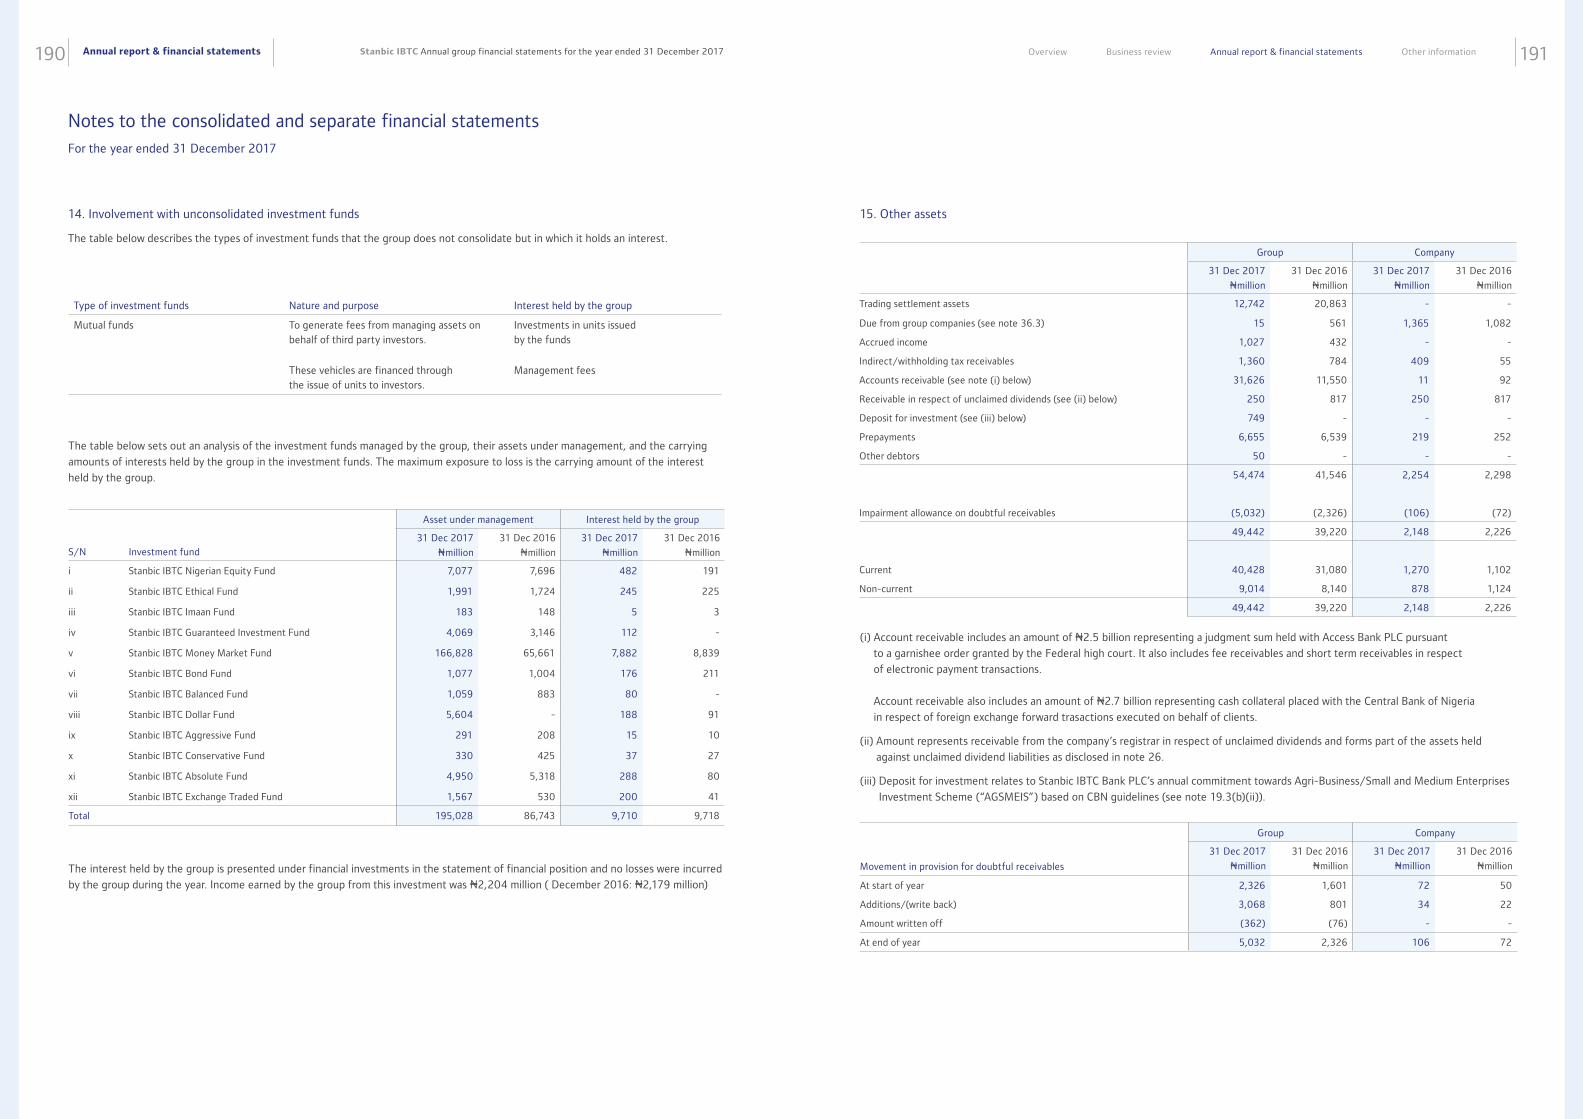
Annual report & financial statements190 191Stanbic IBTC Annual group financial statements for the year ended 31 December 2017 Overview Business review Annual report & financial statements Other information
14. Involvement with unconsolidated investment funds
The table below describes the types of investment funds that the group does not consolidate but in which it holds an interest.
Type of investment funds Nature and purpose Interest held by the group
Mutual funds To generate fees from managing assets on behalf of third party investors.
Investments in units issued by the funds
These vehicles are financed through the issue of units to investors.
Management fees
The table below sets out an analysis of the investment funds managed by the group, their assets under management, and the carrying
amounts of interests held by the group in the investment funds. The maximum exposure to loss is the carrying amount of the interest
held by the group.
Asset under management Interest held by the group
S/N Investment fund
31 Dec 2017
Nmillion
31 Dec 2016
Nmillion
31 Dec 2017
Nmillion
31 Dec 2016
Nmillion
i Stanbic IBTC Nigerian Equity Fund 7,077 7,696 482 191
ii Stanbic IBTC Ethical Fund 1,991 1,724 245 225
iii Stanbic IBTC Imaan Fund 183 148 5 3
iv Stanbic IBTC Guaranteed Investment Fund 4,069 3,146 112 -
v Stanbic IBTC Money Market Fund 166,828 65,661 7,882 8,839
vi Stanbic IBTC Bond Fund 1,077 1,004 176 211
vii Stanbic IBTC Balanced Fund 1,059 883 80 -
viii Stanbic IBTC Dollar Fund 5,604 - 188 91
ix Stanbic IBTC Aggressive Fund 291 208 15 10
x Stanbic IBTC Conservative Fund 330 425 37 27
xi Stanbic IBTC Absolute Fund 4,950 5,318 288 80
xii Stanbic IBTC Exchange Traded Fund 1,567 530 200 41
Total 195,028 86,743 9,710 9,718
The interest held by the group is presented under financial investments in the statement of financial position and no losses were incurred
by the group during the year. Income earned by the group from this investment was N2,204 million ( December 2016: N2,179 million)
15. Other assets
(i) Account receivable includes an amount of N2.5 billion representing a judgment sum held with Access Bank PLC pursuant
to a garnishee order granted by the Federal high court. It also includes fee receivables and short term receivables in respect
of electronic payment transactions.
Account receivable also includes an amount of N2.7 billion representing cash collateral placed with the Central Bank of Nigeria
in respect of foreign exchange forward trasactions executed on behalf of clients.
(ii) Amount represents receivable from the company’s registrar in respect of unclaimed dividends and forms part of the assets held
against unclaimed dividend liabilities as disclosed in note 26.
(iii) Deposit for investment relates to Stanbic IBTC Bank PLC’s annual commitment towards Agri-Business/Small and Medium Enterprises
Investment Scheme (“AGSMEIS”) based on CBN guidelines (see note 19.3(b)(ii)).
Group Company
31 Dec 2017
Nmillion
31 Dec 2016
Nmillion
31 Dec 2017
Nmillion
31 Dec 2016
Nmillion
Trading settlement assets 12,742 20,863 - -
Due from group companies (see note 36.3) 15 561 1,365 1,082
Accrued income 1,027 432 - -
Indirect/withholding tax receivables 1,360 784 409 55
Accounts receivable (see note (i) below) 31,626 11,550 11 92
Receivable in respect of unclaimed dividends (see (ii) below) 250 817 250 817
Deposit for investment (see (iii) below) 749 - - -
Prepayments 6,655 6,539 219 252
Other debtors 50 - - -
54,474 41,546 2,254 2,298
Impairment allowance on doubtful receivables (5,032) (2,326) (106) (72)
49,442 39,220 2,148 2,226
Current 40,428 31,080 1,270 1,102
Non-current 9,014 8,140 878 1,124
49,442 39,220 2,148 2,226
Group Company
Movement in provision for doubtful receivables
31 Dec 2017
Nmillion
31 Dec 2016
Nmillion
31 Dec 2017
Nmillion
31 Dec 2016
Nmillion
At start of year 2,326 1,601 72 50
Additions/(write back) 3,068 801 34 22
Amount written off (362) (76) - -
At end of year 5,032 2,326 106 72
Notes to the consolidated and separate financial statements For the year ended 31 December 2017
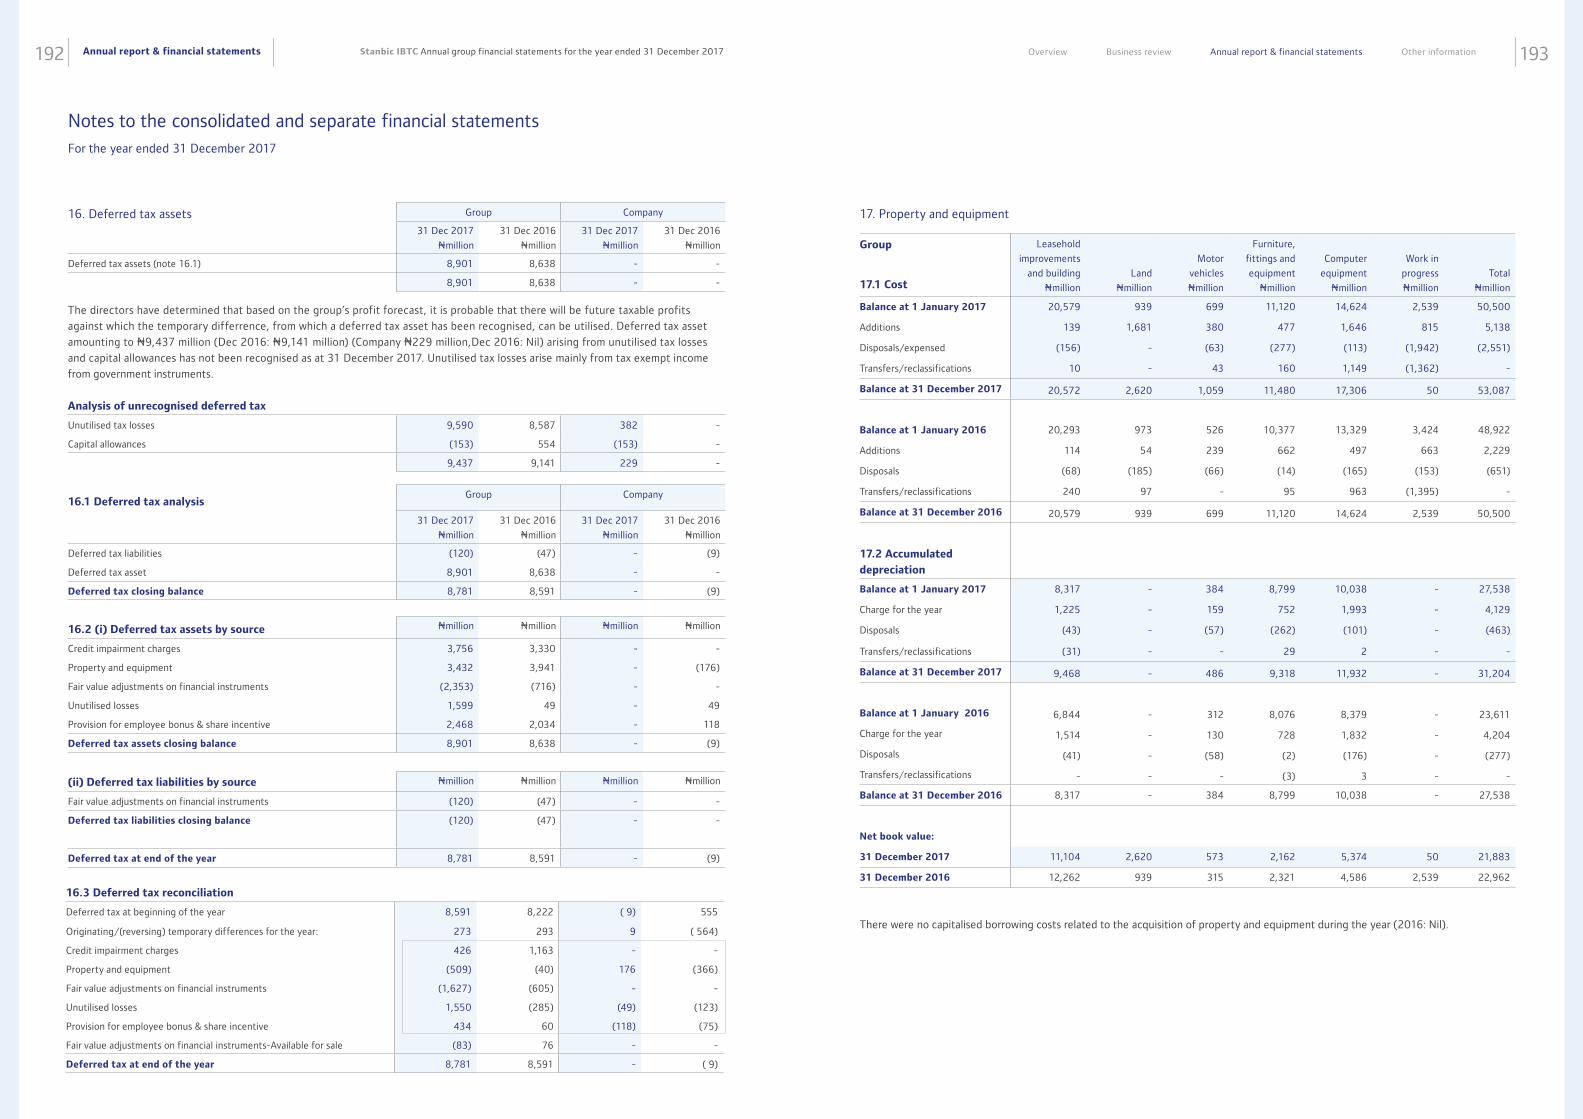
Annual report & financial statements192 193Stanbic IBTC Annual group financial statements for the year ended 31 December 2017 Overview Business review Annual report & financial statements Other information
16. Deferred tax assets Group Company
31 Dec 2017
Nmillion
31 Dec 2016
Nmillion
31 Dec 2017
Nmillion
31 Dec 2016
Nmillion
Deferred tax assets (note 16.1) 8,901 8,638 - -
8,901 8,638 - -
16.1 Deferred tax analysisGroup Company
31 Dec 2017
Nmillion
31 Dec 2016
Nmillion
31 Dec 2017
Nmillion
31 Dec 2016
Nmillion
Deferred tax liabilities (120) (47) - (9)
Deferred tax asset 8,901 8,638 - -
Deferred tax closing balance 8,781 8,591 - (9)
16.2 (i) Deferred tax assets by source Nmillion Nmillion Nmillion Nmillion
Credit impairment charges 3,756 3,330 - -
Property and equipment 3,432 3,941 - (176)
Fair value adjustments on financial instruments (2,353) (716) - -
Unutilised losses 1,599 49 - 49
Provision for employee bonus & share incentive 2,468 2,034 - 118
Deferred tax assets closing balance 8,901 8,638 - (9)
(ii) Deferred tax liabilities by source Nmillion Nmillion Nmillion Nmillion
Fair value adjustments on financial instruments (120) (47) - -
Deferred tax liabilities closing balance (120) (47) - -
Deferred tax at end of the year 8,781 8,591 - (9)
Analysis of unrecognised deferred tax
Unutilised tax losses 9,590 8,587 382 -
Capital allowances (153) 554 (153) -
9,437 9,141 229 -
The directors have determined that based on the group’s profit forecast, it is probable that there will be future taxable profits
against which the temporary differrence, from which a deferred tax asset has been recognised, can be utilised. Deferred tax asset
amounting to N9,437 million (Dec 2016: N9,141 million) (Company N229 million,Dec 2016: Nil) arising from unutilised tax losses
and capital allowances has not been recognised as at 31 December 2017. Unutilised tax losses arise mainly from tax exempt income
from government instruments.
16.3 Deferred tax reconciliation
Deferred tax at beginning of the year 8,591 8,222 ( 9) 555
Originating/(reversing) temporary differences for the year: 273 293 9 ( 564)
Credit impairment charges 426 1,163 - -
Property and equipment (509) (40) 176 (366)
Fair value adjustments on financial instruments (1,627) (605) - -
Unutilised losses 1,550 (285) (49) (123)
Provision for employee bonus & share incentive 434 60 (118) (75)
Fair value adjustments on financial instruments-Available for sale (83) 76 - -
Deferred tax at end of the year 8,781 8,591 - ( 9)
17. Property and equipment
There were no capitalised borrowing costs related to the acquisition of property and equipment during the year (2016: Nil).
Group
17.1 Cost
Leasehold
improvements
and building
Nmillion
Land
Nmillion
Motor
vehicles
Nmillion
Furniture,
fittings and
equipment
Nmillion
Computer
equipment
Nmillion
Work in
progress
Nmillion
Total
Nmillion
Balance at 1 January 2017 20,579 939 699 11,120 14,624 2,539 50,500
Additions 139 1,681 380 477 1,646 815 5,138
Disposals/expensed (156) - (63) (277) (113) (1,942) (2,551)
Transfers/reclassifications 10 - 43 160 1,149 (1,362) -
Balance at 31 December 2017 20,572 2,620 1,059 11,480 17,306 50 53,087
Balance at 1 January 2016 20,293 973 526 10,377 13,329 3,424 48,922
Additions 114 54 239 662 497 663 2,229
Disposals (68) (185) (66) (14) (165) (153) (651)
Transfers/reclassifications 240 97 - 95 963 (1,395) -
Balance at 31 December 2016 20,579 939 699 11,120 14,624 2,539 50,500
17.2 Accumulated
depreciation
Balance at 1 January 2017 8,317 - 384 8,799 10,038 - 27,538
Charge for the year 1,225 - 159 752 1,993 - 4,129
Disposals (43) - (57) (262) (101) - (463)
Transfers/reclassifications (31) - - 29 2 - -
Balance at 31 December 2017 9,468 - 486 9,318 11,932 - 31,204
Balance at 1 January 2016 6,844 - 312 8,076 8,379 - 23,611
Charge for the year 1,514 - 130 728 1,832 - 4,204
Disposals (41) - (58) (2) (176) - (277)
Transfers/reclassifications - - - (3) 3 - -
Balance at 31 December 2016 8,317 - 384 8,799 10,038 - 27,538
Net book value:
31 December 2017 11,104 2,620 573 2,162 5,374 50 21,883
31 December 2016 12,262 939 315 2,321 4,586 2,539 22,962
Notes to the consolidated and separate financial statements For the year ended 31 December 2017
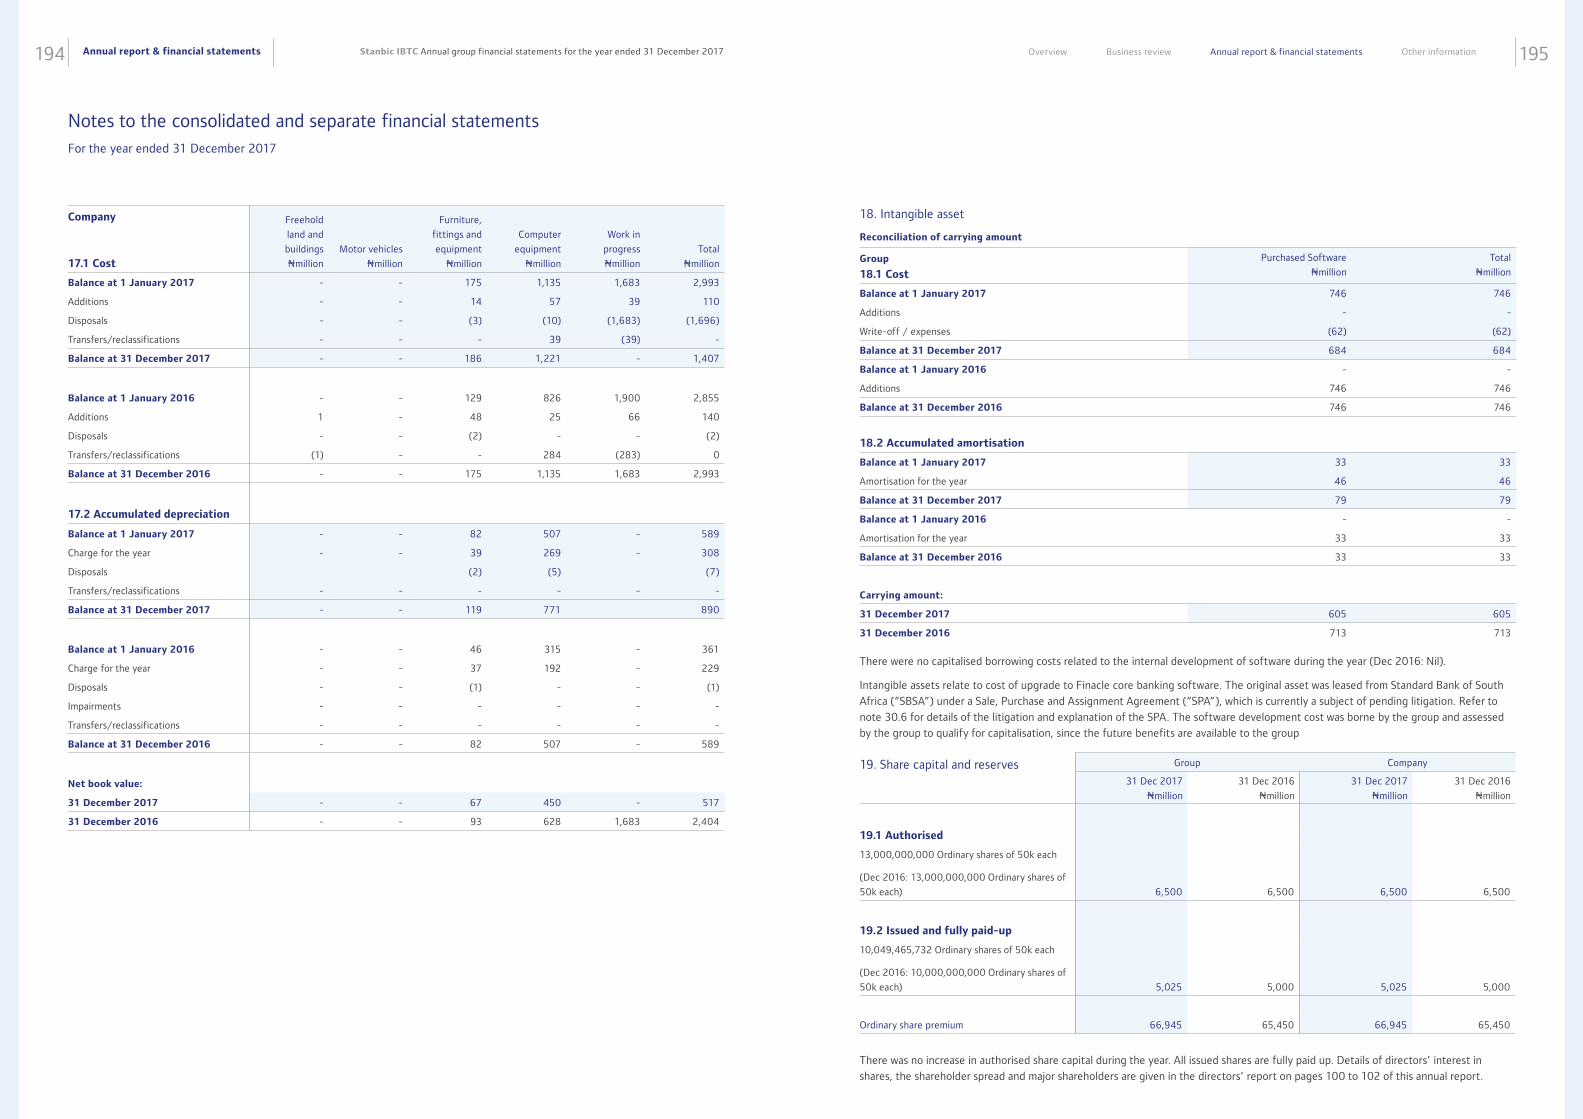
Annual report & financial statements194 195Stanbic IBTC Annual group financial statements for the year ended 31 December 2017 Overview Business review Annual report & financial statements Other information
Company
17.1 Cost
Freehold
land and
buildings
Nmillion
Motor vehicles
Nmillion
Furniture,
fittings and
equipment
Nmillion
Computer
equipment
Nmillion
Work in
progress
Nmillion
Total
Nmillion
Balance at 1 January 2017 - - 175 1,135 1,683 2,993
Additions - - 14 57 39 110
Disposals - - (3) (10) (1,683) (1,696)
Transfers/reclassifications - - - 39 (39) -
Balance at 31 December 2017 - - 186 1,221 - 1,407
Balance at 1 January 2016 - - 129 826 1,900 2,855
Additions 1 - 48 25 66 140
Disposals - - (2) - - (2)
Transfers/reclassifications (1) - - 284 (283) 0
Balance at 31 December 2016 - - 175 1,135 1,683 2,993
17.2 Accumulated depreciation
Balance at 1 January 2017 - - 82 507 - 589
Charge for the year - - 39 269 - 308
Disposals (2) (5) (7)
Transfers/reclassifications - - - - - -
Balance at 31 December 2017 - - 119 771 890
Balance at 1 January 2016 - - 46 315 - 361
Charge for the year - - 37 192 - 229
Disposals - - (1) - - (1)
Impairments - - - - - -
Transfers/reclassifications - - - - - -
Balance at 31 December 2016 - - 82 507 - 589
Net book value:
31 December 2017 - - 67 450 - 517
31 December 2016 - - 93 628 1,683 2,404
18. Intangible asset
Group
18.1 Cost
Purchased Software
Nmillion
Total
Nmillion
Balance at 1 January 2017 746 746
Additions - -
Write-off / expenses (62) (62)
Balance at 31 December 2017 684 684
Balance at 1 January 2016 - -
Additions 746 746
Balance at 31 December 2016 746 746
18.2 Accumulated amortisation
Balance at 1 January 2017 33 33
Amortisation for the year 46 46
Balance at 31 December 2017 79 79
Balance at 1 January 2016 - -
Amortisation for the year 33 33
Balance at 31 December 2016 33 33
Carrying amount:
31 December 2017 605 605
31 December 2016 713 713
There were no capitalised borrowing costs related to the internal development of software during the year (Dec 2016: Nil).
Intangible assets relate to cost of upgrade to Finacle core banking software. The original asset was leased from Standard Bank of South
Africa (“SBSA”) under a Sale, Purchase and Assignment Agreement (“SPA”), which is currently a subject of pending litigation. Refer to
note 30.6 for details of the litigation and explanation of the SPA. The software development cost was borne by the group and assessed
by the group to qualify for capitalisation, since the future benefits are available to the group
There was no increase in authorised share capital during the year. All issued shares are fully paid up. Details of directors’ interest in
shares, the shareholder spread and major shareholders are given in the directors’ report on pages 100 to 102 of this annual report.
Group Company
31 Dec 2017
Nmillion
31 Dec 2016
Nmillion
31 Dec 2017
Nmillion
31 Dec 2016
Nmillion
19.1 Authorised
13,000,000,000 Ordinary shares of 50k each
(Dec 2016: 13,000,000,000 Ordinary shares of
50k each) 6,500 6,500 6,500 6,500
19.2 Issued and fully paid-up
10,049,465,732 Ordinary shares of 50k each
(Dec 2016: 10,000,000,000 Ordinary shares of
50k each) 5,025 5,000 5,025 5,000
Ordinary share premium 66,945 65,450 66,945 65,450
19. Share capital and reserves
Reconciliation of carrying amount
Notes to the consolidated and separate financial statements For the year ended 31 December 2017
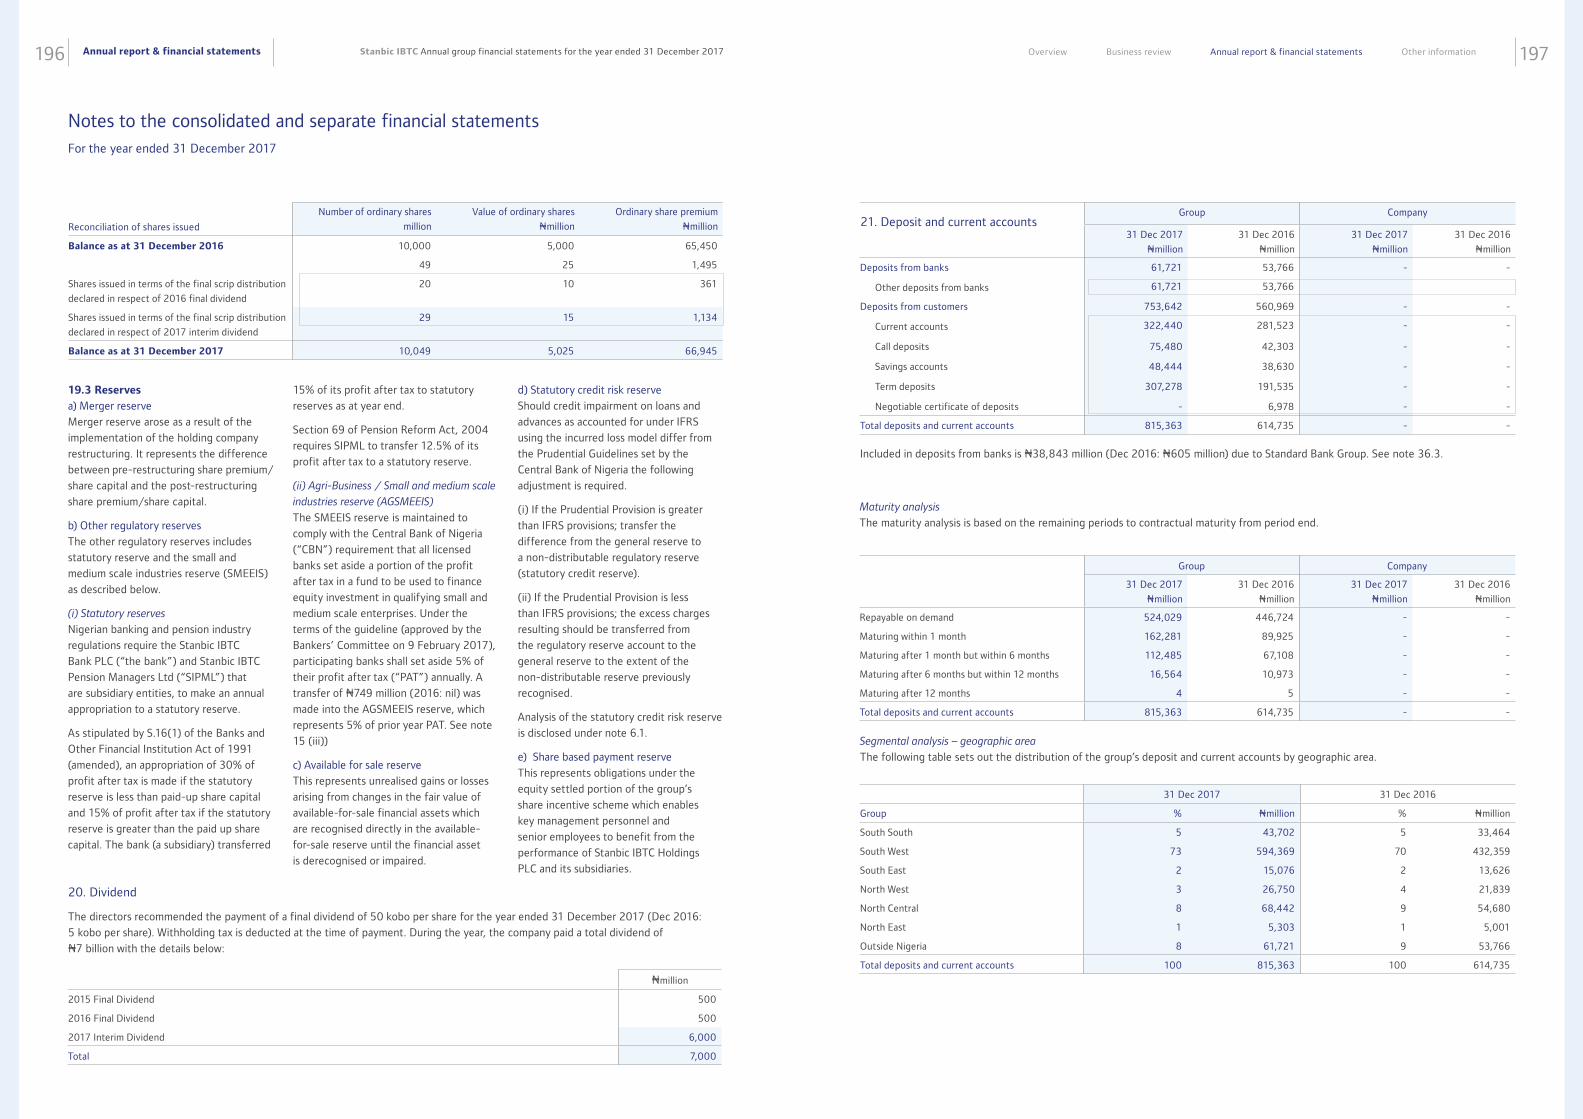
Annual report & financial statements196 197Stanbic IBTC Annual group financial statements for the year ended 31 December 2017 Overview Business review Annual report & financial statements Other information
19.3 Reserves
a) Merger reserve
Merger reserve arose as a result of the
implementation of the holding company
restructuring. It represents the difference
between pre-restructuring share premium/
share capital and the post-restructuring
share premium/share capital.
b) Other regulatory reserves
The other regulatory reserves includes
statutory reserve and the small and
medium scale industries reserve (SMEEIS)
as described below.
(i) Statutory reserves
Nigerian banking and pension industry
regulations require the Stanbic IBTC
Bank PLC (“the bank”) and Stanbic IBTC
Pension Managers Ltd (“SIPML”) that
are subsidiary entities, to make an annual
appropriation to a statutory reserve.
As stipulated by S.16(1) of the Banks and
Other Financial Institution Act of 1991
(amended), an appropriation of 30% of
profit after tax is made if the statutory
reserve is less than paid-up share capital
and 15% of profit after tax if the statutory
reserve is greater than the paid up share
capital. The bank (a subsidiary) transferred
15% of its profit after tax to statutory
reserves as at year end.
Section 69 of Pension Reform Act, 2004
requires SIPML to transfer 12.5% of its
profit after tax to a statutory reserve.
(ii) Agri-Business / Small and medium scale
industries reserve (AGSMEEIS)
The SMEEIS reserve is maintained to
comply with the Central Bank of Nigeria
(“CBN”) requirement that all licensed
banks set aside a portion of the profit
after tax in a fund to be used to finance
equity investment in qualifying small and
medium scale enterprises. Under the
terms of the guideline (approved by the
Bankers’ Committee on 9 February 2017),
participating banks shall set aside 5% of
their profit after tax (“PAT”) annually. A
transfer of N749 million (2016: nil) was
made into the AGSMEEIS reserve, which
represents 5% of prior year PAT. See note
15 (iii))
c) Available for sale reserve
This represents unrealised gains or losses
arising from changes in the fair value of
available-for-sale financial assets which
are recognised directly in the available-
for-sale reserve until the financial asset
is derecognised or impaired.
d) Statutory credit risk reserve
Should credit impairment on loans and
advances as accounted for under IFRS
using the incurred loss model differ from
the Prudential Guidelines set by the
Central Bank of Nigeria the following
adjustment is required.
(i) If the Prudential Provision is greater
than IFRS provisions; transfer the
difference from the general reserve to
a non-distributable regulatory reserve
(statutory credit reserve).
(ii) If the Prudential Provision is less
than IFRS provisions; the excess charges
resulting should be transferred from
the regulatory reserve account to the
general reserve to the extent of the
non-distributable reserve previously
recognised.
Analysis of the statutory credit risk reserve
is disclosed under note 6.1.
e) Share based payment reserve
This represents obligations under the
equity settled portion of the group’s
share incentive scheme which enables
key management personnel and
senior employees to benefit from the
performance of Stanbic IBTC Holdings
PLC and its subsidiaries.
20. Dividend
The directors recommended the payment of a final dividend of 50 kobo per share for the year ended 31 December 2017 (Dec 2016:
5 kobo per share). Withholding tax is deducted at the time of payment. During the year, the company paid a total dividend of
N7 billion with the details below:
Reconciliation of shares issued
Number of ordinary shares
million
Value of ordinary shares
Nmillion
Ordinary share premium
Nmillion
Balance as at 31 December 2016 10,000 5,000 65,450
49 25 1,495
Shares issued in terms of the final scrip distribution
declared in respect of 2016 final dividend
20 10 361
Shares issued in terms of the final scrip distribution
declared in respect of 2017 interim dividend
29 15 1,134
Balance as at 31 December 2017 10,049 5,025 66,945
Nmillion
2015 Final Dividend 500
2016 Final Dividend 500
2017 Interim Dividend 6,000
Total 7,000
21. Deposit and current accountsGroup Company
31 Dec 2017
Nmillion
31 Dec 2016
Nmillion
31 Dec 2017
Nmillion
31 Dec 2016
Nmillion
Deposits from banks 61,721 53,766 - -
Other deposits from banks 61,721 53,766
Deposits from customers 753,642 560,969 - -
Current accounts 322,440 281,523 - -
Call deposits 75,480 42,303 - -
Savings accounts 48,444 38,630 - -
Term deposits 307,278 191,535 - -
Negotiable certificate of deposits - 6,978 - -
Total deposits and current accounts 815,363 614,735 - -
Included in deposits from banks is N38,843 million (Dec 2016: N605 million) due to Standard Bank Group. See note 36.3.
Maturity analysis The maturity analysis is based on the remaining periods to contractual maturity from period end.
Group Company
31 Dec 2017
Nmillion
31 Dec 2016
Nmillion
31 Dec 2017
Nmillion
31 Dec 2016
Nmillion
Repayable on demand 524,029 446,724 - -
Maturing within 1 month 162,281 89,925 - -
Maturing after 1 month but within 6 months 112,485 67,108 - -
Maturing after 6 months but within 12 months 16,564 10,973 - -
Maturing after 12 months 4 5 - -
Total deposits and current accounts 815,363 614,735 - -
Segmental analysis – geographic area The following table sets out the distribution of the group’s deposit and current accounts by geographic area.
31 Dec 2017 31 Dec 2016
Group % Nmillion % Nmillion
South South 5 43,702 5 33,464
South West 73 594,369 70 432,359
South East 2 15,076 2 13,626
North West 3 26,750 4 21,839
North Central 8 68,442 9 54,680
North East 1 5,303 1 5,001
Outside Nigeria 8 61,721 9 53,766
Total deposits and current accounts 100 815,363 100 614,735
Notes to the consolidated and separate financial statements For the year ended 31 December 2017
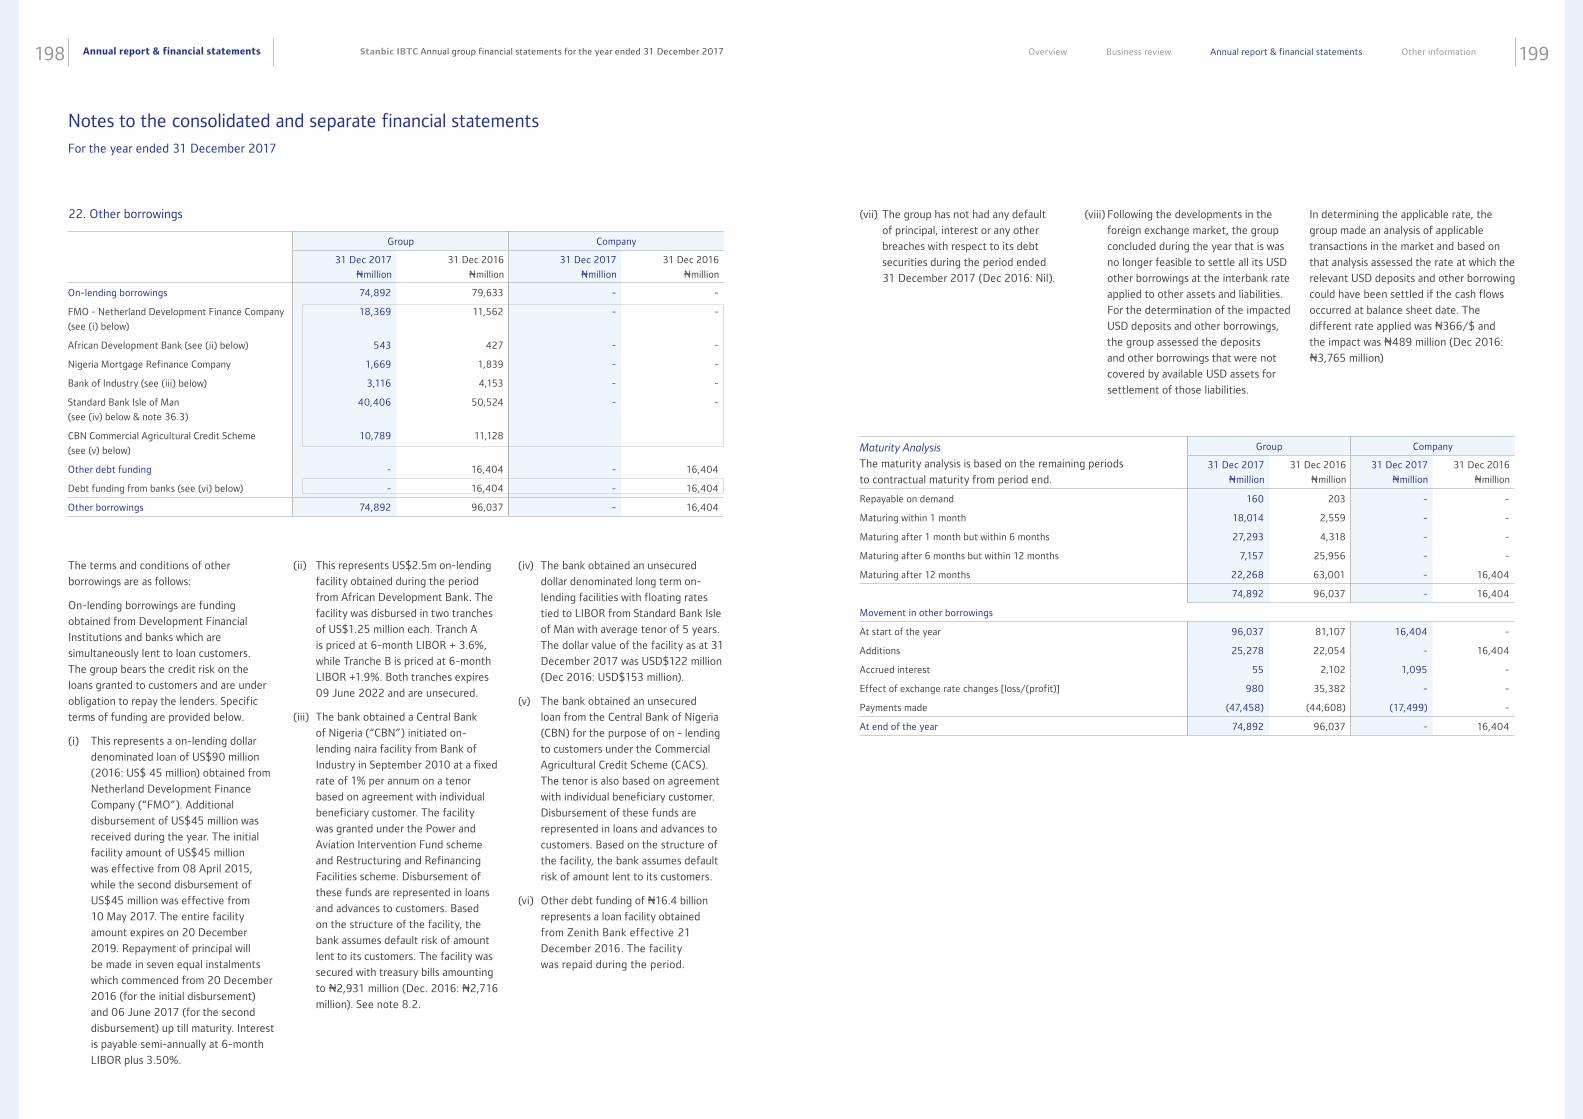
Annual report & financial statements198 199Stanbic IBTC Annual group financial statements for the year ended 31 December 2017 Overview Business review Annual report & financial statements Other information
The terms and conditions of other
borrowings are as follows:
On-lending borrowings are funding
obtained from Development Financial
Institutions and banks which are
simultaneously lent to loan customers.
The group bears the credit risk on the
loans granted to customers and are under
obligation to repay the lenders. Specific
terms of funding are provided below.
(i) This represents a on-lending dollar
denominated loan of US$90 million
(2016: US$ 45 million) obtained from
Netherland Development Finance
Company (“FMO”). Additional
disbursement of US$45 million was
received during the year. The initial
facility amount of US$45 million
was effective from 08 April 2015,
while the second disbursement of
US$45 million was effective from
10 May 2017. The entire facility
amount expires on 20 December
2019. Repayment of principal will
be made in seven equal instalments
which commenced from 20 December
2016 (for the initial disbursement)
and 06 June 2017 (for the second
disbursement) up till maturity. Interest
is payable semi-annually at 6-month
LIBOR plus 3.50%.
(ii) This represents US$2.5m on-lending
facility obtained during the period
from African Development Bank. The
facility was disbursed in two tranches
of US$1.25 million each. Tranch A
is priced at 6-month LIBOR + 3.6%,
while Tranche B is priced at 6-month
LIBOR +1.9%. Both tranches expires
09 June 2022 and are unsecured.
(iii) The bank obtained a Central Bank
of Nigeria (“CBN”) initiated on-
lending naira facility from Bank of
Industry in September 2010 at a fixed
rate of 1% per annum on a tenor
based on agreement with individual
beneficiary customer. The facility
was granted under the Power and
Aviation Intervention Fund scheme
and Restructuring and Refinancing
Facilities scheme. Disbursement of
these funds are represented in loans
and advances to customers. Based
on the structure of the facility, the
bank assumes default risk of amount
lent to its customers. The facility was
secured with treasury bills amounting
to N2,931 million (Dec. 2016: N2,716
million). See note 8.2.
(iv) The bank obtained an unsecured
dollar denominated long term on-
lending facilities with floating rates
tied to LIBOR from Standard Bank Isle
of Man with average tenor of 5 years.
The dollar value of the facility as at 31
December 2017 was USD$122 million
(Dec 2016: USD$153 million).
(v) The bank obtained an unsecured
loan from the Central Bank of Nigeria
(CBN) for the purpose of on - lending
to customers under the Commercial
Agricultural Credit Scheme (CACS).
The tenor is also based on agreement
with individual beneficiary customer.
Disbursement of these funds are
represented in loans and advances to
customers. Based on the structure of
the facility, the bank assumes default
risk of amount lent to its customers.
(vi) Other debt funding of N16.4 billion
represents a loan facility obtained
from Zenith Bank effective 21
December 2016. The facility
was repaid during the period.
Group Company
31 Dec 2017
Nmillion
31 Dec 2016
Nmillion
31 Dec 2017
Nmillion
31 Dec 2016
Nmillion
On-lending borrowings 74,892 79,633 - -
FMO - Netherland Development Finance Company
(see (i) below)
18,369 11,562 - -
African Development Bank (see (ii) below) 543 427 - -
Nigeria Mortgage Refinance Company 1,669 1,839 - -
Bank of Industry (see (iii) below) 3,116 4,153 - -
Standard Bank Isle of Man
(see (iv) below & note 36.3)
40,406 50,524 - -
CBN Commercial Agricultural Credit Scheme
(see (v) below)
10,789 11,128
Other debt funding - 16,404 - 16,404
Debt funding from banks (see (vi) below) - 16,404 - 16,404
Other borrowings 74,892 96,037 - 16,404
22. Other borrowings (vii) The group has not had any default
of principal, interest or any other
breaches with respect to its debt
securities during the period ended
31 December 2017 (Dec 2016: Nil).
(viii) Following the developments in the
foreign exchange market, the group
concluded during the year that is was
no longer feasible to settle all its USD
other borrowings at the interbank rate
applied to other assets and liabilities.
For the determination of the impacted
USD deposits and other borrowings,
the group assessed the deposits
and other borrowings that were not
covered by available USD assets for
settlement of those liabilities.
Maturity Analysis The maturity analysis is based on the remaining periods
to contractual maturity from period end.
Group Company
31 Dec 2017
Nmillion
31 Dec 2016
Nmillion
31 Dec 2017
Nmillion
31 Dec 2016
Nmillion
Repayable on demand 160 203 - -
Maturing within 1 month 18,014 2,559 - -
Maturing after 1 month but within 6 months 27,293 4,318 - -
Maturing after 6 months but within 12 months 7,157 25,956 - -
Maturing after 12 months 22,268 63,001 - 16,404
74,892 96,037 - 16,404
Movement in other borrowings
At start of the year 96,037 81,107 16,404 -
Additions 25,278 22,054 - 16,404
Accrued interest 55 2,102 1,095 -
Effect of exchange rate changes [loss/(profit)] 980 35,382 - -
Payments made (47,458) (44,608) (17,499) -
At end of the year 74,892 96,037 - 16,404
In determining the applicable rate, the
group made an analysis of applicable
transactions in the market and based on
that analysis assessed the rate at which the
relevant USD deposits and other borrowing
could have been settled if the cash flows
occurred at balance sheet date. The
different rate applied was N366/$ and
the impact was N489 million (Dec 2016:
N3,765 million)
Notes to the consolidated and separate financial statements For the year ended 31 December 2017
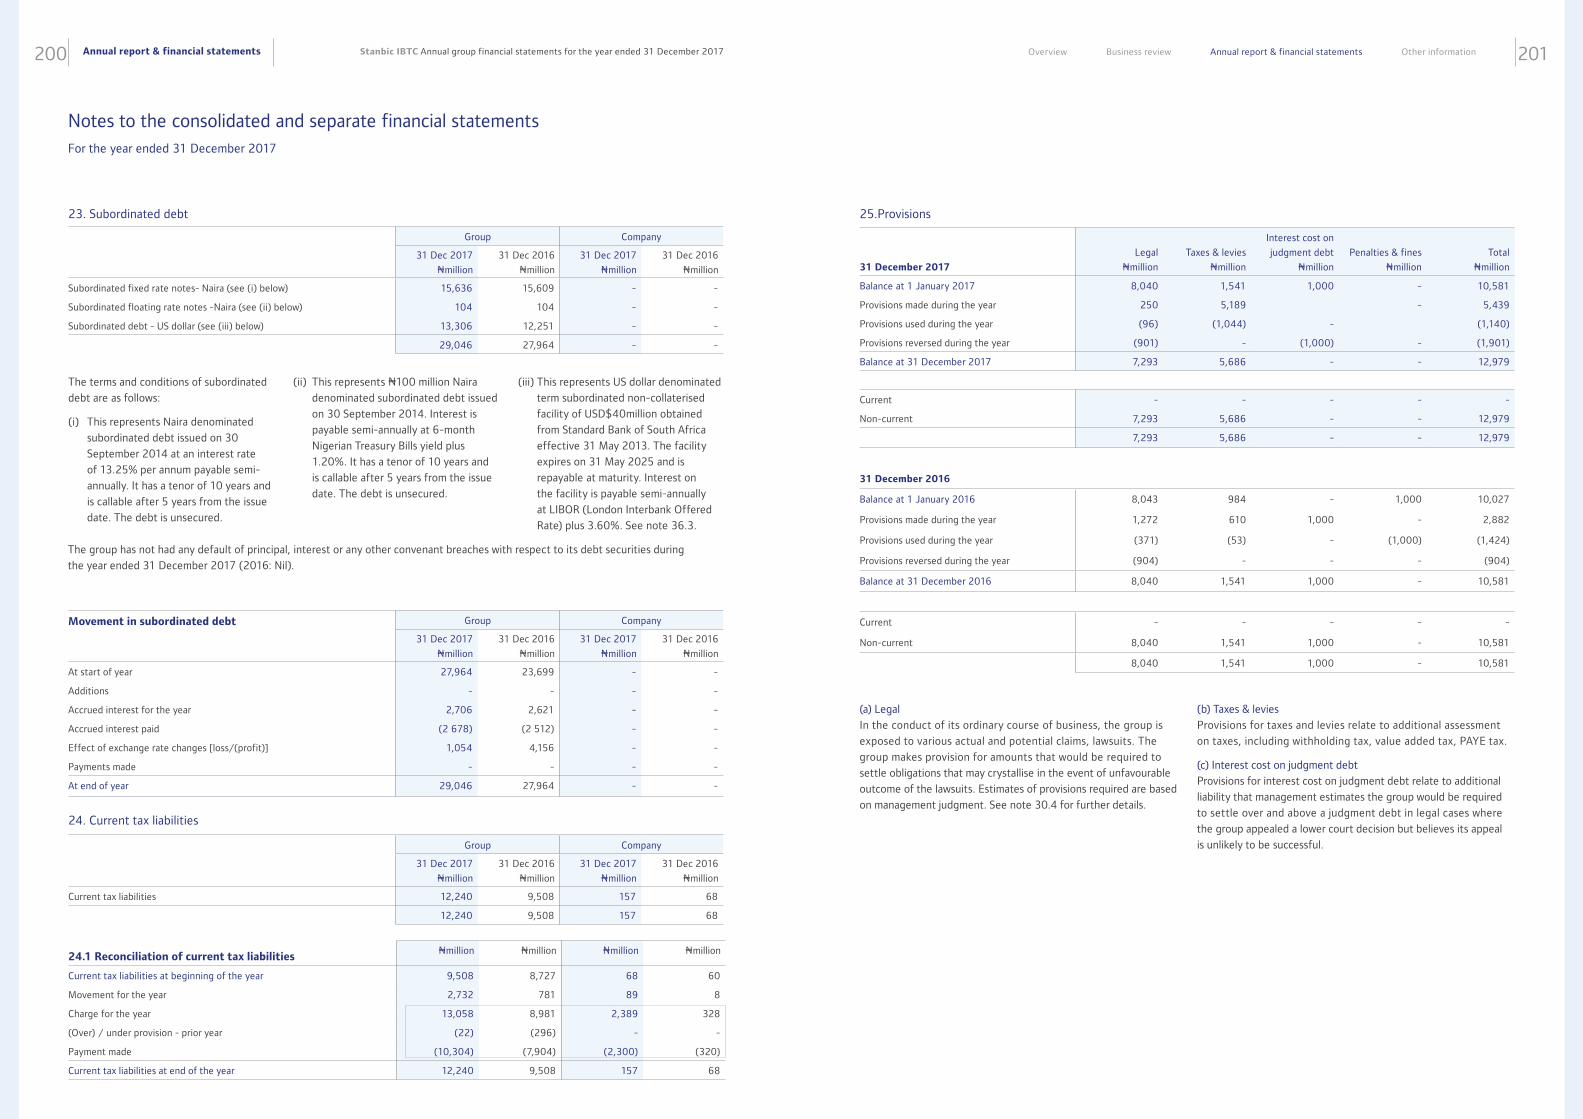
Annual report & financial statements200 201Stanbic IBTC Annual group financial statements for the year ended 31 December 2017 Overview Business review Annual report & financial statements Other information
The terms and conditions of subordinated
debt are as follows:
(i) This represents Naira denominated
subordinated debt issued on 30
September 2014 at an interest rate
of 13.25% per annum payable semi-
annually. It has a tenor of 10 years and
is callable after 5 years from the issue
date. The debt is unsecured.
Group Company
31 Dec 2017
Nmillion
31 Dec 2016
Nmillion
31 Dec 2017
Nmillion
31 Dec 2016
Nmillion
Subordinated fixed rate notes- Naira (see (i) below) 15,636 15,609 - -
Subordinated floating rate notes -Naira (see (ii) below) 104 104 - -
Subordinated debt - US dollar (see (iii) below) 13,306 12,251 - -
29,046 27,964 - -
Group Company
31 Dec 2017
Nmillion
31 Dec 2016
Nmillion
31 Dec 2017
Nmillion
31 Dec 2016
Nmillion
Current tax liabilities 12,240 9,508 157 68
12,240 9,508 157 68
Movement in subordinated debt Group Company
31 Dec 2017
Nmillion
31 Dec 2016
Nmillion
31 Dec 2017
Nmillion
31 Dec 2016
Nmillion
At start of year 27,964 23,699 - -
Additions - - - -
Accrued interest for the year 2,706 2,621 - -
Accrued interest paid (2 678) (2 512) - -
Effect of exchange rate changes [loss/(profit)] 1,054 4,156 - -
Payments made - - - -
At end of year 29,046 27,964 - -
23. Subordinated debt
24. Current tax liabilities
(ii) This represents N100 million Naira
denominated subordinated debt issued
on 30 September 2014. Interest is
payable semi-annually at 6-month
Nigerian Treasury Bills yield plus
1.20%. It has a tenor of 10 years and
is callable after 5 years from the issue
date. The debt is unsecured.
(iii) This represents US dollar denominated
term subordinated non-collaterised
facility of USD$40million obtained
from Standard Bank of South Africa
effective 31 May 2013. The facility
expires on 31 May 2025 and is
repayable at maturity. Interest on
the facility is payable semi-annually
at LIBOR (London Interbank Offered
Rate) plus 3.60%. See note 36.3.
24.1 Reconciliation of current tax liabilitiesNmillion Nmillion Nmillion Nmillion
Current tax liabilities at beginning of the year 9,508 8,727 68 60
Movement for the year 2,732 781 89 8
Charge for the year 13,058 8,981 2,389 328
(Over) / under provision - prior year (22) (296) - -
Payment made (10,304) (7,904) (2,300) (320)
Current tax liabilities at end of the year 12,240 9,508 157 68
The group has not had any default of principal, interest or any other convenant breaches with respect to its debt securities during
the year ended 31 December 2017 (2016: Nil).
25.Provisions
31 December 2017
Legal
Nmillion
Taxes & levies
Nmillion
Interest cost on
judgment debt
Nmillion
Penalties & fines
Nmillion
Total
Nmillion
Balance at 1 January 2017 8,040 1,541 1,000 - 10,581
Provisions made during the year 250 5,189 - 5,439
Provisions used during the year (96) (1,044) - (1,140)
Provisions reversed during the year (901) - (1,000) - (1,901)
Balance at 31 December 2017 7,293 5,686 - - 12,979
Current - - - - -
Non-current 7,293 5,686 - - 12,979
7,293 5,686 - - 12,979
31 December 2016
Balance at 1 January 2016 8,043 984 - 1,000 10,027
Provisions made during the year 1,272 610 1,000 - 2,882
Provisions used during the year (371) (53) - (1,000) (1,424)
Provisions reversed during the year (904) - - - (904)
Balance at 31 December 2016 8,040 1,541 1,000 - 10,581
Current - - - - -
Non-current 8,040 1,541 1,000 - 10,581
8,040 1,541 1,000 - 10,581
(a) Legal
In the conduct of its ordinary course of business, the group is
exposed to various actual and potential claims, lawsuits. The
group makes provision for amounts that would be required to
settle obligations that may crystallise in the event of unfavourable
outcome of the lawsuits. Estimates of provisions required are based
on management judgment. See note 30.4 for further details.
(b) Taxes & levies
Provisions for taxes and levies relate to additional assessment
on taxes, including withholding tax, value added tax, PAYE tax.
(c) Interest cost on judgment debt
Provisions for interest cost on judgment debt relate to additional
liability that management estimates the group would be required
to settle over and above a judgment debt in legal cases where
the group appealed a lower court decision but believes its appeal
is unlikely to be successful.
Notes to the consolidated and separate financial statements For the year ended 31 December 2017
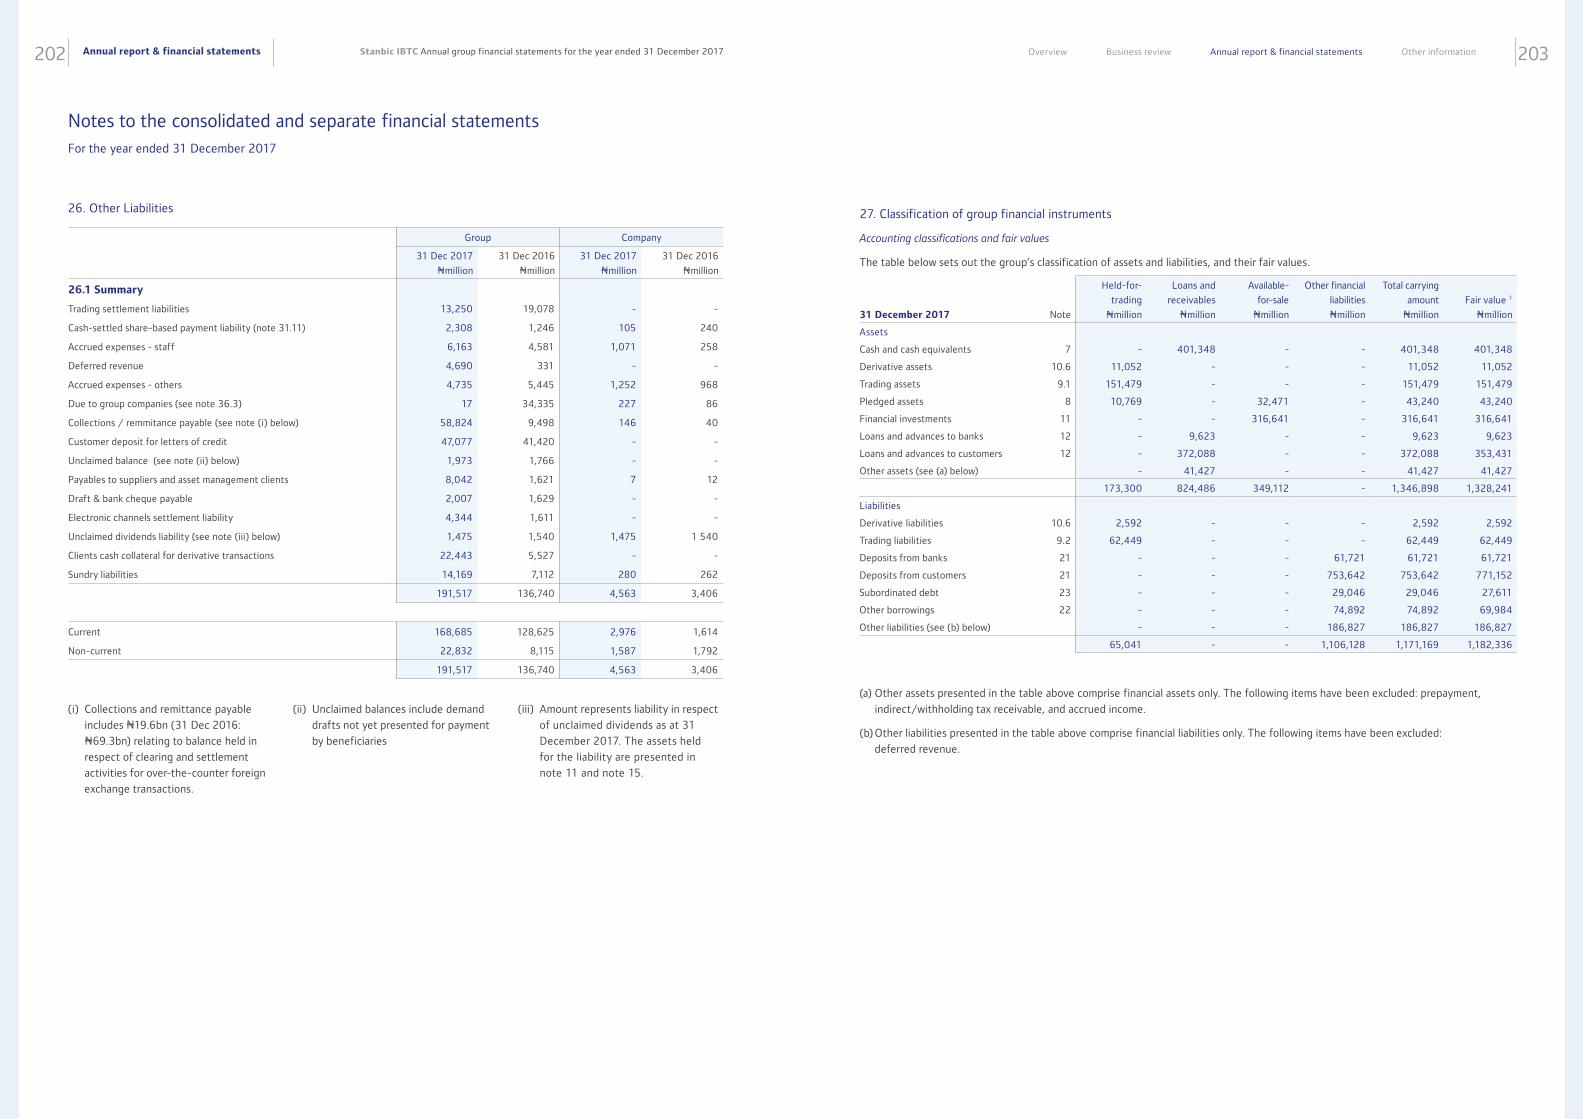
Annual report & financial statements202 203Stanbic IBTC Annual group financial statements for the year ended 31 December 2017 Overview Business review Annual report & financial statements Other information
Group Company
31 Dec 2017
Nmillion
31 Dec 2016
Nmillion
31 Dec 2017
Nmillion
31 Dec 2016
Nmillion
26.1 Summary
Trading settlement liabilities 13,250 19,078 - -
Cash-settled share-based payment liability (note 31.11) 2,308 1,246 105 240
Accrued expenses - staff 6,163 4,581 1,071 258
Deferred revenue 4,690 331 - -
Accrued expenses - others 4,735 5,445 1,252 968
Due to group companies (see note 36.3) 17 34,335 227 86
Collections / remmitance payable (see note (i) below) 58,824 9,498 146 40
Customer deposit for letters of credit 47,077 41,420 - -
Unclaimed balance (see note (ii) below) 1,973 1,766 - -
Payables to suppliers and asset management clients 8,042 1,621 7 12
Draft & bank cheque payable 2,007 1,629 - -
Electronic channels settlement liability 4,344 1,611 - -
Unclaimed dividends liability (see note (iii) below) 1,475 1,540 1,475 1 540
Clients cash collateral for derivative transactions 22,443 5,527 - -
Sundry liabilities 14,169 7,112 280 262
191,517 136,740 4,563 3,406
Current 168,685 128,625 2,976 1,614
Non-current 22,832 8,115 1,587 1,792
191,517 136,740 4,563 3,406
(i) Collections and remittance payable
includes N19.6bn (31 Dec 2016:
N69.3bn) relating to balance held in
respect of clearing and settlement
activities for over-the-counter foreign
exchange transactions.
(ii) Unclaimed balances include demand
drafts not yet presented for payment
by beneficiaries
(iii) Amount represents liability in respect
of unclaimed dividends as at 31
December 2017. The assets held
for the liability are presented in
note 11 and note 15.
27. Classification of group financial instruments26. Other Liabilities
Accounting classifications and fair values
The table below sets out the group’s classification of assets and liabilities, and their fair values.
(a) Other assets presented in the table above comprise financial assets only. The following items have been excluded: prepayment,
indirect/withholding tax receivable, and accrued income.
(b) Other liabilities presented in the table above comprise financial liabilities only. The following items have been excluded:
deferred revenue.
31 December 2017
Note
Held-for-
trading
Nmillion
Loans and
receivables
Nmillion
Available-
for-sale
Nmillion
Other financial
liabilities
Nmillion
Total carrying
amount
Nmillion
Fair value 1
Nmillion
Assets
Cash and cash equivalents 7 - 401,348 - - 401,348 401,348
Derivative assets 10.6 11,052 - - - 11,052 11,052
Trading assets 9.1 151,479 - - - 151,479 151,479
Pledged assets 8 10,769 - 32,471 - 43,240 43,240
Financial investments 11 - - 316,641 - 316,641 316,641
Loans and advances to banks 12 - 9,623 - - 9,623 9,623
Loans and advances to customers 12 - 372,088 - - 372,088 353,431
Other assets (see (a) below) - 41,427 - - 41,427 41,427
173,300 824,486 349,112 - 1,346,898 1,328,241
Liabilities
Derivative liabilities 10.6 2,592 - - - 2,592 2,592
Trading liabilities 9.2 62,449 - - - 62,449 62,449
Deposits from banks 21 - - - 61,721 61,721 61,721
Deposits from customers 21 - - - 753,642 753,642 771,152
Subordinated debt 23 - - - 29,046 29,046 27,611
Other borrowings 22 - - - 74,892 74,892 69,984
Other liabilities (see (b) below) - - - 186,827 186,827 186,827
65,041 - - 1,106,128 1,171,169 1,182,336
Notes to the consolidated and separate financial statements For the year ended 31 December 2017
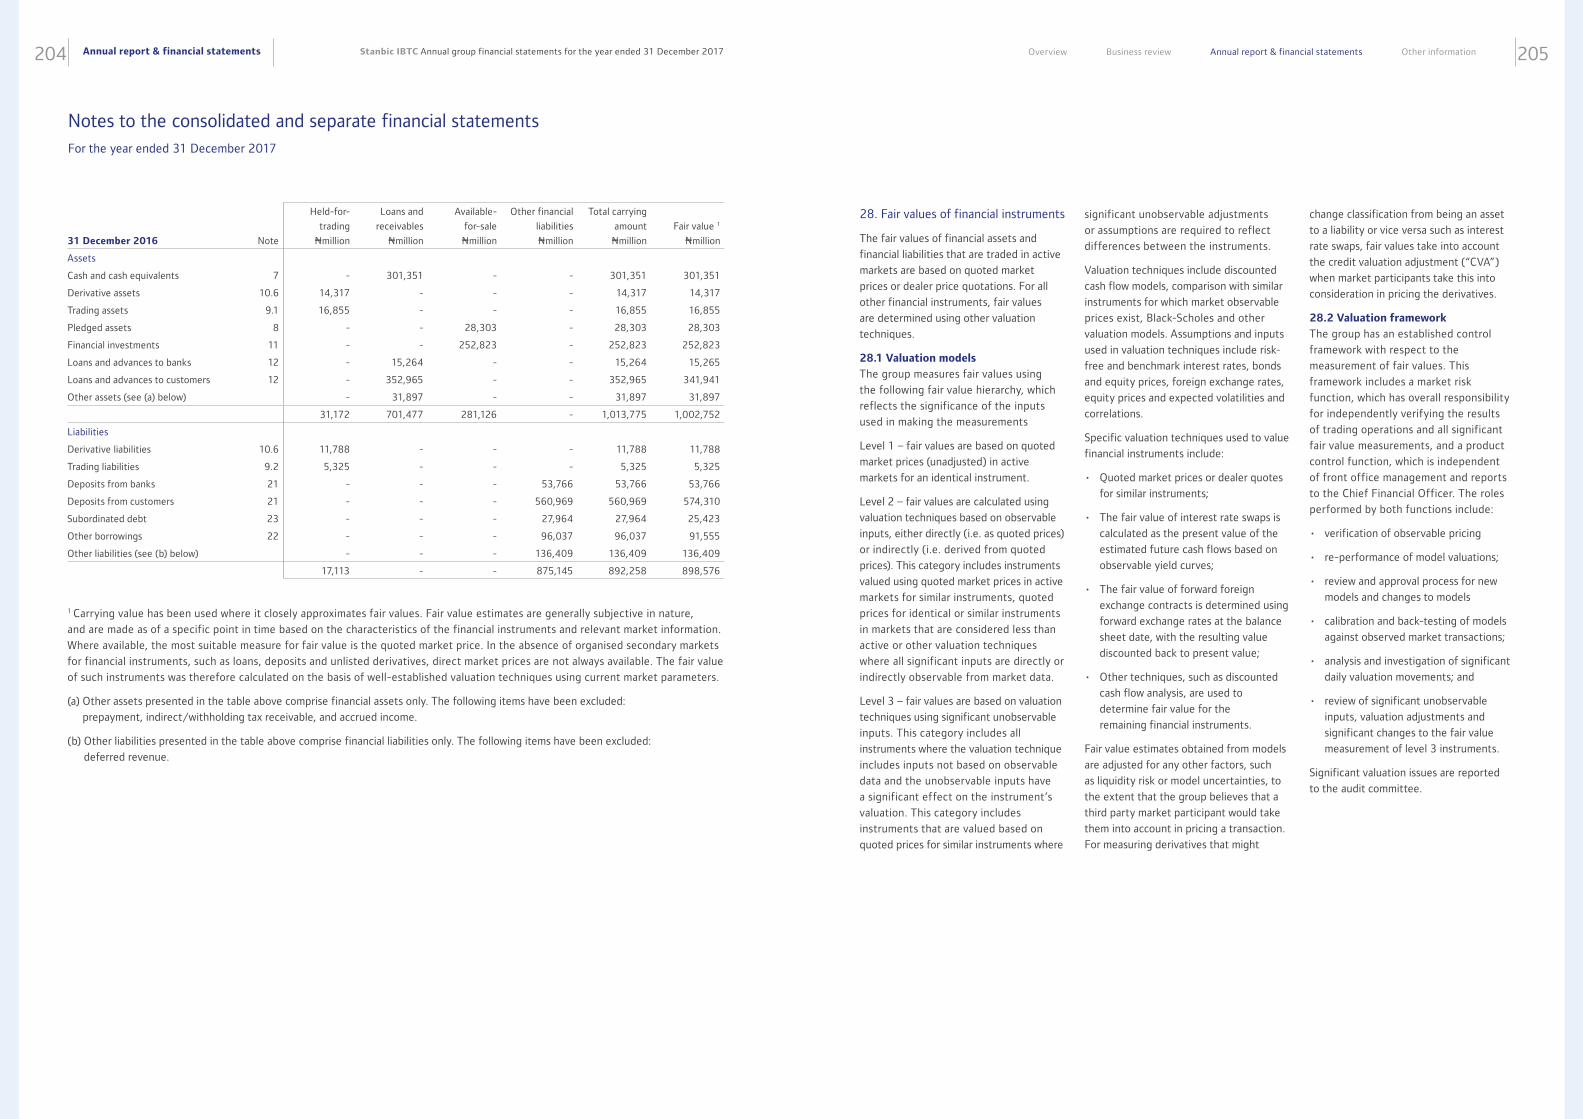
Annual report & financial statements204 205Stanbic IBTC Annual group financial statements for the year ended 31 December 2017 Overview Business review Annual report & financial statements Other information
1 Carrying value has been used where it closely approximates fair values. Fair value estimates are generally subjective in nature,
and are made as of a specific point in time based on the characteristics of the financial instruments and relevant market information.
Where available, the most suitable measure for fair value is the quoted market price. In the absence of organised secondary markets
for financial instruments, such as loans, deposits and unlisted derivatives, direct market prices are not always available. The fair value
of such instruments was therefore calculated on the basis of well-established valuation techniques using current market parameters.
(a) Other assets presented in the table above comprise financial assets only. The following items have been excluded:
prepayment, indirect/withholding tax receivable, and accrued income.
(b) Other liabilities presented in the table above comprise financial liabilities only. The following items have been excluded:
deferred revenue.
31 December 2016
Note
Held-for-
trading
Nmillion
Loans and
receivables
Nmillion
Available-
for-sale
Nmillion
Other financial
liabilities
Nmillion
Total carrying
amount
Nmillion
Fair value 1
Nmillion
Assets
Cash and cash equivalents 7 - 301,351 - - 301,351 301,351
Derivative assets 10.6 14,317 - - - 14,317 14,317
Trading assets 9.1 16,855 - - - 16,855 16,855
Pledged assets 8 - - 28,303 - 28,303 28,303
Financial investments 11 - - 252,823 - 252,823 252,823
Loans and advances to banks 12 - 15,264 - - 15,264 15,265
Loans and advances to customers 12 - 352,965 - - 352,965 341,941
Other assets (see (a) below) - 31,897 - - 31,897 31,897
31,172 701,477 281,126 - 1,013,775 1,002,752
Liabilities
Derivative liabilities 10.6 11,788 - - - 11,788 11,788
Trading liabilities 9.2 5,325 - - - 5,325 5,325
Deposits from banks 21 - - - 53,766 53,766 53,766
Deposits from customers 21 - - - 560,969 560,969 574,310
Subordinated debt 23 - - - 27,964 27,964 25,423
Other borrowings 22 - - - 96,037 96,037 91,555
Other liabilities (see (b) below) - - - 136,409 136,409 136,409
17,113 - - 875,145 892,258 898,576
28. Fair values of financial instruments
The fair values of financial assets and
financial liabilities that are traded in active
markets are based on quoted market
prices or dealer price quotations. For all
other financial instruments, fair values
are determined using other valuation
techniques.
28.1 Valuation models
The group measures fair values using
the following fair value hierarchy, which
reflects the significance of the inputs
used in making the measurements
Level 1 – fair values are based on quoted
market prices (unadjusted) in active
markets for an identical instrument.
Level 2 – fair values are calculated using
valuation techniques based on observable
inputs, either directly (i.e. as quoted prices)
or indirectly (i.e. derived from quoted
prices). This category includes instruments
valued using quoted market prices in active
markets for similar instruments, quoted
prices for identical or similar instruments
in markets that are considered less than
active or other valuation techniques
where all significant inputs are directly or
indirectly observable from market data.
Level 3 – fair values are based on valuation
techniques using significant unobservable
inputs. This category includes all
instruments where the valuation technique
includes inputs not based on observable
data and the unobservable inputs have
a significant effect on the instrument’s
valuation. This category includes
instruments that are valued based on
quoted prices for similar instruments where
significant unobservable adjustments
or assumptions are required to reflect
differences between the instruments.
Valuation techniques include discounted
cash flow models, comparison with similar
instruments for which market observable
prices exist, Black-Scholes and other
valuation models. Assumptions and inputs
used in valuation techniques include risk-
free and benchmark interest rates, bonds
and equity prices, foreign exchange rates,
equity prices and expected volatilities and
correlations.
Specific valuation techniques used to value
financial instruments include:
• Quoted market prices or dealer quotes
for similar instruments;
• The fair value of interest rate swaps is
calculated as the present value of the
estimated future cash flows based on
observable yield curves;
• The fair value of forward foreign
exchange contracts is determined using
forward exchange rates at the balance
sheet date, with the resulting value
discounted back to present value;
• Other techniques, such as discounted
cash flow analysis, are used to
determine fair value for the
remaining financial instruments.
Fair value estimates obtained from models
are adjusted for any other factors, such
as liquidity risk or model uncertainties, to
the extent that the group believes that a
third party market participant would take
them into account in pricing a transaction.
For measuring derivatives that might
change classification from being an asset
to a liability or vice versa such as interest
rate swaps, fair values take into account
the credit valuation adjustment (“CVA”)
when market participants take this into
consideration in pricing the derivatives.
28.2 Valuation framework
The group has an established control
framework with respect to the
measurement of fair values. This
framework includes a market risk
function, which has overall responsibility
for independently verifying the results
of trading operations and all significant
fair value measurements, and a product
control function, which is independent
of front office management and reports
to the Chief Financial Officer. The roles
performed by both functions include:
• verification of observable pricing
• re-performance of model valuations;
• review and approval process for new
models and changes to models
• calibration and back-testing of models
against observed market transactions;
• analysis and investigation of significant
daily valuation movements; and
• review of significant unobservable
inputs, valuation adjustments and
significant changes to the fair value
measurement of level 3 instruments.
Significant valuation issues are reported
to the audit committee.
Notes to the consolidated and separate financial statements For the year ended 31 December 2017
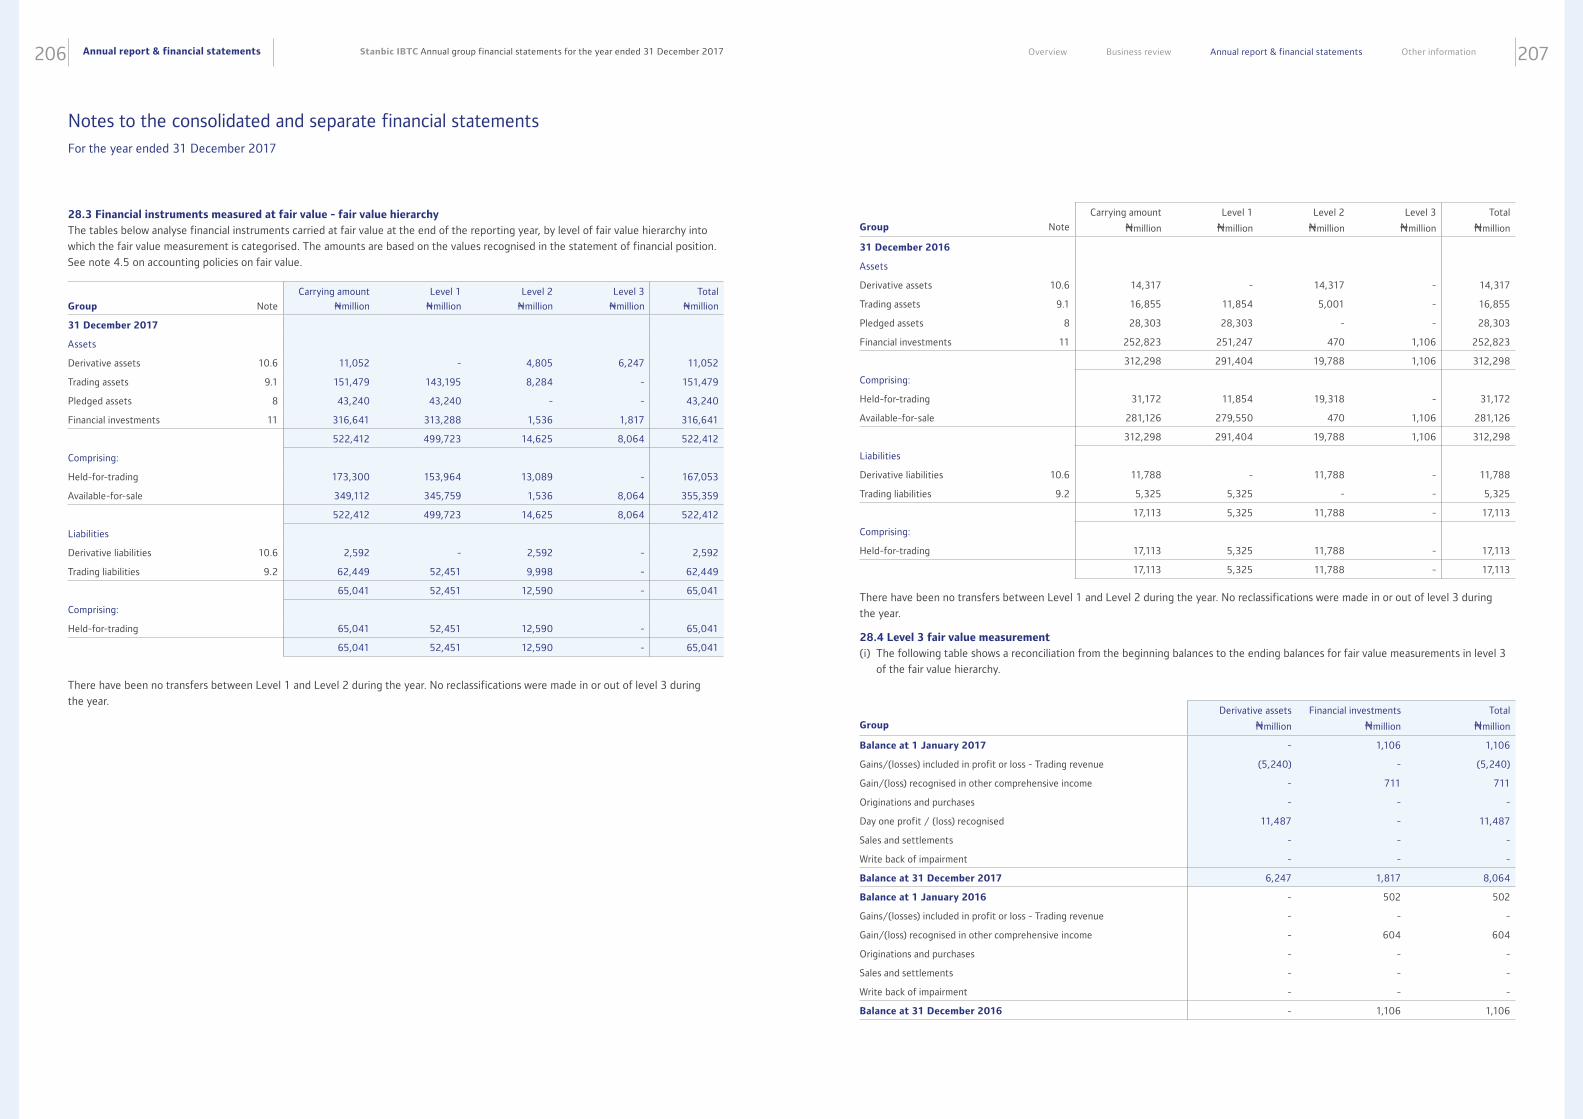
Annual report & financial statements206 207Stanbic IBTC Annual group financial statements for the year ended 31 December 2017 Overview Business review Annual report & financial statements Other information
28.3 Financial instruments measured at fair value - fair value hierarchy
The tables below analyse financial instruments carried at fair value at the end of the reporting year, by level of fair value hierarchy into
which the fair value measurement is categorised. The amounts are based on the values recognised in the statement of financial position.
See note 4.5 on accounting policies on fair value.
There have been no transfers between Level 1 and Level 2 during the year. No reclassifications were made in or out of level 3 during
the year.
Group
Note
Carrying amount
Nmillion
Level 1
Nmillion
Level 2
Nmillion
Level 3
Nmillion
Total
Nmillion
31 December 2017
Assets
Derivative assets 10.6 11,052 - 4,805 6,247 11,052
Trading assets 9.1 151,479 143,195 8,284 - 151,479
Pledged assets 8 43,240 43,240 - - 43,240
Financial investments 11 316,641 313,288 1,536 1,817 316,641
522,412 499,723 14,625 8,064 522,412
Comprising:
Held-for-trading 173,300 153,964 13,089 - 167,053
Available-for-sale 349,112 345,759 1,536 8,064 355,359
522,412 499,723 14,625 8,064 522,412
Liabilities
Derivative liabilities 10.6 2,592 - 2,592 - 2,592
Trading liabilities 9.2 62,449 52,451 9,998 - 62,449
65,041 52,451 12,590 - 65,041
Comprising:
Held-for-trading 65,041 52,451 12,590 - 65,041
65,041 52,451 12,590 - 65,041
Group
Note
Carrying amount
Nmillion
Level 1
Nmillion
Level 2
Nmillion
Level 3
Nmillion
Total
Nmillion
31 December 2016
Assets
Derivative assets 10.6 14,317 - 14,317 - 14,317
Trading assets 9.1 16,855 11,854 5,001 - 16,855
Pledged assets 8 28,303 28,303 - - 28,303
Financial investments 11 252,823 251,247 470 1,106 252,823
312,298 291,404 19,788 1,106 312,298
Comprising:
Held-for-trading 31,172 11,854 19,318 - 31,172
Available-for-sale 281,126 279,550 470 1,106 281,126
312,298 291,404 19,788 1,106 312,298
Liabilities
Derivative liabilities 10.6 11,788 - 11,788 - 11,788
Trading liabilities 9.2 5,325 5,325 - - 5,325
17,113 5,325 11,788 - 17,113
Comprising:
Held-for-trading 17,113 5,325 11,788 - 17,113
17,113 5,325 11,788 - 17,113
Group
Derivative assets
Nmillion
Financial investments
Nmillion
Total
Nmillion
Balance at 1 January 2017 - 1,106 1,106
Gains/(losses) included in profit or loss - Trading revenue (5,240) - (5,240)
Gain/(loss) recognised in other comprehensive income - 711 711
Originations and purchases - - -
Day one profit / (loss) recognised 11,487 - 11,487
Sales and settlements - - -
Write back of impairment - - -
Balance at 31 December 2017 6,247 1,817 8,064
Balance at 1 January 2016 - 502 502
Gains/(losses) included in profit or loss - Trading revenue - - -
Gain/(loss) recognised in other comprehensive income - 604 604
Originations and purchases - - -
Sales and settlements - - -
Write back of impairment - - -
Balance at 31 December 2016 - 1,106 1,106
There have been no transfers between Level 1 and Level 2 during the year. No reclassifications were made in or out of level 3 during
the year.
28.4 Level 3 fair value measurement
(i) The following table shows a reconciliation from the beginning balances to the ending balances for fair value measurements in level 3
of the fair value hierarchy.
Notes to the consolidated and separate financial statements For the year ended 31 December 2017
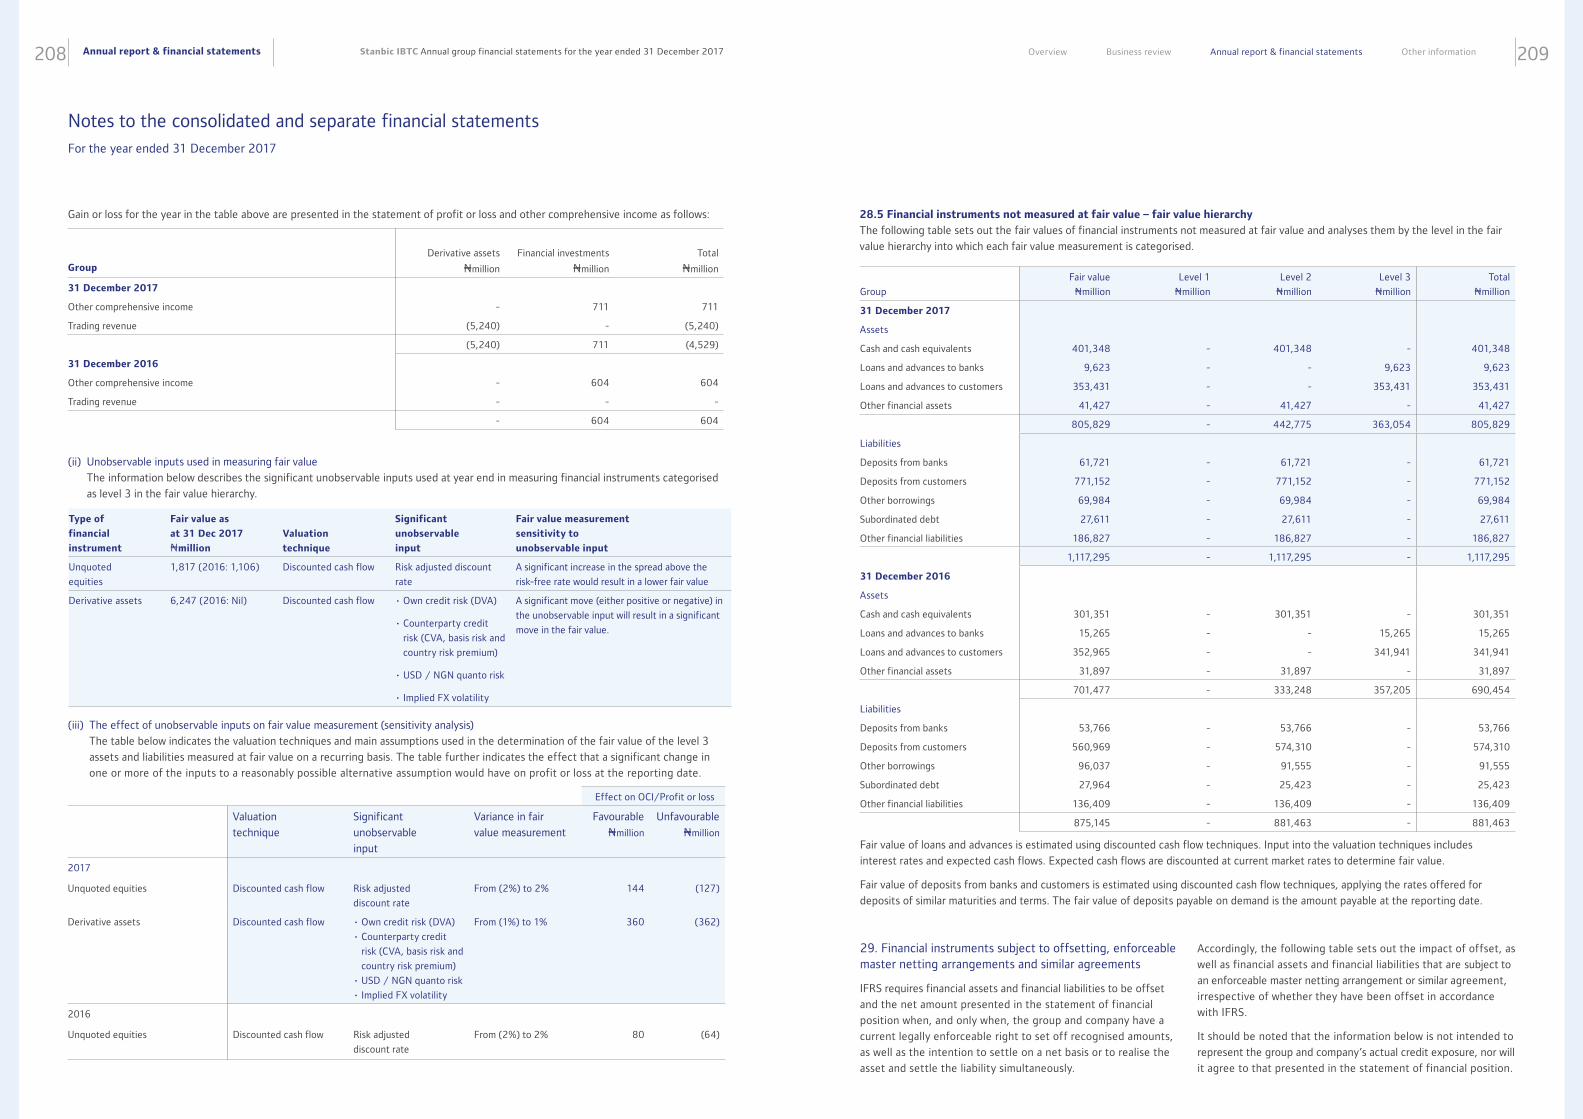
Annual report & financial statements208 209Stanbic IBTC Annual group financial statements for the year ended 31 December 2017 Overview Business review Annual report & financial statements Other information
Group
Derivative assets
Nmillion
Financial investments
Nmillion
Total
Nmillion
31 December 2017
Other comprehensive income - 711 711
Trading revenue (5,240) - (5,240)
(5,240) 711 (4,529)
31 December 2016
Other comprehensive income - 604 604
Trading revenue - - -
- 604 604
(ii) Unobservable inputs used in measuring fair value
The information below describes the significant unobservable inputs used at year end in measuring financial instruments categorised
as level 3 in the fair value hierarchy.
(iii) The effect of unobservable inputs on fair value measurement (sensitivity analysis)
The table below indicates the valuation techniques and main assumptions used in the determination of the fair value of the level 3
assets and liabilities measured at fair value on a recurring basis. The table further indicates the effect that a significant change in
one or more of the inputs to a reasonably possible alternative assumption would have on profit or loss at the reporting date.
Gain or loss for the year in the table above are presented in the statement of profit or loss and other comprehensive income as follows:
Type of
financial
instrument
Fair value as
at 31 Dec 2017
Nmillion
Valuation
technique
Significant
unobservable
input
Fair value measurement
sensitivity to
unobservable input
Unquoted
equities
1,817 (2016: 1,106) Discounted cash flow Risk adjusted discount
rate
A significant increase in the spread above the
risk-free rate would result in a lower fair value
Derivative assets 6,247 (2016: Nil) Discounted cash flow • Own credit risk (DVA)
• Counterparty credit
risk (CVA, basis risk and
country risk premium)
• USD / NGN quanto risk
• Implied FX volatility
A significant move (either positive or negative) in
the unobservable input will result in a significant
move in the fair value.
Effect on OCI/Profit or loss
Valuation
technique
Significant
unobservable
input
Variance in fair
value measurement
Favourable
Nmillion
Unfavourable
Nmillion
2017
Unquoted equities Discounted cash flow Risk adjusted
discount rate
From (2%) to 2% 144 (127)
Derivative assets Discounted cash flow • Own credit risk (DVA)
• Counterparty credit
risk (CVA, basis risk and
country risk premium)
• USD / NGN quanto risk
• Implied FX volatility
From (1%) to 1% 360 (362)
2016
Unquoted equities Discounted cash flow Risk adjusted
discount rate
From (2%) to 2% 80 (64)
Group
Fair value
Nmillion
Level 1
Nmillion
Level 2
Nmillion
Level 3
Nmillion
Total
Nmillion
31 December 2017
Assets
Cash and cash equivalents 401,348 - 401,348 - 401,348
Loans and advances to banks 9,623 - - 9,623 9,623
Loans and advances to customers 353,431 - - 353,431 353,431
Other financial assets 41,427 - 41,427 - 41,427
805,829 - 442,775 363,054 805,829
Liabilities
Deposits from banks 61,721 - 61,721 - 61,721
Deposits from customers 771,152 - 771,152 - 771,152
Other borrowings 69,984 - 69,984 - 69,984
Subordinated debt 27,611 - 27,611 - 27,611
Other financial liabilities 186,827 - 186,827 - 186,827
1,117,295 - 1,117,295 - 1,117,295
31 December 2016
Assets
Cash and cash equivalents 301,351 - 301,351 - 301,351
Loans and advances to banks 15,265 - - 15,265 15,265
Loans and advances to customers 352,965 - - 341,941 341,941
Other financial assets 31,897 - 31,897 - 31,897
701,477 - 333,248 357,205 690,454
Liabilities
Deposits from banks 53,766 - 53,766 - 53,766
Deposits from customers 560,969 - 574,310 - 574,310
Other borrowings 96,037 - 91,555 - 91,555
Subordinated debt 27,964 - 25,423 - 25,423
Other financial liabilities 136,409 - 136,409 - 136,409
875,145 - 881,463 - 881,463
Fair value of loans and advances is estimated using discounted cash flow techniques. Input into the valuation techniques includes
interest rates and expected cash flows. Expected cash flows are discounted at current market rates to determine fair value.
Fair value of deposits from banks and customers is estimated using discounted cash flow techniques, applying the rates offered for
deposits of similar maturities and terms. The fair value of deposits payable on demand is the amount payable at the reporting date.
29. Financial instruments subject to offsetting, enforceable master netting arrangements and similar agreements
IFRS requires financial assets and financial liabilities to be offset
and the net amount presented in the statement of financial
position when, and only when, the group and company have a
current legally enforceable right to set off recognised amounts,
as well as the intention to settle on a net basis or to realise the
asset and settle the liability simultaneously.
Accordingly, the following table sets out the impact of offset, as
well as financial assets and financial liabilities that are subject to
an enforceable master netting arrangement or similar agreement,
irrespective of whether they have been offset in accordance
with IFRS.
It should be noted that the information below is not intended to
represent the group and company’s actual credit exposure, nor will
it agree to that presented in the statement of financial position.
28.5 Financial instruments not measured at fair value – fair value hierarchy
The following table sets out the fair values of financial instruments not measured at fair value and analyses them by the level in the fair
value hierarchy into which each fair value measurement is categorised.
Notes to the consolidated and separate financial statements For the year ended 31 December 2017
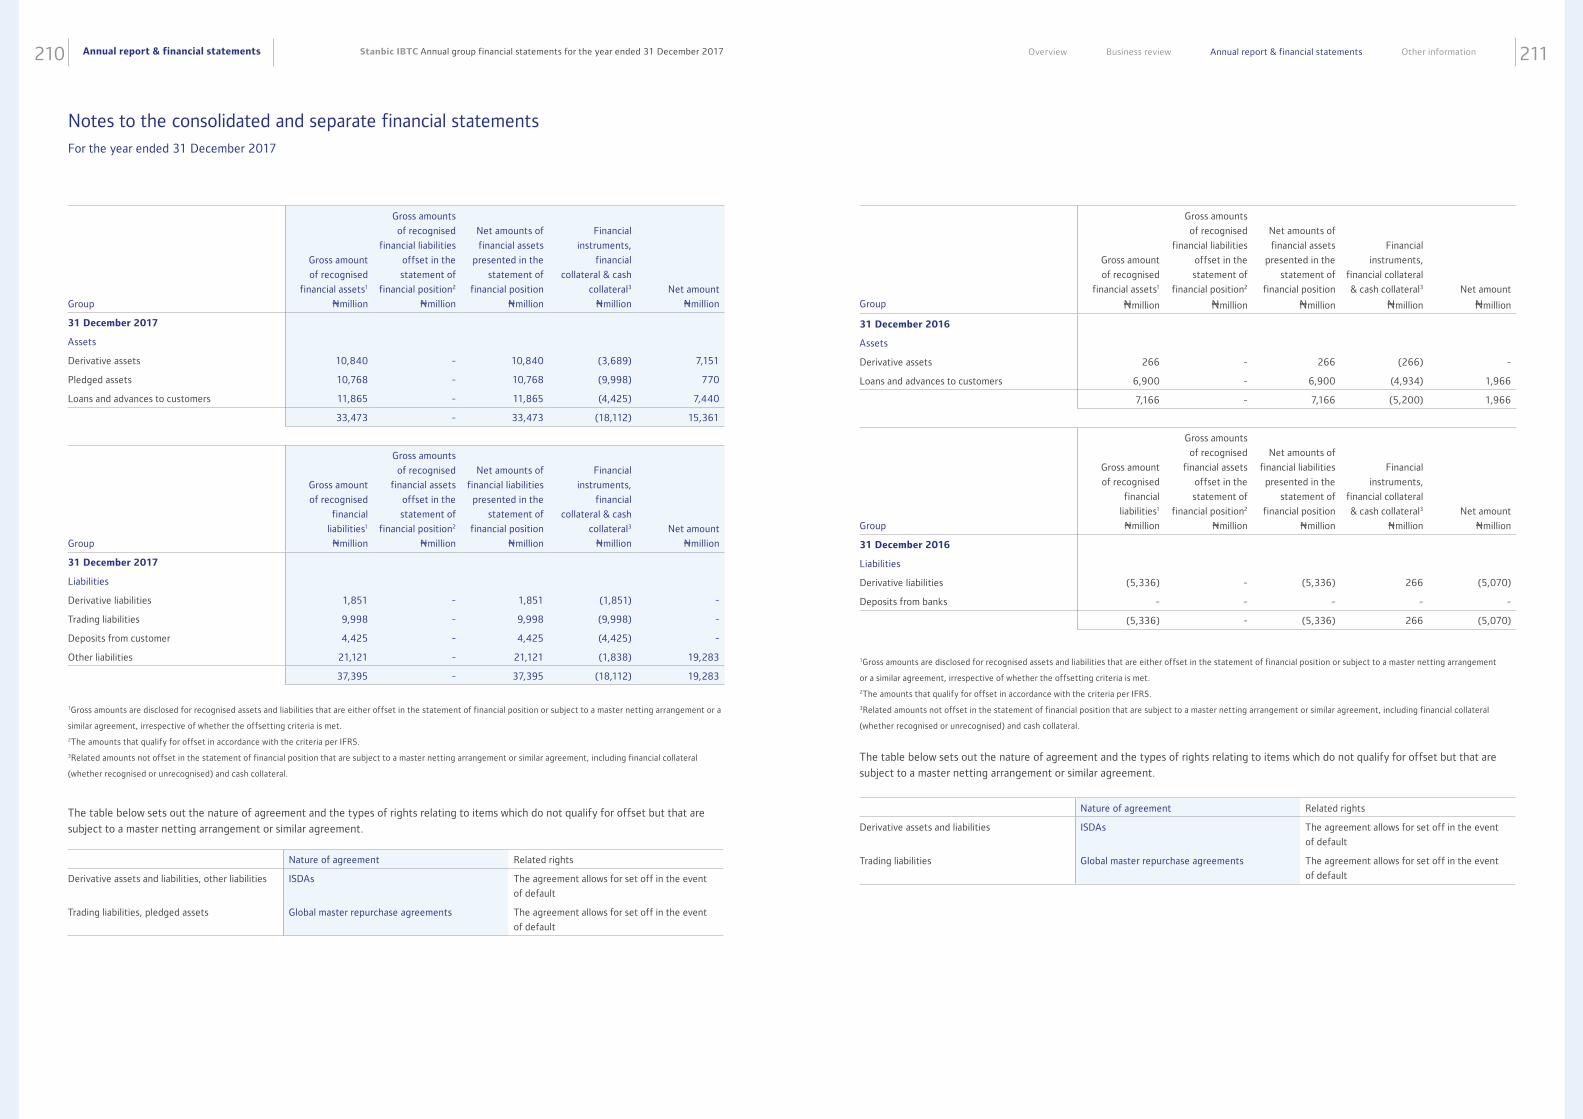
Annual report & financial statements210 211Stanbic IBTC Annual group financial statements for the year ended 31 December 2017 Overview Business review Annual report & financial statements Other information
Group
Gross amount
of recognised
financial assets1
Nmillion
Gross amounts
of recognised
financial liabilities
offset in the
statement of
financial position2
Nmillion
Net amounts of
financial assets
presented in the
statement of
financial position
Nmillion
Financial
instruments,
financial
collateral & cash
collateral3
Nmillion
Net amount
Nmillion
31 December 2017
Assets
Derivative assets 10,840 - 10,840 (3,689) 7,151
Pledged assets 10,768 - 10,768 (9,998) 770
Loans and advances to customers 11,865 - 11,865 (4,425) 7,440
33,473 - 33,473 (18,112) 15,361
Group
Gross amount
of recognised
financial
liabilities1
Nmillion
Gross amounts
of recognised
financial assets
offset in the
statement of
financial position2
Nmillion
Net amounts of
financial liabilities
presented in the
statement of
financial position
Nmillion
Financial
instruments,
financial
collateral & cash
collateral3
Nmillion
Net amount
Nmillion
31 December 2017
Liabilities
Derivative liabilities 1,851 - 1,851 (1,851) -
Trading liabilities 9,998 - 9,998 (9,998) -
Deposits from customer 4,425 - 4,425 (4,425) -
Other liabilities 21,121 - 21,121 (1,838) 19,283
37,395 - 37,395 (18,112) 19,283
1Gross amounts are disclosed for recognised assets and liabilities that are either offset in the statement of financial position or subject to a master netting arrangement or a
similar agreement, irrespective of whether the offsetting criteria is met.
2The amounts that qualify for offset in accordance with the criteria per IFRS.
3Related amounts not offset in the statement of financial position that are subject to a master netting arrangement or similar agreement, including financial collateral
(whether recognised or unrecognised) and cash collateral.
Nature of agreement Related rights
Derivative assets and liabilities, other liabilities ISDAs The agreement allows for set off in the event
of default
Trading liabilities, pledged assets Global master repurchase agreements The agreement allows for set off in the event
of default
The table below sets out the nature of agreement and the types of rights relating to items which do not qualify for offset but that are
subject to a master netting arrangement or similar agreement.
Group
Gross amount
of recognised
financial assets1
Nmillion
Gross amounts
of recognised
financial liabilities
offset in the
statement of
financial position2
Nmillion
Net amounts of
financial assets
presented in the
statement of
financial position
Nmillion
Financial
instruments,
financial collateral
& cash collateral3
Nmillion
Net amount
Nmillion
31 December 2016
Assets
Derivative assets 266 - 266 (266) -
Loans and advances to customers 6,900 - 6,900 (4,934) 1,966
7,166 - 7,166 (5,200) 1,966
Group
Gross amount
of recognised
financial
liabilities1
Nmillion
Gross amounts
of recognised
financial assets
offset in the
statement of
financial position2
Nmillion
Net amounts of
financial liabilities
presented in the
statement of
financial position
Nmillion
Financial
instruments,
financial collateral
& cash collateral3
Nmillion
Net amount
Nmillion
31 December 2016
Liabilities
Derivative liabilities (5,336) - (5,336) 266 (5,070)
Deposits from banks - - - - -
(5,336) - (5,336) 266 (5,070)
1Gross amounts are disclosed for recognised assets and liabilities that are either offset in the statement of financial position or subject to a master netting arrangement
or a similar agreement, irrespective of whether the offsetting criteria is met.
2The amounts that qualify for offset in accordance with the criteria per IFRS.
3Related amounts not offset in the statement of financial position that are subject to a master netting arrangement or similar agreement, including financial collateral
(whether recognised or unrecognised) and cash collateral.
Nature of agreement Related rights
Derivative assets and liabilities ISDAs The agreement allows for set off in the event
of default
Trading liabilities Global master repurchase agreements The agreement allows for set off in the event
of default
The table below sets out the nature of agreement and the types of rights relating to items which do not qualify for offset but that are
subject to a master netting arrangement or similar agreement.
Notes to the consolidated and separate financial statements For the year ended 31 December 2017
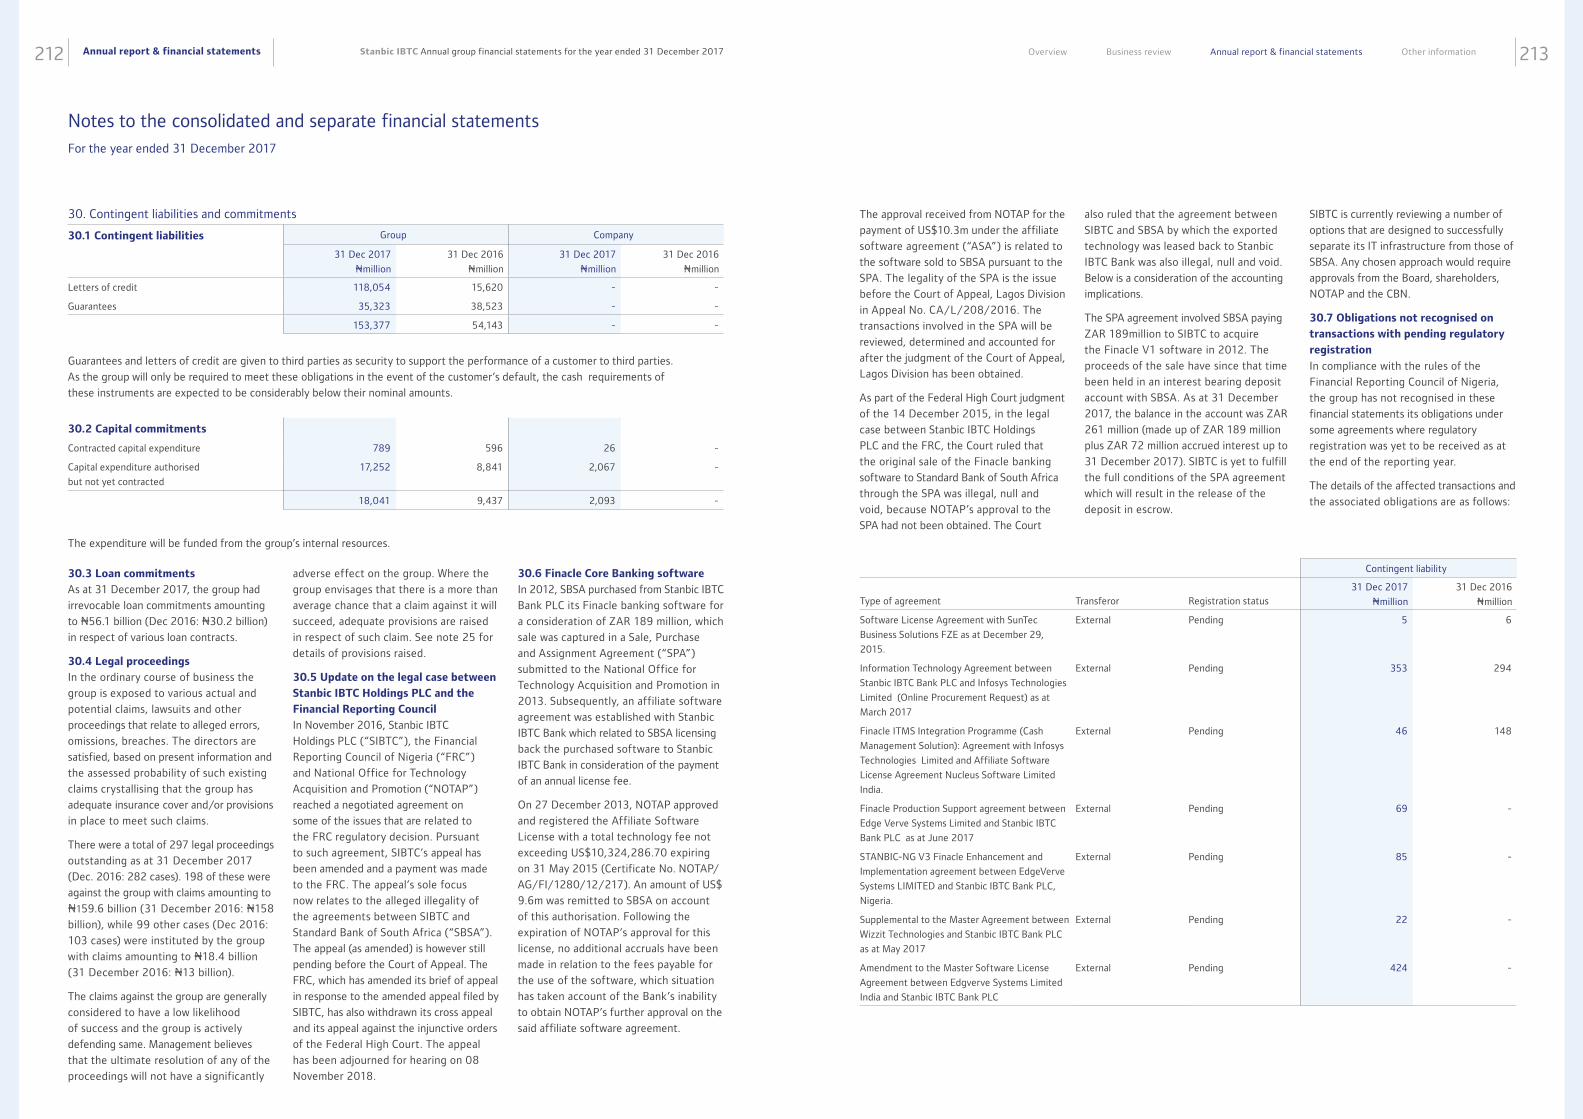
Annual report & financial statements212 213Stanbic IBTC Annual group financial statements for the year ended 31 December 2017 Overview Business review Annual report & financial statements Other information
30.1 Contingent liabilities Group Company
31 Dec 2017
Nmillion
31 Dec 2016
Nmillion
31 Dec 2017
Nmillion
31 Dec 2016
Nmillion
Letters of credit 118,054 15,620 - -
Guarantees 35,323 38,523 - -
153,377 54,143 - -
Guarantees and letters of credit are given to third parties as security to support the performance of a customer to third parties.
As the group will only be required to meet these obligations in the event of the customer’s default, the cash requirements of
these instruments are expected to be considerably below their nominal amounts.
30.2 Capital commitments
Contracted capital expenditure 789 596 26 -
Capital expenditure authorised
but not yet contracted
17,252 8,841 2,067 -
18,041 9,437 2,093 -
The expenditure will be funded from the group’s internal resources.
30. Contingent liabilities and commitments
30.3 Loan commitments
As at 31 December 2017, the group had
irrevocable loan commitments amounting
to N56.1 billion (Dec 2016: N30.2 billion)
in respect of various loan contracts.
30.4 Legal proceedings
In the ordinary course of business the
group is exposed to various actual and
potential claims, lawsuits and other
proceedings that relate to alleged errors,
omissions, breaches. The directors are
satisfied, based on present information and
the assessed probability of such existing
claims crystallising that the group has
adequate insurance cover and/or provisions
in place to meet such claims.
There were a total of 297 legal proceedings
outstanding as at 31 December 2017
(Dec. 2016: 282 cases). 198 of these were
against the group with claims amounting to
N159.6 billion (31 December 2016: N158
billion), while 99 other cases (Dec 2016:
103 cases) were instituted by the group
with claims amounting to N18.4 billion
(31 December 2016: N13 billion).
The claims against the group are generally
considered to have a low likelihood
of success and the group is actively
defending same. Management believes
that the ultimate resolution of any of the
proceedings will not have a significantly
adverse effect on the group. Where the
group envisages that there is a more than
average chance that a claim against it will
succeed, adequate provisions are raised
in respect of such claim. See note 25 for
details of provisions raised.
30.5 Update on the legal case between
Stanbic IBTC Holdings PLC and the
Financial Reporting Council
In November 2016, Stanbic IBTC
Holdings PLC (“SIBTC”), the Financial
Reporting Council of Nigeria (“FRC”)
and National Office for Technology
Acquisition and Promotion (“NOTAP”)
reached a negotiated agreement on
some of the issues that are related to
the FRC regulatory decision. Pursuant
to such agreement, SIBTC’s appeal has
been amended and a payment was made
to the FRC. The appeal’s sole focus
now relates to the alleged illegality of
the agreements between SIBTC and
Standard Bank of South Africa (“SBSA”).
The appeal (as amended) is however still
pending before the Court of Appeal. The
FRC, which has amended its brief of appeal
in response to the amended appeal filed by
SIBTC, has also withdrawn its cross appeal
and its appeal against the injunctive orders
of the Federal High Court. The appeal
has been adjourned for hearing on 08
November 2018.
30.6 Finacle Core Banking software
In 2012, SBSA purchased from Stanbic IBTC
Bank PLC its Finacle banking software for
a consideration of ZAR 189 million, which
sale was captured in a Sale, Purchase
and Assignment Agreement (“SPA”)
submitted to the National Office for
Technology Acquisition and Promotion in
2013. Subsequently, an affiliate software
agreement was established with Stanbic
IBTC Bank which related to SBSA licensing
back the purchased software to Stanbic
IBTC Bank in consideration of the payment
of an annual license fee.
On 27 December 2013, NOTAP approved
and registered the Affiliate Software
License with a total technology fee not
exceeding US$10,324,286.70 expiring
on 31 May 2015 (Certificate No. NOTAP/
AG/FI/1280/12/217). An amount of US$
9.6m was remitted to SBSA on account
of this authorisation. Following the
expiration of NOTAP’s approval for this
license, no additional accruals have been
made in relation to the fees payable for
the use of the software, which situation
has taken account of the Bank’s inability
to obtain NOTAP’s further approval on the
said affiliate software agreement.
The approval received from NOTAP for the
payment of US$10.3m under the affiliate
software agreement (“ASA”) is related to
the software sold to SBSA pursuant to the
SPA. The legality of the SPA is the issue
before the Court of Appeal, Lagos Division
in Appeal No. CA/L/208/2016. The
transactions involved in the SPA will be
reviewed, determined and accounted for
after the judgment of the Court of Appeal,
Lagos Division has been obtained.
As part of the Federal High Court judgment
of the 14 December 2015, in the legal
case between Stanbic IBTC Holdings
PLC and the FRC, the Court ruled that
the original sale of the Finacle banking
software to Standard Bank of South Africa
through the SPA was illegal, null and
void, because NOTAP’s approval to the
SPA had not been obtained. The Court
also ruled that the agreement between
SIBTC and SBSA by which the exported
technology was leased back to Stanbic
IBTC Bank was also illegal, null and void.
Below is a consideration of the accounting
implications.
The SPA agreement involved SBSA paying
ZAR 189million to SIBTC to acquire
the Finacle V1 software in 2012. The
proceeds of the sale have since that time
been held in an interest bearing deposit
account with SBSA. As at 31 December
2017, the balance in the account was ZAR
261 million (made up of ZAR 189 million
plus ZAR 72 million accrued interest up to
31 December 2017). SIBTC is yet to fulfill
the full conditions of the SPA agreement
which will result in the release of the
deposit in escrow.
SIBTC is currently reviewing a number of
options that are designed to successfully
separate its IT infrastructure from those of
SBSA. Any chosen approach would require
approvals from the Board, shareholders,
NOTAP and the CBN.
30.7 Obligations not recognised on
transactions with pending regulatory
registration
In compliance with the rules of the
Financial Reporting Council of Nigeria,
the group has not recognised in these
financial statements its obligations under
some agreements where regulatory
registration was yet to be received as at
the end of the reporting year.
The details of the affected transactions and
the associated obligations are as follows:
Contingent liability
Type of agreement Transferor Registration status
31 Dec 2017
Nmillion
31 Dec 2016
Nmillion
Software License Agreement with SunTec
Business Solutions FZE as at December 29,
2015.
External Pending 5 6
Information Technology Agreement between
Stanbic IBTC Bank PLC and Infosys Technologies
Limited (Online Procurement Request) as at
March 2017
External Pending 353 294
Finacle ITMS Integration Programme (Cash
Management Solution): Agreement with Infosys
Technologies Limited and Affiliate Software
License Agreement Nucleus Software Limited
India.
External Pending 46 148
Finacle Production Support agreement between
Edge Verve Systems Limited and Stanbic IBTC
Bank PLC as at June 2017
External Pending 69 -
STANBIC-NG V3 Finacle Enhancement and
Implementation agreement between EdgeVerve
Systems LIMITED and Stanbic IBTC Bank PLC,
Nigeria.
External Pending 85 -
Supplemental to the Master Agreement between
Wizzit Technologies and Stanbic IBTC Bank PLC
as at May 2017
External Pending 22 -
Amendment to the Master Software License
Agreement between Edgverve Systems Limited
India and Stanbic IBTC Bank PLC
External Pending 424 -
Notes to the consolidated and separate financial statements For the year ended 31 December 2017
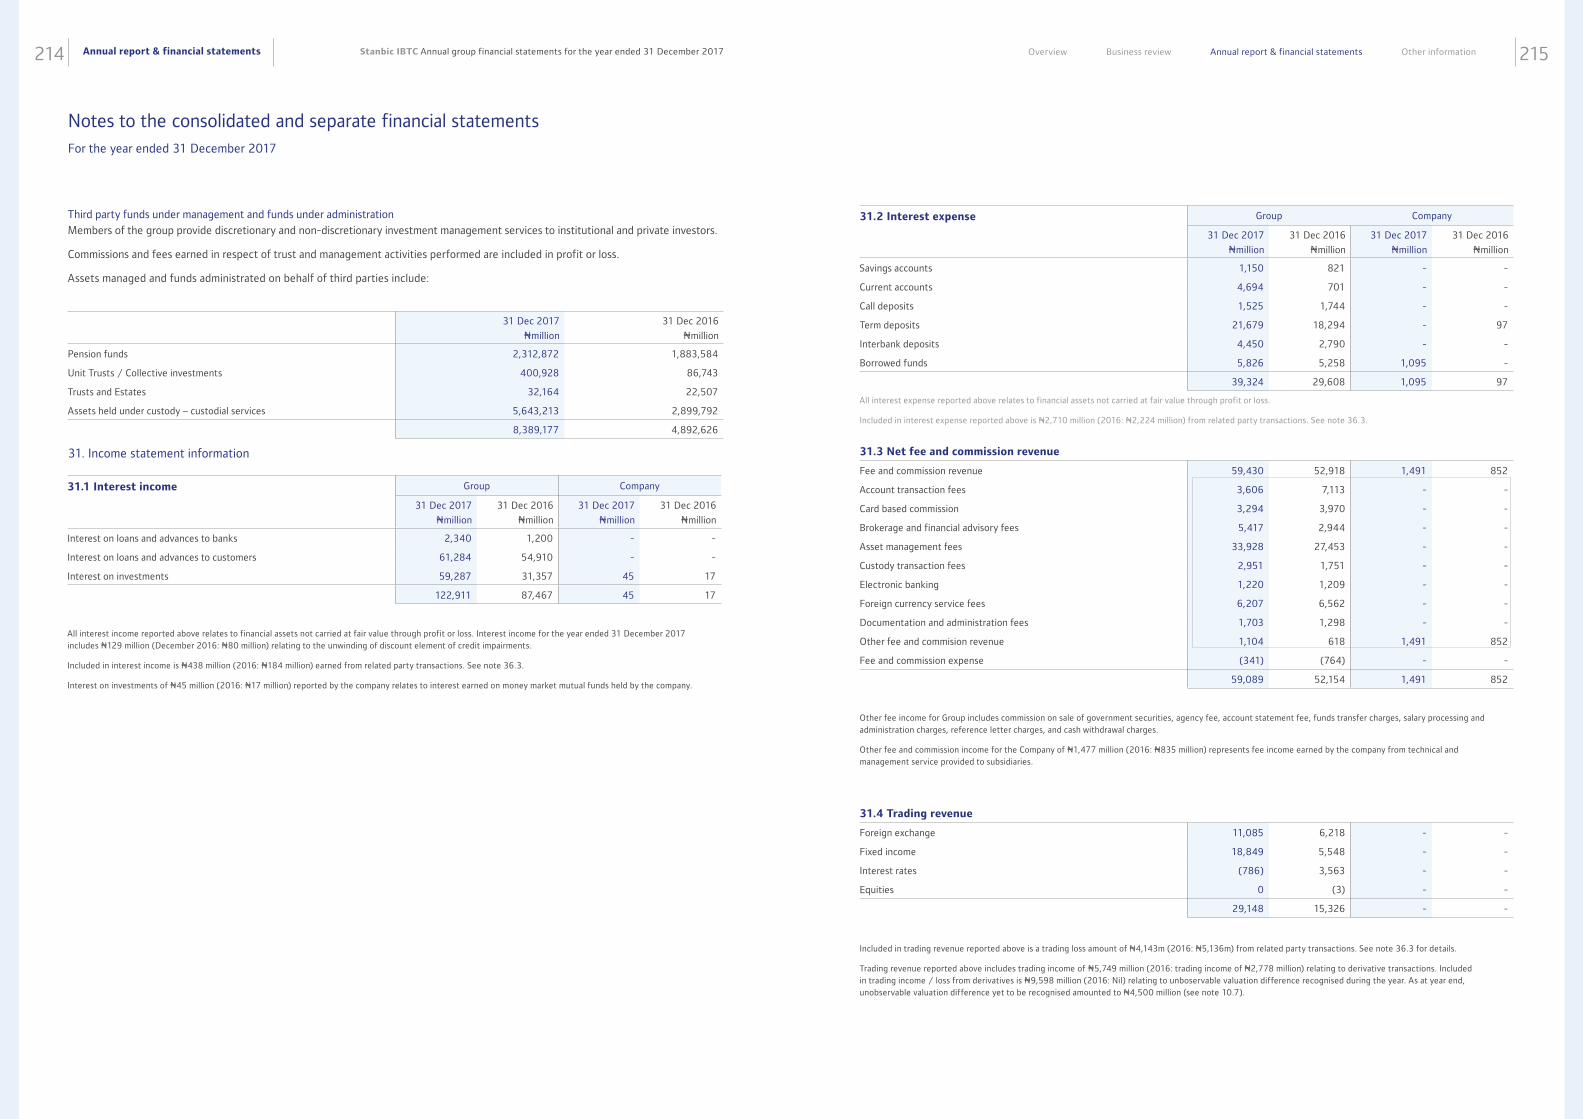
Annual report & financial statements214 215Stanbic IBTC Annual group financial statements for the year ended 31 December 2017 Overview Business review Annual report & financial statements Other information
31 Dec 2017
Nmillion
31 Dec 2016
Nmillion
Pension funds 2,312,872 1,883,584
Unit Trusts / Collective investments 400,928 86,743
Trusts and Estates 32,164 22,507
Assets held under custody – custodial services 5,643,213 2,899,792
8,389,177 4,892,626
Third party funds under management and funds under administration
Members of the group provide discretionary and non-discretionary investment management services to institutional and private investors.
Commissions and fees earned in respect of trust and management activities performed are included in profit or loss.
Assets managed and funds administrated on behalf of third parties include:
31. Income statement information
31.1 Interest income Group Company
31 Dec 2017
Nmillion
31 Dec 2016
Nmillion
31 Dec 2017
Nmillion
31 Dec 2016
Nmillion
Interest on loans and advances to banks 2,340 1,200 - -
Interest on loans and advances to customers 61,284 54,910 - -
Interest on investments 59,287 31,357 45 17
122,911 87,467 45 17
All interest income reported above relates to financial assets not carried at fair value through profit or loss. Interest income for the year ended 31 December 2017 includes N129 million (December 2016: N80 million) relating to the unwinding of discount element of credit impairments.
Included in interest income is N438 million (2016: N184 million) earned from related party transactions. See note 36.3.
Interest on investments of N45 million (2016: N17 million) reported by the company relates to interest earned on money market mutual funds held by the company.
31.2 Interest expense Group Company
31 Dec 2017
Nmillion
31 Dec 2016
Nmillion
31 Dec 2017
Nmillion
31 Dec 2016
Nmillion
Savings accounts 1,150 821 - -
Current accounts 4,694 701 - -
Call deposits 1,525 1,744 - -
Term deposits 21,679 18,294 - 97
Interbank deposits 4,450 2,790 - -
Borrowed funds 5,826 5,258 1,095 -
39,324 29,608 1,095 97
All interest expense reported above relates to financial assets not carried at fair value through profit or loss.
Included in interest expense reported above is N2,710 million (2016: N2,224 million) from related party transactions. See note 36.3.
31.3 Net fee and commission revenue
Fee and commission revenue 59,430 52,918 1,491 852
Account transaction fees 3,606 7,113 - -
Card based commission 3,294 3,970 - -
Brokerage and financial advisory fees 5,417 2,944 - -
Asset management fees 33,928 27,453 - -
Custody transaction fees 2,951 1,751 - -
Electronic banking 1,220 1,209 - -
Foreign currency service fees 6,207 6,562 - -
Documentation and administration fees 1,703 1,298 - -
Other fee and commision revenue 1,104 618 1,491 852
Fee and commission expense (341) (764) - -
59,089 52,154 1,491 852
Other fee income for Group includes commission on sale of government securities, agency fee, account statement fee, funds transfer charges, salary processing and administration charges, reference letter charges, and cash withdrawal charges.
Other fee and commission income for the Company of N1,477 million (2016: N835 million) represents fee income earned by the company from technical and management service provided to subsidiaries.
31.4 Trading revenue
Foreign exchange 11,085 6,218 - -
Fixed income 18,849 5,548 - -
Interest rates (786) 3,563 - -
Equities 0 (3) - -
29,148 15,326 - -
Included in trading revenue reported above is a trading loss amount of N4,143m (2016: N5,136m) from related party transactions. See note 36.3 for details.
Trading revenue reported above includes trading income of N5,749 million (2016: trading income of N2,778 million) relating to derivative transactions. Included in trading income / loss from derivatives is N9,598 million (2016: Nil) relating to unboservable valuation difference recognised during the year. As at year end, unobservable valuation difference yet to be recognised amounted to N4,500 million (see note 10.7).
Notes to the consolidated and separate financial statements For the year ended 31 December 2017
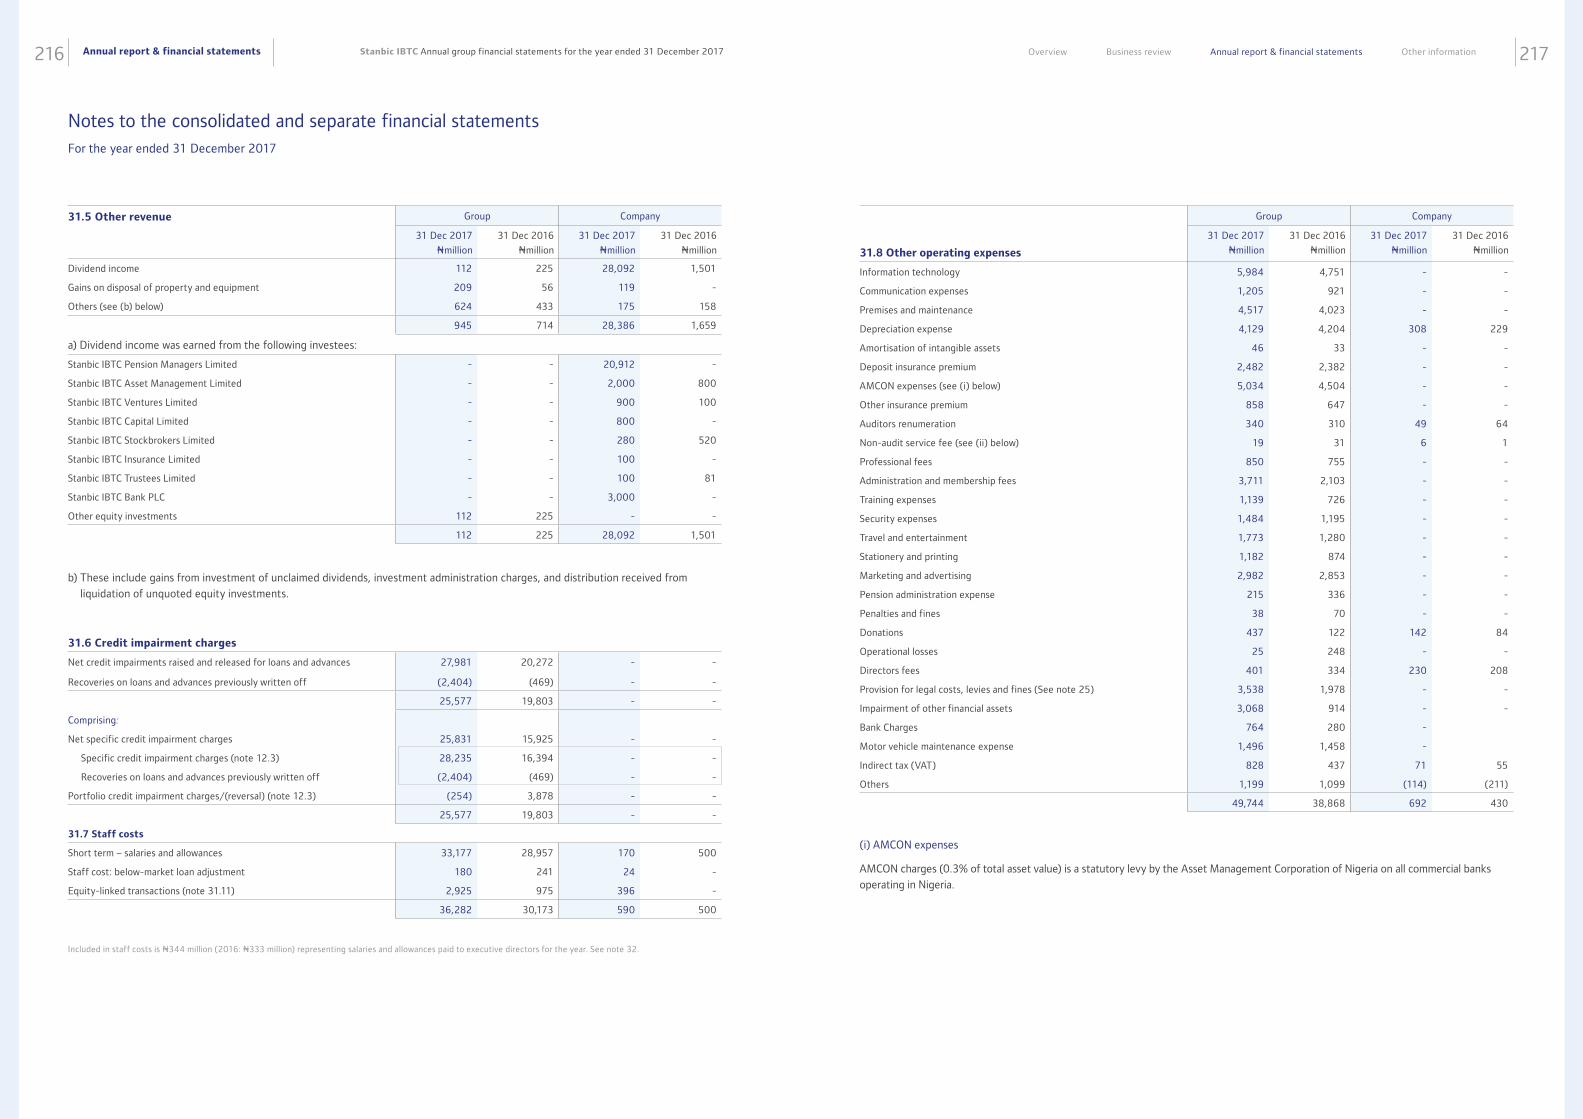
Annual report & financial statements216 217Stanbic IBTC Annual group financial statements for the year ended 31 December 2017 Overview Business review Annual report & financial statements Other information
31.5 Other revenue Group Company
31 Dec 2017
Nmillion
31 Dec 2016
Nmillion
31 Dec 2017
Nmillion
31 Dec 2016
Nmillion
Dividend income 112 225 28,092 1,501
Gains on disposal of property and equipment 209 56 119 -
Others (see (b) below) 624 433 175 158
945 714 28,386 1,659
a) Dividend income was earned from the following investees:
Stanbic IBTC Pension Managers Limited - - 20,912 -
Stanbic IBTC Asset Management Limited - - 2,000 800
Stanbic IBTC Ventures Limited - - 900 100
Stanbic IBTC Capital Limited - - 800 -
Stanbic IBTC Stockbrokers Limited - - 280 520
Stanbic IBTC Insurance Limited - - 100 -
Stanbic IBTC Trustees Limited - - 100 81
Stanbic IBTC Bank PLC - - 3,000 -
Other equity investments 112 225 - -
112 225 28,092 1,501
b) These include gains from investment of unclaimed dividends, investment administration charges, and distribution received from
liquidation of unquoted equity investments.
31.6 Credit impairment charges
Net credit impairments raised and released for loans and advances 27,981 20,272 - -
Recoveries on loans and advances previously written off (2,404) (469) - -
25,577 19,803 - -
Comprising:
Net specific credit impairment charges 25,831 15,925 - -
Specific credit impairment charges (note 12.3) 28,235 16,394 - -
Recoveries on loans and advances previously written off (2,404) (469) - -
Portfolio credit impairment charges/(reversal) (note 12.3) (254) 3,878 - -
25,577 19,803 - -
31.7 Staff costs
Short term – salaries and allowances 33,177 28,957 170 500
Staff cost: below-market loan adjustment 180 241 24 -
Equity-linked transactions (note 31.11) 2,925 975 396 -
36,282 30,173 590 500
Included in staff costs is N344 million (2016: N333 million) representing salaries and allowances paid to executive directors for the year. See note 32.
Group Company
31.8 Other operating expenses
31 Dec 2017
Nmillion
31 Dec 2016
Nmillion
31 Dec 2017
Nmillion
31 Dec 2016
Nmillion
Information technology 5,984 4,751 - -
Communication expenses 1,205 921 - -
Premises and maintenance 4,517 4,023 - -
Depreciation expense 4,129 4,204 308 229
Amortisation of intangible assets 46 33 - -
Deposit insurance premium 2,482 2,382 - -
AMCON expenses (see (i) below) 5,034 4,504 - -
Other insurance premium 858 647 - -
Auditors renumeration 340 310 49 64
Non-audit service fee (see (ii) below) 19 31 6 1
Professional fees 850 755 - -
Administration and membership fees 3,711 2,103 - -
Training expenses 1,139 726 - -
Security expenses 1,484 1,195 - -
Travel and entertainment 1,773 1,280 - -
Stationery and printing 1,182 874 - -
Marketing and advertising 2,982 2,853 - -
Pension administration expense 215 336 - -
Penalties and fines 38 70 - -
Donations 437 122 142 84
Operational losses 25 248 - -
Directors fees 401 334 230 208
Provision for legal costs, levies and fines (See note 25) 3,538 1,978 - -
Impairment of other financial assets 3,068 914 - -
Bank Charges 764 280 -
Motor vehicle maintenance expense 1,496 1,458 -
Indirect tax (VAT) 828 437 71 55
Others 1,199 1,099 (114) (211)
49,744 38,868 692 430
(i) AMCON expenses
AMCON charges (0.3% of total asset value) is a statutory levy by the Asset Management Corporation of Nigeria on all commercial banks
operating in Nigeria.
Notes to the consolidated and separate financial statements For the year ended 31 December 2017
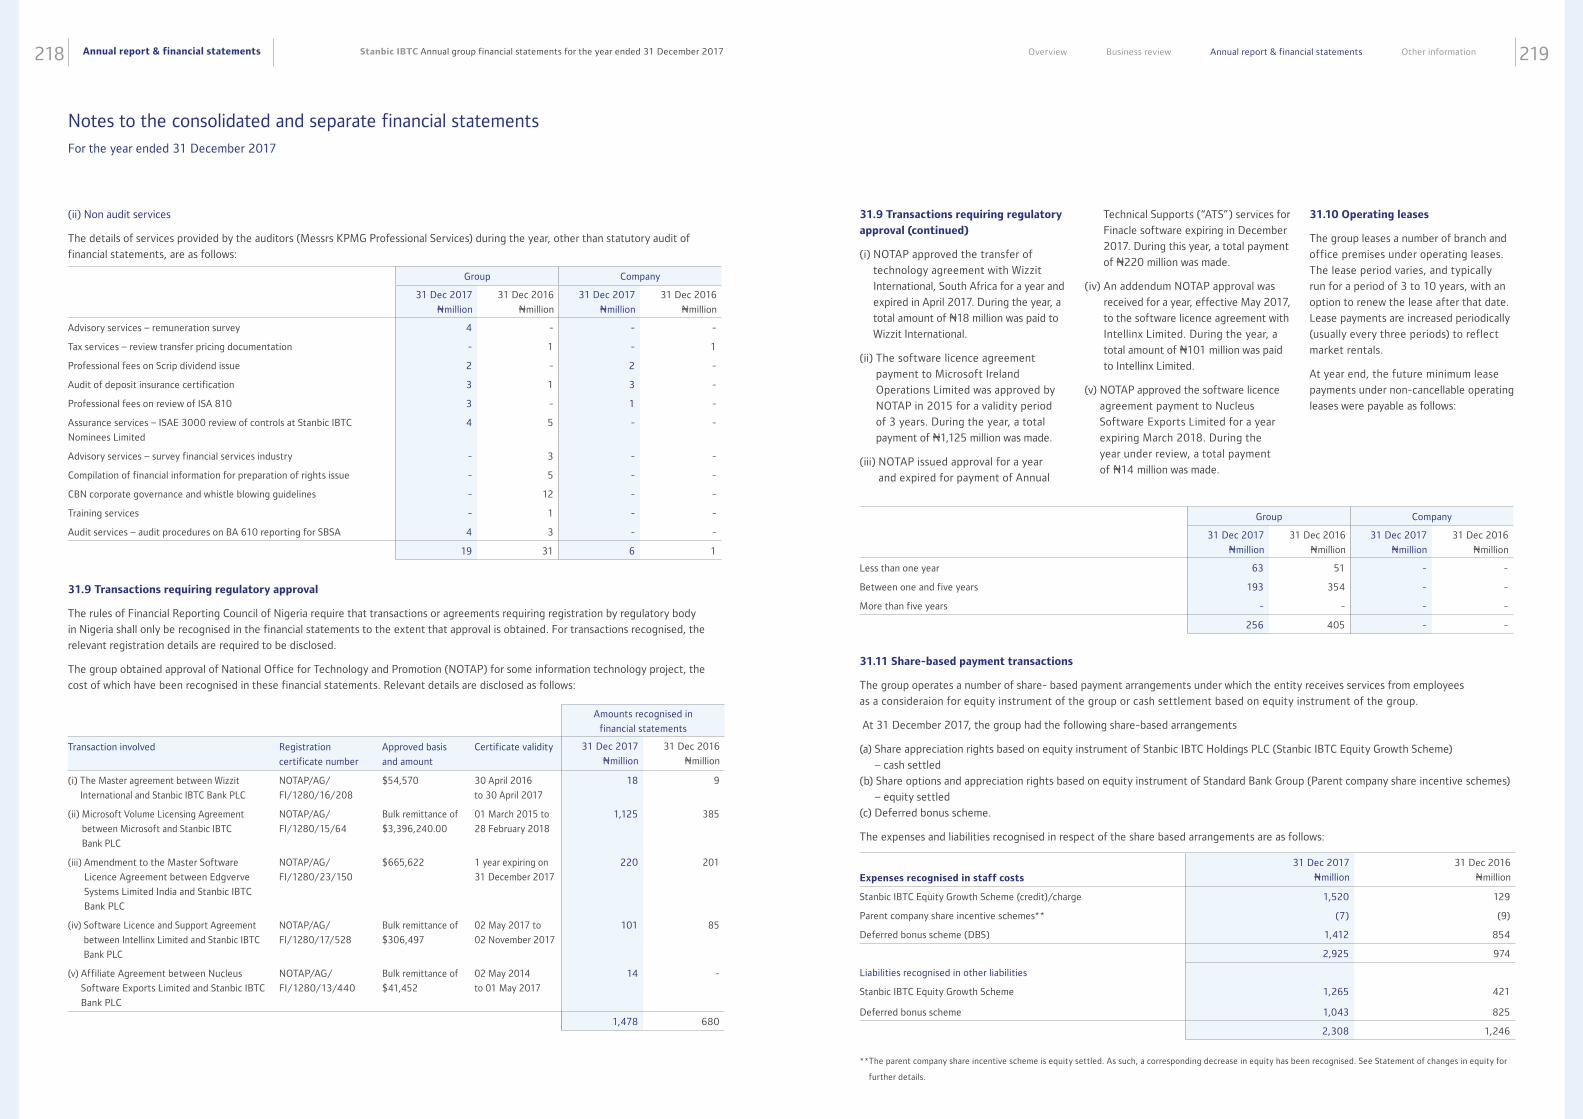
Annual report & financial statements218 219Stanbic IBTC Annual group financial statements for the year ended 31 December 2017 Overview Business review Annual report & financial statements Other information
(ii) Non audit services
The details of services provided by the auditors (Messrs KPMG Professional Services) during the year, other than statutory audit of
financial statements, are as follows:
31.9 Transactions requiring regulatory approval
The rules of Financial Reporting Council of Nigeria require that transactions or agreements requiring registration by regulatory body
in Nigeria shall only be recognised in the financial statements to the extent that approval is obtained. For transactions recognised, the
relevant registration details are required to be disclosed.
The group obtained approval of National Office for Technology and Promotion (NOTAP) for some information technology project, the
cost of which have been recognised in these financial statements. Relevant details are disclosed as follows:
Group Company
31 Dec 2017
Nmillion
31 Dec 2016
Nmillion
31 Dec 2017
Nmillion
31 Dec 2016
Nmillion
Advisory services – remuneration survey 4 - - -
Tax services – review transfer pricing documentation - 1 - 1
Professional fees on Scrip dividend issue 2 - 2 -
Audit of deposit insurance certification 3 1 3 -
Professional fees on review of ISA 810 3 - 1 -
Assurance services – ISAE 3000 review of controls at Stanbic IBTC
Nominees Limited
4 5 - -
Advisory services – survey financial services industry - 3 - -
Compilation of financial information for preparation of rights issue - 5 - -
CBN corporate governance and whistle blowing guidelines - 12 - -
Training services - 1 - -
Audit services – audit procedures on BA 610 reporting for SBSA 4 3 - -
19 31 6 1
Amounts recognised in
financial statements
Transaction involved Registration
certificate number
Approved basis
and amount
Certificate validity 31 Dec 2017
Nmillion
31 Dec 2016
Nmillion
(i) The Master agreement between Wizzit
International and Stanbic IBTC Bank PLC
NOTAP/AG/
FI/1280/16/208
$54,570 30 April 2016
to 30 April 2017
18 9
(ii) Microsoft Volume Licensing Agreement
between Microsoft and Stanbic IBTC
Bank PLC
NOTAP/AG/
FI/1280/15/64
Bulk remittance of
$3,396,240.00
01 March 2015 to
28 February 2018
1,125 385
(iii) Amendment to the Master Software
Licence Agreement between Edgverve
Systems Limited India and Stanbic IBTC
Bank PLC
NOTAP/AG/
FI/1280/23/150
$665,622 1 year expiring on
31 December 2017
220 201
(iv) Software Licence and Support Agreement
between Intellinx Limited and Stanbic IBTC
Bank PLC
NOTAP/AG/
FI/1280/17/528
Bulk remittance of
$306,497
02 May 2017 to
02 November 2017
101 85
(v) Affiliate Agreement between Nucleus
Software Exports Limited and Stanbic IBTC
Bank PLC
NOTAP/AG/
FI/1280/13/440
Bulk remittance of
$41,452
02 May 2014
to 01 May 2017
14 -
1,478 680
31.9 Transactions requiring regulatory
approval (continued)
(i) NOTAP approved the transfer of
technology agreement with Wizzit
International, South Africa for a year and
expired in April 2017. During the year, a
total amount of N18 million was paid to
Wizzit International.
(ii) The software licence agreement
payment to Microsoft Ireland
Operations Limited was approved by
NOTAP in 2015 for a validity period
of 3 years. During the year, a total
payment of N1,125 million was made.
(iii) NOTAP issued approval for a year
and expired for payment of Annual
Technical Supports (“ATS”) services for
Finacle software expiring in December
2017. During this year, a total payment
of N220 million was made.
(iv) An addendum NOTAP approval was
received for a year, effective May 2017,
to the software licence agreement with
Intellinx Limited. During the year, a
total amount of N101 million was paid
to Intellinx Limited.
(v) NOTAP approved the software licence
agreement payment to Nucleus
Software Exports Limited for a year
expiring March 2018. During the
year under review, a total payment
of N14 million was made.
31.10 Operating leases
The group leases a number of branch and
office premises under operating leases.
The lease period varies, and typically
run for a period of 3 to 10 years, with an
option to renew the lease after that date.
Lease payments are increased periodically
(usually every three periods) to reflect
market rentals.
At year end, the future minimum lease
payments under non-cancellable operating
leases were payable as follows:
Group Company
31 Dec 2017
Nmillion
31 Dec 2016
Nmillion
31 Dec 2017
Nmillion
31 Dec 2016
Nmillion
Less than one year 63 51 - -
Between one and five years 193 354 - -
More than five years - - - -
256 405 - -
31.11 Share-based payment transactions
The group operates a number of share- based payment arrangements under which the entity receives services from employees
as a consideraion for equity instrument of the group or cash settlement based on equity instrument of the group.
At 31 December 2017, the group had the following share-based arrangements
(a) Share appreciation rights based on equity instrument of Stanbic IBTC Holdings PLC (Stanbic IBTC Equity Growth Scheme)
– cash settled
(b) Share options and appreciation rights based on equity instrument of Standard Bank Group (Parent company share incentive schemes)
– equity settled
(c) Deferred bonus scheme.
The expenses and liabilities recognised in respect of the share based arrangements are as follows:
Expenses recognised in staff costs
31 Dec 2017
Nmillion
31 Dec 2016
Nmillion
Stanbic IBTC Equity Growth Scheme (credit)/charge 1,520 129
Parent company share incentive schemes** (7) (9)
Deferred bonus scheme (DBS) 1,412 854
2,925 974
Liabilities recognised in other liabilities
Stanbic IBTC Equity Growth Scheme 1,265 421
Deferred bonus scheme 1,043 825
2,308 1,246
** The parent company share incentive scheme is equity settled. As such, a corresponding decrease in equity has been recognised. See Statement of changes in equity for
further details.
Notes to the consolidated and separate financial statements For the year ended 31 December 2017
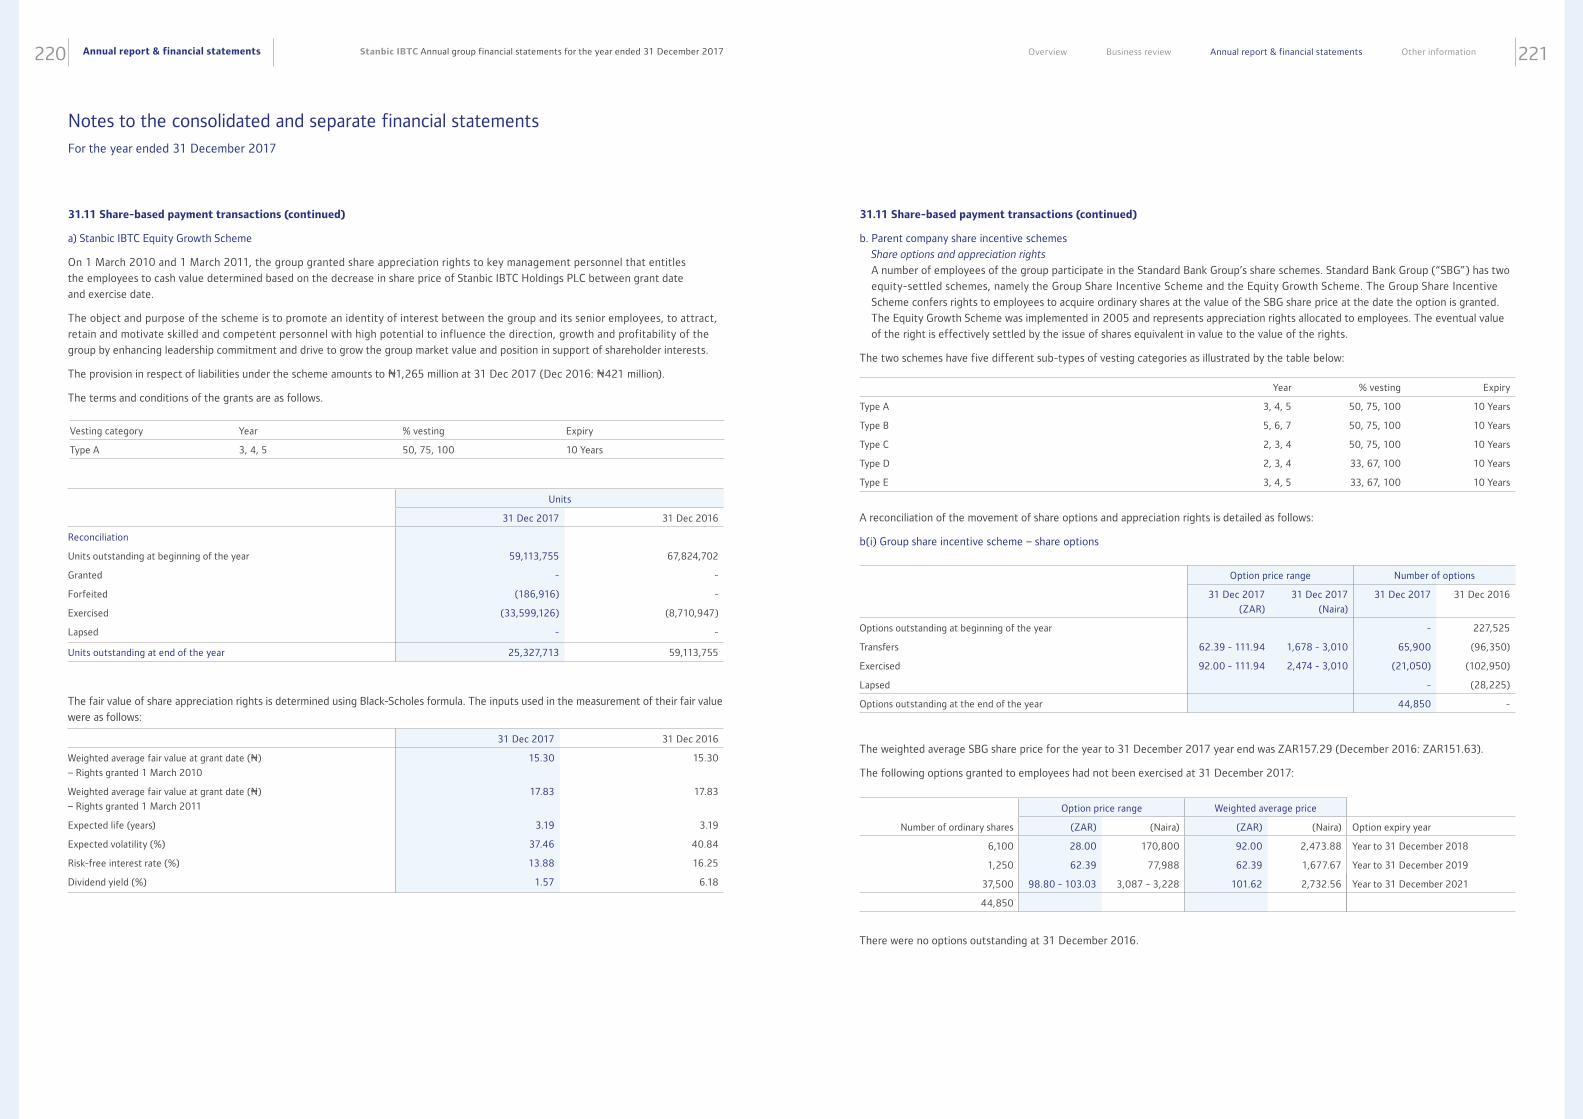
Annual report & financial statements220 221Stanbic IBTC Annual group financial statements for the year ended 31 December 2017 Overview Business review Annual report & financial statements Other information
31.11 Share-based payment transactions (continued)
a) Stanbic IBTC Equity Growth Scheme
On 1 March 2010 and 1 March 2011, the group granted share appreciation rights to key management personnel that entitles
the employees to cash value determined based on the decrease in share price of Stanbic IBTC Holdings PLC between grant date
and exercise date.
The object and purpose of the scheme is to promote an identity of interest between the group and its senior employees, to attract,
retain and motivate skilled and competent personnel with high potential to influence the direction, growth and profitability of the
group by enhancing leadership commitment and drive to grow the group market value and position in support of shareholder interests.
The provision in respect of liabilities under the scheme amounts to N1,265 million at 31 Dec 2017 (Dec 2016: N421 million).
The terms and conditions of the grants are as follows.
The fair value of share appreciation rights is determined using Black-Scholes formula. The inputs used in the measurement of their fair value
were as follows:
Vesting category Year % vesting Expiry
Type A 3, 4, 5 50, 75, 100 10 Years
Units
31 Dec 2017 31 Dec 2016
Reconciliation
Units outstanding at beginning of the year 59,113,755 67,824,702
Granted - -
Forfeited (186,916) -
Exercised (33,599,126) (8,710,947)
Lapsed - -
Units outstanding at end of the year 25,327,713 59,113,755
31 Dec 2017 31 Dec 2016
Weighted average fair value at grant date (N)
– Rights granted 1 March 2010
15.30 15.30
Weighted average fair value at grant date (N)
– Rights granted 1 March 2011
17.83 17.83
Expected life (years) 3.19 3.19
Expected volatility (%) 37.46 40.84
Risk-free interest rate (%) 13.88 16.25
Dividend yield (%) 1.57 6.18
Year % vesting Expiry
Type A 3, 4, 5 50, 75, 100 10 Years
Type B 5, 6, 7 50, 75, 100 10 Years
Type C 2, 3, 4 50, 75, 100 10 Years
Type D 2, 3, 4 33, 67, 100 10 Years
Type E 3, 4, 5 33, 67, 100 10 Years
A reconciliation of the movement of share options and appreciation rights is detailed as follows:
b(i) Group share incentive scheme – share options
The weighted average SBG share price for the year to 31 December 2017 year end was ZAR157.29 (December 2016: ZAR151.63).
The following options granted to employees had not been exercised at 31 December 2017:
There were no options outstanding at 31 December 2016.
Option price range Number of options
31 Dec 2017
(ZAR)
31 Dec 2017
(Naira)
31 Dec 2017 31 Dec 2016
Options outstanding at beginning of the year - 227,525
Transfers 62.39 - 111.94 1,678 - 3,010 65,900 (96,350)
Exercised 92.00 - 111.94 2,474 - 3,010 (21,050) (102,950)
Lapsed - (28,225)
Options outstanding at the end of the year 44,850 -
Option price range Weighted average price
Number of ordinary shares (ZAR) (Naira) (ZAR) (Naira) Option expiry year
6,100 28.00 170,800 92.00 2,473.88 Year to 31 December 2018
1,250 62.39 77,988 62.39 1,677.67 Year to 31 December 2019
37,500 98.80 - 103.03 3,087 - 3,228 101.62 2,732.56 Year to 31 December 2021
44,850
31.11 Share-based payment transactions (continued)
b. Parent company share incentive schemes
Share options and appreciation rights
A number of employees of the group participate in the Standard Bank Group’s share schemes. Standard Bank Group (“SBG”) has two
equity-settled schemes, namely the Group Share Incentive Scheme and the Equity Growth Scheme. The Group Share Incentive
Scheme confers rights to employees to acquire ordinary shares at the value of the SBG share price at the date the option is granted.
The Equity Growth Scheme was implemented in 2005 and represents appreciation rights allocated to employees. The eventual value
of the right is effectively settled by the issue of shares equivalent in value to the value of the rights.
The two schemes have five different sub-types of vesting categories as illustrated by the table below:
Notes to the consolidated and separate financial statements For the year ended 31 December 2017
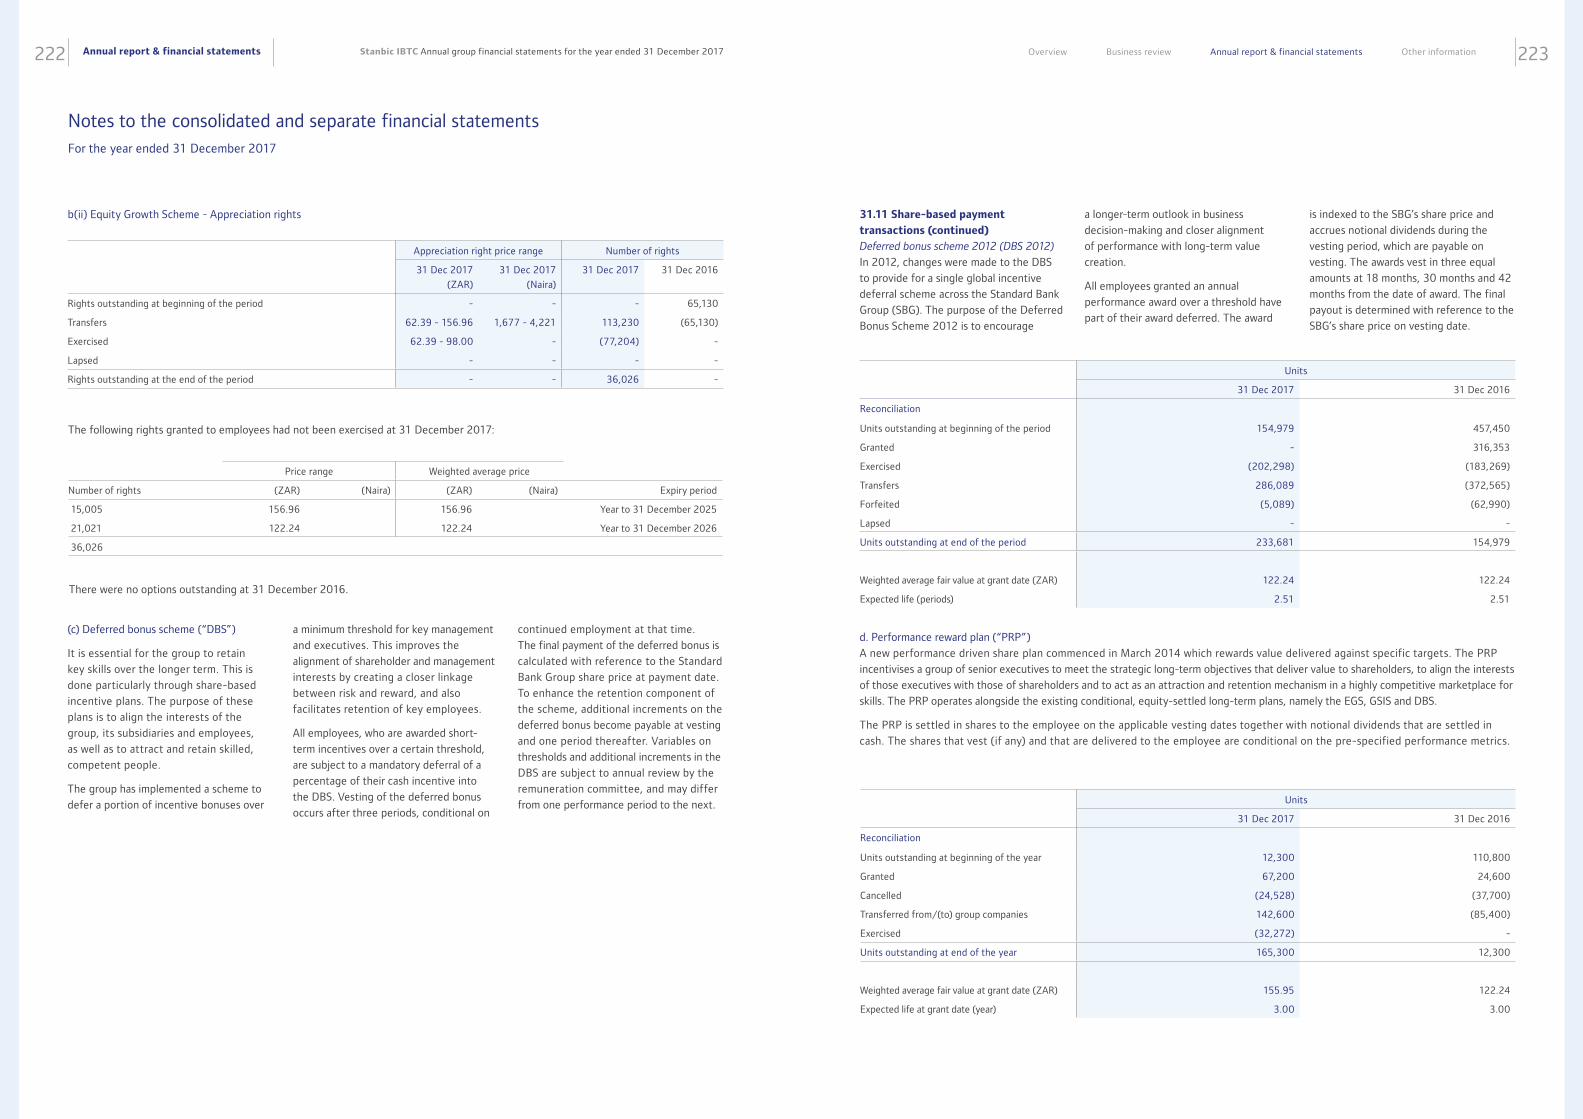
Annual report & financial statements222 223Stanbic IBTC Annual group financial statements for the year ended 31 December 2017 Overview Business review Annual report & financial statements Other information
The following rights granted to employees had not been exercised at 31 December 2017:
There were no options outstanding at 31 December 2016.
(c) Deferred bonus scheme (“DBS”)
It is essential for the group to retain
key skills over the longer term. This is
done particularly through share-based
incentive plans. The purpose of these
plans is to align the interests of the
group, its subsidiaries and employees,
as well as to attract and retain skilled,
competent people.
The group has implemented a scheme to
defer a portion of incentive bonuses over
Price range Weighted average price
Number of rights (ZAR) (Naira) (ZAR) (Naira) Expiry period
15,005 156.96 156.96 Year to 31 December 2025
21,021 122.24 122.24 Year to 31 December 2026
36,026
b(ii) Equity Growth Scheme - Appreciation rights
Appreciation right price range Number of rights
31 Dec 2017
(ZAR)
31 Dec 2017
(Naira)
31 Dec 2017 31 Dec 2016
Rights outstanding at beginning of the period - - - 65,130
Transfers 62.39 - 156.96 1,677 - 4,221 113,230 (65,130)
Exercised 62.39 - 98.00 - (77,204) -
Lapsed - - - -
Rights outstanding at the end of the period - - 36,026 -
a minimum threshold for key management
and executives. This improves the
alignment of shareholder and management
interests by creating a closer linkage
between risk and reward, and also
facilitates retention of key employees.
All employees, who are awarded short-
term incentives over a certain threshold,
are subject to a mandatory deferral of a
percentage of their cash incentive into
the DBS. Vesting of the deferred bonus
occurs after three periods, conditional on
continued employment at that time.
The final payment of the deferred bonus is
calculated with reference to the Standard
Bank Group share price at payment date.
To enhance the retention component of
the scheme, additional increments on the
deferred bonus become payable at vesting
and one period thereafter. Variables on
thresholds and additional increments in the
DBS are subject to annual review by the
remuneration committee, and may differ
from one performance period to the next.
31.11 Share-based payment
transactions (continued)
Deferred bonus scheme 2012 (DBS 2012)
In 2012, changes were made to the DBS
to provide for a single global incentive
deferral scheme across the Standard Bank
Group (SBG). The purpose of the Deferred
Bonus Scheme 2012 is to encourage
d. Performance reward plan (“PRP”)
A new performance driven share plan commenced in March 2014 which rewards value delivered against specific targets. The PRP
incentivises a group of senior executives to meet the strategic long-term objectives that deliver value to shareholders, to align the interests
of those executives with those of shareholders and to act as an attraction and retention mechanism in a highly competitive marketplace for
skills. The PRP operates alongside the existing conditional, equity-settled long-term plans, namely the EGS, GSIS and DBS.
The PRP is settled in shares to the employee on the applicable vesting dates together with notional dividends that are settled in
cash. The shares that vest (if any) and that are delivered to the employee are conditional on the pre-specified performance metrics.
a longer-term outlook in business
decision-making and closer alignment
of performance with long-term value
creation.
All employees granted an annual
performance award over a threshold have
part of their award deferred. The award
is indexed to the SBG’s share price and
accrues notional dividends during the
vesting period, which are payable on
vesting. The awards vest in three equal
amounts at 18 months, 30 months and 42
months from the date of award. The final
payout is determined with reference to the
SBG’s share price on vesting date.
Units
31 Dec 2017 31 Dec 2016
Reconciliation
Units outstanding at beginning of the period 154,979 457,450
Granted - 316,353
Exercised (202,298) (183,269)
Transfers 286,089 (372,565)
Forfeited (5,089) (62,990)
Lapsed - -
Units outstanding at end of the period 233,681 154,979
Weighted average fair value at grant date (ZAR) 122.24 122.24
Expected life (periods) 2.51 2.51
Units
31 Dec 2017 31 Dec 2016
Reconciliation
Units outstanding at beginning of the year 12,300 110,800
Granted 67,200 24,600
Cancelled (24,528) (37,700)
Transferred from/(to) group companies 142,600 (85,400)
Exercised (32,272) -
Units outstanding at end of the year 165,300 12,300
Weighted average fair value at grant date (ZAR) 155.95 122.24
Expected life at grant date (year) 3.00 3.00
Notes to the consolidated and separate financial statements For the year ended 31 December 2017
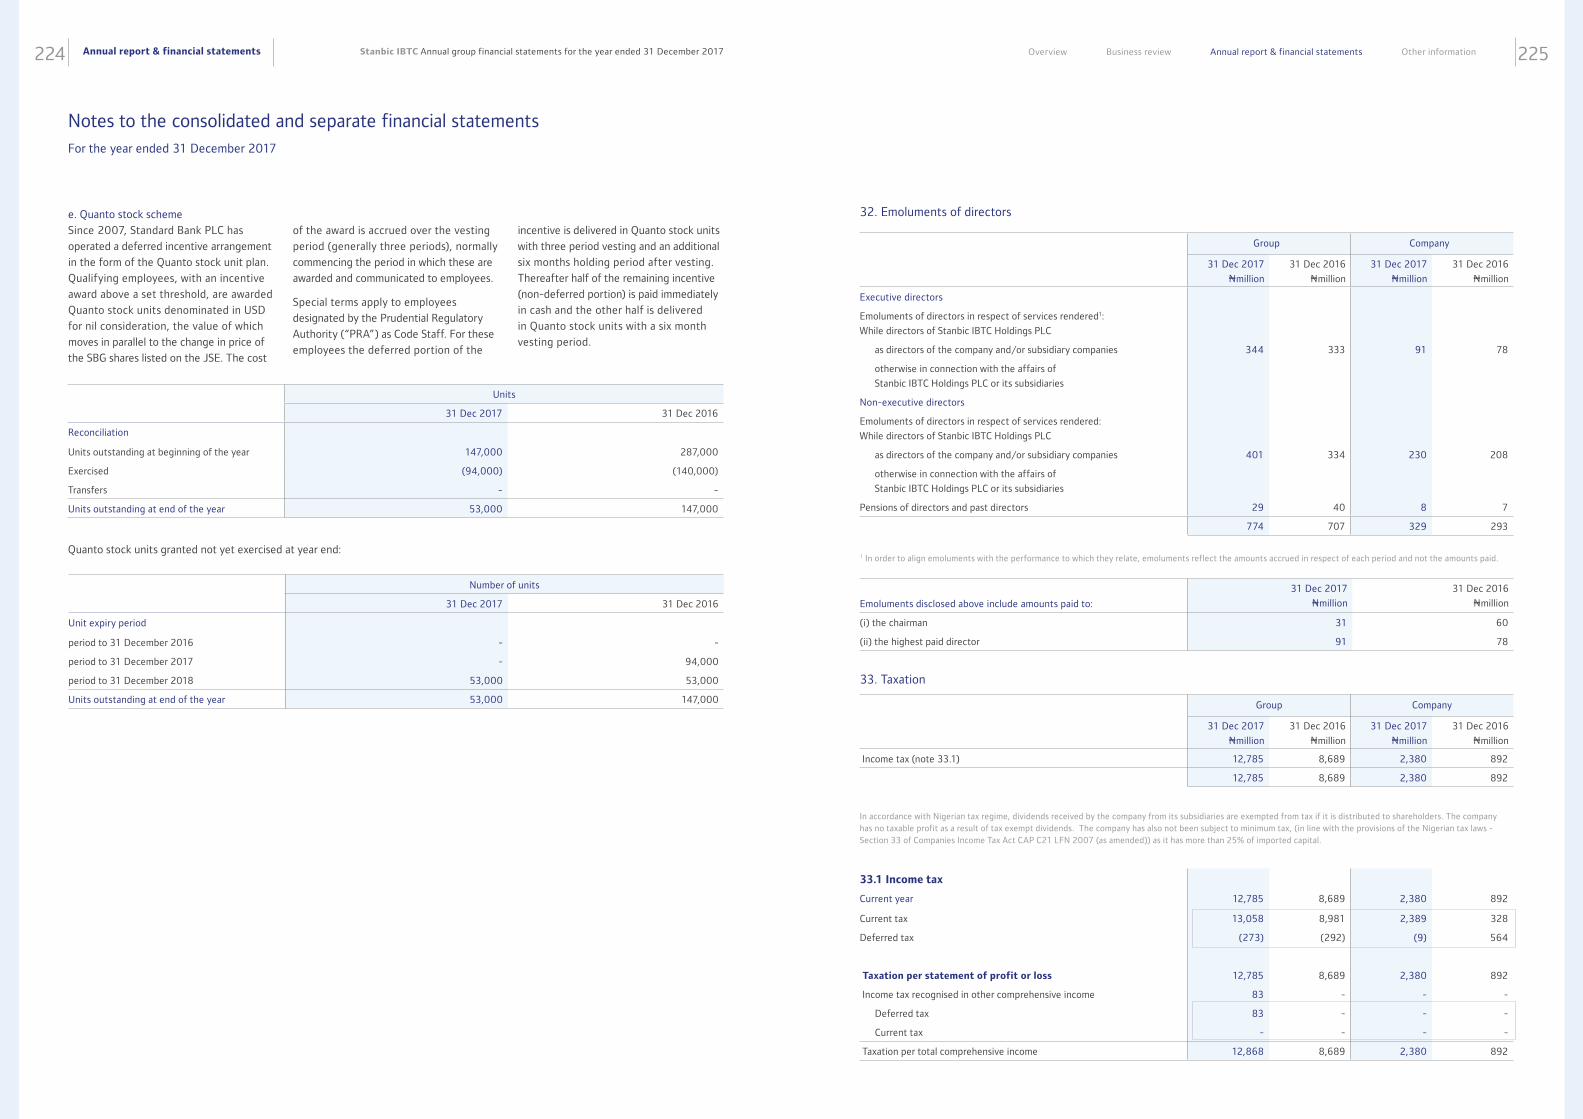
Annual report & financial statements224 225Stanbic IBTC Annual group financial statements for the year ended 31 December 2017 Overview Business review Annual report & financial statements Other information
Quanto stock units granted not yet exercised at year end:
e. Quanto stock scheme
Since 2007, Standard Bank PLC has
operated a deferred incentive arrangement
in the form of the Quanto stock unit plan.
Qualifying employees, with an incentive
award above a set threshold, are awarded
Quanto stock units denominated in USD
for nil consideration, the value of which
moves in parallel to the change in price of
the SBG shares listed on the JSE. The cost
Units
31 Dec 2017 31 Dec 2016
Reconciliation
Units outstanding at beginning of the year 147,000 287,000
Exercised (94,000) (140,000)
Transfers - -
Units outstanding at end of the year 53,000 147,000
Number of units
31 Dec 2017 31 Dec 2016
Unit expiry period
period to 31 December 2016 - -
period to 31 December 2017 - 94,000
period to 31 December 2018 53,000 53,000
Units outstanding at end of the year 53,000 147,000
of the award is accrued over the vesting
period (generally three periods), normally
commencing the period in which these are
awarded and communicated to employees.
Special terms apply to employees
designated by the Prudential Regulatory
Authority (“PRA”) as Code Staff. For these
employees the deferred portion of the
incentive is delivered in Quanto stock units
with three period vesting and an additional
six months holding period after vesting.
Thereafter half of the remaining incentive
(non-deferred portion) is paid immediately
in cash and the other half is delivered
in Quanto stock units with a six month
vesting period.
Group Company
31 Dec 2017
Nmillion
31 Dec 2016
Nmillion
31 Dec 2017
Nmillion
31 Dec 2016
Nmillion
Executive directors
Emoluments of directors in respect of services rendered1:
While directors of Stanbic IBTC Holdings PLC
as directors of the company and/or subsidiary companies 344 333 91 78
otherwise in connection with the affairs of
Stanbic IBTC Holdings PLC or its subsidiaries
Non-executive directors
Emoluments of directors in respect of services rendered:
While directors of Stanbic IBTC Holdings PLC
as directors of the company and/or subsidiary companies 401 334 230 208
otherwise in connection with the affairs of
Stanbic IBTC Holdings PLC or its subsidiaries
Pensions of directors and past directors 29 40 8 7
774 707 329 293
Group Company
31 Dec 2017
Nmillion
31 Dec 2016
Nmillion
31 Dec 2017
Nmillion
31 Dec 2016
Nmillion
Income tax (note 33.1) 12,785 8,689 2,380 892
12,785 8,689 2,380 892
In accordance with Nigerian tax regime, dividends received by the company from its subsidiaries are exempted from tax if it is distributed to shareholders. The company has no taxable profit as a result of tax exempt dividends. The company has also not been subject to minimum tax, (in line with the provisions of the Nigerian tax laws - Section 33 of Companies Income Tax Act CAP C21 LFN 2007 (as amended)) as it has more than 25% of imported capital.
33.1 Income tax
Current year 12,785 8,689 2,380 892
Current tax 13,058 8,981 2,389 328
Deferred tax (273) (292) (9) 564
Taxation per statement of profit or loss 12,785 8,689 2,380 892
Income tax recognised in other comprehensive income 83 - - -
Deferred tax 83 - - -
Current tax - - - -
Taxation per total comprehensive income 12,868 8,689 2,380 892
1 In order to align emoluments with the performance to which they relate, emoluments reflect the amounts accrued in respect of each period and not the amounts paid.
Emoluments disclosed above include amounts paid to:
31 Dec 2017
Nmillion
31 Dec 2016
Nmillion
(i) the chairman 31 60
(ii) the highest paid director 91 78
32. Emoluments of directors
33. Taxation
Notes to the consolidated and separate financial statements For the year ended 31 December 2017
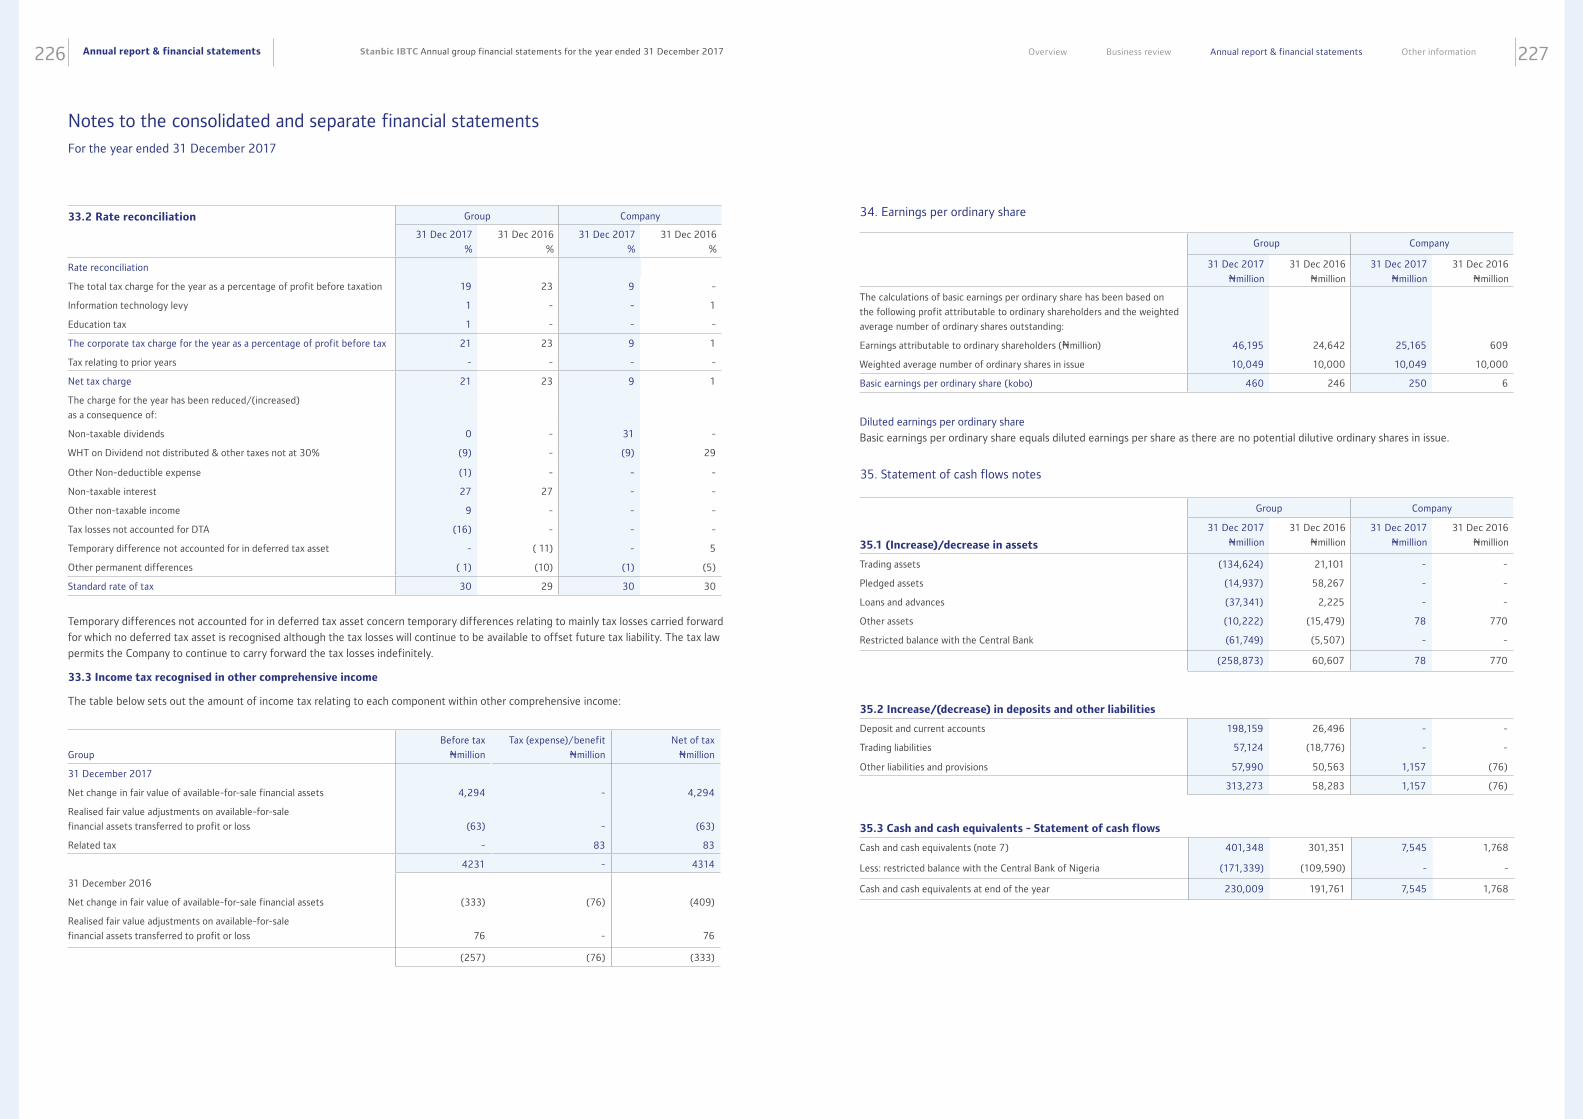
Annual report & financial statements226 227Stanbic IBTC Annual group financial statements for the year ended 31 December 2017 Overview Business review Annual report & financial statements Other information
33.2 Rate reconciliation Group Company
31 Dec 2017
%
31 Dec 2016
%
31 Dec 2017
%
31 Dec 2016
%
Rate reconciliation
The total tax charge for the year as a percentage of profit before taxation 19 23 9 -
Information technology levy 1 - - 1
Education tax 1 - - -
The corporate tax charge for the year as a percentage of profit before tax 21 23 9 1
Tax relating to prior years - - - -
Net tax charge 21 23 9 1
The charge for the year has been reduced/(increased)
as a consequence of:
Non-taxable dividends 0 - 31 -
WHT on Dividend not distributed & other taxes not at 30% (9) - (9) 29
Other Non-deductible expense (1) - - -
Non-taxable interest 27 27 - -
Other non-taxable income 9 - - -
Tax losses not accounted for DTA (16) - - -
Temporary difference not accounted for in deferred tax asset - ( 11) - 5
Other permanent differences ( 1) (10) (1) (5)
Standard rate of tax 30 29 30 30
Temporary differences not accounted for in deferred tax asset concern temporary differences relating to mainly tax losses carried forward
for which no deferred tax asset is recognised although the tax losses will continue to be available to offset future tax liability. The tax law
permits the Company to continue to carry forward the tax losses indefinitely.
33.3 Income tax recognised in other comprehensive income
The table below sets out the amount of income tax relating to each component within other comprehensive income:
Group
Before tax
Nmillion
Tax (expense)/benefit
Nmillion
Net of tax
Nmillion
31 December 2017
Net change in fair value of available-for-sale financial assets 4,294 - 4,294
Realised fair value adjustments on available-for-sale
financial assets transferred to profit or loss
(63)
-
(63)
Related tax - 83 83
4231 - 4314
31 December 2016
Net change in fair value of available-for-sale financial assets (333) (76) (409)
Realised fair value adjustments on available-for-sale
financial assets transferred to profit or loss
76
-
76
(257) (76) (333)
34. Earnings per ordinary share
35. Statement of cash flows notes
Group Company
31 Dec 2017
Nmillion
31 Dec 2016
Nmillion
31 Dec 2017
Nmillion
31 Dec 2016
Nmillion
The calculations of basic earnings per ordinary share has been based on
the following profit attributable to ordinary shareholders and the weighted
average number of ordinary shares outstanding:
Earnings attributable to ordinary shareholders (Nmillion) 46,195 24,642 25,165 609
Weighted average number of ordinary shares in issue 10,049 10,000 10,049 10,000
Basic earnings per ordinary share (kobo) 460 246 250 6
Diluted earnings per ordinary share
Basic earnings per ordinary share equals diluted earnings per share as there are no potential dilutive ordinary shares in issue.
Group Company
35.1 (Increase)/decrease in assets
31 Dec 2017
Nmillion
31 Dec 2016
Nmillion
31 Dec 2017
Nmillion
31 Dec 2016
Nmillion
Trading assets (134,624) 21,101 - -
Pledged assets (14,937) 58,267 - -
Loans and advances (37,341) 2,225 - -
Other assets (10,222) (15,479) 78 770
Restricted balance with the Central Bank (61,749) (5,507) - -
(258,873) 60,607 78 770
35.2 Increase/(decrease) in deposits and other liabilities
Deposit and current accounts 198,159 26,496 - -
Trading liabilities 57,124 (18,776) - -
Other liabilities and provisions 57,990 50,563 1,157 (76)
313,273 58,283 1,157 (76)
35.3 Cash and cash equivalents - Statement of cash flows
Cash and cash equivalents (note 7) 401,348 301,351 7,545 1,768
Less: restricted balance with the Central Bank of Nigeria (171,339) (109,590) - -
Cash and cash equivalents at end of the year 230,009 191,761 7,545 1,768
Notes to the consolidated and separate financial statements For the year ended 31 December 2017
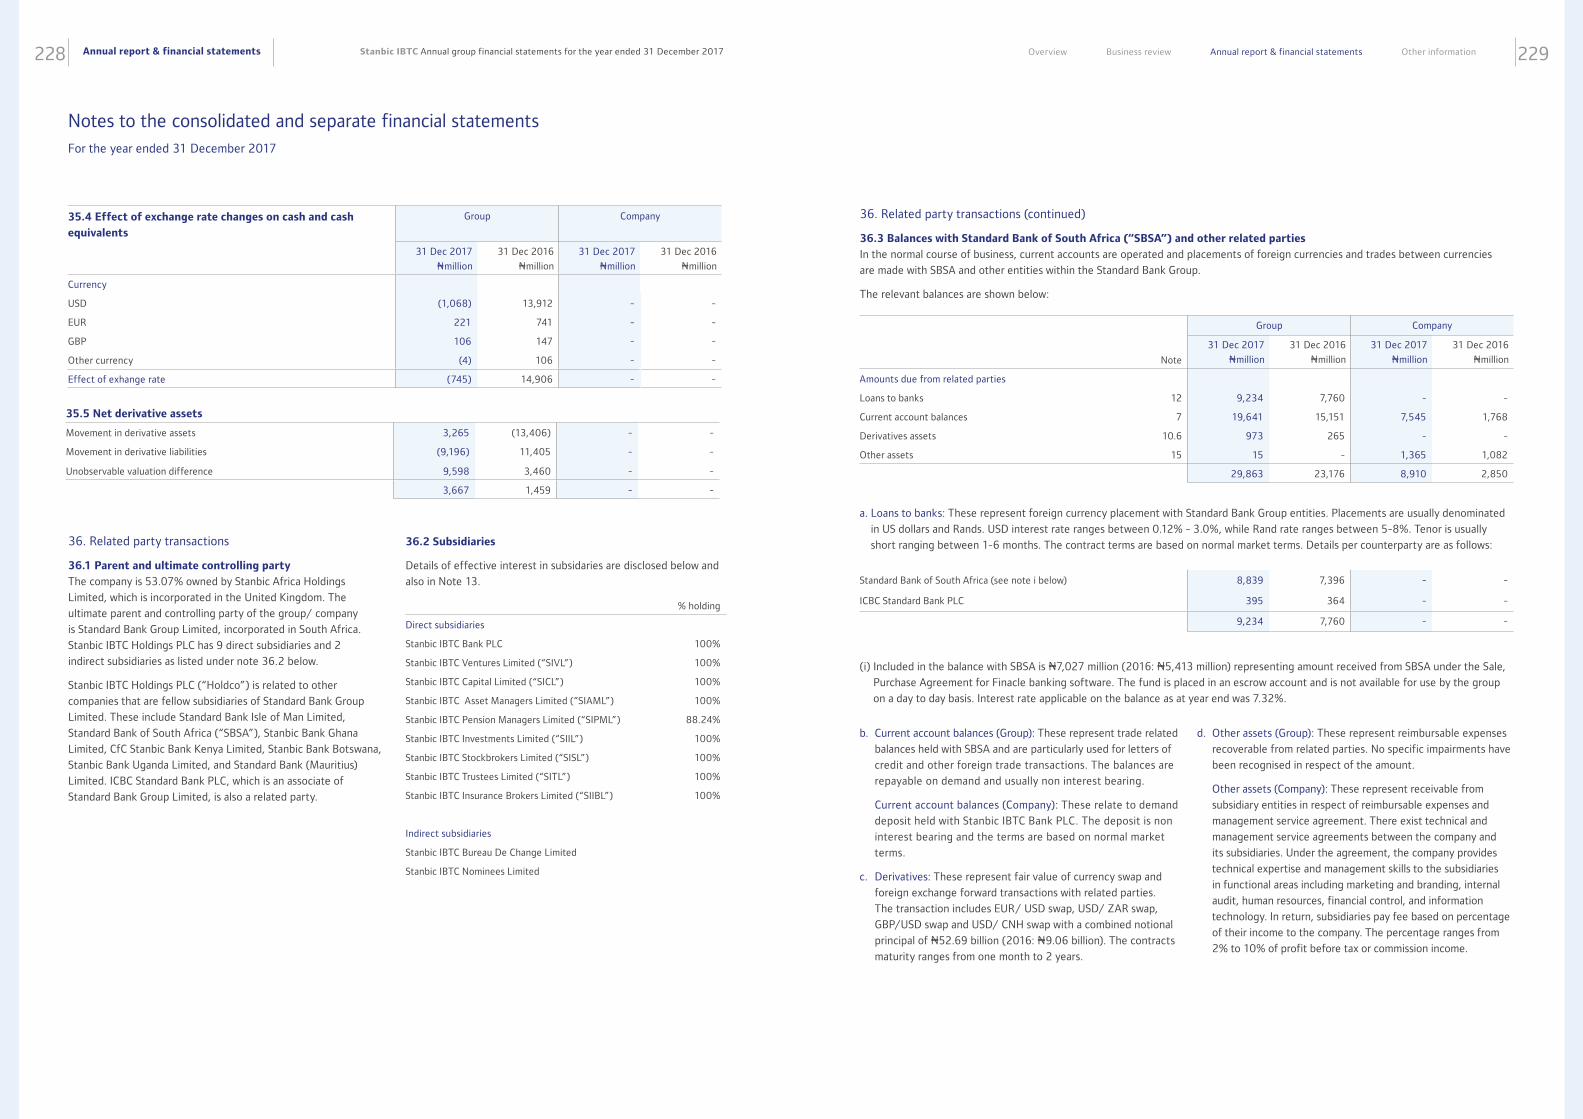
Annual report & financial statements228 229Stanbic IBTC Annual group financial statements for the year ended 31 December 2017 Overview Business review Annual report & financial statements Other information
35.5 Net derivative assets
Movement in derivative assets 3,265 (13,406) - -
Movement in derivative liabilities (9,196) 11,405 - -
Unobservable valuation difference 9,598 3,460 - -
3,667 1,459 - -
35.4 Effect of exchange rate changes on cash and cash
equivalents
Group Company
31 Dec 2017
Nmillion
31 Dec 2016
Nmillion
31 Dec 2017
Nmillion
31 Dec 2016
Nmillion
Currency
USD (1,068) 13,912 - -
EUR 221 741 - -
GBP 106 147 - -
Other currency (4) 106 - -
Effect of exhange rate (745) 14,906 - -
36. Related party transactions
36.1 Parent and ultimate controlling party
The company is 53.07% owned by Stanbic Africa Holdings
Limited, which is incorporated in the United Kingdom. The
ultimate parent and controlling party of the group/ company
is Standard Bank Group Limited, incorporated in South Africa.
Stanbic IBTC Holdings PLC has 9 direct subsidiaries and 2
indirect subsidiaries as listed under note 36.2 below.
Stanbic IBTC Holdings PLC (“Holdco”) is related to other
companies that are fellow subsidiaries of Standard Bank Group
Limited. These include Standard Bank Isle of Man Limited,
Standard Bank of South Africa (“SBSA”), Stanbic Bank Ghana
Limited, CfC Stanbic Bank Kenya Limited, Stanbic Bank Botswana,
Stanbic Bank Uganda Limited, and Standard Bank (Mauritius)
Limited. ICBC Standard Bank PLC, which is an associate of
Standard Bank Group Limited, is also a related party.
% holding
Direct subsidiaries
Stanbic IBTC Bank PLC 100%
Stanbic IBTC Ventures Limited (“SIVL”) 100%
Stanbic IBTC Capital Limited (“SICL”) 100%
Stanbic IBTC Asset Managers Limited (“SIAML”) 100%
Stanbic IBTC Pension Managers Limited (“SIPML”) 88.24%
Stanbic IBTC Investments Limited (“SIIL”) 100%
Stanbic IBTC Stockbrokers Limited (“SISL”) 100%
Stanbic IBTC Trustees Limited (“SITL”) 100%
Stanbic IBTC Insurance Brokers Limited (“SIIBL”) 100%
Indirect subsidiaries
Stanbic IBTC Bureau De Change Limited
Stanbic IBTC Nominees Limited
36.2 Subsidiaries
Details of effective interest in subsidaries are disclosed below and
also in Note 13.
36. Related party transactions (continued)
36.3 Balances with Standard Bank of South Africa (“SBSA”) and other related parties
In the normal course of business, current accounts are operated and placements of foreign currencies and trades between currencies
are made with SBSA and other entities within the Standard Bank Group.
The relevant balances are shown below:
Group Company
Note
31 Dec 2017
Nmillion
31 Dec 2016
Nmillion
31 Dec 2017
Nmillion
31 Dec 2016
Nmillion
Amounts due from related parties
Loans to banks 12 9,234 7,760 - -
Current account balances 7 19,641 15,151 7,545 1,768
Derivatives assets 10.6 973 265 - -
Other assets 15 15 - 1,365 1,082
29,863 23,176 8,910 2,850
a. Loans to banks: These represent foreign currency placement with Standard Bank Group entities. Placements are usually denominated
in US dollars and Rands. USD interest rate ranges between 0.12% - 3.0%, while Rand rate ranges between 5-8%. Tenor is usually
short ranging between 1-6 months. The contract terms are based on normal market terms. Details per counterparty are as follows:
Standard Bank of South Africa (see note i below) 8,839 7,396 - -
ICBC Standard Bank PLC 395 364 - -
9,234 7,760 - -
(i) Included in the balance with SBSA is N7,027 million (2016: N5,413 million) representing amount received from SBSA under the Sale,
Purchase Agreement for Finacle banking software. The fund is placed in an escrow account and is not available for use by the group
on a day to day basis. Interest rate applicable on the balance as at year end was 7.32%.
b. Current account balances (Group): These represent trade related
balances held with SBSA and are particularly used for letters of
credit and other foreign trade transactions. The balances are
repayable on demand and usually non interest bearing.
Current account balances (Company): These relate to demand
deposit held with Stanbic IBTC Bank PLC. The deposit is non
interest bearing and the terms are based on normal market
terms.
c. Derivatives: These represent fair value of currency swap and
foreign exchange forward transactions with related parties.
The transaction includes EUR/ USD swap, USD/ ZAR swap,
GBP/USD swap and USD/ CNH swap with a combined notional
principal of N52.69 billion (2016: N9.06 billion). The contracts
maturity ranges from one month to 2 years.
d. Other assets (Group): These represent reimbursable expenses
recoverable from related parties. No specific impairments have
been recognised in respect of the amount.
Other assets (Company): These represent receivable from
subsidiary entities in respect of reimbursable expenses and
management service agreement. There exist technical and
management service agreements between the company and
its subsidiaries. Under the agreement, the company provides
technical expertise and management skills to the subsidiaries
in functional areas including marketing and branding, internal
audit, human resources, financial control, and information
technology. In return, subsidiaries pay fee based on percentage
of their income to the company. The percentage ranges from
2% to 10% of profit before tax or commission income.
Notes to the consolidated and separate financial statements For the year ended 31 December 2017
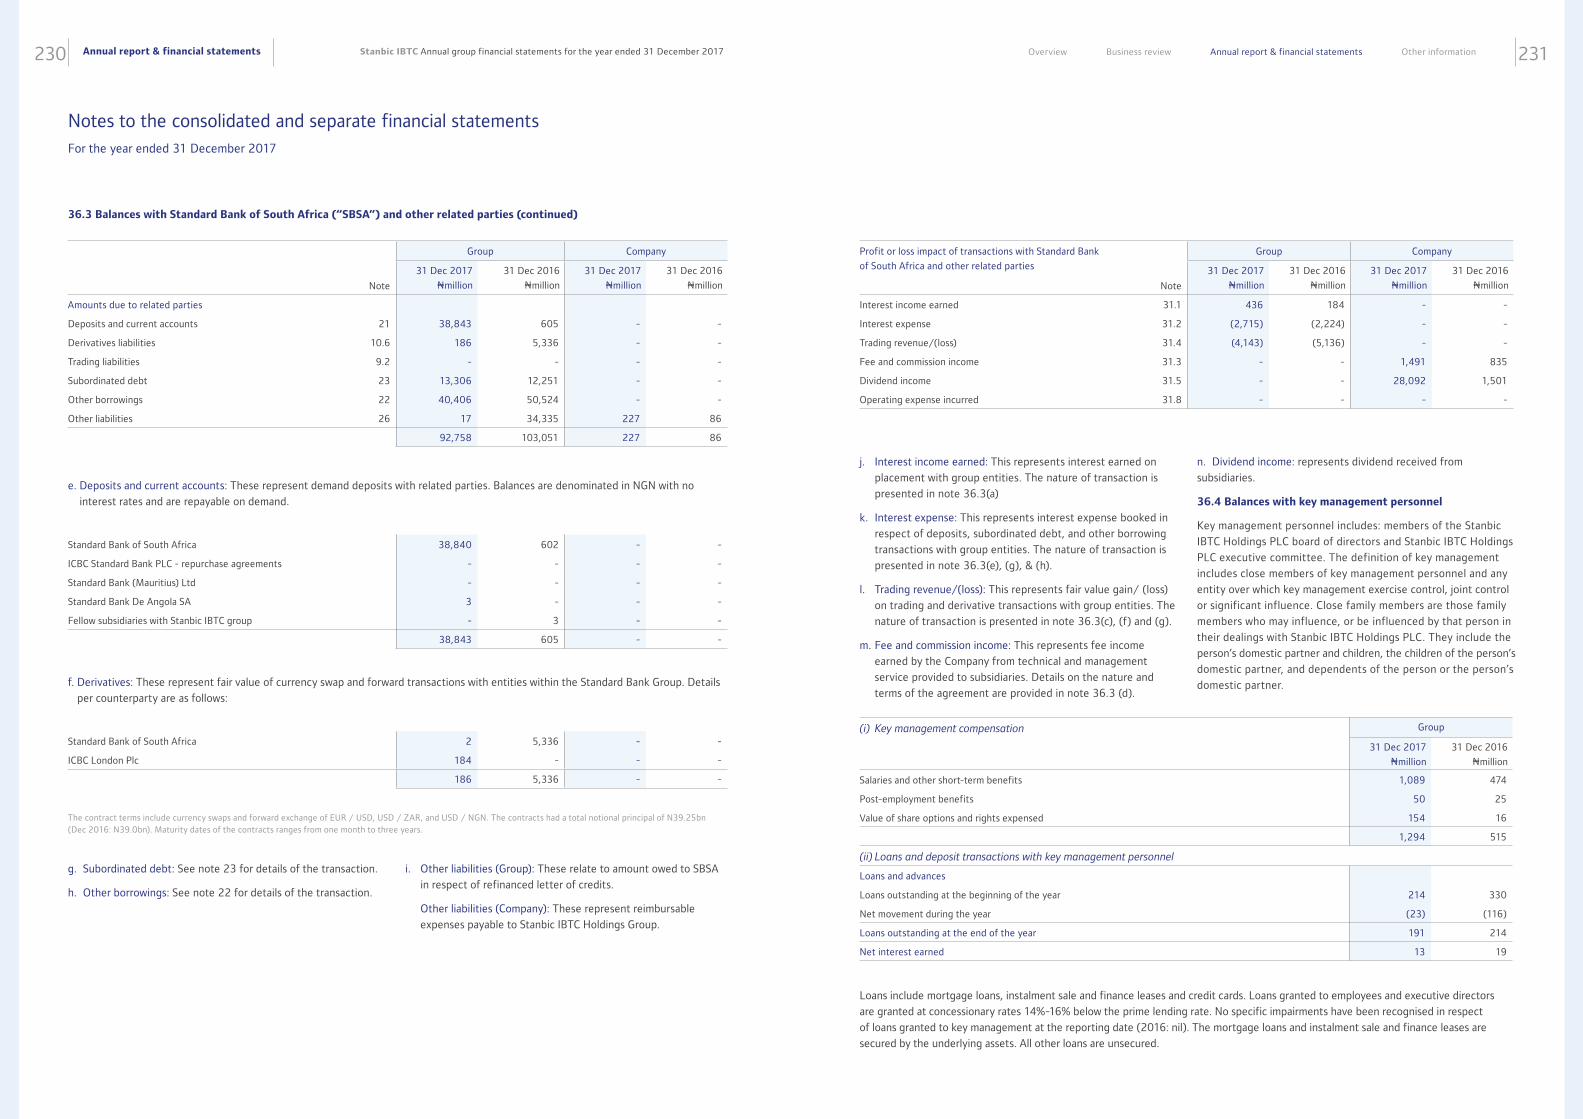
Annual report & financial statements230 231Stanbic IBTC Annual group financial statements for the year ended 31 December 2017 Overview Business review Annual report & financial statements Other information
Group Company
Note
31 Dec 2017
Nmillion
31 Dec 2016
Nmillion
31 Dec 2017
Nmillion
31 Dec 2016
Nmillion
Amounts due to related parties
Deposits and current accounts 21 38,843 605 - -
Derivatives liabilities 10.6 186 5,336 - -
Trading liabilities 9.2 - - - -
Subordinated debt 23 13,306 12,251 - -
Other borrowings 22 40,406 50,524 - -
Other liabilities 26 17 34,335 227 86
92,758 103,051 227 86
e. Deposits and current accounts: These represent demand deposits with related parties. Balances are denominated in NGN with no
interest rates and are repayable on demand.
Standard Bank of South Africa 38,840 602 - -
ICBC Standard Bank PLC - repurchase agreements - - - -
Standard Bank (Mauritius) Ltd - - - -
Standard Bank De Angola SA 3 - - -
Fellow subsidiaries with Stanbic IBTC group - 3 - -
38,843 605 - -
f. Derivatives: These represent fair value of currency swap and forward transactions with entities within the Standard Bank Group. Details
per counterparty are as follows:
Standard Bank of South Africa 2 5,336 - -
ICBC London Plc 184 - - -
186 5,336 - -
The contract terms include currency swaps and forward exchange of EUR / USD, USD / ZAR, and USD / NGN. The contracts had a total notional principal of N39.25bn (Dec 2016: N39.0bn). Maturity dates of the contracts ranges from one month to three years.
g. Subordinated debt: See note 23 for details of the transaction.
h. Other borrowings: See note 22 for details of the transaction.
i. Other liabilities (Group): These relate to amount owed to SBSA
in respect of refinanced letter of credits.
Other liabilities (Company): These represent reimbursable
expenses payable to Stanbic IBTC Holdings Group.
36.3 Balances with Standard Bank of South Africa (“SBSA”) and other related parties (continued)
Profit or loss impact of transactions with Standard Bank
of South Africa and other related parties
Group Company
Note
31 Dec 2017
Nmillion
31 Dec 2016
Nmillion
31 Dec 2017
Nmillion
31 Dec 2016
Nmillion
Interest income earned 31.1 436 184 - -
Interest expense 31.2 (2,715) (2,224) - -
Trading revenue/(loss) 31.4 (4,143) (5,136) - -
Fee and commission income 31.3 - - 1,491 835
Dividend income 31.5 - - 28,092 1,501
Operating expense incurred 31.8 - - - -
j. Interest income earned: This represents interest earned on
placement with group entities. The nature of transaction is
presented in note 36.3(a)
k. Interest expense: This represents interest expense booked in
respect of deposits, subordinated debt, and other borrowing
transactions with group entities. The nature of transaction is
presented in note 36.3(e), (g), & (h).
l. Trading revenue/(loss): This represents fair value gain/ (loss)
on trading and derivative transactions with group entities. The
nature of transaction is presented in note 36.3(c), (f) and (g).
m. Fee and commission income: This represents fee income
earned by the Company from technical and management
service provided to subsidiaries. Details on the nature and
terms of the agreement are provided in note 36.3 (d).
n. Dividend income: represents dividend received from
subsidiaries.
36.4 Balances with key management personnel
Key management personnel includes: members of the Stanbic
IBTC Holdings PLC board of directors and Stanbic IBTC Holdings
PLC executive committee. The definition of key management
includes close members of key management personnel and any
entity over which key management exercise control, joint control
or significant influence. Close family members are those family
members who may influence, or be influenced by that person in
their dealings with Stanbic IBTC Holdings PLC. They include the
person’s domestic partner and children, the children of the person’s
domestic partner, and dependents of the person or the person’s
domestic partner.
(i) Key management compensation Group
31 Dec 2017
Nmillion
31 Dec 2016
Nmillion
Salaries and other short-term benefits 1,089 474
Post-employment benefits 50 25
Value of share options and rights expensed 154 16
1,294 515
(ii) Loans and deposit transactions with key management personnel
Loans and advances
Loans outstanding at the beginning of the year 214 330
Net movement during the year (23) (116)
Loans outstanding at the end of the year 191 214
Net interest earned 13 19
Loans include mortgage loans, instalment sale and finance leases and credit cards. Loans granted to employees and executive directors
are granted at concessionary rates 14%-16% below the prime lending rate. No specific impairments have been recognised in respect
of loans granted to key management at the reporting date (2016: nil). The mortgage loans and instalment sale and finance leases are
secured by the underlying assets. All other loans are unsecured.
Notes to the consolidated and separate financial statements For the year ended 31 December 2017
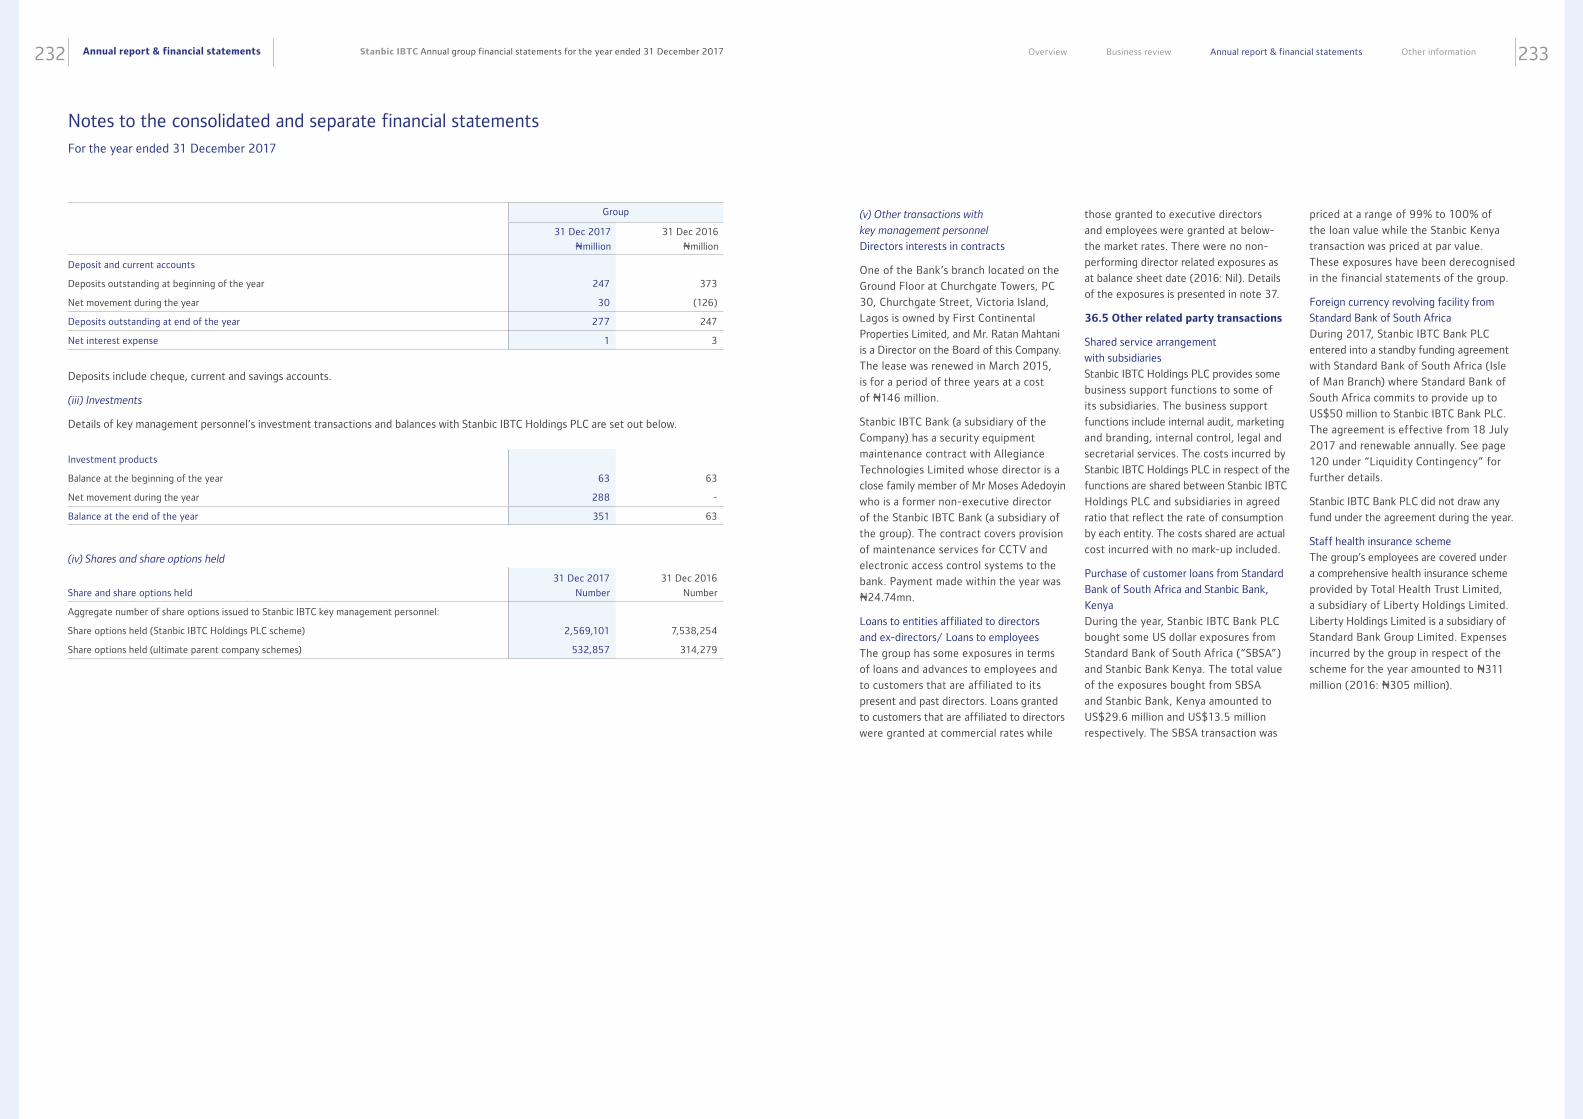
Annual report & financial statements232 233Stanbic IBTC Annual group financial statements for the year ended 31 December 2017 Overview Business review Annual report & financial statements Other information
Group
31 Dec 2017
Nmillion
31 Dec 2016
Nmillion
Deposit and current accounts
Deposits outstanding at beginning of the year 247 373
Net movement during the year 30 (126)
Deposits outstanding at end of the year 277 247
Net interest expense 1 3
Deposits include cheque, current and savings accounts.
(iii) Investments
Details of key management personnel’s investment transactions and balances with Stanbic IBTC Holdings PLC are set out below.
Investment products
Balance at the beginning of the year 63 63
Net movement during the year 288 -
Balance at the end of the year 351 63
(iv) Shares and share options held
Share and share options held
31 Dec 2017
Number
31 Dec 2016
Number
Aggregate number of share options issued to Stanbic IBTC key management personnel:
Share options held (Stanbic IBTC Holdings PLC scheme) 2,569,101 7,538,254
Share options held (ultimate parent company schemes) 532,857 314,279
(v) Other transactions with
key management personnel
Directors interests in contracts
One of the Bank’s branch located on the
Ground Floor at Churchgate Towers, PC
30, Churchgate Street, Victoria Island,
Lagos is owned by First Continental
Properties Limited, and Mr. Ratan Mahtani
is a Director on the Board of this Company.
The lease was renewed in March 2015,
is for a period of three years at a cost
of N146 million.
Stanbic IBTC Bank (a subsidiary of the
Company) has a security equipment
maintenance contract with Allegiance
Technologies Limited whose director is a
close family member of Mr Moses Adedoyin
who is a former non-executive director
of the Stanbic IBTC Bank (a subsidiary of
the group). The contract covers provision
of maintenance services for CCTV and
electronic access control systems to the
bank. Payment made within the year was
N24.74mn.
Loans to entities affiliated to directors
and ex-directors/ Loans to employees
The group has some exposures in terms
of loans and advances to employees and
to customers that are affiliated to its
present and past directors. Loans granted
to customers that are affiliated to directors
were granted at commercial rates while
those granted to executive directors
and employees were granted at below-
the market rates. There were no non-
performing director related exposures as
at balance sheet date (2016: Nil). Details
of the exposures is presented in note 37.
36.5 Other related party transactions
Shared service arrangement
with subsidiaries
Stanbic IBTC Holdings PLC provides some
business support functions to some of
its subsidiaries. The business support
functions include internal audit, marketing
and branding, internal control, legal and
secretarial services. The costs incurred by
Stanbic IBTC Holdings PLC in respect of the
functions are shared between Stanbic IBTC
Holdings PLC and subsidiaries in agreed
ratio that reflect the rate of consumption
by each entity. The costs shared are actual
cost incurred with no mark-up included.
Purchase of customer loans from Standard
Bank of South Africa and Stanbic Bank,
Kenya
During the year, Stanbic IBTC Bank PLC
bought some US dollar exposures from
Standard Bank of South Africa (“SBSA”)
and Stanbic Bank Kenya. The total value
of the exposures bought from SBSA
and Stanbic Bank, Kenya amounted to
US$29.6 million and US$13.5 million
respectively. The SBSA transaction was
priced at a range of 99% to 100% of
the loan value while the Stanbic Kenya
transaction was priced at par value.
These exposures have been derecognised
in the financial statements of the group.
Foreign currency revolving facility from
Standard Bank of South Africa
During 2017, Stanbic IBTC Bank PLC
entered into a standby funding agreement
with Standard Bank of South Africa (Isle
of Man Branch) where Standard Bank of
South Africa commits to provide up to
US$50 million to Stanbic IBTC Bank PLC.
The agreement is effective from 18 July
2017 and renewable annually. See page
120 under “Liquidity Contingency” for
further details.
Stanbic IBTC Bank PLC did not draw any
fund under the agreement during the year.
Staff health insurance scheme
The group’s employees are covered under
a comprehensive health insurance scheme
provided by Total Health Trust Limited,
a subsidiary of Liberty Holdings Limited.
Liberty Holdings Limited is a subsidiary of
Standard Bank Group Limited. Expenses
incurred by the group in respect of the
scheme for the year amounted to N311
million (2016: N305 million).
Notes to the consolidated and separate financial statements For the year ended 31 December 2017
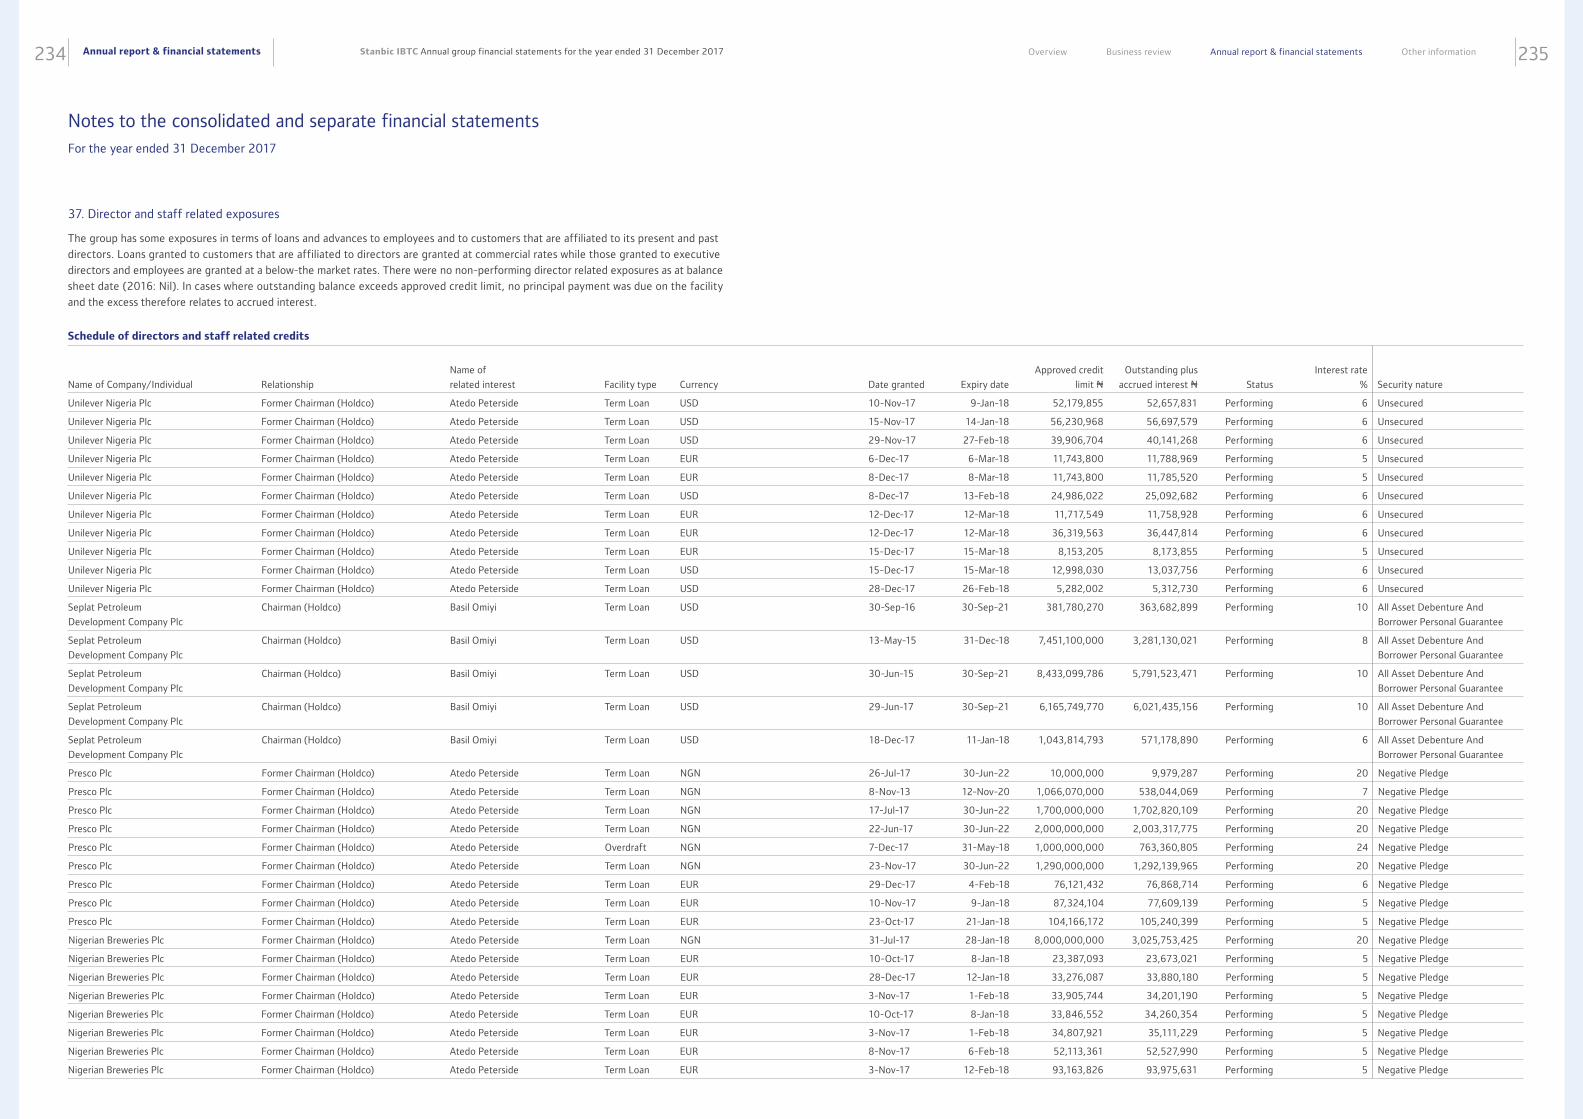
Annual report & financial statements234 235Stanbic IBTC Annual group financial statements for the year ended 31 December 2017 Overview Business review Annual report & financial statements Other information
37. Director and staff related exposures
The group has some exposures in terms of loans and advances to employees and to customers that are affiliated to its present and past
directors. Loans granted to customers that are affiliated to directors are granted at commercial rates while those granted to executive
directors and employees are granted at a below-the market rates. There were no non-performing director related exposures as at balance
sheet date (2016: Nil). In cases where outstanding balance exceeds approved credit limit, no principal payment was due on the facility
and the excess therefore relates to accrued interest.
Schedule of directors and staff related credits
Name of Company/Individual
Relationship
Name of
related interest
Facility type
Currency
Date granted
Expiry date
Approved credit
limit N
Outstanding plus
accrued interest N
Status
Interest rate
%
Security nature
Unilever Nigeria Plc Former Chairman (Holdco) Atedo Peterside Term Loan USD 10-Nov-17 9-Jan-18 52,179,855 52,657,831 Performing 6 Unsecured
Unilever Nigeria Plc Former Chairman (Holdco) Atedo Peterside Term Loan USD 15-Nov-17 14-Jan-18 56,230,968 56,697,579 Performing 6 Unsecured
Unilever Nigeria Plc Former Chairman (Holdco) Atedo Peterside Term Loan USD 29-Nov-17 27-Feb-18 39,906,704 40,141,268 Performing 6 Unsecured
Unilever Nigeria Plc Former Chairman (Holdco) Atedo Peterside Term Loan EUR 6-Dec-17 6-Mar-18 11,743,800 11,788,969 Performing 5 Unsecured
Unilever Nigeria Plc Former Chairman (Holdco) Atedo Peterside Term Loan EUR 8-Dec-17 8-Mar-18 11,743,800 11,785,520 Performing 5 Unsecured
Unilever Nigeria Plc Former Chairman (Holdco) Atedo Peterside Term Loan USD 8-Dec-17 13-Feb-18 24,986,022 25,092,682 Performing 6 Unsecured
Unilever Nigeria Plc Former Chairman (Holdco) Atedo Peterside Term Loan EUR 12-Dec-17 12-Mar-18 11,717,549 11,758,928 Performing 6 Unsecured
Unilever Nigeria Plc Former Chairman (Holdco) Atedo Peterside Term Loan EUR 12-Dec-17 12-Mar-18 36,319,563 36,447,814 Performing 6 Unsecured
Unilever Nigeria Plc Former Chairman (Holdco) Atedo Peterside Term Loan EUR 15-Dec-17 15-Mar-18 8,153,205 8,173,855 Performing 5 Unsecured
Unilever Nigeria Plc Former Chairman (Holdco) Atedo Peterside Term Loan USD 15-Dec-17 15-Mar-18 12,998,030 13,037,756 Performing 6 Unsecured
Unilever Nigeria Plc Former Chairman (Holdco) Atedo Peterside Term Loan USD 28-Dec-17 26-Feb-18 5,282,002 5,312,730 Performing 6 Unsecured
Seplat Petroleum
Development Company Plc
Chairman (Holdco) Basil Omiyi Term Loan USD 30-Sep-16 30-Sep-21 381,780,270 363,682,899 Performing 10 All Asset Debenture And
Borrower Personal Guarantee
Seplat Petroleum
Development Company Plc
Chairman (Holdco) Basil Omiyi Term Loan USD 13-May-15 31-Dec-18 7,451,100,000 3,281,130,021 Performing 8 All Asset Debenture And
Borrower Personal Guarantee
Seplat Petroleum
Development Company Plc
Chairman (Holdco) Basil Omiyi Term Loan USD 30-Jun-15 30-Sep-21 8,433,099,786 5,791,523,471 Performing 10 All Asset Debenture And
Borrower Personal Guarantee
Seplat Petroleum
Development Company Plc
Chairman (Holdco) Basil Omiyi Term Loan USD 29-Jun-17 30-Sep-21 6,165,749,770 6,021,435,156 Performing 10 All Asset Debenture And
Borrower Personal Guarantee
Seplat Petroleum
Development Company Plc
Chairman (Holdco) Basil Omiyi Term Loan USD 18-Dec-17 11-Jan-18 1,043,814,793 571,178,890 Performing 6 All Asset Debenture And
Borrower Personal Guarantee
Presco Plc Former Chairman (Holdco) Atedo Peterside Term Loan NGN 26-Jul-17 30-Jun-22 10,000,000 9,979,287 Performing 20 Negative Pledge
Presco Plc Former Chairman (Holdco) Atedo Peterside Term Loan NGN 8-Nov-13 12-Nov-20 1,066,070,000 538,044,069 Performing 7 Negative Pledge
Presco Plc Former Chairman (Holdco) Atedo Peterside Term Loan NGN 17-Jul-17 30-Jun-22 1,700,000,000 1,702,820,109 Performing 20 Negative Pledge
Presco Plc Former Chairman (Holdco) Atedo Peterside Term Loan NGN 22-Jun-17 30-Jun-22 2,000,000,000 2,003,317,775 Performing 20 Negative Pledge
Presco Plc Former Chairman (Holdco) Atedo Peterside Overdraft NGN 7-Dec-17 31-May-18 1,000,000,000 763,360,805 Performing 24 Negative Pledge
Presco Plc Former Chairman (Holdco) Atedo Peterside Term Loan NGN 23-Nov-17 30-Jun-22 1,290,000,000 1,292,139,965 Performing 20 Negative Pledge
Presco Plc Former Chairman (Holdco) Atedo Peterside Term Loan EUR 29-Dec-17 4-Feb-18 76,121,432 76,868,714 Performing 6 Negative Pledge
Presco Plc Former Chairman (Holdco) Atedo Peterside Term Loan EUR 10-Nov-17 9-Jan-18 87,324,104 77,609,139 Performing 5 Negative Pledge
Presco Plc Former Chairman (Holdco) Atedo Peterside Term Loan EUR 23-Oct-17 21-Jan-18 104,166,172 105,240,399 Performing 5 Negative Pledge
Nigerian Breweries Plc Former Chairman (Holdco) Atedo Peterside Term Loan NGN 31-Jul-17 28-Jan-18 8,000,000,000 3,025,753,425 Performing 20 Negative Pledge
Nigerian Breweries Plc Former Chairman (Holdco) Atedo Peterside Term Loan EUR 10-Oct-17 8-Jan-18 23,387,093 23,673,021 Performing 5 Negative Pledge
Nigerian Breweries Plc Former Chairman (Holdco) Atedo Peterside Term Loan EUR 28-Dec-17 12-Jan-18 33,276,087 33,880,180 Performing 5 Negative Pledge
Nigerian Breweries Plc Former Chairman (Holdco) Atedo Peterside Term Loan EUR 3-Nov-17 1-Feb-18 33,905,744 34,201,190 Performing 5 Negative Pledge
Nigerian Breweries Plc Former Chairman (Holdco) Atedo Peterside Term Loan EUR 10-Oct-17 8-Jan-18 33,846,552 34,260,354 Performing 5 Negative Pledge
Nigerian Breweries Plc Former Chairman (Holdco) Atedo Peterside Term Loan EUR 3-Nov-17 1-Feb-18 34,807,921 35,111,229 Performing 5 Negative Pledge
Nigerian Breweries Plc Former Chairman (Holdco) Atedo Peterside Term Loan EUR 8-Nov-17 6-Feb-18 52,113,361 52,527,990 Performing 5 Negative Pledge
Nigerian Breweries Plc Former Chairman (Holdco) Atedo Peterside Term Loan EUR 3-Nov-17 12-Feb-18 93,163,826 93,975,631 Performing 5 Negative Pledge
Notes to the consolidated and separate financial statements For the year ended 31 December 2017
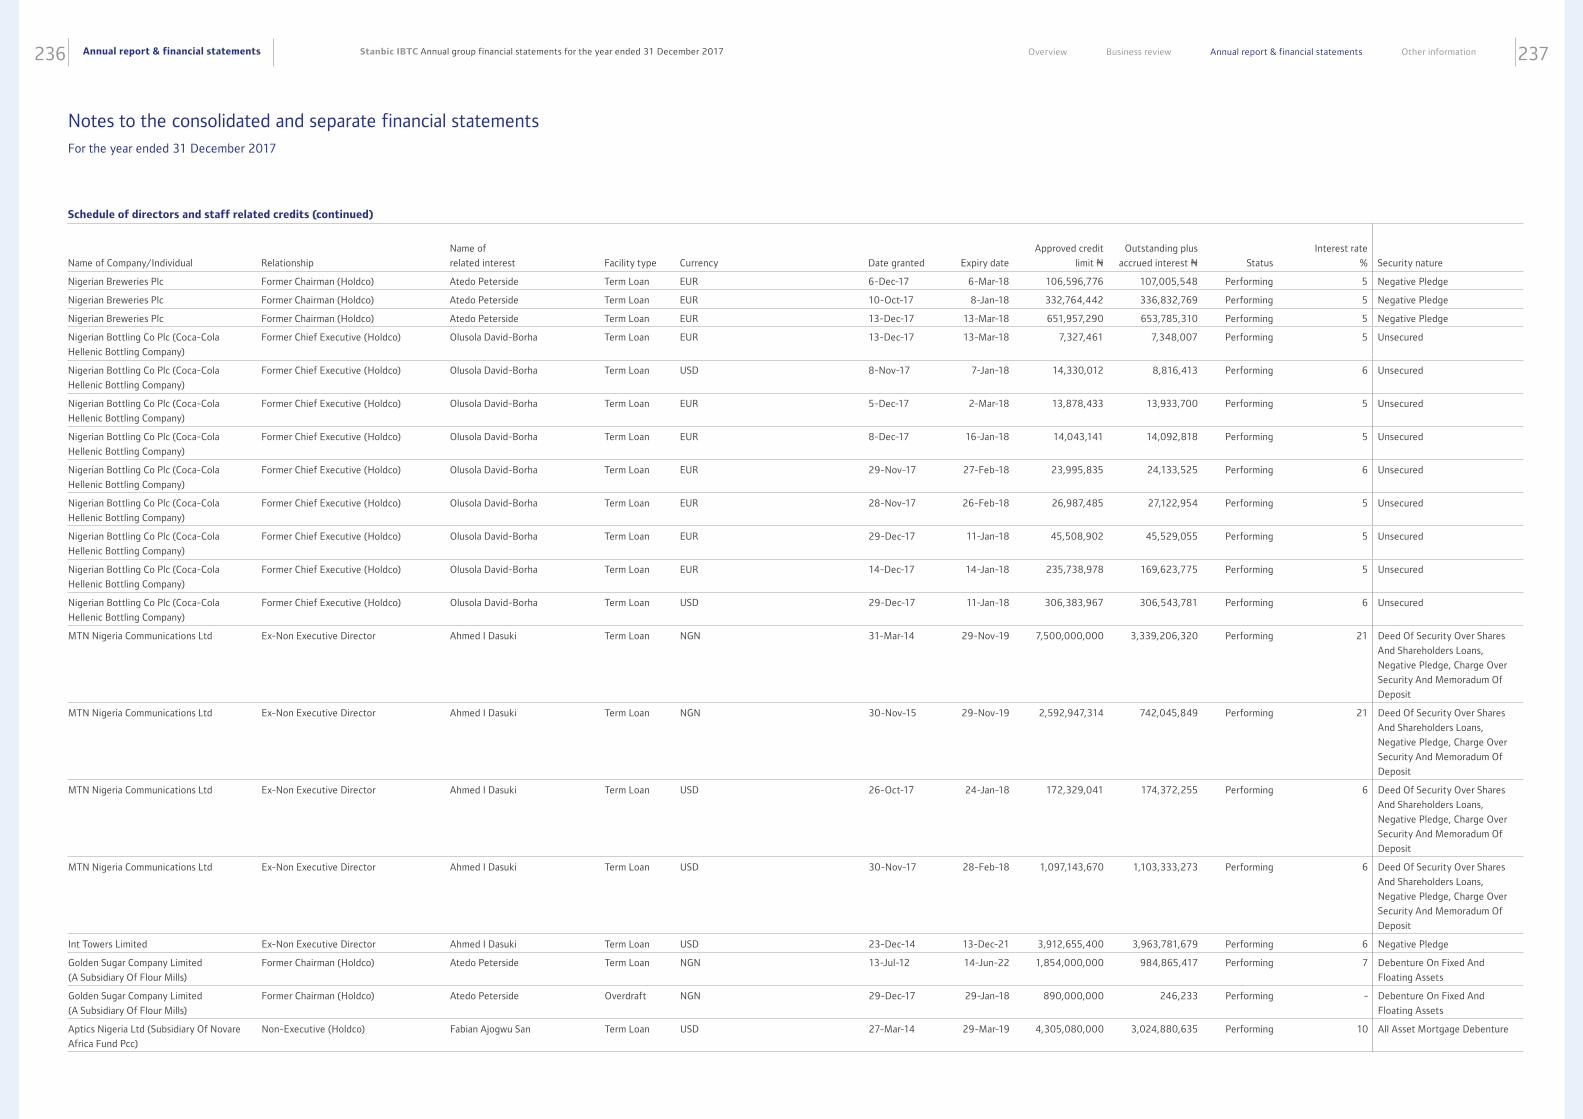
Annual report & financial statements236 237Stanbic IBTC Annual group financial statements for the year ended 31 December 2017 Overview Business review Annual report & financial statements Other information
Schedule of directors and staff related credits (continued)
Name of Company/Individual
Relationship
Name of
related interest
Facility type
Currency
Date granted
Expiry date
Approved credit
limit N
Outstanding plus
accrued interest N
Status
Interest rate
%
Security nature
Nigerian Breweries Plc Former Chairman (Holdco) Atedo Peterside Term Loan EUR 6-Dec-17 6-Mar-18 106,596,776 107,005,548 Performing 5 Negative Pledge
Nigerian Breweries Plc Former Chairman (Holdco) Atedo Peterside Term Loan EUR 10-Oct-17 8-Jan-18 332,764,442 336,832,769 Performing 5 Negative Pledge
Nigerian Breweries Plc Former Chairman (Holdco) Atedo Peterside Term Loan EUR 13-Dec-17 13-Mar-18 651,957,290 653,785,310 Performing 5 Negative Pledge
Nigerian Bottling Co Plc (Coca-Cola
Hellenic Bottling Company)
Former Chief Executive (Holdco) Olusola David-Borha Term Loan EUR 13-Dec-17 13-Mar-18 7,327,461 7,348,007 Performing 5 Unsecured
Nigerian Bottling Co Plc (Coca-Cola
Hellenic Bottling Company)
Former Chief Executive (Holdco) Olusola David-Borha Term Loan USD 8-Nov-17 7-Jan-18 14,330,012 8,816,413 Performing 6 Unsecured
Nigerian Bottling Co Plc (Coca-Cola
Hellenic Bottling Company)
Former Chief Executive (Holdco) Olusola David-Borha Term Loan EUR 5-Dec-17 2-Mar-18 13,878,433 13,933,700 Performing 5 Unsecured
Nigerian Bottling Co Plc (Coca-Cola
Hellenic Bottling Company)
Former Chief Executive (Holdco) Olusola David-Borha Term Loan EUR 8-Dec-17 16-Jan-18 14,043,141 14,092,818 Performing 5 Unsecured
Nigerian Bottling Co Plc (Coca-Cola
Hellenic Bottling Company)
Former Chief Executive (Holdco) Olusola David-Borha Term Loan EUR 29-Nov-17 27-Feb-18 23,995,835 24,133,525 Performing 6 Unsecured
Nigerian Bottling Co Plc (Coca-Cola
Hellenic Bottling Company)
Former Chief Executive (Holdco) Olusola David-Borha Term Loan EUR 28-Nov-17 26-Feb-18 26,987,485 27,122,954 Performing 5 Unsecured
Nigerian Bottling Co Plc (Coca-Cola
Hellenic Bottling Company)
Former Chief Executive (Holdco) Olusola David-Borha Term Loan EUR 29-Dec-17 11-Jan-18 45,508,902 45,529,055 Performing 5 Unsecured
Nigerian Bottling Co Plc (Coca-Cola
Hellenic Bottling Company)
Former Chief Executive (Holdco) Olusola David-Borha Term Loan EUR 14-Dec-17 14-Jan-18 235,738,978 169,623,775 Performing 5 Unsecured
Nigerian Bottling Co Plc (Coca-Cola
Hellenic Bottling Company)
Former Chief Executive (Holdco) Olusola David-Borha Term Loan USD 29-Dec-17 11-Jan-18 306,383,967 306,543,781 Performing 6 Unsecured
MTN Nigeria Communications Ltd Ex-Non Executive Director Ahmed I Dasuki Term Loan NGN 31-Mar-14 29-Nov-19 7,500,000,000 3,339,206,320 Performing 21 Deed Of Security Over Shares
And Shareholders Loans,
Negative Pledge, Charge Over
Security And Memoradum Of
Deposit
MTN Nigeria Communications Ltd Ex-Non Executive Director Ahmed I Dasuki Term Loan NGN 30-Nov-15 29-Nov-19 2,592,947,314 742,045,849 Performing 21 Deed Of Security Over Shares
And Shareholders Loans,
Negative Pledge, Charge Over
Security And Memoradum Of
Deposit
MTN Nigeria Communications Ltd Ex-Non Executive Director Ahmed I Dasuki Term Loan USD 26-Oct-17 24-Jan-18 172,329,041 174,372,255 Performing 6 Deed Of Security Over Shares
And Shareholders Loans,
Negative Pledge, Charge Over
Security And Memoradum Of
Deposit
MTN Nigeria Communications Ltd Ex-Non Executive Director Ahmed I Dasuki Term Loan USD 30-Nov-17 28-Feb-18 1,097,143,670 1,103,333,273 Performing 6 Deed Of Security Over Shares
And Shareholders Loans,
Negative Pledge, Charge Over
Security And Memoradum Of
Deposit
Int Towers Limited Ex-Non Executive Director Ahmed I Dasuki Term Loan USD 23-Dec-14 13-Dec-21 3,912,655,400 3,963,781,679 Performing 6 Negative Pledge
Golden Sugar Company Limited
(A Subsidiary Of Flour Mills)
Former Chairman (Holdco) Atedo Peterside Term Loan NGN 13-Jul-12 14-Jun-22 1,854,000,000 984,865,417 Performing 7 Debenture On Fixed And
Floating Assets
Golden Sugar Company Limited
(A Subsidiary Of Flour Mills)
Former Chairman (Holdco) Atedo Peterside Overdraft NGN 29-Dec-17 29-Jan-18 890,000,000 246,233 Performing - Debenture On Fixed And
Floating Assets
Aptics Nigeria Ltd (Subsidiary Of Novare
Africa Fund Pcc)
Non-Executive (Holdco) Fabian Ajogwu San Term Loan USD 27-Mar-14 29-Mar-19 4,305,080,000 3,024,880,635 Performing 10 All Asset Mortgage Debenture
Notes to the consolidated and separate financial statements For the year ended 31 December 2017
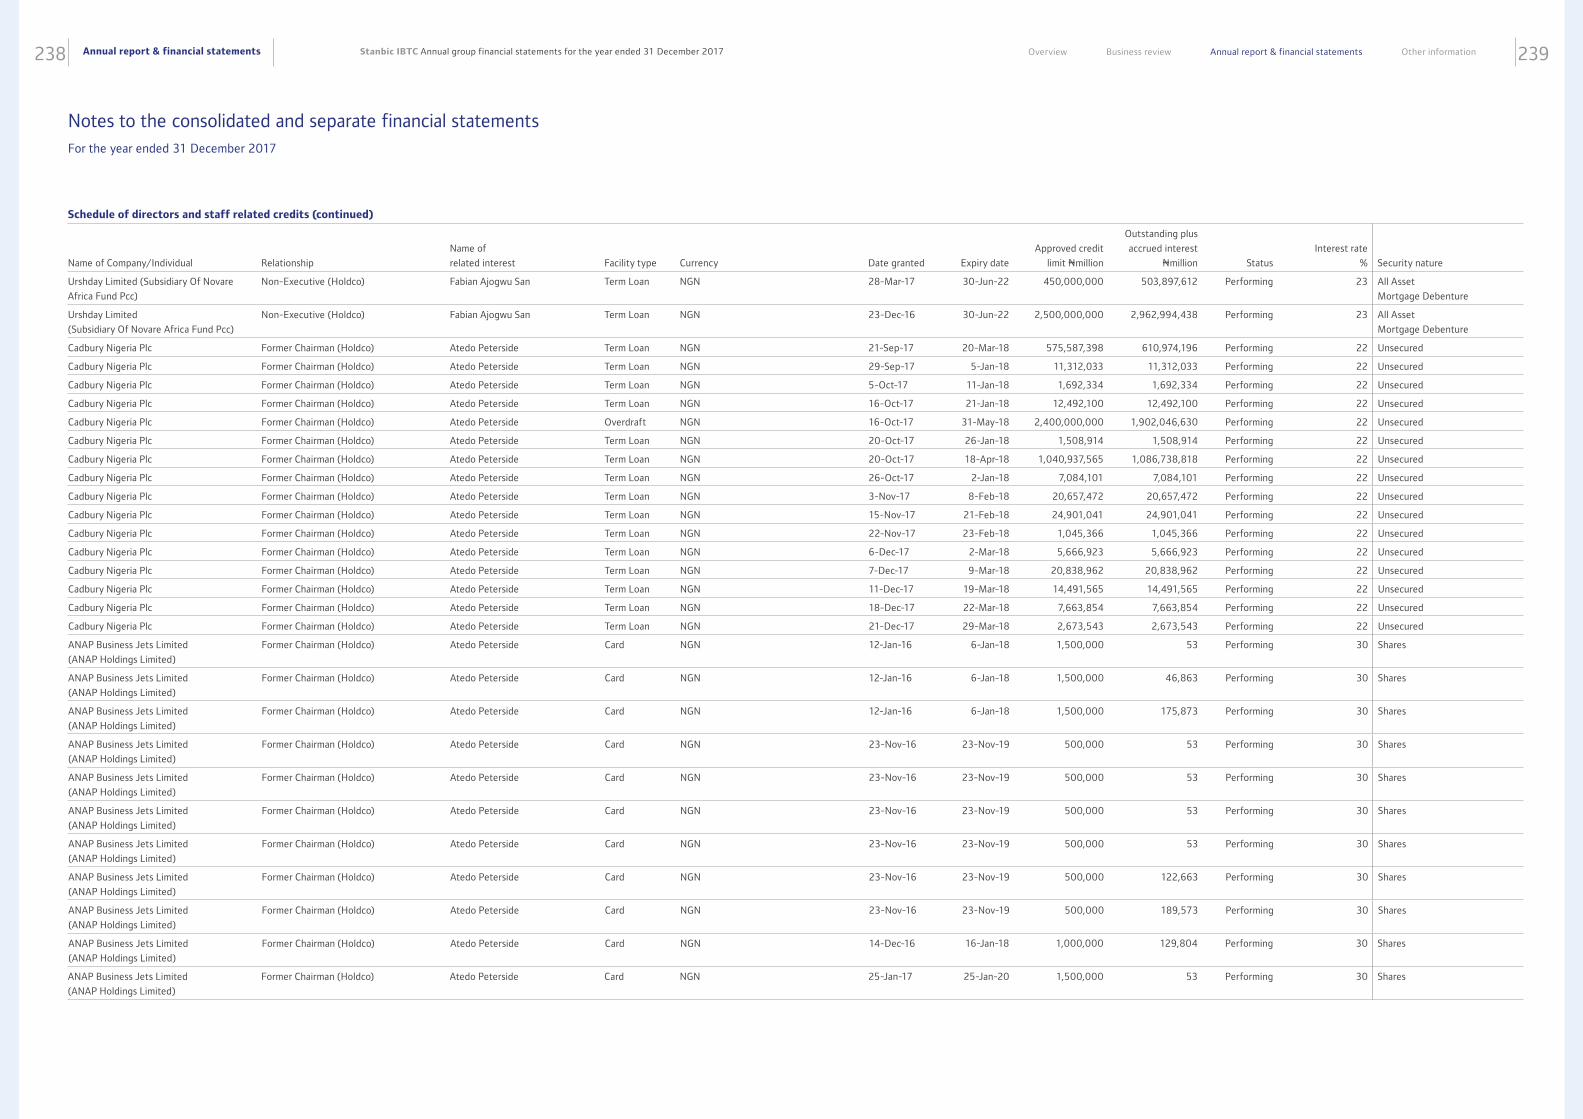
Annual report & financial statements238 239Stanbic IBTC Annual group financial statements for the year ended 31 December 2017 Overview Business review Annual report & financial statements Other information
Schedule of directors and staff related credits (continued)
Name of Company/Individual
Relationship
Name of
related interest
Facility type
Currency
Date granted
Expiry date
Approved credit
limit Nmillion
Outstanding plus
accrued interest
Nmillion
Status
Interest rate
%
Security nature
Urshday Limited (Subsidiary Of Novare
Africa Fund Pcc)
Non-Executive (Holdco) Fabian Ajogwu San Term Loan NGN 28-Mar-17 30-Jun-22 450,000,000 503,897,612 Performing 23 All Asset
Mortgage Debenture
Urshday Limited
(Subsidiary Of Novare Africa Fund Pcc)
Non-Executive (Holdco) Fabian Ajogwu San Term Loan NGN 23-Dec-16 30-Jun-22 2,500,000,000 2,962,994,438 Performing 23 All Asset
Mortgage Debenture
Cadbury Nigeria Plc Former Chairman (Holdco) Atedo Peterside Term Loan NGN 21-Sep-17 20-Mar-18 575,587,398 610,974,196 Performing 22 Unsecured
Cadbury Nigeria Plc Former Chairman (Holdco) Atedo Peterside Term Loan NGN 29-Sep-17 5-Jan-18 11,312,033 11,312,033 Performing 22 Unsecured
Cadbury Nigeria Plc Former Chairman (Holdco) Atedo Peterside Term Loan NGN 5-Oct-17 11-Jan-18 1,692,334 1,692,334 Performing 22 Unsecured
Cadbury Nigeria Plc Former Chairman (Holdco) Atedo Peterside Term Loan NGN 16-Oct-17 21-Jan-18 12,492,100 12,492,100 Performing 22 Unsecured
Cadbury Nigeria Plc Former Chairman (Holdco) Atedo Peterside Overdraft NGN 16-Oct-17 31-May-18 2,400,000,000 1,902,046,630 Performing 22 Unsecured
Cadbury Nigeria Plc Former Chairman (Holdco) Atedo Peterside Term Loan NGN 20-Oct-17 26-Jan-18 1,508,914 1,508,914 Performing 22 Unsecured
Cadbury Nigeria Plc Former Chairman (Holdco) Atedo Peterside Term Loan NGN 20-Oct-17 18-Apr-18 1,040,937,565 1,086,738,818 Performing 22 Unsecured
Cadbury Nigeria Plc Former Chairman (Holdco) Atedo Peterside Term Loan NGN 26-Oct-17 2-Jan-18 7,084,101 7,084,101 Performing 22 Unsecured
Cadbury Nigeria Plc Former Chairman (Holdco) Atedo Peterside Term Loan NGN 3-Nov-17 8-Feb-18 20,657,472 20,657,472 Performing 22 Unsecured
Cadbury Nigeria Plc Former Chairman (Holdco) Atedo Peterside Term Loan NGN 15-Nov-17 21-Feb-18 24,901,041 24,901,041 Performing 22 Unsecured
Cadbury Nigeria Plc Former Chairman (Holdco) Atedo Peterside Term Loan NGN 22-Nov-17 23-Feb-18 1,045,366 1,045,366 Performing 22 Unsecured
Cadbury Nigeria Plc Former Chairman (Holdco) Atedo Peterside Term Loan NGN 6-Dec-17 2-Mar-18 5,666,923 5,666,923 Performing 22 Unsecured
Cadbury Nigeria Plc Former Chairman (Holdco) Atedo Peterside Term Loan NGN 7-Dec-17 9-Mar-18 20,838,962 20,838,962 Performing 22 Unsecured
Cadbury Nigeria Plc Former Chairman (Holdco) Atedo Peterside Term Loan NGN 11-Dec-17 19-Mar-18 14,491,565 14,491,565 Performing 22 Unsecured
Cadbury Nigeria Plc Former Chairman (Holdco) Atedo Peterside Term Loan NGN 18-Dec-17 22-Mar-18 7,663,854 7,663,854 Performing 22 Unsecured
Cadbury Nigeria Plc Former Chairman (Holdco) Atedo Peterside Term Loan NGN 21-Dec-17 29-Mar-18 2,673,543 2,673,543 Performing 22 Unsecured
ANAP Business Jets Limited
(ANAP Holdings Limited)
Former Chairman (Holdco) Atedo Peterside Card NGN 12-Jan-16 6-Jan-18 1,500,000 53 Performing 30 Shares
ANAP Business Jets Limited
(ANAP Holdings Limited)
Former Chairman (Holdco) Atedo Peterside Card NGN 12-Jan-16 6-Jan-18 1,500,000 46,863 Performing 30 Shares
ANAP Business Jets Limited
(ANAP Holdings Limited)
Former Chairman (Holdco) Atedo Peterside Card NGN 12-Jan-16 6-Jan-18 1,500,000 175,873 Performing 30 Shares
ANAP Business Jets Limited
(ANAP Holdings Limited)
Former Chairman (Holdco) Atedo Peterside Card NGN 23-Nov-16 23-Nov-19 500,000 53 Performing 30 Shares
ANAP Business Jets Limited
(ANAP Holdings Limited)
Former Chairman (Holdco) Atedo Peterside Card NGN 23-Nov-16 23-Nov-19 500,000 53 Performing 30 Shares
ANAP Business Jets Limited
(ANAP Holdings Limited)
Former Chairman (Holdco) Atedo Peterside Card NGN 23-Nov-16 23-Nov-19 500,000 53 Performing 30 Shares
ANAP Business Jets Limited
(ANAP Holdings Limited)
Former Chairman (Holdco) Atedo Peterside Card NGN 23-Nov-16 23-Nov-19 500,000 53 Performing 30 Shares
ANAP Business Jets Limited
(ANAP Holdings Limited)
Former Chairman (Holdco) Atedo Peterside Card NGN 23-Nov-16 23-Nov-19 500,000 122,663 Performing 30 Shares
ANAP Business Jets Limited
(ANAP Holdings Limited)
Former Chairman (Holdco) Atedo Peterside Card NGN 23-Nov-16 23-Nov-19 500,000 189,573 Performing 30 Shares
ANAP Business Jets Limited
(ANAP Holdings Limited)
Former Chairman (Holdco) Atedo Peterside Card NGN 14-Dec-16 16-Jan-18 1,000,000 129,804 Performing 30 Shares
ANAP Business Jets Limited
(ANAP Holdings Limited)
Former Chairman (Holdco) Atedo Peterside Card NGN 25-Jan-17 25-Jan-20 1,500,000 53 Performing 30 Shares
Notes to the consolidated and separate financial statements For the year ended 31 December 2017
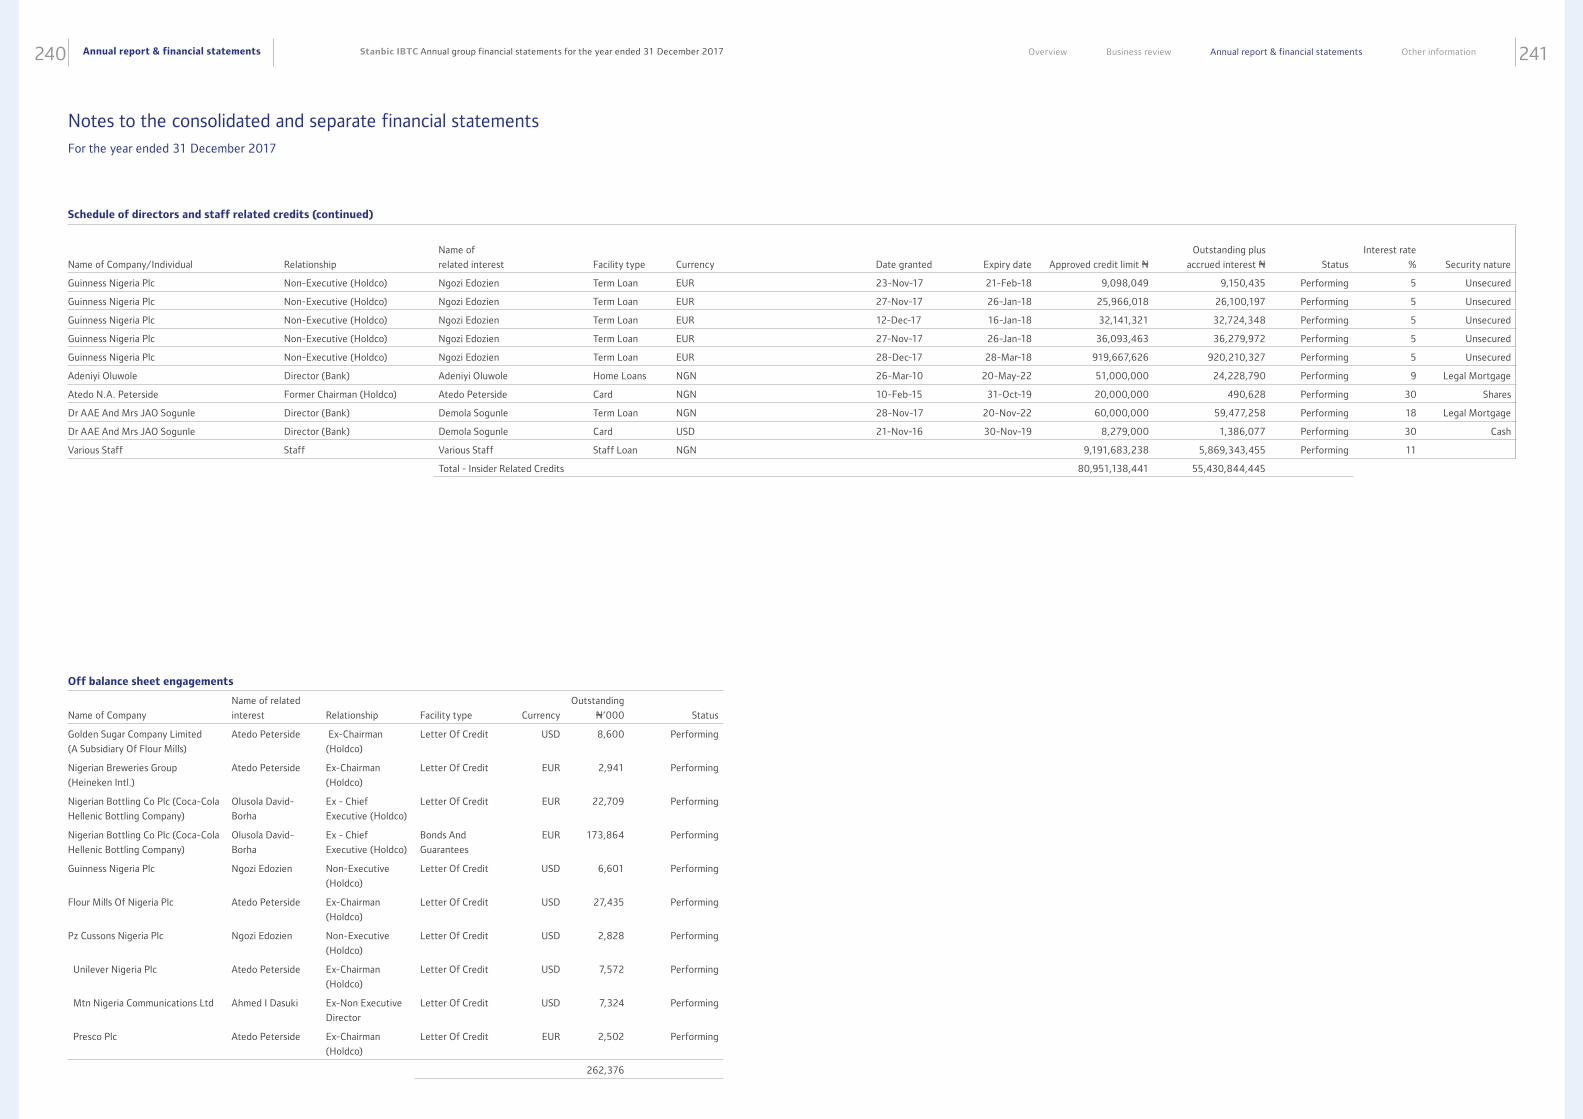
Annual report & financial statements240 241Stanbic IBTC Annual group financial statements for the year ended 31 December 2017 Overview Business review Annual report & financial statements Other information
Name of Company/Individual
Relationship
Name of
related interest
Facility type
Currency
Date granted
Expiry date
Approved credit limit N
Outstanding plus
accrued interest N
Status
Interest rate
%
Security nature
Guinness Nigeria Plc Non-Executive (Holdco) Ngozi Edozien Term Loan EUR 23-Nov-17 21-Feb-18 9,098,049 9,150,435 Performing 5 Unsecured
Guinness Nigeria Plc Non-Executive (Holdco) Ngozi Edozien Term Loan EUR 27-Nov-17 26-Jan-18 25,966,018 26,100,197 Performing 5 Unsecured
Guinness Nigeria Plc Non-Executive (Holdco) Ngozi Edozien Term Loan EUR 12-Dec-17 16-Jan-18 32,141,321 32,724,348 Performing 5 Unsecured
Guinness Nigeria Plc Non-Executive (Holdco) Ngozi Edozien Term Loan EUR 27-Nov-17 26-Jan-18 36,093,463 36,279,972 Performing 5 Unsecured
Guinness Nigeria Plc Non-Executive (Holdco) Ngozi Edozien Term Loan EUR 28-Dec-17 28-Mar-18 919,667,626 920,210,327 Performing 5 Unsecured
Adeniyi Oluwole Director (Bank) Adeniyi Oluwole Home Loans NGN 26-Mar-10 20-May-22 51,000,000 24,228,790 Performing 9 Legal Mortgage
Atedo N.A. Peterside Former Chairman (Holdco) Atedo Peterside Card NGN 10-Feb-15 31-Oct-19 20,000,000 490,628 Performing 30 Shares
Dr AAE And Mrs JAO Sogunle Director (Bank) Demola Sogunle Term Loan NGN 28-Nov-17 20-Nov-22 60,000,000 59,477,258 Performing 18 Legal Mortgage
Dr AAE And Mrs JAO Sogunle Director (Bank) Demola Sogunle Card USD 21-Nov-16 30-Nov-19 8,279,000 1,386,077 Performing 30 Cash
Various Staff Staff Various Staff Staff Loan NGN 9,191,683,238 5,869,343,455 Performing 11
Total - Insider Related Credits 80,951,138,441 55,430,844,445
Schedule of directors and staff related credits (continued)
Off balance sheet engagements
Name of Company
Name of related
interest
Relationship
Facility type
Currency
Outstanding
N’000
Status
Golden Sugar Company Limited
(A Subsidiary Of Flour Mills)
Atedo Peterside Ex-Chairman
(Holdco)
Letter Of Credit USD 8,600 Performing
Nigerian Breweries Group
(Heineken Intl.)
Atedo Peterside Ex-Chairman
(Holdco)
Letter Of Credit EUR 2,941 Performing
Nigerian Bottling Co Plc (Coca-Cola
Hellenic Bottling Company)
Olusola David-
Borha
Ex - Chief
Executive (Holdco)
Letter Of Credit EUR 22,709 Performing
Nigerian Bottling Co Plc (Coca-Cola
Hellenic Bottling Company)
Olusola David-
Borha
Ex - Chief
Executive (Holdco)
Bonds And
Guarantees
EUR 173,864 Performing
Guinness Nigeria Plc Ngozi Edozien Non-Executive
(Holdco)
Letter Of Credit USD 6,601 Performing
Flour Mills Of Nigeria Plc Atedo Peterside Ex-Chairman
(Holdco)
Letter Of Credit USD 27,435 Performing
Pz Cussons Nigeria Plc Ngozi Edozien Non-Executive
(Holdco)
Letter Of Credit USD 2,828 Performing
Unilever Nigeria Plc Atedo Peterside Ex-Chairman
(Holdco)
Letter Of Credit USD 7,572 Performing
Mtn Nigeria Communications Ltd Ahmed I Dasuki Ex-Non Executive
Director
Letter Of Credit USD 7,324 Performing
Presco Plc Atedo Peterside Ex-Chairman
(Holdco)
Letter Of Credit EUR 2,502 Performing
262,376
Notes to the consolidated and separate financial statements For the year ended 31 December 2017
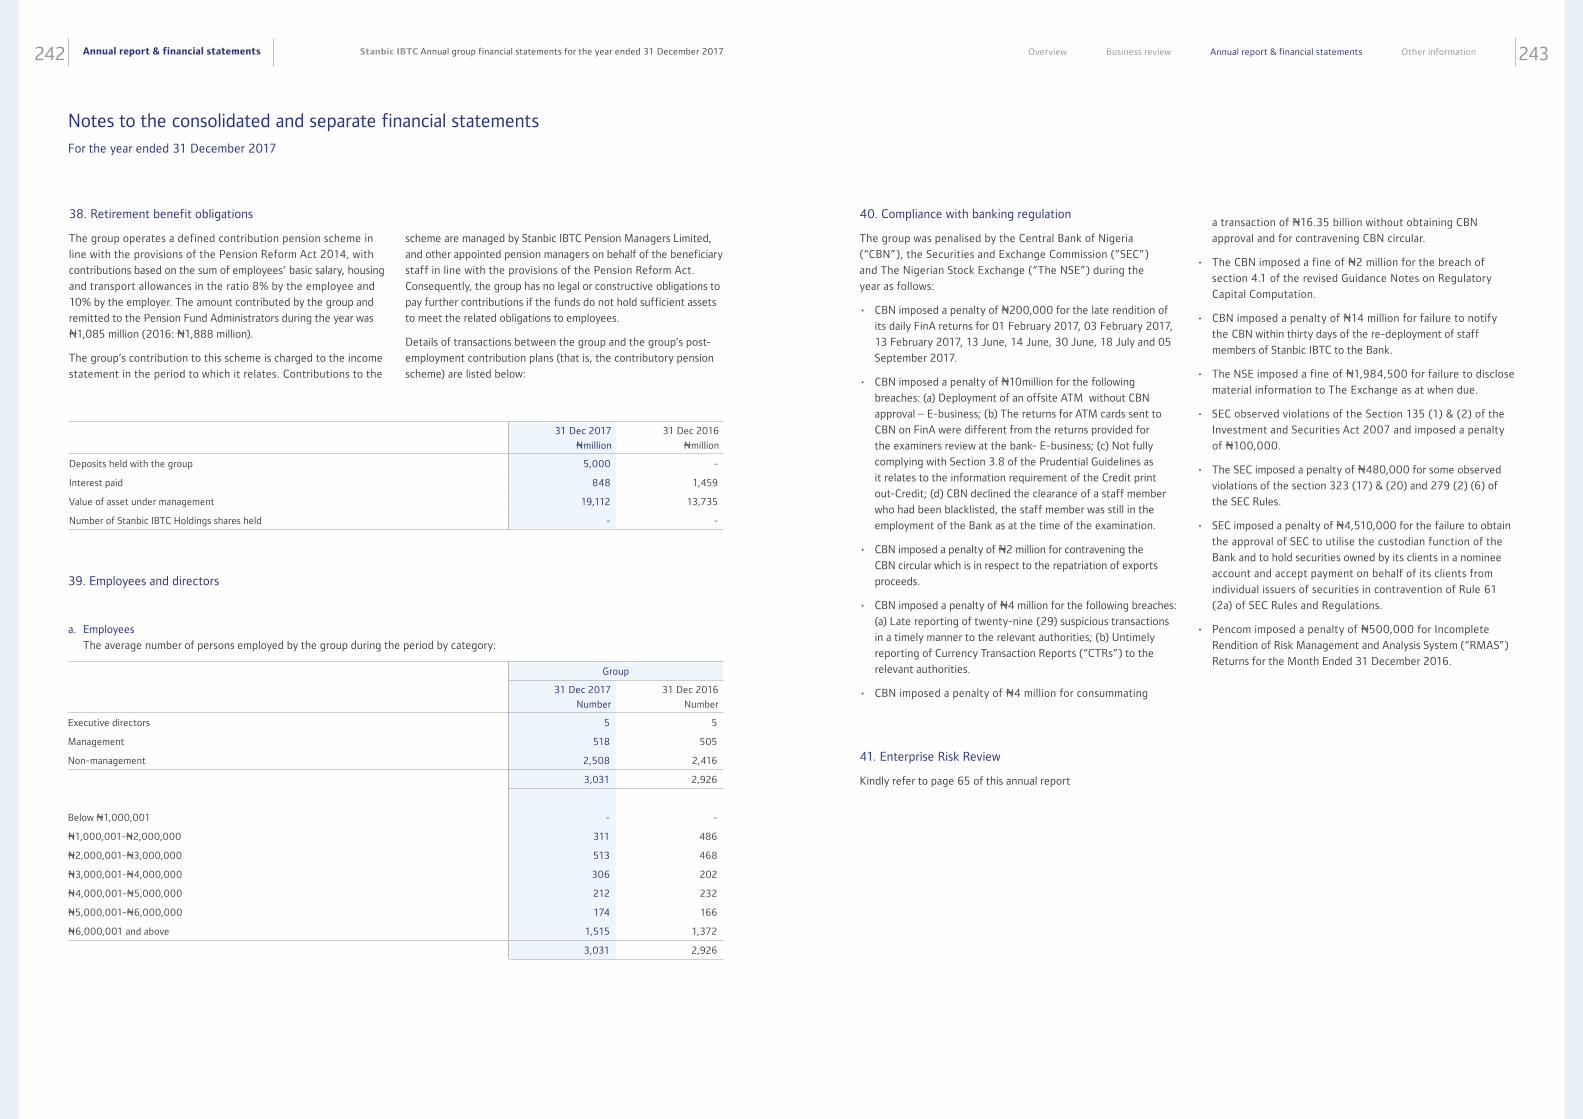
Annual report & financial statements242 243Stanbic IBTC Annual group financial statements for the year ended 31 December 2017 Overview Business review Annual report & financial statements Other information
38. Retirement benefit obligations
The group operates a defined contribution pension scheme in
line with the provisions of the Pension Reform Act 2014, with
contributions based on the sum of employees’ basic salary, housing
and transport allowances in the ratio 8% by the employee and
10% by the employer. The amount contributed by the group and
remitted to the Pension Fund Administrators during the year was
N1,085 million (2016: N1,888 million).
The group’s contribution to this scheme is charged to the income
statement in the period to which it relates. Contributions to the
39. Employees and directors
a. Employees
The average number of persons employed by the group during the period by category:
scheme are managed by Stanbic IBTC Pension Managers Limited,
and other appointed pension managers on behalf of the beneficiary
staff in line with the provisions of the Pension Reform Act.
Consequently, the group has no legal or constructive obligations to
pay further contributions if the funds do not hold sufficient assets
to meet the related obligations to employees.
Details of transactions between the group and the group’s post-
employment contribution plans (that is, the contributory pension
scheme) are listed below:
31 Dec 2017
Nmillion
31 Dec 2016
Nmillion
Deposits held with the group 5,000 -
Interest paid 848 1,459
Value of asset under management 19,112 13,735
Number of Stanbic IBTC Holdings shares held - -
Group
31 Dec 2017
Number
31 Dec 2016
Number
Executive directors 5 5
Management 518 505
Non-management 2,508 2,416
3,031 2,926
Below N1,000,001 - -
N1,000,001-N2,000,000 311 486
N2,000,001-N3,000,000 513 468
N3,000,001-N4,000,000 306 202
N4,000,001-N5,000,000 212 232
N5,000,001-N6,000,000 174 166
N6,000,001 and above 1,515 1,372
3,031 2,926
40. Compliance with banking regulation
The group was penalised by the Central Bank of Nigeria
(“CBN”), the Securities and Exchange Commission (“SEC”)
and The Nigerian Stock Exchange (“The NSE”) during the
year as follows:
• CBN imposed a penalty of N200,000 for the late rendition of
its daily FinA returns for 01 February 2017, 03 February 2017,
13 February 2017, 13 June, 14 June, 30 June, 18 July and 05
September 2017.
• CBN imposed a penalty of N10million for the following
breaches: (a) Deployment of an offsite ATM without CBN
approval – E-business; (b) The returns for ATM cards sent to
CBN on FinA were different from the returns provided for
the examiners review at the bank- E-business; (c) Not fully
complying with Section 3.8 of the Prudential Guidelines as
it relates to the information requirement of the Credit print
out-Credit; (d) CBN declined the clearance of a staff member
who had been blacklisted, the staff member was still in the
employment of the Bank as at the time of the examination.
• CBN imposed a penalty of N2 million for contravening the
CBN circular which is in respect to the repatriation of exports
proceeds.
• CBN imposed a penalty of N4 million for the following breaches:
(a) Late reporting of twenty-nine (29) suspicious transactions
in a timely manner to the relevant authorities; (b) Untimely
reporting of Currency Transaction Reports (“CTRs”) to the
relevant authorities.
• CBN imposed a penalty of N4 million for consummating
41. Enterprise Risk Review
Kindly refer to page 65 of this annual report
a transaction of N16.35 billion without obtaining CBN
approval and for contravening CBN circular.
• The CBN imposed a fine of N2 million for the breach of
section 4.1 of the revised Guidance Notes on Regulatory
Capital Computation.
• CBN imposed a penalty of N14 million for failure to notify
the CBN within thirty days of the re-deployment of staff
members of Stanbic IBTC to the Bank.
• The NSE imposed a fine of N1,984,500 for failure to disclose
material information to The Exchange as at when due.
• SEC observed violations of the Section 135 (1) & (2) of the
Investment and Securities Act 2007 and imposed a penalty
of N100,000.
• The SEC imposed a penalty of N480,000 for some observed
violations of the section 323 (17) & (20) and 279 (2) (6) of
the SEC Rules.
• SEC imposed a penalty of N4,510,000 for the failure to obtain
the approval of SEC to utilise the custodian function of the
Bank and to hold securities owned by its clients in a nominee
account and accept payment on behalf of its clients from
individual issuers of securities in contravention of Rule 61
(2a) of SEC Rules and Regulations.
• Pencom imposed a penalty of N500,000 for Incomplete
Rendition of Risk Management and Analysis System (“RMAS”)
Returns for the Month Ended 31 December 2016.
Notes to the consolidated and separate financial statements For the year ended 31 December 2017
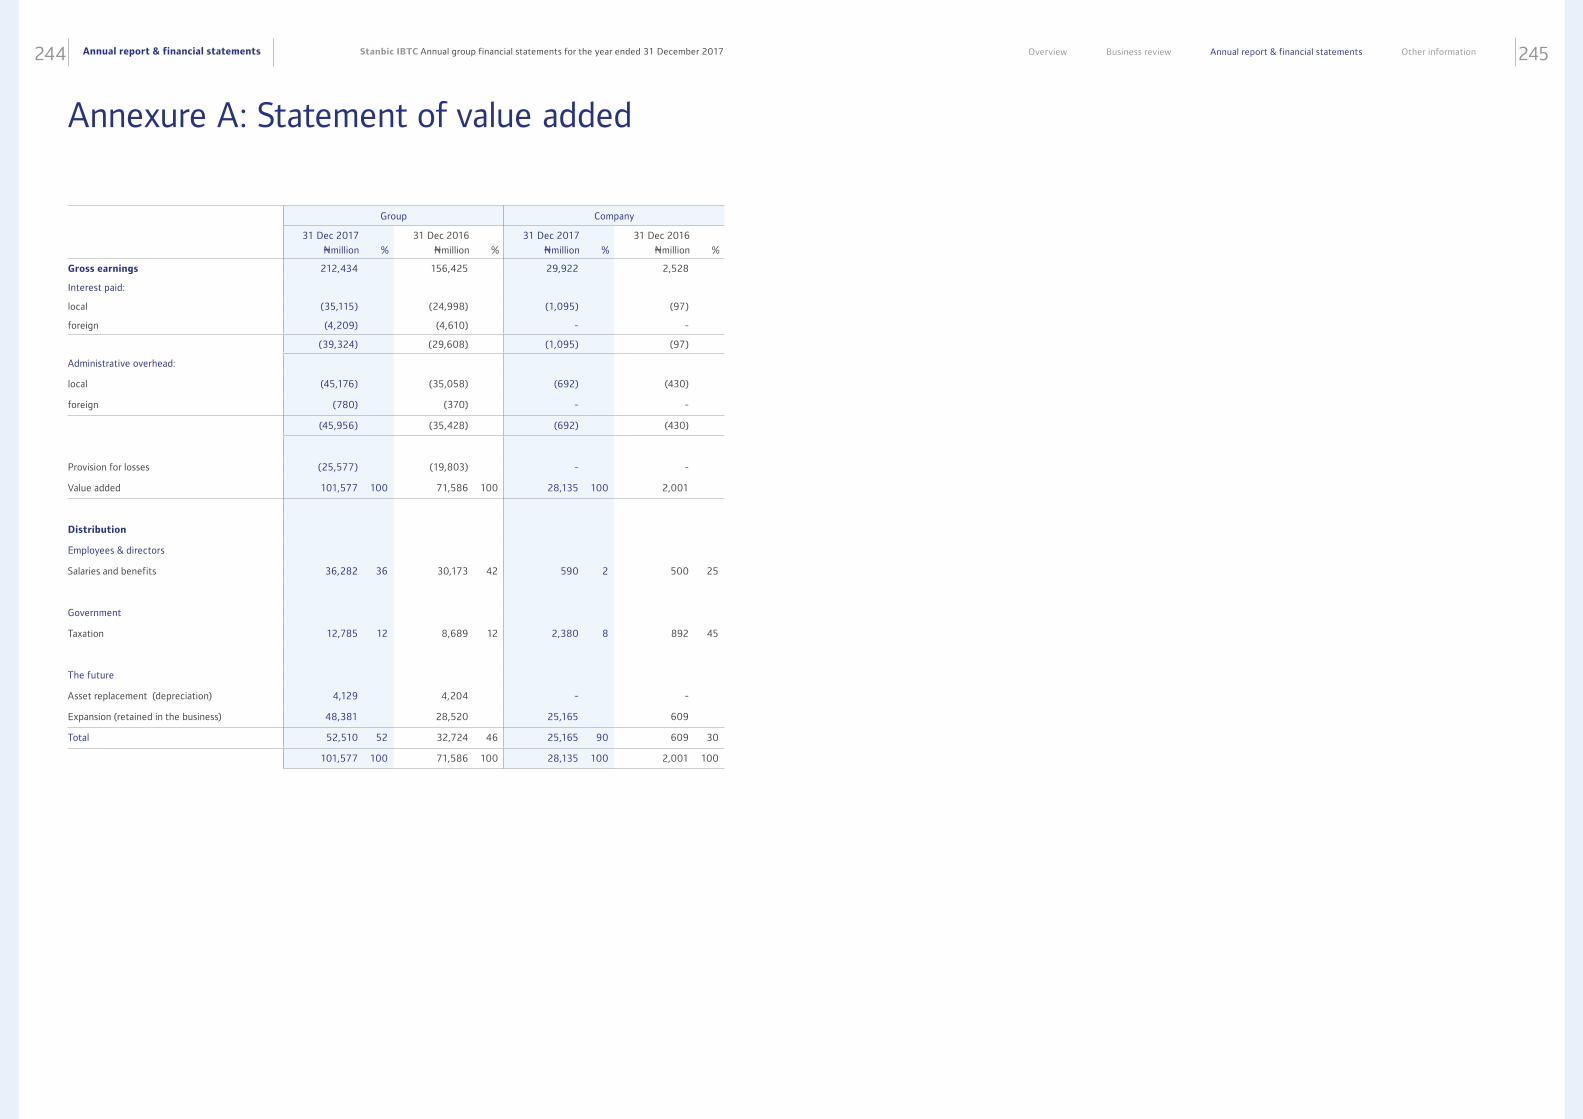
Annual report & financial statements244 245Stanbic IBTC Annual group financial statements for the year ended 31 December 2017 Overview Business review Annual report & financial statements Other information
Group Company
31 Dec 2017
Nmillion
%
31 Dec 2016
Nmillion
%
31 Dec 2017
Nmillion
%
31 Dec 2016
Nmillion
%
Gross earnings 212,434 156,425 29,922 2,528
Interest paid:
local (35,115) (24,998) (1,095) (97)
foreign (4,209) (4,610) - -
(39,324) (29,608) (1,095) (97)
Administrative overhead:
local (45,176) (35,058) (692) (430)
foreign (780) (370) - -
(45,956) (35,428) (692) (430)
Provision for losses (25,577) (19,803) - -
Value added 101,577 100 71,586 100 28,135 100 2,001
Distribution
Employees & directors
Salaries and benefits 36,282 36 30,173 42 590 2 500 25
Government
Taxation 12,785 12 8,689 12 2,380 8 892 45
The future
Asset replacement (depreciation) 4,129 4,204 - -
Expansion (retained in the business) 48,381 28,520 25,165 609
Total 52,510 52 32,724 46 25,165 90 609 30
101,577 100 71,586 100 28,135 100 2,001 100
Annexure A: Statement of value added
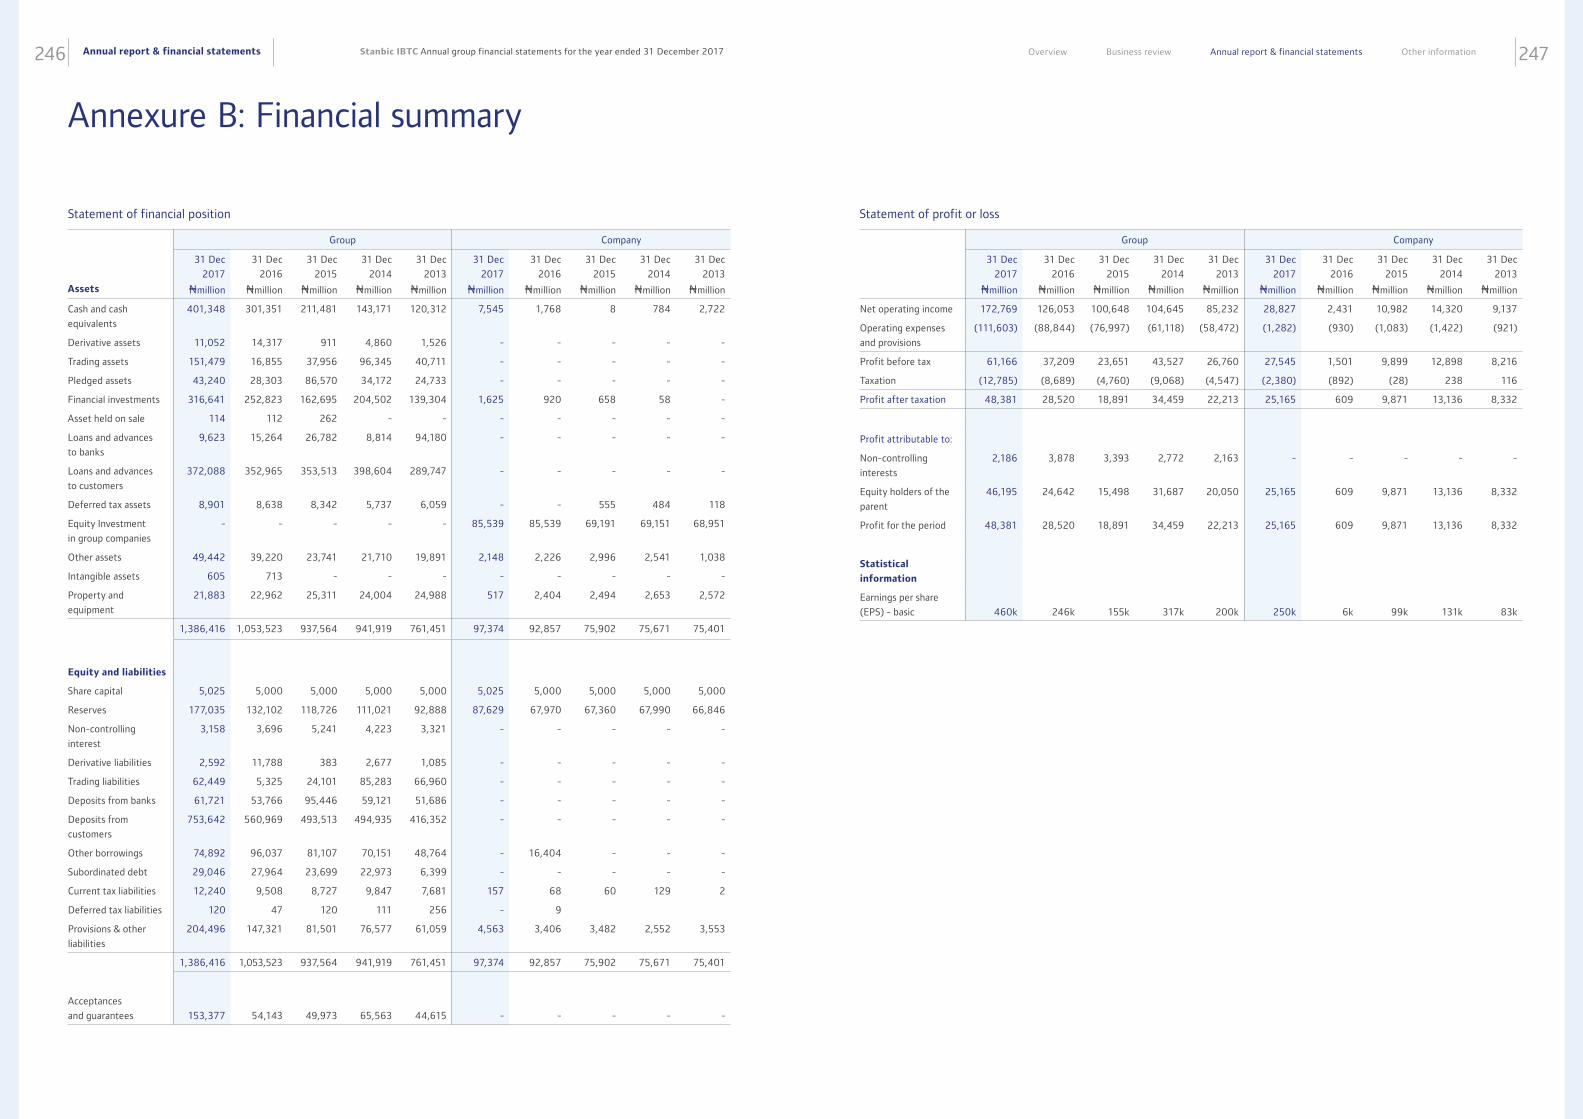
Annual report & financial statements246 247Stanbic IBTC Annual group financial statements for the year ended 31 December 2017 Overview Business review Annual report & financial statements Other information
Annexure B: Financial summary
Group Company
Assets
31 Dec
2017
Nmillion
31 Dec
2016
Nmillion
31 Dec
2015
Nmillion
31 Dec
2014
Nmillion
31 Dec
2013
Nmillion
31 Dec
2017
Nmillion
31 Dec
2016
Nmillion
31 Dec
2015
Nmillion
31 Dec
2014
Nmillion
31 Dec
2013
Nmillion
Cash and cash
equivalents
401,348 301,351 211,481 143,171 120,312 7,545 1,768 8 784 2,722
Derivative assets 11,052 14,317 911 4,860 1,526 - - - - -
Trading assets 151,479 16,855 37,956 96,345 40,711 - - - - -
Pledged assets 43,240 28,303 86,570 34,172 24,733 - - - - -
Financial investments 316,641 252,823 162,695 204,502 139,304 1,625 920 658 58 -
Asset held on sale 114 112 262 - - - - - - -
Loans and advances
to banks
9,623 15,264 26,782 8,814 94,180 - - - - -
Loans and advances
to customers
372,088 352,965 353,513 398,604 289,747 - - - - -
Deferred tax assets 8,901 8,638 8,342 5,737 6,059 - - 555 484 118
Equity Investment
in group companies
- - - - - 85,539 85,539 69,191 69,151 68,951
Other assets 49,442 39,220 23,741 21,710 19,891 2,148 2,226 2,996 2,541 1,038
Intangible assets 605 713 - - - - - - - -
Property and
equipment
21,883 22,962 25,311 24,004 24,988 517 2,404 2,494 2,653 2,572
1,386,416 1,053,523 937,564 941,919 761,451 97,374 92,857 75,902 75,671 75,401
Equity and liabilities
Share capital 5,025 5,000 5,000 5,000 5,000 5,025 5,000 5,000 5,000 5,000
Reserves 177,035 132,102 118,726 111,021 92,888 87,629 67,970 67,360 67,990 66,846
Non-controlling
interest
3,158 3,696 5,241 4,223 3,321 - - - - -
Derivative liabilities 2,592 11,788 383 2,677 1,085 - - - - -
Trading liabilities 62,449 5,325 24,101 85,283 66,960 - - - - -
Deposits from banks 61,721 53,766 95,446 59,121 51,686 - - - - -
Deposits from
customers
753,642 560,969 493,513 494,935 416,352 - - - - -
Other borrowings 74,892 96,037 81,107 70,151 48,764 - 16,404 - - -
Subordinated debt 29,046 27,964 23,699 22,973 6,399 - - - - -
Current tax liabilities 12,240 9,508 8,727 9,847 7,681 157 68 60 129 2
Deferred tax liabilities 120 47 120 111 256 - 9
Provisions & other
liabilities
204,496 147,321 81,501 76,577 61,059 4,563 3,406 3,482 2,552 3,553
1,386,416 1,053,523 937,564 941,919 761,451 97,374 92,857 75,902 75,671 75,401
Acceptances
and guarantees
153,377
54,143
49,973
65,563
44,615
-
-
-
-
-
Statement of financial position
Group Company
31 Dec
2017
Nmillion
31 Dec
2016
Nmillion
31 Dec
2015
Nmillion
31 Dec
2014
Nmillion
31 Dec
2013
Nmillion
31 Dec
2017
Nmillion
31 Dec
2016
Nmillion
31 Dec
2015
Nmillion
31 Dec
2014
Nmillion
31 Dec
2013
Nmillion
Net operating income 172,769 126,053 100,648 104,645 85,232 28,827 2,431 10,982 14,320 9,137
Operating expenses
and provisions
(111,603) (88,844) (76,997) (61,118) (58,472) (1,282) (930) (1,083) (1,422) (921)
Profit before tax 61,166 37,209 23,651 43,527 26,760 27,545 1,501 9,899 12,898 8,216
Taxation (12,785) (8,689) (4,760) (9,068) (4,547) (2,380) (892) (28) 238 116
Profit after taxation 48,381 28,520 18,891 34,459 22,213 25,165 609 9,871 13,136 8,332
Profit attributable to:
Non-controlling
interests
2,186 3,878 3,393 2,772 2,163 - - - - -
Equity holders of the
parent
46,195 24,642 15,498 31,687 20,050 25,165 609 9,871 13,136 8,332
Profit for the period 48,381 28,520 18,891 34,459 22,213 25,165 609 9,871 13,136 8,332
Statistical
information
Earnings per share
(EPS) - basic
460k
246k
155k
317k
200k
250k
6k
99k
131k
83k
Statement of profit or loss
249
The skills to
in the face of challenges
Change is inevitable, and often looked at as a negative, when Stanbic IBTC will always see it as an opportunity.
It is during testing times that we can show true leadership, discover new solutions and chart fresh courses of action. It is the problems that we face that produce better practices and directions for our customers.
250254258
Management teamBranch networkContact information
Other information
This is what drives us at Stanbic IBTC
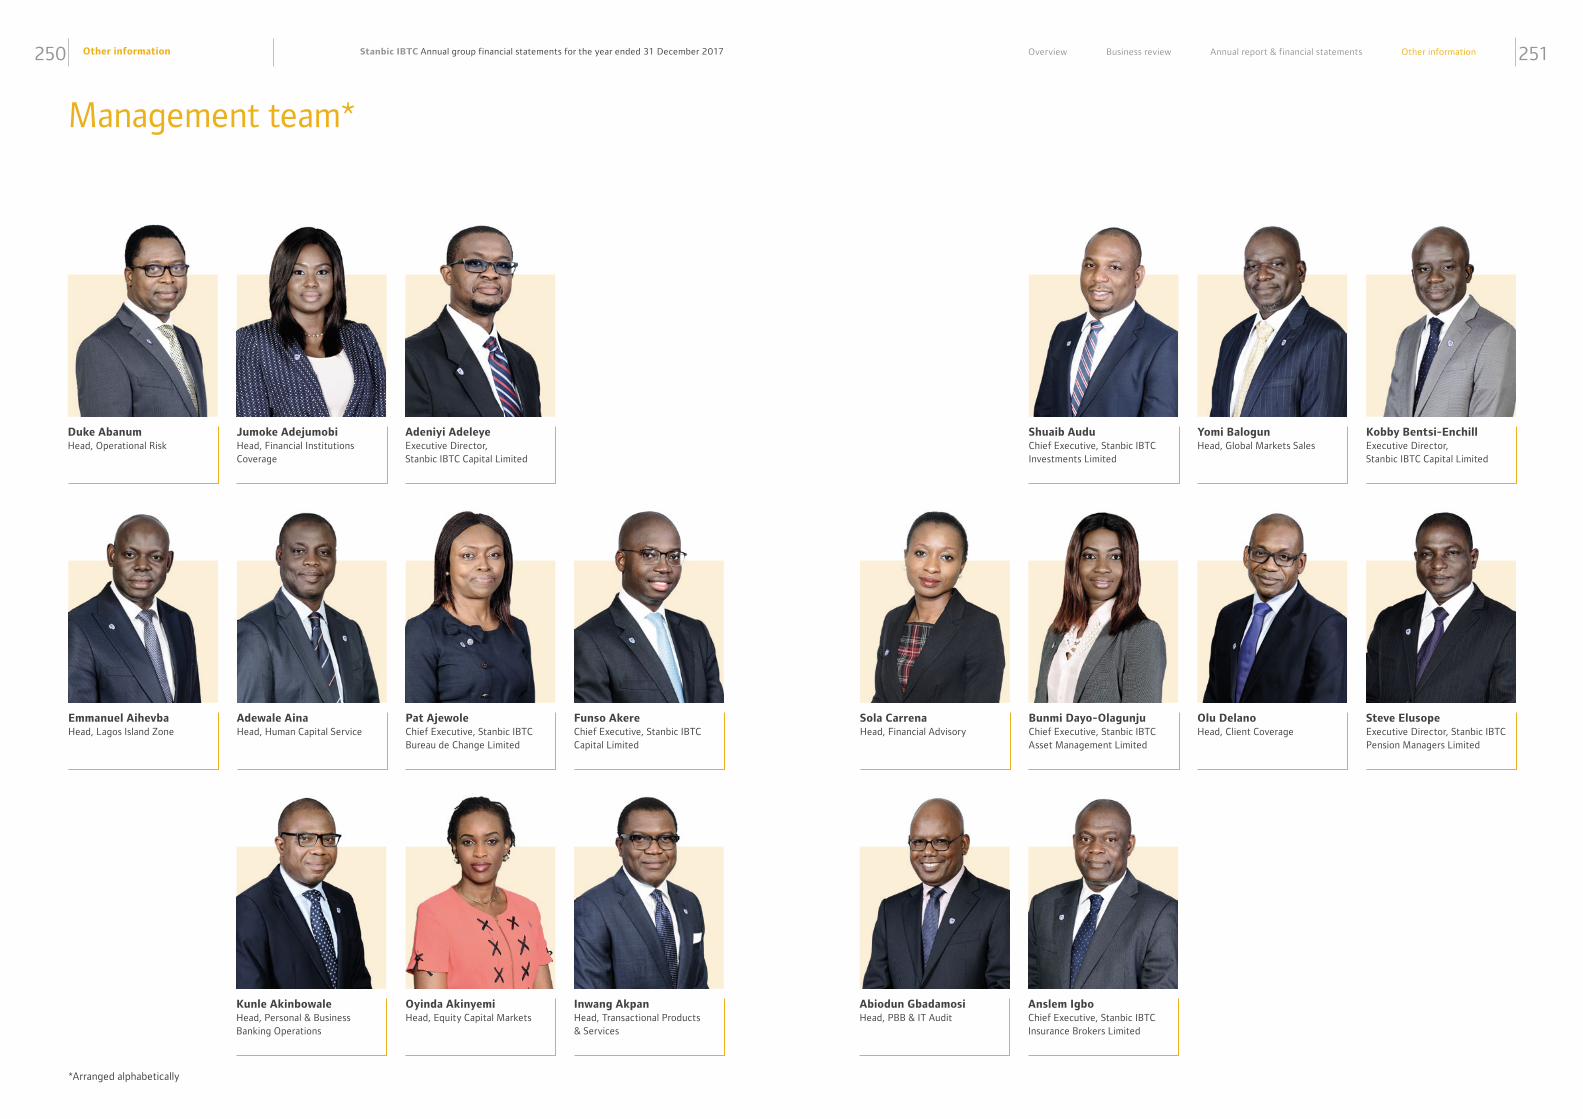
Other information250 251Stanbic IBTC Annual group financial statements for the year ended 31 December 2017 Overview Business review Annual report & financial statements Other information
Inwang Akpan Head, Transactional Products & Services
Management team*
Duke Abanum Head, Operational Risk
Adeniyi Adeleye Executive Director, Stanbic IBTC Capital Limited
Pat Ajewole Chief Executive, Stanbic IBTC Bureau de Change Limited
Funso Akere Chief Executive, Stanbic IBTC Capital Limited
Oyinda Akinyemi Head, Equity Capital Markets
Jumoke Adejumobi Head, Financial Institutions Coverage
Kunle Akinbowale Head, Personal & Business Banking Operations
Adewale Aina Head, Human Capital Service
Emmanuel Aihevba Head, Lagos Island Zone
Yomi Balogun Head, Global Markets Sales
Abiodun Gbadamosi Head, PBB & IT Audit
Kobby Bentsi-Enchill Executive Director, Stanbic IBTC Capital Limited
Olu Delano Head, Client Coverage
Sola Carrena Head, Financial Advisory
Bunmi Dayo-Olagunju Chief Executive, Stanbic IBTC Asset Management Limited
Shuaib Audu Chief Executive, Stanbic IBTC Investments Limited
Steve Elusope Executive Director, Stanbic IBTC Pension Managers Limited
Anslem Igbo Chief Executive, Stanbic IBTC Insurance Brokers Limited
*Arranged alphabetically
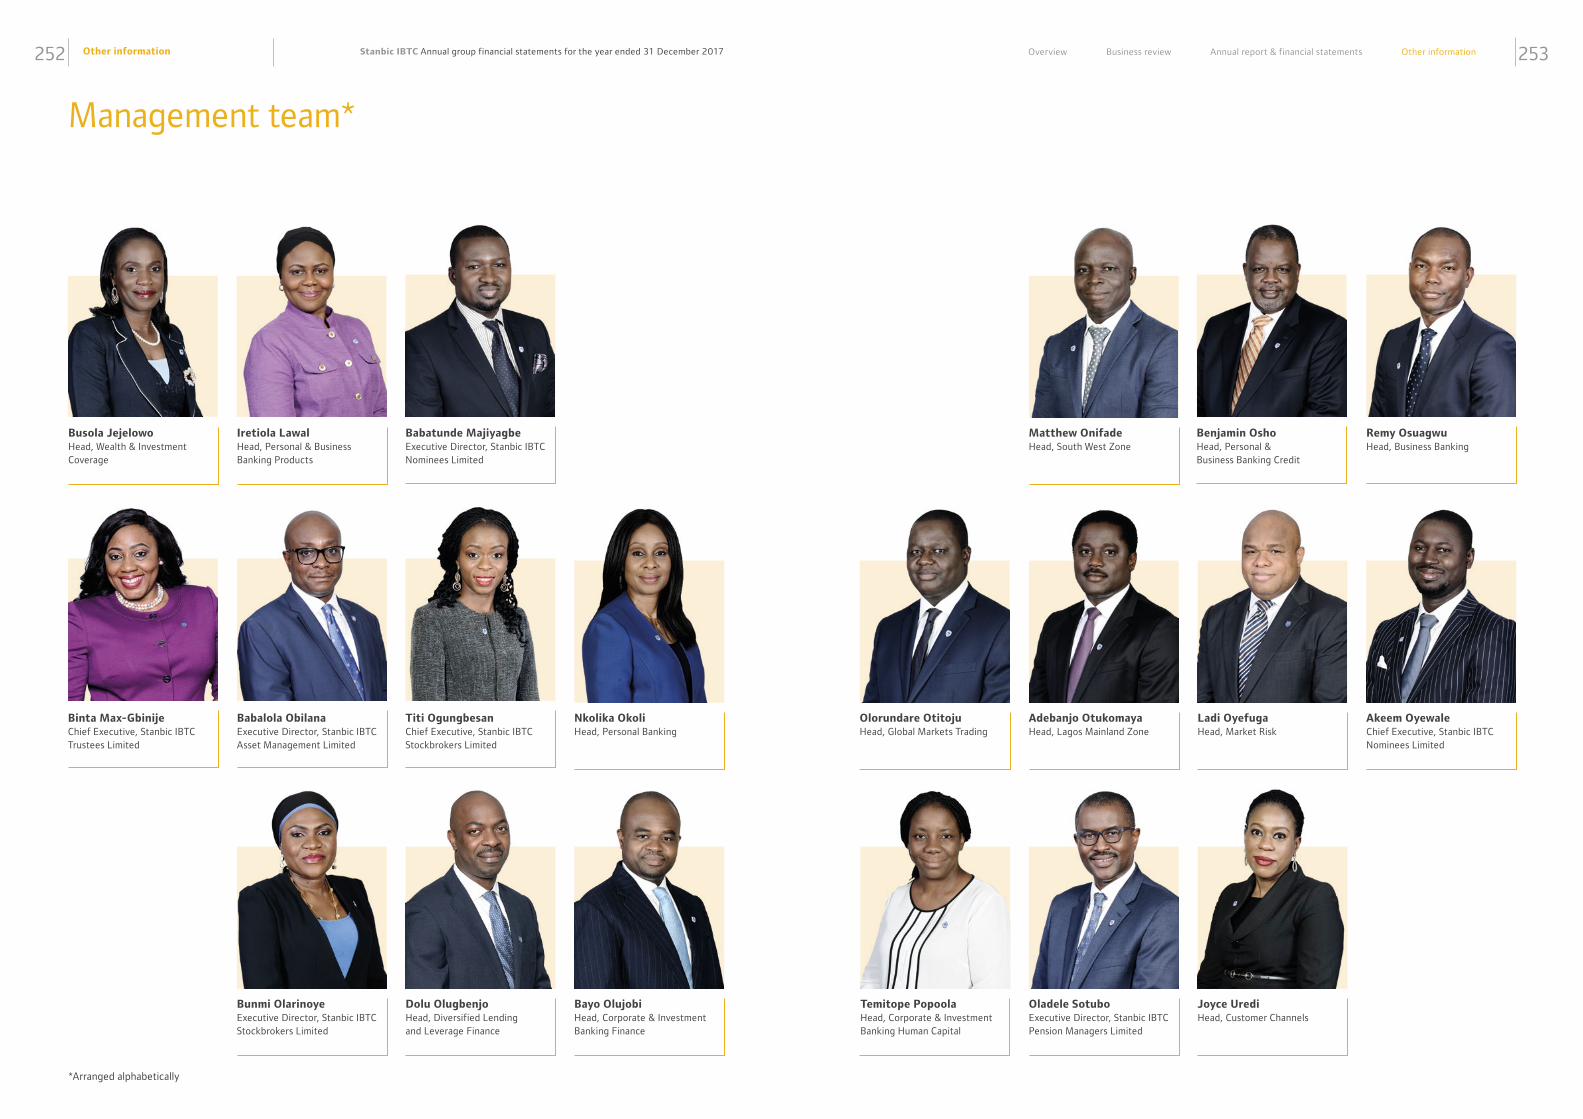
Other information252 253Stanbic IBTC Annual group financial statements for the year ended 31 December 2017 Overview Business review Annual report & financial statements Other information
Babalola Obilana Executive Director, Stanbic IBTC Asset Management Limited
Bunmi Olarinoye Executive Director, Stanbic IBTC Stockbrokers Limited
Dolu Olugbenjo Head, Diversified Lending and Leverage Finance
Binta Max-Gbinije Chief Executive, Stanbic IBTC Trustees Limited
Bayo Olujobi Head, Corporate & Investment Banking Finance
Titi Ogungbesan Chief Executive, Stanbic IBTC Stockbrokers Limited
Babatunde Majiyagbe Executive Director, Stanbic IBTC Nominees Limited
Nkolika Okoli Head, Personal Banking
Busola Jejelowo Head, Wealth & Investment Coverage
Iretiola Lawal Head, Personal & Business Banking Products
Adebanjo Otukomaya Head, Lagos Mainland Zone
Ladi Oyefuga Head, Market Risk
Benjamin Osho Head, Personal & Business Banking Credit
Oladele Sotubo Executive Director, Stanbic IBTC Pension Managers Limited
Matthew Onifade Head, South West Zone
Akeem Oyewale Chief Executive, Stanbic IBTC Nominees Limited
Temitope Popoola Head, Corporate & Investment Banking Human Capital
Remy Osuagwu Head, Business Banking
Joyce Uredi Head, Customer Channels
Olorundare Otitoju Head, Global Markets Trading
Management team*
*Arranged alphabetically
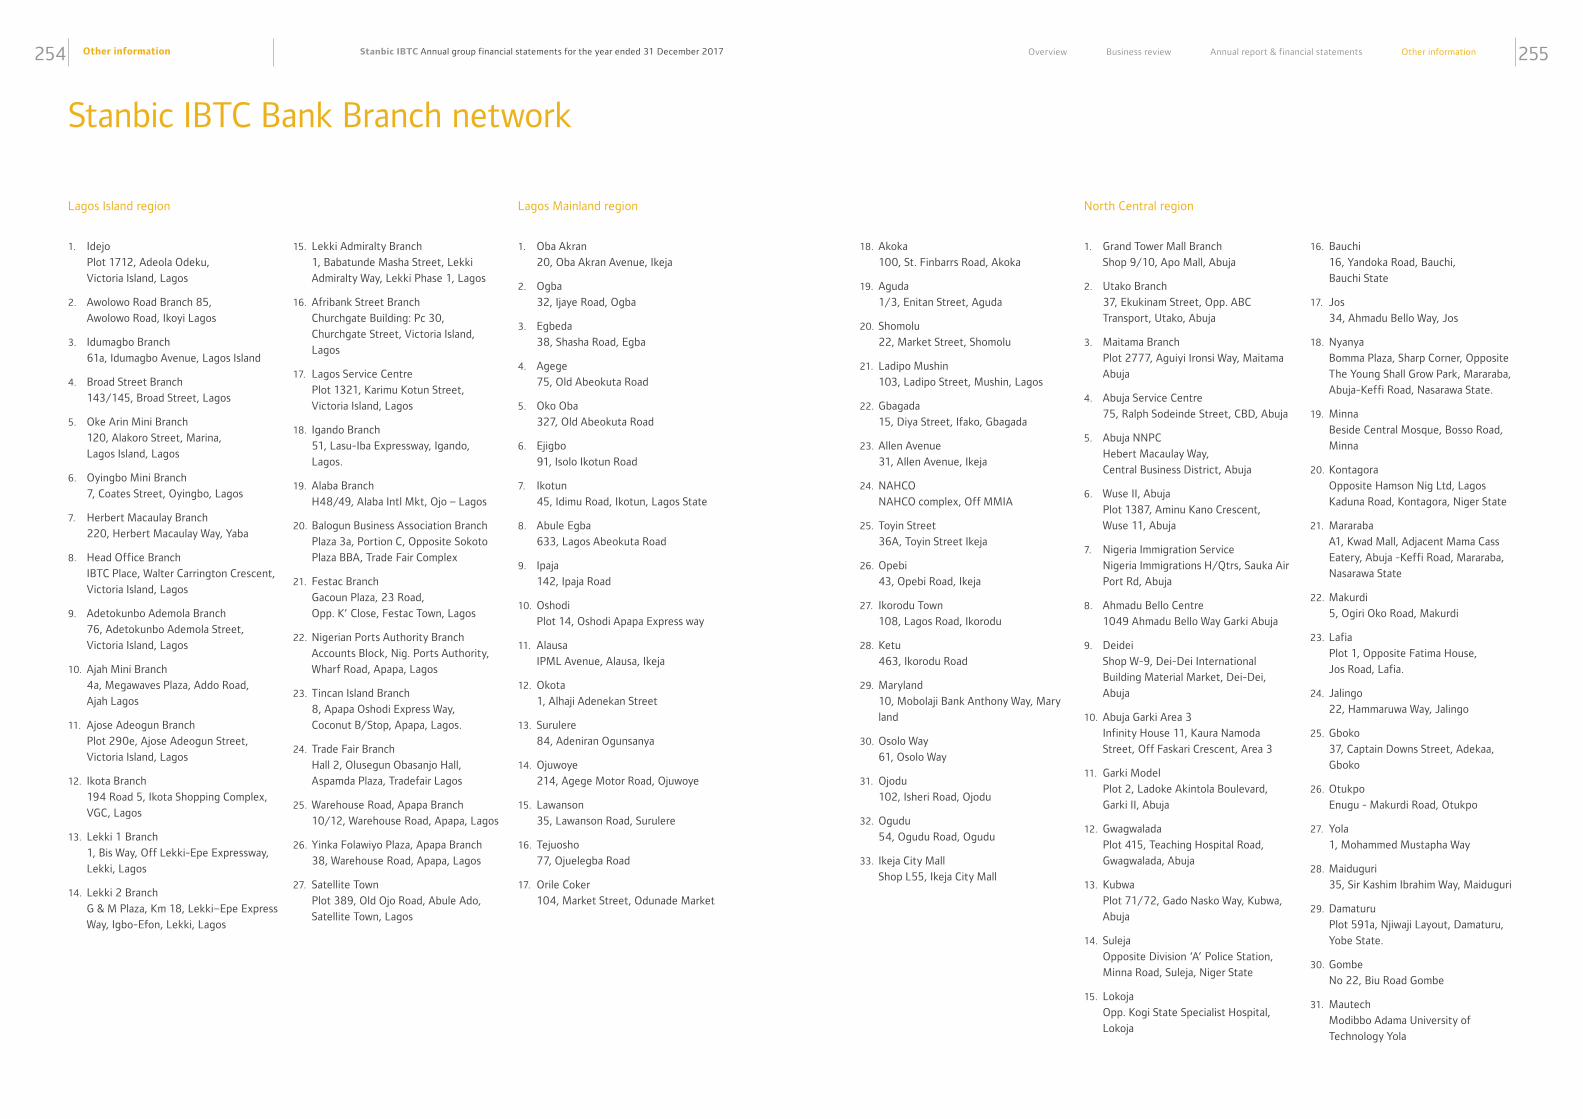
Other information254 255Stanbic IBTC Annual group financial statements for the year ended 31 December 2017 Overview Business review Annual report & financial statements Other information
Stanbic IBTC Bank Branch network
Lagos Island region
1. Idejo
Plot 1712, Adeola Odeku,
Victoria Island, Lagos
2. Awolowo Road Branch 85,
Awolowo Road, Ikoyi Lagos
3. Idumagbo Branch
61a, Idumagbo Avenue, Lagos Island
4. Broad Street Branch
143/145, Broad Street, Lagos
5. Oke Arin Mini Branch
120, Alakoro Street, Marina,
Lagos Island, Lagos
6. Oyingbo Mini Branch
7, Coates Street, Oyingbo, Lagos
7. Herbert Macaulay Branch
220, Herbert Macaulay Way, Yaba
8. Head Office Branch
IBTC Place, Walter Carrington Crescent,
Victoria Island, Lagos
9. Adetokunbo Ademola Branch
76, Adetokunbo Ademola Street,
Victoria Island, Lagos
10. Ajah Mini Branch
4a, Megawaves Plaza, Addo Road,
Ajah Lagos
11. Ajose Adeogun Branch
Plot 290e, Ajose Adeogun Street,
Victoria Island, Lagos
12. Ikota Branch
194 Road 5, Ikota Shopping Complex,
VGC, Lagos
13. Lekki 1 Branch
1, Bis Way, Off Lekki-Epe Expressway,
Lekki, Lagos
14. Lekki 2 Branch
G & M Plaza, Km 18, Lekki–Epe Express
Way, Igbo-Efon, Lekki, Lagos
Lagos Mainland region
1. Oba Akran
20, Oba Akran Avenue, Ikeja
2. Ogba
32, Ijaye Road, Ogba
3. Egbeda
38, Shasha Road, Egba
4. Agege
75, Old Abeokuta Road
5. Oko Oba
327, Old Abeokuta Road
6. Ejigbo
91, Isolo Ikotun Road
7. Ikotun
45, Idimu Road, Ikotun, Lagos State
8. Abule Egba
633, Lagos Abeokuta Road
9. Ipaja
142, Ipaja Road
10. Oshodi
Plot 14, Oshodi Apapa Express way
11. Alausa
IPML Avenue, Alausa, Ikeja
12. Okota
1, Alhaji Adenekan Street
13. Surulere
84, Adeniran Ogunsanya
14. Ojuwoye
214, Agege Motor Road, Ojuwoye
15. Lawanson
35, Lawanson Road, Surulere
16. Tejuosho
77, Ojuelegba Road
17. Orile Coker
104, Market Street, Odunade Market
15. Lekki Admiralty Branch
1, Babatunde Masha Street, Lekki
Admiralty Way, Lekki Phase 1, Lagos
16. Afribank Street Branch
Churchgate Building: Pc 30,
Churchgate Street, Victoria Island,
Lagos
17. Lagos Service Centre
Plot 1321, Karimu Kotun Street,
Victoria Island, Lagos
18. Igando Branch
51, Lasu-Iba Expressway, Igando,
Lagos.
19. Alaba Branch
H48/49, Alaba Intl Mkt, Ojo – Lagos
20. Balogun Business Association Branch
Plaza 3a, Portion C, Opposite Sokoto
Plaza BBA, Trade Fair Complex
21. Festac Branch
Gacoun Plaza, 23 Road,
Opp. K’ Close, Festac Town, Lagos
22. Nigerian Ports Authority Branch
Accounts Block, Nig. Ports Authority,
Wharf Road, Apapa, Lagos
23. Tincan Island Branch
8, Apapa Oshodi Express Way,
Coconut B/Stop, Apapa, Lagos.
24. Trade Fair Branch
Hall 2, Olusegun Obasanjo Hall,
Aspamda Plaza, Tradefair Lagos
25. Warehouse Road, Apapa Branch
10/12, Warehouse Road, Apapa, Lagos
26. Yinka Folawiyo Plaza, Apapa Branch
38, Warehouse Road, Apapa, Lagos
27. Satellite Town
Plot 389, Old Ojo Road, Abule Ado,
Satellite Town, Lagos
18. Akoka
100, St. Finbarrs Road, Akoka
19. Aguda
1/3, Enitan Street, Aguda
20. Shomolu
22, Market Street, Shomolu
21. Ladipo Mushin
103, Ladipo Street, Mushin, Lagos
22. Gbagada
15, Diya Street, Ifako, Gbagada
23. Allen Avenue
31, Allen Avenue, Ikeja
24. NAHCO
NAHCO complex, Off MMIA
25. Toyin Street
36A, Toyin Street Ikeja
26. Opebi
43, Opebi Road, Ikeja
27. Ikorodu Town
108, Lagos Road, Ikorodu
28. Ketu
463, Ikorodu Road
29. Maryland
10, Mobolaji Bank Anthony Way, Mary
land
30. Osolo Way
61, Osolo Way
31. Ojodu
102, Isheri Road, Ojodu
32. Ogudu
54, Ogudu Road, Ogudu
33. Ikeja City Mall
Shop L55, Ikeja City Mall
North Central region
1. Grand Tower Mall Branch
Shop 9/10, Apo Mall, Abuja
2. Utako Branch
37, Ekukinam Street, Opp. ABC
Transport, Utako, Abuja
3. Maitama Branch
Plot 2777, Aguiyi Ironsi Way, Maitama
Abuja
4. Abuja Service Centre
75, Ralph Sodeinde Street, CBD, Abuja
5. Abuja NNPC
Hebert Macaulay Way,
Central Business District, Abuja
6. Wuse II, Abuja
Plot 1387, Aminu Kano Crescent,
Wuse 11, Abuja
7. Nigeria Immigration Service
Nigeria Immigrations H/Qtrs, Sauka Air
Port Rd, Abuja
8. Ahmadu Bello Centre
1049 Ahmadu Bello Way Garki Abuja
9. Deidei
Shop W-9, Dei-Dei International
Building Material Market, Dei-Dei,
Abuja
10. Abuja Garki Area 3
Infinity House 11, Kaura Namoda
Street, Off Faskari Crescent, Area 3
11. Garki Model
Plot 2, Ladoke Akintola Boulevard,
Garki II, Abuja
12. Gwagwalada
Plot 415, Teaching Hospital Road,
Gwagwalada, Abuja
13. Kubwa
Plot 71/72, Gado Nasko Way, Kubwa,
Abuja
14. Suleja
Opposite Division ‘A’ Police Station,
Minna Road, Suleja, Niger State
15. Lokoja
Opp. Kogi State Specialist Hospital,
Lokoja
16. Bauchi
16, Yandoka Road, Bauchi,
Bauchi State
17. Jos
34, Ahmadu Bello Way, Jos
18. Nyanya
Bomma Plaza, Sharp Corner, Opposite
The Young Shall Grow Park, Mararaba,
Abuja-Keffi Road, Nasarawa State.
19. Minna
Beside Central Mosque, Bosso Road,
Minna
20. Kontagora
Opposite Hamson Nig Ltd, Lagos
Kaduna Road, Kontagora, Niger State
21. Mararaba
A1, Kwad Mall, Adjacent Mama Cass
Eatery, Abuja -Keffi Road, Mararaba,
Nasarawa State
22. Makurdi
5, Ogiri Oko Road, Makurdi
23. Lafia
Plot 1, Opposite Fatima House,
Jos Road, Lafia.
24. Jalingo
22, Hammaruwa Way, Jalingo
25. Gboko
37, Captain Downs Street, Adekaa,
Gboko
26. Otukpo
Enugu - Makurdi Road, Otukpo
27. Yola
1, Mohammed Mustapha Way
28. Maiduguri
35, Sir Kashim Ibrahim Way, Maiduguri
29. Damaturu
Plot 591a, Njiwaji Layout, Damaturu,
Yobe State.
30. Gombe
No 22, Biu Road Gombe
31. Mautech
Modibbo Adama University of
Technology Yola
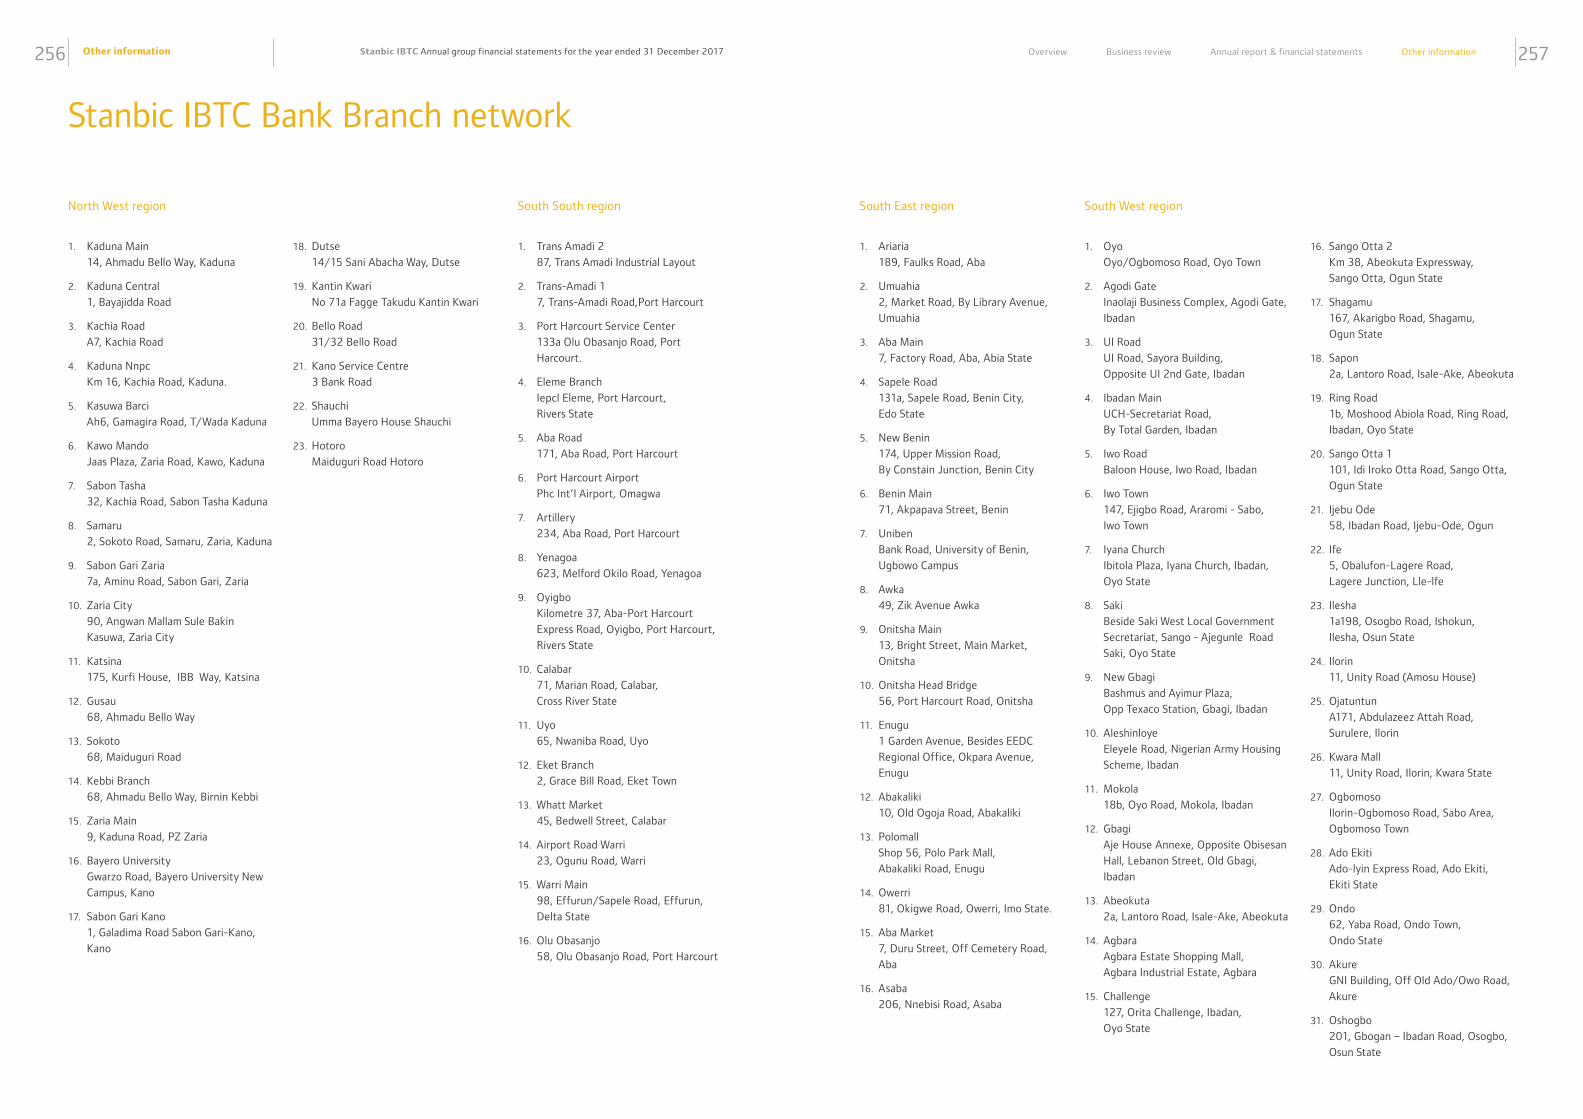
Other information256 257Stanbic IBTC Annual group financial statements for the year ended 31 December 2017 Overview Business review Annual report & financial statements Other information
South South region
1. Trans Amadi 2
87, Trans Amadi Industrial Layout
2. Trans-Amadi 1
7, Trans-Amadi Road,Port Harcourt
3. Port Harcourt Service Center
133a Olu Obasanjo Road, Port
Harcourt.
4. Eleme Branch
Iepcl Eleme, Port Harcourt,
Rivers State
5. Aba Road
171, Aba Road, Port Harcourt
6. Port Harcourt Airport
Phc Int’l Airport, Omagwa
7. Artillery
234, Aba Road, Port Harcourt
8. Yenagoa
623, Melford Okilo Road, Yenagoa
9. Oyigbo
Kilometre 37, Aba-Port Harcourt
Express Road, Oyigbo, Port Harcourt,
Rivers State
10. Calabar
71, Marian Road, Calabar,
Cross River State
11. Uyo
65, Nwaniba Road, Uyo
12. Eket Branch
2, Grace Bill Road, Eket Town
13. Whatt Market
45, Bedwell Street, Calabar
14. Airport Road Warri
23, Ogunu Road, Warri
15. Warri Main
98, Effurun/Sapele Road, Effurun,
Delta State
16. Olu Obasanjo
58, Olu Obasanjo Road, Port Harcourt
North West region
1. Kaduna Main
14, Ahmadu Bello Way, Kaduna
2. Kaduna Central
1, Bayajidda Road
3. Kachia Road
A7, Kachia Road
4. Kaduna Nnpc
Km 16, Kachia Road, Kaduna.
5. Kasuwa Barci
Ah6, Gamagira Road, T/Wada Kaduna
6. Kawo Mando
Jaas Plaza, Zaria Road, Kawo, Kaduna
7. Sabon Tasha
32, Kachia Road, Sabon Tasha Kaduna
8. Samaru
2, Sokoto Road, Samaru, Zaria, Kaduna
9. Sabon Gari Zaria
7a, Aminu Road, Sabon Gari, Zaria
10. Zaria City
90, Angwan Mallam Sule Bakin
Kasuwa, Zaria City
11. Katsina
175, Kurfi House, IBB Way, Katsina
12. Gusau
68, Ahmadu Bello Way
13. Sokoto
68, Maiduguri Road
14. Kebbi Branch
68, Ahmadu Bello Way, Birnin Kebbi
15. Zaria Main
9, Kaduna Road, PZ Zaria
16. Bayero University
Gwarzo Road, Bayero University New
Campus, Kano
17. Sabon Gari Kano
1, Galadima Road Sabon Gari-Kano,
Kano
18. Dutse
14/15 Sani Abacha Way, Dutse
19. Kantin Kwari
No 71a Fagge Takudu Kantin Kwari
20. Bello Road
31/32 Bello Road
21. Kano Service Centre
3 Bank Road
22. Shauchi
Umma Bayero House Shauchi
23. Hotoro
Maiduguri Road Hotoro
South East region
1. Ariaria
189, Faulks Road, Aba
2. Umuahia
2, Market Road, By Library Avenue,
Umuahia
3. Aba Main
7, Factory Road, Aba, Abia State
4. Sapele Road
131a, Sapele Road, Benin City,
Edo State
5. New Benin
174, Upper Mission Road,
By Constain Junction, Benin City
6. Benin Main
71, Akpapava Street, Benin
7. Uniben
Bank Road, University of Benin,
Ugbowo Campus
8. Awka
49, Zik Avenue Awka
9. Onitsha Main
13, Bright Street, Main Market,
Onitsha
10. Onitsha Head Bridge
56, Port Harcourt Road, Onitsha
11. Enugu
1 Garden Avenue, Besides EEDC
Regional Office, Okpara Avenue,
Enugu
12. Abakaliki
10, Old Ogoja Road, Abakaliki
13. Polomall
Shop 56, Polo Park Mall,
Abakaliki Road, Enugu
14. Owerri
81, Okigwe Road, Owerri, Imo State.
15. Aba Market
7, Duru Street, Off Cemetery Road,
Aba
16. Asaba
206, Nnebisi Road, Asaba
South West region
1. Oyo
Oyo/Ogbomoso Road, Oyo Town
2. Agodi Gate
Inaolaji Business Complex, Agodi Gate,
Ibadan
3. UI Road
UI Road, Sayora Building,
Opposite UI 2nd Gate, Ibadan
4. Ibadan Main
UCH-Secretariat Road,
By Total Garden, Ibadan
5. Iwo Road
Baloon House, Iwo Road, Ibadan
6. Iwo Town
147, Ejigbo Road, Araromi - Sabo,
Iwo Town
7. Iyana Church
Ibitola Plaza, Iyana Church, Ibadan,
Oyo State
8. Saki
Beside Saki West Local Government
Secretariat, Sango - Ajegunle Road
Saki, Oyo State
9. New Gbagi
Bashmus and Ayimur Plaza,
Opp Texaco Station, Gbagi, Ibadan
10. Aleshinloye
Eleyele Road, Nigerian Army Housing
Scheme, Ibadan
11. Mokola
18b, Oyo Road, Mokola, Ibadan
12. Gbagi
Aje House Annexe, Opposite Obisesan
Hall, Lebanon Street, Old Gbagi,
Ibadan
13. Abeokuta
2a, Lantoro Road, Isale-Ake, Abeokuta
14. Agbara
Agbara Estate Shopping Mall,
Agbara Industrial Estate, Agbara
15. Challenge
127, Orita Challenge, Ibadan,
Oyo State
16. Sango Otta 2
Km 38, Abeokuta Expressway,
Sango Otta, Ogun State
17. Shagamu
167, Akarigbo Road, Shagamu,
Ogun State
18. Sapon
2a, Lantoro Road, Isale-Ake, Abeokuta
19. Ring Road
1b, Moshood Abiola Road, Ring Road,
Ibadan, Oyo State
20. Sango Otta 1
101, Idi Iroko Otta Road, Sango Otta,
Ogun State
21. Ijebu Ode
58, Ibadan Road, Ijebu-Ode, Ogun
22. Ife
5, Obalufon-Lagere Road,
Lagere Junction, Lle-lfe
23. Ilesha
1a198, Osogbo Road, Ishokun,
Ilesha, Osun State
24. Ilorin
11, Unity Road (Amosu House)
25. Ojatuntun
A171, Abdulazeez Attah Road,
Surulere, Ilorin
26. Kwara Mall
11, Unity Road, Ilorin, Kwara State
27. Ogbomoso
Ilorin-Ogbomoso Road, Sabo Area,
Ogbomoso Town
28. Ado Ekiti
Ado-lyin Express Road, Ado Ekiti,
Ekiti State
29. Ondo
62, Yaba Road, Ondo Town,
Ondo State
30. Akure
GNI Building, Off Old Ado/Owo Road,
Akure
31. Oshogbo
201, Gbogan – Ibadan Road, Osogbo,
Osun State
Stanbic IBTC Bank Branch network
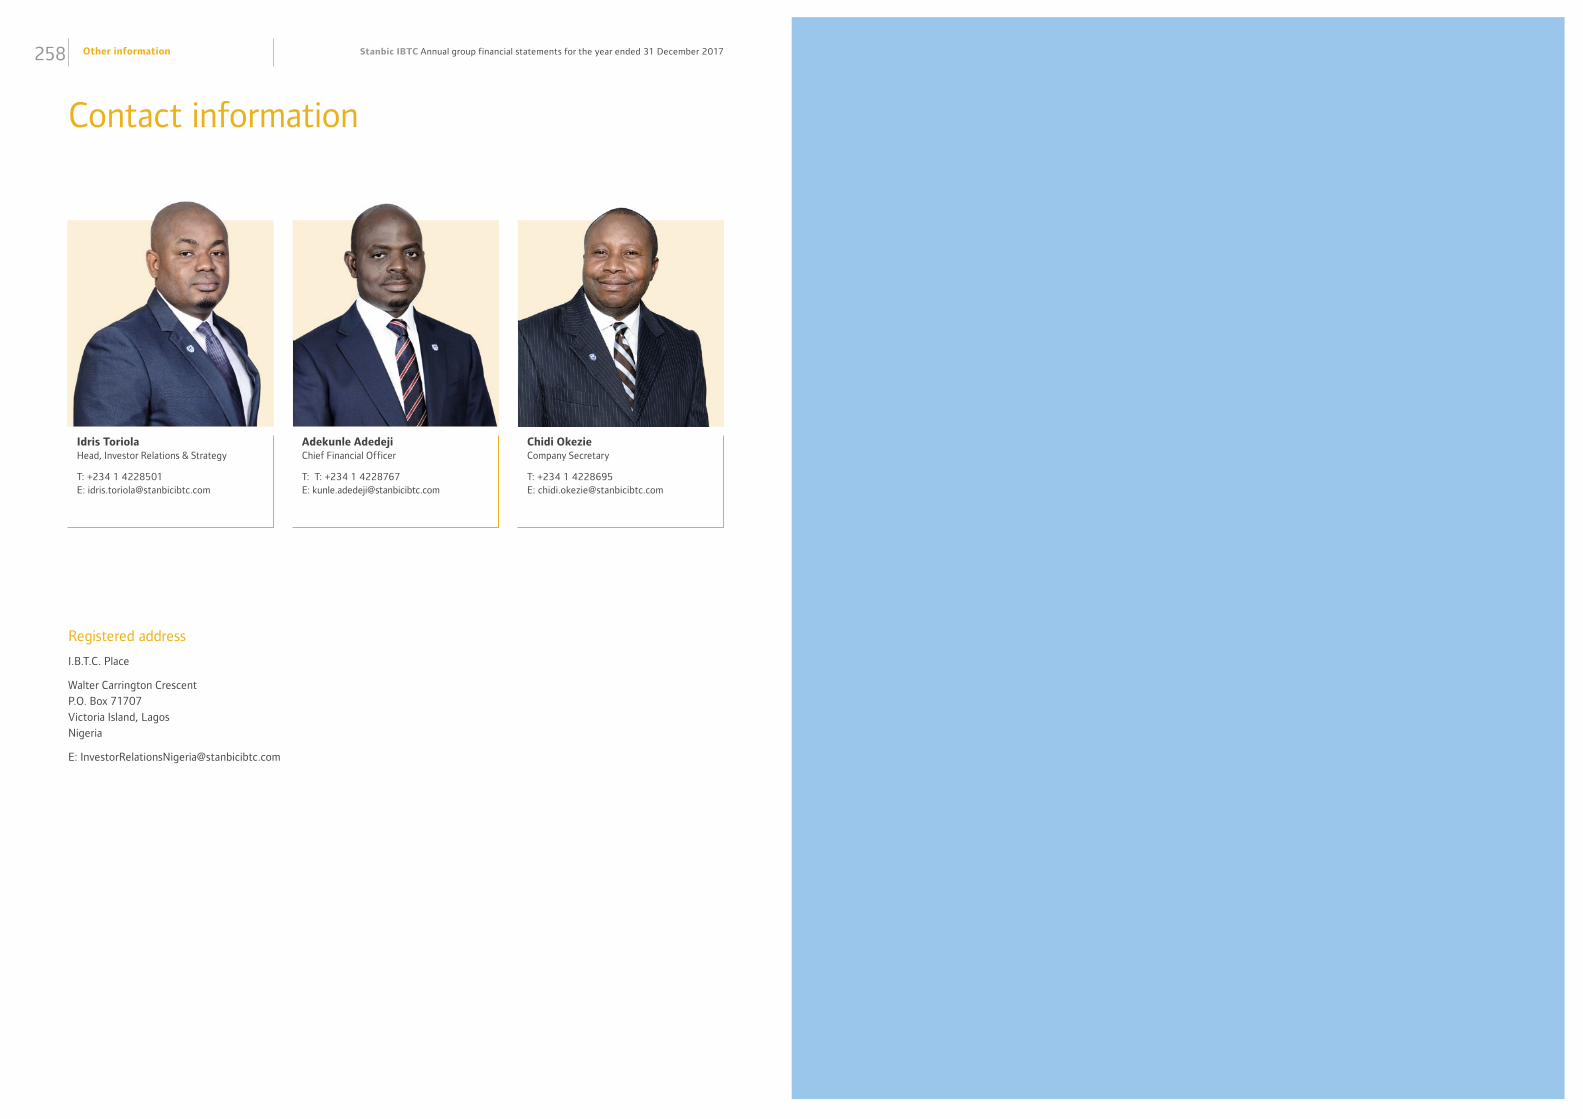
Other information258 Stanbic IBTC Annual group financial statements for the year ended 31 December 2017
Contact information
Registered address
I.B.T.C. Place
Walter Carrington Crescent
P.O. Box 71707
Victoria Island, Lagos
Nigeria
Idris Toriola Head, Investor Relations & Strategy
T: +234 1 4228501 E: [email protected]
Adekunle Adedeji Chief Financial Officer
T: T: +234 1 4228767 E: [email protected]
Chidi Okezie Company Secretary
T: +234 1 4228695 E: [email protected]

Stanbic IBTC Holdings PLC RC1018051
www.stanbicibtc.comDesigned and produced by Creative Interpartners, London Email: [email protected]
Photography: Centaur Photographers