Embed Size (px)
Citation preview

16-1Copyright © 2012 Pearson Prentice Hall. All rights reserved.
C H A P T E R 16The Dynamics of Inflationand Unemployment
Copyright © 2012 Pearson Prentice Hall. All rights reserved.

Copyright © 2012 Pearson Prentice Hall. All rights reserved.
The Dynamics of Inflationand Unemployment
Brock Williams
P R E P A R E D B Y
As the financial crisis spread in 2008, central banks around the world increased the supply of money and liquidity, and governments borrowed extensively and incurred increasing amounts of government debt.
CHAPTER
16
Copyright © 2012 Pearson Prentice Hall. All rights reserved.

16-3Copyright © 2012 Pearson Prentice Hall. All rights reserved.
C H A P T E R 16The Dynamics of Inflationand Unemployment
1
2
How can data on vacancies and unemployment be used to measure shifts in the natural rate?
Shifts in the Natural Rate of Unemployment
Can changes in the way central banks are governed affect inflation expectations?
Increased Political Independence for the Bank of England Lowered Inflation Expectations
What caused a severe hyperinflation to emerge recently in Zimbabwe?
Hyperinflation in Zimbabwe
3
A P P L Y I N G T H E C O N C E P T S

16-4Copyright © 2012 Pearson Prentice Hall. All rights reserved.
C H A P T E R 16The Dynamics of Inflationand Unemployment
● nominal wagesWages expressed in current dollars.
MONEY GROWTH, INFLATION, ANDINTEREST RATES16.1
Inflation in a Steady State
● real wagesWage rates paid to employees adjusted for changes in the price level.
● money illusionConfusion of real and nominal magnitudes.
● expectations of inflationThe beliefs held by the public about the likely path of inflation in the future.
16-5Copyright © 2012 Pearson Prentice Hall. All rights reserved.
C H A P T E R 16The Dynamics of Inflationand Unemployment
Inflation in a Steady State
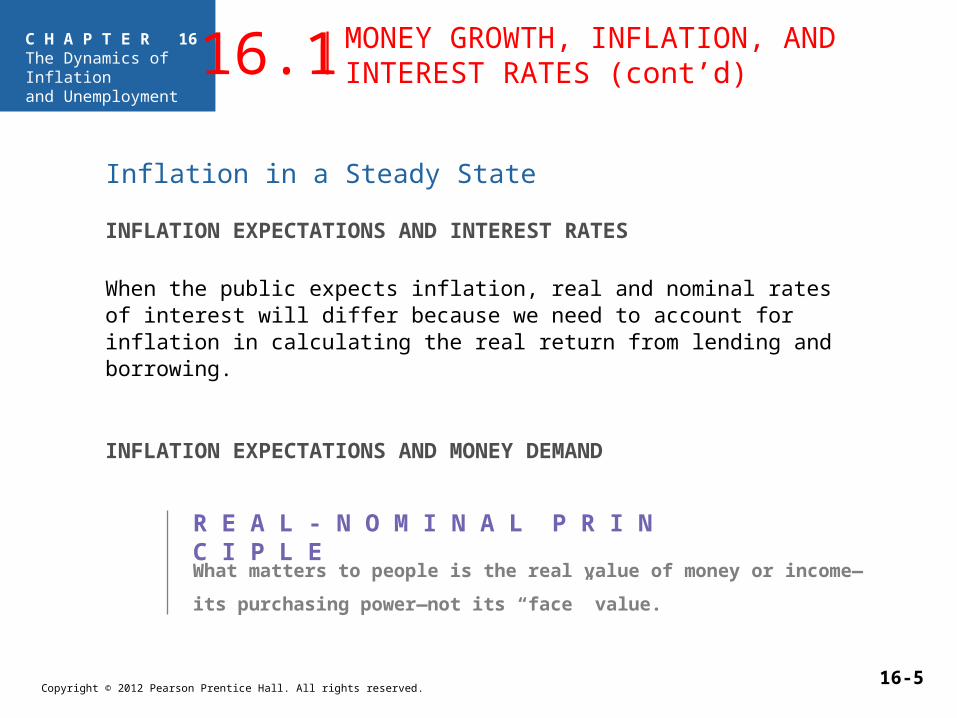
INFLATION EXPECTATIONS AND INTEREST RATES
INFLATION EXPECTATIONS AND MONEY DEMAND
When the public expects inflation, real and nominal rates of interest will differ because we need to account for inflation in calculating the real return from lending and borrowing.
MONEY GROWTH, INFLATION, ANDINTEREST RATES (cont’d)16.1
R E A L - N O M I N A L P R I N C I P L E
What matters to people is the real value of money or income—its purchasing
power—not its “face” value.

16-6Copyright © 2012 Pearson Prentice Hall. All rights reserved.
C H A P T E R 16The Dynamics of Inflationand Unemployment
How Changes in the Growth Rate of Money Affect the Steady State
MONEY GROWTH, INFLATION, ANDINTEREST RATES (cont’d)16.1
16-7Copyright © 2012 Pearson Prentice Hall. All rights reserved.
C H A P T E R 16The Dynamics of Inflationand Unemployment
UNDERSTANDING THE EXPECTATIONS PHILLIPS CURVE: THE RELATIONSHIP BETWEEN UNEMPLOYMENT AND INFLATION
16.2
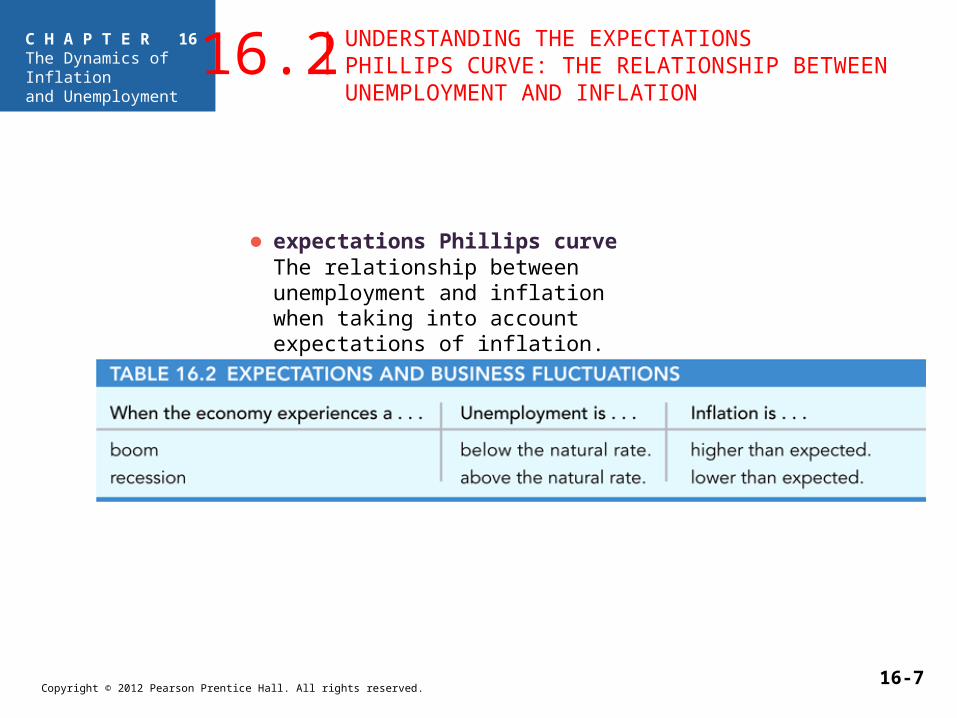
● expectations Phillips curveThe relationship between unemployment and inflation when taking into account expectations of inflation.
16-8Copyright © 2012 Pearson Prentice Hall. All rights reserved.
C H A P T E R 16The Dynamics of Inflationand Unemployment
● rational expectationsThe economic theory that analyzes how the public forms expectations in such a manner that, on average, they forecast the future correctly.
Are the Public’s Expectations About Inflation Rational?
UNDERSTANDING THE EXPECTATIONS PHILLIPS CURVE: THE RELATIONSHIP BETWEEN UNEMPLOYMENT AND INFLATION (cont’d)
16.2

16-9Copyright © 2012 Pearson Prentice Hall. All rights reserved.
C H A P T E R 16The Dynamics of Inflationand Unemployment
U.S. Inflation and Unemployment in the 1980s
FIGURE 16.1The Dynamics of Inflation and Unemployment, 1986–1993
Inflation rose and the unemployment rate fell below the natural rate.
Inflation later fell as unemployment exceeded the natural rate.
UNDERSTANDING THE EXPECTATIONS PHILLIPS CURVE: THE RELATIONSHIP BETWEEN UNEMPLOYMENT AND INFLATION (cont’d)
16.2
16-10Copyright © 2012 Pearson Prentice Hall. All rights reserved.
C H A P T E R 16The Dynamics of Inflationand Unemployment
Shifts in the Natural Rate of Unemployment in the 1990s
What factors can shift the natural rate of unemployment?
• Demographics
• Institutional changes
• The recent history of the economy
• Changes in growth of labor productivity
UNDERSTANDING THE EXPECTATIONS PHILLIPS CURVE: THE RELATIONSHIP BETWEEN UNEMPLOYMENT AND INFLATION (cont’d)
16.2

16-11Copyright © 2012 Pearson Prentice Hall. All rights reserved.
C H A P T E R 16The Dynamics of Inflationand Unemployment
•The natural rate of unemployment changes over time.
•Policy makers need to know what the natural rate is to avoid unnecessary unemployment and inflation.
•One way to estimate is to look at the Beveridge Curve, the relationship between job vacancies and the unemployment rate.
•Economist William Dickens tracked the natural rate in recent decades:
Five percent in the mid 1960s
Peaked near seven percent in the late 1970s and early 1980s
Falling through the 1990s and reached five percent in 2000
SHIFTS IN THE NATURAL RATE OF UNEMPLOYMENTAPPLYING THE CONCEPTS #1: How can data on vacancies and
unemployment be used to measure shifts in the natural rate?
A P P L I C A T I O N 1
16-12Copyright © 2012 Pearson Prentice Hall. All rights reserved.
C H A P T E R 16The Dynamics of Inflationand Unemployment
HOW THE CREDIBILITY OF A NATION’SCENTRAL BANK AFFECTS INFLATION16.3
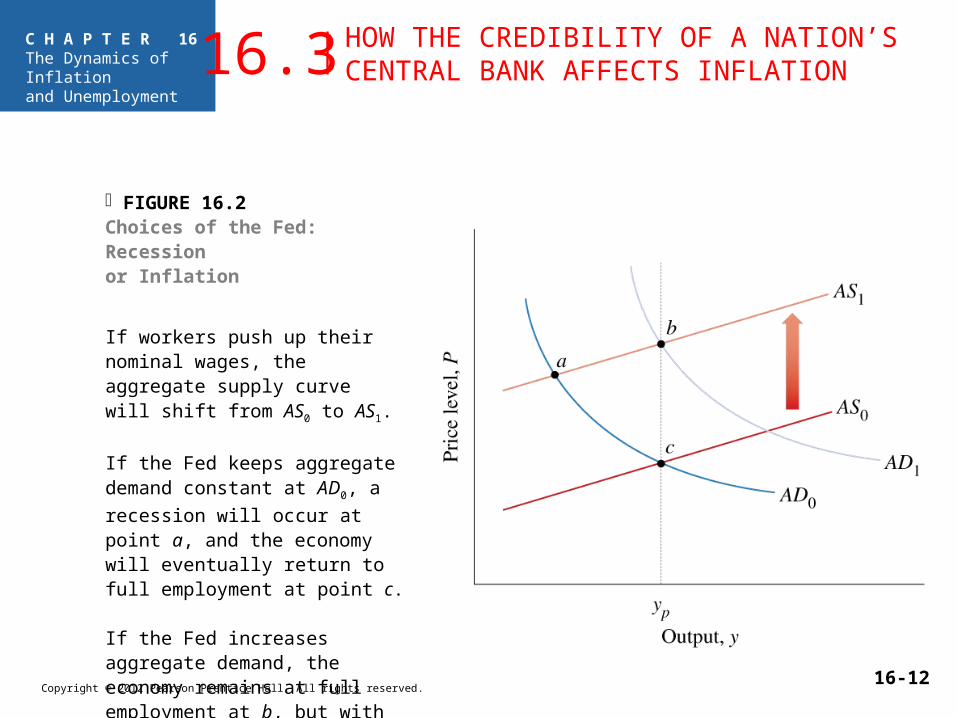
FIGURE 16.2Choices of the Fed: Recession or Inflation
If workers push up their nominal wages, the aggregate supply curve will shift from AS0 to AS1.
If the Fed keeps aggregate demand constant at AD0, a recession will
occur at point a, and the economy will eventually return to full employment at point c.
If the Fed increases aggregate demand, the economy remains at full employment at b, but with a higher price level.

16-13Copyright © 2012 Pearson Prentice Hall. All rights reserved.
C H A P T E R 16The Dynamics of Inflationand Unemployment
FIGURE 16.3How Central Bank Independence Affects Inflation
Countries in which central banks are more independent from the rest of the government have, on average, lower inflation rates.
HOW THE CREDIBILITY OF A NATION’SCENTRAL BANK AFFECTS INFLATION (cont’d)16.3
16-14Copyright © 2012 Pearson Prentice Hall. All rights reserved.
C H A P T E R 16The Dynamics of Inflationand Unemployment
In 1997, a major change in monetary policy allowed the Bank of England to be free to pursue its policy goals without direct political control.
An economist studied how the British bond market reacted to the policy change by comparing the interest rates changes on two types of long-term bonds: bonds that are automatically adjusted (or indexed) for inflation and bonds that are not.
• The difference between the two interest rates primarily reflects expectations of inflation.
• If the gap narrowed following the policy announcement, this would be evidence that the new policy reduced expectations of inflation.
• If it did not, the announced policy would have had no effect on inflation expectations.
Result: After the announcement, the gap narrowed.
Conclusion: The announcement did cause expectations about inflation to fall by about half a percentage.
INCREASED POLITICAL INDEPENDENCE FOR THE BANK OF ENGLAND LOWERED INFLATION EXPECTATIONS
APPLYING THE CONCEPTS #2: Can changes in the way central banks are governed affect inflation expectations?
A P P L I C A T I O N 2
16-15Copyright © 2012 Pearson Prentice Hall. All rights reserved.
C H A P T E R 16The Dynamics of Inflationand Unemployment
INFLATION AND THE VELOCITY OF MONEY16.4
● velocity of moneyThe rate at which money turns over during the year. It is calculated as nominal GDP divided by the money supply.

16-16Copyright © 2012 Pearson Prentice Hall. All rights reserved.
C H A P T E R 16The Dynamics of Inflationand Unemployment
or
● quantity equationThe equation that links money, velocity, prices, and real output. In symbols, we have M × V = P × y.
INFLATION AND THE VELOCITY OF MONEY(cont’d)16.4

16-17Copyright © 2012 Pearson Prentice Hall. All rights reserved.
C H A P T E R 16The Dynamics of Inflationand Unemployment
FIGURE 16.4The Velocity of M2, 1959–2009
INFLATION AND THE VELOCITY OF MONEY(cont’d)16.4

16-18Copyright © 2012 Pearson Prentice Hall. All rights reserved.
C H A P T E R 16The Dynamics of Inflationand Unemployment
growth rate of money + growth rate of velocity
= growth rate of prices + growth rate of real output
● growth version of the quantity equationAn equation that links the growth rates of money, velocity, prices, and real output.
INFLATION AND THE VELOCITY OF MONEY(cont’d)16.4

16-19Copyright © 2012 Pearson Prentice Hall. All rights reserved.
C H A P T E R 16The Dynamics of Inflationand Unemployment
HYPERINFLATION16.5● hyperinflation
An inflation rate exceeding 50 percent per month.

16-20Copyright © 2012 Pearson Prentice Hall. All rights reserved.
C H A P T E R 16The Dynamics of Inflationand Unemployment
● seignorageRevenue raised from money creation.
How Budget Deficits Lead to Hyperinflation
government deficit = new borrowing from the public + new money created
● monetaristsEconomists who emphasize the role that the supply of money plays in determining nominal income and inflation.
HYPERINFLATION (cont’d)16.5

16-21Copyright © 2012 Pearson Prentice Hall. All rights reserved.
C H A P T E R 16The Dynamics of Inflationand Unemployment
In June 2008, the consumer price index in Zimbabwe was 8 million percent higher than it was a year before. A $12 lunch in local currency cost 1.1 trillion Zimbabwe dollars.
What caused Zimbabwe to suffer from this crippling hyperinflation?
The simple answer is that the political and economic system began to self-destruct.
HYPERINFLATION IN ZIMBABWEAPPLYING THE CONCEPTS #3: What caused a
severe hyperinflation to emerge recently in Zimbabwe?
Zimbabwe has been ruled since 1980 by the dictator Robert Mugabe, whose policies to intervene militarily in African conflicts and expropriate white-owned farms had the cumulative effect of crippling the economy.
• As the economy deteriorated, tax revenues declined.
• Mugabe and his central bank simply resorted to printing new banknotes.
Result: Hyperinflation and further deterioration of the economy as the financial system collapsed.
A P P L I C A T I O N 3

16-22Copyright © 2012 Pearson Prentice Hall. All rights reserved.
C H A P T E R 16The Dynamics of Inflationand Unemployment
expectations of inflation
expectations Phillips curve
growth version of the quantity equation
hyperinflation
monetarists
money illusion
nominal wages
quantity equation
rational expectations
real wages
seignorage
velocity of money
K E Y T E R M S