Embed Size (px)
Citation preview
INDIAN PEDIATRICS 1 SEPTEMBER 26, 2017 [E-PUB AHEAD OF PRINT]
Research Paper
Reference Centile Curves for Body Fat Percentage, Fat-free Mass, Muscle Mass and Bone
Mass Measured by Bioelectrical Impedance in Asian Indian Children and Adolescents
SHASHI CHIPLONKAR, NEHA KAJALE, VEENA EKBOTE, RUBINA MANDLIK, LAVANYA
PARTHASARATHY, *ASHWIN BORADE, #PINAL PATEL , #PRERNA PATEL ,VAMAN KHADILKAR
AND ANURADHA KHADILKAR
From Departments of Pediatrics, Hirabai Cowasji Jehangir Medical Research Institute, Jehangir
Hospital, Pune, Maharashtra and *Inamdar Hospitals, Pune, Maharashtra; and #Department of
Biotechnology, Hemchandracharya North Gujarat University, Patan, Gujarat, India.
Correspondence to: Dr Anuradha Khadilkar, Deputy Director, Hirabai Cowasji Jehangir Medical
Research Institute, Jehangir Hospital, 32, Sassoon Road, Pune, Maharashtra, 411001, India.
Email: [email protected]
PII: S097475591600091
Note: These early-online versions of the article are manuscripts that have been accepted for
publication. These have been posted to the website for making it available to readers, ahead of its
publication in print. This version will undergo copy-editing, typesetting, and proofreading, before
final publication; and the text may undergo changes in the final version.

CHIPLONKAR et al. REFERENCE CURVE FOR BODY COMPOSITION
INDIAN PEDIATRICS 2 SEPTEMBER 26, 2017 [E-PUB AHEAD OF PRINT]
ABSTRACT Objectives: To create gender-specific percentile curves for percent body fat (%BF) by Bio electrical
Impedance Analysis ( BIA) for screening adiposity and risk of hypertension in Indian children and
generate reference curves for percent fat-free mass (%FFM), muscle mass (%LM) and bone mineral
content (BMC) by using bioelectrical impedance.
Design: Multicenter cross-sectional study.
Setting: Private schools from major Indian cities from 5 regions of India.
Participants: A random sample of 3850 healthy school children (2067 boys) (5-17 yr) from private
schools in five major Indian cities.
Methods: Anthropometry, blood pressure (BP) and body composition were measured by bioelectrical
impedance. Reference curves were generated for %BF, %FFM, %LM and BMC using the LMS
method.
Main outcome measures: %BF, %FFM, %LM, BMC and BP
Results: Median %BF increased by 6% from 5 to 13 years of age and declined (around 2%) up to 17
years in boys. In girls, %BF increased by 8% from 5 to 14 years and thereafter declined by 3%. Based
upon the risk of hypertension, the new cut-offs of 75th and 85th percentile of %BF were proposed for
detecting over fatness and excess fatness in children. Median %FFM was 90% at 5 yrs and decreased
till 12 years, and then showed a slight increase to 84% at 17 yrs in boys. In girls, it was 86% at 5 yr
and decreased till 15 yrs, and plateaued at 71.8% at 17 yrs.
Conclusions: Reference curves for percent body fat for Indian children would be useful to screen
children for health risk in clinical set up.
INTRODUCTION Obesity has become a major health concern in childhood as it poses a beginning of cardio-metabolic
risk in later life. Recent studies have also demonstrated that not only excess fat mass [1] but lean mass
and muscle fitness [2] are also associated with health risk. Assessment of body composition is an
appropriate method to judge adiposity and lean mass, and can help in early detection of cardio
metabolic risk.
Bioelectrical impedance (BIA) is a valuable alternative to dual energy X-ray absortiometry
(DXA) in assessing body composition as it is portable and convenient to use in clinical setting and
field surveys. However, a local reference database is essential to assess the body composition status of
children [3]. For the DXA, we have generated such a reference database for Indian children and
adolescents [4-6]. However, lack of Indian reference values for BIA reduces its utility to evaluate
nutritional status, and associated health risk in Indian children.
Thus, the objectives of the present study were: (i) to create gender-specific percentile curves
for percent body fat (%BF) by BIA for screening adiposity in Indian children, (ii) to explore the
CHIPLONKAR et al. REFERENCE CURVE FOR BODY COMPOSITION
INDIAN PEDIATRICS 3 SEPTEMBER 26, 2017 [E-PUB AHEAD OF PRINT]
possible cut-offs of reference curves for risk of hypertension, and (iii) to generate reference curves for
percent fat free mass (%FFM), muscle mass (%LM) and bone mineral content (BMC) by BIA.
METHODS
In all, data of 3832 school children (2054 boys) aged 5-17 years collected in previous cross-sectional
studies were analyzed to generate age- and gender-specific reference percentile curves for total body
fat percentage by BIA. It was a multicenter study conducted in 5 major cities (Delhi, Chennai, Pune,
Kolkata and Raipur) from 5 states of India [7] along with one center in Gujarat (Ahmadabad) during
2011 to 2014. Detailed methodology has been previously described [7]. From a list of schools catering
to children of socio-economically well-off families from each city, six schools were randomly
selected and approached for permission to carry out measurements. All 2- to 17-year-old children
from participating schools whose parents consented to measurements were included [7]. The studies
were approved by the Ethics Committee of the Jehangir Clinical Development Pvt. Ltd., Pune, which
is a recognised Institute by Department of Scientific and Industrial research (DSIR), Government of
India.
Data were collected by the same team at each site; equipments were calibrated daily. The
mean inter- and intra-observer coefficients of variation were <1% for weight, height and body
composition measurements.
Height-for-age (HAZ), weight-for-age (WAZ) and BMI-for-age (BAZ) Z-scores were
computed as deviations from the median [8]. Adult equivalent BMI Z scores were also computed
using adult equivalent values for Asians [9] as normal weight (BMI at age 18 ≤23 kg/m2), overweight
(BMI 23 to 28 kg/m2) and obese (BMI > 28 kg/m2).
Body composition was assessed using Bioelectrical Impedance Analyzer (BIA), (Tanita
Model BC-420MA) after a minimum of 3 hours of fasting, and voiding before measurements (10 am
onwards) [10]. This analyzer measures body composition using a constant current source with a high
frequency current (50kHz, 90μA). The 8 electrodes are positioned so that electric current is supplied
from the electrodes on the tips of the toes of both feet, and voltage is measured on the heel of both
feet. BIA measures body composition as fat%, fat mass, fat free mass, total body water, bone-free lean
tissue mass (LTM), bone mineral amount included in the entire bone (bone mass) by measuring
bioelectrical impedance in the body in standing position of subject. Measurements were tested for
test-retest reliability on pilot sample of ten subjects separately by measuring them on BIA at two
different time points. Reliability coefficient was significant for the body fat percent, fat mass, fat-free
mass and muscle mass (intra class correlation coefficient = 0.96, P=0.0001). Clinical examinations
were carried out by pediatricians to assess health status of children to ensure that only apparently
healthy children were included in the study.
Statistical analysis: All statistical analyses were performed using SPSS software (version 16.0. 2007).
All results were expressed as mean (SD) for comparability with other studies. Smoothed gender-
CHIPLONKAR et al. REFERENCE CURVE FOR BODY COMPOSITION
INDIAN PEDIATRICS 4 SEPTEMBER 26, 2017 [E-PUB AHEAD OF PRINT]
specific reference plots showing 2nd, 9th, 25th, 50th, 75th, 85th and 95th percentiles of %BF and
FFM were derived using LMS method (LMS chart-maker Pro version 2.4, 2008; by Pan and Cole),
which constructs reference percentiles adjusted for skewness [11]. Each variable of interest was
summarized by three smooth curves plotted against age, representing the median (M), coefficient of
variation (S) and skewness (L) of the measurement distribution [12]. Models were checked for
goodness off fit using the detrended Q-Q plot, Q Tests and worm plots [13]. The LMS method was
found to be appropriate to use for this data as the measure of skewness of the data was 1.1 with a
standard error of 0.03. The possible cut-offs of derived %BF percentiles were tested for their efficacy
against the BP values by classifying the children into three groups: normal BP (SBP/DBP <90th
percentile), pre-hypertension (SBP/DBP 90th-95th percentile), and hypertension (SBP/DBP >95th
percentile) [14]. Pearson’s correlation coefficient was used to assess relationship of BP and various
body composition parameters, i.e. BMI, FMI, LMI, FFMI and %BF.
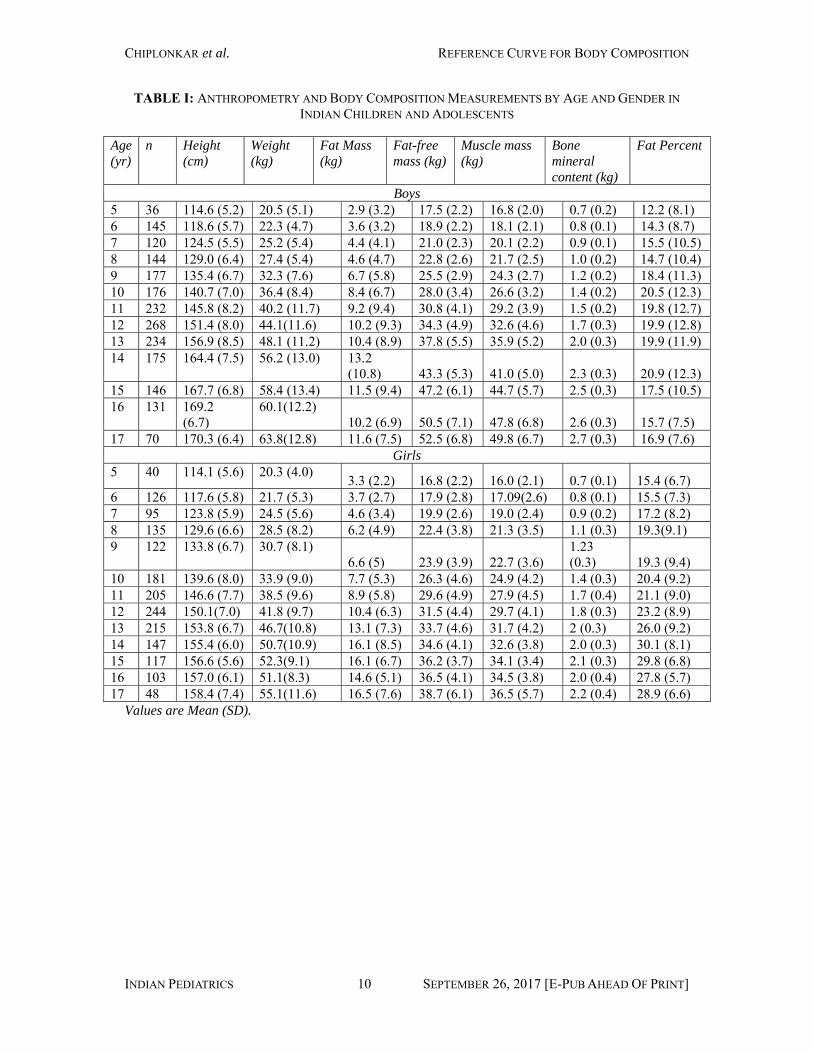
RESULTS Table I illustrates anthropometric and body composition parameters for both the genders from 5 to 17
years of age. Mean (SD) height-for-age Z-scores in boys (girls) were 0.11 (1.0) (0.10 (1.0)); weight
for age Z-scores were 0.25 (1.0) (0.12 (1.1)) and BMI for age Z-scores were 0.21 (0.98) (0.09 (1.1)).
Majority of the children (95.5%) had normal Z-scores for height, weight and BMI with reference to
contemporary Indian growth references [8]. When compared with adult-equivalent cut-offs of BMI for Asians corresponding to 23 and 28
kg/m2 [9], 65.2% boys (86.9% girls) had normal BMI, 23.3% boys (11.1% girls) had BMI >23 kg/m2
adult cut-off and 11.5% boys (2% girls) had >28 kg/m2 adult cut-off.
Mean body fat percent in boys and girls increased gradually till 14 years of age and then
showed a decline up to 17 years; though the decline was small and mean fat percent was higher in
girls than boys (P <0.05). Mean muscle mass and fat-free mass also increased with age in both boys
and girls though boys had a significantly higher muscle mass than girls after 11 years of age (P<0.05).
Bone mass of boys and girls increased with age, and after 13 years of age, bone mass of girls showed
a plateau while boys showed increase till 17 years.
BMI showed a significant correlation with %BF (r=0.87, P <0.01.) Considering the adult
equivalent Asian BMI cut-offs of obesity and adiposity, 90.8% of boys and 91.8% of girls with high
adiposity were correctly identified by BMI (sensitivity or true-positive rate), and 91.7% of boys and
82.2% of girls without high adiposity were also correctly classified (specificity or true-negative rate).
Among those adolescents considered as overweight or obese by BMI cut-offs, only 69.3% of girls and
85.0% of boys had excess adiposity (the predictive value).
With advancing age, SBP and DBP increased slowly; the mean blood pressure was within
reference range [14] in 87% boys and 90% girls. BMI showed a significant correlation with SBP (r=
0.67, P<0.01) and DBP (r= 0.54, P<0.01) A positive significant correlation was observed between
CHIPLONKAR et al. REFERENCE CURVE FOR BODY COMPOSITION
INDIAN PEDIATRICS 5 SEPTEMBER 26, 2017 [E-PUB AHEAD OF PRINT]
percent body fat with SBP (r= 0.53, P<0.01) and DBP (r= 0.44, P< 0.01). According to hypertension
cut-offs, 41.1% overweight or obese boys and 30.6% girls showed high blood pressure, whereas with
excess fatness 45% boys and 36.4% girls were having hypertension. Around 4% to 6% children and
adolescents were misclassified as hypertensive with BMI cut-offs than the BIA cut-offs as also with
the proposed body fatness cut-offs.
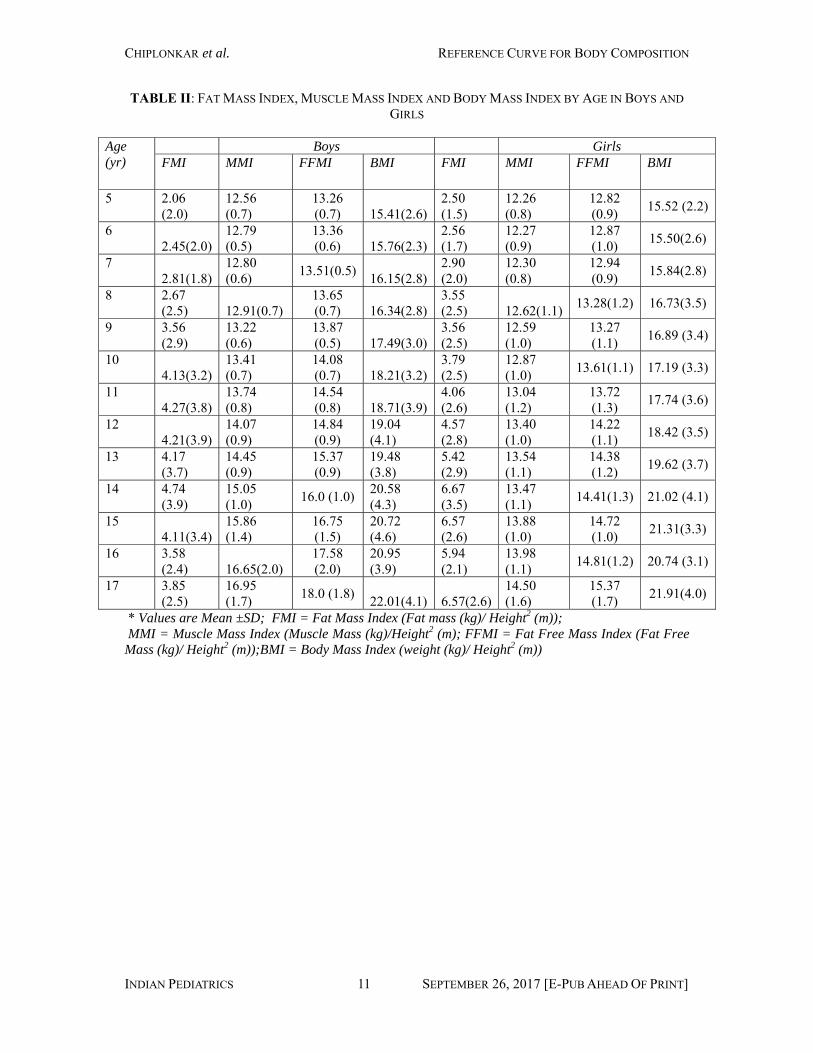
To examine the relative fatness with height, indices of Fat mass, muscle mass and body mass
were computed (Table II). In boys with increasing age, average increase in FMI and BMI was around
3% whereas increase in Muscle mass index (MMI ) was 7%. In girls, BMI showed a similar rate of
increase of 3% with age but average increase in FMI was 9% and in MMI 1.4%. The correlations of
SBP with FMI, MMI, and BMI (r= 0.57-0.69, P< 0.01) evenafter adjusting for age in both boys and
girls.
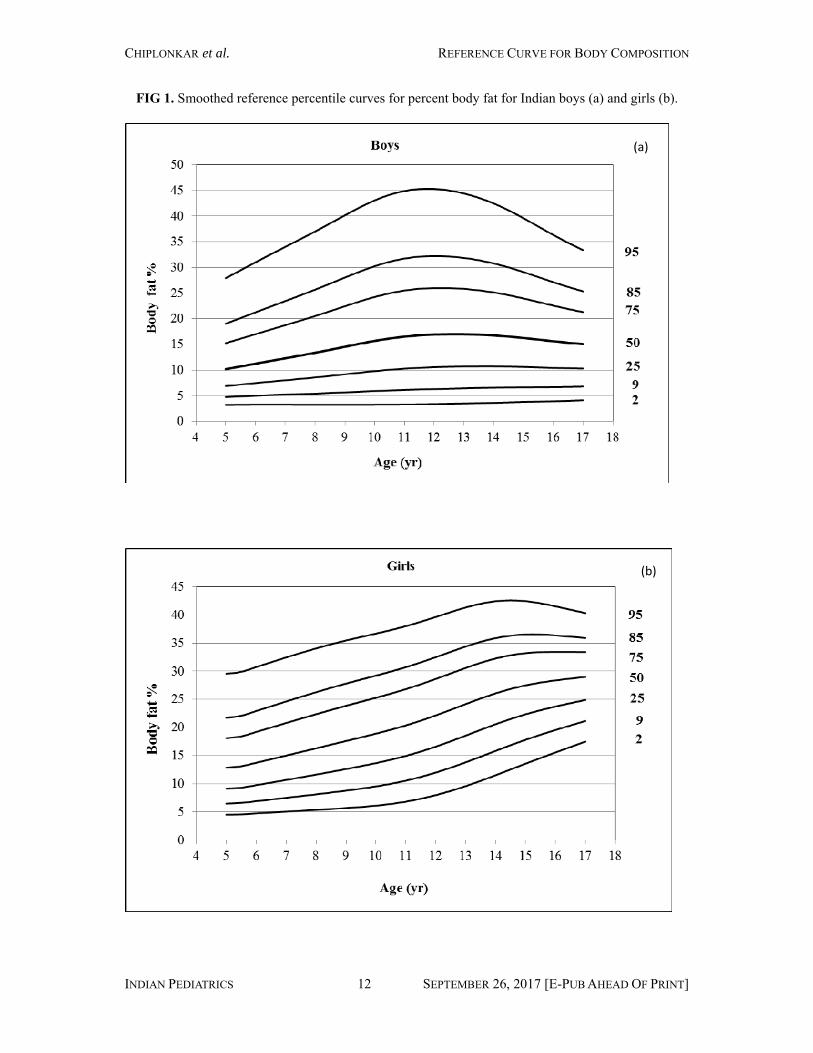
The reference percentile curves generated for %BF by BIA are illustrated in Fig. 1a (boys)
and Fig. 1b (girls). A significant gender difference was seen in the shape of fat percentile curves.
Lower percentiles of boys were flatter than girls and around 10 years of age, body fat% showed
higher increase in girls than boys. Median fat% percentile of boys was also lower than the median
percentile of girls. Median fat% of boys declined after 13 years of age while for girls there was a
steady increase with age. Median fat percent in boys showed an average increase of 6% from 5 to 13
years of age, and then a decline of around 2% up to 17 years of age. However, median fat% in girls
increased by 8% from 5 to 14 yr, and by 3% thereafter up to 17 years of age.
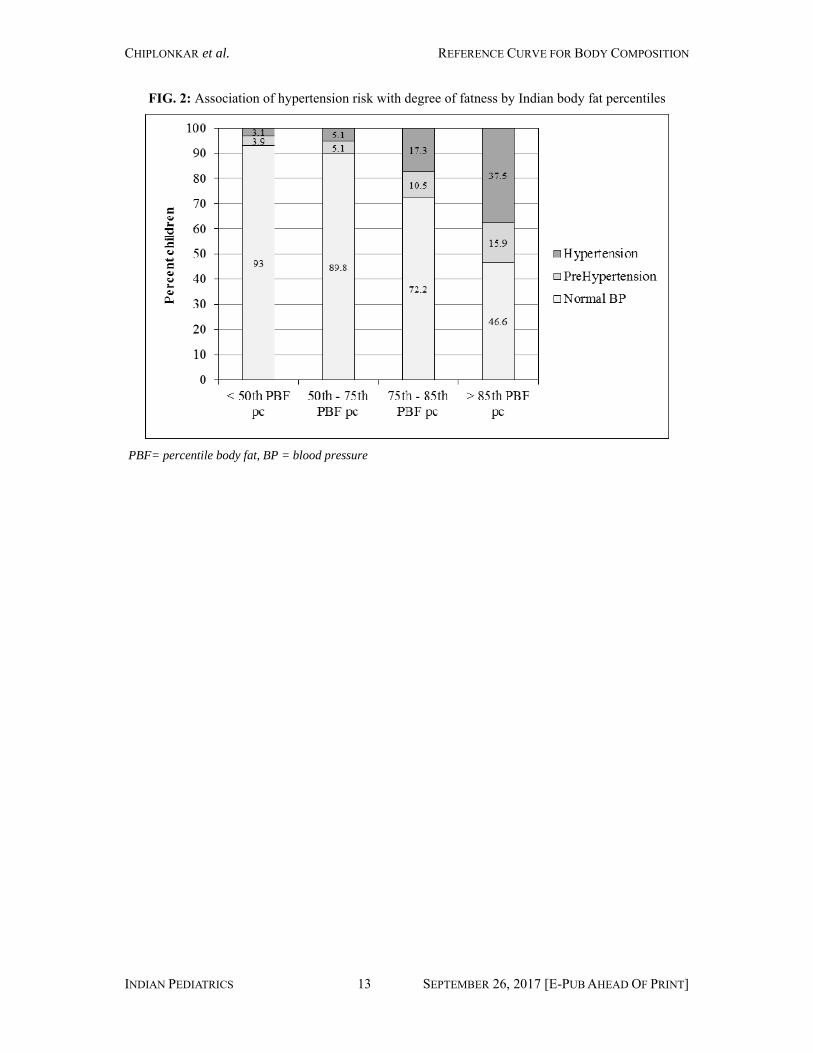
To explore the association of over fatness and obesity with the risk of hypertension, the
percentages of children in the hypertensive or pre-hypertensive range or with BP <90th percentile
wereclassified in successive fat percentile categories. It was observed that %BF percentile groups; i.e.
<50th, 50th-75th, 75th -85th, and >85th reference percentile, exhibited a significant difference in
prevalence of hypertension in various percentile groups (P<0.01). Up to the 75th fat percentile, the
percent children with hypertension was relatively small which increased in the later %BF percentile
groups (P<0.05). Percentage of children with pre-hypertension also increased from the 75th percentile
(P<0.05). Thus, the75th and 85th reference percentiles may reveal the risk of hypertension (Fig. 2).
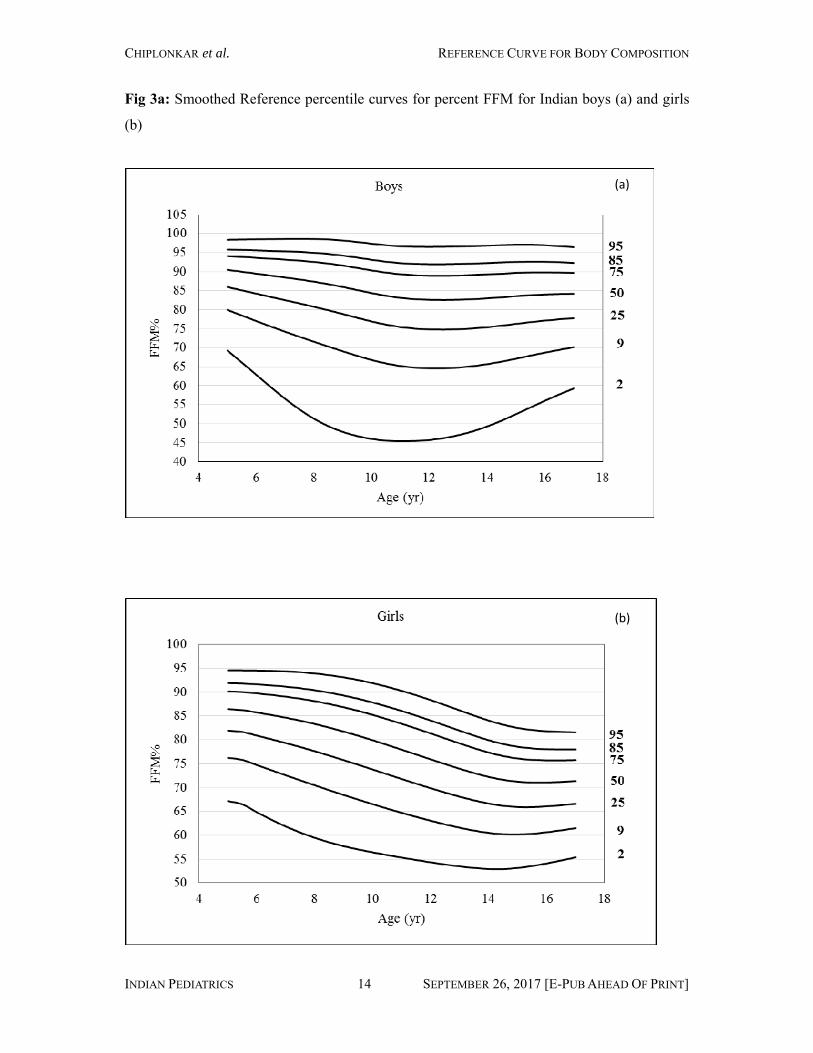
Reference percentiles for %FFM by age and gender are provided in Fig. 3a and 3b
respectively. Median percentile of %FFM was 90% at 5 years of age, and it decreased gradually to
82.5% by 12 years of age in boys, after which it increased gradually to 84% at the age of 17 yr. In
girls, the 50th percentile of %FFM was lower (86% at 5 yr of age) than boys and it decreased to 71%
by 15 years of age and showed a plateau till 17 years of age.
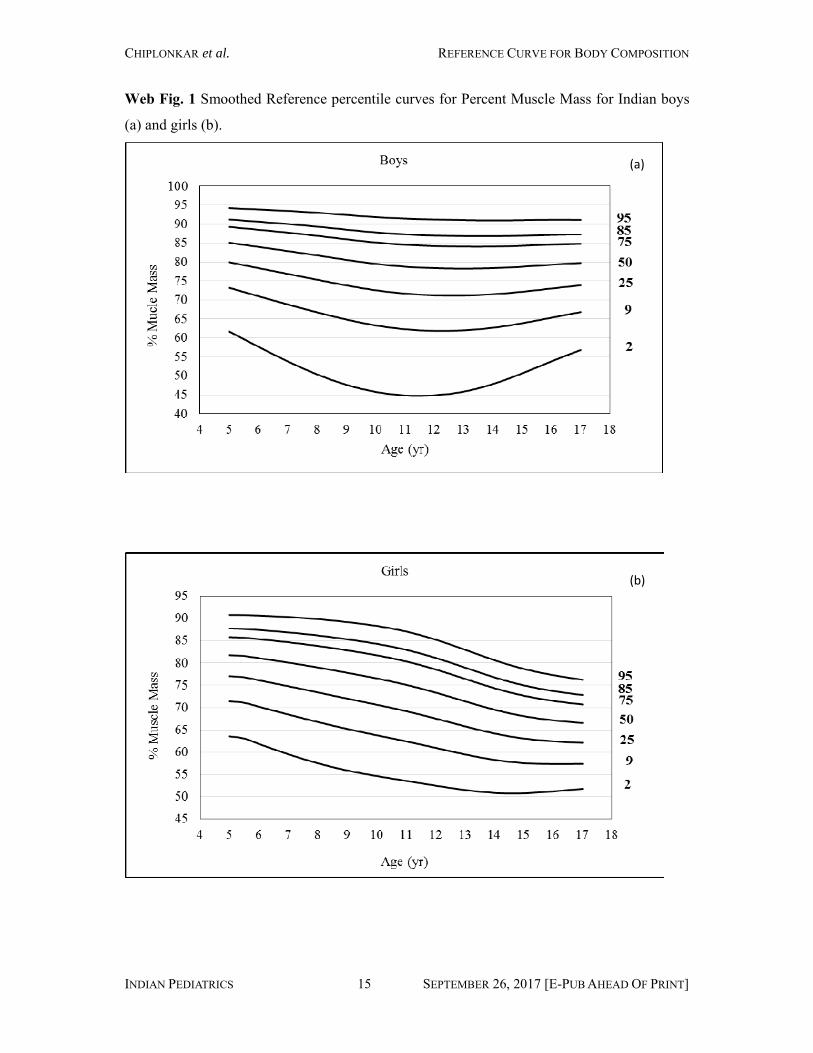
WebFig.1and b represent reference curves for percent muscle mass in boys and girls,
respectively. In boys, the lower percentiles (2nd and 9th) exhibit a dip between 7 to 14 years of age
CHIPLONKAR et al. REFERENCE CURVE FOR BODY COMPOSITION
INDIAN PEDIATRICS 6 SEPTEMBER 26, 2017 [E-PUB AHEAD OF PRINT]
and then show a small increase till 17 years; while, higher percentiles are flat and almost parallel to
the horizontal axis. In girls, average decrease of 0.8% was seen in median %lean mass with increasing
age.
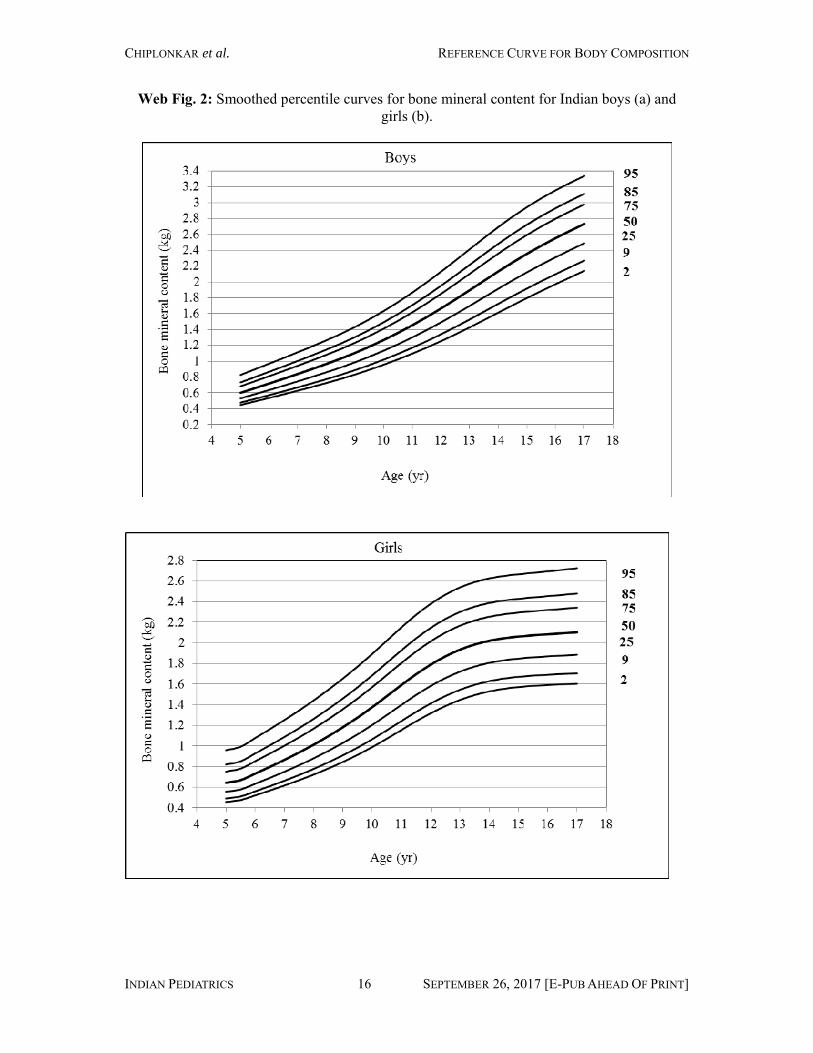
Reference curves for bone mineral content by BIA for Indian boys and girls showed
increasing trend with age till 17 yr in boys (Web Fig. 2a) and till 15 yr in girls (Web Fig. 2 b). In
boys, 50th percentile of BMC increased rapidly up to 13 yr and then gradually till 17 yr of age. In
girls, median percentile of BMC showed an increase up to 11 yr of age after which the curve was
flatter till 17 yr of age.
DISCUSSION The present study describes age-and gender-specific reference curves for body fat percentage
measured by BIA (BC-420MA) for children and adolescents using a large sample representing
various regions of India. The possible cut-offs of 75th and 85th percentile have been suggested based
on the risk of hypertension for defining over fat and excess fat, respectively. Our study also provides
reference percentiles of %FFM, %LM and BMC by age and gender.
The present fat mass percentiles are device- and country specific, and may not be applicable
to other BIA devices. Another limitation of the study is that the cut-offs for %BF and various body
composition parameters could not be assessed with metabolic markers. Unlike what is known about
BMI and Waist Circumference [15], there are no meaningful cut-off values established to indicate
cardiovascular and metabolic risk. We used hypertension as a marker for health risk and proposed the
‘excess fat’ cut-offs. Our results showed a better correlation of BMI with blood pressure than %BF.
This may be due to use of adult equivalent Asian BMI cut-offs over IOTF or other cut-offs. However,
misclassification of hypertension risk was more with BMI cut-offs than proposed excess fatness cut-
offs. These results suggest the utility of body fat assessment in evaluating possible health risk in
youth. Results also indicate the need for future research to establish Indian population-specific
prediction equations for BIA estimates of total body water and fat mass.
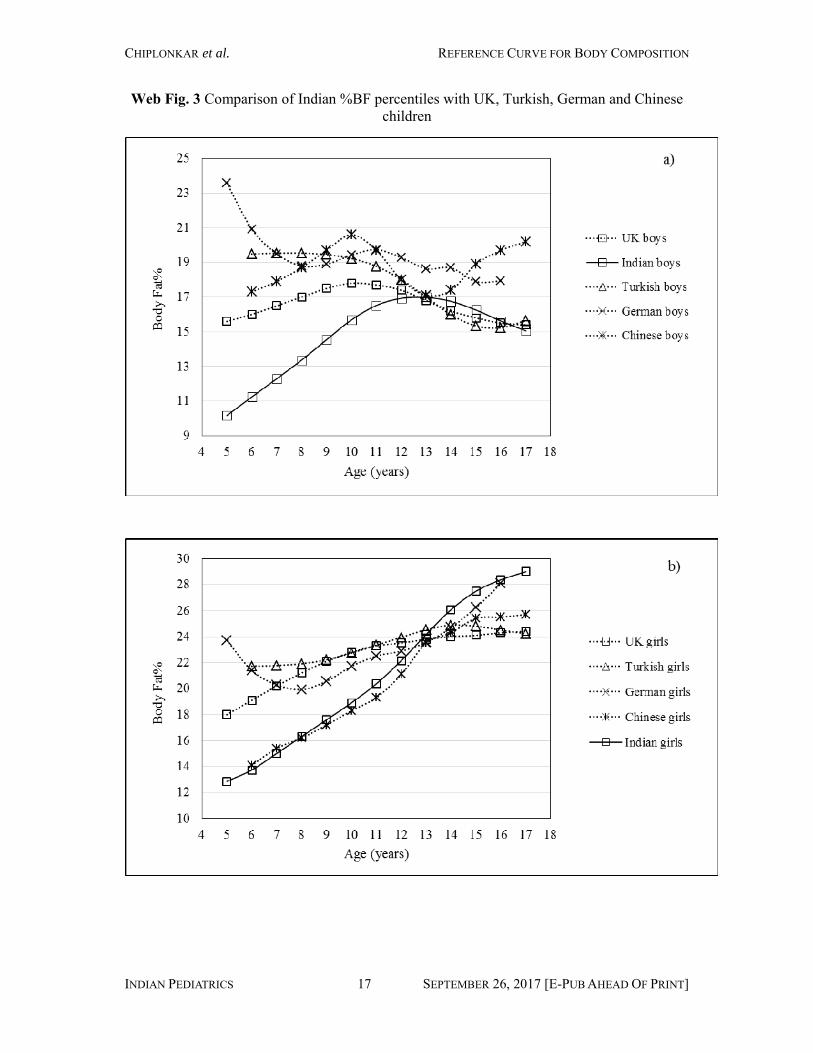
When compared with other BIA fat percentile data, median fat percentage of Indian boys was
lower than the UK, Turkish, German and Chinese boys till the age of 12 years, and then it overlapped
with the UK and Turkish boys but remained lower than that of Chinese and German boys [16-19]
(Web Fig. 3a). Indian and Chinese girls’ median fat percentage was similar with both showing a
steady rise with age. Till the age of 13 years, Indian and Chinese median curves were lower than UK,
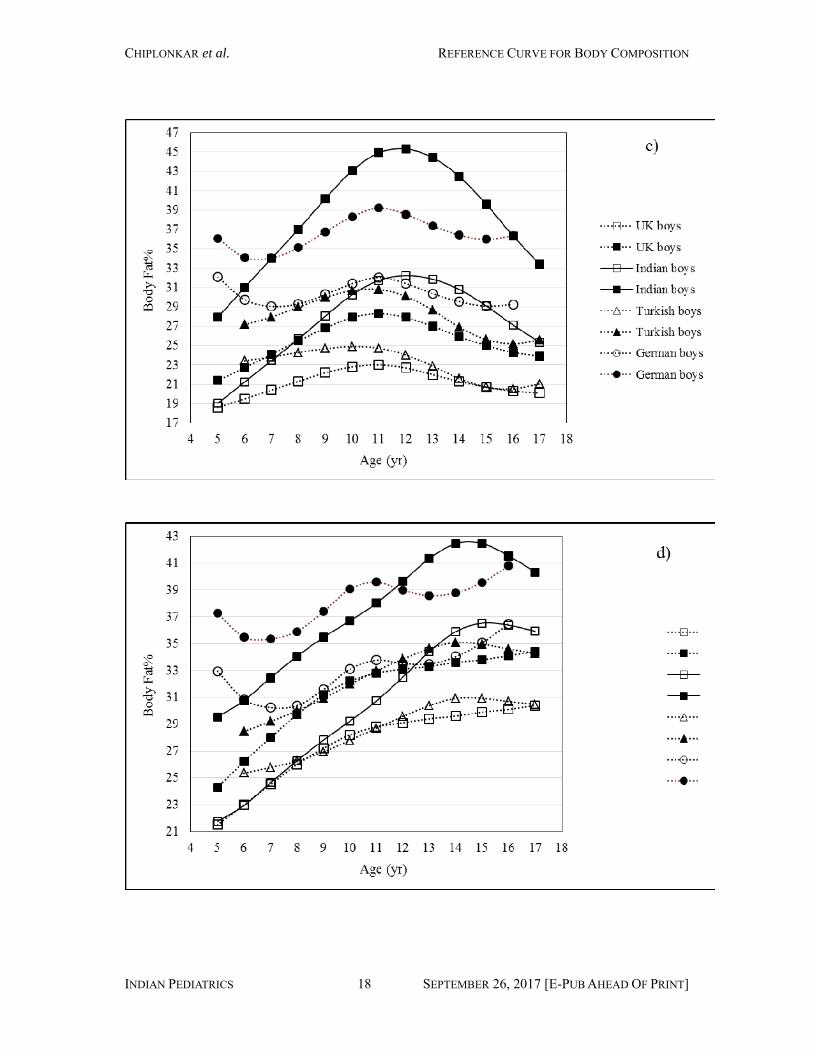
German and Turkish girls and were higher thereafter (Web Fig. 3b). The 85th and 95th %BF
percentiles of Indian boys and girls were higher than that of the UK, German and Turkish children
(Web Fig. 3c and 3d). Thus, the shape of the Indian fat percentile curves was different, especially
during pubertal years, than the UK standards and other population based studies. Therefore, these
western reference standards may not assess fatness uniformly over the entire childhood age-range for
children of Asian Indian origin. Though some part of these variations may be attributable to the
CHIPLONKAR et al. REFERENCE CURVE FOR BODY COMPOSITION
INDIAN PEDIATRICS 7 SEPTEMBER 26, 2017 [E-PUB AHEAD OF PRINT]
differences in the model and make of BIA instruments [19], the reference curves derived in this study
from Indian data may be more appropriate for assessing fatness in Asian Indian children and
adolescents.
Percentiles for fat free mass by BIA in adults have been reported [20]. Though %FFM
percentiles in pediatric age range have been recently reported in UK population [21], such data are not
available for Asian populations. The 50th percentile of UK boys was flat across the age range which
is in agreement with our data. For UK girls, the 50th percentile of %FFM was lower compared with
boys and declined with age until around 11 years of age (the mean age at which puberty commences);
it then continued to decrease at a slower rate up to age 17 years. Indian girls in the present study also
showed a similar decline in % FFM with age; however, the age of decline and magnitude of %FFM
are lower in our data than in the UK girls and boys.
In summary, suggested reference curves for percent body fat, fat free mass, muscle mass and
bone mineral content by BIA for Asian Indian children may be useful to assess body composition in
children in clinical and community set up. A cut off of 75th and 85th percentile of %BF may further be
beneficial to detect over fatness and excess fatness in Asian Indian children.
WHAT IS ALREADY KNOWN?
• Prevalence of obesity is increasing globally including in Asian Indian children.
• Body fat percentage for a given BMI is higher in Asian Indian children in comparison to their
Caucasian counterparts.
WHAT THIS STUDY ADDS?
• Reference centile curves for body fat percentage, fat-free mass and muscle mass for Asian
Indian children and adolescents are provided.
• Based on the risk of hypertension, cut offs of 75th and 85th percentile of body fat percentage
have been suggested for correctly classifying excess fatness in clinical and community settings.
Acknowledgments: Director, HCJMRI, Dr. Uma Divate for giving us permission for carrying out this
study.
Contributors: SAC, AVK, VVK, VHE and NAK designed research; SAC, AVK, VVK, VHE, NAK,
LP, RM, AB, PP and PP conducted research; SAC, AVK, VHE, NAK and RM analyzed data; SAC,
AVK, VHE, NAK and VVK wrote the paper; AVK had primary responsibility for final content. All
authors read and approved the final manuscript.
Funding: Novo Nordisk India Pvt. Ltd. Competing interest: None stated.
CHIPLONKAR et al. REFERENCE CURVE FOR BODY COMPOSITION
INDIAN PEDIATRICS 8 SEPTEMBER 26, 2017 [E-PUB AHEAD OF PRINT]
REFERENCES
1. Jahagirdar R, Hemchand KP, Chiplonkar SA, Khadilkar VV, Khadilkar AV. Relationship
between body mass index, fat distribution and cardio-metabolic risk factors in Indian children
and adolescents. Pediatr Obes. 2012;7:E37-41.
2. Weber DR, Leonard MB, Shults J, Zemel BS. A comparison of fat and muscle body mass
index to BMI for the identification of metabolic syndrome in children and adolescents. J Clin
Endocrinol Metab. 2014;99:3208-16.
3. Pandit D, Chiplonkar S, Khadilkar A, Khadilkar V, Ekbote V. Body fat percentages by dual-
energy X-ray absorptiometry corresponding to body mass index cutoffs for overweight and
obesity in Indian children. Clin Med Pediatr. 2009;3:55-61.
4. Khadilkar AV, Sanwalka NJ, Chiplonkar SA, Khadilkar VV, Pandit D. Body fat reference
percentiles on healthy affluent Indian children and adolescents to screen for adiposity. Int J Obes
(Lond). 2013;37:947-53.
5. Jebb S, McCarthy D, Fry T, Prenice AM. New body fat reference curves for children. Obesity
Reviews ( NAASO supple.) 2004;A 156. Available from:
http://media.tanita.com/data/Children's_Body_Fat_Chart_OTHERS_others_OTHERS__011b.jp
g?rev=E5A0. Accessed
6. Liu A, Byrne NM, Kagawa M, Ma G, Kijboonchoo K, Nasreddine L, et al. Ethnic differences in
body fat distribution among Asian pre-pubertal children: A cross-sectional multicenter study.
BMC Public Health. 2011;11:500.
7. Khadilkar A, Ekbote V, Chiplonkar S, Khadilkar V, Kajale N, Kulkarni S, et al. Waist
circumference percentiles in 2-18 year old Indian children. J Pediatr. 2014;164:1358-62.
8. Indian Academy of Pediatrics Growth Charts Committee, Khadilkar V, Yadav S, Agrawal KK,
Tamboli S, Banerjee M, Cherian A, et al. Revised IAP Growth Charts for Height, Weight and
Body Mass Index for 5- to 18-year-old Indian Children. Indian Pediatr. 2015;52:47-55,
9. Khadilkar VV, Khadilkar AV, Borade AB, Chiplonkar SA. Body mass index cut-offs for
screening for childhood overweight and obesity in Indian children. Indian Pediatr. 2012;49:29-
34.
10. Kyle UG, Bosaeus I, De Lorenzo AD, Deurenberg P, Elia M, Manuel Gómez J, et al.
Bioelectrical impedance analysis-part II: Utilization in clinical practice. Clin Nutr.
2004;23:1430-53.
11. van 't Hof MA, Wit JM, Roede MJ. A method to construct age references for skewed skinfold
data, using Box-Cox transformations to normality. Hum Biol. 1985;57:131-9.
12. Cole TJ, Green PJ. Smoothing reference centile curves: the LMS method and penalized
likelihood. Stat Med. 1992;11:1305-19.
CHIPLONKAR et al. REFERENCE CURVE FOR BODY COMPOSITION
INDIAN PEDIATRICS 9 SEPTEMBER 26, 2017 [E-PUB AHEAD OF PRINT]
13. van Buuren S, Fredriks M. Worm plot: A simple diagnostic device for modelling growth
reference curves. Stat Med. 2001;20:1259-77.
14. Raj M, Sundaram R, Paul M, Kumar K. Blood Pressure distribution in Indian children. Indian
Pediatr. 2010;47:477-85.
15. Sung RY, Yu CC, Choi KC, McManus A, Li AM, Xu SL, et al. Waist circumference and body
mass index in Chinese children: cutoff values for predicting cardiovascular risk factors. Int J
Obes (Lond). 2007;31:550-8.
16. McCarthy HD, Cole TJ, Fry T, Jebb SA, Prentice AM. Body fat reference curves for children. Int
J Obes. 2006;30:598-602.
17. Kurtoglu S, Mazicioglu MM, Ozturk A, Hatipoglu N, Cicek B, Ustunbas HB. Body fat reference
curves for healthy Turkish children and adolescents. Eur J Pediatr. 2010;169:1329-35.
18. Plachta-Danielzik S, Gehrke MI, Kehden B, Kromeyer-Hauschild K, Grillenberger M, Willhöft
C, et al. Body fat percentiles for German children and adolescents. Obes Facts. 2012;5:77-90.
19. Sung RY, So HK, Choi KC, Li AM, Yin J, Nelson EA. Body fat measured by bioelectrical
impedance in Hong Kong Chinese children. Hong Kong Med J. 2009;15:110-17.
20. Pichard C, Kyle UG, Bracco D, Slosman DO, Morabia A, Schutz Y. Reference values of fat-free
and fat masses by bioelectrical impedance analysis in 3393 healthy subjects. Nutrition.
2000;16:245-54.
21. McCarthy HD, Samani-Radia D, Jebb SA, Prentice AM. Skeletal muscle mass reference curves
for children and adolescents. Pediatr Obes. 2014;9:249-59.
CHIPLONKAR et al. REFERENCE CURVE FOR BODY COMPOSITION
INDIAN PEDIATRICS 10 SEPTEMBER 26, 2017 [E-PUB AHEAD OF PRINT]
TABLE I: ANTHROPOMETRY AND BODY COMPOSITION MEASUREMENTS BY AGE AND GENDER IN INDIAN CHILDREN AND ADOLESCENTS
Values are Mean (SD).
Age (yr)
n Height (cm)
Weight (kg)
Fat Mass (kg)
Fat-free mass (kg)
Muscle mass (kg)
Bone mineral content (kg)
Fat Percent
Boys 5 36 114.6 (5.2) 20.5 (5.1) 2.9 (3.2) 17.5 (2.2) 16.8 (2.0) 0.7 (0.2) 12.2 (8.1) 6 145 118.6 (5.7) 22.3 (4.7) 3.6 (3.2) 18.9 (2.2) 18.1 (2.1) 0.8 (0.1) 14.3 (8.7) 7 120 124.5 (5.5) 25.2 (5.4) 4.4 (4.1) 21.0 (2.3) 20.1 (2.2) 0.9 (0.1) 15.5 (10.5) 8 144 129.0 (6.4) 27.4 (5.4) 4.6 (4.7) 22.8 (2.6) 21.7 (2.5) 1.0 (0.2) 14.7 (10.4) 9 177 135.4 (6.7) 32.3 (7.6) 6.7 (5.8) 25.5 (2.9) 24.3 (2.7) 1.2 (0.2) 18.4 (11.3) 10 176 140.7 (7.0) 36.4 (8.4) 8.4 (6.7) 28.0 (3.4) 26.6 (3.2) 1.4 (0.2) 20.5 (12.3) 11 232 145.8 (8.2) 40.2 (11.7) 9.2 (9.4) 30.8 (4.1) 29.2 (3.9) 1.5 (0.2) 19.8 (12.7) 12 268 151.4 (8.0) 44.1(11.6) 10.2 (9.3) 34.3 (4.9) 32.6 (4.6) 1.7 (0.3) 19.9 (12.8) 13 234 156.9 (8.5) 48.1 (11.2) 10.4 (8.9) 37.8 (5.5) 35.9 (5.2) 2.0 (0.3) 19.9 (11.9) 14 175 164.4 (7.5) 56.2 (13.0) 13.2
(10.8) 43.3 (5.3) 41.0 (5.0) 2.3 (0.3) 20.9 (12.3) 15 146 167.7 (6.8) 58.4 (13.4) 11.5 (9.4) 47.2 (6.1) 44.7 (5.7) 2.5 (0.3) 17.5 (10.5)16 131 169.2
(6.7) 60.1(12.2)
10.2 (6.9) 50.5 (7.1) 47.8 (6.8) 2.6 (0.3) 15.7 (7.5) 17 70 170.3 (6.4) 63.8(12.8) 11.6 (7.5) 52.5 (6.8) 49.8 (6.7) 2.7 (0.3) 16.9 (7.6)
Girls 5 40 114.1 (5.6) 20.3 (4.0) 3.3 (2.2) 16.8 (2.2) 16.0 (2.1) 0.7 (0.1) 15.4 (6.7) 6 126 117.6 (5.8) 21.7 (5.3) 3.7 (2.7) 17.9 (2.8) 17.09(2.6) 0.8 (0.1) 15.5 (7.3)7 95 123.8 (5.9) 24.5 (5.6) 4.6 (3.4) 19.9 (2.6) 19.0 (2.4) 0.9 (0.2) 17.2 (8.2) 8 135 129.6 (6.6) 28.5 (8.2) 6.2 (4.9) 22.4 (3.8) 21.3 (3.5) 1.1 (0.3) 19.3(9.1) 9 122 133.8 (6.7) 30.7 (8.1)
6.6 (5) 23.9 (3.9) 22.7 (3.6) 1.23 (0.3) 19.3 (9.4)
10 181 139.6 (8.0) 33.9 (9.0) 7.7 (5.3) 26.3 (4.6) 24.9 (4.2) 1.4 (0.3) 20.4 (9.2) 11 205 146.6 (7.7) 38.5 (9.6) 8.9 (5.8) 29.6 (4.9) 27.9 (4.5) 1.7 (0.4) 21.1 (9.0) 12 244 150.1(7.0) 41.8 (9.7) 10.4 (6.3) 31.5 (4.4) 29.7 (4.1) 1.8 (0.3) 23.2 (8.9) 13 215 153.8 (6.7) 46.7(10.8) 13.1 (7.3) 33.7 (4.6) 31.7 (4.2) 2 (0.3) 26.0 (9.2) 14 147 155.4 (6.0) 50.7(10.9) 16.1 (8.5) 34.6 (4.1) 32.6 (3.8) 2.0 (0.3) 30.1 (8.1) 15 117 156.6 (5.6) 52.3(9.1) 16.1 (6.7) 36.2 (3.7) 34.1 (3.4) 2.1 (0.3) 29.8 (6.8) 16 103 157.0 (6.1) 51.1(8.3) 14.6 (5.1) 36.5 (4.1) 34.5 (3.8) 2.0 (0.4) 27.8 (5.7) 17 48 158.4 (7.4) 55.1(11.6) 16.5 (7.6) 38.7 (6.1) 36.5 (5.7) 2.2 (0.4) 28.9 (6.6)
CHIPLONKAR et al. REFERENCE CURVE FOR BODY COMPOSITION
INDIAN PEDIATRICS 11 SEPTEMBER 26, 2017 [E-PUB AHEAD OF PRINT]
TABLE II: FAT MASS INDEX, MUSCLE MASS INDEX AND BODY MASS INDEX BY AGE IN BOYS AND GIRLS
Age (yr)
Boys Girls FMI MMI FFMI BMI FMI MMI FFMI BMI
5 2.06 (2.0)
12.56 (0.7)
13.26 (0.7) 15.41(2.6)
2.50 (1.5)
12.26 (0.8)
12.82 (0.9) 15.52 (2.2)
6 2.45(2.0)
12.79 (0.5)
13.36 (0.6) 15.76(2.3)
2.56 (1.7)
12.27 (0.9)
12.87 (1.0) 15.50(2.6)
7 2.81(1.8)
12.80 (0.6) 13.51(0.5) 16.15(2.8)
2.90 (2.0)
12.30 (0.8)
12.94 (0.9) 15.84(2.8)
8 2.67 (2.5) 12.91(0.7)
13.65 (0.7) 16.34(2.8)
3.55 (2.5) 12.62(1.1) 13.28(1.2) 16.73(3.5)
9 3.56 (2.9)
13.22 (0.6)
13.87 (0.5) 17.49(3.0)
3.56 (2.5)
12.59 (1.0)
13.27 (1.1) 16.89 (3.4)
10 4.13(3.2)
13.41 (0.7)
14.08 (0.7) 18.21(3.2)
3.79 (2.5)
12.87 (1.0) 13.61(1.1) 17.19 (3.3)
11 4.27(3.8)
13.74 (0.8)
14.54 (0.8) 18.71(3.9)
4.06 (2.6)
13.04 (1.2)
13.72 (1.3) 17.74 (3.6)
12 4.21(3.9)
14.07 (0.9)
14.84 (0.9)
19.04 (4.1)
4.57 (2.8)
13.40 (1.0)
14.22 (1.1) 18.42 (3.5)
13 4.17 (3.7)
14.45 (0.9)
15.37 (0.9)
19.48 (3.8)
5.42 (2.9)
13.54 (1.1)
14.38 (1.2) 19.62 (3.7)
14 4.74 (3.9)
15.05 (1.0) 16.0 (1.0) 20.58
(4.3) 6.67 (3.5)
13.47 (1.1) 14.41(1.3) 21.02 (4.1)
15 4.11(3.4)
15.86 (1.4)
16.75 (1.5)
20.72 (4.6)
6.57 (2.6)
13.88 (1.0)
14.72 (1.0) 21.31(3.3)
16 3.58 (2.4) 16.65(2.0)
17.58 (2.0)
20.95 (3.9)
5.94 (2.1)
13.98 (1.1) 14.81(1.2) 20.74 (3.1)
17 3.85 (2.5)
16.95 (1.7) 18.0 (1.8) 22.01(4.1) 6.57(2.6)
14.50 (1.6)
15.37 (1.7) 21.91(4.0)
* Values are Mean ±SD; FMI = Fat Mass Index (Fat mass (kg)/ Height2 (m)); MMI = Muscle Mass Index (Muscle Mass (kg)/Height2 (m); FFMI = Fat Free Mass Index (Fat Free Mass (kg)/ Height2 (m));BMI = Body Mass Index (weight (kg)/ Height2 (m))
CHIPLONKAR et al. REFERENCE CURVE FOR BODY COMPOSITION
INDIAN PEDIATRICS 12 SEPTEMBER 26, 2017 [E-PUB AHEAD OF PRINT]
FIG 1. Smoothed reference percentile curves for percent body fat for Indian boys (a) and girls (b).
(a)
(b)
CHIPLONKAR et al. REFERENCE CURVE FOR BODY COMPOSITION
INDIAN PEDIATRICS 13 SEPTEMBER 26, 2017 [E-PUB AHEAD OF PRINT]
FIG. 2: Association of hypertension risk with degree of fatness by Indian body fat percentiles
PBF= percentile body fat, BP = blood pressure
CHIPLONKAR et al. REFERENCE CURVE FOR BODY COMPOSITION
INDIAN PEDIATRICS 14 SEPTEMBER 26, 2017 [E-PUB AHEAD OF PRINT]
Fig 3a: Smoothed Reference percentile curves for percent FFM for Indian boys (a) and girls
(b)
(b)
(a)
CHIPLONKAR et al. REFERENCE CURVE FOR BODY COMPOSITION
INDIAN PEDIATRICS 15 SEPTEMBER 26, 2017 [E-PUB AHEAD OF PRINT]
Web Fig. 1 Smoothed Reference percentile curves for Percent Muscle Mass for Indian boys
(a) and girls (b).
(a)
(b)
CHIPLONKAR et al. REFERENCE CURVE FOR BODY COMPOSITION
INDIAN PEDIATRICS 16 SEPTEMBER 26, 2017 [E-PUB AHEAD OF PRINT]
Web Fig. 2: Smoothed percentile curves for bone mineral content for Indian boys (a) and girls (b).
CHIPLONKAR et al. REFERENCE CURVE FOR BODY COMPOSITION
INDIAN PEDIATRICS 17 SEPTEMBER 26, 2017 [E-PUB AHEAD OF PRINT]
Web Fig. 3 Comparison of Indian %BF percentiles with UK, Turkish, German and Chinese children
CHIPLONKAR et al. REFERENCE CURVE FOR BODY COMPOSITION
INDIAN PEDIATRICS 18 SEPTEMBER 26, 2017 [E-PUB AHEAD OF PRINT]


![16-00717R1 edited by N approved - Indian Pediatrics · INDIAN PEDIATRICS 1 SEPTEMBER 26, 2017 [E-PUB ... [E-PUB AHEAD OF PRINT] Research Paper Reference Centile Curves for Body Fat](https://img.pdfslide.us/doc/110x75/5af0ed387f8b9aa9168e7ad0/16-00717r1-edited-by-n-approved-indian-pediatrics-1-september-26-2017-e-pub.jpg)