Embed Size (px)
Citation preview
1E U R O P E A NC O M M I S S I O N
THEME 1Generalstatistics
15th CEIES seminar
Inflation in Europe — Differentmeasures and their usersBerlin, 4 and 5 October 2001
20
02
ED
ITIO
N

A great deal of additional information on the European Union is available on the Internet.It can be accessed through the Europa server (http://europa.eu.int).
Luxembourg: Office for Official Publications of the European Communities, 2002
ISBN 92-894-3287-XISSN 1725-1338
© European Communities, 2002

1st day - 4 October 2001(starting at 2 p.m)
13:30 REGISTRATION
14:00 OPENING SESSION
Welcome to the participants:Mr J. Lamel, Vice-chairman of CEIESOpening address: Mrs K. Siune, chairperson of the subcommitteeKeynote speech: Mr B. Meganck, Director, European Commission, Eurostat
14:30 (1) STATE OF THE ART
CHAIR: MR U. HEILEMANN, Rheinisch-Westfälisches Institut für Wirtschaftsforschung, GermanyPresentation of the HICP and Comparison between CPIs and the HICP:Mr J. Astin, European Commission, EurostatPresentation of national CPIs:Mr L. Hoven, CBS, Netherlands Ms E. Szabo, Central Statistical Office, HungaryMr G. Elbel, Statistisches Bundesamt, Germany
15:20-15:50 Coffee / tea break
15:50 (2) OFFICIAL USERS, ECONOMIC AND MONETARY POLICY
CHAIR: MR D. FENWICK, Office for National Statistics, United KingdomSpeakers:Mr W. Bier, European Central BankMs M. Druant, National Bank, Belgium Discussants:Mr T. Quinn, Central Bank, IrelandMr I. Suoniemi, Labour Institute for Economic Research, Finland
16:40-17:10 OPEN DISCUSSION
17:10 END OF THE FIRST DAY
eureurostatostat
15th CEIES seminar: Inflation in Europe — Different measures and their users 5

2nd day - 5 October 2001(starting at 9:30 a.m)
09:30 (3) MARKET AND BANK ANALYSTS / RESEARCH INSTITUTES
CHAIR: MR P. GEARY, National University of Ireland Speakers:Mr E. D’Elia, Istituto di Studi e Analisi Economica, ItalyMr R. Barrie, CSFB,United KingdomMr P. von der Lippe, Universität Essen, Germany Discussants: Mr Y. Vartia, University of Helsinki, Finland
10:30-11:00 Coffee / Tea break
11:00 (4) COLLECTIVE BARGAINING AND CONTRACTING: BROAD PUBLIC
CHAIR: MR P. HASCHKA, Statistical Office, AustriaSpeakers:Mr V. Aalto-Setälä, National Consumer Research Center, Finland Mr E. Mermet, European Trade Union Institute Mr J. Lamel, Wirtschaftskammer, Austria Discussant:Mr L. Hoven, CBS, Netherlands
11:45-12:15 OPEN DISCUSSION
12:15-14:00 Lunch break
14:00 (5) JOURNALISTS / PRESS
CHAIR: MRS K. SIUNE, Institute for Studies in Research and Research Policy, DenmarkSpeaker:Mr R. Kuls, Börsen-Zeitung, GermanyDiscussants:Mr D. Murphy, Ireland Mr Zeuthen, Denmark
15:00 (6) PANEL DISCUSSION: NEEDS FOR THE FUTURE
CHAIR: MR J. LAMEL, Wirtschaftskammer, AustriaPanel:Mr J. Krovák, Statistical Office, Czech RepublicMr J. Astin, European Commission, Eurostat Mr W. Bier, European Central BankMr J. Ruiz Castillo, Universidad Carlos III, Spain Mr L. Biggeri, ISTAT, Italy
16:00-16:30 Coffee / Tea break
16:30 REACTION FROM EUROSTAT
Mr B. Meganck
16:40 SUMMING UP BY THE CHAIRMAN OF THE SUBCOMMITTEE
Ms K. Siune
16:55 CLOSING UP BY THE CHAIRPERSON
Mr J. Lamel, Vice-Chairman of the CEIES
17:00 END OF THE SEMINAR
* * * * * * * * * *
eureurostatostat
6 15th CEIES seminar: Inflation in Europe — Different measures and their users
CONTENTSDocuments presented at the seminar on “Inflation in Europe – Different Measures and their Users”
1st day
THEME 1 – STATE OF THE ART
Paper: Mr J. Astin, European Commission, Eurostat . . . . . . . . . . . . . . . . . . . . . . . . . . . . . . . . 9Paper: Mr L. Hoven, CBS, The Netherlands . . . . . . . . . . . . . . . . . . . . . . . . . . . . . . . . . . . . . . . 11Paper : Ms E. Szabo, Central Statistical Office, Hungary . . . . . . . . . . . . . . . . . . . . . . . . . . . . . 19Paper : Mr G. Elbel, Statistisches Bundesamt, Germany . . . . . . . . . . . . . . . . . . . . . . . . . . . . . . 27
THEME 2 – OFFICIAL USERS, ECONOMIC AND MONETARY POLICY
Paper: Mr W. Bier, European Central Bank . . . . . . . . . . . . . . . . . . . . . . . . . . . . . . . . . . . . . . . 35Paper : Ms M. Druant, National Bank, Belgium . . . . . . . . . . . . . . . . . . . . . . . . . . . . . . . . . . . . 39
2nd Day
THEME 3 – MARKET AND BANK ANALYSTS / RESEARCH INSTITUTES
Paper: Mr E. D’Elia, Istituto di Studi e Analisi Economica, Italy . . . . . . . . . . . . . . . . . . . . . . 53Paper: Mr R. Barrie, CSFB,United Kingdom . . . . . . . . . . . . . . . . . . . . . . . . . . . . . . . . . . . . . . 61Paper: Mr P. von der Lippe, Universität Essen, Germany . . . . . . . . . . . . . . . . . . . . . . . . . . . . 69
THEME 4 – COLLECTIVE BARGAINING AND CONTRACTING: BROAD PUBLIC
Paper: Mr V. Aalto-Setälä, National Consumer Research Centre, Finland . . . . . . . . . . . . . . . 77Paper: Mr E. Mermet, European Trade Union Institute . . . . . . . . . . . . . . . . . . . . . . . . . . . . . . 83Paper : Mr J. Lamel, Wirtschaftskammer, Austria . . . . . . . . . . . . . . . . . . . . . . . . . . . . . . . . . . . 89
THEME 5 - JOURNALISTS / PRESS
Paper: Mr R. Kuls, Börsen-Zeitung, Germany . . . . . . . . . . . . . . . . . . . . . . . . . . . . . . . . . . . . . 97
Summing up by the chairman of the subcommitteeMs K. Siune, Chairperson of the subcommittee . . . . . . . . . . . . . . . . . . . . . . . . . . . . . . . . . . . . . 101
List of Participants . . . . . . . . . . . . . . . . . . . . . . . . . . . . . . . . . . . . . . . . . . . . . . . . . . . . . . . . . . 103
eureurostatostat
15th CEIES seminar: Inflation in Europe — Different measures and their users 7
STATE OF THE ART
ASTIN JohnEuropean CommissionEurostatHead of Unit B-3BECH B3/303Batiment JMOL-2920 [email protected]
The HICPs started life as a way of meeting the Maastricht Treaty requirements to have a price stability measurefor assessing progress towards convergence for membership of the European Monetary Union. The Treatystipulated that
“Inflation shall be measured by means of the consumer price index on a comparable basis, taking intoaccount differences in national definitions”.
So from 1993 to 1995 we held lengthy discussions with the CPI experts from the member states, and weeventually produced a Council Regulation (Council Reg (EC) 2494/95, 23.10.95) setting out the framework fora new type of CPI, to be known as the Harmonized Index of Consumer Prices (HICP). It was launched in 1997,in preparation for the third stage of Monetary Union in January 1999.
At an early stage in our discussions, it became obvious that the European Central Bank (ECB) would need anaggregate index to enable it to monitor price stability over the eurozone, and indeed this requirement is met bythe Monetary Union Index of Consumer Prices (MUICP) which is published monthly. The MUICP is simply aweighted average of the national HICPs.
What sort of index is the HICP? Both from its initial purpose as a comparative index, and from its later use asan aggregate eurozone index, its purpose is clearly macroeconomic. Although it cannot pretend to measure thetotality of inflation, it serves as a measure of inflation faced by the household sector, itself often referred tosimply as “inflation”.
Nobody can define inflation in a way which is meaningful for statisticians. The accepted definition (“apersistent increase in the general level of prices”) is not much help to the index compiler. Phrases like “cost-of-living”, “standard of living” and so on are bandied about without much thought as to what they might meanin detailed reality. In deciding on the concept of the HICP we had to decide on the underlying principle, but wealso had to be rather pragmatic on details - as is indeed the case with all national CPIs.
It is perhaps easier to say what the HICP is not, rather than what it is. It is not designed as a compensation index,which might imply that all household expenditure, including such items as mortgage interest should beincluded. Nor can it be said to be a cost of living index (COLI), which implies that the basket of goods andservices comprising the index should be continually changed to reflect changing tastes which may be assumedto relate to utility maximisation, difficult or impossible to measure though this may be in practice.
In fact, the HICP is what one might describe, with some hesitancy, as a “pure” price index: the frameworkregulation defines it as a “Laspeyres-type” index, implying that it should measure the changing price of a fixedbasket of goods and services. Of course, the composition of the basket must be updated to reflect changingmarkets. And this at once leads to that most difficult of subjects: how to deal with new products, products withaltered specifications, and the accompanying issues of quality change. Nobody has the solution to these
eureurostatostat
15th CEIES seminar: Inflation in Europe — Different measures and their users 9
questions, and we would not pretend to have the solution for the HICP either, though we are continuing to workhard on finding one.
Some countries, though few in the EU, maintain that their national CPI uses a COLI approach, yet in practicethe construction of such indices seems to differ little from those who affirm that they produce a Laspeyres-typeindex.
Another difference between the HICP and some national CPIs is the approach to population coverage. At aseminar in Madrid earlier this year, Prof Ruiz Castillo showed that there could be some significant differencesbetween a CPI using weights relating to total national consumption as opposed to a CPI using weights obtainedby averaging expenditure proportions over the whole population. The former type (sometimes referred to as“plutocratic” because it gives a relatively high weight to the high expenditure of the rich) may be regarded asunsuitable for a compensation index, but is appropriate for a measure of total consumer inflation – and indeedthis is the basis of the HICP. The latter type of index, (referred to as “democratic”) which is used in somenational CPIs, may be more appropriate for an index which is used as a reference for wage negotiations. I amsure we will return to this topic later in the discussion.
Owner-occupied housing is a traditionally difficult sector for CPI statisticians. There is a wide range ofpractices among the member states in their national CPIs. Shelter costs (as opposed to the more tangible itemssuch as regular repairs, maintenance and insurance) are currently excluded from the HICP, though we arestudying how to include house prices on the basis of acquisition costs. Housing is a capital item in the nationalaccounts (ESA95) and there is consequently a good argument for permanent exclusion. But most users feel thatto do so would omit an important aspect of a type of inflation which most certainly faces consumers.
In the limited time available, I will mention only one other important sector where one can find majordifferences in treatment between the HICP and national CPIs, and that concerns education and healthexpenditure, much of which is heavily subsidised by the state in most member states. Given that the HICP isintended to measure household inflation, rather than total inflation, we developed the concept of HouseholdFinal Monetary Consumption Expenditure (HFMCE). In this case, this is a rather long way of saying that wherea consumer purchases a subsidised product (such as a prescription drug), the price (and weight) which entersthe HICP is restricted to that part which is finally paid by the consumer. The subsidised part is relevant for agovernment expenditure price index, if such exists.
Let me finish by showing you some charts which demonstrate the differences between HICPs and national CPIsas they have evolved over the past few years.
One of the persistent questions is: is there evidence of gradual convergence between national CPIs and nationalHICPs? These charts show that in general there are indeed signs of convergence, but it is not universal, nor arethey always present. I would like to emphasise that there is no question – nor I hope will there be – of anycompulsion for member states to adopt the HICP as their national index. Of course, there would be advantagesfor the public in having a single index, but from a technical viewpoint I believe that it is preferable to haveseparate indicators if there are different purposes to be served.
eureurostatostat
10 15th CEIES seminar: Inflation in Europe — Different measures and their users
CONSUMER PRICE INDEXES IN THE NETHERLANDS: AN OVERVIEW
HOVEN LeendertCBSPostbus 959NL – 2273 XZ [email protected]
1. Introduction
The aim of a consumer price index (CPI) is to measure changes in prices of goods and services bought byconsumers. Consumer price indexes are used for various purposes. Amongst others, a consumer price index isused as a measure of inflation, as an instrument for indexation of wages, pensions, alimony, rents etc. and fornational accounting deflation. This paper presents an overview of the key concepts underlying the Dutchnational CPI. It is then compared with the harmonized index of consumer prices (HICP), which was designedto measure consumer price inflation on a comparable basis between Member States of the European Union.
2. The national CPI: guiding principles
2.1. The CPI and cost of living
The CPI is used for various purposes. Measurement of changes in the cost of living is regarded by many as oneof the most important purposes. A conceptual framework for an index that monitors the change in the cost ofliving is provided by the theory of the cost-of-living (COL) index. In economic theory, a (true) cost-of-livingindex is defined as the minimum ratio of expenditure required to maintain a constant level of utility. Alternativeformulations speak of “standard of living” or “well being” instead of “utility”, or define the COL index as anindex that measures the cost of remaining on the same indifference curve. It is important to notice that the COLindex is a theoretical construct, not a straightforward index formula which can be applied in practice.Nevertheless, the concept of the COL index is a quite useful guiding tool for making decisions about CPImeasurement issues. In the Netherlands, COL index theory provides the conceptual framework for the CPI.Several other countries have adopted the COL index framework for their CPI (the United States, Sweden).
In practice, the CPI measures the average change in the prices paid by consumers for a fixed basket of goodsand services. The CPI is Laspeyres-type price index. It equals the ratio of the cost of the base-period basket atthis month’s prices to the actual cost of the base-period basket in the base period. See Appendix 1 for thecorresponding formula.
A Laspeyres price index thus answers the question: “What is the value of the base-period basket of goods andservices in today’s prices? A Laspeyres price index can be regarded as an upper bound of a true COL index. Bysubstituting goods that have become relatively cheaper for goods that have become relatively more expensive,consumers can maintain the same utility level for less than the cost of the base period market basket. Thedifference between a Laspeyres index and an index that takes this substitution properly into account is knownas substitution bias1.
eureurostatostat
15th CEIES seminar: Inflation in Europe — Different measures and their users 11
1 There is a class of index number formulae, known as “superlative” indexes, that account for changes that consumers make in response to relative pricechanges. These indexes, among which are the Fisher and the Törnqvist indexes, can be regarded as close approximations to the true COL index. SeeDiewert, 1976. Their estimation, however, requires information on the comparison period market basket. They can only be produced with a consider-able time lag, because it takes time to collect and process consumer expenditure data.
2.2. Goods and services covered in the CPI
The goods and services that are customarily included in a country’s CPI are (market) goods and services whichare bought by the households themselves. This is also the case in the Netherlands. The consumer’s standard ofliving does not only depend on market goods and services, but on other aspects as well, such as goods andservices which are provided by the government (education, fire protection, national defense) and environmentalquality. It is sometimes argued that such factors should be included in a COL index. This would most certainlycreate enormous measurement problems. A CPI restricted to market goods and services could be looked uponas (an approximation to) a subindex of the all-encompassing COL index, specifically a subindex that isconditional on the excluded factors.
The scope of the CPI is defined as the set of goods and services which are acquired by the average householdfor prices which are known to the households at the moment of acquisition. We will elaborate upon thisdefinition in the remainder if this section.
All acquisitions are done by the household itself. The acquisitions are made from net spendable householdincome, that is gross household income minus obligatory transfers. Obligatory transfers are income tax andsocial premiums. For households which fall under the compulsory medical insurance (about 63 percent of thetotal population) the premium is an obligatory transfer, hence is not part of net spendable income. Although thepremium for a voluntary medical insurance cannot be conceived of as an obligatory transfer, on account of aunified treatment of both types of households is is deleted from net spendable income as well. This leaves uswith the problem that the remaining non-insured medical expenses of both types of households are not definedin the same way. This is caused by the fact that the coverage of the compulsory medical insurance differs fromthe coverage of the various voluntary medical insurances. The solution chosen is to delete from the netspendable income of the voluntarily insured households also the value of those medical expenses which wouldbe covered by the compulsory medical insurance. For both types of households, own risk is also deleted.
Every transaction corresponds with a price. Thus all transactions with the character of a free donation or atransfer are excluded. In addition, at the moment of transaction the price must be known to the buyer. Thus alltransactions where the price is determined retrospectively are excluded.
The scope of the CPI is restricted to those goods and services which are acquired in the base period. Savingswhich can be regarded as deferred acquisitions, are excluded. Payments which have largely the character ofsavings, such as premiums for life insurances and pensions, are also excluded.
Some acquisitions imply the payment of tax. Living in a house (owned or rented) implies the payment ofproperty tax, sanitation levy, etc. With a dog corresponds dog tax, with a motor car motor vehicle tax, etc. Theseconsumption-related taxes play an important role in the household’s perception of the cost of living and aretherefore included in the scope of the index. Government services, such as the supply of a passport or a legaldocument, are also included.
2.3. Population coverage
Statistics Netherlands calculates the CPI for three population groups. The CPI for all private residenthouseholds can be considered the most general index. This index serves as the main inflation indicator in theNetherlands. Two indexes are compiled for households of employees, one for households with low income andone for households with high income. The median of the income distribution of households of employees formsthe threshold between high and low. The population of households of employees is thus split into two parts ofequal size.
2.4. Geographical coverage
The CPI covers all acquisitions of resident private households on the domestic territory or abroad. Expenditureby non-residents on the domestic territory is excluded.
2.5. The CPI exclusive of tax changes
The CPI relates to the prices actually paid by consumers for the goods and services wiithin its scope. Indirecttaxes, such as value added tax and excise duties, are thus included. In addition to the CPI which is based on the
eureurostatostat
12 15th CEIES seminar: Inflation in Europe — Different measures and their users
actually paid prices, Statistics Netherlands also compiles a CPI exclusive of the effect of changes in the ratesof indirect taxes and consumption-related taxes. In price index literature such an index is often referred to as a“net price index”.
The CPI exclusive of tax changes is compiled as the ratio of the cost in the comparison and the base periodnecessary for the acquisition of the previously defined basket of goods and services, where it is assumed thatthe tax rates have not changed since the base period. The prices entering the numerator of the index can not beobserved. They must be estimated, based on observed prices and information on tax rates. Only the direct effectof tax rate changes is taken into account. Incorporation of the indirect effect (of taxes levied on previous stagesof the production process) would necessitate too many, rather arbitrary, assumptions. Statistics Netherlandspublishes a “net price index” for the three population groups mentioned in section 2.3.
Apart from analytical purposes, the main use of the CPI exclusive of tax changes lies in (automatic) wage andsalary escalation. The main argument is, that when the government decides to increase (or to reduce) an exciseduty or tax, for example on tobacco, in order to reduce (or stimulate) consumption, the effectiveness of such ameasure should not automatically be reduced.
2.6. Owner-occupied housing
Consumer goods are generally not consumed at the very same moment when they are acquired. An index thatis supposed to provide an approximation to a COL index should ideally relate to the costs of consumption oruse, assuming that not the acquisition as such, but the consumption or use provides utility. Particularly in thecase of consumer durables, which can have a lifetime of many years, the distinction between acquisition anduse is not unimportant. The purchase of a durable goods can be considered an investment, designed to provideconsumption services over a future time span. Since market transactions do not take place each time the serviceis consumed, a price of the service cannot be observed, but needs to be estimated in one way or the other.
For pratical reasons, the distinction between acquisition and consumption is ignored in CPI compilation, withone exception: owner-occupied housing. Reasons for this can be found in the extremely long lifetime of a houseand the very high acquisition costs which are usually spread over time by taking out a mortgage. Homeownersusually spend each month a considerable part of their income on housing, or, to put it in other words: an owner-occupier spends money on a house while he is living in it, and not when he first buys it. An acquisitionsapproach, based on purchaser prices of (new) houses, does not reflect what owner- occupiers spend on housing.Another reason is that the existence of well developed rental housing markets facilitates the estimation ofimplicit prices for owner-occupied housing. For other consumer durables, these possibilities do often not exist.
There are, it seems, enough reasons to adopt a flow-of-services approach in the treatment of owner-occupiedhousing in a CPI which is supposed to approximate a COL index. Within a flow-of-services approach, there aretwo candidates for estimating the implicit prices for owner-occupied housing: the user-cost approach and therental equivalence approach.
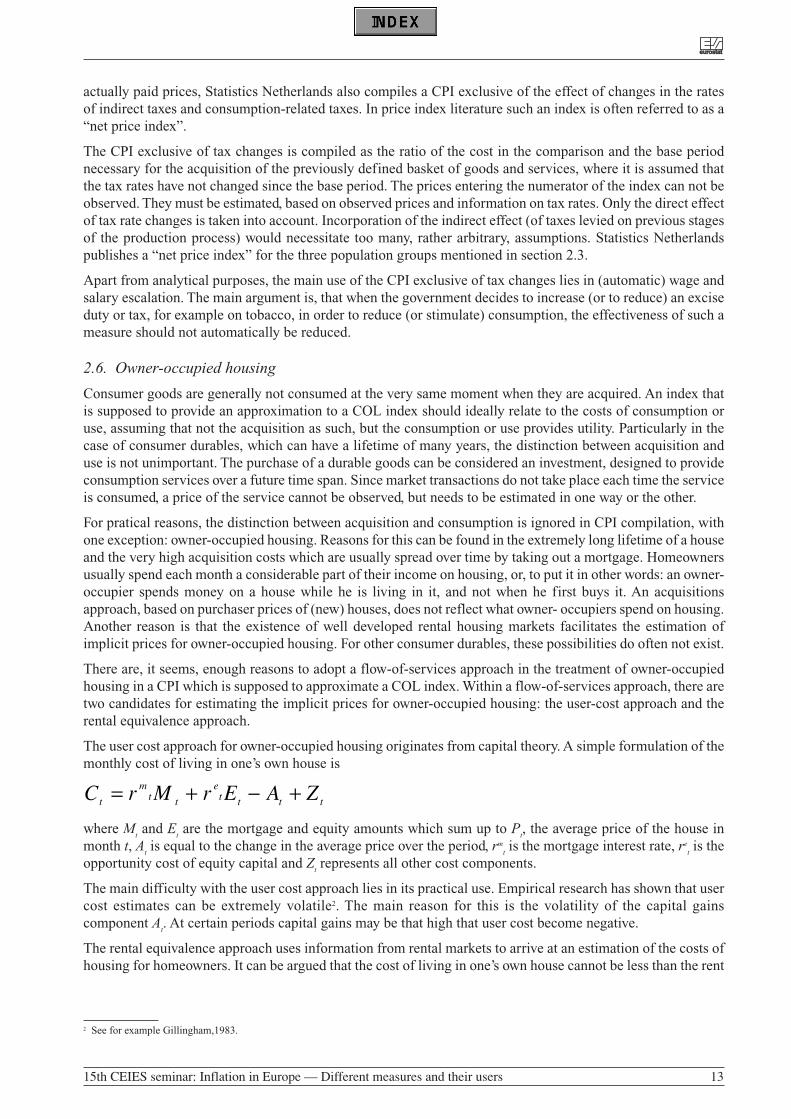
The user cost approach for owner-occupied housing originates from capital theory. A simple formulation of themonthly cost of living in one’s own house is
where Mtand E
tare the mortgage and equity amounts which sum up to P
t, the average price of the house in
month t, Atis equal to the change in the average price over the period, rm
tis the mortgage interest rate, re
tis the
opportunity cost of equity capital and Ztrepresents all other cost components.
The main difficulty with the user cost approach lies in its practical use. Empirical research has shown that usercost estimates can be extremely volatile2. The main reason for this is the volatility of the capital gainscomponent A
t. At certain periods capital gains may be that high that user cost become negative.
The rental equivalence approach uses information from rental markets to arrive at an estimation of the costs ofhousing for homeowners. It can be argued that the cost of living in one’s own house cannot be less than the rent
tttte
ttm
t ZAErMrC +−+=
eureurostatostat
15th CEIES seminar: Inflation in Europe — Different measures and their users 13
2 See for example Gillingham,1983.
that one could receive from a tenant. An owner-occupier always foregoes this amount when he lives in his ownhouse. It can also be argued that, over a longer period, the cost cannot be greater than the rent of a similar rentalhouse, assuming the existence of a sufficiently active rental market, since the homeowner always has thepossibility of acquiring equivalent housing services at this price.
It is mainly for practical reasons, and not for its conceptual superiority, that Statistics Netherlands uses rentalequivalence in its estimation of shelter cost for owner-occupiers. The produced estimates are far less volatilethan user cost estimates would be.
2.7. Insurances
For insurances, Statistics Netherlands uses an approach known as “gross-gross”. The weight in the index, aswell as the price indicator, relate to the gross premium payments. The alternative is the so-called “net-gross”approach” based on the costs of repair and replacement of damaged or stolen goods and the costs associatedwith the services provided by the insurance companies. The weight of insurances in the index relates to theseservices. Usually the change in the gross premium is taken as a measure of price change of the services of theinsurance company.
Gross-gross is in our view the correct way to deal with insurances in (an approximation of) a COL index. Grossweights reflect the buying behaviour of consumers; what consumers pay are gross premiums. It is likely that aconsumer experiences a rise of the premium of a particular insurance as an increase in his cost of living.
3. A comparison between CPI and HICP
The Harmonized Index of Consumer Prices (HICP) is produced in each Member State using a harmonizedmethodology . It is the main measure of price stability in the euro-zone.
The HICP can be described as a “Laspeyres-type” or a “pure” price index measuring the average price changefor a fixed basket of consumer goods and services. “Pure” means that it is only the changes in prices that arereflected in the measure between the current and the base or reference period.
The coverage of the HICP is defined as those goods and services which are included in household finalmonetary consumption expenditure, which is defined as that part of final consumption expenditure which isincurred:
• by households irrespective of nationality or residence status, and• in monetary transactions, and• in the economic territory of the Member State, and• on goods and services that are used for the direct satisfaction of individual needs or wants, and• in one or both of the time periods compared.
Box 1 provides an overview of the main differences between CPI and HICP. While the CPI uses COL indextheory as a guiding principle, and the HICP does not, both measures are not very different from each other. Themain differences relate to coverage.
As regards the population coverage, the HICP includes individuals living in institutional households(retirement homes, homes for the disabled, etc.). The CPI excludes them, mainly for practical reasons: sincethey are not included in the yearly budget survey, detailed expenditure data for this category are not available.In the HICP, rough estimates for the expenditure shares for persons in institutional households are used.
As regards the geographical coverage, it follows from the main purpose of the CPI that all acquisitions of thereference population, on the domestic territory or abroad, should be included. The HICP, its main purpose beingan inflation indicator, is restricted to acquisitions on the economic territory, but includes expenditure by non-residents.
As regards the coverage of goods and services, the point of departure in the HICP is not really different fromthe starting point in the CPI. Different choices were made in some bordeline/special cases, viz. medical care,owner-occupied housing and consumption-related taxes.
In the Netherlands, the majority of health goods and services is provided to households in transactionsdescribed as “social transfers in kind”. These transfers are partly or wholly financed by government units or
eureurostatostat
14 15th CEIES seminar: Inflation in Europe — Different measures and their users
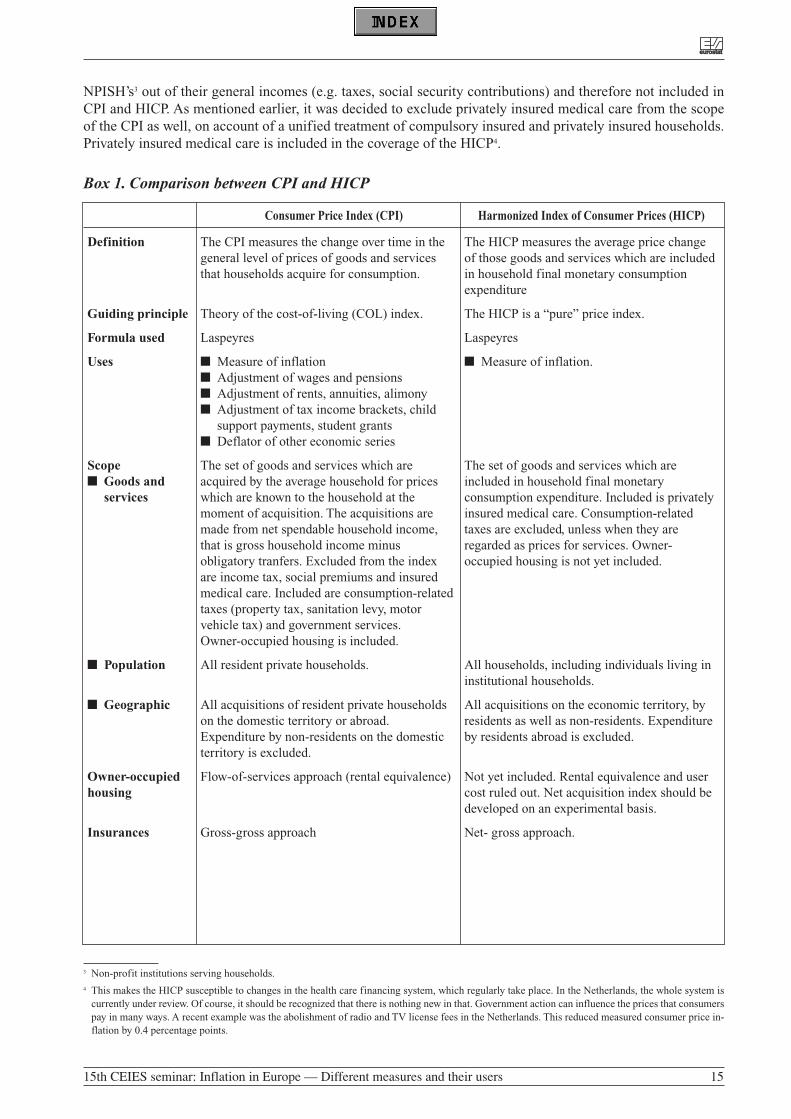
NPISH’s3 out of their general incomes (e.g. taxes, social security contributions) and therefore not included inCPI and HICP. As mentioned earlier, it was decided to exclude privately insured medical care from the scopeof the CPI as well, on account of a unified treatment of compulsory insured and privately insured households.Privately insured medical care is included in the coverage of the HICP4.
Box 1. Comparison between CPI and HICP
Consumer Price Index (CPI) Harmonized Index of Consumer Prices (HICP)
eureurostatostat
15th CEIES seminar: Inflation in Europe — Different measures and their users 15
3 Non-profit institutions serving households.4 This makes the HICP susceptible to changes in the health care financing system, which regularly take place. In the Netherlands, the whole system is
currently under review. Of course, it should be recognized that there is nothing new in that. Government action can influence the prices that consumerspay in many ways. A recent example was the abolishment of radio and TV license fees in the Netherlands. This reduced measured consumer price in-flation by 0.4 percentage points.
Definition
Guiding principle
Formula used
Uses
Scope■ Goods and
services
■ Population
■ Geographic
Owner-occupiedhousing
Insurances
The CPI measures the change over time in thegeneral level of prices of goods and servicesthat households acquire for consumption.
Theory of the cost-of-living (COL) index.
Laspeyres
■ Measure of inflation■ Adjustment of wages and pensions■ Adjustment of rents, annuities, alimony■ Adjustment of tax income brackets, child
support payments, student grants■ Deflator of other economic series
The set of goods and services which areacquired by the average household for priceswhich are known to the household at themoment of acquisition. The acquisitions aremade from net spendable household income,that is gross household income minusobligatory tranfers. Excluded from the indexare income tax, social premiums and insuredmedical care. Included are consumption-relatedtaxes (property tax, sanitation levy, motorvehicle tax) and government services.Owner-occupied housing is included.
All resident private households.
All acquisitions of resident private householdson the domestic territory or abroad.Expenditure by non-residents on the domesticterritory is excluded.
Flow-of-services approach (rental equivalence)
Gross-gross approach
The HICP measures the average price changeof those goods and services which are includedin household final monetary consumptionexpenditure
The HICP is a “pure” price index.
Laspeyres
■ Measure of inflation.
The set of goods and services which areincluded in household final monetaryconsumption expenditure. Included is privatelyinsured medical care. Consumption-relatedtaxes are excluded, unless when they areregarded as prices for services. Owner-occupied housing is not yet included.
All households, including individuals living ininstitutional households.
All acquisitions on the economic territory, byresidents as well as non-residents. Expenditureby residents abroad is excluded.
Not yet included. Rental equivalence and usercost ruled out. Net acquisition index should bedeveloped on an experimental basis.
Net- gross approach.
Owner-occupied housing is presently not included in the coverage of the HICP.
The issue of owner-occupied housing in the HICP raised a lot of debate. Rental equivalence was ruled outbecause it was considered an imputation. The argument was, that imputations should not appear in a (consumerprice) inflation measure, because inflation is a monetary phenomenon. The HICP should therefore be restrictedto monetary transactions5.
User cost was also not considered appropriate, because this would introduce interest rates into the HICP.Central banks use interest rates as a tool of monetary policy and therefore do not like them included in aninflation measure: “If interest rate costs are included in the HICP, policy actions to maintain price stability may,at least initially, have perverse effects on the headline HICP measure of inflation, leading to presentationalproblems for the communication of monetary policy decisions” (European Central Bank, 2000). This argumentcaused surprisingly little debate. There may be good reasons to reject the user cost approach as a practical wayto measure owner-occupier’s shelter cost (volatility is a big problem), but there can not be much doubt thatinterest is a major part of the cost of consuming housing services. If mortgage interest rates go up, owner-occupier’s shelter cost go up. That is a reality.
After the decison was made that user cost and rental equivalence were not appropriate in a consumer priceinflation measure, the remaining options were: excluding owner-occupied housing altogether from the HICP ordevelop an index of acquisition prices of new dwellings. It was concluded that it was unsatisfactory to excludeowner-occupied housing from the HICP. The ECB remarked: “..considering the substantial expenditures ofhouseholds required for the use of shelter services, the exclusion of owner-occupied housing from HICP’s isnot satisfactory and leaves a gap in the coverage of consumer expenditures for consumption purposes”. It wasalso considered unsatisfactory against the background of the comparability requirement for the HICP: “Theowner occupation level differs in the EU between around 40% (DE) and 80% (IE) and the market shares ofrental dwellings differ accordingly. Depending on the size of the rental market in the countries, price changesin the housing sector are reflected to a differing degree in HICP’s of different contries. This reduces thecomparability of HICP’s” (European Central Bank, 2000).
This leaves the net acquisitions approach as the only remaining candidate. Last year, it was decided that a netacquisitions approach should be developed on an experimental basis in each Member State and that a pilot timeseries should be developed, addressing methodological and measurement issues. After a certain time, a decisionshould be made if this index in to be incorporated in the HICP.
The net acquisitions approach for owner-occupied housing in a cosumer price inflation measure is notundisputed. Measuring asset price developments can be considered a quite useful exercise in the context of totalinflation measurement, but their inclusion in a consumer price index is controversial. A price index for newdwellings cannot be expected to reflect what owner-occupiers spend on housing. For owners, an increase inhouse prices has two effects on the cost of housing. The direct effect raises the cost of housing (see the user costequation in section 2.6), because the house price (which equals unpaid mortgage plus equity) is multiplied byinterest rates. But the capital gains effect lowers the cost of housing. Triplett (2001) notes, that “The commonsense of the user cost equation is the widely observed fact that owners like to see house prices go up, butprospective owners do not (for prospective owners, there is only the direct effect, they do not benefit from thecapital gain). Including house prices only in the CPI overstates the cost of housing to owners during a periodof rising house prices, and understates it if house prices fall”.
Another problem in the net acquisitions approach concerns weights. It could be argued that a basic requirementshould be that countries with a high owner-occupation level have a higher weight for owner-occupied housingin their index than countries with a low owner-occupation level. The net acquisitions approach does notnecessarily meet this requirement. According to Eurostat, this is not a serious drawback: “..although this aspectof weights may seem contradictory to some users, it actually reflects the volume in monetary transactionsincurred by the household sector” (Eurostat, 2000).
eureurostatostat
16 15th CEIES seminar: Inflation in Europe — Different measures and their users
5 This is a point of controversy. Triplett notes: “The statement that inflation is a monetary phenomenon is a statement about its causes…But the analy-sis of inflation, and the determination of its causes, is a different topic from the measurement of inflation..”. He observes, that the HICP does containan imputation in the case of insurances, and continues: “Whether or not the price is imputed should not be the question. The question is whether theoccupants of owner-occupied housing are affected by inflation in the housing market, and if they are how should we measure inflation for this portionof the CPI population.” (Triplett, 2001).
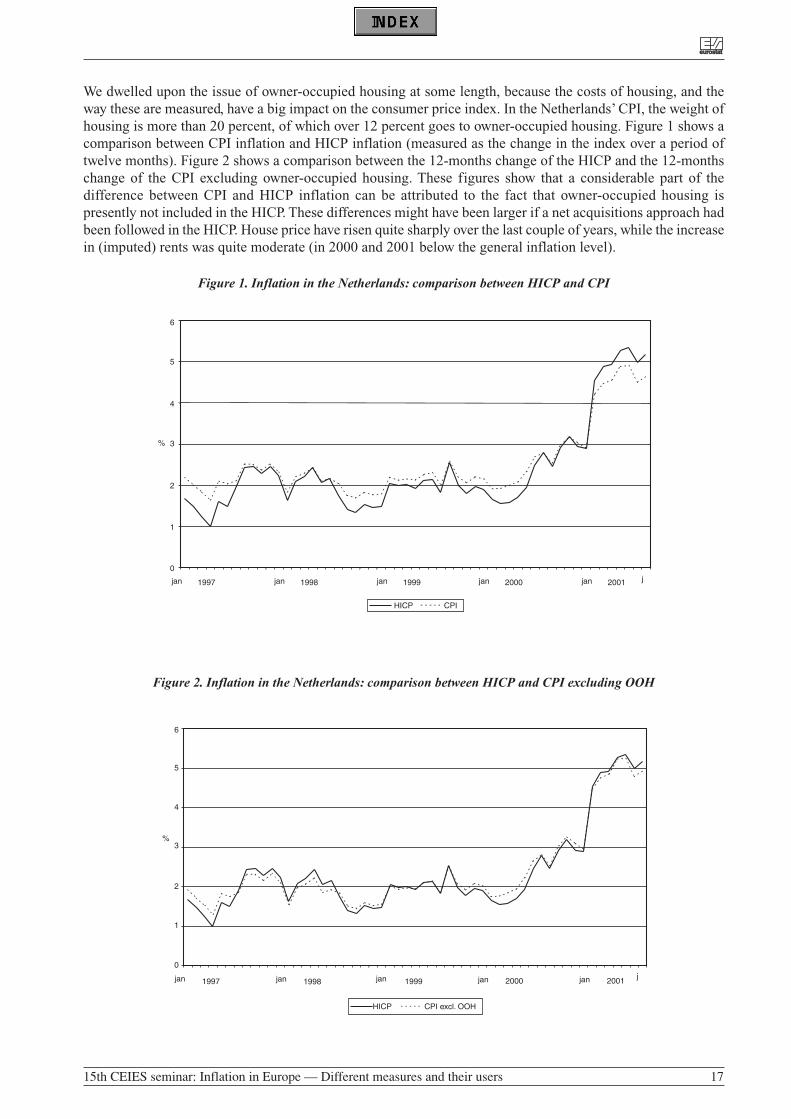
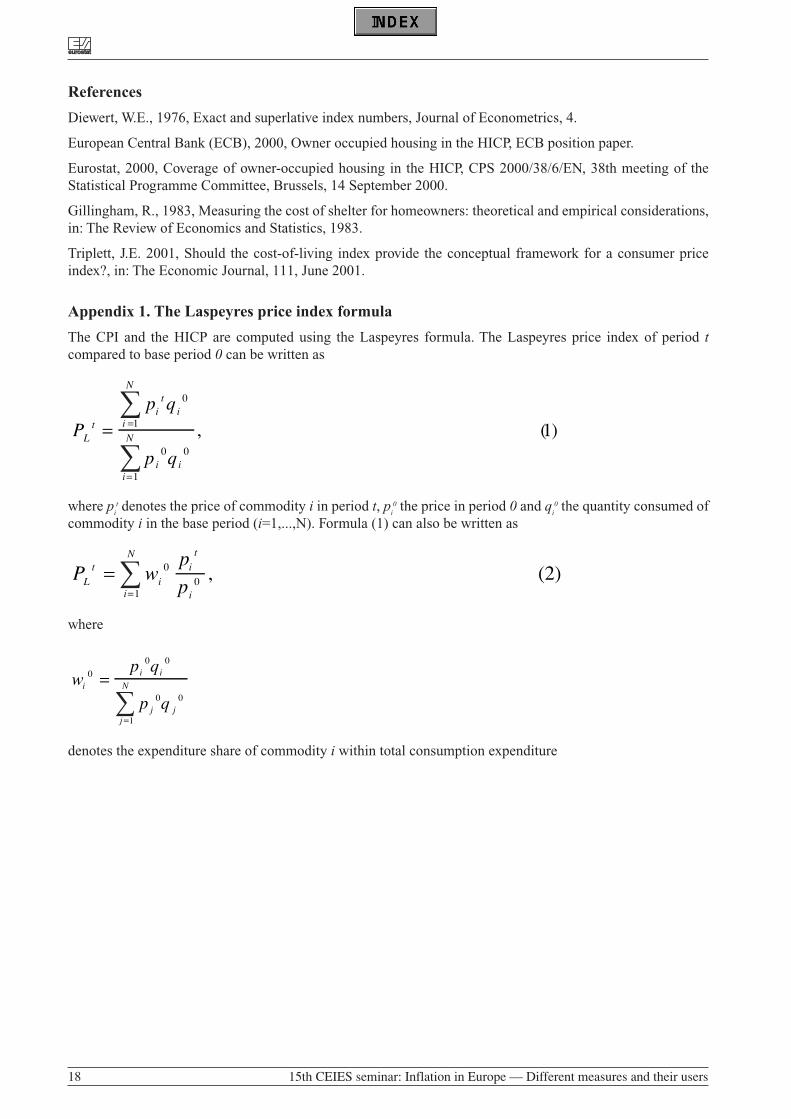
We dwelled upon the issue of owner-occupied housing at some length, because the costs of housing, and theway these are measured, have a big impact on the consumer price index. In the Netherlands’ CPI, the weight ofhousing is more than 20 percent, of which over 12 percent goes to owner-occupied housing. Figure 1 shows acomparison between CPI inflation and HICP inflation (measured as the change in the index over a period oftwelve months). Figure 2 shows a comparison between the 12-months change of the HICP and the 12-monthschange of the CPI excluding owner-occupied housing. These figures show that a considerable part of thedifference between CPI and HICP inflation can be attributed to the fact that owner-occupied housing ispresently not included in the HICP. These differences might have been larger if a net acquisitions approach hadbeen followed in the HICP. House price have risen quite sharply over the last couple of years, while the increasein (imputed) rents was quite moderate (in 2000 and 2001 below the general inflation level).
eureurostatostat
15th CEIES seminar: Inflation in Europe — Different measures and their users 17
Figure 1. Inflation in the Netherlands: comparison between HICP and CPI
6
5
4
3%
2
1
0
jan 1997 jan 1998 jan 1999 jan 2000 jan 2001 j
HICP CPI
Figure 2. Inflation in the Netherlands: comparison between HICP and CPI excluding OOH
6
5
4
3%
2
1
0
jan 1997 jan 1998 jan 1999 jan 2000 jan 2001j
HICP CPI excl. OOH
References
Diewert, W.E., 1976, Exact and superlative index numbers, Journal of Econometrics, 4.
European Central Bank (ECB), 2000, Owner occupied housing in the HICP, ECB position paper.
Eurostat, 2000, Coverage of owner-occupied housing in the HICP, CPS 2000/38/6/EN, 38th meeting of theStatistical Programme Committee, Brussels, 14 September 2000.
Gillingham, R., 1983, Measuring the cost of shelter for homeowners: theoretical and empirical considerations,in: The Review of Economics and Statistics, 1983.
Triplett, J.E. 2001, Should the cost-of-living index provide the conceptual framework for a consumer priceindex?, in: The Economic Journal, 111, June 2001.
Appendix 1. The Laspeyres price index formula
The CPI and the HICP are computed using the Laspeyres formula. The Laspeyres price index of period tcompared to base period 0 can be written as
where pit denotes the price of commodity i in period t, p
i0 the price in period 0 and q
i0 the quantity consumed of
commodity i in the base period (i=1,...,N). Formula (1) can also be written as
where
denotes the expenditure share of commodity i within total consumption expenditure
wp q
p qi
i i
j jj
N0
0 0
0 0
1
=
=
P wp
pLt
iit
ii
N
==
00
1
, (2)
P
p q
p qL
tit
ii
N
i ii
N= =
=
0
1
0 0
1
, (1)
eureurostatostat
18 15th CEIES seminar: Inflation in Europe — Different measures and their users
∑
∑
∑
∑
METHODOLOGIES OF CONSUMER PRICE INDEX (CPI) IN HUNGARY 1
SZABO Eva MariaHungarian Central Statistical OfficeKeleti Karoly u. 5-6H-1026 [email protected]
Summary: In Hungary, the Consumer Price Index (CPI) is a measure of the national average price change inthe fixed market basket of goods and services purchased by the private households.
The purpose of this paper is to present a general overview of the method applied for the computation HungarianCPI.
The CPI is the most widely used of inflation indicator in Hungary, the transition to market economy increasedits importance since 1990.
Since January 1992 an improved system of the CPI has been introduced. The main target of the improvementwas a better harmonisation to the needs of a real market economy to the practice of EU countries.
In 1998, during the statistical screening and starting of accession negotiation with EU, it has become moreimportant for Hungary to consider the harmonised EU procedures in developing our system.
In the way of harmonisation year 2000. was the next substantial year, when the Consumer Price Index is based“fully” on internationally endorsed standards and recommendations. In addition we compute HarmonisedConsumer Price Index (HICP) and Core Inflation too.
The main characteristics of Hungarian CPI between 1968-1990:
Responding to changes in the economy introducing of elements of market economy, in the frame in the newmechanism economic reform, in 1968 the so-called “western type” CPI calculation was introduced as well.Until 1991 the method was heterogeneous. In wide areas of economy the regulated prices remained in force butfor other areas the prices of selected items were collected from a retail trade survey and services survey, that isto say various departments of the Statistical Office worked on the CPI. The prices of appr. 2500 of importantitems, so called representative items were recorded in various settlements across the country, once or twice amonth. The prices of appr. 600 services were observed quarterly. The Department of Economics in HungarianCentral Statistical Office (HCSO) obtained all these primary statistics and completed them in some respect(e.g. gas, electricity, water charges, local and long distance transport, central heating).
In accordance with the number of representative items, the outlet sample was also big.
The weights were based on National Accounts data.
The Consumer Price Indices has only been made on the basis of the corresponding month of the previous year.It was characteristic to a planned economy.
Following the fundamental changes in the economy, under new circumstances, the significant methodologicalrenewal of the CPI took place in 1991 with respect to the practice of EU countries, and with consideration ofthe major requirements and earlier experiences of the Hungarian CPI.
eureurostatostat
15th CEIES seminar: Inflation in Europe — Different measures and their users 19
1 Prepared by Eva SZABO, head of Consumer Price Section in HSCO
The main characteristics of Hungarian CPI at the present: CPI methodology involves thefollowing topics:
1.Scope2.Official base, calculation method3.Sampling method4.Data sources5.Publication
1.Scope
The index is compiled monthly and covers the whole country and entire population living in private household.It is the measure of the price changes of goods and services intended for household consumption.
2.Official base and calculation method
The Hungarian CPI is a Laspeyres type index. The base (reference) period of the index computation isDecember of the previous year. In addition, every month the indices are calculated on this basis of the previousmonth and the same month of the previous year.
All other (quarterly, yearly etc.) indices are calculated as composite chain indices (averaged when applicable)of the above mentioned monthly indices.
For the computation of lowest level indices, the price relatives of the representative items are calculated bydividing the national average price of the given item in the current month by the national average price of thebase month. When a price observation is temporarily unavailable in a given month, its price is imputed basedupon the price movement of similar products in the same item category in the same localities. The estimated(imputed) price is used for two months.
The price index of the 156 basic headings is the weighted average of the price relatives of the includedrepresentative items. The price indices of the major groups and total consumption are the weighted average of156 basic headings.
The compilation of the Consumer Price Index is carried out by the HCSO with the 19 regional offices.
3. Sampling method
The representative character of data must be considered a requirement in consumer price statistics, as well, tothe extent that concentration and its random techniques are employed simultaneously and compromise caninevitably be reached with respect to practical organisational solution.
The sampling methods of price observation are used the following issues:
3.1. Selection of items3.2. Selection of localities3.3. Selection of outlets3.4.Number of recorded prices
Sample size is: 1100 selected items, about 100 selected localities, and more than 8000 selected outlets. Randomsampling method (except HBS) is not used, so no information is available about sampling errors and non-sampling errors.
3.1. Selection of items
The selection of representative items is realised by the CSO, in a concentrated way.
The selected goods and services are consumed by households and their prices movement are representative forall items.
The list of items is revised every year. The appearance of new products and disappearance of old products aretaken into consideration annually.
eureurostatostat
20 15th CEIES seminar: Inflation in Europe — Different measures and their users
The selected representative items present the most important elements in the consumption expenditure of thepopulation. Their number decreased considerably while the number of recorded prices per representative itemincreased. These changes were related to the fact that while the dispersion of the price indices of representativeitems was abating, as is to be expected, the regional dispersion of the prices of representative items was growingin the wake of the development of a market economy.
The CPI covers the goods and services purchased by the population for the direct satisfaction of human needsin households:
- purchases on the market of durable and non-durable goods, except for houses, apartments, andpurchases of tools or special clothing needed for work,
- purchases of market services, - the imputed rents of owner-occupied dwellings.
The CPI does not cover those elements of consumption which are not purchased: the consumption from the ownproduction of the households, (social) benefits in kind, gifts, domestic services produced for themselves byhouseholds. The black market prices are not considered.
Medical and educational costs are included up to the proportion paid by families. Health care system is mainlyfinanced by the government and that expenditure is treated as social benefits in kind of households’consumption.
In the last couple of years there has been a shift to market economy in the financing of health care but its shareis still very small. The pharmaceutical products are considered as one item, although it is further subdividedinto 500 different specifications.
The same is true for education as well. The universities and high-schools fees are taken from a special book,where these prices are listed. These prices were introduced from 1998.
Housing is very special in Hungary. The share of owner occupied dwellings is higher than in the EU countries(e.g. 92%). Rate of municipal dwellings is about 5%, and the lowest share is the market-type dwelling (renteddwellings).
Data on housing is based on municipal information and the agencies. The treatment of imputed rents, as owneroccupied housing in the computation of CPI is a difficult issue, because the real market of rented dwellings isvery small and rents practically has not been existing.
Consequently the information about these issues has no adequate economic sense; they could not serve as basefor the computation. So, we have made some estimation on imputed rent in NA for 1993 taking intoconsideration area, age and technology of the dwellings, the price of purchase of dwellings and the length ofamortisation periods. The weights are based on these calculations. As far as the price index of imputed rents isconcerned in situation mentioned above we take the solution as follows: we use for this purpose the average ofprice indices of different repair items (goods and services) in connection with dwellings.
Second-hand transactions except cars are excluded.
In 1991, CPI items were classified according to the national needs. There were and still are three levels. The 7major groups are made up of 156 basic headings (expenditure classes) of which appr. 17 per cent ishomogeneous (e.g. eggs, gas, electricity, gas, water charges) of the total. In 2001, the 156 basic headings aredivided into 1100 representative items. (Structure of CPI: e.g. Major group: 3 Clothing, footwear, Basicheading: 310 Men’s coat, Representative item: 310 01 Men’s winter coat, carded wool, 431-500g per sm.)
Between 1991 and 1996 the number of representative items was 1800, this number was reduced in the followingyears in view of the expected diminishing alterations between the price trends of different goods and services.
The descriptions of the products are available both in a detailed and less detailed form. (E.g. pork liver, fresheggs, apples or set of furniture: sofa and armchairs, upholstered, 3-4 pieces, hand mixer: 2 dough look, 2 whisk)The composition of the representative items is to allow the price collectors to choose the exact variety ofselected item.
From 2000, the CPI structure follows Eurostat regulation for HICP, it means that we use both classifications.
eureurostatostat
15th CEIES seminar: Inflation in Europe — Different measures and their users 21
The COICOP classification system is adopted into HBS and NA at the first time in the calculation for thereference year 2000. The earlier classification system does not make possible the easy and simple conversionin all cases.
3.2. Selection of localities
The sample is based mainly on the Unified System of the Household Surveys (HBS). The target population ofthis survey consists of all Hungarian citizens living in private households in the country.
The unit of sampling of HBS is the dwelling and the unit of observation is the household. The HBS is based onthe random sampling. The sampling frame is the updated census data. The sample is taken by multistratamethod. This sample covers all settlements with 15000 or more inhabitants. In cases of settlements with morethan 2000 and less than 15000 inhabitants in the first stage the settlements and in the second stage the districtshave been selected. All districts of the selected settlements with less than 2000 inhabitants are part of thesample. Different sampling fractions have been applied by size of settlements, namely in settlements with morethan 10000 and less than 50000 inhabitants the sampling fraction was 4/5, in settlements with more than 50000inhabitants it was 3/5, while in Budapest it was half of that applied in settlements with less than 10000inhabitants.
The localities for the price observation for CPI, were selected firstly with respect to the number of inhabitantsin each area.
Budapest (2 million) and the counties (8 million) are to be distinguished. Secondly, the geographicaldistribution of the 8 million inhabitants outside Budapest is to be examined in HCSO.
The concrete localities are selected by the HCSO regional offices in a concentrated way, in Budapest and allthe 19 county seats.
In selecting localities, the commercial attraction of cities and other influences distinguishing the distribution ofpurchases from the measurements of population distribution must be taken into account in addition topopulation dimension.
The number of selected localities for the calculation of the consumer price index is about 100.
3.3. Selection of outlets
The representative items are priced in more than 8000 outlets. Since we have some difficulties with a centraloutlets register, the selection of concrete outlets within the localities is the task of the HCSO regional offices.
The outlets are chosen to be representative as far as possible.
Primarily the shops, service places, markets etc. with the greatest turnover and the largest assortment of goodshave to be selected in such a way that the standard should be approximated optimally. Small shops are alsoincluded in the sample. The observation does not extend to such special forms of trading as marketing by post,shipping trade, automatic vending, tax-free shops, e-commerce, which has small market recently. The newoutlet chains, shopping centres are included.
When an item disappears from an outlet and is replaced by an item at an other outlet, the current rule is to treatthe replacement as if it had been made at the same outlet.
The sample of outlets is updated every year, in December.
3.4. Number of recorded prices:
The standard number of prices are determined according to the number of inhabitants, consequently respectexpenditures too.
The HCSO formed following 4 groups:
- the first group includes the counties where the population is less than 400 thousand (14 counties)- the second group contains the counties with a population between 400 and 500 thousand (3 counties)- the third group includes the counties with a population between 500 and 700 thousand (2 counties)- the fourth group is Budapest with more than 2 million inhabitants.
eureurostatostat
22 15th CEIES seminar: Inflation in Europe — Different measures and their users
Due to the higher income situation, the urban population can make more purchases than inhabitants of ruralvillages which is just such a fact. In addition food shopping in villages is smaller as well because own accountproduction for more of personal consumption.
For these reasons, the number of purchases per inhabitants is much greater in the cities than in the villages. Inthe case of foods, beverages and tobacco and everyday household wares, the differences are more moderatewhile with respect to industrial products and services, they are greater.
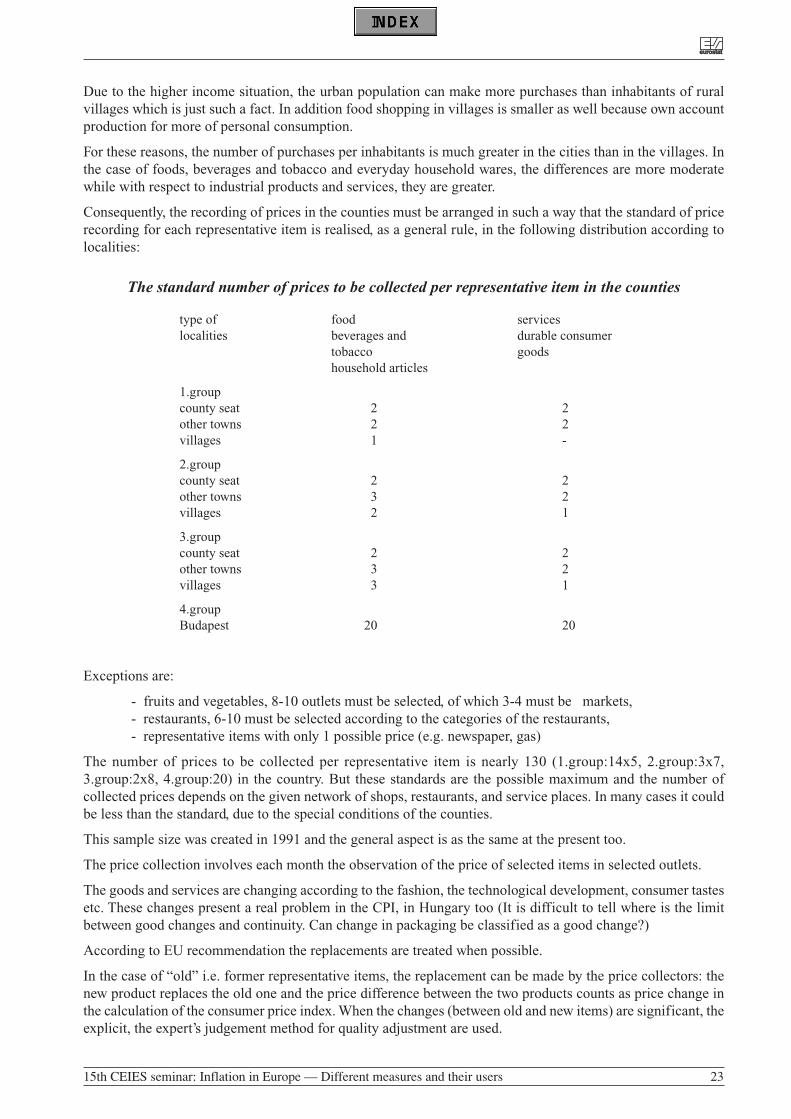
Consequently, the recording of prices in the counties must be arranged in such a way that the standard of pricerecording for each representative item is realised, as a general rule, in the following distribution according tolocalities:
The standard number of prices to be collected per representative item in the counties
type of food serviceslocalities beverages and durable consumer
tobacco goodshousehold articles
1.groupcounty seat 2 2other towns 2 2villages 1 -
2.groupcounty seat 2 2other towns 3 2villages 2 1
3.groupcounty seat 2 2other towns 3 2villages 3 1
4.groupBudapest 20 20
Exceptions are:
- fruits and vegetables, 8-10 outlets must be selected, of which 3-4 must be markets,- restaurants, 6-10 must be selected according to the categories of the restaurants,- representative items with only 1 possible price (e.g. newspaper, gas)
The number of prices to be collected per representative item is nearly 130 (1.group:14x5, 2.group:3x7,3.group:2x8, 4.group:20) in the country. But these standards are the possible maximum and the number ofcollected prices depends on the given network of shops, restaurants, and service places. In many cases it couldbe less than the standard, due to the special conditions of the counties.
This sample size was created in 1991 and the general aspect is as the same at the present too.
The price collection involves each month the observation of the price of selected items in selected outlets.
The goods and services are changing according to the fashion, the technological development, consumer tastesetc. These changes present a real problem in the CPI, in Hungary too (It is difficult to tell where is the limitbetween good changes and continuity. Can change in packaging be classified as a good change?)
According to EU recommendation the replacements are treated when possible.
In the case of “old” i.e. former representative items, the replacement can be made by the price collectors: thenew product replaces the old one and the price difference between the two products counts as price change inthe calculation of the consumer price index. When the changes (between old and new items) are significant, theexplicit, the expert’s judgement method for quality adjustment are used.
eureurostatostat
15th CEIES seminar: Inflation in Europe — Different measures and their users 23
In the case of “new” representative items, there are centrally defined replacements i.e. the introduction of newproducts follows the annual revision. So, in December each year new product-offers are introduced in overlappricing.
If a price is missing, imputation is applied. In compliance with the EU requirements, as of 1997, the imputedprices are used for the missing data. The estimated prices are computed from the latest price multiplied by theaverage regional index of the given representative item. The estimated (imputed) price shall be used for twomonths.
4. Data sources
4.1. Weights
The weights concerning 156 basic headings are derived from the data of the National Accounts (NA). Thesedata are mainly on Household Budget Survey (HBS) and other additional sources. The regular HouseholdBudget Survey is based on random sample of household.
Weights –expenditure of households- are revised annually and refers to the annual consumption two years priorto the current year. For example, the weights used in 2001 show the expenditure structure of 1999.
The weights of the representative items are derived from macro level sources, expert estimations or othersources. Some representative items have equal weight in the basic heading. This feature is used in the case ofrelatively homogeneous content and the requisite number (at least ten) of representative items.
The weight structure (except fresh fruits and vegetables) is remaining the same every month throughout theyear.
4.2. Prices
The CPI is based on observation of market prices. The actual price paid (charged) on the day (month) of pricecollecting has to be observed. Consumer credit charges are excluded; seasonal sales are included in CPI. Lowerprice for pensioner, student’s etc. (e.g. air-plane ticket) is excluded.
Price collection is well spread over the area of the counties. There are now about 100 towns, cities in the index.The product-offers (price’s observation) is appr. 100000.
The consumer price statistics have three pillars: the HCSO, the regional offices and the HCSO computer center.
In this context, the task of the consumer price statistics section of the HCSO is to determine the requirementsand numerical standards of the price collection program.
The task of the regional offices is the collection of the prices. Price collectors work under the guidance of theperson responsible for the consumer price statistics. The price collectors are employed partly full-time andpartly for part-time labour in the regional i.e. local offices of the HCSO and they use the traditionalquestionnaire.
The observation time extends from the 2nd to 22nd day of every month. The prices collected are stored by the PCs of the CSO local offices and are transmitted after having been controlled to the CSO computer center.
The deadline for transmission is the 1-st day of the next month.
Most of the representative items are collected in the selected outlets. The rate of their weights is 74,5% of thetotal and their number is 973. Regarding certain representative items such as railway ticket, television licences,newspaper, telecommunication, insurances, gas, electricity prices are collected centrally. Their weight is 22,5%of the total and their number is 111.
For certain representative items such as rents, local transport, water charges, prices are collected at the localauthorities. Their weights amount to 3% of the total and their number is 16.
5. Publication
The HCSO has an advance release calendar for all publications on the Internet website.
eureurostatostat
24 15th CEIES seminar: Inflation in Europe — Different measures and their users
The CPI is published on the 11th of the following month. The indices are final when first released.
The present publication contains the indices of 7 major groups of consumer expenditure and the indices of 12major groups of COICOP too. The price indices of selected items, and groups of commodities are publishedmonthly, quarterly and yearly on difference bases.
The price indices of different types of households by using the weights of the family expenditure structure arealso published each year.
Other type of Consumer Price Indices in Hungary are as follow:
CORE INFLATION
Core inflation is basically a communications medium, which attempts to guide economic agents’ thinking aboutinflation and the inflation expectations. In contrast with headline indices, which describe past price movement,core inflation indicators are forward-looking, in harmony with the approach of monetary policy.
So, the resulting index provides a useful additional tool for analysing inflationary pressures.
Since August 1999, the HCSO and Hungarian National Bank (HNB) have been calculating and publishing thecore inflation, their own core inflation indicators using different methods.
The HCSO follows OECD’s calculation, the only difference is all food product only the non-processed foodsare excluded.
Core inflation rate is published by HCSO every month in the same time as the consumer price index.
The scope of HCSO core inflation is narrower than CPI; the following product categories are eliminated:
– non-processed food (pork, beef and veal, mutton, rabbit and other meat, edible offal’s, poultry meat,fish, eggs, potatoes, fresh vegetables, fresh domestic and tropical fruits)
– Electricity, gas and other fuels (briquettes, coke, firewood, purchased heat, electricity, natural,manufactured, butane and propane gas)
– Motor fuels and oils
The main differences between the core inflation calculated by the HCSO and NBH are in the coverage:
The HCSO core inflation covers about 80% of items of CPI and the NBH core inflation: about 90%.
This summer the HCSO and NBH have agreed to develop a new core inflation indicator calculated using astandard method.
This index will be calculated by HCSO. The first release of the new indicator will be published by HCSO onFebruary 2002.
From January 2002, core inflation will be delivered from the CPI by eliminating the following productcategories:
- non-processed foods and other seasonal goods,- energy with market-determined price,- goods and services with regulated price, including energy with regulated price- services owner-occupied dwelling.
Therefore the coverage of core inflation rate will be about 65 percentage.
HARMONISED CONSUMER PRICE INDEX (HICP)
The efforts to harmonise the methods of calculating the consumer price indices are aiming at makingcomparable the rate of inflation of EU Member States and Candidate Countries. The EU regulations andGuidelines are setting the legal basis for the establishment of harmonised methodology for compiling consumerprice indices. The harmonisation process is led by EUROSTAT in close co-operation with the nationalstatistical offices. This implementing of these methodological changes on the Hungarian Consumer PriceIndices is also actual task.
eureurostatostat
15th CEIES seminar: Inflation in Europe — Different measures and their users 25
HICPs are not and will never be „fully” harmonised consumer price indices; in as much as the aim iscomparability and not full harmonisation.
The HICPs are not intended to replace national CPIs. The countries allowed continue the calculation theirexisting CPIs for domestic purposes.
The calculation of HICP started with the index for January 1997, in Member States and for January 2000,Candidate Countries.
The HICP are based entirely on modified national CPIs, adjusted solely so as to make the coverage of goodsand services as similar as possible.
The major characteristics of the interim Hungarian HICP are the following:
The interim indices were based entirely on existing national CPIs (except owner occupied housing andgambling).
The coverage of HICP is determined by COICOP/HICP.
The domestic concept was introduced from January 2001. This means that the expenditures of foreign touristand border-shoppers are covered.
The assessment of quality changes has been made from January 2000; this work has been carried outcontinuously. From 2001, a new price collection form was introduced. Explicit quality codes for replacementsis used, which could be analysed. The EUROSTAT rule of maximum 2 months of missing prices is strictlyapplied.
The common index reference period has been the year 1996.
Reference:
“What is the actual question for Hungarian CPI” Eva Maria Szabo, Statistical Review, Budapest, 2001.
“Harmonisation of Consumer Price Indices” Eva Maria Szabo, Erzsébet Kerékgyártó, Erzsébet Melega,Statistical Review, Budapest, 1999.
“The selection method of items, localities and outlets, the determination of their number and frequency of pricecollection in Hungary” Eva Maria Szabó Central Statistical Office Budapest, 1996.
“The renewal of the Hungarian Consumer Price Index” Mihály Zafir, Central Statistical Office Budapest, 1991
eureurostatostat
26 15th CEIES seminar: Inflation in Europe — Different measures and their users
GERMANY’S CONSUMER PRICE INDEX
ELBEL GüntherStatistisches BundesamtGustav-Stresemann-Ring 11D-65189 [email protected]
Basic principles
• The German consumer price index (cost-of-living price index) is a fixed-base Laspeyres index that is re-weighted at five-yearly intervals. The price, weighting and index bases are all identical (generally calendaryears ending in the digit 0 or 5). The current base year is 1995, and the new base will be 2000 from the startof 2003.
• Germany’s consumer price index is based on the domestic approach, i.e. it includes all purchase transactionson the economic territory (particularly purchases by foreign tourists in Germany, but not expenditure byGerman tourists abroad).
• The German CPI should include all consumption expenditure by private households. Account must be takenof all types of household, including institutional households (as from 2003) and all regions in the economicarea.
Purpose and use
The aim of the German consumer price index is to measure inflation from the point of view of privatehouseholds. It is specifically designed not to be a constant utility index (COLI). It is used as an importantindicator of economic and financial policy by politicians, the central banks, the two sides of industry, economicresearch institutes, enterprises and the like. It forms the basis for deflating overall economic parameters (e.g.for the national accounts, though for this purpose it must be adapted to somewhat different conceptualrequirements). It is under close scrutiny from the media, and another important use to which it is put is tostabilise the value of regular payments in private-contract laws (rents, transfer of businesses on retirement, etc.).
Derivation of weightings
The weightings used in the German consumer price index are derived primarily from household budgetsurveys. In Germany, this means the sample survey on income and consumption and household budget surveystatistics. Sources also include the national accounts, tax statistics, other official statistics, the Bundesbank’sbalance-of-payment statistics, departmental statistics, studies by research institutes, figures compiled byassociations, etc. Finally, there are the independent studies conducted by consumer price statisticians. In all,weightings are published for around 700 groups of goods.1
eureurostatostat
15th CEIES seminar: Inflation in Europe — Different measures and their users 27
1 A more detailed report entitled “Die Berechnung der Wägungsschemata für die Preisindizes für die Lebenshaltung” [The calculation of weightingmechanisms for the cost-of-living price index, in German] can be found in Wirtschaft und Statistik, No 3/1999. Data on detils of weighting schemescan also be downloaded from the Internet.
Calculation of basic aggregates
For these 700 or so groups of goods, monthly prices are recorded, mostly on a decentralised basis in thereporting municipalities but in some cases centrally by the Statistisches Bundesamt. For each group of goodsin the decentralised price survey there are also regional weightings for 16 Länder (there are currently still twoweightings for West and East Berlin) and in some cases a weighting for the central survey of the mail orderbusiness. Within the basic aggregates, efforts are made to apply a self-weighting sample (selection of the mostvisited businesses in the reporting municipalities, selection of best-selling items in individual businesses).
The Statistisches Bundesamt carries out a central survey of price schedules (e.g. post and telecommunicationsservices, railways, flights, insurance, issue of passports, etc.), of prices that are valid throughout Germany (suchas package holidays, newspapers, magazines, cigarettes), of goods subject to price-fixing arrangements(books), of major nation-wide suppliers (e.g. construction enterprises in the social housing sector), of list prices(cars) and of goods and services with a fixed price duration (e.g. cable cars, funicular railways, ferries). Forthese goods, efforts are made to establish (at least approximately) unpublished volume-based partial weightings(enterprise weightings, weightings for individual survey headings, etc.).
The basic indices are then calculated as measurements of arithmetically standardised mean prices.
Price survey
Every month (between the 10th and the 15th), around 350 000 unit prices are recorded in 190 reportingmunicipalities (and centrally by the Statistisches Bundesamt). Selection of the reporting municipalities for thedecentralised price survey takes account of their regional distribution and number of inhabitants. Changes arenot normally made to this sample. The selection of reporting sites is updated every five years, as is the sampleof goods, when the changeover is made to a new price base year. If necessary - e.g. if a reporting site closes -a replacement must be found immediately, preferably in the same business category. The same applies to thesurvey headings: if the price for a particular item can no longer by recorded, the price of a replacement productshould immediately be included (preferably the previous month’s price too, in order to produce overlappingtime series where possible).
Publication of the consumer price indices
Once recorded, the prices are used by the Land statistical offices to calculate price indices for 12 Länder (someof the smaller Länder do not publish their own consumer price indices), whilst the Statistisches Bundesamtcalculates the price index for the standard of living of all private households, the retail trade price index and theHoreca price index (the latter are needed primarily to deflate other statistical figures such as retail tradeturnover, though they are also used in index clauses). At present, the Statistisches Bundesamt also records eightdifferent price indices for the standard of living for the former territory of the Federal Republic and the newLänder, and for special types of household, though it will only do so until the end of 2002.
In addition to the breakdown according to the Classification of Individual Consumption by Purpose (COICOP)or the Classification of the Income and Expenditure of Private Households (SEA), the Statistisches Bundesamtcalculates indices for various special breakdowns and aggregates, e.g. an index for seasonal goods (and anoverall index that does not include seasonal goods), an index for administered prices (and an overall index thatdoes not include administered prices), an overall index that does not include heating oil and fuels, and a driver’sprice index. However, the Statistisches Bundesamt does not designate any of these as indicators of “coreinflation”. The breakdown of detailed results (for around 700 groups of goods) and their weightings means thatusers can quite readily calculate special indices for their own purposes.
A provisional result is estimated on the basis of definitive results for six Länder (North Rhine-Westphalia,Hessen, Baden-Württemberg, Bavaria, Brandenburg and Saxony). Use is made of multilinear regression, whichprovides an overall result for the Federal Republic as a whole (without any type of breakdown) that generallydeviates from the final result by a maximum of +/-0.1%.
Most of the findings are published in press releases, in specialist series 17 (rapid report, monthly report, annualreport, long time series) and on the Internet (www.statistik-bund.de � Figures and facts � Basic data �Consumer price indices). For a fee, detailed results may be ordered from the time series service (www.statistik-
eureurostatostat
28 15th CEIES seminar: Inflation in Europe — Different measures and their users
bund.de � Figures and facts � Time series). Seasonally adjusted figures (using the BV-4 method) for someaggregates are also available on the Internet (via � Figures and facts � Indicators). Some data are alsoavailable via a recorded message service (Tel.: 0611/75-2888) and by fax (Fax no: 0611/75-3888), these beingare updated on a daily basis.
Revisions
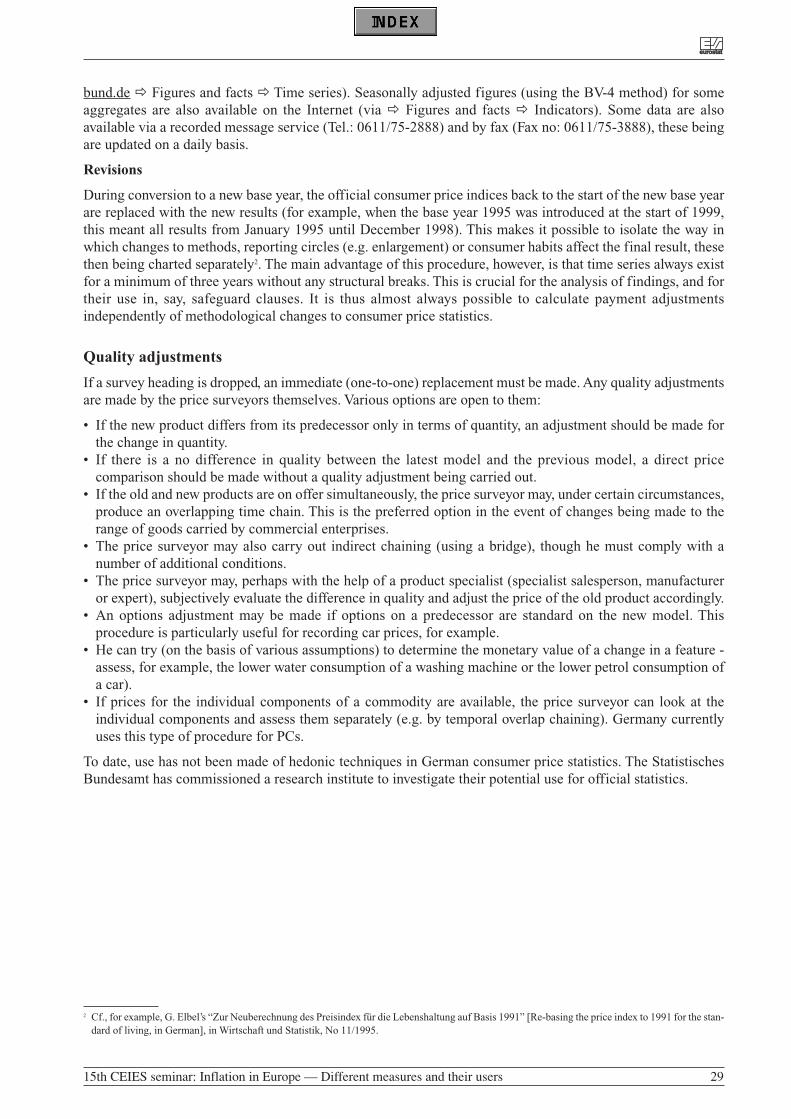
During conversion to a new base year, the official consumer price indices back to the start of the new base yearare replaced with the new results (for example, when the base year 1995 was introduced at the start of 1999,this meant all results from January 1995 until December 1998). This makes it possible to isolate the way inwhich changes to methods, reporting circles (e.g. enlargement) or consumer habits affect the final result, thesethen being charted separately2. The main advantage of this procedure, however, is that time series always existfor a minimum of three years without any structural breaks. This is crucial for the analysis of findings, and fortheir use in, say, safeguard clauses. It is thus almost always possible to calculate payment adjustmentsindependently of methodological changes to consumer price statistics.
Quality adjustments
If a survey heading is dropped, an immediate (one-to-one) replacement must be made. Any quality adjustmentsare made by the price surveyors themselves. Various options are open to them:
• If the new product differs from its predecessor only in terms of quantity, an adjustment should be made forthe change in quantity.
• If there is a no difference in quality between the latest model and the previous model, a direct pricecomparison should be made without a quality adjustment being carried out.
• If the old and new products are on offer simultaneously, the price surveyor may, under certain circumstances,produce an overlapping time chain. This is the preferred option in the event of changes being made to therange of goods carried by commercial enterprises.
• The price surveyor may also carry out indirect chaining (using a bridge), though he must comply with anumber of additional conditions.
• The price surveyor may, perhaps with the help of a product specialist (specialist salesperson, manufactureror expert), subjectively evaluate the difference in quality and adjust the price of the old product accordingly.
• An options adjustment may be made if options on a predecessor are standard on the new model. Thisprocedure is particularly useful for recording car prices, for example.
• He can try (on the basis of various assumptions) to determine the monetary value of a change in a feature -assess, for example, the lower water consumption of a washing machine or the lower petrol consumption ofa car).
• If prices for the individual components of a commodity are available, the price surveyor can look at theindividual components and assess them separately (e.g. by temporal overlap chaining). Germany currentlyuses this type of procedure for PCs.
To date, use has not been made of hedonic techniques in German consumer price statistics. The StatistischesBundesamt has commissioned a research institute to investigate their potential use for official statistics.
eureurostatostat
15th CEIES seminar: Inflation in Europe — Different measures and their users 29
2 Cf., for example, G. Elbel’s “Zur Neuberechnung des Preisindex für die Lebenshaltung auf Basis 1991” [Re-basing the price index to 1991 for the stan-dard of living, in German], in Wirtschaft und Statistik, No 11/1995.
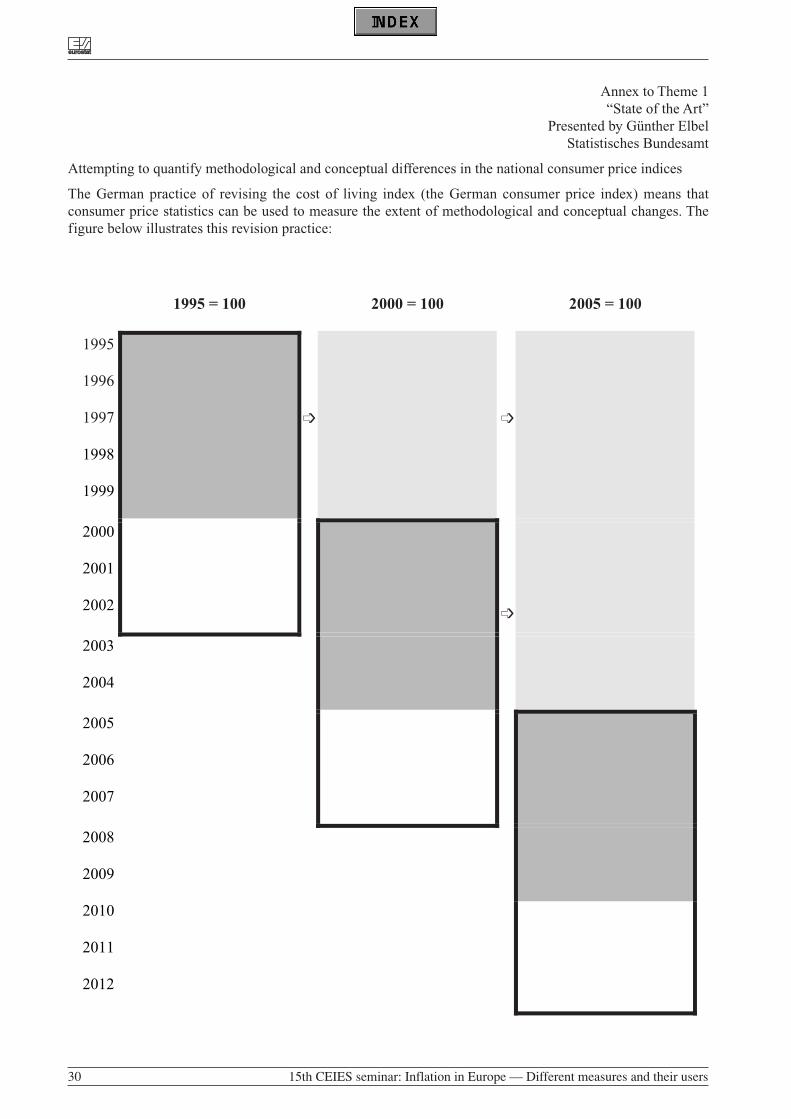
Annex to Theme 1“State of the Art”
Presented by Günther ElbelStatistisches Bundesamt
Attempting to quantify methodological and conceptual differences in the national consumer price indices
The German practice of revising the cost of living index (the German consumer price index) means thatconsumer price statistics can be used to measure the extent of methodological and conceptual changes. Thefigure below illustrates this revision practice:
eureurostatostat
30 15th CEIES seminar: Inflation in Europe — Different measures and their users
1995 = 100 2000 = 100 2005 = 100
1995
1996
1997
1998
1999
2000
2001
2002
2003
2004
2005
2006
2007
2008
2009
2010
2011
2012
➩ ➩
➩
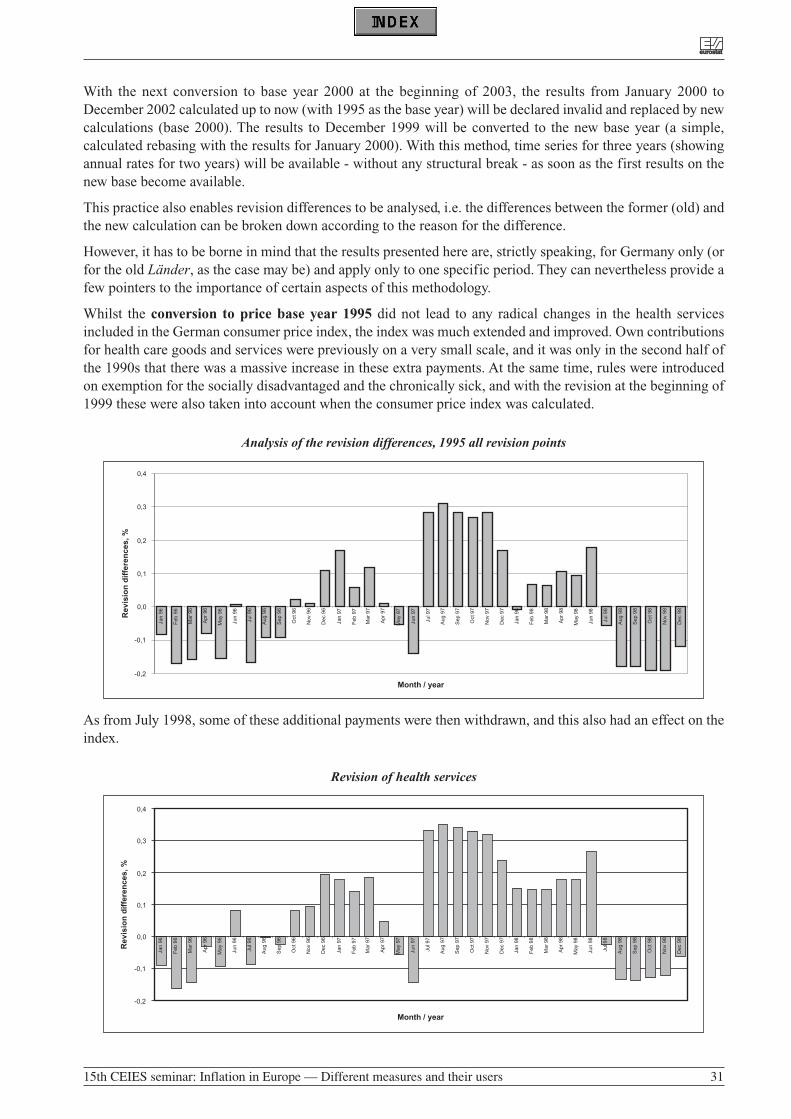
With the next conversion to base year 2000 at the beginning of 2003, the results from January 2000 toDecember 2002 calculated up to now (with 1995 as the base year) will be declared invalid and replaced by newcalculations (base 2000). The results to December 1999 will be converted to the new base year (a simple,calculated rebasing with the results for January 2000). With this method, time series for three years (showingannual rates for two years) will be available - without any structural break - as soon as the first results on thenew base become available.
This practice also enables revision differences to be analysed, i.e. the differences between the former (old) andthe new calculation can be broken down according to the reason for the difference.
However, it has to be borne in mind that the results presented here are, strictly speaking, for Germany only (orfor the old Länder, as the case may be) and apply only to one specific period. They can nevertheless provide afew pointers to the importance of certain aspects of this methodology.
Whilst the conversion to price base year 1995 did not lead to any radical changes in the health servicesincluded in the German consumer price index, the index was much extended and improved. Own contributionsfor health care goods and services were previously on a very small scale, and it was only in the second half ofthe 1990s that there was a massive increase in these extra payments. At the same time, rules were introducedon exemption for the socially disadvantaged and the chronically sick, and with the revision at the beginning of1999 these were also taken into account when the consumer price index was calculated.
Analysis of the revision differences, 1995 all revision points
As from July 1998, some of these additional payments were then withdrawn, and this also had an effect on theindex.
Revision of health services
-0,2
-0,1
0,0
0,1
0,2
0,3
0,4
Jan
96
Feb
96
Mar
96
Apr
96
May
96
Jun
96
Jul9
6
Aug
96
Sep
96
Oct
96
Nov
96
Dec
96
Jan
97
Feb
97
Mar
97
Apr
97
May
97
Jun
97
Jul9
7
Aug
97
Sep
97
Oct
97
Nov
97
Dec
97
Jan
98
Feb
98
Mar
98
Apr
98
May
98
Jun
98
Jul9
8
Aug
98
Sep
98
Oct
98
Nov
98
Dec
98
Rev
isio
n d
iffe
ren
ces,
%
Month / year
-0,2
-0,1
0,0
0,1
0,2
0,3
0,4
Mar
96
Apr
96
May
96
Jun
96
Jul9
6
Aug
96
Sep
96
Oct
96
Nov
96
Dec
96
Jan
97
Feb
97
Mar
97
Apr
97
May
97
Jun
97
Jul9
7
Aug
97
Sep
97
Oct
97
Nov
97
Dec
97
Jan
98
Feb
98
Mar
98
Apr
98
May
98
Jun
98
Jul9
8
Aug
98
Sep
98
Oct
98
Nov
98
Dec
98
Rev
isio
n d
iffe
ren
ces,
%
Jan
96
Feb
96
Month / year
eureurostatostat
15th CEIES seminar: Inflation in Europe — Different measures and their users 31
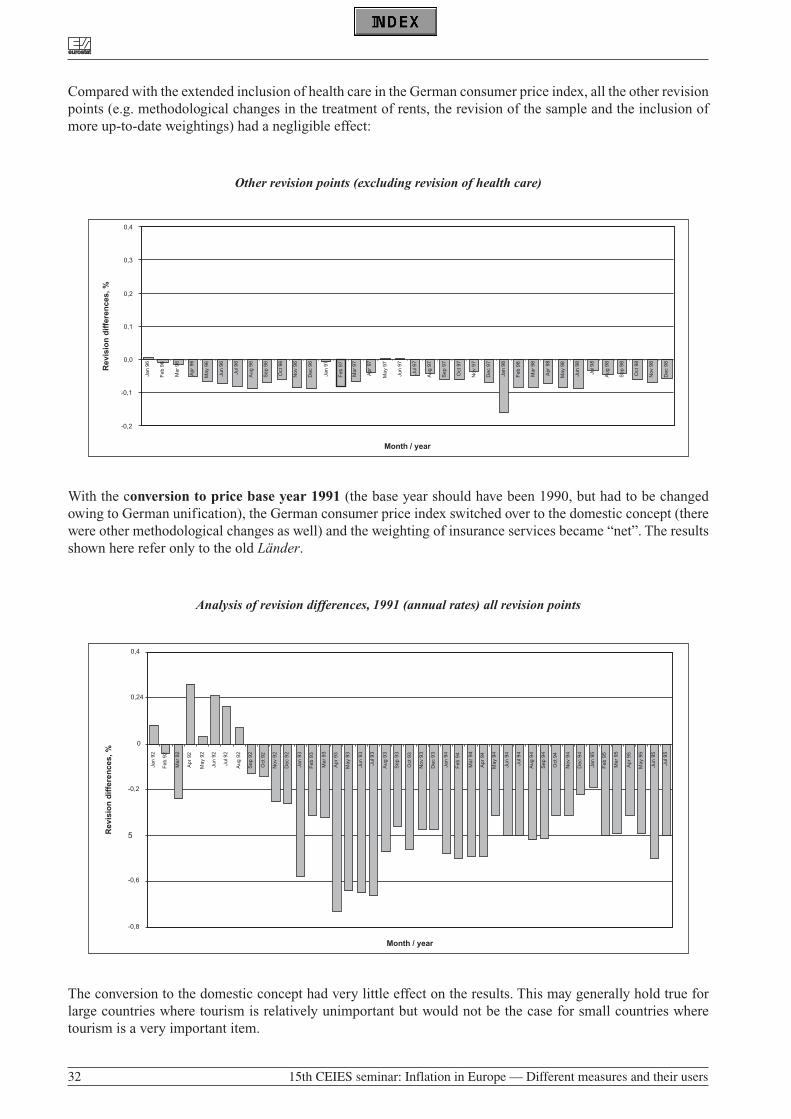
Compared with the extended inclusion of health care in the German consumer price index, all the other revisionpoints (e.g. methodological changes in the treatment of rents, the revision of the sample and the inclusion ofmore up-to-date weightings) had a negligible effect:
Other revision points (excluding revision of health care)
With the conversion to price base year 1991 (the base year should have been 1990, but had to be changedowing to German unification), the German consumer price index switched over to the domestic concept (therewere other methodological changes as well) and the weighting of insurance services became “net”. The resultsshown here refer only to the old Länder.
Analysis of revision differences, 1991 (annual rates) all revision points
The conversion to the domestic concept had very little effect on the results. This may generally hold true forlarge countries where tourism is relatively unimportant but would not be the case for small countries wheretourism is a very important item.
-0,8
-0,6
5
-0,2
0
0,24
0,4
Jan
92
Feb
92
Mar
92
Apr
92
Ma y
92
Jun
92
Jul9
2
Aug
92
Sep
92
Oct
92
Nov
92
Dec
92
Jan
93
Feb
93
Mar
93
Apr
93
Ma y
93
Jun
93
Jul9
3
Aug
93
Sep
93
Oct
93
Nov
93
Dec
93
Jan
94
Feb
94
Mar
94
Apr
94
Ma y
94
Jun
94
Jul9
4
Aug
94
Sep
94
Oct
94
Nov
94
Dec
94
Jan
95
Feb
95
Mar
95
Apr
95
Ma y
95
Jun
95
Jul9
5
Rev
isio
n d
iffe
ren
ces,
%
Month / year
-0,2
-0,1
0,0
0,1
0,2
0,3
0,4
Jan
96
Feb
96
Mar
96
Apr
96
Ma y
96
Jun
96
Jul9
6
Aug
96
Sep
96
Oct
96
Nov
96
Dec
96
Jan
97
Feb
97
Mar
97
Apr
97
Ma y
97
Jun
97
Jul9
7
Aug
97
Sep
97
Oct
97
Nov
97
Dec
97
Jan
98
Feb
98
Mar
98
Apr
98
Ma y
98
Jun
98
Jul9
8
Aug
98
Sep
98
Oct
98
Nov
98
Dec
98
Rev
isio
n d
iffe
ren
ces,
%
Month / year
eureurostatostat
32 15th CEIES seminar: Inflation in Europe — Different measures and their users
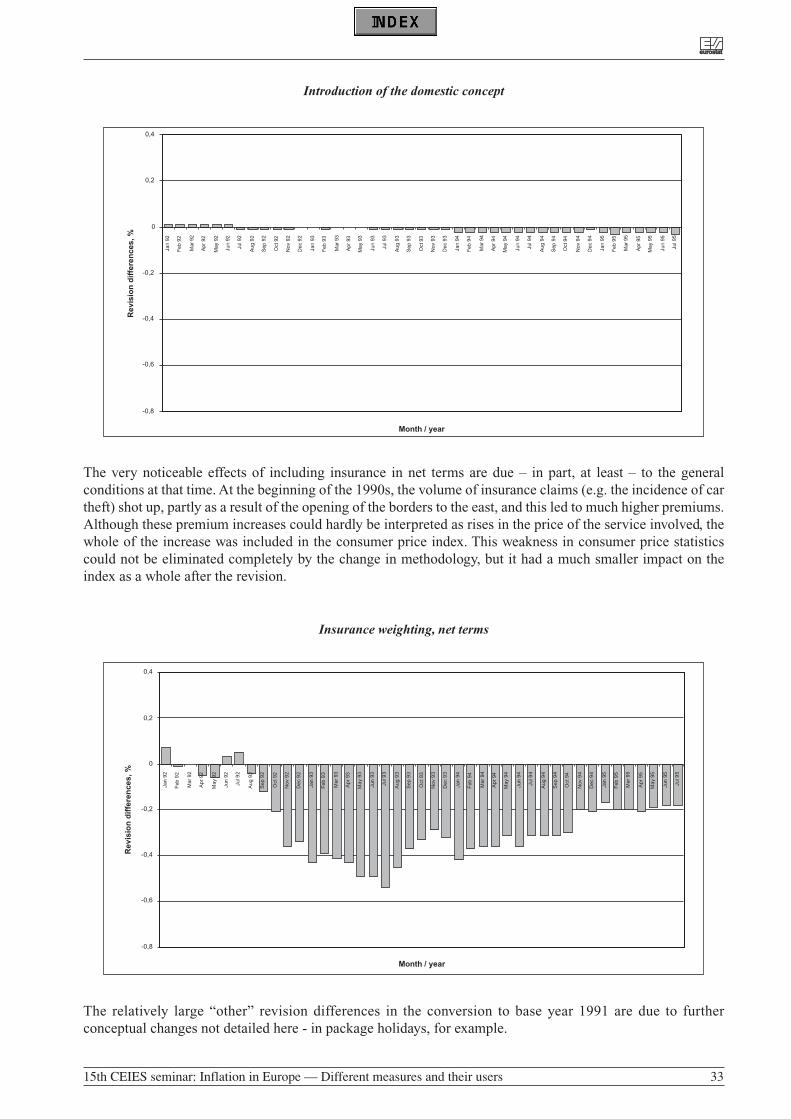
Introduction of the domestic concept
The very noticeable effects of including insurance in net terms are due – in part, at least – to the generalconditions at that time. At the beginning of the 1990s, the volume of insurance claims (e.g. the incidence of cartheft) shot up, partly as a result of the opening of the borders to the east, and this led to much higher premiums.Although these premium increases could hardly be interpreted as rises in the price of the service involved, thewhole of the increase was included in the consumer price index. This weakness in consumer price statisticscould not be eliminated completely by the change in methodology, but it had a much smaller impact on theindex as a whole after the revision.
Insurance weighting, net terms
The relatively large “other” revision differences in the conversion to base year 1991 are due to furtherconceptual changes not detailed here - in package holidays, for example.
-0,8
-0,6
-0,4
-0,2
0
0,4
Jan
92
Feb
92
Mar
92
Apr
92
Ma y
92
Jun
92
Jul9
2
Aug
92
Sep
92
Oct
92
Nov
92
Dec
92
Jan
93
Feb
93
Mar
93
Apr
93
Ma y
93
Jun
93
Jul9
3
Aug
93
Sep
93
Oct
93
Nov
93
Dec
93
Jan
94
Feb
94
Mar
94
Apr
94
Ma y
94
Jun
94
Jul9
4
Aug
94
Sep
94
Oct
94
Nov
94
Dec
94
Jan
95
Feb
95
Mar
95
Apr
95
Ma y
95
Jun
95
Jul9
5
0,2
Rev
isio
n d
iffe
ren
ces,
%
Month / year
-0,8
-0,6
-0,4
-0,2
0
0,2
0,4
Jan
92
Feb
92
Mar
92
Apr
92
May
92
Jun
92
Jul9
2
Aug
92
Sep
92
Oct
92
Nov
92
Dec
92
Jan
93
Feb
93
Mar
93
Apr
93
May
93
Jun
93
Jul9
3
Aug
93
Sep
93
Oct
93
Nov
93
Dec
93
Jan
94
Feb
94
Mar
94
Apr
94
May
94
Jun
94
Jul9
4
Aug
94
Sep
94
Oct
94
Nov
94
Dec
94
Jan
95
Feb
95
Mar
95
Apr
95
May
95
Jun
95
Jul9
5
Rev
isio
n d
iffe
ren
ces,
%
Month / year
eureurostatostat
15th CEIES seminar: Inflation in Europe — Different measures and their users 33
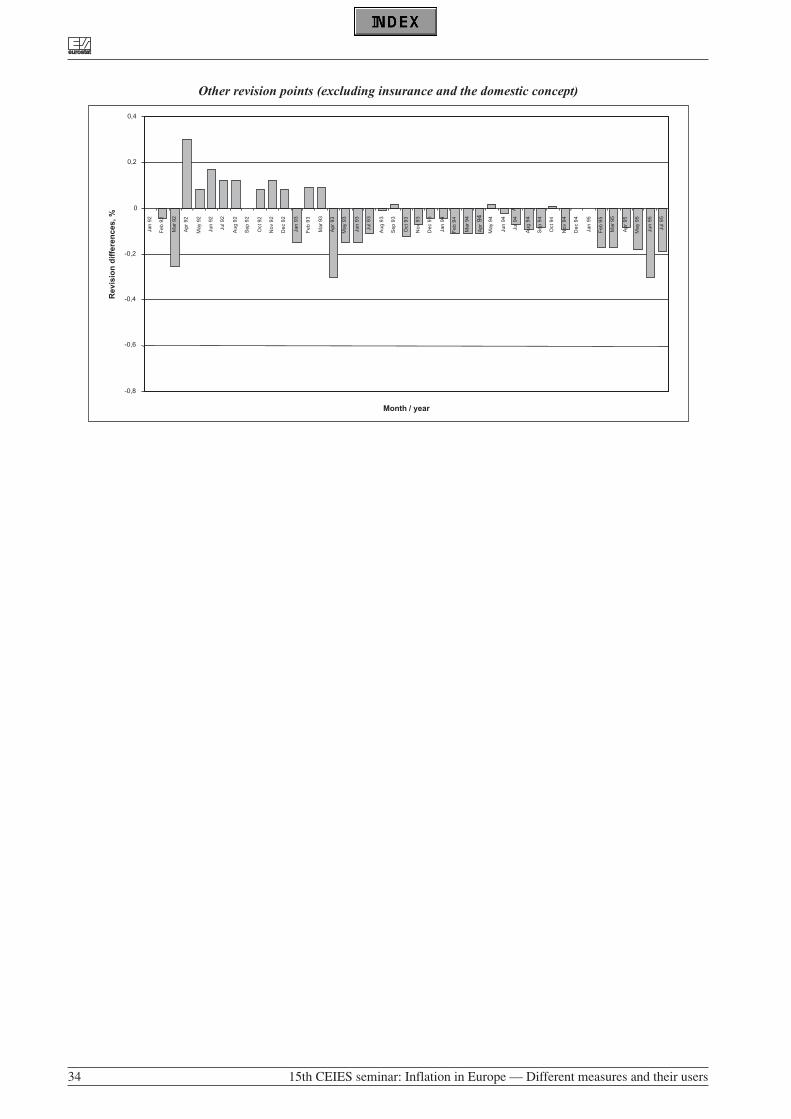
Other revision points (excluding insurance and the domestic concept)
-0,8
-0,6
-0,4
-0,2
0
0,2
0,4
Jan
92
Feb
92
Mar
92
Apr
92
Ma y
92
Jun
92
Jul9
2
Aug
92
Sep
92
Oct
92
Nov
92
Dec
92
Jan
93
Feb
93
Mar
93
Apr
93
Ma y
93
Jun
93
Jul9
3
Aug
93
Sep
93
Oct
93
Nov
93
Dec
93
Jan
94
Feb
94
Mar
94
Apr
94
Ma y
94
Jun
94
Jul9
4
Aug
94
Sep
94
Oct
94
Nov
94
Dec
94
Jan
95
Feb
95
Mar
95
Apr
95
Ma y
95
Jun
95
Jul9
5
Rev
isio
n d
iffe
ren
ces,
%
Month / year
eureurostatostat
34 15th CEIES seminar: Inflation in Europe — Different measures and their users
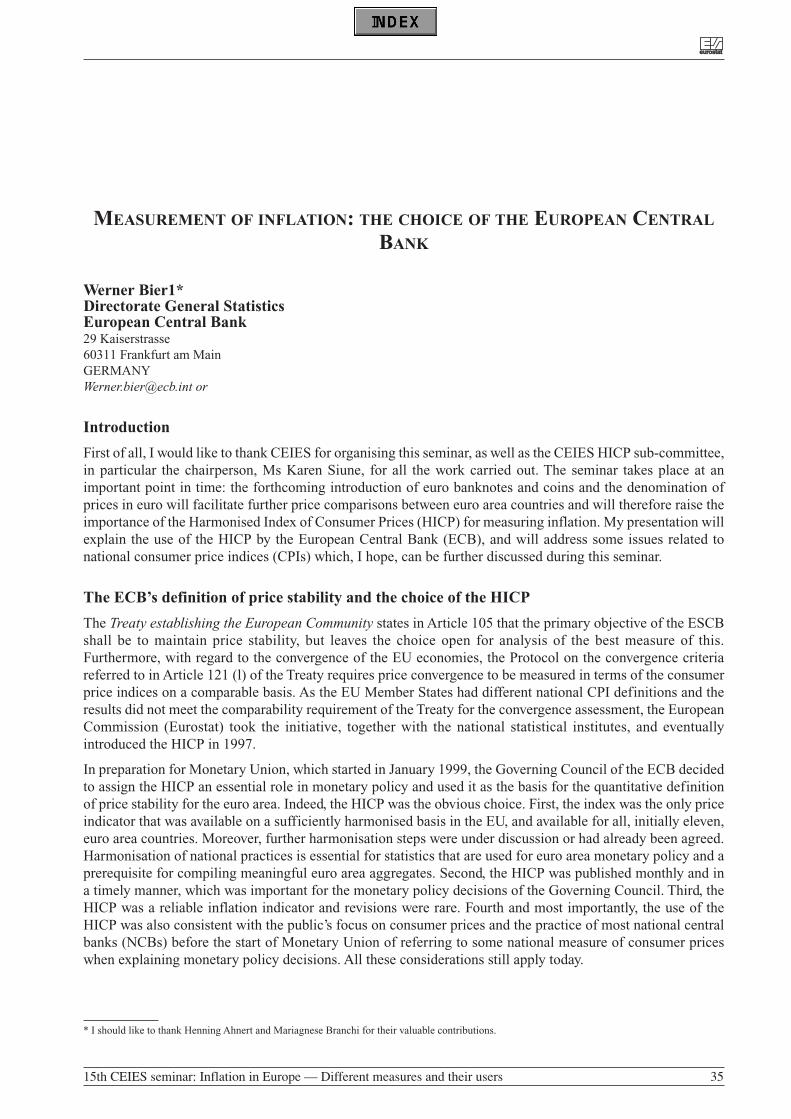
MEASUREMENT OF INFLATION: THE CHOICE OF THE EUROPEAN CENTRAL
BANK
Werner Bier1*Directorate General StatisticsEuropean Central Bank29 Kaiserstrasse60311 Frankfurt am [email protected] or
Introduction
First of all, I would like to thank CEIES for organising this seminar, as well as the CEIES HICP sub-committee,in particular the chairperson, Ms Karen Siune, for all the work carried out. The seminar takes place at animportant point in time: the forthcoming introduction of euro banknotes and coins and the denomination ofprices in euro will facilitate further price comparisons between euro area countries and will therefore raise theimportance of the Harmonised Index of Consumer Prices (HICP) for measuring inflation. My presentation willexplain the use of the HICP by the European Central Bank (ECB), and will address some issues related tonational consumer price indices (CPIs) which, I hope, can be further discussed during this seminar.
The ECB’s definition of price stability and the choice of the HICP
The Treaty establishing the European Community states in Article 105 that the primary objective of the ESCBshall be to maintain price stability, but leaves the choice open for analysis of the best measure of this.Furthermore, with regard to the convergence of the EU economies, the Protocol on the convergence criteriareferred to in Article 121 (l) of the Treaty requires price convergence to be measured in terms of the consumerprice indices on a comparable basis. As the EU Member States had different national CPI definitions and theresults did not meet the comparability requirement of the Treaty for the convergence assessment, the EuropeanCommission (Eurostat) took the initiative, together with the national statistical institutes, and eventuallyintroduced the HICP in 1997.
In preparation for Monetary Union, which started in January 1999, the Governing Council of the ECB decidedto assign the HICP an essential role in monetary policy and used it as the basis for the quantitative definitionof price stability for the euro area. Indeed, the HICP was the obvious choice. First, the index was the only priceindicator that was available on a sufficiently harmonised basis in the EU, and available for all, initially eleven,euro area countries. Moreover, further harmonisation steps were under discussion or had already been agreed.Harmonisation of national practices is essential for statistics that are used for euro area monetary policy and aprerequisite for compiling meaningful euro area aggregates. Second, the HICP was published monthly and ina timely manner, which was important for the monetary policy decisions of the Governing Council. Third, theHICP was a reliable inflation indicator and revisions were rare. Fourth and most importantly, the use of theHICP was also consistent with the public’s focus on consumer prices and the practice of most national centralbanks (NCBs) before the start of Monetary Union of referring to some national measure of consumer priceswhen explaining monetary policy decisions. All these considerations still apply today.
eureurostatostat
15th CEIES seminar: Inflation in Europe — Different measures and their users 35
* I should like to thank Henning Ahnert and Mariagnese Branchi for their valuable contributions.
In accordance with the Treaty mandate, the Governing Council of the ECB adopted the following definition ofprice stability in autumn 1998: “Price stability shall be defined as a year-on-year increase in the HarmonisedIndex of Consumer Prices (HICP) for the euro area of below 2%”. At the same time, the Governing Councilstated that price stability “is to be maintained over the medium term.”
The upper limit of “2%” reflects the strong commitment to price stability as a means to ensure the bestconditions for economic prosperity in the euro area. The definition is in line with the monetary policyobjectives of the euro area NCBs before 1999. Furthermore, the emphasis on the term “increase” means thatdeflation, i.e. prolonged declines in the level of the HICP, would not be deemed consistent with price stability.
By defining price stability in terms of the “HICP for the euro area” as a whole, the ECB has made it clear thatwith a single monetary policy, policy decisions must reflect conditions across the euro area in its entirety, ratherthan specific national or even regional developments.
In addition, the time horizon within which the ECB conducts monetary policy in order to pursue its primaryobjective is the “medium term”. The medium-term orientation acknowledges, inter alia, the existence of short-term volatility in prices (such as that caused by changes in energy prices or taxes) which cannot and should notbe controlled by monetary policy. It also reflects the need to conduct monetary policy in a forward-looking,pre-emptive manner given the time lags in the transmission of monetary policy impulses to the price level.
In order to fulfil its primary objective of price stability, the ECB follows a strategy based on two pillars. Thefirst pillar assigns a prominent role to money as signalled by the announcement of a reference value formonetary growth (specifically, for the growth of the broad monetary aggregate, M3). It consists of a detailedanalysis of potential deviations of monetary growth from the reference value, supported and complemented byan examination of the information content of monetary aggregates and their components and counterparts forfuture price developments. The second pillar consists of a broadly based assessment of the outlook for pricedevelopments and the risks to price stability in the euro area based on a wide range of other economic andfinancial indicators including, in addition to the HICP, producer and commodity prices, wages, exchange ratesand indicators of economic activity.
Macroeconomic projections, produced jointly by staff from the ECB and the NCBs, on GDP growth and priceand cost prospects, including the HICP, are part of the analysis under the second pillar. The overall HICPdevelopment is projected over a two-year horizon, and based on “conditioning assumptions” with regard to,inter alia, unchanged short-term interest rates and bilateral euro exchange rates, the development over theprojection horizon of oil prices and of other non-energy commodity prices. The staff projections are includedtwice a year in the Governing Council’s assessment of price developments and were published for the first timein the December 2000 issue of the ECB’s Monthly Bulletin.
In the assessment of the euro area price developments under the second pillar, the ECB analyses both thegeographical and the product breakdown of the euro area HICP. While the focus is on the euro area as a whole,country data are taken into account to analyse the consequences of regional developments for the entire euroarea. As regards the product breakdown, the ECB uses, in addition to the detailed sub-indices for individualconsumption categories, a breakdown by goods and services with further details. For these analyses, the ECBalso uses different measures that exclude particular sub-components from the HICP. This is done in an attemptto eliminate volatile temporary effects and to support the analysis of the overall index change.
Caveats and advantages of the HICP
Detractors of the HICP mainly refer to the coverage or the method of calculation of the indices. I will mentionbelow two sources of criticism. However, this occasional criticism reflects the difficulties and differencesinvolved in the compilation of national CPIs and points to the main sources of non-comparability betweennational CPIs in the EU.
A controversial item regarding the coverage of the HICP is the inclusion or exclusion of owner occupiedhousing. It is currently excluded, as this is the practice in the national CPIs of eight EU Member States.Economists and statisticians have discussed for years the relevance of this item in CPIs. It is uncontroversialthat housing can be considered both as shelter and as an investment, and that a CPI should – if at all – includeonly the part related to the current shelter costs. Its price measurement is difficult in practice because actualprices for the shelter provided are not observable. The extension of coverage of the HICP in this respect is an
eureurostatostat
36 15th CEIES seminar: Inflation in Europe — Different measures and their users
issue on which Eurostat and the national statistical institutes are working extensively. They are seeking tocompile an index for owner occupied housing costs and will later decide whether, and if so how, to introduce itin the HICP. The ECB has given support to this initiative and favours in principle this further extension ofcoverage using the transaction approach for price measurement. The idea is to reflect the change in the pricelevel of housing acquired by the household sector (mainly new dwellings) and to avoid any imputed prices orthe inclusion of interest payments, because the latter would not be suitable for monetary policy purposes.
A second controversial item with regard to the HICP – and most other price statistics – are the potentialmeasurement biases, which have attracted considerable attention, especially since the publication of the BoskinReport on the US CPI in 1996. Most experts agree that the quality change bias might be non-negligible for anumber of goods and services. When a new and technically enhanced product appears on the market in placeof a product that no longer exists or has a diminishing market relevance, the true price difference between thetwo products, excluding the quality change, needs to be estimated. The quality change bias might occur whenthe true price change is overestimated as this is often assumed for high-tech goods. There are also cases inwhich the true price change may be underestimated. These effects offset each other to some extent. As a result,it is not clear whether and how the headline HICP, particularly at the euro area level, is affected by ameasurement bias, because neither its quantitative range nor its direction has been clarified. It is worth notingthat Eurostat and the national statistical institutes are carrying out substantial research in order to be able tofurther harmonise and improve the national practices for quality adjustment, both for a better measure ofinflation as well as for a better measurement of real growth in the EU.
From a more practical point of view, the lack of sufficient HICP backdata and the lower level of detail of theHICP as compared with some national CPIs are also sometimes criticised. Yet efforts have been made to ensurethat there is a minimum of ten years of backdata, starting from 1990, for the euro area, and the HICP has a levelof detail up to the three-digit COICOP indices.
The HICP has many advantages as an inflation measure, which explains its prominent role in the context ofmonetary policy. The HICP is harmonised for all EU Member States and therefore allows the analysis ofinflation developments in the EU on a comparable basis. Only from harmonised data can meaningful euro areaaggregates be compiled. This harmonisation is even extended to countries outside the EU. As from this year,eleven accession countries are compiling HICPs largely comparable to those published in the EU. It is a greatadvantage to be able to identify the developments in these economies on the basis of comparable indicators,particularly in view of the future process of EU enlargement.
Moreover, the HICP has the advantage of sharing the common ground on which a number of other indicatorsare constructed, that is the European System of Accounts 1995 (ESA 95). During the harmonisation process ofthe HICP, the index was deliberately linked to the national accounts standards in many ways, thereby improvingthe consistency and usefulness of different but connected statistics. Most importantly, the HICP coveragedefinition refers to the scope of household final monetary consumption expenditure. This is a sub-set of thenational accounts definition for private consumption. It includes only actual monetary transactions andtherefore excludes any imputed values.
The HICP covers the population as a whole. This is not always the case for national CPIs, which focus on therepresentation of a specific group of consumers, such as urban consumers or consumers in a certain age group.
Concerning the geographical coverage, the HICP refers to expenditure within the euro area territory. Bycontrast, many national CPIs use the national (or resident) concept, i.e. exclude expenditure of foreign residentsin the country and sometimes include the expenditure of the country’s residents abroad. The definition for theHICP is more appropriate for monetary policy purposes, as it is more precise and avoids potential doublecounting at the level of the euro area, even though the differences between the two concepts for such a largeeconomic area are small. The difference for national data may, however, be significant in some Member States,e.g. Spain and Luxembourg.
The HICP and National CPIs
All EU Member States publish national CPIs as distinct from the HICP. For most, though not all EU MemberStates, the divergence between national HICP series and national CPIs is relatively small. The differencesdiminish as measures introduced for the HICP are also applied in national CPIs. Two different collection and
eureurostatostat
15th CEIES seminar: Inflation in Europe — Different measures and their users 37
compilation systems would be impractical and too expensive. Remaining conceptual differences mainly resultfrom differences in coverage, in particular with regard to owner occupied housing, and in some cases from themethod of calculation of index weights or prices. However, the dichotomy between comparable and harmonisedHICPs on the one hand and national, non-harmonised CPIs on the other is increasingly hard to justify. TheHICP and national CPIs are compiled from the same sources, and although some differences exist in thecalculation of aggregate results from this source data, a tendency towards further convergence between the twois apparent.
What might the future system of consumer price indices in the EU and particularly in the euro area look like?Is there sufficient justification to continue with the separate use of the HICP for European and euro areapurposes and national CPIs for national purposes?
Only national experts can answer whether or not national CPIs will be needed in the future for nationalpurposes. Nevertheless, I should like to make a number of observations on this occasion. It is confusing to havesimilar, but at the same time different, measures for the same phenomenon, not only for the public at large, butsometimes even for expert users. The co-existence of the two measures at the national level is difficult tounderstand in a period of broad economic convergence of EU Member States and, in particular, in a singlecurrency area. I am not aware of considerations in any of the EU Member States, even the largest ones, or inthe United States to produce conceptually differing CPIs for different regions of their economies.
Whilst I put for your consideration the need to produce national CPIs in addition to the HICP, there arearguments in favour of having variants of the HICP in order to take into account the needs of specific nationaluses or purposes. For example, Luxembourg had adopted the HICP as its national CPI until the geographiccoverage of the HICP was modified in order to apply the domestic concept. As the difference between domesticand national concept definitions is relatively large in Luxembourg on account of the high level of cross-bordershopping (around 15%), Luxembourg decided to compile a national variant of the HICP, which differs from the(Eurostat) HICP only in terms of geographic coverage.
There is good reason to develop a vision for consumer price statistics in the EU. The most important stepforward would be for consumer price indices – those used mainly for European and euro area purposes as wellas those used for national purposes – to form an integral part of a European System of Consumer Price Indices(ESCPI). The HICP could provide the backbone for the ESCPI. This would not only help users to betterunderstand the reasons for differences between the HICP and national CPIs, but would also provide bridgesbetween different national CPIs.
Conclusions
The HICP has enduring advantages. By contrast with the national CPIs, the HICP is based on methodscomparable across EU Member States. It covers a large share of private consumption expenditure. It is availablefor all euro area countries to a good degree of detail. It is a measure which attempts to isolate “pure” pricechanges and enjoys, with good reason, high public confidence. The headline HICP and its sub-indices are awell-defined set of indicators appropriate for monetary policy purposes.
There are at the same time reasons to further develop and improve the HICP, particularly in the fields of owneroccupied housing and quality adjustment. In both areas Eurostat, in close co-operation with national statisticalinstitutes, has already carried out research work and is expected to provide results in the coming years.Nevertheless, the HICP is already well known and is followed closely by the public as a measure of pricedevelopments. In conclusion, there is a continuous need to communicate the HICP methods and data to theinterested public.
Moreover, in the medium term the HICP could provide the backbone for a European System of Consumer PriceIndices. If there is a need, variants of the HICP may be defined for specific purposes, but may best be embeddedin this harmonised framework. Spending resources on national CPIs following a methodology substantiallydifferent from that applied for the HICP may be increasingly difficult to justify in the future. While headlinemeasures of inflation must have sound statistical features, they also need to be understood by the citizens of ademocratic EU.
eureurostatostat
38 15th CEIES seminar: Inflation in Europe — Different measures and their users
BELGIAN HICP : A MAJOR STEP FORWARD IN THE ACCURATE
MEASUREMENT OF INFLATION
DRUANT MartineNational Bank of BelgiumResearch DepartmentBld de Berlaimont 14B-1000 Brussels [email protected]
The views expressed in this paper are those of the author and do not necessarily reflect the views of the NationalBank of Belgium.
The author would like to thank Leo Ponteur for providing detailed information regarding the calculation ofBelgian CPIs, as well as Luc Aucremanne for his valuable comments on the first draft of this paper andEmmanuel Dhyne for the illustration on substitution and income effects.
Abstract
This paper is a case study on the application of Eurostat methodology to Belgian HICP. Although the author’saim has not been to submit an exhaustive analysis, some major HICP concepts regarding coverage, price-recording methods and aggregation of individual prices have been tackled. Moreover, important differencesbetween the Belgian national CPI and HICP have been highlighted in order to show that HICP is a major stepforward in accurate inflation measurement. Systematic inclusion of newly significant products and the annualrevision of weights are in particular an important improvement. The extension of the coverage to owner -occupied housing and harmonising adjustments for quality changes seem to be the most important challengesfor the future.
1. INTRODUCTION
The harmonised index of consumer prices (HICP) is a crucial economic indicator in Europe. This is particularlytrue from a monetary policy perspective. Initially, HICP was used to measure the convergence of inflation ratesin the EU, one of the Maastricht criteria for entry in the EMU. Nowadays it is at the heart of the single monetarypolicy which, under the Treaty, has price stability as its primary objective, the latter being defined by theGoverning Council of the ECB as “a year-on-year increase in HICP for the euro area of below 2 p.c.”. TheBelgian HICP, which will be discussed in this paper, contributes to the extent of 3.3 p.c. in weight to the HICPof the euro area.
HICP was developed in order to obtain comparable CPIs for inflation measurement in the EU member states.The existing national CPIs did not meet this requirement. In a first stage, interim indices were calculated, basedentirely on existing national CPIs, adjusted solely to make the coverage as comparable as possible. In March1997, completely new HICPs were published. In contrast to the interim indices, HICPs have a harmonisedmethodology and coverage. However, it should be stressed that HICPs are not fully harmonised, inasmuch asthe aim is comparability1 and not full harmonisation. National differences will thus continue to exist as long as
eureurostatostat
15th CEIES seminar: Inflation in Europe — Different measures and their users 39
1 The comparability requirement is, on a case by case basis, defined as a threshold. Comparability is held to be : any difference in practices used bymember states accounting for less than one part in a thousand of the total expenditure covered by HICP (for coverage matters) or accounting for lessthan 0.1 percentage point on the average annual rate of change (for price matters) (Eurostat 2001: “Report from the Commission to the Council on har-monization of consumer price indices in the European Union, 21.11 2000”) .
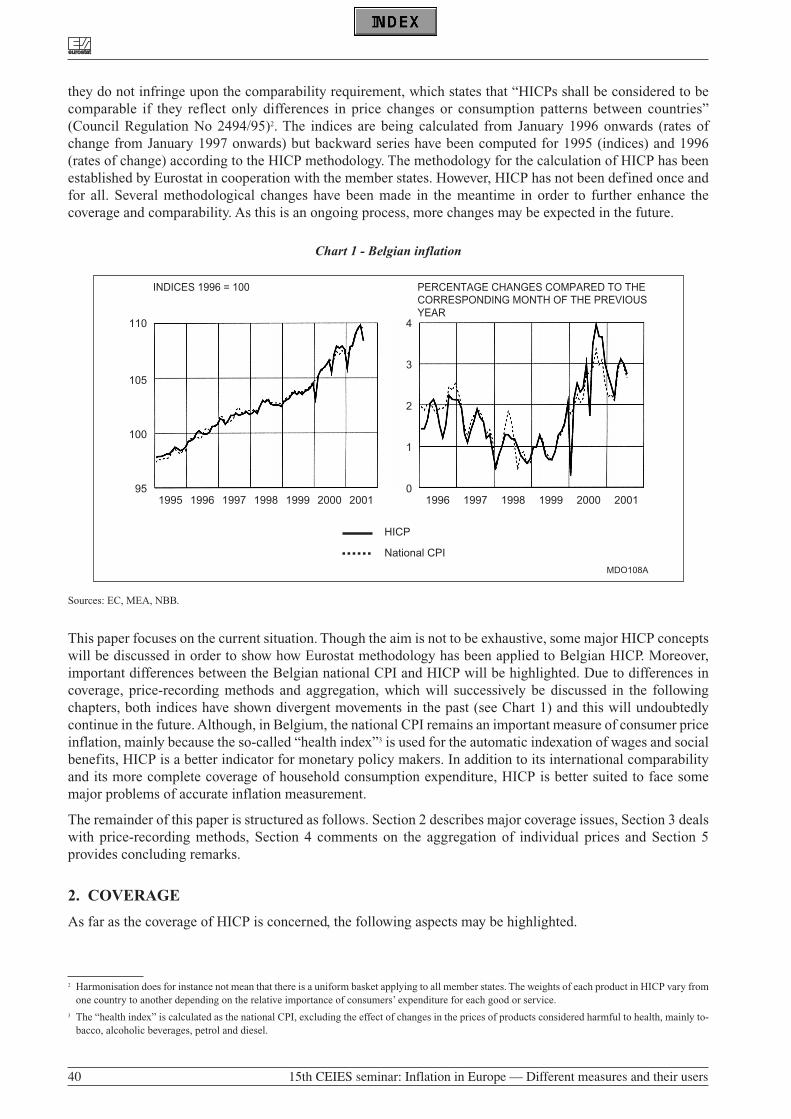
they do not infringe upon the comparability requirement, which states that “HICPs shall be considered to becomparable if they reflect only differences in price changes or consumption patterns between countries”(Council Regulation No 2494/95)2. The indices are being calculated from January 1996 onwards (rates ofchange from January 1997 onwards) but backward series have been computed for 1995 (indices) and 1996(rates of change) according to the HICP methodology. The methodology for the calculation of HICP has beenestablished by Eurostat in cooperation with the member states. However, HICP has not been defined once andfor all. Several methodological changes have been made in the meantime in order to further enhance thecoverage and comparability. As this is an ongoing process, more changes may be expected in the future.
Chart 1 - Belgian inflation
Sources: EC, MEA, NBB.
This paper focuses on the current situation. Though the aim is not to be exhaustive, some major HICP conceptswill be discussed in order to show how Eurostat methodology has been applied to Belgian HICP. Moreover,important differences between the Belgian national CPI and HICP will be highlighted. Due to differences incoverage, price-recording methods and aggregation, which will successively be discussed in the followingchapters, both indices have shown divergent movements in the past (see Chart 1) and this will undoubtedlycontinue in the future. Although, in Belgium, the national CPI remains an important measure of consumer priceinflation, mainly because the so-called “health index”3 is used for the automatic indexation of wages and socialbenefits, HICP is a better indicator for monetary policy makers. In addition to its international comparabilityand its more complete coverage of household consumption expenditure, HICP is better suited to face somemajor problems of accurate inflation measurement.
The remainder of this paper is structured as follows. Section 2 describes major coverage issues, Section 3 dealswith price-recording methods, Section 4 comments on the aggregation of individual prices and Section 5provides concluding remarks.
2. COVERAGE
As far as the coverage of HICP is concerned, the following aspects may be highlighted.
INDICES 1996 = 100 PERCENTAGE CHANGES COMPARED TO THECORRESPONDING MONTH OF THE PREVIOUSYEAR
110
105
100
951995 1996 1997 1998 1999 2000 2001
4
3
2
01996 1997 1998 1999 2000 2001
1
HICP
National CPI
MDO108A
eureurostatostat
40 15th CEIES seminar: Inflation in Europe — Different measures and their users
2 Harmonisation does for instance not mean that there is a uniform basket applying to all member states. The weights of each product in HICP vary fromone country to another depending on the relative importance of consumers’ expenditure for each good or service.
3 The “health index” is calculated as the national CPI, excluding the effect of changes in the prices of products considered harmful to health, mainly to-bacco, alcoholic beverages, petrol and diesel.
2.1. Household final monetary consumption expenditure
The agreed concept for HICP coverage is “household final monetary consumption expenditure” (HFMCE). Itconsists of “expenditure incurred on goods and services that are used for the direct satisfaction of individualneeds or wants by households” and “accounting for more than one part in a thousand of the total expenditurecovered by HICP” (Council Regulation No 1687/98). For a complete list of products, classified according toCOICOP/HICP (classification of individual consumption by purpose adapted to the needs of HICPs), as wellas a detailed description of the HFMCE concept, we refer to the Annexes 1a and 1b of the aforementionedregulation.
The notion “monetary” in HFMCE deserves particular attention. “A monetary transaction is an economic flowthat is an interaction between institutional units by mutual agreement, where the units involved make or receivepayments” (Council Regulation No 1687/98). The requirement that a monetary transaction is involved in orderto include a product in HICP, is consistent with the view that inflation is a monetary phenomenon. Moreover,it has made it possible to extend the coverage in the areas of health, education, social protection services andinsurance on a harmonised basis (Council Regulation No 2166/1999). For several of those items, the consumerdoes not cover the full price and institutional arrangements, as well as existing methodology in national CPIs,are quite different between member states, hampering comparability. That is why these services were initiallynot included in HICP. Later it was agreed that, according to the monetary concept, prices recorded in HICPshould reflect the amount paid by the household minus the reimbursement (social transfers in kind). On thebasis of this principle, medical products and services, education and social protection services were introducedon a harmonised basis in HICP in 2000, and hospital services and additional social protection services in 2001.
It should be mentioned that the extension of HICP to the monetary transactions for the aforementioned productshas led to more convergence between Belgian HICP and the national CPI, as they were already recorded in thelatter on a net basis. Moreover, it increased consistency with the concept of “household final consumptionexpenditure” in the European System of National Accounts (ESA 95)4.
Because of the monetary concept, two major exceptions subsist between HICP and ESA 95. First, prices ofproducts received as “income in kind”5 are not covered by HICP because of their non-monetary character.Moreover, for the same reason, HICP does not cover imputed rents for the service provided by owner-occupiedhousing, whereas national accounts do. According to national accounts, the latter type of non-monetarytransactions represent approximately 12 p.c. of overall Belgian final household consumption in 1999, which issubstantially higher than the share of actual rents. They amount to 5 p.c. according to national accounts and to6 p.c. in HICP.
It seems inappropriate to exclude such a major expenditure from the inflation measure. Moreover, the exclusionof owner-occupied housing endangers comparability between member states, as there are large differences inthe percentage of the population owning or renting their dwelling. For these reasons, Eurostat is currently re-examining the treatment of owner-occupiers’ housing. Although this process has not yet come to an end, thereseems to be agreement now to use the “net acquisition approach”. This means that HICP would include theprice of newly purchased owner-occupied dwellings weighted by the net purchases by consumers, i.e. theirpurchases of newly constructed houses and of existing houses from other sectors less their sales to other sectors.In contrast to imputed rents, this approach is consistent with the monetary nature of HICP. A third option wouldhave been to rely on the payments approach, measuring the cash-flows on mortgage reimbursements andinterest payments. However, interest payments are in principle not included in HICP, as it is the aim to measureconsumption prices and not the cost of financing the purchase of consumption goods. Moreover, the inclusionof interest payments would have had the drawback that it interferes with monetary policy.
eureurostatostat
15th CEIES seminar: Inflation in Europe — Different measures and their users 41
4 “Household final consumption expenditure” in ESA 95 excludes government final consumption expenditures which can be individualised (education,health, ...), the so-called social transfers in kind, and is thus consistent with HFMCE in HICP. “Household actual final consumption expenditure” inESA 95, on the other hand, includes those individualised government final consumption expenditures and thus focuses on what households actuallyconsume, rather than on what they actually pay. As a consequence, government consumption expenditure in the latter case is limited to collective con-sumption expenditure, such as justice, defense, ...
5 This ESA 95 concept refers to goods and services received as income in kind by employees or produced as outputs of unincorporated enterprises,owned by households, that are retained for consumption by members of the household.
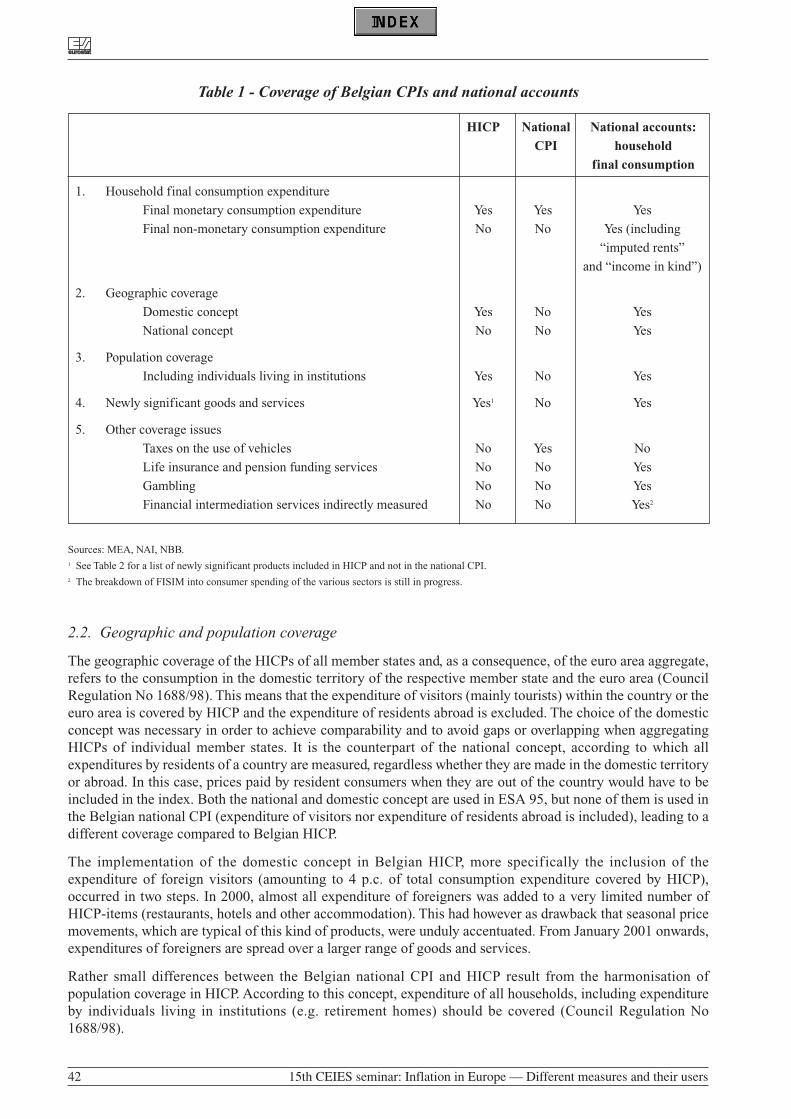
Table 1 - Coverage of Belgian CPIs and national accounts
HICP National National accounts:
CPI household
final consumption
1. Household final consumption expenditure
Final monetary consumption expenditure Yes Yes Yes
Final non-monetary consumption expenditure No No Yes (including
“imputed rents”
and “income in kind”)
2. Geographic coverage
Domestic concept Yes No Yes
National concept No No Yes
3. Population coverage
Including individuals living in institutions Yes No Yes
4. Newly significant goods and services Yes1 No Yes
5. Other coverage issues
Taxes on the use of vehicles No Yes No
Life insurance and pension funding services No No Yes
Gambling No No Yes
Financial intermediation services indirectly measured No No Yes2
Sources: MEA, NAI, NBB.1 See Table 2 for a list of newly significant products included in HICP and not in the national CPI.2 The breakdown of FISIM into consumer spending of the various sectors is still in progress.
2.2. Geographic and population coverage
The geographic coverage of the HICPs of all member states and, as a consequence, of the euro area aggregate,refers to the consumption in the domestic territory of the respective member state and the euro area (CouncilRegulation No 1688/98). This means that the expenditure of visitors (mainly tourists) within the country or theeuro area is covered by HICP and the expenditure of residents abroad is excluded. The choice of the domesticconcept was necessary in order to achieve comparability and to avoid gaps or overlapping when aggregatingHICPs of individual member states. It is the counterpart of the national concept, according to which allexpenditures by residents of a country are measured, regardless whether they are made in the domestic territoryor abroad. In this case, prices paid by resident consumers when they are out of the country would have to beincluded in the index. Both the national and domestic concept are used in ESA 95, but none of them is used inthe Belgian national CPI (expenditure of visitors nor expenditure of residents abroad is included), leading to adifferent coverage compared to Belgian HICP.
The implementation of the domestic concept in Belgian HICP, more specifically the inclusion of theexpenditure of foreign visitors (amounting to 4 p.c. of total consumption expenditure covered by HICP),occurred in two steps. In 2000, almost all expenditure of foreigners was added to a very limited number ofHICP-items (restaurants, hotels and other accommodation). This had however as drawback that seasonal pricemovements, which are typical of this kind of products, were unduly accentuated. From January 2001 onwards,expenditures of foreigners are spread over a larger range of goods and services.
Rather small differences between the Belgian national CPI and HICP result from the harmonisation ofpopulation coverage in HICP. According to this concept, expenditure of all households, including expenditureby individuals living in institutions (e.g. retirement homes) should be covered (Council Regulation No1688/98).
eureurostatostat
42 15th CEIES seminar: Inflation in Europe — Different measures and their users
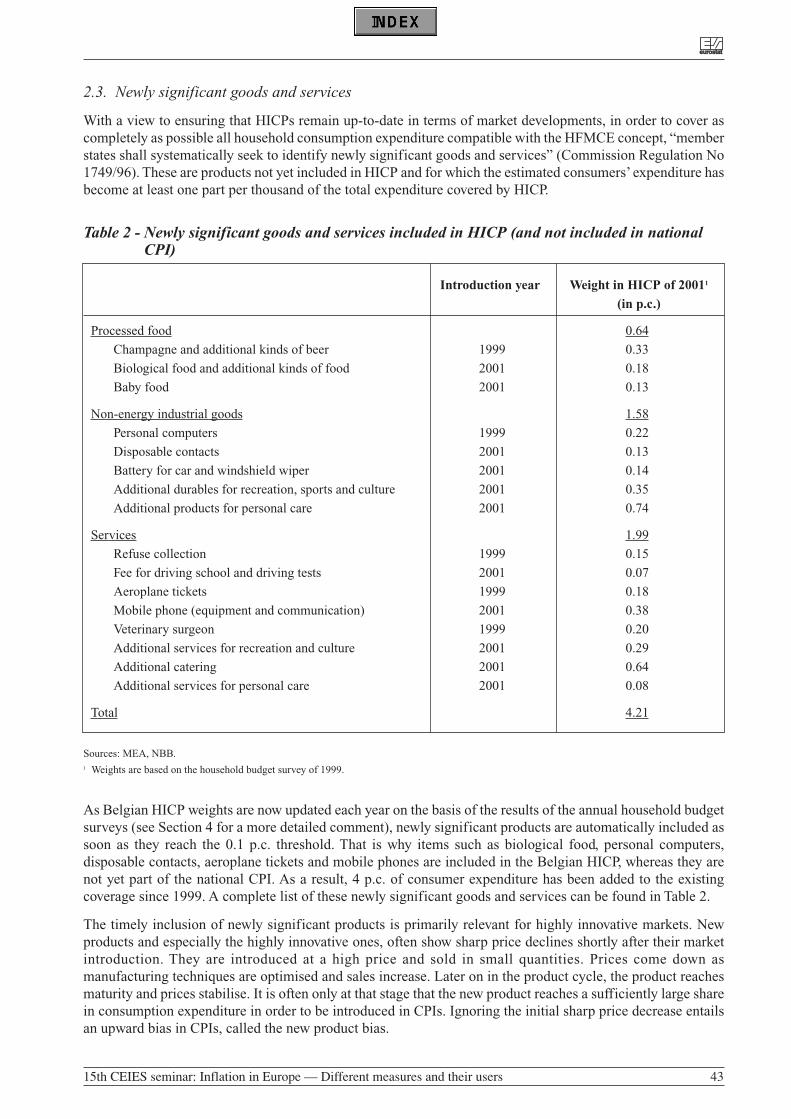
2.3. Newly significant goods and services
With a view to ensuring that HICPs remain up-to-date in terms of market developments, in order to cover ascompletely as possible all household consumption expenditure compatible with the HFMCE concept, “memberstates shall systematically seek to identify newly significant goods and services” (Commission Regulation No1749/96). These are products not yet included in HICP and for which the estimated consumers’ expenditure hasbecome at least one part per thousand of the total expenditure covered by HICP.
Table 2 - Newly significant goods and services included in HICP (and not included in nationalCPI)
Introduction year Weight in HICP of 20011
(in p.c.)
Processed food 0.64
Champagne and additional kinds of beer 1999 0.33
Biological food and additional kinds of food 2001 0.18
Baby food 2001 0.13
Non-energy industrial goods 1.58
Personal computers 1999 0.22
Disposable contacts 2001 0.13
Battery for car and windshield wiper 2001 0.14
Additional durables for recreation, sports and culture 2001 0.35
Additional products for personal care 2001 0.74
Services 1.99
Refuse collection 1999 0.15
Fee for driving school and driving tests 2001 0.07
Aeroplane tickets 1999 0.18
Mobile phone (equipment and communication) 2001 0.38
Veterinary surgeon 1999 0.20
Additional services for recreation and culture 2001 0.29
Additional catering 2001 0.64
Additional services for personal care 2001 0.08
Total 4.21
Sources: MEA, NBB.1 Weights are based on the household budget survey of 1999.
As Belgian HICP weights are now updated each year on the basis of the results of the annual household budgetsurveys (see Section 4 for a more detailed comment), newly significant products are automatically included assoon as they reach the 0.1 p.c. threshold. That is why items such as biological food, personal computers,disposable contacts, aeroplane tickets and mobile phones are included in the Belgian HICP, whereas they arenot yet part of the national CPI. As a result, 4 p.c. of consumer expenditure has been added to the existingcoverage since 1999. A complete list of these newly significant goods and services can be found in Table 2.
The timely inclusion of newly significant products is primarily relevant for highly innovative markets. Newproducts and especially the highly innovative ones, often show sharp price declines shortly after their marketintroduction. They are introduced at a high price and sold in small quantities. Prices come down asmanufacturing techniques are optimised and sales increase. Later on in the product cycle, the product reachesmaturity and prices stabilise. It is often only at that stage that the new product reaches a sufficiently large sharein consumption expenditure in order to be introduced in CPIs. Ignoring the initial sharp price decrease entailsan upward bias in CPIs, called the new product bias.
eureurostatostat
15th CEIES seminar: Inflation in Europe — Different measures and their users 43
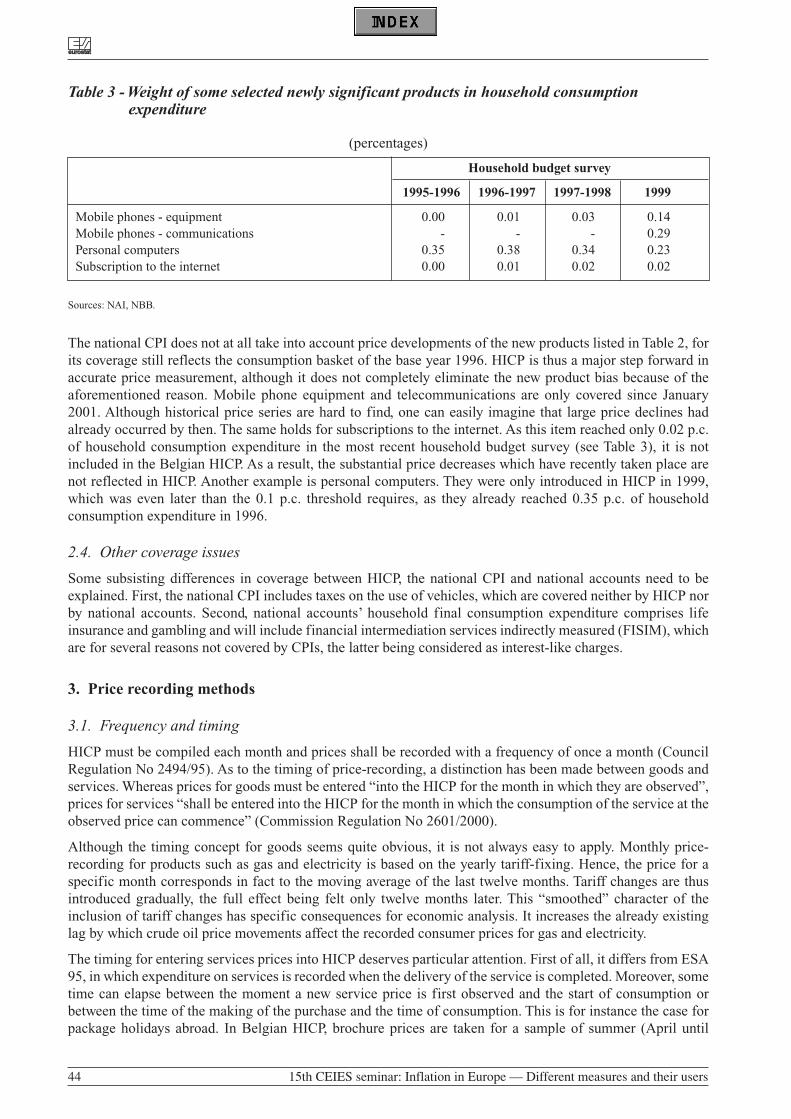
Table 3 - Weight of some selected newly significant products in household consumptionexpenditure
(percentages)
Household budget survey
1995-1996 1996-1997 1997-1998 1999
Mobile phones - equipment 0.00 0.01 0.03 0.14Mobile phones - communications - - - 0.29Personal computers 0.35 0.38 0.34 0.23Subscription to the internet 0.00 0.01 0.02 0.02
Sources: NAI, NBB.
The national CPI does not at all take into account price developments of the new products listed in Table 2, forits coverage still reflects the consumption basket of the base year 1996. HICP is thus a major step forward inaccurate price measurement, although it does not completely eliminate the new product bias because of theaforementioned reason. Mobile phone equipment and telecommunications are only covered since January2001. Although historical price series are hard to find, one can easily imagine that large price declines hadalready occurred by then. The same holds for subscriptions to the internet. As this item reached only 0.02 p.c.of household consumption expenditure in the most recent household budget survey (see Table 3), it is notincluded in the Belgian HICP. As a result, the substantial price decreases which have recently taken place arenot reflected in HICP. Another example is personal computers. They were only introduced in HICP in 1999,which was even later than the 0.1 p.c. threshold requires, as they already reached 0.35 p.c. of householdconsumption expenditure in 1996.
2.4. Other coverage issues
Some subsisting differences in coverage between HICP, the national CPI and national accounts need to beexplained. First, the national CPI includes taxes on the use of vehicles, which are covered neither by HICP norby national accounts. Second, national accounts’ household final consumption expenditure comprises lifeinsurance and gambling and will include financial intermediation services indirectly measured (FISIM), whichare for several reasons not covered by CPIs, the latter being considered as interest-like charges.
3. Price recording methods
3.1. Frequency and timing
HICP must be compiled each month and prices shall be recorded with a frequency of once a month (CouncilRegulation No 2494/95). As to the timing of price-recording, a distinction has been made between goods andservices. Whereas prices for goods must be entered “into the HICP for the month in which they are observed”,prices for services “shall be entered into the HICP for the month in which the consumption of the service at theobserved price can commence” (Commission Regulation No 2601/2000).
Although the timing concept for goods seems quite obvious, it is not always easy to apply. Monthly price-recording for products such as gas and electricity is based on the yearly tariff-fixing. Hence, the price for aspecific month corresponds in fact to the moving average of the last twelve months. Tariff changes are thusintroduced gradually, the full effect being felt only twelve months later. This “smoothed” character of theinclusion of tariff changes has specific consequences for economic analysis. It increases the already existinglag by which crude oil price movements affect the recorded consumer prices for gas and electricity.
The timing for entering services prices into HICP deserves particular attention. First of all, it differs from ESA95, in which expenditure on services is recorded when the delivery of the service is completed. Moreover, sometime can elapse between the moment a new service price is first observed and the start of consumption orbetween the time of the making of the purchase and the time of consumption. This is for instance the case forpackage holidays abroad. In Belgian HICP, brochure prices are taken for a sample of summer (April until
eureurostatostat
44 15th CEIES seminar: Inflation in Europe — Different measures and their users
October) and winter (November until March) holiday destinations. This means that the index of August forinstance contains the prices in summer brochures for departures in August, although the holiday can have beenbooked months before. Anyhow, the consumer pays the indicated price for August ultimately two to three weeksbefore departure.
Box 1 - Recording of individual prices and calculation of Belgian CPIs
The Index Office of the Ministry of Economic Affairs is charged with the price recording and with thecomputation of Belgian CPIs. At about the same time each month, 20 employees collect prices for a largeamount of the various items in the index basket. The national CPI consists all in all of 481 items, whereasHICP includes more than 500 items. This is done in almost 10,000 outlets (always the same) spread over 65locations, amounting to more than 105,000 price observations each month. Besides the local price quotationsfor 67 p.c. (according to their weight) of the index items, 33 p.c. are observed centrally, such as electricity,rents, cars, telephone services, package holidays abroad, newspapers, ... Price recording takes place duringthe first 20 days of each month.
The calculation of the national CPI for each month comprises three stages. First, an index is calculated foreach item in each location (481*65 = 31,265 item indices). Second, in each location, a weighted average ofthese item indices is calculated. The weights are based on the results of the household budget surveys.Finally, the country index is calculated as the weighted average of the 65 location indices. Geographicweights are based on population figures as of the first day of the base year of the index.
HICP is calculated in a slightly different way. Only one index is calculated for each item, based on the 65geographically weighted prices. HICP is the weighted average of the more than 500 item indices. HICPfigures are sent to Eurostat and published by Eurostat around the 17th of the following month.
3.2. Price reductions
Reductions in prices of individual goods and services should be reflected in HICP if “they are available to allpotential consumers with no special conditions attached (non-discriminatory)” and if “they can be claimed atthe time of purchase or within such a time period following the actual purchase that they might be expected tohave a significant influence on the quantities purchasers are willing to purchase” (Commission Regulation No2602/2000). Reductions in the prices of products, which are likely to be available again at normal prices or areavailable elsewhere at normal prices, shall in particular be taken into account in HICP.
In January 2001, sales have been introduced in Belgian HICP and the index series have been revisedappropriately for the year 2000. As sales take place in the months of January and July, the year-on-year rates ofchange for January and July 2000 have fallen sharply for products affected by off-peak discounts. The monthlyprofile of the ascending aggregates has accordingly been influenced (see Chart 2). As sales have not beenintroduced in the national CPI, large differences are observed since 2000 between HICP and the national CPIfor the months of January and July (see Chart 1).
A special problem might arise in January 2002. Because of the euro cash changeover, sales will be postponedfor some weeks. They will start on the 19th of January and last for one month. As price recording takes placeduring the first 20 days of each month, the effect of discounts would not at all be felt in the index of January2002 and only to a minor extent in February, because the effect of sales on HICP becomes very weak at the endof the period, discounted products becoming too scarce to be available to all potential consumers. This wouldcause another break in the series, similar to the one observed in January and July 2000. However, it has beendecided to make an exception by extending the price recording period for HICP until the end of January 2002.
eureurostatostat
15th CEIES seminar: Inflation in Europe — Different measures and their users 45
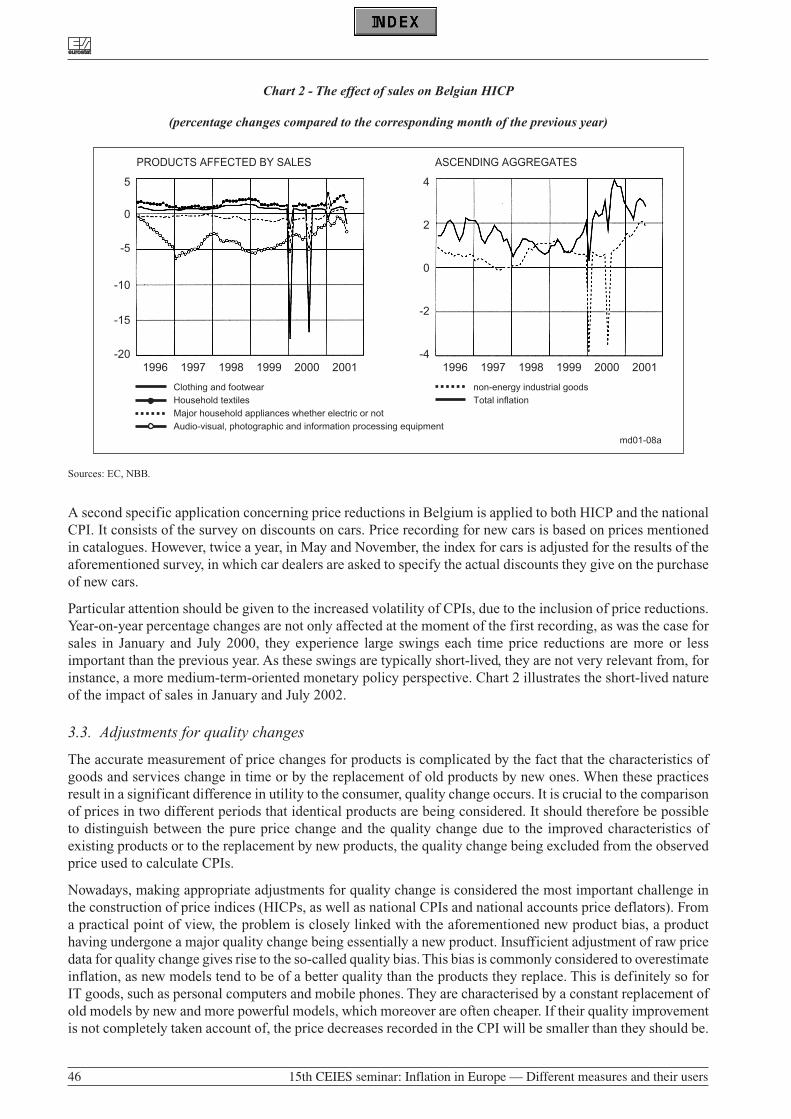
Chart 2 - The effect of sales on Belgian HICP
(percentage changes compared to the corresponding month of the previous year)
Sources: EC, NBB.
A second specific application concerning price reductions in Belgium is applied to both HICP and the nationalCPI. It consists of the survey on discounts on cars. Price recording for new cars is based on prices mentionedin catalogues. However, twice a year, in May and November, the index for cars is adjusted for the results of theaforementioned survey, in which car dealers are asked to specify the actual discounts they give on the purchaseof new cars.
Particular attention should be given to the increased volatility of CPIs, due to the inclusion of price reductions.Year-on-year percentage changes are not only affected at the moment of the first recording, as was the case forsales in January and July 2000, they experience large swings each time price reductions are more or lessimportant than the previous year. As these swings are typically short-lived, they are not very relevant from, forinstance, a more medium-term-oriented monetary policy perspective. Chart 2 illustrates the short-lived natureof the impact of sales in January and July 2002.
3.3. Adjustments for quality changes
The accurate measurement of price changes for products is complicated by the fact that the characteristics ofgoods and services change in time or by the replacement of old products by new ones. When these practicesresult in a significant difference in utility to the consumer, quality change occurs. It is crucial to the comparisonof prices in two different periods that identical products are being considered. It should therefore be possibleto distinguish between the pure price change and the quality change due to the improved characteristics ofexisting products or to the replacement by new products, the quality change being excluded from the observedprice used to calculate CPIs.
Nowadays, making appropriate adjustments for quality change is considered the most important challenge inthe construction of price indices (HICPs, as well as national CPIs and national accounts price deflators). Froma practical point of view, the problem is closely linked with the aforementioned new product bias, a producthaving undergone a major quality change being essentially a new product. Insufficient adjustment of raw pricedata for quality change gives rise to the so-called quality bias. This bias is commonly considered to overestimateinflation, as new models tend to be of a better quality than the products they replace. This is definitely so forIT goods, such as personal computers and mobile phones. They are characterised by a constant replacement ofold models by new and more powerful models, which moreover are often cheaper. If their quality improvementis not completely taken account of, the price decreases recorded in the CPI will be smaller than they should be.
PRODUCTS AFFECTED BY SALES ASCENDING AGGREGATES
md01-08a
5
0
-5
-20
-10
-15
4
2
0
-4
-2
1996 1997 1998 1999 2000 2001 1996 1997 1998 1999 2000 2001
non-energy industrial goodsTotal inflationHousehold textiles
Major household appliances whether electric or notAudio-visual, photographic and information processing equipment
Clothing and footwear
eureurostatostat
46 15th CEIES seminar: Inflation in Europe — Different measures and their users
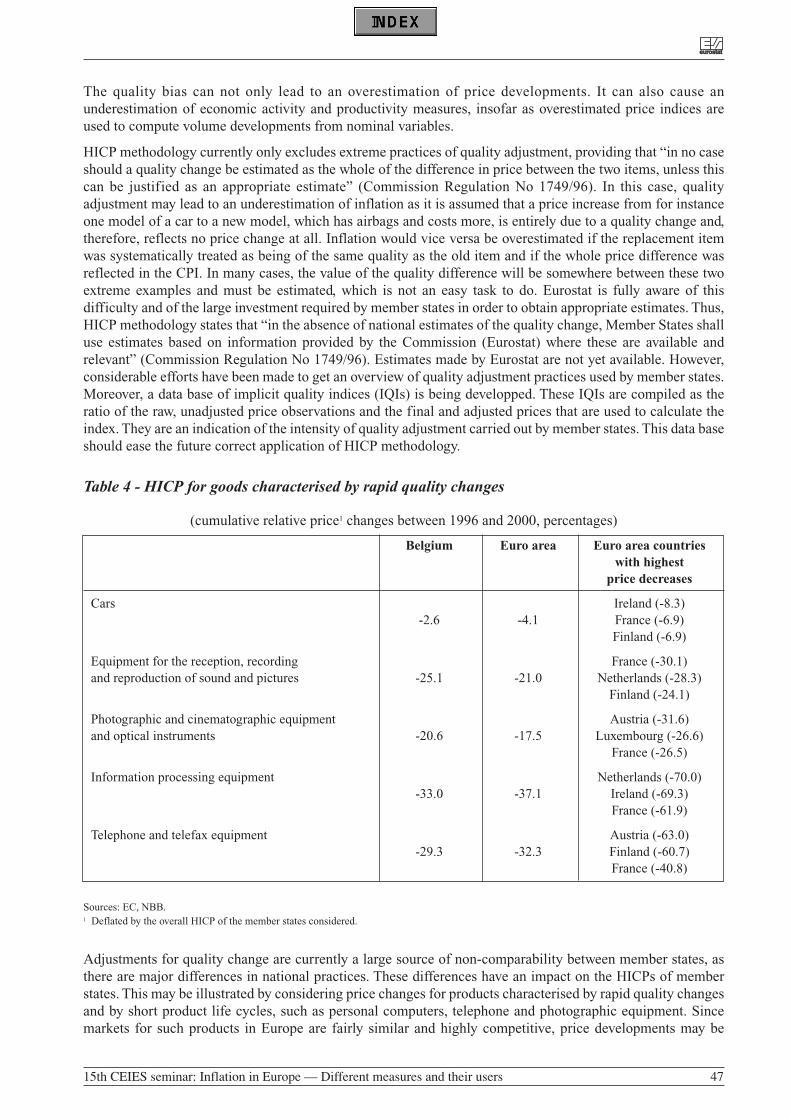
The quality bias can not only lead to an overestimation of price developments. It can also cause anunderestimation of economic activity and productivity measures, insofar as overestimated price indices areused to compute volume developments from nominal variables.
HICP methodology currently only excludes extreme practices of quality adjustment, providing that “in no caseshould a quality change be estimated as the whole of the difference in price between the two items, unless thiscan be justified as an appropriate estimate” (Commission Regulation No 1749/96). In this case, qualityadjustment may lead to an underestimation of inflation as it is assumed that a price increase from for instanceone model of a car to a new model, which has airbags and costs more, is entirely due to a quality change and,therefore, reflects no price change at all. Inflation would vice versa be overestimated if the replacement itemwas systematically treated as being of the same quality as the old item and if the whole price difference wasreflected in the CPI. In many cases, the value of the quality difference will be somewhere between these twoextreme examples and must be estimated, which is not an easy task to do. Eurostat is fully aware of thisdifficulty and of the large investment required by member states in order to obtain appropriate estimates. Thus,HICP methodology states that “in the absence of national estimates of the quality change, Member States shalluse estimates based on information provided by the Commission (Eurostat) where these are available andrelevant” (Commission Regulation No 1749/96). Estimates made by Eurostat are not yet available. However,considerable efforts have been made to get an overview of quality adjustment practices used by member states.Moreover, a data base of implicit quality indices (IQIs) is being developped. These IQIs are compiled as theratio of the raw, unadjusted price observations and the final and adjusted prices that are used to calculate theindex. They are an indication of the intensity of quality adjustment carried out by member states. This data baseshould ease the future correct application of HICP methodology.
Table 4 - HICP for goods characterised by rapid quality changes
(cumulative relative price1 changes between 1996 and 2000, percentages)
Belgium Euro area Euro area countries with highest
price decreases
Cars Ireland (-8.3)-2.6 -4.1 France (-6.9)
Finland (-6.9)
Equipment for the reception, recording France (-30.1)and reproduction of sound and pictures -25.1 -21.0 Netherlands (-28.3)
Finland (-24.1)
Photographic and cinematographic equipment Austria (-31.6)and optical instruments -20.6 -17.5 Luxembourg (-26.6)
France (-26.5)
Information processing equipment Netherlands (-70.0)-33.0 -37.1 Ireland (-69.3)
France (-61.9)
Telephone and telefax equipment Austria (-63.0)-29.3 -32.3 Finland (-60.7)
France (-40.8)
Sources: EC, NBB.1 Deflated by the overall HICP of the member states considered.
Adjustments for quality change are currently a large source of non-comparability between member states, asthere are major differences in national practices. These differences have an impact on the HICPs of memberstates. This may be illustrated by considering price changes for products characterised by rapid quality changesand by short product life cycles, such as personal computers, telephone and photographic equipment. Sincemarkets for such products in Europe are fairly similar and highly competitive, price developments may be
eureurostatostat
15th CEIES seminar: Inflation in Europe — Different measures and their users 47
expected to be broadly the same. However, Table 4 shows that large differences exist between countries, a ratherstable group of member states showing the strongest price declines (France, Finland, the Netherlands, Austriaand Ireland). Belgian price developments for these goods are generally less pronounced than those recorded inthe above-mentioned countries, but similar to those for the euro area. These national differences indicate thatthere is scope for further harmonisation of methods.
4. Aggregation of individual prices
Once a basket of products has been compiled and prices have been collected according to the requiredmethodology, these data must be aggregated.
4.1. Lower level aggregation
In a first stage, elementary aggregate indices are computed. “Elementary aggregate refers to the expenditure orconsumption covered by the most detailed level of stratification of the HICP and within which reliableexpenditure information is not available for weighting purposes” (Commission Regulation No 1749/96). Morecolloquially, it consists of the calculation of one price for, for instance, spaghetti, based on prices recorded fordifferent brands of spaghetti.
The aforementioned commission regulation leaves in principle the choice between two formulas for thecalculation of the elementary aggregate indices. Either the ratio of arithmetic mean prices or the ratio ofgeometric mean prices may be used 6. Alternative formulas are however also accepted, provided that they meetthe comparability requirement. In Belgium, only the first formula is used. However, it may be shown that, undercertain circumstances, the geometric mean is a better choice for reducing the so-called substitution bias at thelower level of aggregation.
Consumers respond to price changes by turning from products that have become relatively more expensive, toproducts for which prices have shown a relative decline. At the lower level of aggregation this for instancemeans the replacement of a more expensive brand of spaghetti by a cheaper one. At the upper level ofaggregation, it for instance may imply the replacement of beef by chicken. The substitution bias is theoverestimation of inflation because - by using no weights (at the lower level of aggregation) or fixed weights(at the upper level aggregation, see below for more details) - the replacement, in due time, of relative moreexpensive products by relative cheaper products is not taken into account. Later on, the relative more expensiveproducts will be overrepresented in comparison with actual consumption expenditure, leading to anoverestimation of inflation.
4.2. Upper level aggregation
In order to obtain CPIs, elementary aggregate indices have to be aggregated, taking into account the share ofeach item in the total basket of products covered by HICP. According to HICP methodology, this should be doneusing a Laspeyres-type index (Council Regulation No 2494/95). This means that the elementary aggregateindices are aggregated using fixed weights, which reflect the consumption pattern in the weight referenceperiod.
In order to prevent weights from becoming completely obsolete, minimum standards for the quality of HICPweights have been established. “Each month Member States shall produce HICPs using weightings whichreflect consumers’ expenditure patterns in a weighting reference period ending no more than seven years beforethe preceding December”. Moreover, “each year, Member States shall carry out a review of weightings in orderto ensure that they are sufficiently reliable and relevant to meet the comparability requirement” (Commission
eureurostatostat
48 15th CEIES seminar: Inflation in Europe — Different measures and their users
6 The exact formulas are as follows :
the ratio of arithmetic mean prices and the ratio of geometric mean prices , were is the current price, the reference price
and the number of such prices in the elementary aggregate.n
bptp[ ][ ]nb
nt
p
p1
1
∏∏
∑
∑b
t
pn1
pn1
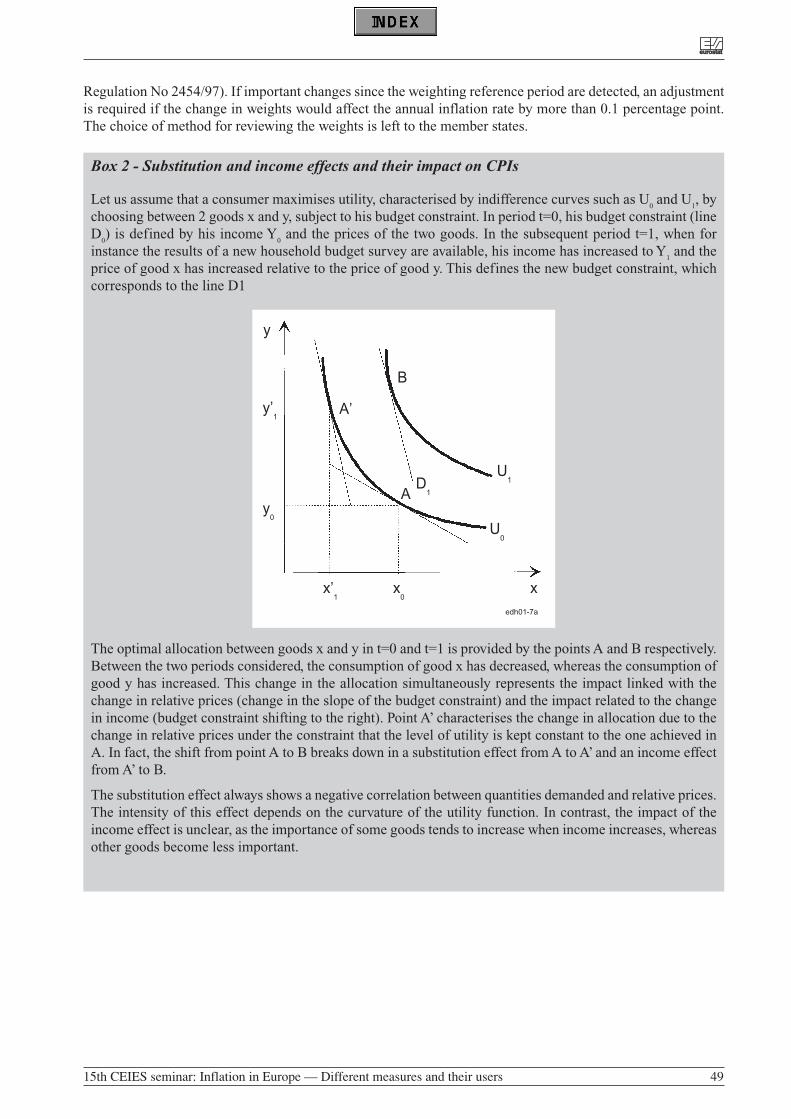
Regulation No 2454/97). If important changes since the weighting reference period are detected, an adjustmentis required if the change in weights would affect the annual inflation rate by more than 0.1 percentage point.The choice of method for reviewing the weights is left to the member states.
Box 2 - Substitution and income effects and their impact on CPIs
Let us assume that a consumer maximises utility, characterised by indifference curves such as U0and U
1, by
choosing between 2 goods x and y, subject to his budget constraint. In period t=0, his budget constraint (lineD
0) is defined by his income Y
0and the prices of the two goods. In the subsequent period t=1, when for
instance the results of a new household budget survey are available, his income has increased to Y1
and theprice of good x has increased relative to the price of good y. This defines the new budget constraint, whichcorresponds to the line D1
The optimal allocation between goods x and y in t=0 and t=1 is provided by the points A and B respectively.Between the two periods considered, the consumption of good x has decreased, whereas the consumption ofgood y has increased. This change in the allocation simultaneously represents the impact linked with thechange in relative prices (change in the slope of the budget constraint) and the impact related to the changein income (budget constraint shifting to the right). Point A’ characterises the change in allocation due to thechange in relative prices under the constraint that the level of utility is kept constant to the one achieved inA. In fact, the shift from point A to B breaks down in a substitution effect from A to A’ and an income effectfrom A’ to B.
The substitution effect always shows a negative correlation between quantities demanded and relative prices.The intensity of this effect depends on the curvature of the utility function. In contrast, the impact of theincome effect is unclear, as the importance of some goods tends to increase when income increases, whereasother goods become less important.
y
edh01-7a
y’1
y0
x’1
x0
x
A’
A
U0
D1
U1
B
eureurostatostat
15th CEIES seminar: Inflation in Europe — Different measures and their users 49
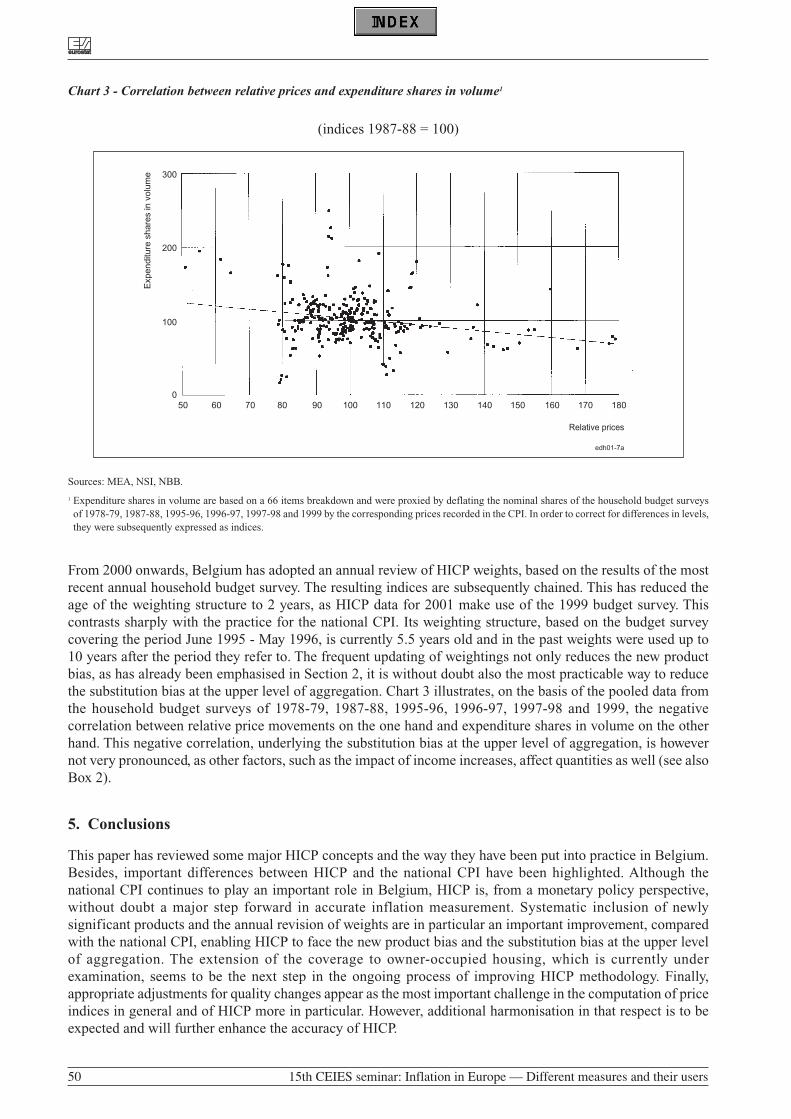
Chart 3 - Correlation between relative prices and expenditure shares in volume1
(indices 1987-88 = 100)
Sources: MEA, NSI, NBB.
1 Expenditure shares in volume are based on a 66 items breakdown and were proxied by deflating the nominal shares of the household budget surveysof 1978-79, 1987-88, 1995-96, 1996-97, 1997-98 and 1999 by the corresponding prices recorded in the CPI. In order to correct for differences in levels,they were subsequently expressed as indices.
From 2000 onwards, Belgium has adopted an annual review of HICP weights, based on the results of the mostrecent annual household budget survey. The resulting indices are subsequently chained. This has reduced theage of the weighting structure to 2 years, as HICP data for 2001 make use of the 1999 budget survey. Thiscontrasts sharply with the practice for the national CPI. Its weighting structure, based on the budget surveycovering the period June 1995 - May 1996, is currently 5.5 years old and in the past weights were used up to10 years after the period they refer to. The frequent updating of weightings not only reduces the new productbias, as has already been emphasised in Section 2, it is without doubt also the most practicable way to reducethe substitution bias at the upper level of aggregation. Chart 3 illustrates, on the basis of the pooled data fromthe household budget surveys of 1978-79, 1987-88, 1995-96, 1996-97, 1997-98 and 1999, the negativecorrelation between relative price movements on the one hand and expenditure shares in volume on the otherhand. This negative correlation, underlying the substitution bias at the upper level of aggregation, is howevernot very pronounced, as other factors, such as the impact of income increases, affect quantities as well (see alsoBox 2).
5. Conclusions
This paper has reviewed some major HICP concepts and the way they have been put into practice in Belgium.Besides, important differences between HICP and the national CPI have been highlighted. Although thenational CPI continues to play an important role in Belgium, HICP is, from a monetary policy perspective,without doubt a major step forward in accurate inflation measurement. Systematic inclusion of newlysignificant products and the annual revision of weights are in particular an important improvement, comparedwith the national CPI, enabling HICP to face the new product bias and the substitution bias at the upper levelof aggregation. The extension of the coverage to owner-occupied housing, which is currently underexamination, seems to be the next step in the ongoing process of improving HICP methodology. Finally,appropriate adjustments for quality changes appear as the most important challenge in the computation of priceindices in general and of HICP more in particular. However, additional harmonisation in that respect is to beexpected and will further enhance the accuracy of HICP.
edh01-7a
Relative prices
300
200
100
050 60 70 80 90 100 110 120 130 140 150 160 170 180
Exp
endi
ture
sha
res
in v
olum
e
eureurostatostat
50 15th CEIES seminar: Inflation in Europe — Different measures and their users
References
Astin, J. (1999), “The European Union Harmonised Indices of Consumer Prices (HICP), Statistical Journal ofthe United Nations ECE, No. 16, pp.123-135.
Aucremanne, L. and Donkers, F. (1997), “Analyse van de inflatie in het licht van het convergentiecriterium vanMaastricht”, unpublished paper of the National Bank of Belgium.
Boskin, J. (1996), “Toward a More Accurate Measure of the Cost of Living”, Final Report to the Senate FinanceCommittee from the Advisory Commission To Study The Consumer Price Index, December.
Lequiller F. (1997), “L’indice des prix à la consommation surestime-t-il l’inflation?”, Economique etStatistique, No. 303.
ECB (2001), “Price effects of regulatory reform in selected network industries”, March.
Eurostat (1996),”European system of accounts - ESA 1995”, June.
Eurostat (2001), “Compendium of HICP reference documents”, March.
Goodhart C. (2001), “What weight should be given to asset prices in the measurement of inflation?” DNB StaffReports, No. 65.
Hoffmann, J. (1998), “Problems of inflation measurement in Germany”, Discussion papers Economic ResearchGroup of the Deutsche Bundesbank, No. 1 (February).
IPK International and CISET (2000/2001), “Analysis of expenditures of foreign leisure tourists in Belgium2000”, IPK International Munich.
OECD (1997), “Synthesis paper on shortcomings of the consumer price index measure of inflation foreconomic policy purposes”, Working Party on Macroeconomic and Structural Policy Analysis, October.
Ministerie van Economische Zaken; Dienst voor het Indexcijfer (1999), “Het indexcijfer der consumptieprijzenbasis 1996”.
Vranken, P. (2000), “Het Geharmoniseerde Indexcijfer van de Consumptieprijzen. Analyse van de eigenheden,overeenkomsten en verschillen met het nationale indexcijfer van de consumptieprijzen”, Ministerie vanEconomische Zaken; Dienst voor het Indexcijfer, april.
eureurostatostat
15th CEIES seminar: Inflation in Europe — Different measures and their users 51
MEASURING INFLATION WHEN PRICES CHANGE SLOWLY
D’ELIA Enrico
ISAE – Institute for Studiesand Economic AnalysesPiazza [email protected]
1. Introduction
Inflation is currently low and falling in the OECD area, even after the recent tragic events in USA. As a matterof fact, this is not a short run occurrence, but the result of several structural changes, mainly concerningmarkets flexibility and increasing competitiveness. Globalisation, privatisation, liberalisation, f iscalconsolidation and tight monetary policies worked together to achieve such results.
A side effect of these facts is that they made harder the task of price index compilers, since the demand forinformation about inflation is evolving. The transformation is twofold and, in a sense, is contradictory as well.On the one hand, increasing integration of international markets pushed for harmonised measures of inflation,to be used in international comparisons. On the other hand, researchers and analysts are moving their attentionfrom aggregate price dynamics to price differentials (among products, markets, consumers groups, andcountries), since relative differences among single prices did not tend to narrow as inflation falls. Thus thedistribution of price changes (and underlying price dispersion) has become more and more relevant for users.
In the European countries, HICP provided an answer to the first request. While, until now, the breakdown ofnational CPIs for markets and consumers groups sometimes satisfied the demand for information on pricedifferentials within few countries.
Figure 1 below tries to summarise the current awkward condition of price compilers. First of all, they have tocope with some practical, but not trivial, problems raised by low inflation itself, such as rounding. Secondly,statistical agencies must devote huge resources to ensure international comparability of national price indexes.Actually, international organizations are capable of harmonising national indexes ex-post only up to a point,since data collection, definitions and data processing can be harmonised only ex-ante at national level. Thecomplex regulatory process behind the compilation of HICP exemplifies how hard this task can be. On its turn,a fine breakdown of price indexes requires comparable classifications as well.
In addition, important factors, such as market segmentation and consumers stratification, should be taken intoaccount both in CPIs and in harmonised indexes, above and beyond usual “consumption purpose” of goods andservices, underlying COICOP classification. For instance, the relation between price level, on the one side, andprice dynamics cannot be disregarded as well, as Section 4 below will show. Furthermore, price dispersionrequires the dissemination of new indicators on inflation dynamics, notably those based on the concept of“core” inflation.
Of course, this paper can only touch upon few of these points. In the following section the “trivial” problem ofrounding is considered. Section 3 provides some empirical evidence concerning price changes dispersion andits effects on economic analysis. Section 4 deals with the dependency of inflation from initial price level.
eureurostatostat
15th CEIES seminar: Inflation in Europe — Different measures and their users 53
2. New outcomes of an old problem: rounding
Price index rounding is a very old problem, but never solved as well. Usually only rounded inflation figures aredisseminated to the public and to the researchers. This may be a relic of times when computation was a heavyduty, and dealing with one decimal figure made far simple the task of statistical agencies. In addition, duringmid or high inflation, rounding did not turn out so disturbing for analysts, since monthly price index changeslargely exceeded rounding approximation. Hence rounding “noise” did not conceal the signal of inflation.Nowadays the noise to signal ratio is much more unfavourable. Provided that index figures are usually roundedup to the first decimal place, it implies an “extra” variance of price index of 0.01/12 ( 0.001 percentage points1,which seems apparently negligible, compared to sample variance and Boskin-type systematic bias. However, itimplies, for instance, that in 50% of cases the true index differs from the rounded one more than ±0.025percentage points. If a fixed base index is compiled, this error has only transitory effects, but if a chained indexis used, then the rounding inaccuracy occurred in the chaining month (usually December) potentially carriesover forever. If statistical agencies are unlucky enough, one half decimal point drift may occur in 10 years.
What is more, inflation rate is usually computed by using rounded index, and the result is rounded again. Hence,in 50% of cases the published inflation rate diverges from the unrounded one more than ±2x0.015 = ±0.03percentage points, that is one third of monthly price changes currently observed in many countries. Suchinaccuracy seems unimportant again, and it might be in fact if it was a random noise added to the true figures.Unfortunately this is not the general case, since the double rounding creates pseudo-periodic oscillationsaround the true inflation rate. As a consequence, the turning points of inflation, if any, may be moved, andfurther spurious cycles are introduced in the time series of inflation. It is easy to show that rounding producesa series of “saw-tooth” waves around the true inflation rate whose width is 0.1 percentage points, and the periodchanges over the time according to a highly non –linear function of annual inflation rate. Non-linearity impliesthat even a small change of long run inflation rate may change dramatically the pattern of spurious waves. Forinstance, even considering the very simple case of three constant inflation rates (i.e.: 1.5%, 2%, and 2.5% peryear), it is apparent in Figure 2 that shapes and periods of spurious waves induced by rounding vary completelyfrom one case to the other. Hence it is almost impossible to deduce from rounded data the “true” underlyinginflation dynamics. This is enough to confuse every analyst.
Furthermore, noise and cycles added to price index may disturb usual seasonal adjustment procedures. First ofall, it is possible that such cycles have a near-seasonal period, but this is only a minor problem (and a luckychance, indeed), since in this case seasonal adjustment is generally able to cancel out rounding influence fromadjusted time series. Nevertheless, sometimes the noise component added by rounding may hinder the detectionand estimation of seasonal pattern. Specifically, rounding may worsen the estimation and projection of timeseries models on which most seasonal adjustment methods are based.
Of course there is a trivial remedy to these drawbacks: namely to publish unrounded data, or at least data with2 or 3 decimal places, in order to make negligible the size of rounding noise. It is not by chance that otherindexes, widely used by analysts, such as the stock market indicators, have a base near 10,000, that makesalmost negligible rounding effect on decimal places, and nevertheless the daily changes of these indexes arepublished by using 2 decimal places at least. However, only few statistical agencies adopt this convention, andeven the recent agreements on HICP compilation suggest rounding indexes and inflation rates to the firstdecimal place. Notably, the base of HICP has been fixed to 100 in 1996. Furthermore, in most cases, Europeanstatistical agencies are allowed to adopt different compilation procedures, other than the agreed one (e.g.: theymay use a different aggregation formula), under the condition that the results differ from the baseline less thanone tenth of a percentage point. Only in computing average yearly changes of HICP it is required to useunrounded figures of annual index averages.
eureurostatostat
54 15th CEIES seminar: Inflation in Europe — Different measures and their users
1 By the way, this result was reported by Sheppard more than a century ago in his article published in the Proceeding of the London Mathematical So-ciety, 1989, vol. 29: “On the calculation of the most probable values of frequency constants for data arranged according to equidistant divisions of ascale”.
3. Price changes dispersion
To compile a price index means necessarily computing average prices for a number of products. On their turn,products sub-indexes are aggregated by using a system of weights, derived from households’ budget surveys,national accounts, and other wide-ranging sources. Of course this practice provides an accurate measure ofaverage price changes from the viewpoint of a representative consumer, who has average preferences, averageincome, and so on. As a matter of fact, this average inflation applies to other consumers as well, if pricedynamics of different goods and services do not differ too much from the average one. Unfortunately, it hasbeen remarked that this is not the most frequent case nowadays; hence different consumers groups bear verydifferent purchasing power reductions.
Of course this is a well known (and maybe unavoidable) drawback of every aggregate statistical measure.According to the mainstream economic theory, market enlargement and improved competition should narrowthe differences within every product market, while the same factors could widen the divergence of pricechanges among different products as well. In fact, general equilibrium requires that prices adjust very fast ineach market. As a result, global competition lowers general inflation, on the one hand, while it tends to increaseprices dispersion on the other.
Figure 3, reporting some distribution indicators for HICP compiled for the European Monetary Union, providesa very rude exemplification of this fact. Specifically, the breakdown in 89 product groups has been used tocompute each month the second and eighth deciles of 12-month price changes distribution.
First of all, it is worth noticing that price dispersion does not increased too much during the oil crisis: thedistance between second and eighth deciles remained by 2-2.5 percentage points, as during the previous period.It means that price dispersion does not depend mainly on transitory shocks on special prices, but is determinedessentially by structural factors. One reason may be the fast and strong adjustment of prices on markets thatbecome more and more flexible and reactive. If it is so, analysts need some measures of overall price dynamicsthat are less sensitive to changes in price distribution than the headline average inflation rate. Otherwise, itwould be very difficult understanding the true signals coming from the markets. Hence statistical agenciesshould make an effort to provide researchers and analysts also with some indicators about price changesdistribution, such as quantiles, median, trimmed mean, and the like. Incidentally, the last two indicators arestandard core inflation measures as well.
It can be argued that average European inflation almost always stayed within the aforementioned quantiles,even during the latest oil price rise. Nevertheless, the distribution of price changes became pretty asymmetricalsince the mid of 1999. It implies that, at the same time as the average inflation speeded up by 2.5 percentagepoints from the end of 1998 to April 2001, the large majority of prices, included between the second and theeighth deciles, accelerated by less than 2 percentage points. What is more, until September 2000, the prices ofone fifth of products fell or rose less than 0.5% per year, as the dynamics of the second decile shows. Namelyinflation, in its narrowest definition, regarded only 80% of products. On the other hand, even when averageEuropean inflation was below 1%, one fifth of products displayed annual price increases over 2% (as the levelof eighth decile confirms), that is more than twice the average inflation rate.
Adopting a narrow statistical viewpoint, an estimated average associated to such dispersion might not differfrom zero significantly. Of course, nobody questions seriously that inflation was, and still will be, a problemfor European countries. However, it should be stressed that deflating consumers’ expenditure by using a singleaverage inflation indicator could be misleading. Furthermore, headline inflation rate may provide a poor (noisy)signal about general price dynamics. As a consequence, analysts need, first of all, very disaggregate price sub-indexes in order to evaluate properly purchasing power of different consumer groups and, secondly, they wouldappreciate some “robust” measure of inflation, such as “core” indicators.
4. Market competitiveness, price convergence, and price index compilation
Increasing market integration, competitiveness and flexibility play a crucial role in determining pricedynamics. The so-called “law of one price” states that in a perfect competitive market the same commoditiesmust be exchanged at the same price. If this were not the case, the market would not be in equilibrium, therewould be a scope for arbitrage, and therefore the price would not be stable. This law holds also in most of actualmarkets, even though they are far from being competitive. For instance, in the case of indifferianciate
eureurostatostat
15th CEIES seminar: Inflation in Europe — Different measures and their users 55

monopoly, the monopolist sets a single price in order to maximise his profits. The same happens in collusiveoligopolistic markets for commodities that can be hardly be differentiated (such as fuels).
In other cases the law of one-price holds because of the strategies followed by firms. For instance, sometimesthe same price is set on different markets in order to “fidelise” clients. This is the case of several brands suchas McDonald, Swatch and Benetton, that sometimes make use of a rude PPP rule too. Occasionally, firms useone-price policies to reinforce the look of their products. For instance, most luxury goods producers impose asingle highest price in all shops, to the aim of granting customers about quality and originality of their products.In other cases, prices tend to follow a reference benchmark, set by the price leader, which can be a truedominant firm or a “barometric” one, which simply has better information about the market. Furthermore, ineach instant of time prices could differ only owing to the staggering of price variations among the firms andoutlets. Anyway, even in a perfect competitive market, the prices of the same commodity are allowed to divergeif consumer incurs in search costs. Thus the law of “one stable structure of price” holds instead.
In any case, it could be put forward the general hypothesis that prices variations exhibits a negative correlationwith the initial level of prices, or, specifically, with the difference between initial price and the average (orreference) one. Figure 3 illustrates this hypothesis in the case of six models of a given product, whose pricesdiffer in the beginning, but tend to converge in the long run. To do so, higher initial prices must rise at a slowerpace, while lower prices must increase speedier. Of course, price variations should also depend on the usualstructural factors, such as the nature of goods, the place of selling, type of outlet.
If convergence hypothesis is not false, a series of consequences for the estimation of inflation rates follow. Firstof all, price changes are not independent from price levels, as price index compilers usually assume. Thussurveyed products should be chosen taking into account also the price frequency distribution in the market.Specifically, the selection of “best selling” products only could bias the inflation rates. As far as “best selling”items have the best quality price ratio (otherwise rational consumers did not prefer them), this class of productshas also a price above the average (taking into account quality and other relevant characteristics). Thus, if theone price law holds, then bestseller prices tend to rise faster than the others. As far as I know, this possibleupward bias of CPI (not only of COLI) has not been regarded yet in Boskin Report and related literature.
Furthermore, it is likely that the adjustment of prices toward some equilibrium configuration is faster as pricestickiness lessens. Notably, this is the case when search costs incurred by consumers decrease, and when “menucosts” for firms reduce. The next changeover in Europe is likely to cut both types of costs: consumers will beable to compare prices of the same item all over Europe, without incurring in any exchange fee; and firms maytake advantage of the changeover to adjust their prices exactly to the optimal level, since in any case they haveto bear (not trivial) menu costs to switch their national prices in euros. As a consequence, the selection of pricesample for 2002 will be crucial. Inflation measures in Europe could be biased if the sample provided an out offocus picture of current prices structure.
Namely, some statistical evidence in favour of one price hypothesis is provided by the analysis of Italian datacollected in order to estimate HCPI during 1995 and 1996 in 9 cities, for over 400 products. The author will behappy to provide further details about this study to the interested people. Table 1 reports the price changes ofdifferent classes of items, grouped according to the difference between their own price level and the relatedaverage price (computed for the same item sold in the same city and in the same type of outlet). Price changesare given as difference to the average inflation rate, which was by 6%. It is self evident that items that are soldat a higher price show price increases far lower than the others, and vice versa. In addition, the effect of initialprice on future price dynamics seems to be substantial.
By using the same data, the half-life of a prices divergence has been estimated approximately in 13 years, whichis slightly longer than convergence time found among general price levels in several US cities. Sharpdifferences in convergence rates hold among various outlet categories. Notably, mean reversion effect seemsstronger in big commercial centres and in street markets, maybe because these are the (polar) cases in whichcompetition is stronger and search costs for consumers are negligible. Quite the reverse, convergence is slowerin traditional, specialised, one brand and chained outlets, where product differentiation is a common practice.Furthermore, goods prices tend to revert toward the average faster than services do, and this fact is consistentwith the scarce competition in most service markets in Italy.
eureurostatostat
56 15th CEIES seminar: Inflation in Europe — Different measures and their users
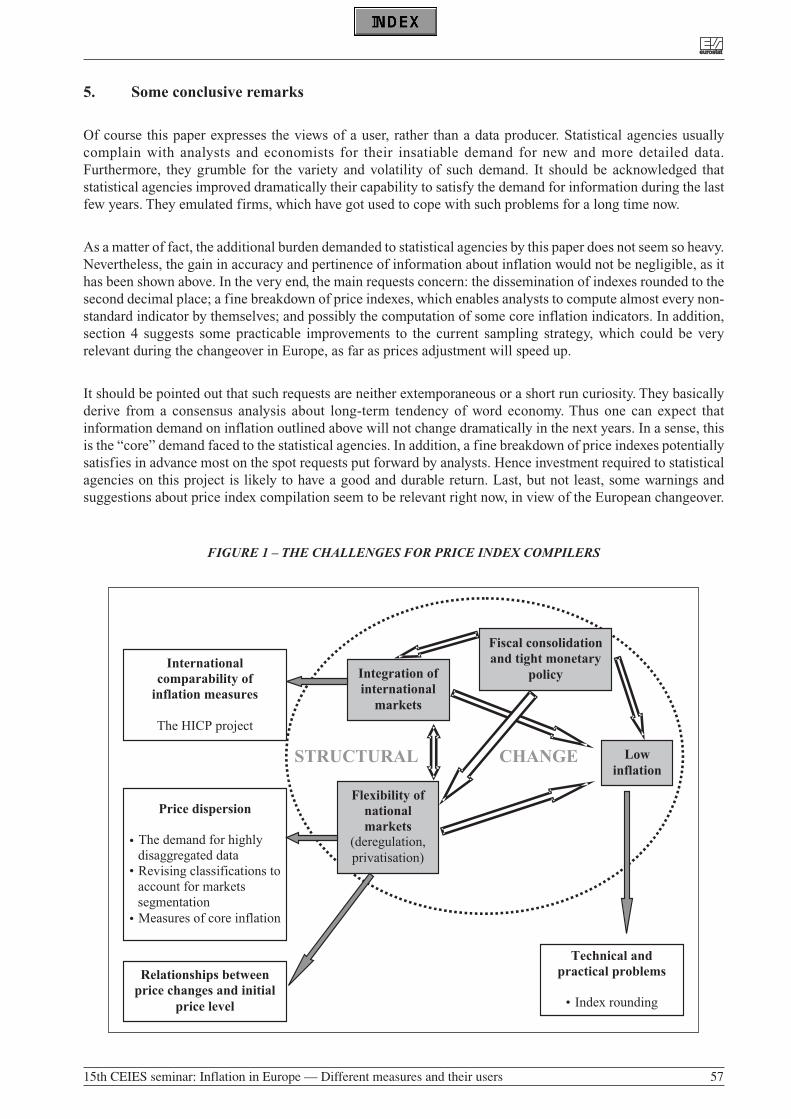
5. Some conclusive remarks
Of course this paper expresses the views of a user, rather than a data producer. Statistical agencies usuallycomplain with analysts and economists for their insatiable demand for new and more detailed data.Furthermore, they grumble for the variety and volatility of such demand. It should be acknowledged thatstatistical agencies improved dramatically their capability to satisfy the demand for information during the lastfew years. They emulated firms, which have got used to cope with such problems for a long time now.
As a matter of fact, the additional burden demanded to statistical agencies by this paper does not seem so heavy.Nevertheless, the gain in accuracy and pertinence of information about inflation would not be negligible, as ithas been shown above. In the very end, the main requests concern: the dissemination of indexes rounded to thesecond decimal place; a fine breakdown of price indexes, which enables analysts to compute almost every non-standard indicator by themselves; and possibly the computation of some core inflation indicators. In addition,section 4 suggests some practicable improvements to the current sampling strategy, which could be veryrelevant during the changeover in Europe, as far as prices adjustment will speed up.
It should be pointed out that such requests are neither extemporaneous or a short run curiosity. They basicallyderive from a consensus analysis about long-term tendency of word economy. Thus one can expect thatinformation demand on inflation outlined above will not change dramatically in the next years. In a sense, thisis the “core” demand faced to the statistical agencies. In addition, a fine breakdown of price indexes potentiallysatisfies in advance most on the spot requests put forward by analysts. Hence investment required to statisticalagencies on this project is likely to have a good and durable return. Last, but not least, some warnings andsuggestions about price index compilation seem to be relevant right now, in view of the European changeover.
FIGURE 1 – THE CHALLENGES FOR PRICE INDEX COMPILERS
STRUCTURAL CHANGE
Internationalcomparability of
inflation measures
The HICP project
Price dispersion
The demand for highly•
•
•
Relationships between
price levelprice changes and initial
Integration ofinternational
markets
Fiscal consolidationand tight monetary
policy
Flexibility ofnationalmarkets
(deregulation,privatisation)
Lowinflation
Technical andpractical problems
Index rounding•
eureurostatostat
15th CEIES seminar: Inflation in Europe — Different measures and their users 57
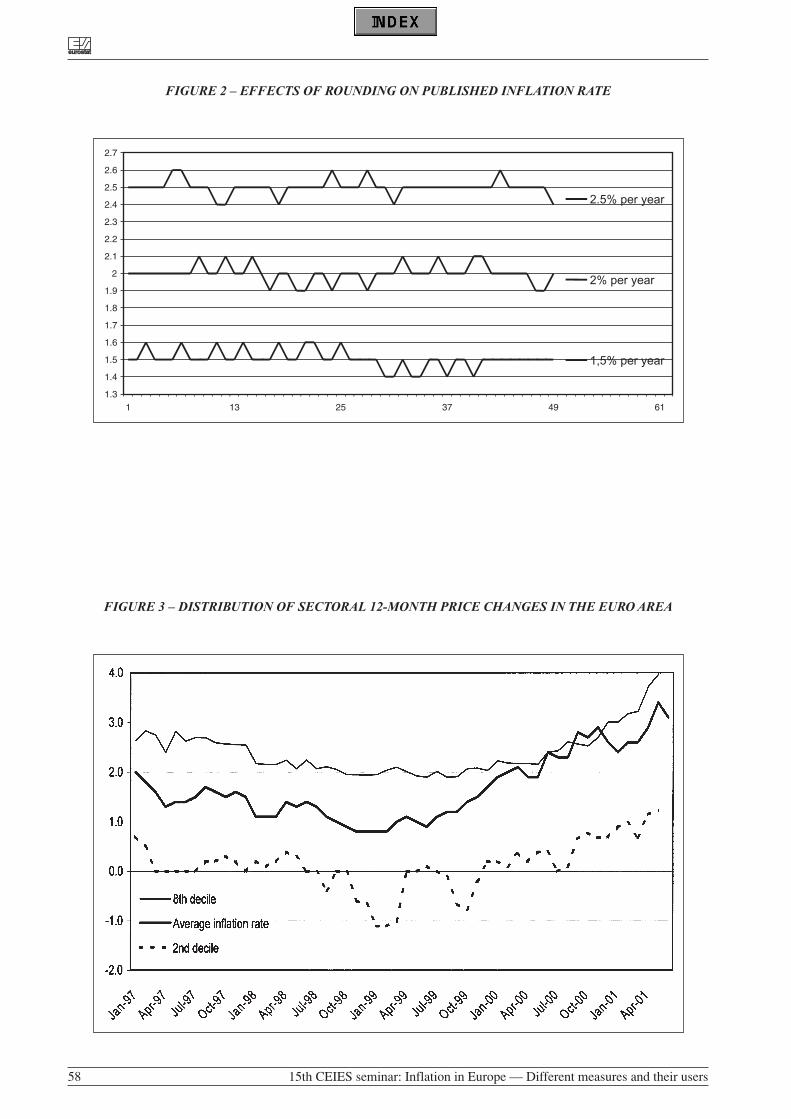
FIGURE 2 – EFFECTS OF ROUNDING ON PUBLISHED INFLATION RATE
FIGURE 3 – DISTRIBUTION OF SECTORAL 12-MONTH PRICE CHANGES IN THE EURO AREA
1.3
1.4
1.5
1.6
1.7
1.8
1.9
2
2.1
2.2
2.3
2.4
2.5
2.6
2.7
1 13 25 37 49 61
2.5% per year
2% per year
1,5% per year
eureurostatostat
58 15th CEIES seminar: Inflation in Europe — Different measures and their users
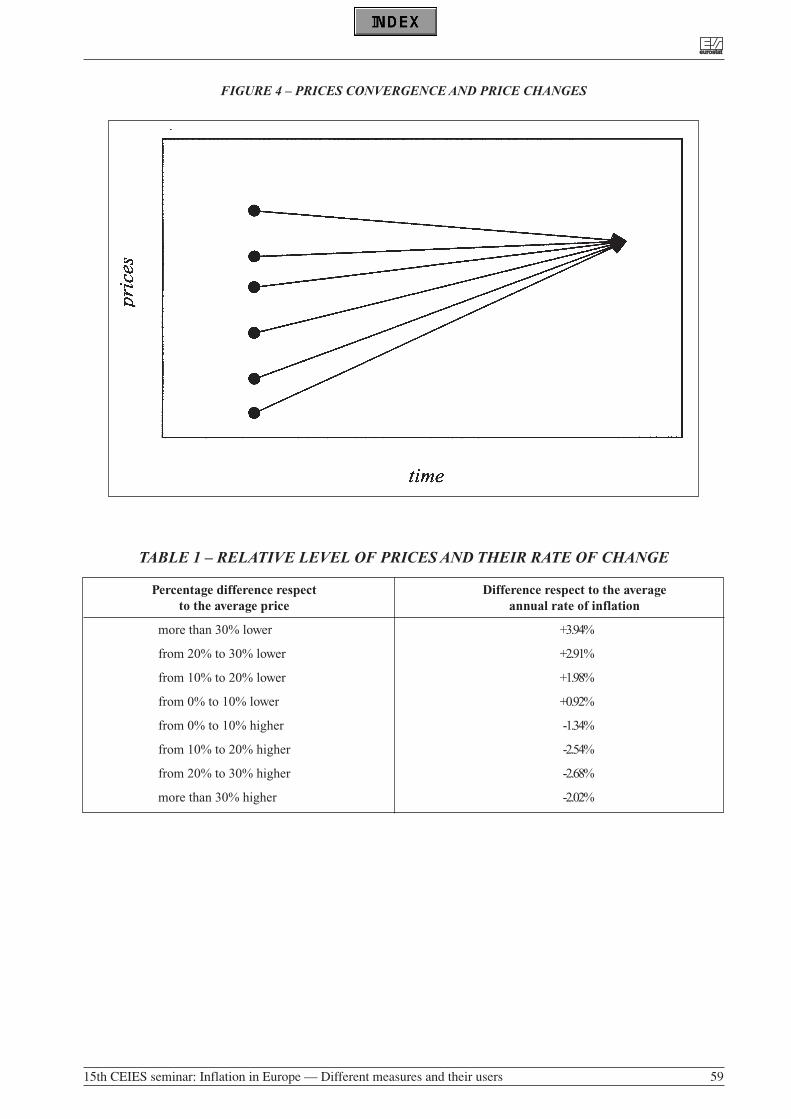
FIGURE 4 – PRICES CONVERGENCE AND PRICE CHANGES
TABLE 1 – RELATIVE LEVEL OF PRICES AND THEIR RATE OF CHANGE
Percentage difference respect Difference respect to the averageto the average price annual rate of inflation
more than 30% lower +3.94%
from 20% to 30% lower +2.91%
from 10% to 20% lower +1.98%
from 0% to 10% lower +0.92%
from 0% to 10% higher -1.34%
from 10% to 20% higher -2.54%
from 20% to 30% higher -2.68%
more than 30% higher -2.02%
eureurostatostat
15th CEIES seminar: Inflation in Europe — Different measures and their users 59
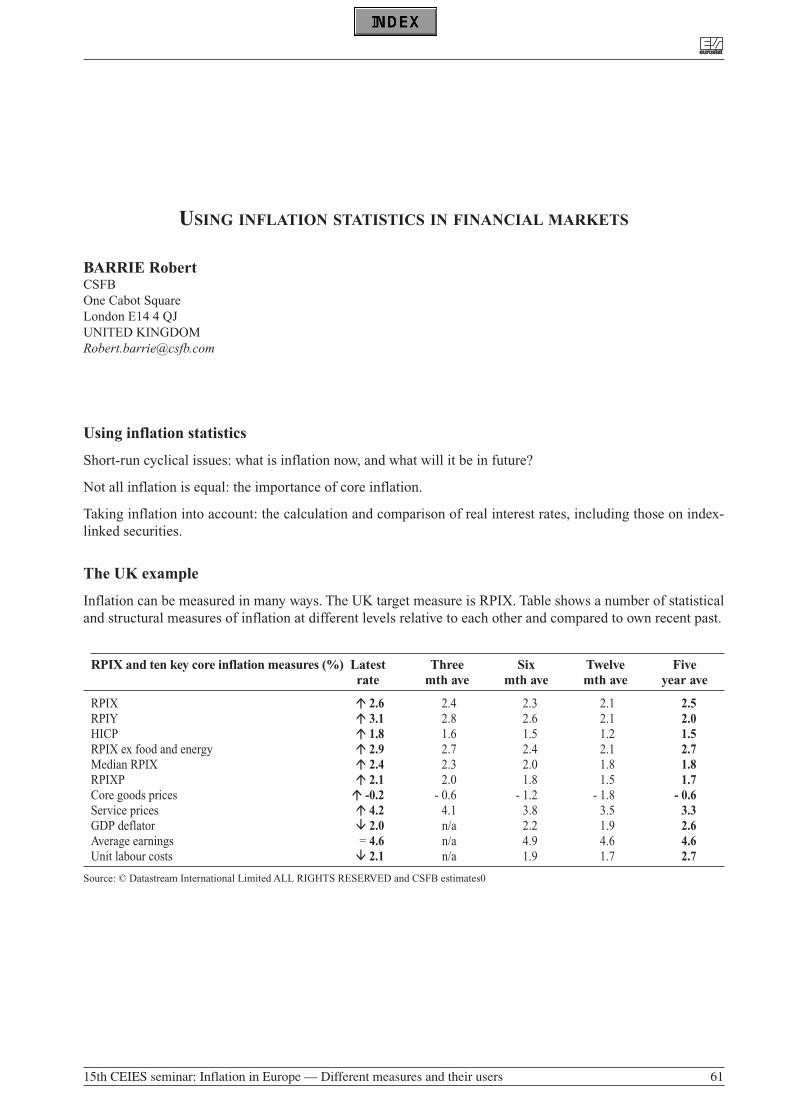
USING INFLATION STATISTICS IN FINANCIAL MARKETS
BARRIE RobertCSFBOne Cabot SquareLondon E14 4 QJUNITED [email protected]
Using inflation statistics
Short-run cyclical issues: what is inflation now, and what will it be in future?
Not all inflation is equal: the importance of core inflation.
Taking inflation into account: the calculation and comparison of real interest rates, including those on index-linked securities.
The UK example
Inflation can be measured in many ways. The UK target measure is RPIX. Table shows a number of statisticaland structural measures of inflation at different levels relative to each other and compared to own recent past.
eureurostatostat
15th CEIES seminar: Inflation in Europe — Different measures and their users 61
RPIX and ten key core inflation measures (%) Latest Three Six Twelve Fiverate mth ave mth ave mth ave year ave
RPIX � 2.6 2.4 2.3 2.1 2.5RPIY � 3.1 2.8 2.6 2.1 2.0HICP � 1.8 1.6 1.5 1.2 1.5RPIX ex food and energy � 2.9 2.7 2.4 2.1 2.7Median RPIX � 2.4 2.3 2.0 1.8 1.8RPIXP � 2.1 2.0 1.8 1.5 1.7Core goods prices � -0.2 - 0.6 - 1.2 - 1.8 - 0.6Service prices � 4.2 4.1 3.8 3.5 3.3GDP deflator � 2.0 n/a 2.2 1.9 2.6Average earnings = 4.6 n/a 4.9 4.6 4.6Unit labour costs � 2.1 n/a 1.9 1.7 2.7
Source: © Datastream International Limited ALL RIGHTS RESERVED and CSFB estimates0
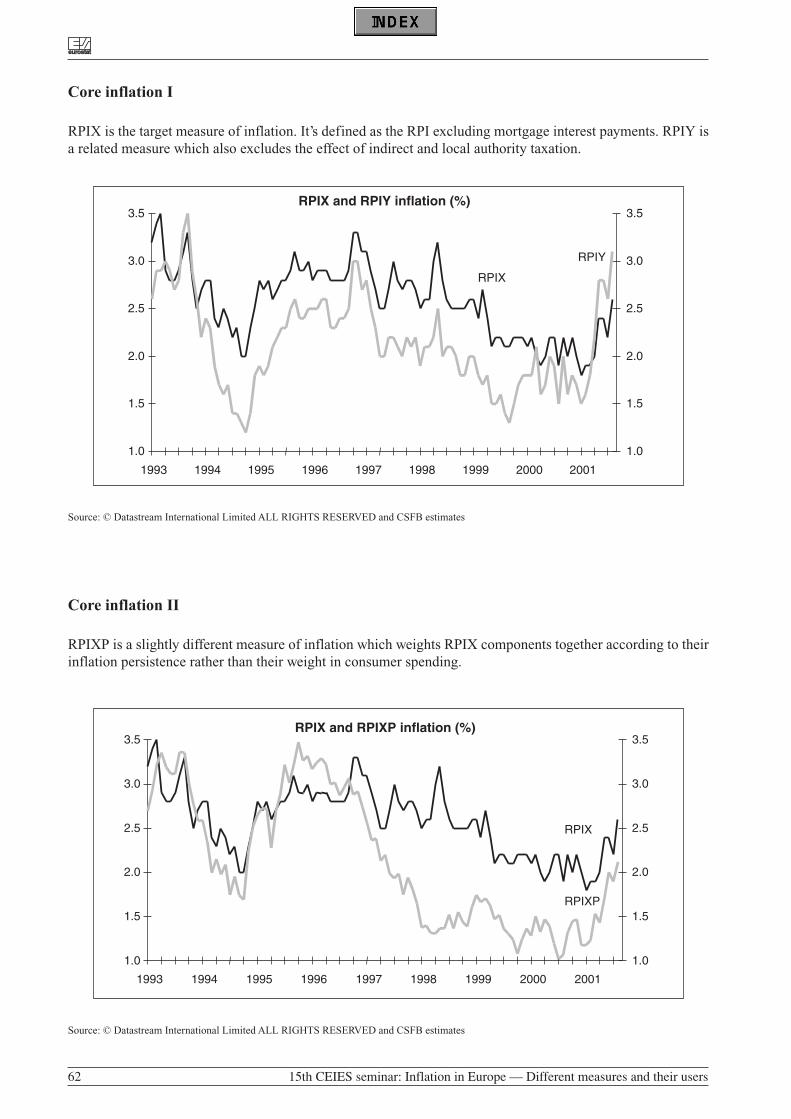
Core inflation I
RPIX is the target measure of inflation. It’s defined as the RPI excluding mortgage interest payments. RPIY isa related measure which also excludes the effect of indirect and local authority taxation.
Source: © Datastream International Limited ALL RIGHTS RESERVED and CSFB estimates
Core inflation II
RPIXP is a slightly different measure of inflation which weights RPIX components together according to theirinflation persistence rather than their weight in consumer spending.
Source: © Datastream International Limited ALL RIGHTS RESERVED and CSFB estimates
RPIX and RPIXP inflation (%)
1.0
1.5
2.0
2.5
3.0
3.5
1993 1994 1995 1996 1997 1998 1999 2000 2001
1.0
1.5
2.0
2.5
3.0
3.5
RPIX
RPIXP
RPIX and RPIY inflation (%)
1.0
1.5
2.0
2.5
3.0
3.5
1993 1994 1995 1996 1997 1998 1999 2000 2001
1.0
1.5
2.0
2.5
3.0
3.5
RPIX
RPIY
eureurostatostat
62 15th CEIES seminar: Inflation in Europe — Different measures and their users
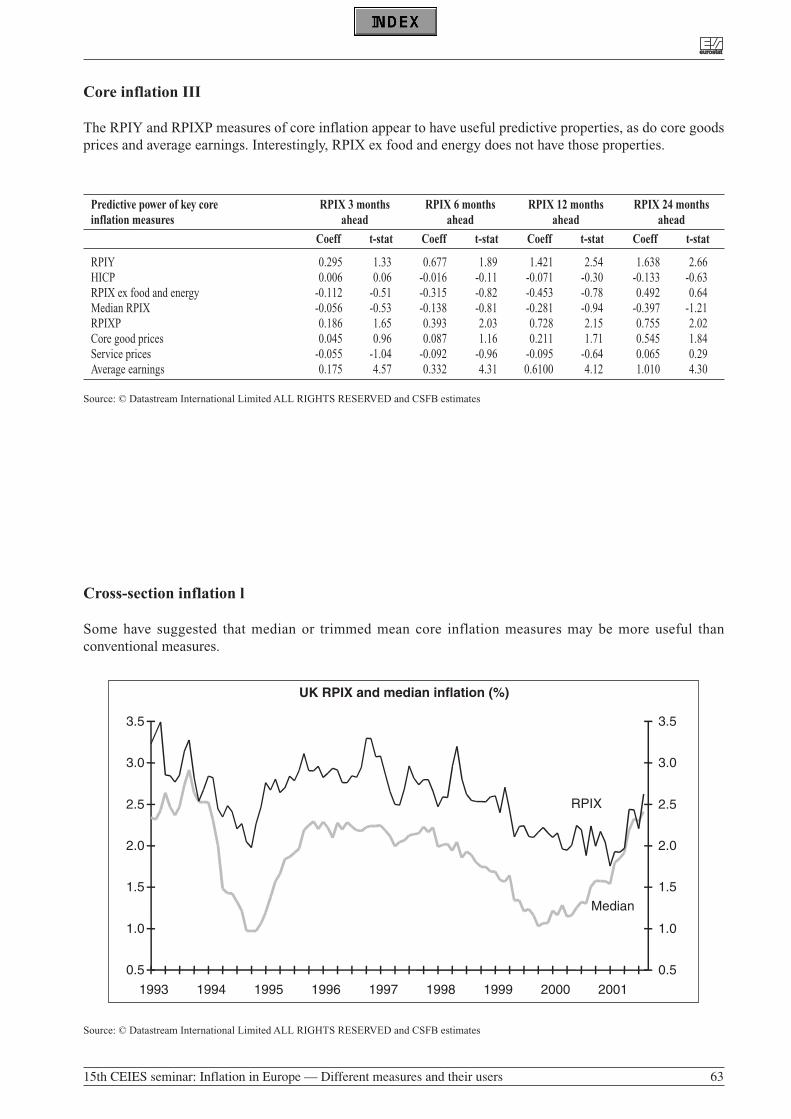
Core inflation III
The RPIY and RPIXP measures of core inflation appear to have useful predictive properties, as do core goodsprices and average earnings. Interestingly, RPIX ex food and energy does not have those properties.
Cross-section inflation l
Some have suggested that median or trimmed mean core inflation measures may be more useful thanconventional measures.
Source: © Datastream International Limited ALL RIGHTS RESERVED and CSFB estimates
UK RPIX and median inflation (%)
0.5
1.0
1.5
2.0
2.5
3.0
3.5
1993 1994 1995 1996 1997 1998 1999 2000 2001
0.5
1.0
1.5
2.0
2.5
3.0
3.5
RPIX
Median
eureurostatostat
15th CEIES seminar: Inflation in Europe — Different measures and their users 63
Predictive power of key core RPIX 3 months RPIX 6 months RPIX 12 months RPIX 24 monthsinflation measures ahead ahead ahead ahead
Coeff t-stat Coeff t-stat Coeff t-stat Coeff t-stat
RPIY 0.295 1.33 0.677 1.89 1.421 2.54 1.638 2.66HICP 0.006 0.06 -0.016 -0.11 -0.071 -0.30 -0.133 -0.63RPIX ex food and energy -0.112 -0.51 -0.315 -0.82 -0.453 -0.78 0.492 0.64Median RPIX -0.056 -0.53 -0.138 -0.81 -0.281 -0.94 -0.397 -1.21RPIXP 0.186 1.65 0.393 2.03 0.728 2.15 0.755 2.02Core good prices 0.045 0.96 0.087 1.16 0.211 1.71 0.545 1.84Service prices -0.055 -1.04 -0.092 -0.96 -0.095 -0.64 0.065 0.29Average earnings 0.175 4.57 0.332 4.31 0.6100 4.12 1.010 4.30
Source: © Datastream International Limited ALL RIGHTS RESERVED and CSFB estimates
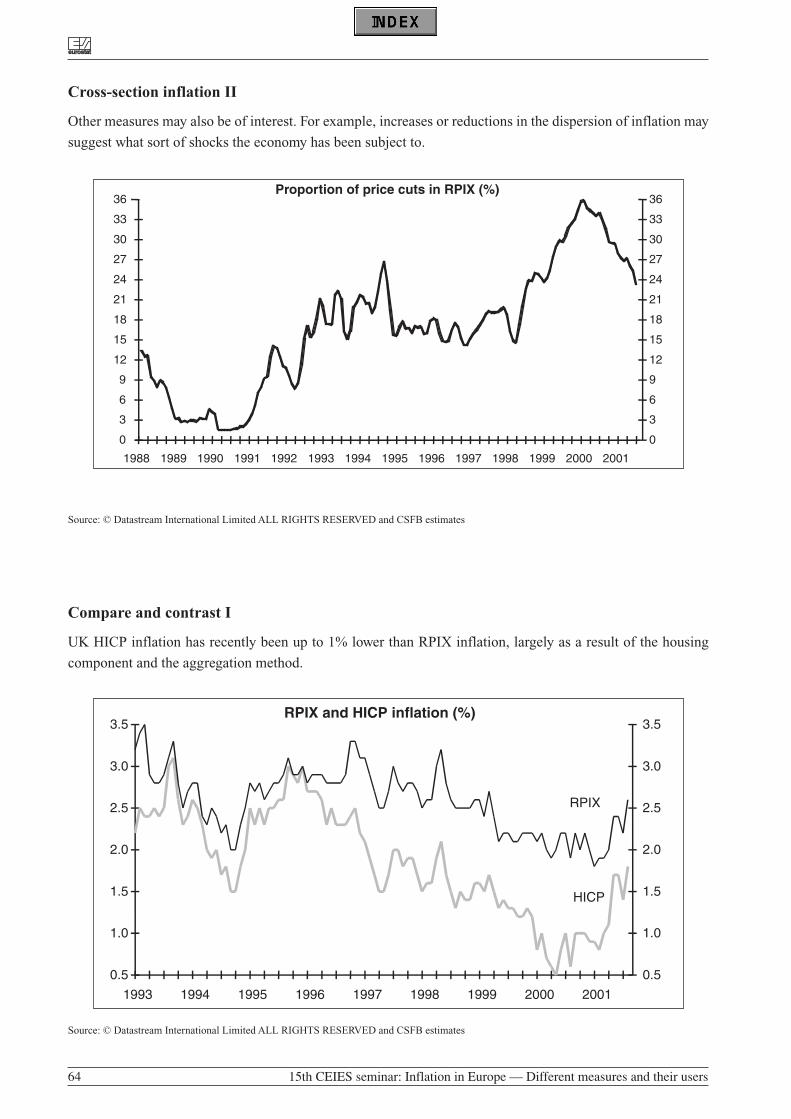
Cross-section inflation II
Other measures may also be of interest. For example, increases or reductions in the dispersion of inflation may
suggest what sort of shocks the economy has been subject to.
Source: © Datastream International Limited ALL RIGHTS RESERVED and CSFB estimates
Compare and contrast I
UK HICP inflation has recently been up to 1% lower than RPIX inflation, largely as a result of the housing
component and the aggregation method.
Source: © Datastream International Limited ALL RIGHTS RESERVED and CSFB estimates
RPIX and HICP inflation (%)
0.5
1.0
1.5
2.0
2.5
3.0
3.5
1993 1994 1995 1996 1997 1998 1999 2000 2001
0.5
1.0
1.5
2.0
2.5
3.0
3.5
RPIX
HICP
Proportion of price cuts in RPIX (%)
0
3
6
9
12
15
18
21
24
27
30
33
36
1988 1989 1990 1991 1992 1993 1994 1995 1996 1997 1998 1999 2000 2001
0
3
6
9
12
15
18
21
24
27
30
33
36
eureurostatostat
64 15th CEIES seminar: Inflation in Europe — Different measures and their users
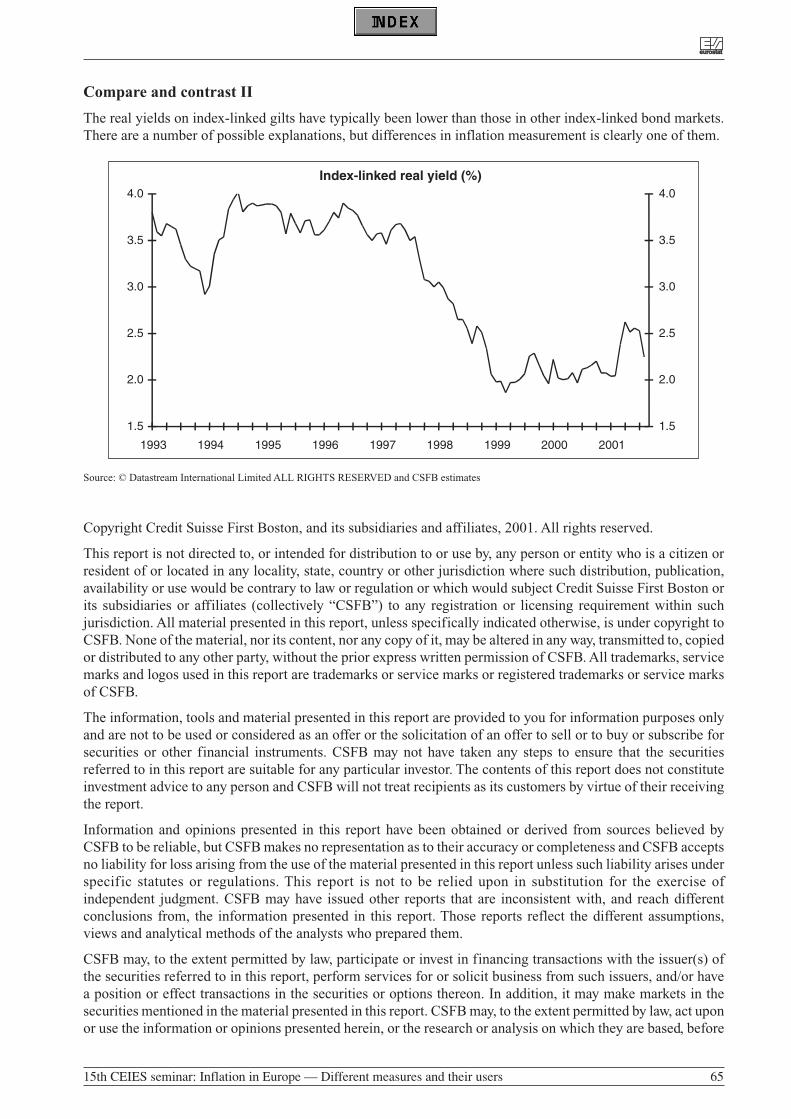
Compare and contrast II
The real yields on index-linked gilts have typically been lower than those in other index-linked bond markets.There are a number of possible explanations, but differences in inflation measurement is clearly one of them.
Source: © Datastream International Limited ALL RIGHTS RESERVED and CSFB estimates
Copyright Credit Suisse First Boston, and its subsidiaries and affiliates, 2001. All rights reserved.
This report is not directed to, or intended for distribution to or use by, any person or entity who is a citizen orresident of or located in any locality, state, country or other jurisdiction where such distribution, publication,availability or use would be contrary to law or regulation or which would subject Credit Suisse First Boston orits subsidiaries or affiliates (collectively “CSFB”) to any registration or licensing requirement within suchjurisdiction. All material presented in this report, unless specifically indicated otherwise, is under copyright toCSFB. None of the material, nor its content, nor any copy of it, may be altered in any way, transmitted to, copiedor distributed to any other party, without the prior express written permission of CSFB. All trademarks, servicemarks and logos used in this report are trademarks or service marks or registered trademarks or service marksof CSFB.
The information, tools and material presented in this report are provided to you for information purposes onlyand are not to be used or considered as an offer or the solicitation of an offer to sell or to buy or subscribe forsecurities or other financial instruments. CSFB may not have taken any steps to ensure that the securitiesreferred to in this report are suitable for any particular investor. The contents of this report does not constituteinvestment advice to any person and CSFB will not treat recipients as its customers by virtue of their receivingthe report.
Information and opinions presented in this report have been obtained or derived from sources believed byCSFB to be reliable, but CSFB makes no representation as to their accuracy or completeness and CSFB acceptsno liability for loss arising from the use of the material presented in this report unless such liability arises underspecific statutes or regulations. This report is not to be relied upon in substitution for the exercise ofindependent judgment. CSFB may have issued other reports that are inconsistent with, and reach differentconclusions from, the information presented in this report. Those reports reflect the different assumptions,views and analytical methods of the analysts who prepared them.
CSFB may, to the extent permitted by law, participate or invest in financing transactions with the issuer(s) ofthe securities referred to in this report, perform services for or solicit business from such issuers, and/or havea position or effect transactions in the securities or options thereon. In addition, it may make markets in thesecurities mentioned in the material presented in this report. CSFB may, to the extent permitted by law, act uponor use the information or opinions presented herein, or the research or analysis on which they are based, before
Index-linked real yield (%)
1.5
2.0
2.5
3.0
3.5
4.0
1993 1994 1995 1996 1997 1998 1999 2000 2001
1.5
2.0
2.5
3.0
3.5
4.0
eureurostatostat
15th CEIES seminar: Inflation in Europe — Different measures and their users 65
the material is published. CSFB may have, within the last three years, served as manager or co-manager of apublic offering of securities for, or currently may make a primary market in issues of, any or all of thecompanies mentioned in this report. Additional information is available on request.
Some investments referred to in the research will be offered solely by a single entity and in the case of someinvestments solely by CSFB, or an associate of CSFB.
Past performance should not be taken as an indication or guarantee of future performance, and norepresentation or warranty, express or implied, is made regarding future performance. Information, opinionsand estimates contained in this report reflect a judgement at its original date of publication by CSFB and aresubject to change. The price, value of and income from any of the securities or financial instruments mentionedin this report can fall as well as rise. The value of securities and financial instruments is subject to exchangerate fluctuation that may have a positive or adverse effect on the price or income of such securities or financialinstruments. Investors in securities such as ADR’s, the values of which are influenced by currency volatility,effectively assume this risk. Structured securities are complex instruments, typically involve a high degree ofrisk and are intended for sale only to sophisticated investors who are capable of understanding and assumingthe risks involved. The market value of any structured security may be affected by changes in economic,financial and political factors (including, but not limited to, spot and forward interest and exchange rates), timeto maturity, market conditions and volatility, and the credit quality of any issuer or reference issuer. Anyinvestor interested in purchasing a structured product should conduct their own investigation and analysis ofthe product and consult with their own professional advisers as to the risks involved in making such a purchase.
Some investments discussed in the research may have a high level of volatility. High volatility investments mayexperience sudden and large falls in their value causing losses when that investment is realised. Those lossesmay equal your original investment. In the case of some investments the potential losses may exceed the amountof initial investment, in such circumstances you may be required to pay more money to support those losses.Income yields from investments may fluctuate and in consequence initial capital paid to make the investmentmay be used as part of that income yield.
Some investments may not be readily realisable and it may be difficult to sell or realise those investments,similarly it may prove difficult for you to obtain reliable information about the value, or risks, to which such aninvestment is exposed. The investments and services contained or referred to in this report may not be suitablefor you, it is recommended you consult an independent investment advisor if you are in doubt about thoseinvestments or investment services. Nothing in this report constitutes investment, legal, accounting or taxadvice nor a representation that any investment or strategy is suitable or appropriate to your individualcircumstances. Nothing in the report constitutes a personal recommendation to you. CSFB does not advise onthe tax consequences of investments. You are advised to contact an independent tax adviser. Please note thebases and levels of taxation may change.
This report may contain hyperlinks to websites. CSFB has not reviewed the linked site and takes noresponsibility for the content contained therein. The link is provided solely for your convenience andinformation and the content of the linked site does not in any way form part of this document. Following thelink through this report or CSFB’s website shall be at your own risk.
This report is issued in Europe by Credit Suisse First Boston (Europe) Limited, which is regulated in the UnitedKingdom by The Securities and Futures Authority (“SFA”). This report is being distributed in Europe by CreditSuisse First Boston (Europe) Limited, in the United States by Credit Suisse First Boston Corporation; inSwitzerland by Credit Suisse First Boston; in Canada by Credit Suisse First Boston Securities Canada, Inc.; inBrazil by Banco de Investimentos Credit Suisse Boston Garantia S.A; in Japan by Credit Suisse First BostonSecurities (Japan) Limited; elsewhere in Asia by Credit Suisse First Boston (Hong Kong) Limited, CreditSuisse First Boston Australia Equities Limited, Credit Suisse First Boston NZ Securities Limited, Credit SuisseFirst Boston (Thailand) Limited, CSFB Research (Malaysia) Sdn Bhd, Credit Suisse First Boston SingaporeBranch and elsewhere in the world by an authorised affiliate. Research on Taiwanese securities produced byCredit Suisse First Boston, Taipei Branch has been prepared and/or reviewed by a registered Senior BusinessPerson.
In jurisdictions where CSFB is not already registered or licensed to trade in securities, transactions will onlybe effected in accordance with applicable securities legislation, which will vary from jurisdiction to jurisdiction
eureurostatostat
66 15th CEIES seminar: Inflation in Europe — Different measures and their users
and may require that the trade be made in accordance with applicable exemptions from registration or licensingrequirements. Non-U.S. customers wishing to effect a transaction should contact a CSFB entity in their localjurisdiction unless governing law permits otherwise. U.S. customers wishing to effect a transaction should doso only by contacting a representative at Credit Suisse First Boston Corporation in the U.S.
Please note that this research was originally prepared and issued by CSFB for distribution to their marketprofessional and institutional investor customers. Recipients who are not market professional or institutionalinvestor customers of CSFB should seek the advice of their independent financial advisor prior to taking anyinvestment decision based on this report or for any necessary explanation of its contents.
eureurostatostat
15th CEIES seminar: Inflation in Europe — Different measures and their users 67
CONCEPTUAL PROBLEMS WITH THE HARMONISED INDEX OF CONSUMER
PRICES (HICP)
VON DER LIPPE PeterUniversitaet Essen/FB 545141 [email protected]
1. Background to my critique of the HICP
When studying the harmonised index of consumer prices (HICP), we must distinguish between two quitedifferent things:
1. Endeavours to produce standardised and comparable methods for compiling national indices of consumerprices (ICPs) or the special index needed for the European HICP (or ICP for short), and
2. The aggregation of national ICPs based on the European Union Member States or countries belonging tothe European Monetary Union (EMU) into an HICP that is officially used as the basis for, or measure of,ECB1 monetary policy.
There are similarities between these two topics in that the methodological approach to the HICP played adecisive role in shaping the contents of the regulations adopted as part of the harmonisation process. This isparticularly true of the HICP’s main feature, namely the fact that it is a chain index based on national basketsof goods that change over time. Had an entirely different approach been chosen, the harmonisation regulationswould have looked very different in terms of their contents.
This is also true of a second feature of the HICP methodology - the role played by enthusiasm (particularly inthe USA) for the “economic theory of index figures” and the “True Cost of Living Index” (COLI), which verymuch shaped the Boskin Commission’s thinking2.
In my critique of the conceptual premises of the HICP I will thus be concentrating on these two points, because:
• the HICP is designed as a chain index - which, whilst consistent with the SNA3, has a number of drawbacksthat clearly receive only scant attention in the SNA, and because
• although it does not profess to be a COLI (unlike the USA’s ICP), it is very much influenced by COLI-typethinking.
The HICP may well provide a valuable service, and a solution that is more satisfying from a theoretical pointof view might prove quite elusive. Nevertheless, the quality of a statistical measure is difficult to assess if it isnot clear what exactly is being measured, and if the result (in this case the measured “rate of inflation”) dependson such a wealth of factors.
2. Harmonisation strategy and the concept of comparability
Notwithstanding criticism of the underlying concepts, the object of harmonisation can be wholeheartedlyendorsed - “HICPs shall be considered to be comparable if they reflect only differences in price changes or
eureurostatostat
15th CEIES seminar: Inflation in Europe — Different measures and their users 69
1 European Central Bank.2 The Boskin Commission also thought COLI a worthy goal, in theory at least.3 System of National Accounts.
consumption patterns between countries”. The fact that different national CPIs also reflect differences inconsumption patterns hardly needs to be pointed out. Another question is whether the common (country-aggregated) HICP rate of inflation should be affected by such differences.
Criticism has recently been levelled at the HICP for the monetary union (hereinafter “MUICP”, or MonetaryUnion Index of Consumer Prices), particularly by Georg Erber of the DIW Berlin, basically because theMUICP rate of inflation, which the ECB also uses as a guideline, has two components:
1. The price increase measured using a common European basket of goods (as is done when calculatingpurchasing power parities [PPPs], comparisons being made for two countries - or one country plus theCommunity - on the basis of the same basket of goods4), and
2. Differences between the national baskets of goods that make up the MUICP.
Alignment of consumer patterns in the EMU countries will gradually eliminate the second component of theMUICP rate of inflation, which in this respect is naturally “too high”. It has been argued that the existence ofthis structural component should be a reason for the ECB to base itself on a 2.5% rather than 2% annualincrease in the MUICP, so that countries with large national weightings (such as Germany) are notunintentionally exposed to deflationary tendencies.
It is certainly right that comparability between countries (which in itself presupposes an ability to makecountry-based aggregations) is contingent upon there being no differences in inflation rates that can beattributed to divergent methods. It is also right that this type of comparability can only be achieved by meansof agreements and regulations on methods to be uniformly applied.
The principles of harmonisation drawn up at EU level in this field are laudable, at least in terms of intent - thequest for “best practices” (but how should we define these?) or the laying down of rules, not in detail, but justto the extent necessary to ensure that certain “minimum standards” are observed. The phased introduction ofthe HICP is, in any case, to be welcomed. It should likewise be accepted that, when regulations are being drawnup, a country may be outvoted. This is, after all, the price of integration and increased international co-operation.
However, the contents of individual regulations and their theoretical (and sometimes political) raison d’etre area different matter. Here criticism is perfectly in order.
3. The concept of “pure price comparison” (temporal comparability)
Why not simply compare two specific average prices (values) at two different points in time in order to measurethe rise in prices? The reason is that, in addition to price changes, a whole series of other structural changesinfluence the comparison. This is clear from the reasons that the SNA advances for not using the unit valueindex. The SNA rejects this approach on the grounds that it is “affected by changes in the mix of items as wellas by changes in their prices. Unit value indices cannot therefore be expected to provide good measures ofaverage price change over time” (para 16.13).
It is one of the abiding secrets of the SNA why it - correctly - acknowledges the disadvantages of the unit valueindex but then goes on to recommend chain indices, failing to realise that the very same objections can be raisedagainst these. The basic objection here is that chain indices are not based on pure price comparisons. Thecomparison is not “pure” in the sense that the result is influenced merely by the change in prices, not by othervariables too. Nor is it “pure” in the sense that the outcome is influenced only by the periods 0 and t used in thecomparison, not by the intervening periods (1, 2, ..., t-1) with their prices and volumes.
In index theory, there are basically two ways of constructing situations such that prices related to these reflectthe actual increase in prices in a certain sense. We can either:
eureurostatostat
70 15th CEIES seminar: Inflation in Europe — Different measures and their users
4 Much has been written on international comparisons of this type, the best known contributions in this field being the methods devised by Geary andKhamis (GK) and by Eltetö, Köves and Szulc [EKS]. These works clearly played no role in the creation of the HICP. Why not? Though true that theHICP is an aggregation of countries rather than a comparison between countries, why does the comparability of goods and baskets of goods play a rolein the latter but not in the former?
1. Compare expenditure on a basket of goods which, on paper at least, is the same (in terms of type, volumeand quality of goods), or
2. Compare the theoretical minimum expenditure required to purchase a selection of goods of the same valuein terms of its utility during periods 0 and t,
concluding that an increase in prices has taken place (i.e. inflation has occurred) between periods 0 and t ifexpenditure (defined in one way or another) has increased.
The first approach is the famous Laspeyres’ index,
or, more simply, ,
where p stands for the prices and q the quantities of goods and services i = 1, 2, ..., n during the base period 0(in the case of HICP, 1996) and reporting time t. The second approach produces a constant utility index (orCOLI), where inflation is lower than the figure generated by
if and when households make rational substitutions, i.e. consume relatively less (or more) of goods that arebecoming relatively more (or less) expensive.
Temporal comparability is thus guaranteed by the uniformity of the basket of goods or of “utility”, though auniform situation may be more readily established in the first instance (the same basket) than in the second (thesame level of utility).
This is not the place to compare these two approaches, especially since neither the HICP - nor indeed itscountry-based aggregated equivalent, the MUICP - really corresponds to either. Although, as has already beensaid, the HICP does not claim to be a COLI, unlike the American CPI, at least one of the regulations imposedon the Member States as part of the harmonisation programme, namely Commission Regulation No 1749/96of 9 September 1996 on the inclusion of “newly significant goods and services”, smacks of usefulness andconstant utility indices.
This is very much in line with the thinking behind the Boskin Commission’s “new product bias” (akin to “outletbias”), the assumption being that a CPI should also reflect the added usefulness of new goods or forms ofselling (which the US CPI did not do at the time, hence the mention of “bias”). However, it is precisely this, i.e.the inclusion of new goods (except for the regular re-basings), that the Laspeyres’ approach urges us to avoid,as it adversely affects the comparability of the basket of goods.
Including new goods as quickly as possible is an action motivated by considerations of usefulness. Thus we findthe Boskin Report5 saying that petrol is not as expensive as the index suggests because credit cards now makepaying easier. Likewise, the prices given for eating out are too expensive, as there is now a large selection offrozen food that can be prepared at home. Or the increase in the price of books overestimates inflation, since itis now easier than ever to borrow books. And so the arguments continue - a consumer price index should alsoreflect a greater selection of goods, a cleaner environment, longer life expectancy and so forth.
There is no end to discussions of this nature if the ultimate aim6 is not to achieve price comparability but tocalculate for consumers an increase in usefulness that is not reflected in an increased price. The problem is nothow to deliberately under-calculate inflation7, the problem is whether there is any point in price statisticsmoving ever further away from observable prices for specifically defined goods.
4. The obsession with weightings that are as up-to-date as possible
Neither of the above-mentioned approaches - pure price comparison or COLI - justifies the use of a chain index,the desired means to the HICP end. At the forefront of attention here is the constant updating of the basket ofgoods and the ability to alter the basis of comparison (selection of goods and businesses and so forth) at any
Lt0P
000t qpqp
=0i0i
0iitLt0 qp
qpP
eureurostatostat
15th CEIES seminar: Inflation in Europe — Different measures and their users 71
5 All the examples included in my critique of the economic-theory-index are taken from the discussions held in the US.6 When taking account of quality changes, for example.
∑∑
∑ ∑
point in time - something that should not happen with the Laspeyres’ formula with weightings (q0) that are
fixed in the interests of a pure price comparison for the duration of an index with base 0.
It is sometimes said that the index is no longer appropriate in an age in which everything is changing so quickly- so much so that weightings may have to be changed yearly. This was clearly the thinking behind CommissionRegulation No 2454/97 of 10 December 1997 on “minimum standards for the quality of HICP weightings”. For“the quality of ”, read “recent”!
It should also be borne in mind that, since all the countries aggregated under the MUICP are constantlychanging their weighting schemes, the index for all the countries together (i.e. the MUICP) represents not justa wealth of baskets, but also baskets of differing ages. And if the “1996-base” index currently stands at 120,this does not mean that something that cost 100 in year 0 (i.e. 1996) now (i.e. in year t) costs 120 (the“something” is, in reality several baskets of goods from 1996 [not just one constant basket], and these basketshave been changed repeatedly, all of them being k x t baskets of k countries in t periods (1996 to the present,t).
In a chain index, a comparison between two periods 0 and t is produced not directly8 but indirectly, i. e. bychaining (multiplying) the links (the individual factors), e.g.:9
.
5. The disadvantages of chain indices
In my book on chain indices10, I endeavoured to critically review all arguments normally advanced in favour ofchain indices11 and investigated as many characteristics of chain indices as possible. It was primarily therealisation than not one of the arguments in favour of such indices is watertight that made me into more andmore of a non-chainer. I will not go into details of this here, though I will list the drawbacks of chain indicesthat gradually became clear to me:
1. The theory on which they are based is inconsistent.2. Chain indices violate almost all the axioms generally applied to indices, since3. They are “path-dependent”, which explains numbers 1 and 2; 4. They reflect no less than four types of influence (rather than just one, as is ideally the case with a pure price
comparison).5. They do not lend themselves readily to aggregation, and6. They cannot therefore be used for deflation. 7. Finally, continued calculation of these indices by official statistical bodies will probably prove considerably
more troublesome12.
−−
−=1t1t
1tt
11
12
00
01Lt0 qp
qp ...
qp
qp
qp
qpP
Lt0P
eureurostatostat
72 15th CEIES seminar: Inflation in Europe — Different measures and their users
7 Which is perfectly feasible if the base on which indices are calculated can be changed at will, as was done, for example, by the former GDR wherethere was virtually never any official inflation. If the price of a product increased, the increase was either explained away as a concomitant increase inquality, or the product was replaced by an item whose price had not increased. Keeping a basket of goods stable for a number of years does have anadvantage that should not be underestimated: it throws up a compelling conceptual barrier to manipulation of any sort. By doing away with this, weopen the door to manipulation.
8 We prefer the term “direct” index and thus speak of a “direct Laspeyres’ index”. The term “fixed-base index” is a misnomer here, quite apart from thefact that “fixed” has negative connations in the view of many people.
9 As can be seen, this type of index - in this case a Laspeyres’ chain index comprises not just one basket but several (t). We will not go into the reasonsadvanced by supporters of chain indices in favour of this approach. On closer inspection, none of the comparisons are either accurate or sound (afavourite move is to erroneously compare just one of the product’s links with the index. It is not the chain component [the link] that is the problem, itis the multiplication of components [i.e. the chain]).
10 P. von der Lippe, Chain Indices, A Study in Price Index Theory, Vol. 16 of the Publication Series “Spectrum of Federal Statistics”, (published by theStatistisches Bundesamt, Wiesbaden), Stuttgart 2001.
11 op cit., chapter 6 (pp 218).12 Particularly in view of the increasing frequency with which baskets of goods must be determined (as a result of, for example, household surveys). On
the other hand, chain indices may be more convenient to calculate than direct indices, as no attention need be paid to comparability between more thantwo adjacent periods at any one time. It is generally accepted that chain indices involve a lot more survey work. However, there are clearly no realcost/benefit analyses. This matter will not be discussed any further under point 7.
∑∑
∑∑
∑∑
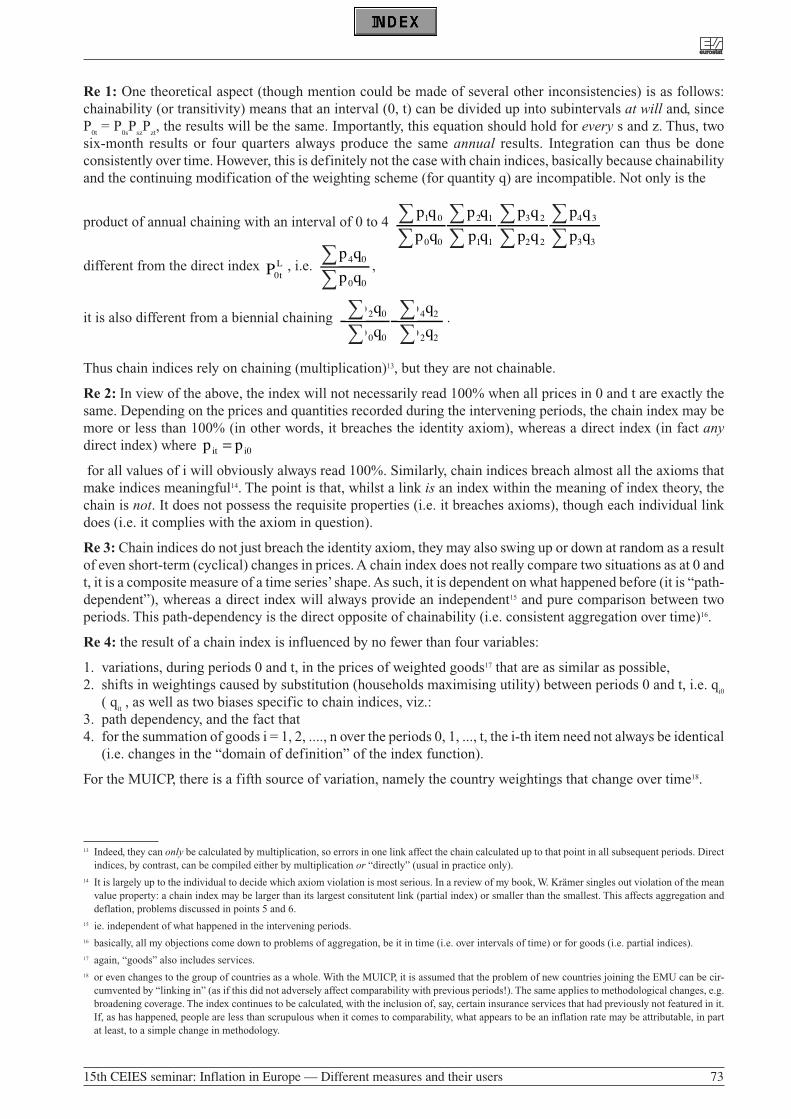
Re 1: One theoretical aspect (though mention could be made of several other inconsistencies) is as follows:chainability (or transitivity) means that an interval (0, t) can be divided up into subintervals at will and, sinceP
0t= P
0sP
szP
zt, the results will be the same. Importantly, this equation should hold for every s and z. Thus, two
six-month results or four quarters always produce the same annual results. Integration can thus be doneconsistently over time. However, this is definitely not the case with chain indices, basically because chainabilityand the continuing modification of the weighting scheme (for quantity q) are incompatible. Not only is the
product of annual chaining with an interval of 0 to 4
different from the direct index , i.e. ,
it is also different from a biennial chaining .
Thus chain indices rely on chaining (multiplication)13, but they are not chainable.
Re 2: In view of the above, the index will not necessarily read 100% when all prices in 0 and t are exactly thesame. Depending on the prices and quantities recorded during the intervening periods, the chain index may bemore or less than 100% (in other words, it breaches the identity axiom), whereas a direct index (in fact anydirect index) where
for all values of i will obviously always read 100%. Similarly, chain indices breach almost all the axioms thatmake indices meaningful14. The point is that, whilst a link is an index within the meaning of index theory, thechain is not. It does not possess the requisite properties (i.e. it breaches axioms), though each individual linkdoes (i.e. it complies with the axiom in question).
Re 3: Chain indices do not just breach the identity axiom, they may also swing up or down at random as a resultof even short-term (cyclical) changes in prices. A chain index does not really compare two situations as at 0 andt, it is a composite measure of a time series’ shape. As such, it is dependent on what happened before (it is “path-dependent”), whereas a direct index will always provide an independent15 and pure comparison between twoperiods. This path-dependency is the direct opposite of chainability (i.e. consistent aggregation over time)16.
Re 4: the result of a chain index is influenced by no fewer than four variables:
1. variations, during periods 0 and t, in the prices of weighted goods17 that are as similar as possible,2. shifts in weightings caused by substitution (households maximising utility) between periods 0 and t, i.e. q
i0
( qit
, as well as two biases specific to chain indices, viz.:3. path dependency, and the fact that4. for the summation of goods i = 1, 2, ...., n over the periods 0, 1, ..., t, the i-th item need not always be identical
(i.e. changes in the “domain of definition” of the index function).
For the MUICP, there is a fifth source of variation, namely the country weightings that change over time18.
0iit pp =
22
24
00
02
qp
qp
qp
qp
00
04
qp
qpLt0P
33
34
22
23
11
12
00
01
qp
qp
qp
qp
qp
qp
qp
qp
eureurostatostat
15th CEIES seminar: Inflation in Europe — Different measures and their users 73
13 Indeed, they can only be calculated by multiplication, so errors in one link affect the chain calculated up to that point in all subsequent periods. Directindices, by contrast, can be compiled either by multiplication or “directly” (usual in practice only).
14 It is largely up to the individual to decide which axiom violation is most serious. In a review of my book, W. Krämer singles out violation of the meanvalue property: a chain index may be larger than its largest consitutent link (partial index) or smaller than the smallest. This affects aggregation anddeflation, problems discussed in points 5 and 6.
15 ie. independent of what happened in the intervening periods.16 basically, all my objections come down to problems of aggregation, be it in time (i.e. over intervals of time) or for goods (i.e. partial indices).17 again, “goods” also includes services.18 or even changes to the group of countries as a whole. With the MUICP, it is assumed that the problem of new countries joining the EMU can be cir-
cumvented by “linking in” (as if this did not adversely affect comparability with previous periods!). The same applies to methodological changes, e.g.broadening coverage. The index continues to be calculated, with the inclusion of, say, certain insurance services that had previously not featured in it.If, as has happened, people are less than scrupulous when it comes to comparability, what appears to be an inflation rate may be attributable, in partat least, to a simple change in methodology.
∑ ∑ ∑ ∑∑ ∑ ∑ ∑
∑∑
∑∑
∑∑
“Pure price comparison” could be taken to mean that the first source of variation should be isolated. If weattempt to do just this with the direct Laspeyres’ index, we are not denying the enhanced dynamics of the worldof merchandise. We are not acting out of nostalgia, we are merely acknowledging that the fact that the pace ofchange has quickened does not mean that we should start comparing chalk with cheese, we are acknowledgingthat the purpose of a price index is still to measure changes in prices and not changes in, say, volume, which isthe job of a volume index.
It may be objected that fictitious price developments of this type are not of interest. This can be countered byarguing that, for analytical purposes, it is better to have separate and “pure” measures for different phenomena,and to correlate these, than to have a single measure that somehow includes everything.
In order to take account of substitution effects when measuring inflation, i.e. the second of the four sources ofvariation listed above, there may well be micro-economic reasons, which we will not go into here, which callfor a COLI approach (as in the USA). The only important thing to realise is that the standard objection to thefixed (and possibly outdated) basket of goods can also be countered with indices which are under discussion asCOLI approximations and which take account of the most recent basket of goods in each case (in much thesame way as the direct Fisher or Törnquist indices).
If it were merely a question of taking current volumes ( ) into account in addition to those of the base period( ), use could be made of such indices, obviating the need for a chain-index approach and eliminating thethird source of variation (path-dependency), which is not only unwanted but also very difficult to justify intheoretical terms.
However, the main difference between the direct Fisher index and the chain index, e.g. a Laspeyres -
( ) or Fisher chain index ( ) is not just the fact that can be interpreted as a COLI, whereas the chain
index manifestly cannot, but also the fact that the i-th values for in 0 and in t are for the same commodity19
(or at least should be), which in practice is not easy to achieve, whereas such considerations do not apply to
chain indices.
However, the price of the much-vaunted “flexibility” with a chain index is another source of variation (thefourth) of unknown magnitude. This means that the definition domain of the index function can be changed atvirtually every link. At , say, inflation may thus be greater or smaller (by an unspecified amount) than with thepure price comparison , because the conceals a selection of goods that has been changed repeatedly overtime20.
6. The analytical value of chain indices
If, as reports suggest, the ECB is under pressure to depart from its two-pillar approach with its focus on thevolume of money and concentrate on targeting inflation directly, it is obviously important to know whichinfluences in particular the index represents, to what extent they can be called “inflationary” and to what extentthey react to the central bank’s instruments. Seen in this light, a complex and flexible method of measuring atarget parameter is not necessarily advantageous.
Aggregates of partial indices are useful not just as targets, but also for analysing the causes of inflation. Thefact that chain indices cannot be consistently aggregated (using partial indices) and do not therefore show pricelinearity21 detracts from their analytical value. Poor aggregation properties (cf. point 5 above) mean that laymenand external analysts who do not perhaps have access to the detailed data held by Eurostat or the ECB cannotcalculate and compare ad hoc variants of the HCPI with or without certain components (e.g. administeredprices, highly volatile prices, etc.) - something that they were previously able to do with conventionalmechanisms for measuring inflation (i.e. direct indices).
Lt0P
Ft0P
Ft0PFC
t0PLCt0P
Ft0P
0iqitq
eureurostatostat
74 15th CEIES seminar: Inflation in Europe — Different measures and their users
19 This is true of all direct indices, but not of chain indices.20 Not that this was done with reluctance owing to practical difficulties with meeting the requirements of the Laspeyres formula. Indeed, it was done
quite consciously in the light of the obsession with ultra-recent weightings and with the virtually instantaneous inclusion of “newly significant goods”.21 This is a particular requirement as aggregation consistency.
Then there is the problem of the usefulness of chain indices as deflators (cf. point 6 above), i.e. the propertiesthe resultant “volumes” possess. The SNA identifies this as a shortcoming (though it plays it down), as thevolumes22 are not “additive”, i.e. do not satisfy the same definitions as the values23 from which they are derivedby deflation. There are other disadvantages too24.
The volumes generated by chain indices are not, for example, proportional in terms of volume, which is whythe identity axiom does not hold: even if all quantities in periods 0 and t are identical, the “volume” (i.e. theproxy for the sum of individual quantities which is not defined) may well be larger or smaller in t than in 0,which is again a corollary of path-dependency but obviously impairs interpretation of the “volumes”.
7. Country-based aggregation
In addition to chaining (for which there is no real justification25), the HICP also features country-basedaggregation (e.g. in the case of the MUICP26, this means using the EMU countries to produce a Europeaninflation rate)27. The simple idea of constructing the MUICP links as a weighted28 mean of national HICPs wasreached, with country weightings (c
m) for k member states (m = 1, ..., k) thus:
where Hmt
is the link (from t-1 to t) for country m (i.e. its HICP increase).
The problem with this index is as follows: if the annual national inflation rates are similar, the MUICP isbasically redundant, but if they are different - which is likely to be the case, since the constituent countries (k)will have very different standards of living, and some goods cannot be traded across borders (housing rents, forinstance) - what is the MUICP actually measuring? Nor is it clear exactly how the aggregation (or moreprcisely: the averaging) of price level based on countries with changing weightings should be interpreted interms of economic theory.
The MUICP is influenced by a number of factors that may be more or less interpreted as manifestations of“inflation”:
• aggregation of the country price levels,• aggregation over goods, the type and weighting (in the baskets) varying from country to country and from
period to period, and • aggregation over time, which because of path-dependency, always has a deleterious effect in a chain index,
and finally• the constantly changing calculation bases, e.g the inclusion of new goods or sales outlets.
We do not share the widespread obsession with ultra-topical index weightings. Instead, we think the mostimportant thing is to produce a pure price comparison and let the indices (e.g. expenditure ratio or meanincrease in prices) speak for themselves. After all, experience shows that the more opaque a measuringapproach is, the greater the tendency will be to manipulate findings to suit political ends and to attack themethod itself29. Nor should we forget that the ECB and the euro-curreny have yet to undergo the acid test.
eureurostatostat
15th CEIES seminar: Inflation in Europe — Different measures and their users 75
22 i.e. as aggregates “at constant prices”, in so far as this has any meaning in connection with chain index deflators.23 aggregates at constant prices.24 For details of these, cf. chapter 5 of my book “Chain Indices”.25 as can be seen from the concepts discussed above - pure price comparison and COLI (i.e. the idea of the need for income compensation so that the
household (what household?) can maintain the same level of utility). The formula contains not just one, but kt baskets of goods, nor is there a con-stant utility function for a “European” household living everywhere simultaneously.
26 Monetary Union Index of Consumer Prices (MUICP).27 Politicians are never happy to look at more than one figure at a time. The tendency is always therefore to take several figures and combine them into
one, even if they measure completely different things. 28 True to the obsession with weightings generally shown in the field of indexing, experts concentrated on topics such as how to produce country weight-
ings that were as up-to-date as possible, and how to prevent a high-inflation country disproportionately affecting the overall inflation rate.29 cf. the example of the Boskin commission.

THE EFFECT OF EURO ON PRICES
AALTO-SETÄLÄ VilleHead of ResearchNational Consumer Research CentreP.O. Box 5FIN-00531 [email protected]
This paper shows that nominal prices have strong impact on pricing of firms. Because euro will change nominalit will affect pricing at least in retailing sector. In fact, adjustment process of prices has already started. Thecrucial issue in the adjustment process is average price level. Does adjustment of single prices cause averageprice level to increase? This study shows that this is not necessarily the case.
1. Introduction
Psychology of consumers and nominal prices affect pricing a lot. The reason is that firms believe consumers’price knowledge to be inaccurate and biased. In other words, consumers do not know prices of even frequentlybought products (Conover, 1986; Dickson and Sawyer, 1990) and consumers often believe that prices with 9-digit endings are cheap (Stiving and Winer, 1997; Blattberg and Neslin, 1990; Blattberg and Wisniewskil,1987).
Both of these issues are very important in a process of changing national currencies to Euro. As a result of Euro,retail firms will change (I mean change – not convert with official rate) in practice prices of all products. Thedangerous fact is that consumers’ price knowledge will be even worse than normally due to new currency. Thiscombination may cause inflation peak at the beginning of 2002 in the countries where national currency willbe replaced by Euro.
This paper describes the importance of nominal prices in pricing decisions of firms. Further, the paperexamines possible effect of Euro on prices already in year 2001. The data used in the analysis is Finnish groceryretailing data.
2. The Data
The paper examines Finnish grocery retailing data from years 2000 and 2001. Both of the cross-sections havebeen collected at May. The cross-sections include the same 43 stores around Finland and 148 products in eachstore1. In other words, both of the cross-sections include 6364 price observations.
The observations in the data have been specified in two different ways. Part of the products are brandedproducts and very strictly defined (for example 1 liter of Coca Cola). Another part of the products are notstrictly specified, instead they are cheapest products of certain product category (for example the cheapestwheat flour 2 kg). This characteristics of the data is very important. The interpretation is that price data ofstrictly specified products can be seen as a random sample of prices. Instead, the cheapest price observationsare not random sample of prices. They present typical prices of low priced items.
eureurostatostat
15th CEIES seminar: Inflation in Europe — Different measures and their users 77
1 The total number of observations in both of the cross-sections is larger. This paper presents only price distributions of exactly same products and storesin both years. However, the price distributions based on the whole data are very similar the distributions presented in this paper.
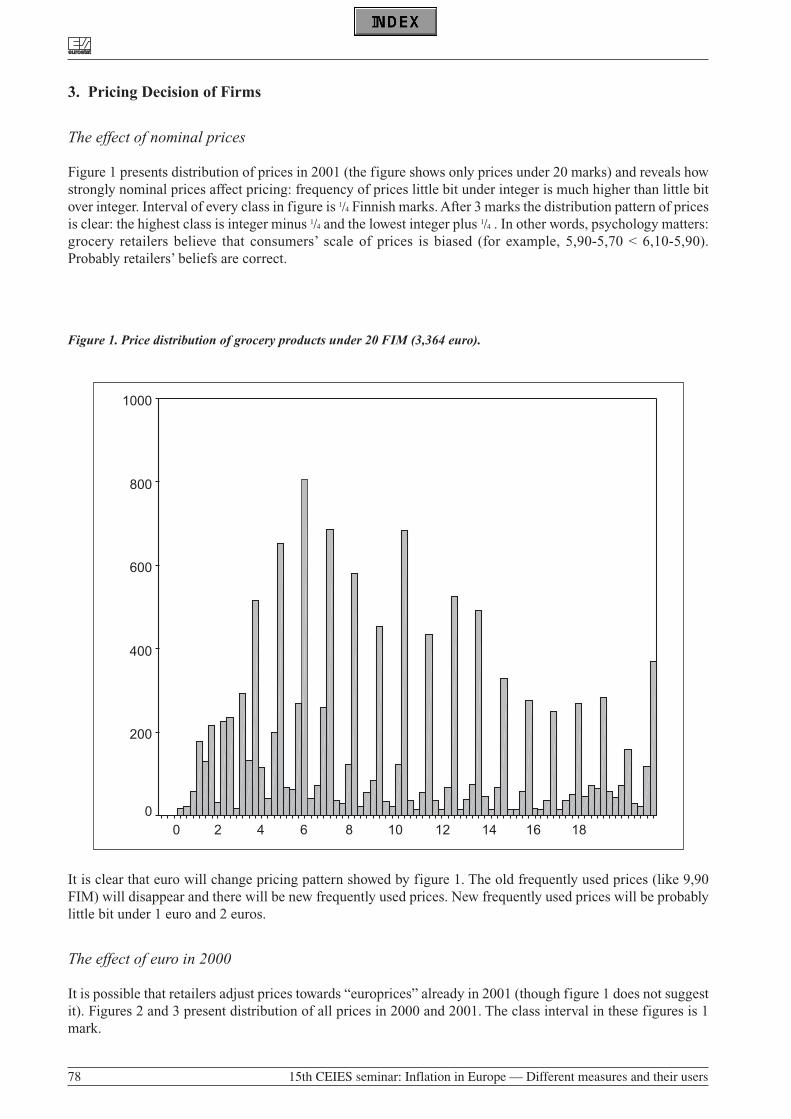
3. Pricing Decision of Firms
The effect of nominal prices
Figure 1 presents distribution of prices in 2001 (the figure shows only prices under 20 marks) and reveals howstrongly nominal prices affect pricing: frequency of prices little bit under integer is much higher than little bitover integer. Interval of every class in figure is 1/4 Finnish marks. After 3 marks the distribution pattern of pricesis clear: the highest class is integer minus 1/4 and the lowest integer plus 1/4 . In other words, psychology matters:grocery retailers believe that consumers’ scale of prices is biased (for example, 5,90-5,70 < 6,10-5,90).Probably retailers’ beliefs are correct.
Figure 1. Price distribution of grocery products under 20 FIM (3,364 euro).
It is clear that euro will change pricing pattern showed by figure 1. The old frequently used prices (like 9,90FIM) will disappear and there will be new frequently used prices. New frequently used prices will be probablylittle bit under 1 euro and 2 euros.
The effect of euro in 2000
It is possible that retailers adjust prices towards “europrices” already in 2001 (though figure 1 does not suggestit). Figures 2 and 3 present distribution of all prices in 2000 and 2001. The class interval in these figures is 1mark.
1000
800
600
400
200
00 2 4 6 8 10 12 14 16 18
eureurostatostat
78 15th CEIES seminar: Inflation in Europe — Different measures and their users
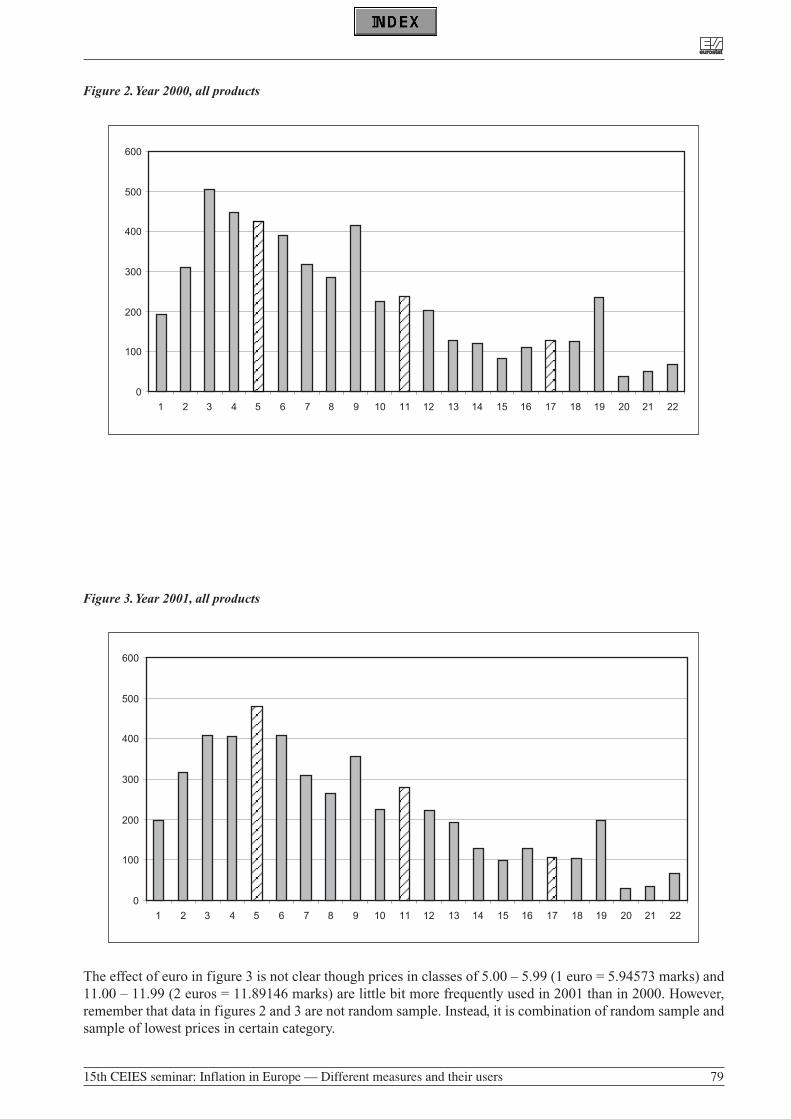
Figure 2.Year 2000, all products
Figure 3.Year 2001, all products
The effect of euro in figure 3 is not clear though prices in classes of 5.00 – 5.99 (1 euro = 5.94573 marks) and11.00 – 11.99 (2 euros = 11.89146 marks) are little bit more frequently used in 2001 than in 2000. However,remember that data in figures 2 and 3 are not random sample. Instead, it is combination of random sample andsample of lowest prices in certain category.
0
100
200
300
400
500
600
1 2 3 4 5 6 7 8 9 10 11 12 13 14 15 16 17 18 19 20 21 22
0
100
200
300
400
500
600
1 2 3 4 5 6 7 8 9 10 11 12 13 14 15 16 17 18 19 20 21 22
eureurostatostat
15th CEIES seminar: Inflation in Europe — Different measures and their users 79
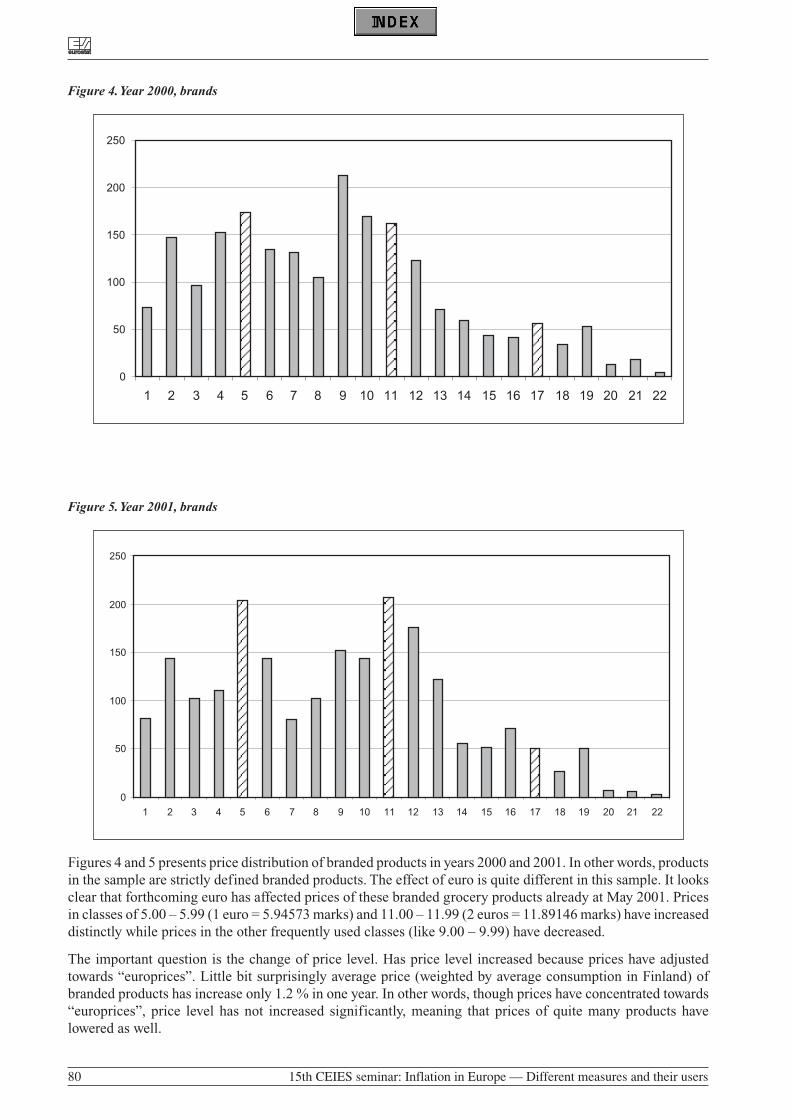
Figure 4.Year 2000, brands
Figure 5.Year 2001, brands
Figures 4 and 5 presents price distribution of branded products in years 2000 and 2001. In other words, productsin the sample are strictly defined branded products. The effect of euro is quite different in this sample. It looksclear that forthcoming euro has affected prices of these branded grocery products already at May 2001. Pricesin classes of 5.00 – 5.99 (1 euro = 5.94573 marks) and 11.00 – 11.99 (2 euros = 11.89146 marks) have increaseddistinctly while prices in the other frequently used classes (like 9.00 – 9.99) have decreased.
The important question is the change of price level. Has price level increased because prices have adjustedtowards “europrices”. Little bit surprisingly average price (weighted by average consumption in Finland) ofbranded products has increase only 1.2 % in one year. In other words, though prices have concentrated towards“europrices”, price level has not increased significantly, meaning that prices of quite many products havelowered as well.
0
50
100
150
200
250
1 2 3 4 5 6 7 8 9 10 11 12 13 14 15 16 17 18 19 20 21 22
0
50
100
150
200
250
1 2 3 4 5 6 7 8 9 10 11 12 13 14 15 16 17 18 19 20 21 22
eureurostatostat
80 15th CEIES seminar: Inflation in Europe — Different measures and their users
4. Concluding Remarks
This study has shown that nominal prices affect pricing a lot. Thus, the change of national currencies to eurowill result huge change in single prices. It is realistic to assume prices to fall (or at least inflation to bemoderate) due to euro in the long run. Instead, at the short run euro may result general price level to rise. Thereason is that price rigidity disappears at the beginning of 2002 and at the same time consumers’ priceknowledge will probably decrease.
This kind of large change in pricing requires naturally very careful price level measurement. The question iscan we take into account all the important aspects to carry out valid measurement and to provide enoughinformation to public about price changes.
References:
Blattberg, Robert C. and Scott A. Neslin (1990): Sales Promotion: Concepts, Methods and Strategies,Englewood Cliffs, NJ: Prentice-Hall.
Blattberg, Robert C. and Kenneth J Wisniewski (1987): “How Retail Price Promotions Work: EmpiricalResults”, Working Paper No. 42, Graduate School of Business, University of Chigago, 60637.
Conower, Jerry (1986): “The Accuracy of Price Knowledge: Issues in Research Methodology”, in Advances inConsumer Research, Vol. 13, Ed. Richard Lutz, Ann Arbor, MI: Association for Consumer Research, 589-593.
Dickson, Peter and Alan Sawyer (1990): “The Price Knowledge and Search of Supermarket Shoppers”, Journalof Marketing, 54 (July), 42-53, Conover, 1986.
Stiving, Mark and Russel S. Winer (1997): “An Empirical Analysis of Price Endings with Scanner Data”,Journal of Consumer Research, June, 57-67.
eureurostatostat
15th CEIES seminar: Inflation in Europe — Different measures and their users 81

COLLECTIVE BARGAINING AND CONTRACTING
MERMET EmmanuelEconomist ResearcherEuropean Trade Union Institute (ETUI)5 bd Albert II, BP 4B – 1210 [email protected]
This paper aims at giving an overview of the potential use that trade unions, and the social partners can makeof statistical information. As the focus of this conference is focusing on inflation and its different measures, wepropose that this presentation focuses on three main issues linked to the role of inflation measures in the wageformation process (1st part). The following section will review the new situation in which bargaining on wagesand working conditions is taking place from a European perspective, and how it fosters the need for goodstatistical evaluation of the economic situation (2nd part). Lastly, we will review the existing measures ofinflation which already exist and the needs for improvements, linked to the wage formation process (3rd part).
1. The role of inflation in wage setting
Inflation is defined as the yearly rise in consumer prices and therefore has a role in wage formation. A rise ininflation reduces the purchasing power of the wage earners. Therefore it is necessary to limit the inflation rateas well as to ensure that wages increase at the minimum as the inflation. The role of inflation in wage setting istherefore very important.
In practical terms, trade unions currently use inflation as a determinant of wage demands in all the 15 EUcountries.
It is determinant in 10 countries, alongside productivity or economic growth.
It is the major determinant in 5 countries (France, Greece, Luxembourg, Sweden and the UK).
Nevertheless, trade unions are generally relying on national inflation figures (published by National StatisticInstitutes), rather than on harmonised figures as published by Eurostat.
eureurostatostat
15th CEIES seminar: Inflation in Europe — Different measures and their users 83
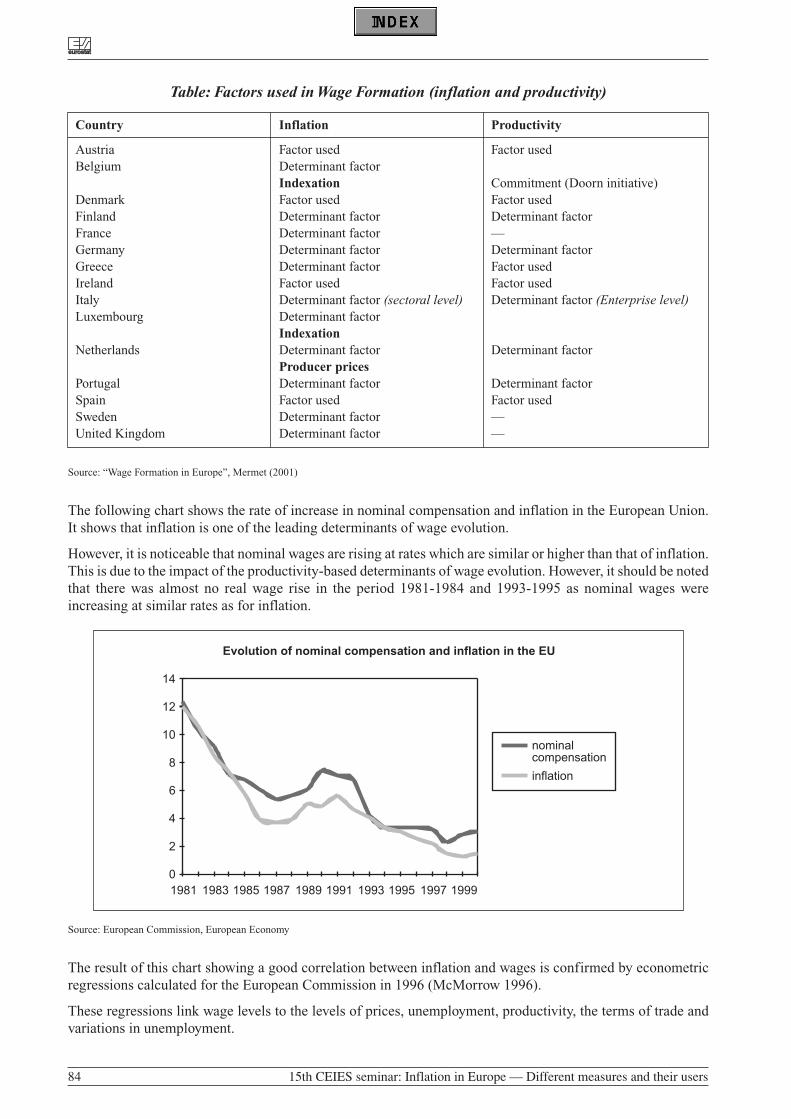
Table: Factors used in Wage Formation (inflation and productivity)
Country Inflation Productivity
Austria Factor used Factor usedBelgium Determinant factor
Indexation Commitment (Doorn initiative)Denmark Factor used Factor usedFinland Determinant factor Determinant factorFrance Determinant factor —Germany Determinant factor Determinant factorGreece Determinant factor Factor used Ireland Factor used Factor usedItaly Determinant factor (sectoral level) Determinant factor (Enterprise level)Luxembourg Determinant factor
IndexationNetherlands Determinant factor Determinant factor
Producer pricesPortugal Determinant factor Determinant factorSpain Factor used Factor usedSweden Determinant factor —United Kingdom Determinant factor —
Source: “Wage Formation in Europe”, Mermet (2001)
The following chart shows the rate of increase in nominal compensation and inflation in the European Union.It shows that inflation is one of the leading determinants of wage evolution.
However, it is noticeable that nominal wages are rising at rates which are similar or higher than that of inflation.This is due to the impact of the productivity-based determinants of wage evolution. However, it should be notedthat there was almost no real wage rise in the period 1981-1984 and 1993-1995 as nominal wages wereincreasing at similar rates as for inflation.
Source: European Commission, European Economy
The result of this chart showing a good correlation between inflation and wages is confirmed by econometricregressions calculated for the European Commission in 1996 (McMorrow 1996).
These regressions link wage levels to the levels of prices, unemployment, productivity, the terms of trade andvariations in unemployment.
Evolution of nominal compensation and inflation in the EU
0
2
4
6
8
10
12
14
1981 1983 1985 1987 1989 1991 1993 1995 1997 1999
nominalcompensation
inflation
eureurostatostat
84 15th CEIES seminar: Inflation in Europe — Different measures and their users
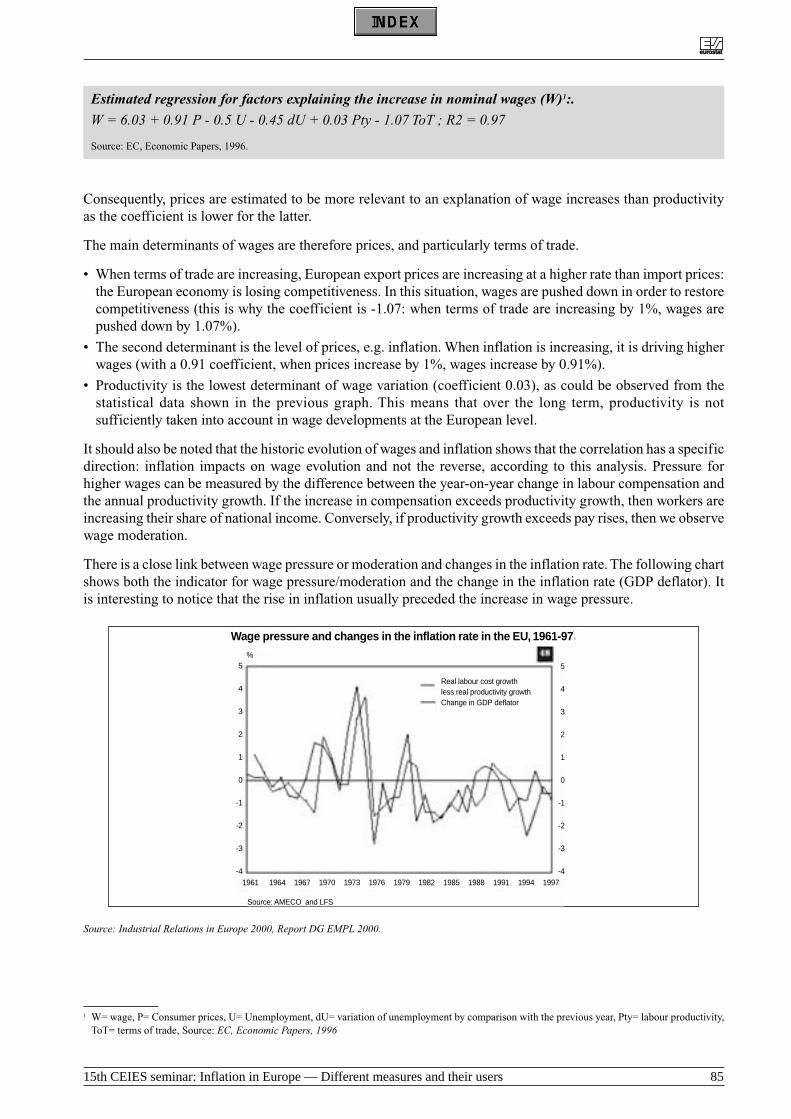
Estimated regression for factors explaining the increase in nominal wages (W)1:.
W = 6.03 + 0.91 P - 0.5 U - 0.45 dU + 0.03 Pty - 1.07 ToT ; R2 = 0.97
Source: EC, Economic Papers, 1996.
Consequently, prices are estimated to be more relevant to an explanation of wage increases than productivityas the coefficient is lower for the latter.
The main determinants of wages are therefore prices, and particularly terms of trade.
• When terms of trade are increasing, European export prices are increasing at a higher rate than import prices:the European economy is losing competitiveness. In this situation, wages are pushed down in order to restorecompetitiveness (this is why the coefficient is -1.07: when terms of trade are increasing by 1%, wages arepushed down by 1.07%).
• The second determinant is the level of prices, e.g. inflation. When inflation is increasing, it is driving higherwages (with a 0.91 coefficient, when prices increase by 1%, wages increase by 0.91%).
• Productivity is the lowest determinant of wage variation (coefficient 0.03), as could be observed from thestatistical data shown in the previous graph. This means that over the long term, productivity is notsufficiently taken into account in wage developments at the European level.
It should also be noted that the historic evolution of wages and inflation shows that the correlation has a specificdirection: inflation impacts on wage evolution and not the reverse, according to this analysis. Pressure forhigher wages can be measured by the difference between the year-on-year change in labour compensation andthe annual productivity growth. If the increase in compensation exceeds productivity growth, then workers areincreasing their share of national income. Conversely, if productivity growth exceeds pay rises, then we observewage moderation.
There is a close link between wage pressure or moderation and changes in the inflation rate. The following chartshows both the indicator for wage pressure/moderation and the change in the inflation rate (GDP deflator). Itis interesting to notice that the rise in inflation usually preceded the increase in wage pressure.
Source: Industrial Relations in Europe 2000, Report DG EMPL 2000.
eurostat
15th CEIES seminar: Inflation in Europe — Different measures and their users 85
1 W= wage, P= Consumer prices, U= Unemployment, dU= variation of unemployment by comparison with the previous year, Pty= labour productivity,ToT= terms of trade, Source: EC, Economic Papers, 1996
Wage pressure and changes in the inflation rate in the EU, 1961-97
Real labour cost growthless real productivity growthChange in GDP deflator
1961 1964 1967 1970 1973 1976 1979 1982 1985 1988 1991 1994 1997
5
4
3
2
1
0
-1
-2
-3
-4
%5
4
3
2
1
0
-1
-2
-3
-4
Source: AMECO and LFS
2. The euro-zone: wage policy as one pillar of the European policy-mix
On the political side, it should be stressed that now, the wage policy has entered in the field of the policy mix.The launching of the Macroeconomic Dialogue at the Cologne Summit in 1998 gave importance to this newpolitical environment. The Dialogue gathers together the representatives of the European Social Partners(UNICE for private employers, CEEP for public employers and the ETUC) together with the European CentralBank, the European Commission (DG Economic and Financial Affairs, and DG Employment and SocialAffairs), and the European Council (Committee for Economic Policy, as well as for Economic and FinancialAffairs and Employment and Social Affairs). In this Dialogue, forecasts of the economy are discussed and eachside is responsible for its own pillar. The ECB is responsible for the single monetary policy, the Commissionand the Council for the budgetary policy and the European Social Partners for the wage policy.
Therefore, the concept of “policy-mix”, which was understood as the linkage between monetary andbudgetary/fiscal policy now encompasses the wage policy as well. The dialogue can be the place for discussionand exchange of views on the forecasted wage evolution and its sustainability and coordination with the otherpillars of this enlarged policy-mix. At the Dialogue, debate can tackle the issue of the evolution of wages in theEuropean Union. However, from a European point of view, the ETUC is the main interlocutor of the ECB andthe Commission on the wage issue. As a consequence, the whole process of coordination has to be linked to ageneral reflection on the European policy-mix and the links between wages, budgetary and monetary policies.
At the same time, the advent of EMU gave more importance to the Broad Economic Policy Guidelines (BEPGs)which are issued annually. Particularly, it should be noticed that the BEPGs are an important vehicle of theCommission’s thought on wage evolution. For example, back in 1998, the BEPGs stated unequivocally that“wage increases in the whole Euro area that are incompatible with price stability will inevitably lead to atightening of monetary conditions in the euro zone, with adverse effects on growth and employment”(European Commission 1998).
Moreover, the ECB will consider excessive wage increases as a pressure on prices, leading to inflation. Theconcept of the European Central Bank on inflation risks is clear: “a situation marked by high rates of nationalinflation as a result of excessive wage increases, an unsustainable expansion of profit margins and/or anexpansionary stance in fiscal policy (…) would lead to a loss in competitiveness and, eventually, to a loss inoutput and employment growth” said Mr Duisenberg (ECB 2001). Thus, it can be argued that social partnerswill assume a new responsibility in relation to the way monetary policy reacts to their wage bargaining.Accordingly, should monetary policy become restrictive (e.g. higher interest rates), this development will beblamed upon the social partners, and hence upon the workers and their trade unions.
This also means that national bargaining for wages will have to be consistent with the inflation target chosenby the European Central Bank.
However, another focus of wage bargaining is also the sharing out of productivity gains between workers andemployers. Here, the 2001 BEPGs state that “from a macroeconomic perspective, it is necessary to set nominalwage increases consistent with price stability and job creation; this implies taking due account of the ECB’sprice stability objective whilst ensuring that real wage increases do not exceed productivity growth” (EuropeanCommission 2001). This new formulation gives more room for manoeuvre to bargainers, particularly in the useof productivity.
Under these circumstances, it is important for the trade unions, and the social partners in general to have goodand up-to-date information on both inflation and productivity, past and forecasted trends.
3. The trade unions’ needs on inflation rates and other determinants of wage setting
Inflation is taken into account in all the studied countries (14). However, it is of interest to wonder which rateof inflation shall be used by unions. For example, it may be assumed that a multitude of rates are published,from the national central banks, the ECB, Eurostat, the national statistical offices or the Commission’s services.
Before, it should be reminded that the use of specific rates of inflation is almost compulsory when dealing withEuropean comparison. European institutions, including Eurostat, the ECB and the Commission, are usingHarmonised Index of Consumer Prices. “HICPs are harmonised inflation figures required under Article 109j
eureurostatostat
86 15th CEIES seminar: Inflation in Europe — Different measures and their users
of the Treaty establishing the European Community. They are designed for international comparison ofconsumer price inflation”2. Nevertheless, several HICPs rates already exist, either at EU or national level.
INFLATION RATESmeasured as a Harmonised Index of Consumer Prices (HICPs)
National Rates European Rates
July 2001
From 1.4% to 5.2% Euro-Zone (EU-11): 2.6%Accross the Euro zone EU (EU-15): 2.8%
Alongside HICPs, other sources also publish other rates, which give different results from the “official”Eurostat figures. Although differences are rather small, this contributes to enhance the general confusion ofactors, particularly those which are not very well aware of the European context.
One example of different measures of inflation is given for one Member State:
Inflation figures for France
Eurostat INSEE Figures ECB
June 2001 HICP: +3.0% June 2001 HICP: +3.1%
July 2001 HICP: +2.2% July 2001 HICP: +2.2%
IPC: +2.1%IPC energy excl.: +2.3%IPC tobacco excl.: +2.0%
On the forecast side, the situation is also confusing. Whereas the Commission issues twice a year its“Macroeconomic Forecasts”, it is publishing HICP forecasts only recently. One year ago, forecasts weredealing with the macroeconomic aggregate “Private consumption deflator”. The ECB is publishing“projections” which indicate a range of possibilities for the following year rate of inflation. There are noforecasts available from the statistical office Eurostat.
Forecasts
European Commission Eurostat ECB
Macroeconomic Forecasts No forecasts Staff economic projections
May 2001 Dec 2000
2001: +2.1% 2001: 1.8% - 2.8%
2002: +1.8% 2002: 1.3% - 2.5%
Another important determinant of wage evaluation is the evolution of productivity. In this area, the situation atEuropean level is also difficult. Eurostat and the Commission are only publishing rates per head and not perhour.
eureurostatostat
15th CEIES seminar: Inflation in Europe — Different measures and their users 87
2 Eurostat, “Euro-Zone Annual Inflation stable at 0.8%”, News Release n° 26/99, 25/03/99.
LABOUR PRODUCTIVITY GAINS
Productivity per employee Productivity per hourMeasured as GDP/employee Measured as GDP/hour
Difficult to find at the European level
The main disadvantages of productivity per capita are:
• The number of employees influences productivity. An increase in employment figures can be achieved witha reduction in working time or by an increase in the number of part-timers. In this case, productivity percapita falls, however workers also work fewer hours.
• It is difficult to compare with wage rates which are generally calculated by the hour (hourly wage costs, etc.).
This is why productivity per hour is preferred, although there is as yet no existing data at the European level.
Particularly, it should be stressed that this evaluation of hourly productivity is important. The project of creatinga “Labour Price Index” which is a pure labour cost index per hour will lead to comparisons with the HICP.However, this would lead to biased view of the results of bargaining as wages are driven by both inflation andproductivity. If the LPI measures wage evolution per hour, a calculation of productivity per hour will also beneeded in order to compare the wage increase with both inflation plus productivity.
4. Conclusion: more efforts demanded on inflation forecasts and other indicators related towages
The role of inflation in the wage formation process is very important, as it constitutes one of the maindeterminants of wage evolution. However, other users also need up-to-date information on inflation (banks,retails, financial sector, government…). At the same time, the economic environment has recently changed.Nowadays, the economic actors, particularly firms, are responding more quickly to any change in the economicsphere, due to the development of the information society as well as of the integration of the different nationaleconomies. All these circumstances speak in favour of improved information on economic indicators. Althoughthe timeliness has improved, some harmonisation among institutions remains to be done. At the same time, theneed for forecast indicators has increased. However, the field of inflation is one of the most developed due tothe set-up of the Economic and Monetary Union. One message to this conference is therefore linked to otherindicators very important for the social partners which are linked to the wage formation process, i.e. wagemeasurement itself as well as labour productivity and other aspects linked to capital productivity ofprofitability.
eureurostatostat
88 15th CEIES seminar: Inflation in Europe — Different measures and their users
PRICE INDICES IN COLLECTIVE-AGREEMENT NEGOTIATIONS AND
SAFEGUARDING VALUE: THE EXAMPLE OF AUSTRIA
LAMEL JoachimVice-Chairman of the CEIESBundessektion IndustrieWirtschaftskammer OsterreichWiedner Hauptstrasse, 63Postfach 330A-1045 [email protected]
1. Collective-agreement negotiations
The regular adjustments to wages and salaries are among the most important routine decisions in economicpolicy. They have a decisive influence on macroeconomic complexes, since the wages and salaries of employedpersons are the most important source of finance for private consumption, which in turn is an important elementin macroeconomic demand. Wages and salaries as cost factors also have a direct influence on thecompetitiveness of an economy or its individual sectors and branches, and hence affect developments in theproduction structures. Finally, they form the basis for taxation or social contributions and their development isan important reference for many social benefits.
However, since wage adjustments can lead to conflicts between employees and employers, or between theorganisations that represent them, certain regulatory mechanisms for settling disputes have emerged in manycountries. The Austrian “social partnership” system has managed to settle employment issues - includingworking hours and conditions as well as wages and salaries - with a minimum of conflict. This paper brieflyoutlines the system and particularly the role of measuring inflation in connection with wage policy.
1.1. The institutional framework for Austria’s wage policy
Austria’s social partnership is based on the “Chambers” - organisations set up by law that represent the interestsof certain groups of employees. Except in very few special cases, anyone taking up a given occupation mustjoin one these organisations. The two biggest for self-employed persons are the Agricultural Chambers (for allself-employed persons in agriculture) and the Economic Chambers (for all self-employed persons in commerceand industry). There are also various Chambers for the professions, such as the Medical and Legal Chambers.All employed persons, except for civil servants, are members of the Chambers of Workers and Employees.Together with the Federation of Austrian Trade Unions [ÖGB], the leading organisations of the AgriculturalChambers, the Economic Chambers and the Chambers of Workers and Employees form the nucleus of thesocial partnership. Unlike the Chambers, which are set up by law, the ÖGB is an association.
Negotiations on wages and salaries and other terms of employment take place between the specialisedsubdivisions of the Trade Unions Federation (“specialised trade unions”) or of the Economic Chambers(“specialised associations”). By law, all the Chambers have the right to conduct such negotiations on behalf oftheir members and to ensure that they comply with the agreements reached. Normally, negotiations of this kindare conducted by selected representatives of the members (“officials”). The Chambers of Workers andEmployees have ceded their collective-agreement negotiating rights to the ÖGB. In principle, any group that issufficiently representative and so wishes may be eligible for a collective agreement. A public body examinesthe representativeness of the group and acknowledges or rejects its eligibility.
eureurostatostat
15th CEIES seminar: Inflation in Europe — Different measures and their users 89
Wage-policy initiatives generally come from a specialised trade union or the ÖGB. The specialist trade unioninforms the ÖGB of its wish for collective-agreement negotiations. The ÖGB then applies - in theSubcommittee on Wages [Lohnunterausschuss], which comprises representatives of employers and employees- for permission to take up negotiations. This Subcommittee on Wages is a subcommittee of the once powerfulJoint Committee on Prices and Wages [Paritätischen Kommission für Preis- und Lohnfragen], which used tobe the most important coordinating body for the social partnership. The Subcommittee usually authorisesnegotiations, which implies consent on the part of the employers too. The existence of the Subcommittee onWages enables the ÖGB to coordinate collective-agreement activities by branch and to influence the ideas ofthe individual specialised trade unions, partly with an eye to the “solidarity in wage policy” which is one of itsgoals. Despite this coordinating function, however, there are no official wage guidelines.
The ÖGB comprises a total of 13 specialised trade unions. The breakdown by branch is more detailed amongemployers than in the ÖGB. For example, the industry section of the Economic Chamber alone comprises 22specialised associations, and all the branches taken together comprise some 130 specialised organisations.However, negotiations with the trade unions are to some extent conducted jointly, while the individualspecialised associations nevertheless retain their autonomy. The important “collective-agreement associationfor the metal industry”, for example, comprises seven specialised industrial associations.
1.2. Austria’s wage negotiation system in an international perspective
In the literature of political science and economics, wage negotiation systems are usually classified in terms oftheir degree of centralisation and coordination, and often examined in terms their impact on inflation andemployment and unemployment. Price trends and trends in employment and unemployment are not, however,directly discussed in wage negotiations; they are external factors. Whether two of the classical objectives ofeconomic policy, i.e. price stability and full employment, are taken into account at all depends on the extent towhich wage policy is based on, and coordinated in terms of, macroeconomic considerations. A wage policybased on macroeconomic considerations that takes account of these external factors, and must thereby beintersectoral, nevertheless needs to be implemented by the actual bodies that take the decisions on wage policy- in other words, at the level of negotiation.
In a classification of wage-negotiation systems, Kittel/Draxler (2001, 22) have made a distinction, for theformulation of a macroeconomic wage policy, between coordination by an umbrella organisation, authoritativecoordination, sectoral wage leadership and non-coordination. Wage policy can be most effectivelyimplemented and hence managed if the enforceability of, or compliance with, collective agreements isstandardised by law. Otherwise its manageability is low. These considerations led to the development of fivecategories of wage-negotiation systems:
• coordination by an umbrella organisation on the basis of low manageability• coordination by an umbrella organisation on the basis of high manageability• sectoral wage leadership• authoritative coordination• non-coordination
In their study of wage-negotiation systems in 20 OECD countries since 1970, Kittel/Draxler classify the systemapplied in Austria since 1983 as “sectoral wage leadership”. Before then it had been “coordination by anumbrella organisation on the basis of high manageability”.
This classification clearly rests on the leadership of the metal industry, and hence of a branch of the exposedsector. Because of the degree of exposure of this industry in the world economy, there is particularly greatincentive to gear wage policy to macroeconomic elements and hence to internalise external factors, and indeedAustria’s “metal-wages round”, in which negotiations begin in the second half of September and the collectiveagreement usually takes effect as from 1 November, has considerable influence on all other wage negotiations.The same is true of the salaries for industrial white-collar workers, which are negotiated at the same time in the“global round”. However, the results of this are not reported and discussed so prominently in public as theagreements concluded for the metal-workers. In 2000, the collective agreement sector comprising the iron andmetals industry covered 142 000 blue-collar and 83 000 white-collar workers, or a total of 225 000 employees.Thus, if the additional 42 000 employees covered by the “global round” are also included, wage and salary
eureurostatostat
90 15th CEIES seminar: Inflation in Europe — Different measures and their users
negotiations are conducted for around 267 000 employees, or 65% of the total 411 000 persons employed inindustry.
It is worthy of note in the international context that the agreements reached in these negotiations concern notonly minimum wages and salaries under the collective agreements but also the adjustment of the amountsactually paid. There are also frequent changes to the framework rights, which are usually cost-effective for thebusinesses.
1.3. The theoretical basis of wage policy
Austria’s wage policy is fundamentally geared to productivity with solidarity, and this approach is based on theidea that all its citizens should be equally involved in increasing productivity, while the relative wage shareshould remain constant. In practice, this should mean that actual wages keep pace with increasing productivityin the economy as a whole. If overall inflation, measured by means of the GDP deflator, is also taken intoaccount, there is a nominal increase in wages under collective agreements.
A result of this gearing to increasing macroeconomic productivity is that prices tend to rise in branches that failto achieve the average increase in productivity and to fall in branches where the increase is above average, asthis gives them more room to manoeuvre. Nor does this type of policy result overall in wage-pressure on pricesand hence a “wage-price spiral” can be avoided.
The new international economic environment (internal market, greater capital mobility etc.) has increased thecompetitive pressure on large areas of the Austrian economy enormously, as can be seen particularly in thedivergence of the exposed and protected sectors. The criticism has also been made that gearing wage policy toproductivity takes no account of yield. This problem becomes particularly acute when exposed branches arefaced with falling prices on the world market and increased costs for intermediate consumption from theprotected sector. Employers are therefore calling for a wage policy that is more geared to yield, along the linesof the cost-neutral policy originally developed by the German Expert Group [Deutscher Sachverständigenrat]in 1982.
As far as wage and profit shares are concerned, this cost-neutral approach to wage policy is more flexible thana policy geared to productivity. It can therefore help to maintain a profit share that is regarded as vital for fullemployment, economic growth or competitiveness and thus takes account of the call for a policy more gearedto yield. Cost-neutral scope for wage increases also takes account of changes in non-wage labour cost, payrollstructures and changes in working hours. Particular account is taken of the inflation rate: if the change in theprice level is measured using the real GDP price index, the figure must be adjusted to eliminate the elementsresulting from the introduction of, or an increase in, indirect taxes. Price increases of this kind show aredistribution in favour of the State, compensation for which is not compatible with a cost-neutral approach.Moreover, it would impede any attempts to exert influence (e.g. environmental taxes), if compensation weremade for the corresponding price increases.
If the change in the macroeconomic price level is measured using the consumer price index rather than the realGDP price index, changes in terms of trade also need to be taken into account. “Terms of trade” is defined asthe ratio between the price index for export goods and the price index for import goods. If the terms of tradedeteriorate - in other words, if there is a redistribution in favour of other countries - it is also not possible for aresultant price increase to be compensated for in a cost-neutral fashion. To put it another way, a flow ofpurchasing power to other countries cannot be compensated for once more in the country of origin. An exampleof a possible source of deterioration in the terms of trade is the trend in energy prices, and particularly oil prices.
1.4. The role of inflation rates
The purpose of this contribution is not to discuss wage policy but to show the significance and role of thevarious ways of measuring inflation in connection with wage negotiations. Focusing on the Austrian system hasmade it necessary to give a brief description of the institutional background to this system and the theoreticalbasis of wage policy. It has also become clear that the measurement of inflation is basic to any approach to wagepolicy, be it geared to productivity or to the price level in the economy as a whole. We now need to concentratemore on the practical aspects of wage negotiations, taking the example of the metals industry, since this, asmentioned previously, acts as a leader.
eureurostatostat
15th CEIES seminar: Inflation in Europe — Different measures and their users 91
The “Benya formula” continues to be a useful reference for the scope for wage increases - not only for the ÖGB,but also for many economic journalists and interested members of the public. Anton Benya was President ofthe ÖGB from 1963 to 1987 (having previously been Vice-President and President of the Metal, Mining andEnergy Workers’ Trade Union) . From 1971 to 1986 he was also President of the Austrian National Council(Parliament). According to this formula the scope for wage increases is derived from “productivity plusinflation”, or more precisely from the change in macroeconomic productivity and the change in the consumerprice index (CPI). The consumer price index is therefore an important reference not only for theoretical reasonsbut primarily because of its use in wage negotiations in practice. It is determined by Statistics Austria. Eversince price indices have been calculated in the second republic, the two side of industry have always beeninvolved. In the Central CPI Committee [Zentrales Redaktionskomitee für den VPI], which meets each month,any points of contention are discussed and solutions are established jointly with the statistical authorities. Therecan therefore be no disputes between the two sides of industry over the methods used for calculating theconsumer price index and the results.
The equally important price forecasts are based on those of the Austrian Economic Research Institute[Österreichisches Institut für Wirtschaftsforschung], which operates fully independently under the aegis of thetwo sides of industry (its President is the President of the Economic Chamber and its Vice-Presidents are thePresident of the Federal Employment Chamber and a Professor of the national economy at the University ofVienna). One of its most important tasks is to draw up the short-term economic forecast, which is revised eachquarter. This contains not only the forecasts for the consumer price index, but also data on the trend inproductivity for the economy as a whole. The forecast for trends in consumer prices is generally more accuratethan the productivity forecast, which is not surprising as the consumer price index is determined each month,so recent values are always available for the forecast. The annual rates of change are also taken into account sothat the influence of a known price change on the index can be calculated relatively easily. No such recent dataare, however, available for the trend in productivity and, in addition to GDP, forecasts must also be made of thenumber of economically active persons in order to forecast productivity, since the forecast value required is thequotient of these two values.
It is often unclear, however, which forecast value is used in the negotiations - particularly in the case of theconsumer price index. At the time the negotiations are conducted - i.e. in the autumn of a given year - the pricetrend for that year is still the subject of the forecast, although by September or October the CPI for the year isrelatively easier to estimate. Since the result of the wage negotiations primarily concerns wages and salaries forthe coming year, they should be geared to the CPI forecast for the coming year. However, since the outcome ofthe negotiation is ultimately the result of a bargaining processes and can no longer be split into components, itis not possible to ascertain the inflation rate it was based on.
1.5. Current developments, HCPI
It should be clear from the above that wage negotiations are geared to the consumer price index. Employers inparticular have not questioned this basic approach, but a number of considerations have repeatedly beendiscussed.
1.5.1. GDP deflator
As already argued, it would make more sense to use the GDP deflator than the consumer price index in theapproach to wage policy, as the extent of imported inflation or the influence of terms of trade would no longerbe relevant. The main practical problems arise from the lack of data and the difficulty of making forecasts.
1.5.2. The concept of core inflation
This is a question of isolating from the change in price level the elements that are attributable to outside events.Recently the ECB has identified the trends in prices for energy and unprocessed foodstuffs as “shocks” thathave resulted in a considerable increase in the price level in the economy as a whole. The extent of temporaryshocks of this kind is identified in order to be able to assess the need for monetary measures. These shocksshould not, however, boost inflation through effects on wages. The idea of taking account of the remaining coreinflation only goes beyond disregarding imported inflation.
eureurostatostat
92 15th CEIES seminar: Inflation in Europe — Different measures and their users
1.5.3. Increased taxes and levies
It has already been argued that increased indirect taxes, levies and charges that affect the price level should notbe compensated for in wage increases and should therefore be eliminated from price level calculations. Thequestion of the extent to which the higher prices resulting from environmental measures should be treated asan improvement of quality (either in the products or in the environment itself) so that they do not have the effectof pushing up the price level has also been discussed.
1.5.4. HCPI and CPI
In Austria the result obtained by measuring the change in the price level using the harmonised consumer priceindex (HCPI) tends to be lower than the figure obtained using the CPI. This is because of the different conceptson which the two indices are based. In terms of the orders of magnitude alone, therefore, employers are likelyto prefer the harmonised index. Unfortunately for arguments in this direction, however, the Economic Chamberfrequently does not, in its deliberations, recommend that its members use the harmonised consumer price indexfor national purposes nor do the members regard it as appropriate. This will be discussed in Section 2(safeguarding value).
The trade unions regard these considerations as somewhat academic and concentrate on the CPI in the wagenegotiations. Their main argument is that apart from enabling workers to share in the benefits of increasedproductivity, one of the purposes of wage negotiations is to offset loss of purchasing power resulting from priceincreases, which, whatever their source, place a burden on the total budget of a worker’s household and shouldtherefore, in the view of trade unions, be compensated for.
2. Safeguarding value with price indices
This Section also describes the specific situation of Austria. It is very important to stress this since, forhistorical reasons, different countries attach very different importance to stability. In both Austria and Germany,the gulf that emerged between the nominal value of money and the quantity of goods available in the 20thcentury led to very painful experiences. The whole of society had a negative, not to say traumatic, experiencewith the inflationary crises in the period between the first and second world wars, with the result that very highpriority was given to stability in the political discussions following the second world war.
2.1. Safeguarding the value of money
Our money nowadays – usually paper money – is evidence of our claim for a share in the goods and servicesavailable in a national economy; no satisfaction is to be had from the material value of the money. One ofmoney’s many functions is that of storage. Any claim to goods or services – irrespective of how it was acquired- can be kept for later in the form of money, and this is where the problem of safeguarding value arises. Theclaim embodied in units of money remains constant only in nominal terms. The amount of goods or servicesthat can be bought with a unit of money may increase or decrease over time. If it increases there is no directproblem for the individual. The situation becomes problematic, however, if, at a later date, a unit of money canonly buy fewer goods and services than when it was acquired. In this case we speak of depreciation or inflation.For the sake of accuracy, however, these terms should be clearly distinguished. “Depreciation” is shown bymeasuring the amount of goods that can be bought with a nominally unchanged amount of money at two pointsin time. Inflation is the change in the price of a given basket of goods between two points in time.
Price changes are an element in the competitive model for the market economy. A change in the price of a goodreflects a change in scarcity relationships. Relative prices in an economy are therefore continually subject tochange, but the macroeconomic price level should not be affected by these changes. This is what is meant bythe economic-policy objective of price stability.
The price level in a national economy and the way it changes can be measured, totally or in part, at variouspoints in the economic process. This usually requires the development of indices, and consumer price indicesare a prominent example of such statistical constructs.
eureurostatostat
15th CEIES seminar: Inflation in Europe — Different measures and their users 93
2.2. The effects of inflation
Without going into the reasons for inflation, we can at least make a distinction in our minds between its effectson distribution and on allocation, although these interact in practice. The main effects on distribution concernearned income. These have already been dealt with separately. Persons receiving nominally fixed incomes arealso affected. These include all groups who receive transfers from the State - pensions, for example - as well aspeople receiving life annuities or yield on monetary assets. There is no simple answer to the question of whetherthe State is among the winners or the losers if there is inflation, but it is certain that, with a progressive taxationsystem, inflation causes State revenue to outpace the actual capacity of the taxpayers.
The effects on allocation primarily concern investment. “Taking refuge in property” clearly means amisallocation of resources that would not have happened in a stable situation. The effects on employment areexplained in the literature not least by the “Philips curve”, which primarily analyses a relationship between theunemployment rate and the rate of change in wages. If it is assumed that inflation is also reflected in rate ofchange in wages, this yields a connection between inflation and employment trends. It was once thought thatthis connection was almost a law of nature, from which one could also deduce how more inflation could be usedto reduce unemployment, but we have learnt from painful experience that this is not the case and that, in thelong term, inflation is a threat to employment.
Not least, this very brief description of the negative effects of inflation on distribution and allocation shouldmake it clear once more why the Treaty on European Union describes maintaining price stability as “primaryobjective of the ESCB”. It is also an indication of why measuring inflation at European level is so important.
2.3. Safeguarding the value of claims
2.3.1. Capital markets
This is mainly a matter of protecting savers or investors from losses in real value. It can be assumed that the agreedinterest on monetary assets includes a component designed to offset inflation as well as a real-yield component. Aquestion that is repeatedly asked is whether or not index-linking would be better in this case, the argument being that,since investors cautiously tend to think in terms of higher rates of inflation, the interest rate tends to be higher in theabsence of index-linking. This can apply, if at all, only in the case of longer-term investments. With short-terminvestments it is always possible, by means of a reassessment, to make the corresponding market interest rateprofitable. Because of the lower nominal interest rates, longer-term investments over a period of high inflation will besubject to exchange losses - which will cause investors to hold on to the securities. Index-linking of loans would inprinciple mean establishing a real interest rate, and it is not immediately obvious how this should be done. There aremany practical reasons, therefore, for regarding index-linking of loans as unworkable. We might mention as a curiositythat in Austria in the 1950s there were energy loans that were linked, for servicing purposes, to the average electricityrates. Experts refer reservedly to the “bonification” of Austrian loans at the beginning of the 1970s as a “marginalphenomenon” of index-linking. In today’s international financial markets, all such ideas are a thing of the past.
2.3.2. Debtors/creditors
The capital market is only one prominent example of debtor/creditor relationships. These also exist in manyother areas such as renting, leasing, annuities etc. The corresponding contracts often contain an agreement onthe stability of the value of the claim and link this to changes in an indicator to be specified by the parties tothe contract - preferably an officially calculated index. This is very useful in social terms if the political systemauthorises such safeguarding of value, since expected inflation plays a smaller role, although agreements onsafeguarding the value of goods or services can admittedly themselves encourage inflation (because of the waysuch goods and services - for example, rents - influence the index). The advantages - not the least of which isconsolidation - outweigh the disadvantages, however.
2.4. Instruments for safeguarding value
The best way of safeguarding value depends on the type of monetary transaction involved. At themicroeconomic level, individuals are often interested in data that are of everyday significance. In business, itmight be a question of how the value of fixed-term contracts should be calculated over time. Households needdocuments in order to meet contractually-agreed financial commitments - for example, in the form of leases or
eureurostatostat
94 15th CEIES seminar: Inflation in Europe — Different measures and their users
annuity policies, or maintenance payments. After a period in which value was safeguarded on the basis of theprices for foodstuffs and goods (e.g. the price of bread or wood, wages for bricklayers), it is the consumer priceindex or specific indices for certain areas which tend to be used nowadays.
The building price index or building cost index, producer prices for agricultural and forestry products andspecial breakdown of the wholesale price index can be used for this purpose. Occasionally the collective wageindex or partial series from it are used as the yardstick for safeguarding value. In this case, however, the partiesto a contract must realise that wage indices tend to rise more steeply than the inflation rate, and that this resultsin a kind of “overindexing” compared with the consumer price index. The difference could be interpreted as anelement in the higher standard of living.
In industry and commerce, producer price indices are often required for safeguarding value. Since Austria isstill lagging behind in the calculation of these indices, the German series are generally used. We also repeatedlyencounter “combined solutions” - in other words, safeguarding value by means of a price index for the materialscomponent and a wage index for the labour component (in a fixed ratio) for contracts and supplies.
However, the universal yardstick for safeguarding value is the consumer price index. In their deliberations onstable-value clauses, the Economic Chambers generally recommend the consumer price index rather than theharmonised consumer price index for use in Austria, for reasons relating to the conceptual and methodologicaldifferences between the two. Austria’s CPI is based on the concept of “national residents on national territory”,i.e. weighting and price observation for Austria are based on the consumption patterns of the residentpopulation. The HCPI, on the other hand, is based on the concept of “national territory” and therefore comprisesprivate consumption within the national borders, thus including expenditure by foreign tourists in Austria. InAustria’s CPI, each individual price is, in principle, compared with the corresponding basic price, and therelative change is calculated. The arithmetical mean of these relative changes gives the regional relative for theproduct in question (relatives method). In the HCPI, on the other hand, the geometric mean is used instead ofthe arithmetical mean. Moreover, Austria’s CPI is calculated using the usual international procedure involvinga Laspeyre index, which means that the percentage change in the price level for the basket of goods of anaverage household is determined, the composition of the basket remaining constant throughout the indexperiod. Since the beginning of 2000, Austria’s HCPI has, on the other hand, been calculated as a chain index.
The main reasons for the predominant use of the CPI, however, are sure to be habit and the fact that the HCPIis still relatively little-known. On top of this, the majority of value-safeguarding agreements that are still inforce use the CPI, and people consequently still have most experience with that index.
3. Further reading
Beirat für Wirtschafts- und Sozialfragen (1973), ed., Wirtschaftspolitische Handlungsspiel-räume, Vienna.
Breuss, Fritz (1983), Terms of Trade und Reallohnspielraum, in: Monthly Reports of the ÖsterreichischesInstitut für Wirtschaftsforschung, Vol. 56, No 2, pp. 107-125.
European Commission (1997), Die Wettbewerbsfähigkeit der europäischen Industrie, Luxembourg.
Guger, Alois, Lohnpolitik und Sozialpartnerschaft, in Talos (1993), pp. 227-241.
Huemer, Gerhard et al. (1999), ed, The Role of Employer Associations and Labour Unions in the EMU,Alderstat.
Karlhofer, Ferdinand and Talos, Emmerich (1999), ed., Zukunft der Sozialpartnerschaft, Vienna.
Knittel, Bernhard and Traxler, Franz (2001), Lohnverhandlungssysteme und Geldpolitik, in: Wirtschaft undGesellschaft Vol. 27, No 1, pp. 11-40.
Lamel, Joachim (1990), Wertsicherung aus der Sicht der Gesellschafts- und Wirtschaftspolitik, in: ÖSTAT,Wertsicherung mit Preisindizes, pp. 19-30.
Roser, Peter, Lohnbewegung und Bewegung der Lohnpolitik, in : Karlhofer/Talos (1999), pp. 75-94.
Sachverständigenrat zur Begutachtung der gesamtwirtschaftlichen Entwicklung, annual report 1982/83, annualreport 2000/01.
Talos, Emmerich (1993), ed., Sozialpartnerschaft, Vienna.
BSI, Dkfm.La/Pk, 24.07.2001
eureurostatostat
15th CEIES seminar: Inflation in Europe — Different measures and their users 95
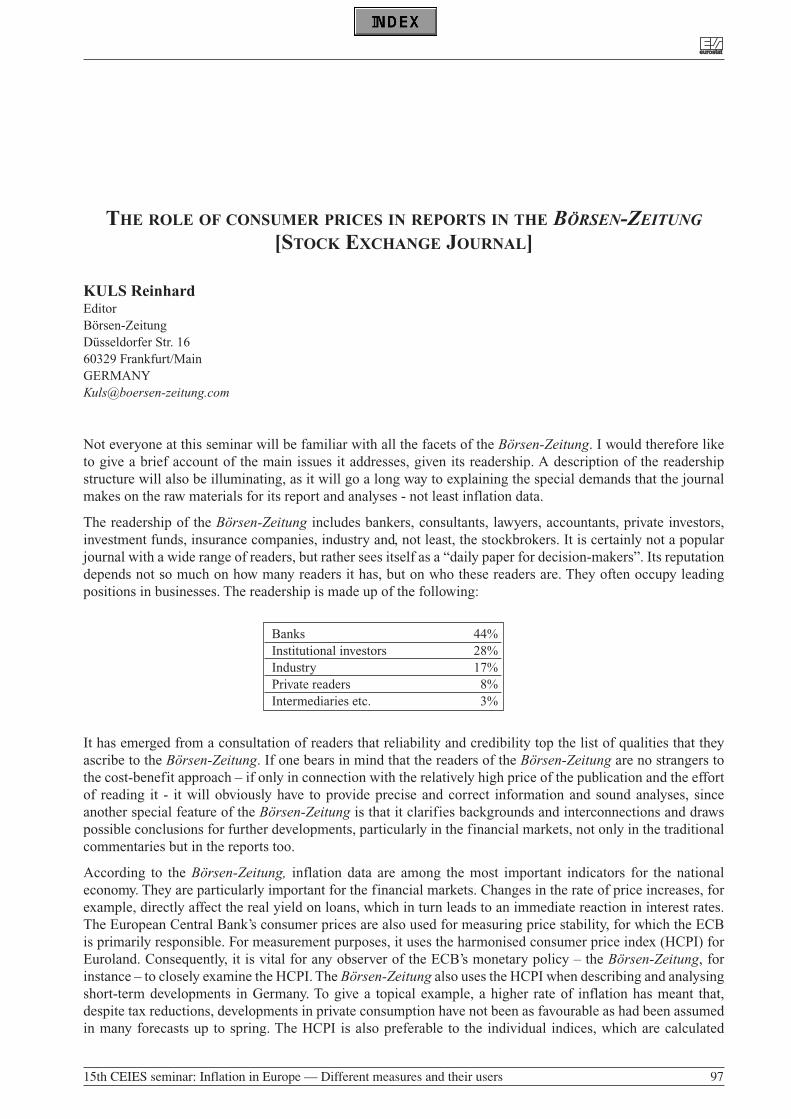
THE ROLE OF CONSUMER PRICES IN REPORTS IN THE BÖRSEN-ZEITUNG
[STOCK EXCHANGE JOURNAL]
KULS ReinhardEditorBörsen-ZeitungDüsseldorfer Str. 1660329 Frankfurt/[email protected]
Not everyone at this seminar will be familiar with all the facets of the Börsen-Zeitung. I would therefore liketo give a brief account of the main issues it addresses, given its readership. A description of the readershipstructure will also be illuminating, as it will go a long way to explaining the special demands that the journalmakes on the raw materials for its report and analyses - not least inflation data.
The readership of the Börsen-Zeitung includes bankers, consultants, lawyers, accountants, private investors,investment funds, insurance companies, industry and, not least, the stockbrokers. It is certainly not a popularjournal with a wide range of readers, but rather sees itself as a “daily paper for decision-makers”. Its reputationdepends not so much on how many readers it has, but on who these readers are. They often occupy leadingpositions in businesses. The readership is made up of the following:
Banks 44%Institutional investors 28%Industry 17%Private readers 8%Intermediaries etc. 3%
It has emerged from a consultation of readers that reliability and credibility top the list of qualities that theyascribe to the Börsen-Zeitung. If one bears in mind that the readers of the Börsen-Zeitung are no strangers tothe cost-benefit approach – if only in connection with the relatively high price of the publication and the effortof reading it - it will obviously have to provide precise and correct information and sound analyses, sinceanother special feature of the Börsen-Zeitung is that it clarifies backgrounds and interconnections and drawspossible conclusions for further developments, particularly in the financial markets, not only in the traditionalcommentaries but in the reports too.
According to the Börsen-Zeitung, inflation data are among the most important indicators for the nationaleconomy. They are particularly important for the financial markets. Changes in the rate of price increases, forexample, directly affect the real yield on loans, which in turn leads to an immediate reaction in interest rates.The European Central Bank’s consumer prices are also used for measuring price stability, for which the ECBis primarily responsible. For measurement purposes, it uses the harmonised consumer price index (HCPI) forEuroland. Consequently, it is vital for any observer of the ECB’s monetary policy – the Börsen-Zeitung, forinstance – to closely examine the HCPI. The Börsen-Zeitung also uses the HCPI when describing and analysingshort-term developments in Germany. To give a topical example, a higher rate of inflation has meant that,despite tax reductions, developments in private consumption have not been as favourable as had been assumedin many forecasts up to spring. The HCPI is also preferable to the individual indices, which are calculated
eureurostatostat
15th CEIES seminar: Inflation in Europe — Different measures and their users 97
differently in different countries, since it is the only index that makes price developments in the individualcountries of the euro area mutually comparable. This, as well as the trend in the price-increase rate in Euroland,is of interest to the financial markets, since “the difference between the highest and the lowest inflation rate inthe individual countries ... is a source of information on possible differences in developments in the individualregions of the currency area. The smaller the differences, the greater the ECB’s room for manoeuvre in theimplementation of its monetary policy.”1
The HCPI crops up directly or indirectly in many places in the Börsen-Zeitung. I cannot go into them all indetail here, but let me, by way of example, describe the reporting for one month of the inflation figurespublished by the various statistical offices. The Börsen-Zeitung has for a long time concentrated on aggregatedindices in its presentation of economic indicators for Euroland. Only if no standardised data were available didit use national figures (obtained by means of a variety of national methods). In the case of consumer prices, thismeans mixing up data and methods, and this is something that we at the Börsen-Zeitung are not happy about,but are unable to avoid because it is our job to be up-to-the-minute.
The monthly price series start shortly after the 20th of a given month, usually with the first price data from thebig cities in Italy, which can also be published over several days and – depending on the space available andhow “dramatic” the developments are – can also be mentioned in the Börsen-Zeitung on each occasion. At thesame time, or only slightly later, come the first price data from the six big German Länder: the cost-of-livingfigures for private households, calculated according to the national method. These can also be published all atonce or spread over several days. The most interesting figure is usually the first, from which the financialmarket can usually tell the way inflation is going compared with the previous month. It can also give an idea ofthe likely order of magnitude of the change in the price-increase rate. The Börsen-Zeitung tends to be somewhatreticent about publishing data published by the statistical offices of the other Länder, as these data are onlyreally useful for checking the initial estimate of price developments. If they are in line with the trend, there islittle point in publishing them. A vital figure, on the other hand, is the provisional inflation rate for Germany asa whole, which the Federal Statistical Office calculates at frequent intervals on the basis of the data from thesix Länder. These used to be merely the “provisional cost-of-living figures” (according to national method),which the Börsen-Zeitung published in the absence of harmonised figures for the EU but, since the middle of2000, the Federal Statistical Office has also provided the provisional HCPI, which now takes pride of place inthe Börsen-Zeitung’s reports on price developments at consumer level. We see this as a major step forward,since Germany represents a good third of the HCPI for Euroland and we know from experience from that theprovisional HCPI tends to be very close to the definitive figure, which means that an initial estimate, based onactual figures, can already be made of the Euroland HCPI.
In the following days and weeks, further HCPI become available from various Euro countries. These too arebriefly reported by the Börsen-Zeitung - although not regularly and here too – as with the data on the rate forGermany as a whole from the German Länder – the first estimate for the euroland HCPI is checked and, ifnecessary, adjusted. The same applies in the case of the definitive inflation figures from Germany, which arrivearound two weeks after the provisional figure. Here, as a rule, we do not merely examine how the EurolandHCPI is likely to develop in the light of the definitive figures for Germany, but we also get an indication of thegroups of products that particularly tend to drive - or stabilise - prices, although only according to the nationalmethod and in relation to the cost of living. The HCPI is published in the Federal Statistical Office’s usual pressrelease only in the form of the general HCPI without partial indices. Finally, the Euroland HCPI is not publisheduntil almost four weeks after the first national price data. Only a few days after the Euroland HCPI, the firstnational inflation figures for the following month become available. These then become the centre of attentionon the markets.
This sequence also explains why the Euroland data usually offer no surprises as far as the general HCPI isconcerned when they are published by Eurostat. Of greater interest are the partial indices, since these can showthe subsectors in which inflationary pressures are increasing or easing off. However, they reveal less about whatis ultimately driving price increases: shortage of supply, an increase or abrupt change in demand, or
eureurostatostat
98 15th CEIES seminar: Inflation in Europe — Different measures and their users
1 Conrad Mattern, „Praktiker-Handbuch Investment Research“. Stuttgart 2000, p. 331
administrative action. Estimating the quality of the price increase is, however, decisive for any analysisregarding monetary policy. Revealing the reasons for the phenomena is therefore one of the things we mightwish the HCPI to do for us - but this is to disregard the question of whether this would not be ultimately placingtoo heavy a burden on statistics. It should perhaps be mentioned in this connection that the monthly reports ofthe European Central Bank, which could possibly perform this analytical function, have not hitherto done so ina satisfactory fashion. In any event, they are published even later than the Euroland HCPI.
Another thing one might wish European statistics to do is perhaps similarly ambitious as far as the likelihoodof it happening is concerned - i.e. replace the disparate national indices by a harmonised coverage of pricedevelopments in the individual euro countries down to regional level, if the regions publish their data beforethe national central offices. It should be stressed that this is not a plea for holding back the regional data (e.g.the data from the Länder). Indeed, as soon as information is available on price increases it should be published,since the sooner the financial markets can adjust to changes in their basic data, the more effectively they cando their job. There are many reasons for this second wish:
a) There could presumably be savings for the public if there was no longer a need for so many parallel surveysand calculations.
a) Estimates of trends in inflation for the financial markets would become more reliable. Admittedly, thenational index and the HCPI in Germany, for example, tend to vary by no more than 0.1 percentage points,if at all, but even a change of one-tenth of a point in the inflation rate can be significant - and not only whenit affects whether the price-increase rate is above, at or below the ECB’s much-quoted - and psychologicallysensitive - 2% stability threshold. The direction in which inflation is moving is also of relevance.
a) Mixing data obtained using harmonised survey methods with those obtained using national methods notonly makes the information less precise, it is also a constant source of confusion and error – not least in themedia. Unfortunately - let us make no bones about it - the Börsen-Zeitung, despite all its efforts, alsosometimes makes mistakes, which particularly distresses us, given the high standards we strive for, andultimately damages our reputation. At any rate, it does not help our readers. Mixing the data like this meansthat differences need to be explained in the reports, and this calls for a lot of patience on the part of the readerand sometimes results in such indigestible monstrosities as the following sentence: “While the inflationrates of the six big Länder collected using the national methodology had still led us to expect a change of xpercentage points in the provisional price-increase rate for Germany as a whole, the harmonised consumerprice index calculated according to the EU standard has now shown a change of y points...”
To sum up: the Börsen-Zeitung, which keeps a very close eye on the inflation figures, sees no reason whynational price data should continue to be collected and published alongside the HCPI, except for the specialcase of scientific research, which does not move in the same public realm as financial journals and other media.It would be more useful for ourselves and our readers if only the HCPI were used.
eureurostatostat
15th CEIES seminar: Inflation in Europe — Different measures and their users 99
SUMMING UP
SIUNE KarenAnalyseinstitut for ForskningFinlandsgade 4DK-8200 ÅRHUS [email protected]
The CEIES Subcommittee on the Harmonised Index of Consumer Prices (HICP) organised a seminar for usersof price statistics in the European Union with a focus on the HICP at the premises of the German Chamber ofIndustry and Commerce in Berlin on 4 and 5 October 2001. The seminar aimed at supporting the publicunderstanding of the HICP and its relation to other measures of inflation, in particular national Consumer PriceIndices (CPI). This is, at least presentationally and for the sake of public credibility of the results, particularlyimportant shortly before the euro banknotes and coins are introduced and in a period where the denominationof consumer prices changes from national currencies to the euro.
The 70 to 80 participants in the seminar came from European Union Member States and Candidate Countriesand represented a variety of users as well as producers of price statistics. The seminar was organised in fivesessions followed by a panel discussion on the needs for the future between users and producers of the HICPand national CPIs.
In the first session (“state of the art”) Eurostat presented the HICP and comparisons between the HICP and theCPIs in general. The comparison was further elaborated by contributions from the Dutch, Hungarian andGerman National Statistical Institutes. The second session (“economic and monetary policy, official users”)covered presentations from the European Central Bank and the National Bank of Belgium. In the third session(“market and bank analysts / research institutes”) and the fourth session (“collective bargaining andcontracting: broad public”) representatives of Italian, British and German economic research institutescommented on the HICP, followed by representatives from the Finnish consumer research center, the Europeantrade union institute and the Austrian Wirtschaftskammer. The fifth session was dedicated to communicationto a wider audience, in particular via the press. The seminar concluded with a session on future needs.
Main messages arising from the seminar
• The discussions showed a general acceptance and support for the HICP, which plays an essential role in themonetary policy of the European Central Bank.
• Different measures of inflation may be needed for different uses. There is however a strong need forharmonisation of these measures where possible.
• The HICP should be better explained to the interested public. Unjustified differences between the HICP andnational CPIs should be eliminated, in particular in euro area countries. Remaining differences are to beexplained by national authorities.
• The medium term objective of a European System of Consumer Price Indices (ESCPI), with the HICP as itsbackbone, gained broad support.
• There was strong encouragement for further work to settle the issue of owner occupied housing.Clarifications of concepts and practical issues are imminent.
• Quality adjustment was recognised as highly important and further work in this field is necessary and alreadyscheduled.
eureurostatostat
15th CEIES seminar: Inflation in Europe — Different measures and their users 101
• The forthcoming cash changeover in the euro area countries and the much easier comparison of prices andwages in the euro area will strengthen the HICP as a harmonised measure of consumer price inflation. Thisrequires an intensified co-operation between users and producers of price statistics.
Further statistical issues addressed in the sessions by individual speakers
• Price index rounding may be a problem when inflation is low. In this case the inflation rate calculated onrounded indices may be affected by the rounding approximation. A proposal to improve this situation couldbe to introduce a publication policy with a precision of two decimal places.
• Some of the statistical and technical properties of the chain index formula used in the compilation of theHICP were critically examined.
• The good timeliness of the HICP is considered important and efforts are made to further improve it.• Different price collection periods in the EU countries is a known problem, as it implies that some price
changes may be recorded in the index with a lag for a country depending on the collection time within themonth.
• The need for additional information on regulated prices and tax changes was expressed.• The importance of core inflation measures for analysts was underlined. Users may want to develop the
necessary indices where possible, but may need support from producers when the construction of coreinflation measures becomes technically demanding. The desire for a common strategy was expressed.
• Interest was expressed in the availability of short-term and medium-term HICP forecasts based on sound andtransparent methods.
eureurostatostat
102 15th CEIES seminar: Inflation in Europe — Different measures and their users

ATTENDANCE LIST
Eurostat MEGANCK BartASTIN John OLSSON CarstenNÄSLUND-FOGELBERG AnnikaLAUWERIJS NicoleEVANS Deborah
CEIES LAMEL Joachim, Wirtschaftskammer ÖsterreichHEILEMANN Ullrich, Rheinisch – Westfälisches Institut fürWirtschaftsforschungSIUNE Karen, Analyseinstitut for ForskningEPLER Margit, Chamber of LabourGEARY Patrick, NUI MaynoothPÜCKLER Botho, Bundesvereinigung der Deutschen ArbeitgeberverbandeVOLKERS Anne, VNO-NCW
European Central Bank BIER WernerBRANCHI MariagneseKENNY GeoffRODRIGUEZ Diego
European Investment bank FISCHBACH Mireille
Austria SCHUBERT Aurel, Oesterreichische NationalbankWAGNER Karin, Austrian Central BankHASCHKA Paul, ÖSTAT 5.4 (VPI)
Belgium DRUANT Martine, National Bank of BelgiumGLAVIE Christian, National Bank of BelgiumHOOYBERGHS Koen, National Institute of StatisticsMERMET Emmanuel, European Trade Union InstitutePONTEUR Leo, Ministère des affaires économiquesVANHAELEN Jean-Jacques, National Bank of Belgium
Bulgaria POPOVA Veneta, National Statistical Institute
Czech Republic KROVÁK Jirí, Czech Statistical Office
Denmark THAGE Bent, Statistics DenmarkZEUTHEN Hans
Estonia NIKIFOROVA Olga, Statistical Office of Estonia
Finland AALTO-SETÄLÄ Ville, National Consumer Research CentreHUKKINEN Juhana, Bank of Finland
eureurostatostat
15th CEIES seminar: Inflation in Europe — Different measures and their users 103
KOSKIMAKI Timo, Statistics FinlandSUONIEMI Ilpo, Labour Institute for Economic ResearchVARTIA Yrjö, University of Helsinki
Germany ANTONOVICS Nick, ReutersBUCHWALD Wolfgang, Statistisches BundesamtELBEL Gunter, Statistisches BundesamtHOFFMANN Johannes, Deutsche BundesbankKULS Reinhard, Börsen-ZeitungLEIFER Hans-Albert, Deutsche BundesbankUHLIG Anke, Verband Deutscher Maschinen – und AnlagenbauVON DER LIPPE Peter, Universitaet Essen
Greece KARABALIS Nikos, Bank of GreeceKONDELIS Euripides, Bank of GreeceSTYLIARAS Evangelos, National Statistical Institute
Hungary SZABO Eva Maria, Hungarian Central Statistical Office
Ireland MURPHY Donal, Former Director General of CSO IrelandQUINN Terry, Central Bank of Ireland
Italy BIGGERI Luigi, ISTATD’ELIA Enrico, ISAEPOLIDORO Federico, ISTATSABBATINI Roberto, Bank of Italy
Lithuania ALEJEVA Nadiezda, Statistics LithuaniaMARKELEVICIUS Jonas, Statistics Lithuania
Luxembourg WEIDES Robert, STATEC
The Netherlands HOVEN Leendert, CBSWALSCHOTS Jan, Statistics Netherlands
Poland GLUCHOWSKA Alina, CSO Poland
Slovak Republic GAVURA Miroslav, National Bank of Slovakia
Slovenia VASLE Bostjan, Institute of Macroeconomic Analysis and Development
Spain GOMEZ DE MORAL Mariano, INE SpainRUIZ-CASTILLO Javier, Universidad Carlos III
Turkey BAKIR Akif, State Institute of Statistics of Turkey
United Kingdom BARRIE Robert, CSFBBRUETON Anna, Office for National statisticsFENWICK David, Office for National Statistics
eureurostatostat
104 15th CEIES seminar: Inflation in Europe — Different measures and their users