Embed Size (px)
Citation preview
1
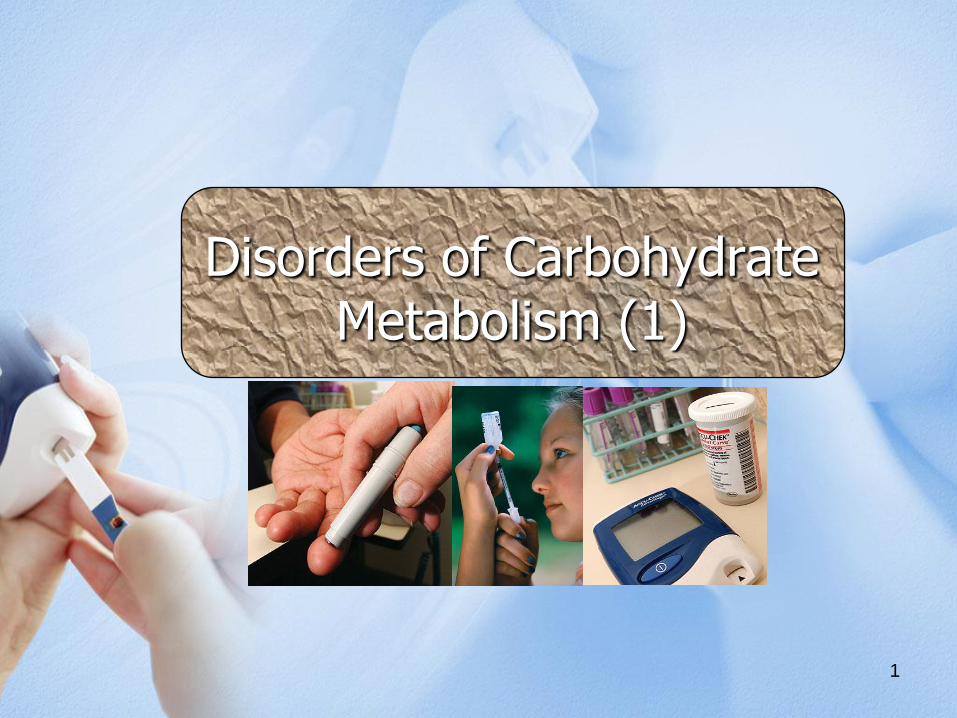
Disorders of Carbohydrate Metabolism (1)
2
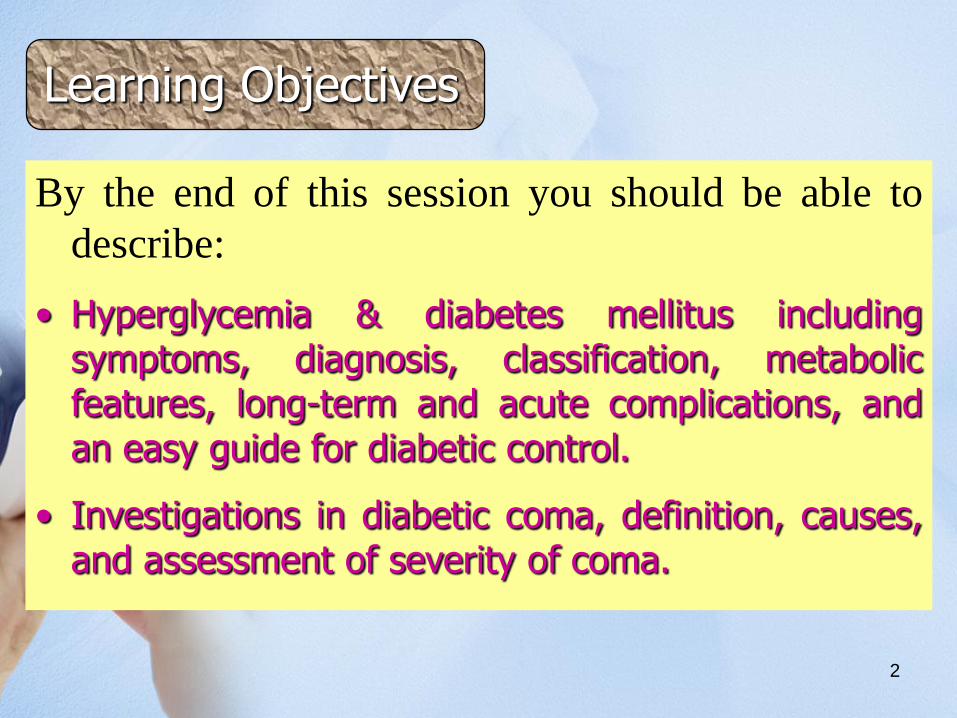
Learning Objectives
By the end of this session you should be able to
describe:
• Hyperglycemia & diabetes mellitus includingsymptoms, diagnosis, classification, metabolicfeatures, long-term and acute complications, andan easy guide for diabetic control.
• Investigations in diabetic coma, definition, causes,and assessment of severity of coma.
3
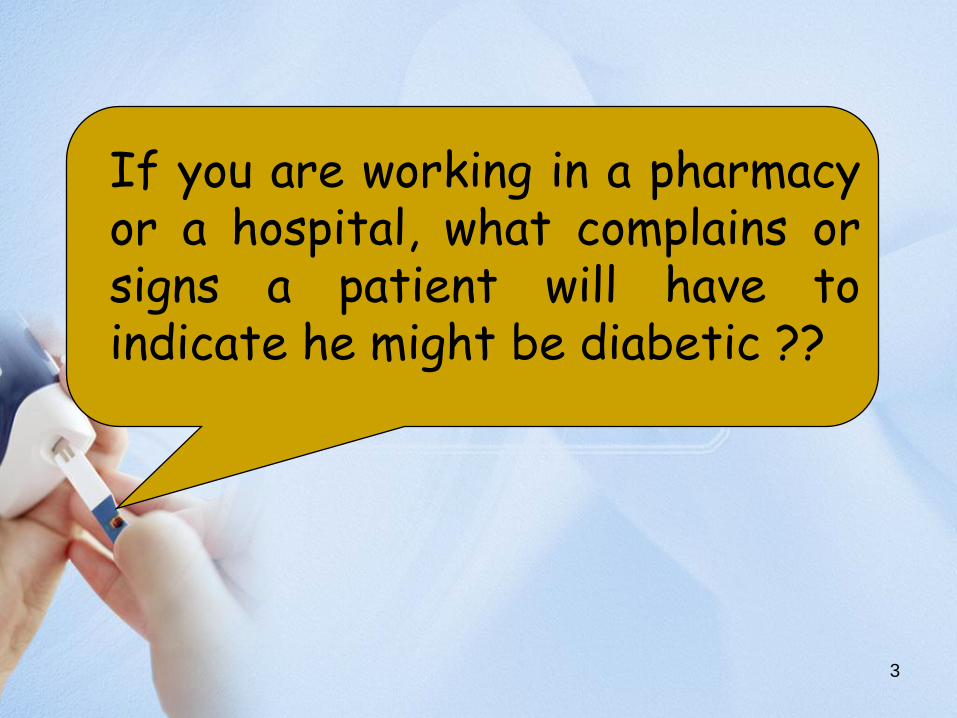
If you are working in a pharmacyor a hospital, what complains orsigns a patient will have toindicate he might be diabetic ??
16 March 2011 Dr. Mohamed Z Gad 4
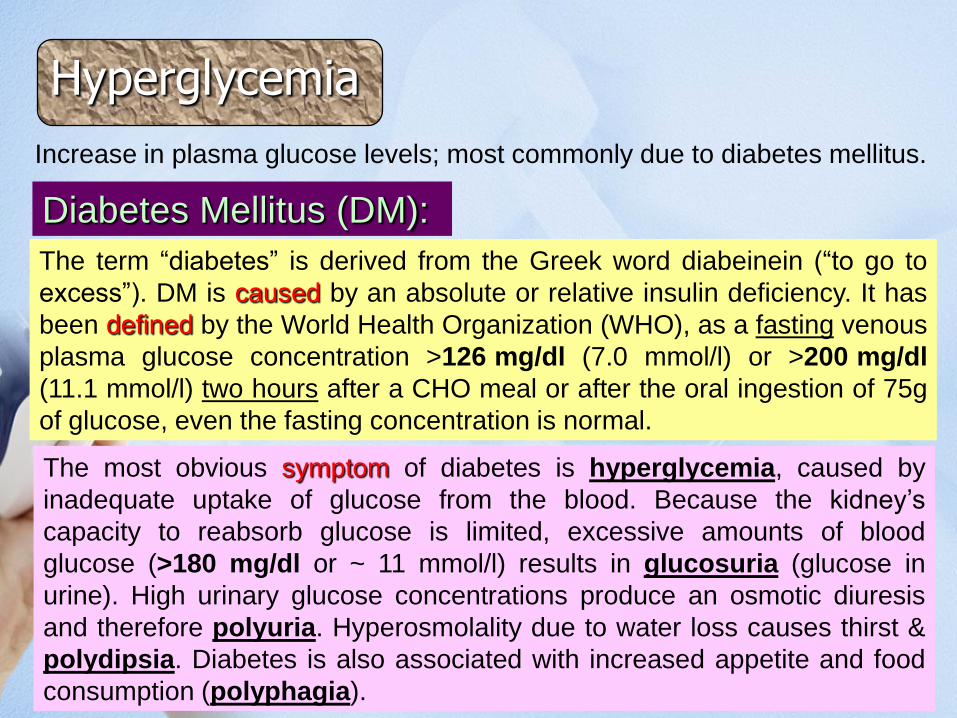
Hyperglycemia
Increase in plasma glucose levels; most commonly due to diabetes mellitus.
Diabetes Mellitus (DM):
The term “diabetes” is derived from the Greek word diabeinein (“to go to
excess”). DM is caused by an absolute or relative insulin deficiency. It has
been defined by the World Health Organization (WHO), as a fasting venous
plasma glucose concentration >126 mg/dl (7.0 mmol/l) or >200 mg/dl
(11.1 mmol/l) two hours after a CHO meal or after the oral ingestion of 75g
of glucose, even the fasting concentration is normal.
The most obvious symptom of diabetes is hyperglycemia, caused by
inadequate uptake of glucose from the blood. Because the kidney’s
capacity to reabsorb glucose is limited, excessive amounts of blood
glucose (>180 mg/dl or ~ 11 mmol/l) results in glucosuria (glucose in
urine). High urinary glucose concentrations produce an osmotic diuresis
and therefore polyuria. Hyperosmolality due to water loss causes thirst &
polydipsia. Diabetes is also associated with increased appetite and food
consumption (polyphagia).
16 March 2011 Dr. Mohamed Z Gad 5
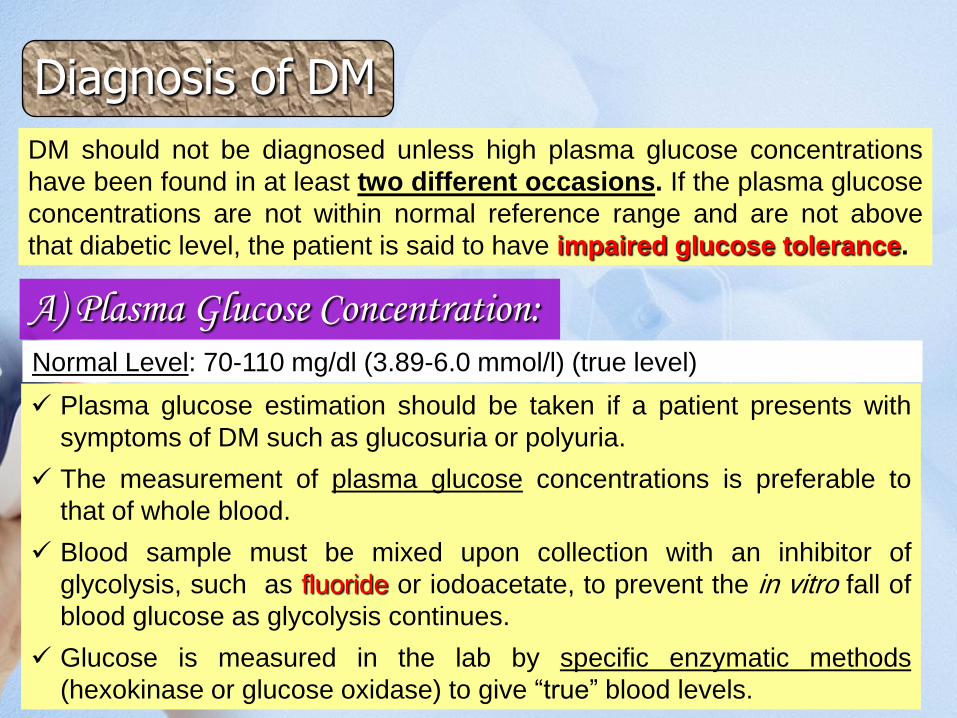
Diagnosis of DM
DM should not be diagnosed unless high plasma glucose concentrations
have been found in at least two different occasions. If the plasma glucose
concentrations are not within normal reference range and are not above
that diabetic level, the patient is said to have impaired glucose tolerance.
A) Plasma Glucose Concentration:
Normal Level: 70-110 mg/dl (3.89-6.0 mmol/l) (true level)
Plasma glucose estimation should be taken if a patient presents with
symptoms of DM such as glucosuria or polyuria.
The measurement of plasma glucose concentrations is preferable to
that of whole blood.
Blood sample must be mixed upon collection with an inhibitor of
glycolysis, such as fluoride or iodoacetate, to prevent the in vitro fall of
blood glucose as glycolysis continues.
Glucose is measured in the lab by specific enzymatic methods
(hexokinase or glucose oxidase) to give “true” blood levels.
16 March 2011 Dr. Mohamed Z Gad 6
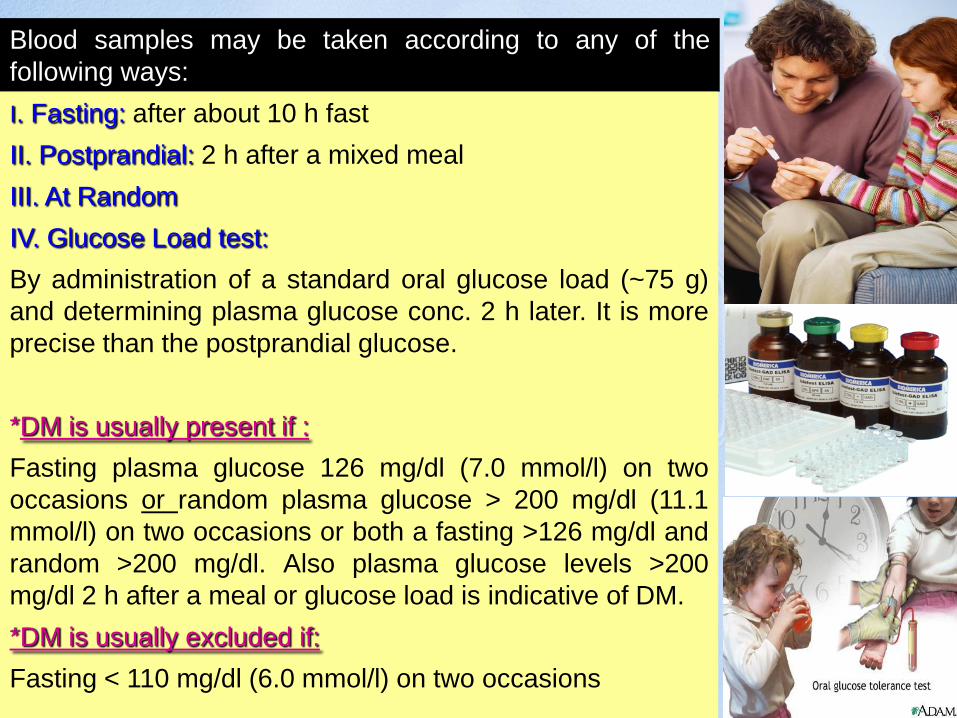
Blood samples may be taken according to any of the
following ways:
I. Fasting: after about 10 h fast
II. Postprandial: 2 h after a mixed meal
III. At Random
IV. Glucose Load test:
By administration of a standard oral glucose load (~75 g)
and determining plasma glucose conc. 2 h later. It is more
precise than the postprandial glucose.
*DM is usually present if :
Fasting plasma glucose 126 mg/dl (7.0 mmol/l) on two
occasions or random plasma glucose > 200 mg/dl (11.1
mmol/l) on two occasions or both a fasting >126 mg/dl and
random >200 mg/dl. Also plasma glucose levels >200
mg/dl 2 h after a meal or glucose load is indicative of DM.
*DM is usually excluded if:
Fasting < 110 mg/dl (6.0 mmol/l) on two occasions
16 March 2011 Dr. Mohamed Z Gad 7
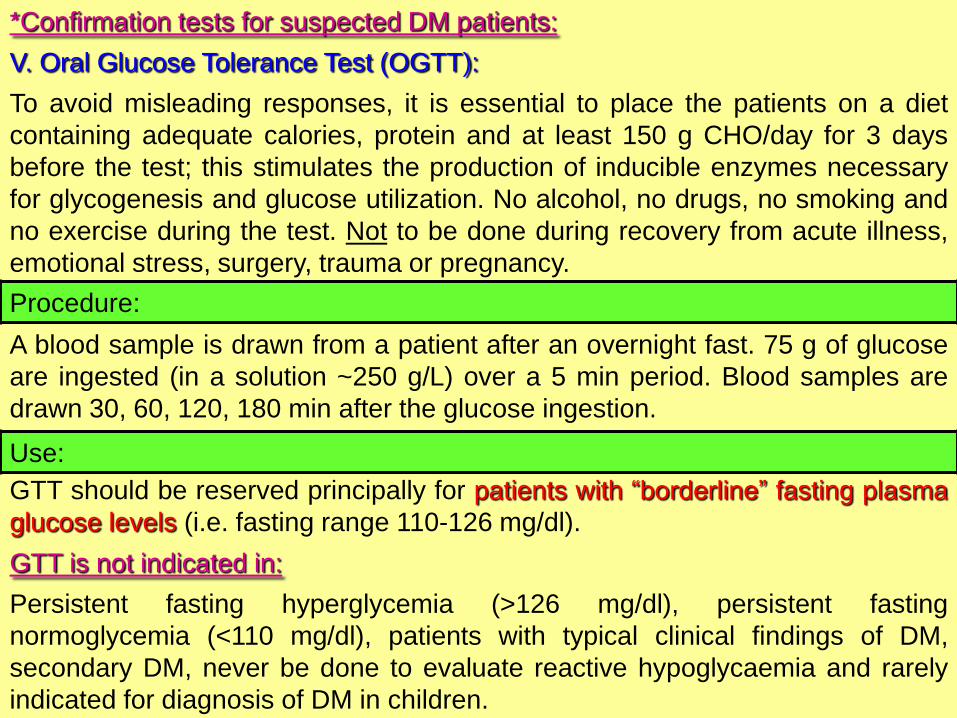
*Confirmation tests for suspected DM patients:
V. Oral Glucose Tolerance Test (OGTT):
To avoid misleading responses, it is essential to place the patients on a diet
containing adequate calories, protein and at least 150 g CHO/day for 3 days
before the test; this stimulates the production of inducible enzymes necessary
for glycogenesis and glucose utilization. No alcohol, no drugs, no smoking and
no exercise during the test. Not to be done during recovery from acute illness,
emotional stress, surgery, trauma or pregnancy.
A blood sample is drawn from a patient after an overnight fast. 75 g of glucose
are ingested (in a solution ~250 g/L) over a 5 min period. Blood samples are
drawn 30, 60, 120, 180 min after the glucose ingestion.
GTT should be reserved principally for patients with “borderline” fasting plasma
glucose levels (i.e. fasting range 110-126 mg/dl).
GTT is not indicated in:
Persistent fasting hyperglycemia (>126 mg/dl), persistent fasting
normoglycemia (<110 mg/dl), patients with typical clinical findings of DM,
secondary DM, never be done to evaluate reactive hypoglycaemia and rarely
indicated for diagnosis of DM in children.
Procedure:
Use:
16 March 2011 Dr. Mohamed Z Gad 8
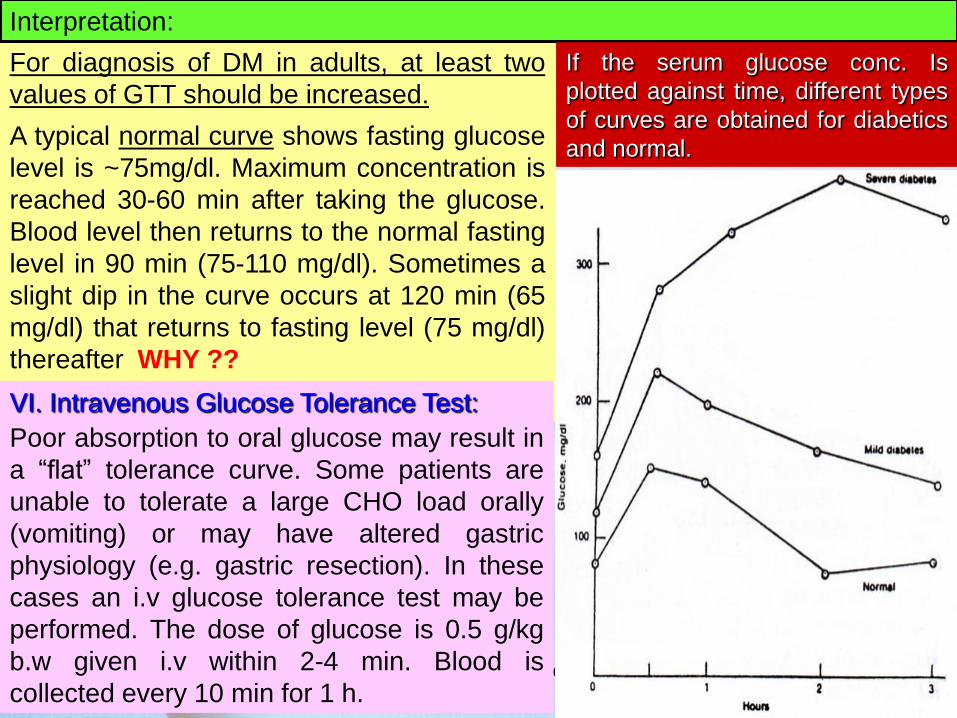
For diagnosis of DM in adults, at least two
values of GTT should be increased.
A typical normal curve shows fasting glucose
level is ~75mg/dl. Maximum concentration is
reached 30-60 min after taking the glucose.
Blood level then returns to the normal fasting
level in 90 min (75-110 mg/dl). Sometimes a
slight dip in the curve occurs at 120 min (65
mg/dl) that returns to fasting level (75 mg/dl)
thereafter WHY ??
Interpretation:
If the serum glucose conc. Is
plotted against time, different types
of curves are obtained for diabetics
and normal.
VI. Intravenous Glucose Tolerance Test:
Poor absorption to oral glucose may result in
a “flat” tolerance curve. Some patients are
unable to tolerate a large CHO load orally
(vomiting) or may have altered gastric
physiology (e.g. gastric resection). In these
cases an i.v glucose tolerance test may be
performed. The dose of glucose is 0.5 g/kg
b.w given i.v within 2-4 min. Blood is
collected every 10 min for 1 h.
16 March 2011 Dr. Mohamed Z Gad 9
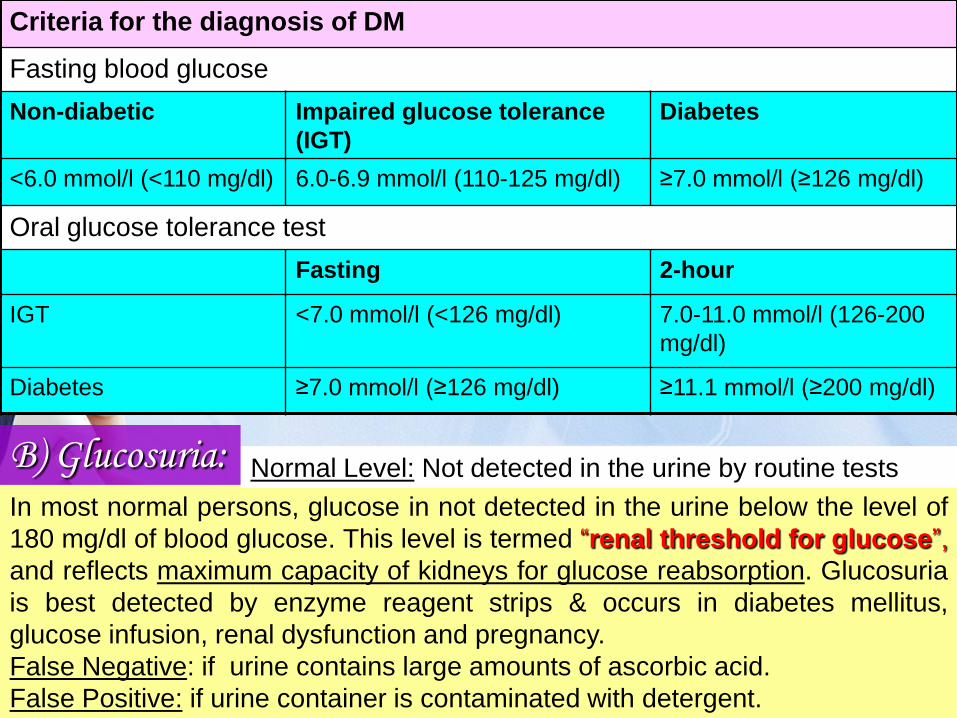
Criteria for the diagnosis of DM
Fasting blood glucose
Non-diabetic Impaired glucose tolerance
(IGT)
Diabetes
<6.0 mmol/l (<110 mg/dl) 6.0-6.9 mmol/l (110-125 mg/dl) ≥7.0 mmol/l (≥126 mg/dl)
Oral glucose tolerance test
Fasting 2-hour
IGT <7.0 mmol/l (<126 mg/dl) 7.0-11.0 mmol/l (126-200
mg/dl)
Diabetes ≥7.0 mmol/l (≥126 mg/dl) ≥11.1 mmol/l (≥200 mg/dl)
B) Glucosuria:In most normal persons, glucose in not detected in the urine below the level of
180 mg/dl of blood glucose. This level is termed “renal threshold for glucose”,
and reflects maximum capacity of kidneys for glucose reabsorption. Glucosuria
is best detected by enzyme reagent strips & occurs in diabetes mellitus,
glucose infusion, renal dysfunction and pregnancy.
False Negative: if urine contains large amounts of ascorbic acid.
False Positive: if urine container is contaminated with detergent.
Normal Level: Not detected in the urine by routine tests
16 March 2011 Dr. Mohamed Z Gad 10
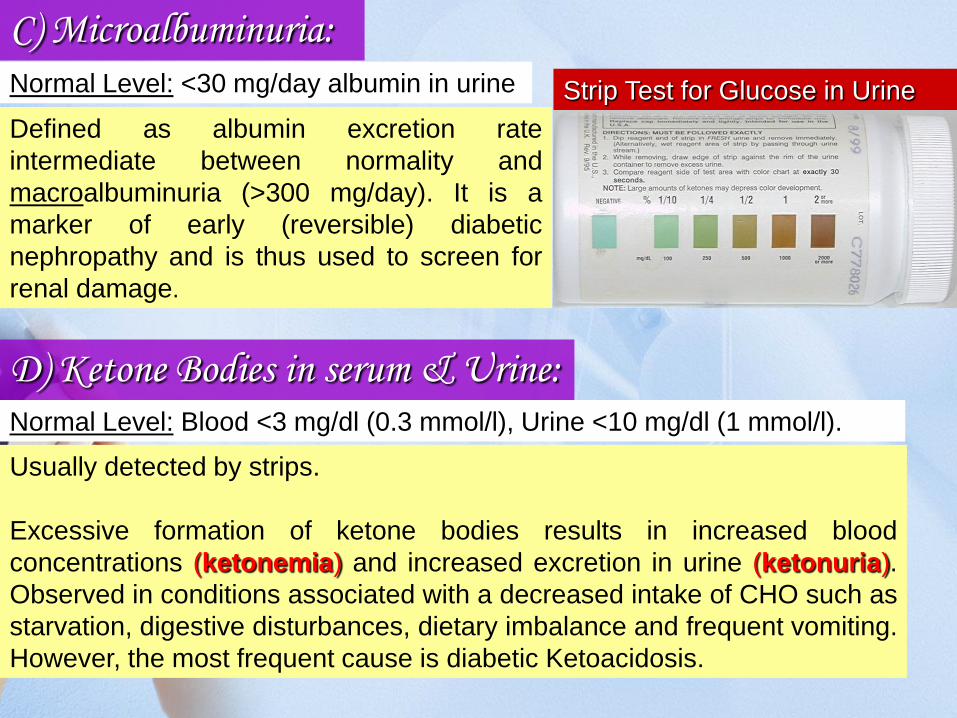
D) Ketone Bodies in serum & Urine:Normal Level: Blood <3 mg/dl (0.3 mmol/l), Urine <10 mg/dl (1 mmol/l).
Usually detected by strips.
Excessive formation of ketone bodies results in increased blood
concentrations (ketonemia) and increased excretion in urine (ketonuria).
Observed in conditions associated with a decreased intake of CHO such as
starvation, digestive disturbances, dietary imbalance and frequent vomiting.
However, the most frequent cause is diabetic Ketoacidosis.
C) Microalbuminuria:
Defined as albumin excretion rate
intermediate between normality and
macroalbuminuria (>300 mg/day). It is a
marker of early (reversible) diabetic
nephropathy and is thus used to screen for
renal damage.
Normal Level: <30 mg/day albumin in urine Strip Test for Glucose in Urine
16 March 2011 Dr. Mohamed Z Gad 11
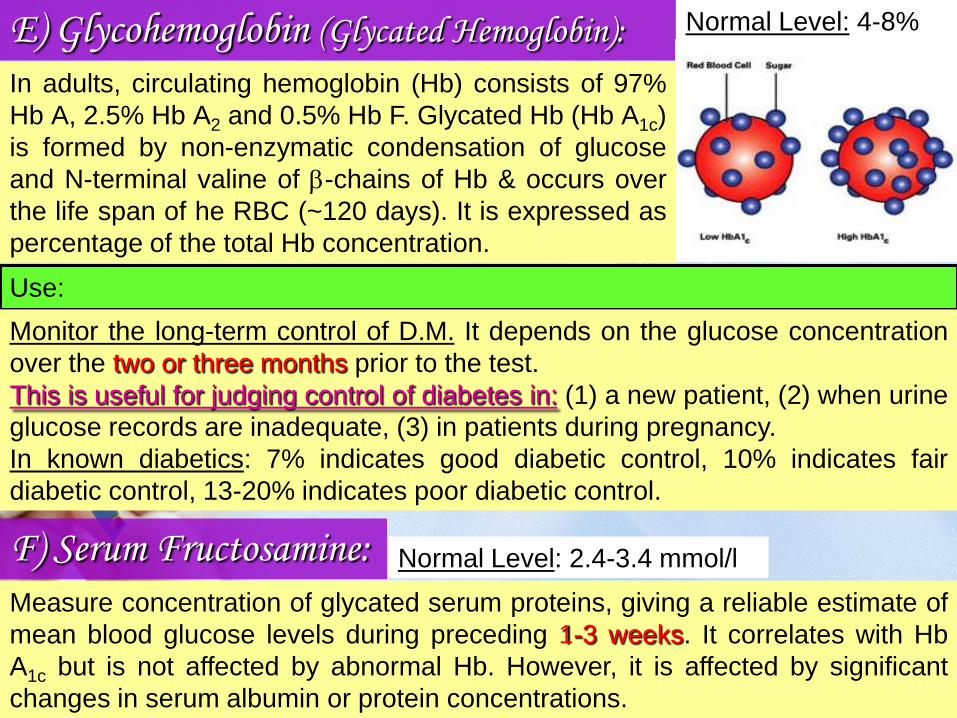
E) Glycohemoglobin (Glycated Hemoglobin): Normal Level: 4-8%
In adults, circulating hemoglobin (Hb) consists of 97%
Hb A, 2.5% Hb A2 and 0.5% Hb F. Glycated Hb (Hb A1c)
is formed by non-enzymatic condensation of glucose
and N-terminal valine of b-chains of Hb & occurs over
the life span of he RBC (~120 days). It is expressed as
percentage of the total Hb concentration.
Use:
Monitor the long-term control of D.M. It depends on the glucose concentration
over the two or three months prior to the test.
This is useful for judging control of diabetes in: (1) a new patient, (2) when urine
glucose records are inadequate, (3) in patients during pregnancy.
In known diabetics: 7% indicates good diabetic control, 10% indicates fair
diabetic control, 13-20% indicates poor diabetic control.
F) Serum Fructosamine: Normal Level: 2.4-3.4 mmol/l
Measure concentration of glycated serum proteins, giving a reliable estimate of
mean blood glucose levels during preceding 1-3 weeks. It correlates with Hb
A1c but is not affected by abnormal Hb. However, it is affected by significant
changes in serum albumin or protein concentrations.
16 March 2011 Dr. Mohamed Z Gad 12
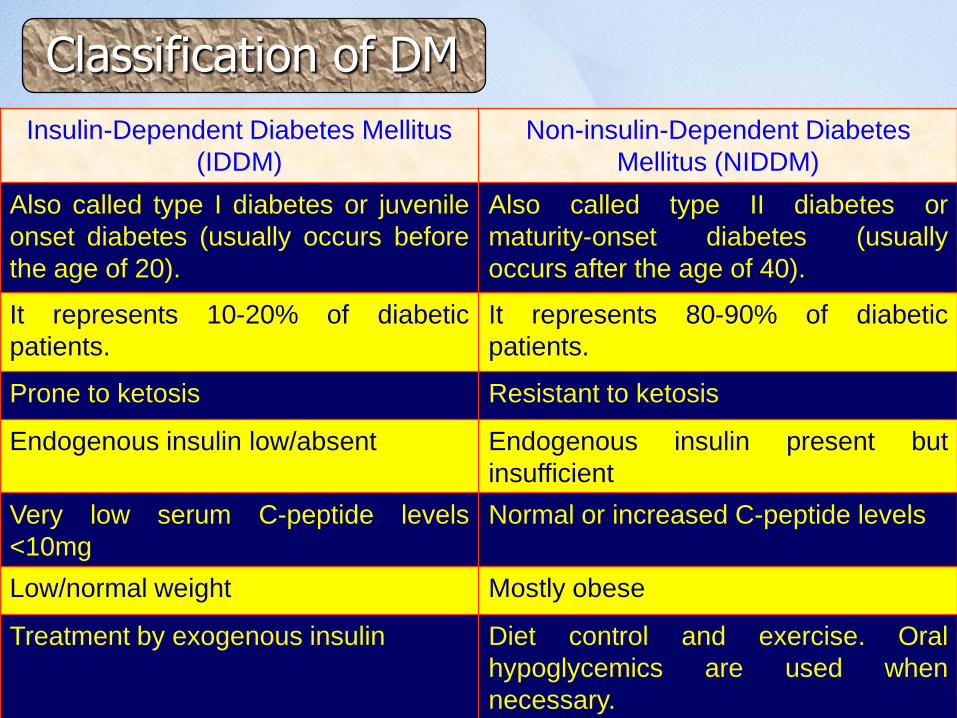
Classification of DM
Insulin-Dependent Diabetes Mellitus
(IDDM)
Non-insulin-Dependent Diabetes
Mellitus (NIDDM)
Also called type I diabetes or juvenile
onset diabetes (usually occurs before
the age of 20).
Also called type II diabetes or
maturity-onset diabetes (usually
occurs after the age of 40).
It represents 10-20% of diabetic
patients.
It represents 80-90% of diabetic
patients.
Prone to ketosis Resistant to ketosis
Endogenous insulin low/absent Endogenous insulin present but
insufficient
Very low serum C-peptide levels
<10mg
Normal or increased C-peptide levels
Low/normal weight Mostly obese
Treatment by exogenous insulin Diet control and exercise. Oral
hypoglycemics are used when
necessary.
16 March 2011 Dr. Mohamed Z Gad 13
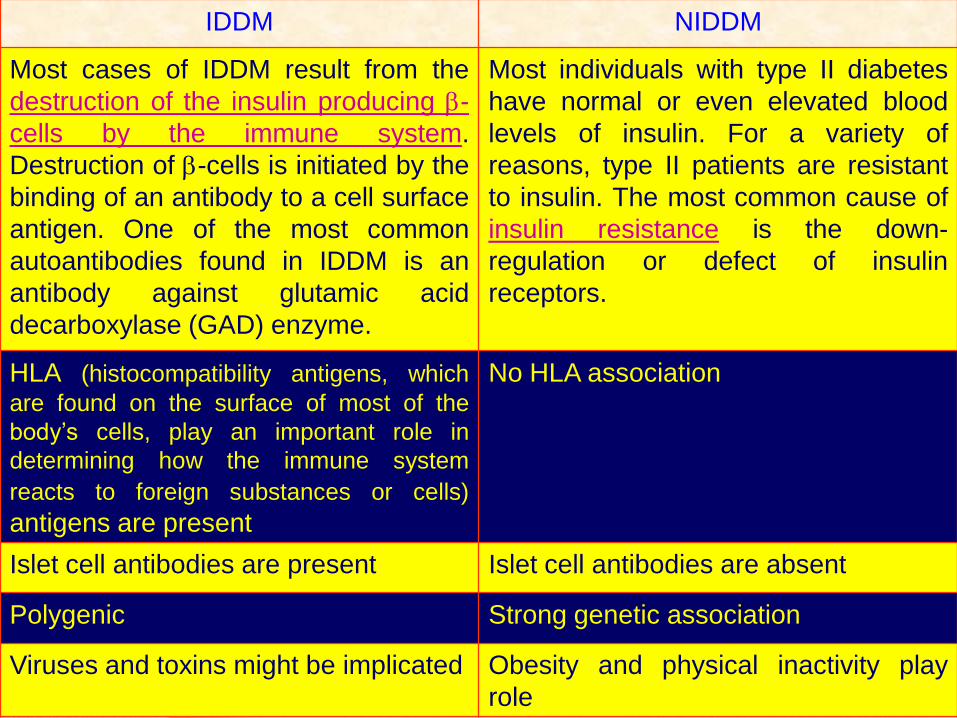
IDDM NIDDM
Most cases of IDDM result from the
destruction of the insulin producing b-
cells by the immune system.
Destruction of b-cells is initiated by the
binding of an antibody to a cell surface
antigen. One of the most common
autoantibodies found in IDDM is an
antibody against glutamic acid
decarboxylase (GAD) enzyme.
Most individuals with type II diabetes
have normal or even elevated blood
levels of insulin. For a variety of
reasons, type II patients are resistant
to insulin. The most common cause of
insulin resistance is the down-
regulation or defect of insulin
receptors.
HLA (histocompatibility antigens, which
are found on the surface of most of the
body’s cells, play an important role in
determining how the immune system
reacts to foreign substances or cells)
antigens are present
No HLA association
Islet cell antibodies are present Islet cell antibodies are absent
Polygenic Strong genetic association
Viruses and toxins might be implicated Obesity and physical inactivity play
role
Dr. Mohamed Z Gad 14
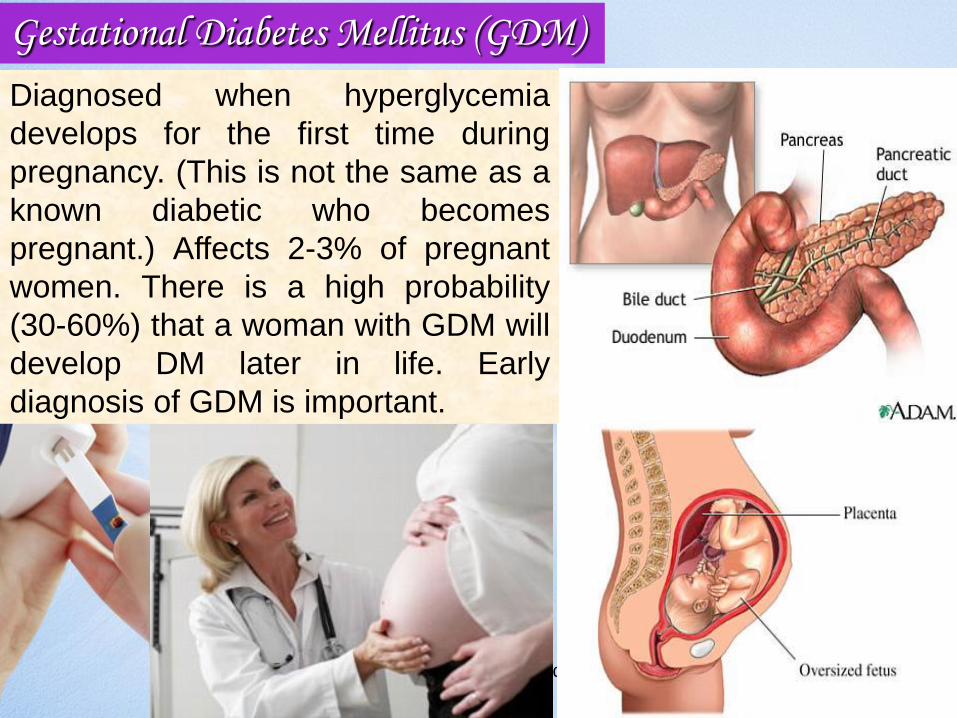
Diagnosed when hyperglycemia
develops for the first time during
pregnancy. (This is not the same as a
known diabetic who becomes
pregnant.) Affects 2-3% of pregnant
women. There is a high probability
(30-60%) that a woman with GDM will
develop DM later in life. Early
diagnosis of GDM is important.
Gestational Diabetes Mellitus (GDM)
Dr. Mohamed Z Gad 15
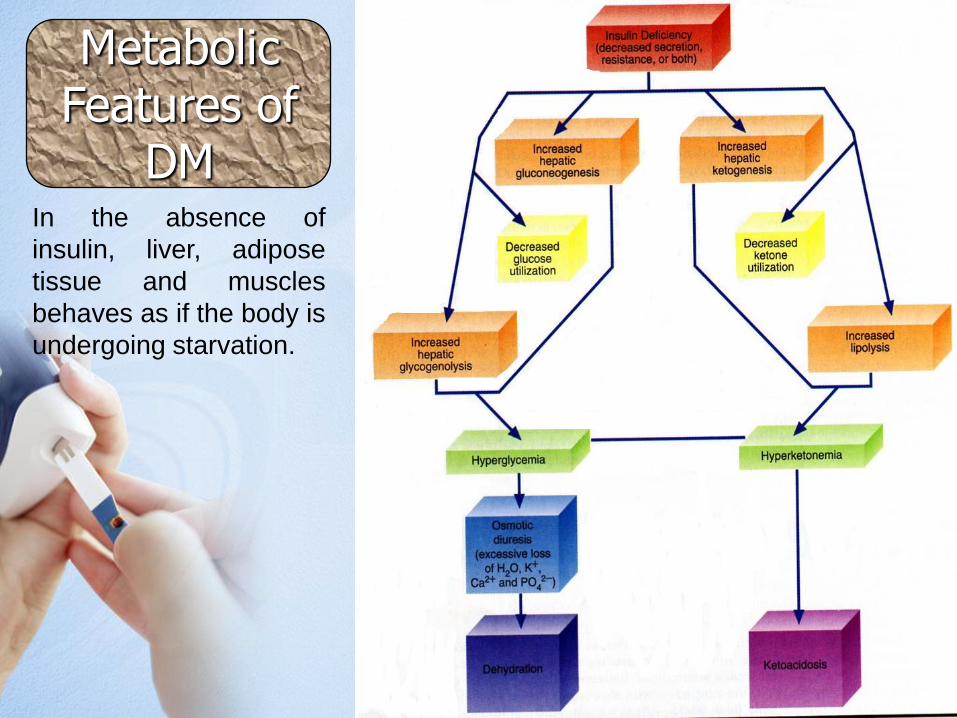
Metabolic Features of
DMIn the absence of
insulin, liver, adipose
tissue and muscles
behaves as if the body is
undergoing starvation.
16 March 2011 Dr. Mohamed Z Gad 16
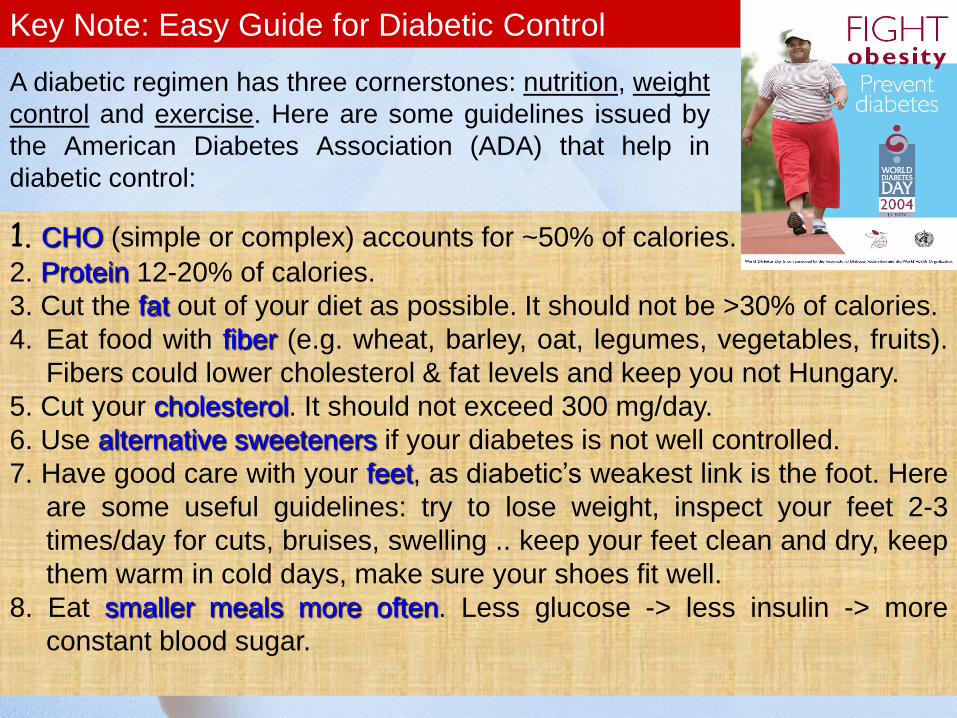
Key Note: Easy Guide for Diabetic Control
1. CHO (simple or complex) accounts for ~50% of calories.
2. Protein 12-20% of calories.
3. Cut the fat out of your diet as possible. It should not be >30% of calories.
4. Eat food with fiber (e.g. wheat, barley, oat, legumes, vegetables, fruits).
Fibers could lower cholesterol & fat levels and keep you not Hungary.
5. Cut your cholesterol. It should not exceed 300 mg/day.
6. Use alternative sweeteners if your diabetes is not well controlled.
7. Have good care with your feet, as diabetic’s weakest link is the foot. Here
are some useful guidelines: try to lose weight, inspect your feet 2-3
times/day for cuts, bruises, swelling .. keep your feet clean and dry, keep
them warm in cold days, make sure your shoes fit well.
8. Eat smaller meals more often. Less glucose -> less insulin -> more
constant blood sugar.
A diabetic regimen has three cornerstones: nutrition, weight
control and exercise. Here are some guidelines issued by
the American Diabetes Association (ADA) that help in
diabetic control:
17
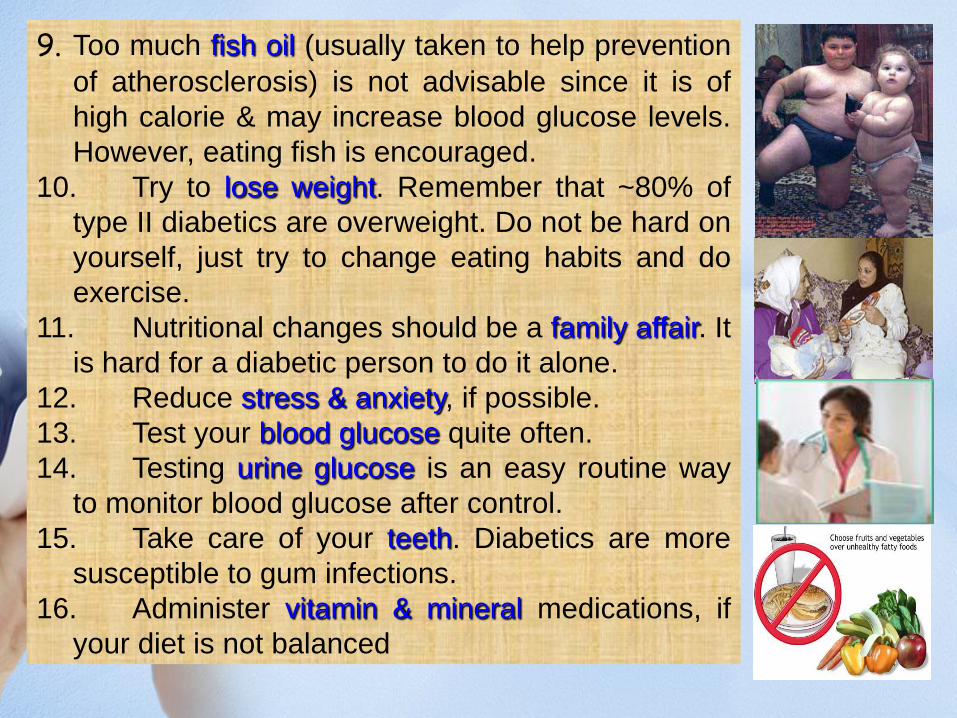
9. Too much fish oil (usually taken to help prevention
of atherosclerosis) is not advisable since it is of
high calorie & may increase blood glucose levels.
However, eating fish is encouraged.
10. Try to lose weight. Remember that ~80% of
type II diabetics are overweight. Do not be hard on
yourself, just try to change eating habits and do
exercise.
11. Nutritional changes should be a family affair. It
is hard for a diabetic person to do it alone.
12. Reduce stress & anxiety, if possible.
13. Test your blood glucose quite often.
14. Testing urine glucose is an easy routine way
to monitor blood glucose after control.
15. Take care of your teeth. Diabetics are more
susceptible to gum infections.
16. Administer vitamin & mineral medications, if
your diet is not balanced
16 March 2011 Dr. Mohamed Z Gad 18
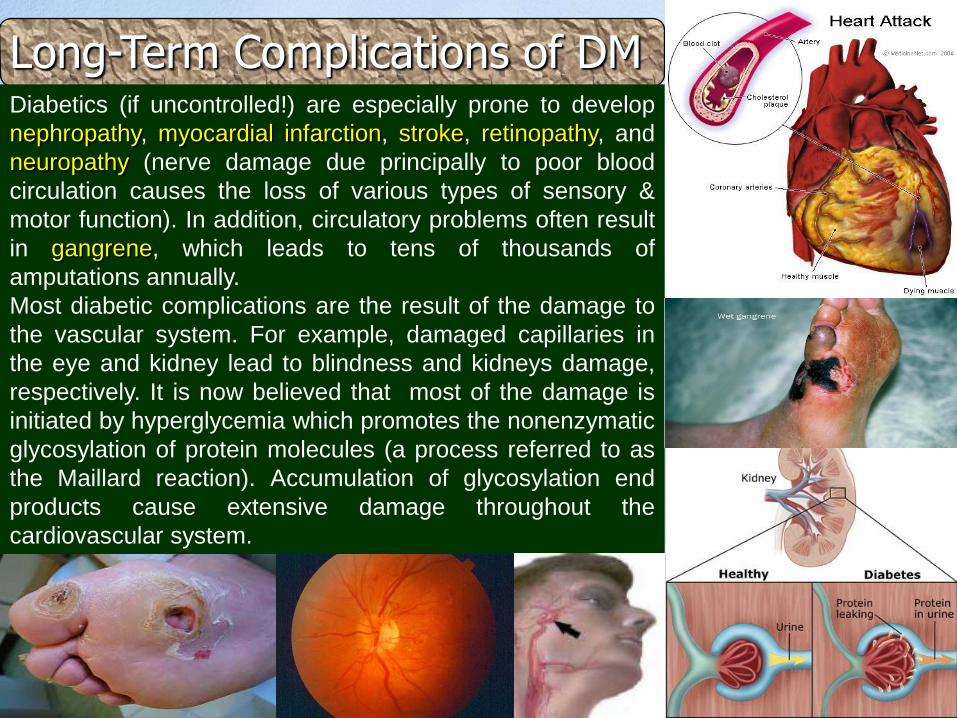
Long-Term Complications of DMDiabetics (if uncontrolled!) are especially prone to develop
nephropathy, myocardial infarction, stroke, retinopathy, and
neuropathy (nerve damage due principally to poor blood
circulation causes the loss of various types of sensory &
motor function). In addition, circulatory problems often result
in gangrene, which leads to tens of thousands of
amputations annually.
Most diabetic complications are the result of the damage to
the vascular system. For example, damaged capillaries in
the eye and kidney lead to blindness and kidneys damage,
respectively. It is now believed that most of the damage is
initiated by hyperglycemia which promotes the nonenzymatic
glycosylation of protein molecules (a process referred to as
the Maillard reaction). Accumulation of glycosylation end
products cause extensive damage throughout the
cardiovascular system.
16 March 2011 Dr. Mohamed Z Gad 19
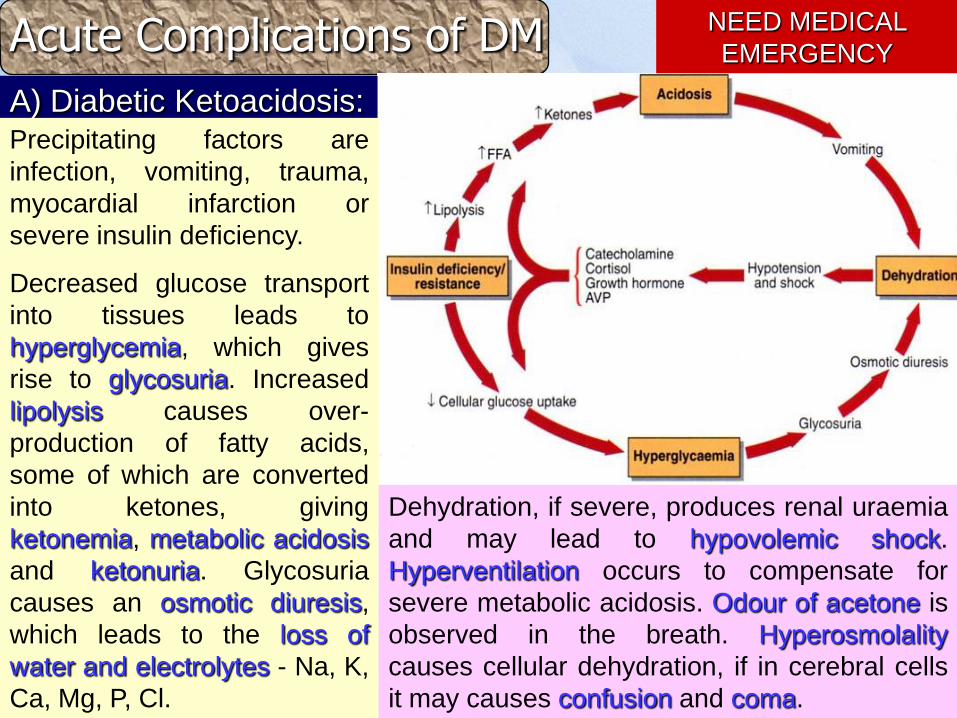
Acute Complications of DM NEED MEDICAL
EMERGENCY
A) Diabetic Ketoacidosis:Precipitating factors are
infection, vomiting, trauma,
myocardial infarction or
severe insulin deficiency.
Decreased glucose transport
into tissues leads to
hyperglycemia, which gives
rise to glycosuria. Increased
lipolysis causes over-
production of fatty acids,
some of which are converted
into ketones, giving
ketonemia, metabolic acidosis
and ketonuria. Glycosuria
causes an osmotic diuresis,
which leads to the loss of
water and electrolytes - Na, K,
Ca, Mg, P, Cl.
Dehydration, if severe, produces renal uraemia
and may lead to hypovolemic shock.
Hyperventilation occurs to compensate for
severe metabolic acidosis. Odour of acetone is
observed in the breath. Hyperosmolality
causes cellular dehydration, if in cerebral cells
it may causes confusion and coma.
20
NEED MEDICAL
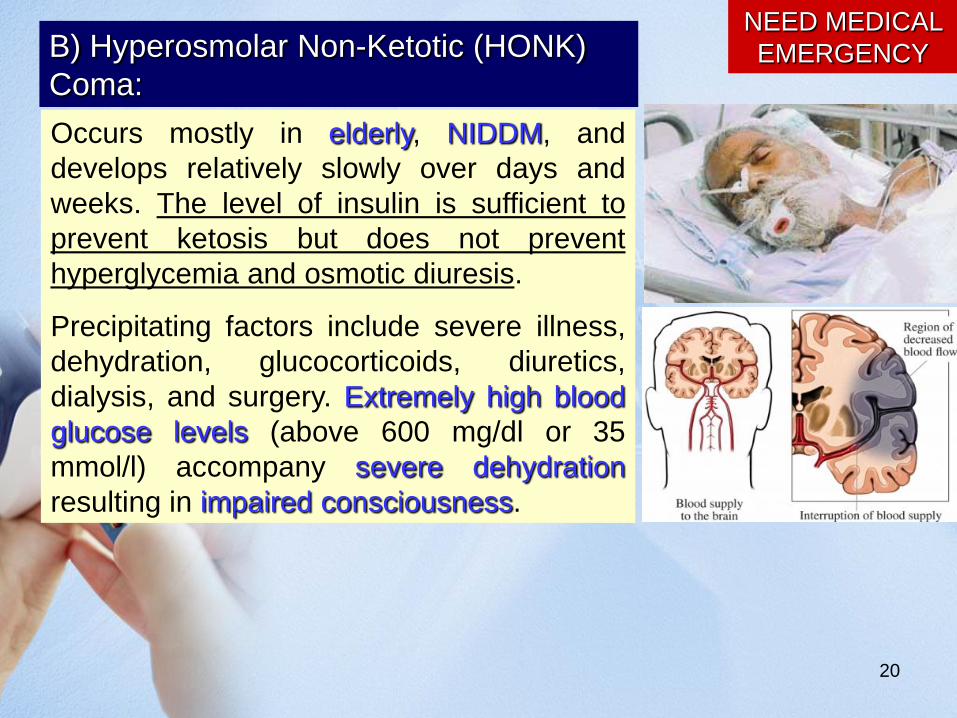
EMERGENCYB) Hyperosmolar Non-Ketotic (HONK)
Coma:
Occurs mostly in elderly, NIDDM, and
develops relatively slowly over days and
weeks. The level of insulin is sufficient to
prevent ketosis but does not prevent
hyperglycemia and osmotic diuresis.
Precipitating factors include severe illness,
dehydration, glucocorticoids, diuretics,
dialysis, and surgery. Extremely high blood
glucose levels (above 600 mg/dl or 35
mmol/l) accompany severe dehydration
resulting in impaired consciousness.
21
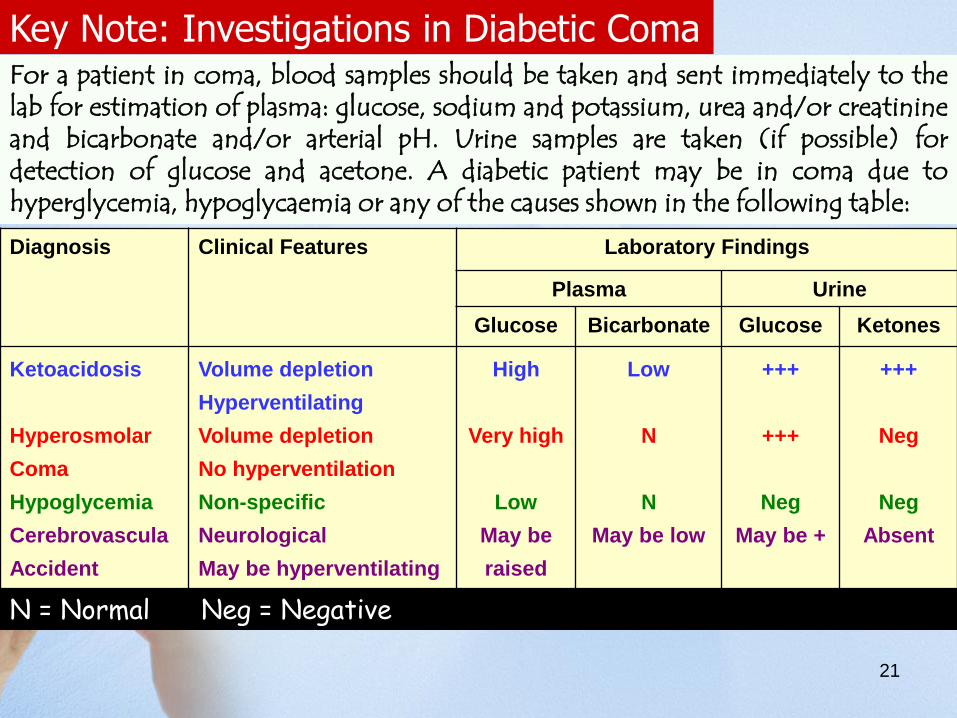
Key Note: Investigations in Diabetic ComaFor a patient in coma, blood samples should be taken and sent immediately to thelab for estimation of plasma: glucose, sodium and potassium, urea and/or creatinineand bicarbonate and/or arterial pH. Urine samples are taken (if possible) fordetection of glucose and acetone. A diabetic patient may be in coma due tohyperglycemia, hypoglycaemia or any of the causes shown in the following table:
Diagnosis Clinical Features Laboratory Findings
Plasma Urine
Glucose Bicarbonate Glucose Ketones
Ketoacidosis
Hyperosmolar
Coma
Hypoglycemia
Cerebrovascula
Accident
Volume depletion
Hyperventilating
Volume depletion
No hyperventilation
Non-specific
Neurological
May be hyperventilating
High
Very high
Low
May be
raised
Low
N
N
May be low
+++
+++
Neg
May be +
+++
Neg
Neg
Absent
N = Normal Neg = Negative
22
What is Coma ?
23
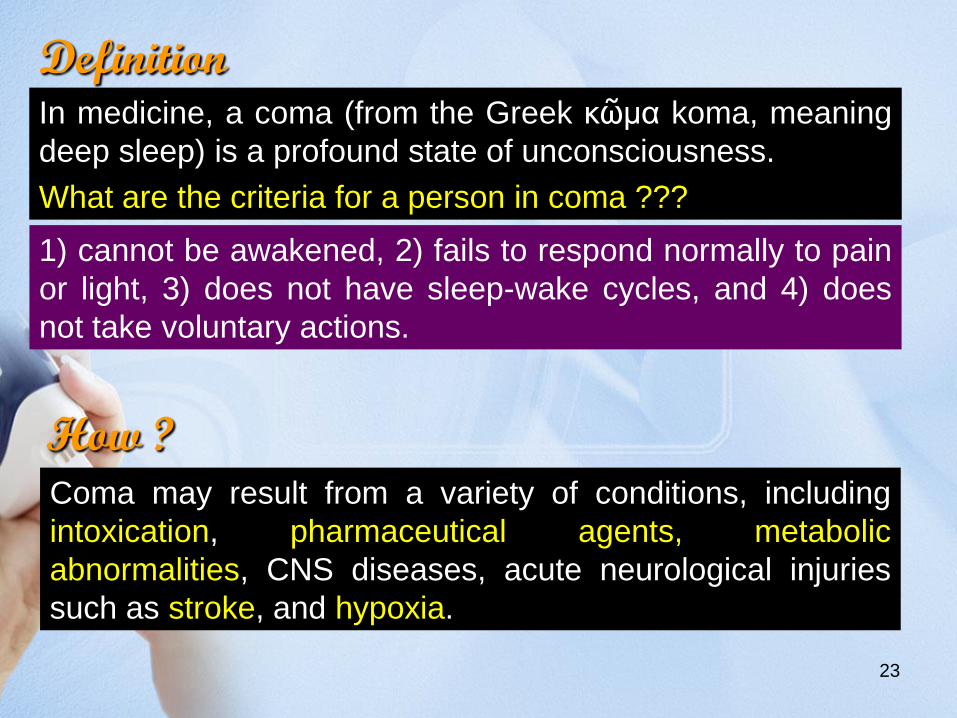
DefinitionIn medicine, a coma (from the Greek κῶμα koma, meaning
deep sleep) is a profound state of unconsciousness.
What are the criteria for a person in coma ???
Coma may result from a variety of conditions, including
intoxication, pharmaceutical agents, metabolic
abnormalities, CNS diseases, acute neurological injuries
such as stroke, and hypoxia.
How ?
1) cannot be awakened, 2) fails to respond normally to pain
or light, 3) does not have sleep-wake cycles, and 4) does
not take voluntary actions.
16 March 2011 Dr. Mohamed Z Gad 24
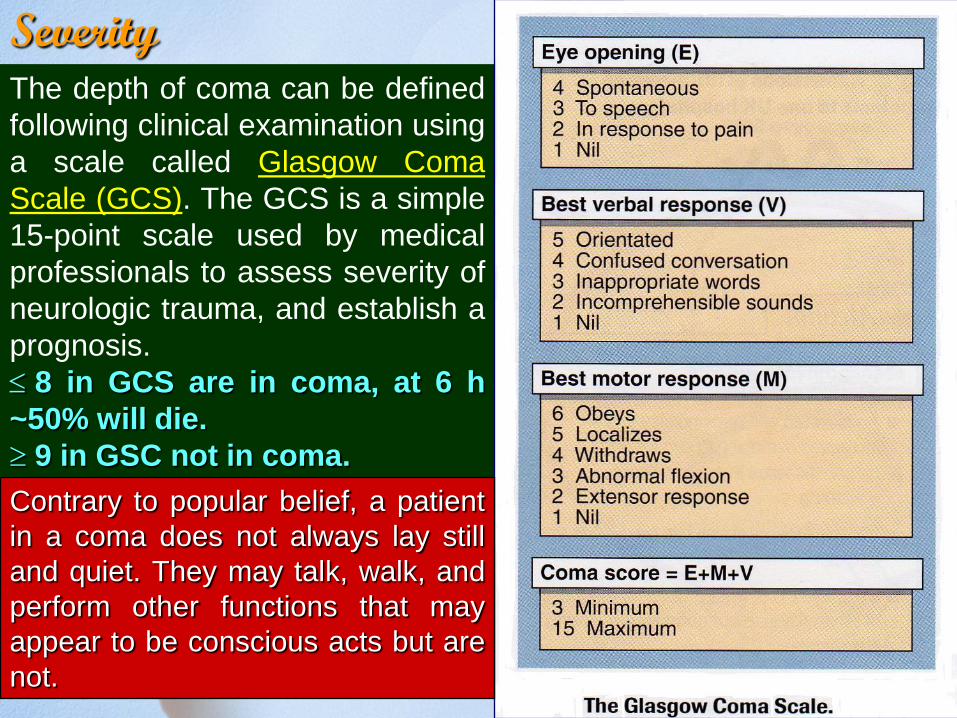
SeverityThe depth of coma can be defined
following clinical examination using
a scale called Glasgow Coma
Scale (GCS). The GCS is a simple
15-point scale used by medical
professionals to assess severity of
neurologic trauma, and establish a
prognosis.
8 in GCS are in coma, at 6 h
~50% will die.
9 in GSC not in coma.
Contrary to popular belief, a patient
in a coma does not always lay still
and quiet. They may talk, walk, and
perform other functions that may
appear to be conscious acts but are
not.
25
Guess
what is The longest period
spent in coma according to
Guinness World Records ?
16 March 2011 Dr. Mohamed Z Gad 26
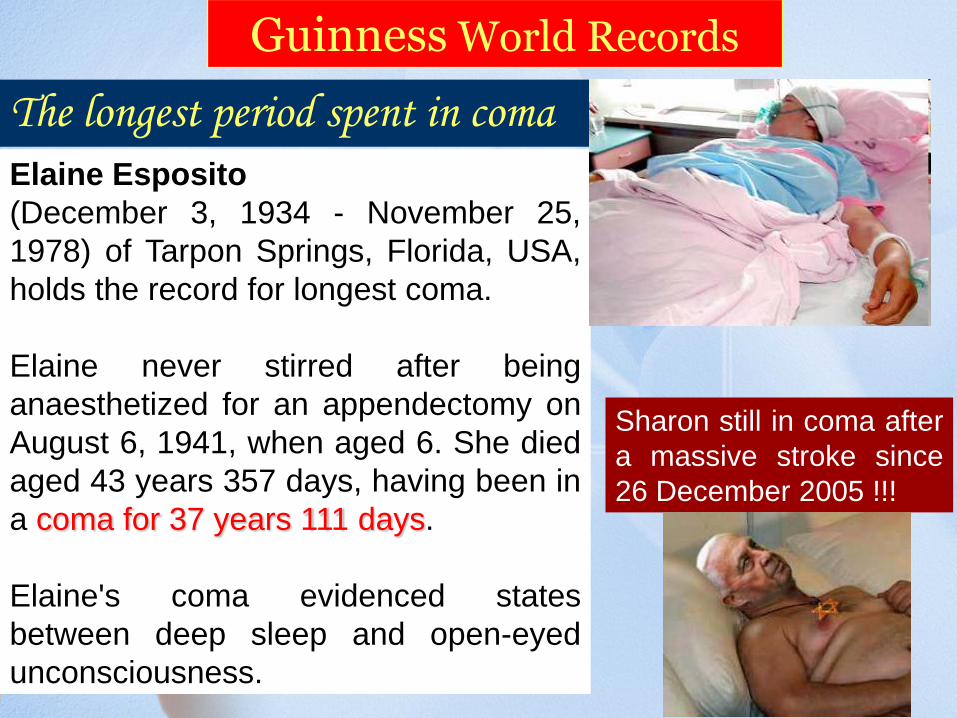
Guinness World Records
The longest period spent in coma
Elaine Esposito
(December 3, 1934 - November 25,
1978) of Tarpon Springs, Florida, USA,
holds the record for longest coma.
Elaine never stirred after being
anaesthetized for an appendectomy on
August 6, 1941, when aged 6. She died
aged 43 years 357 days, having been in
a coma for 37 years 111 days.
Elaine's coma evidenced states
between deep sleep and open-eyed
unconsciousness.
Sharon still in coma after
a massive stroke since
26 December 2005 !!!
27
References:
• Clinical Biochemistry: An illustrated colour text, A. Gaw et al., Churchill
Livingstone.
• Clinical Chemistry, W.J. Marshall, Mosby.
• Clinical Chemistry: Interpretation and Techniques, A. Kaplan & L.L. Szabo, Lea
& Febiger, Philadelphia.
• Fundamentals of Clinical Chemistry, N.W. Tietz, W.B., Saunders Company,
Philadelphia, London, Tokyo ….
• Clinical Biochemistry, A.F. Smith, G.J. Beckett, S.W. Walker & P.W. H Rae,
Blackwell Science Ltd, London…
• Interpretation of Diagnostic Tests, I. Wallach, Little, brown & Company, Boston,
London …..
• Practical Clinical Biochemistry, H. Varley, A.H. Gowenlock & M. Bell, William
Heinemann Medical Books LTD, London
28
1
Disorders of Carbohydrate Metabolism (2)
2
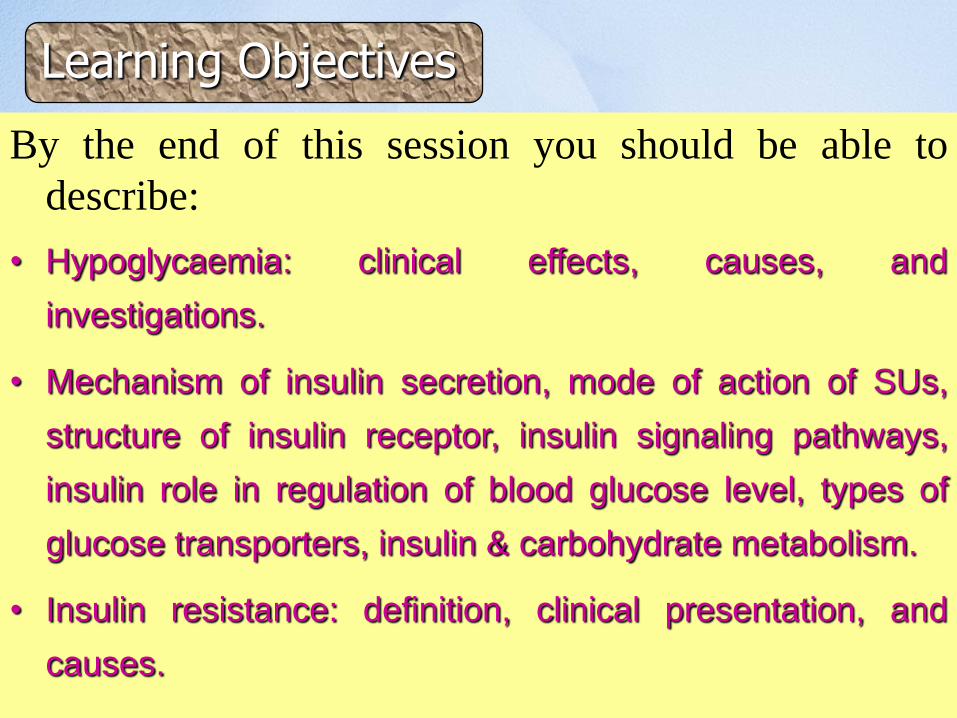
Learning Objectives
By the end of this session you should be able to
describe:
• Hypoglycaemia: clinical effects, causes, and
investigations.
• Mechanism of insulin secretion, mode of action of SUs,
structure of insulin receptor, insulin signaling pathways,
insulin role in regulation of blood glucose level, types of
glucose transporters, insulin & carbohydrate metabolism.
• Insulin resistance: definition, clinical presentation, and
causes.
3
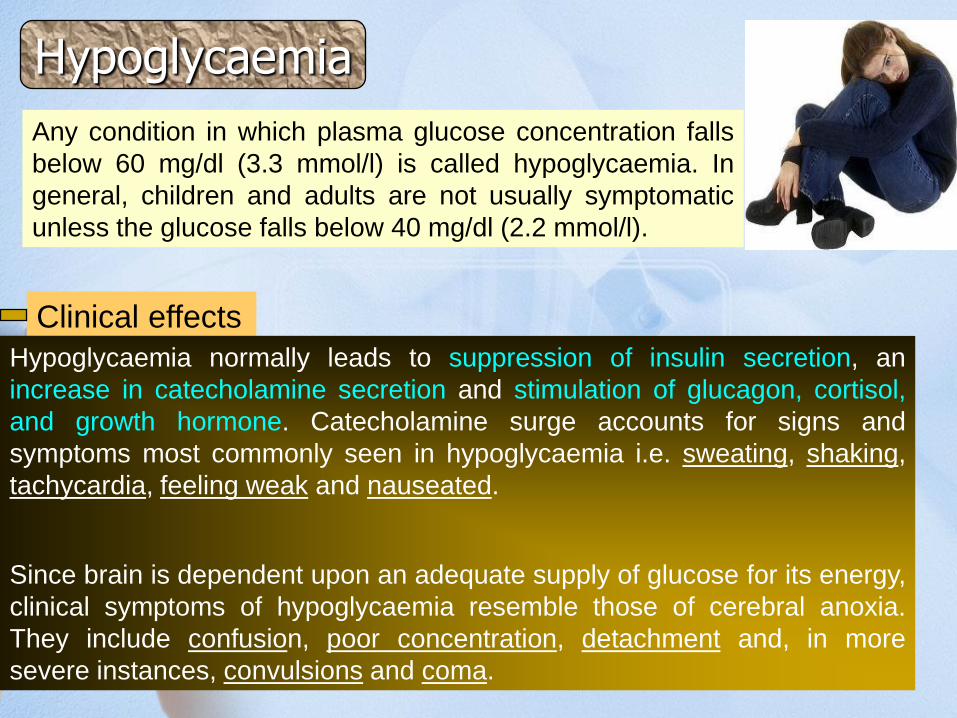
Hypoglycaemia
Any condition in which plasma glucose concentration falls
below 60 mg/dl (3.3 mmol/l) is called hypoglycaemia. In
general, children and adults are not usually symptomatic
unless the glucose falls below 40 mg/dl (2.2 mmol/l).
Clinical effects
Hypoglycaemia normally leads to suppression of insulin secretion, an
increase in catecholamine secretion and stimulation of glucagon, cortisol,
and growth hormone. Catecholamine surge accounts for signs and
symptoms most commonly seen in hypoglycaemia i.e. sweating, shaking,
tachycardia, feeling weak and nauseated.
Since brain is dependent upon an adequate supply of glucose for its energy,
clinical symptoms of hypoglycaemia resemble those of cerebral anoxia.
They include confusion, poor concentration, detachment and, in more
severe instances, convulsions and coma.
4
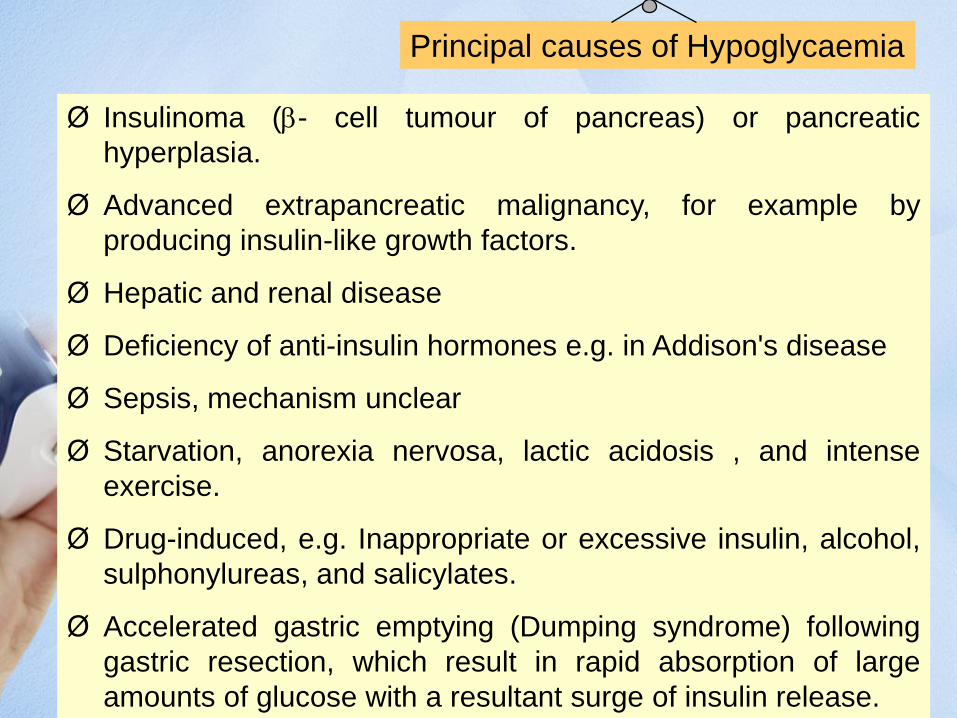
Principal causes of Hypoglycaemia
Ø Insulinoma (b- cell tumour of pancreas) or pancreatic
hyperplasia.
Ø Advanced extrapancreatic malignancy, for example by
producing insulin-like growth factors.
Ø Hepatic and renal disease
Ø Deficiency of anti-insulin hormones e.g. in Addison's disease
Ø Sepsis, mechanism unclear
Ø Starvation, anorexia nervosa, lactic acidosis , and intense
exercise.
Ø Drug-induced, e.g. Inappropriate or excessive insulin, alcohol,
sulphonylureas, and salicylates.
Ø Accelerated gastric emptying (Dumping syndrome) following
gastric resection, which result in rapid absorption of large
amounts of glucose with a resultant surge of insulin release.

5
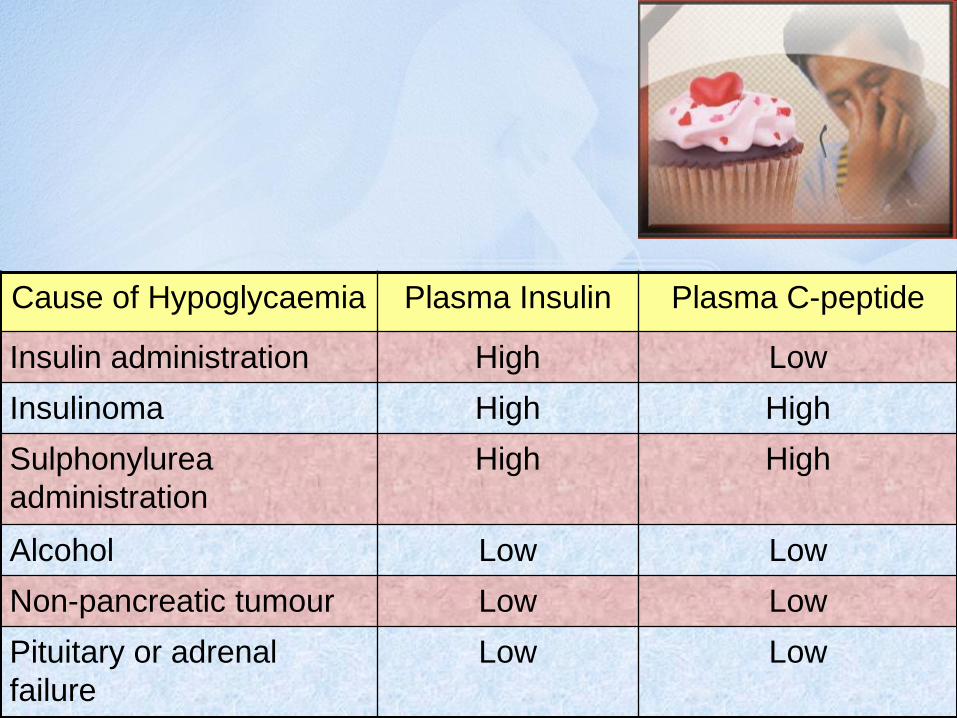
Investigations in Hypoglycaemia
The diagnosis of hypoglycaemia is established when three criteria are satisfied:
Symptoms consistent with hypoglycaemia
Laboratory confirmation of hypoglycaemia
Symptoms are relieved by glucose administration
• The most important test is plasma insulin
concentration. This differentiates
hypoglycaemia due to high insulin level from
other causes of hypoglycaemia.
• If plasma insulin conc. is inappropriately
high, plasma C-peptide concentrations
should be assayed …… WHY ?
• If plasma C-peptide is high, it suggests
endogenous insulin secretion, or pancreatic
stimulation e.g. by sulphonylureas.
Undetectable plasma C-peptide concentration
suggests exogenous insulin administration.
6
Cause of Hypoglycaemia Plasma Insulin Plasma C-peptide
Insulin administration High Low
Insulinoma High High
Sulphonylurea
administration
High High
Alcohol Low Low
Non-pancreatic tumour Low Low
Pituitary or adrenal
failure
Low Low
7
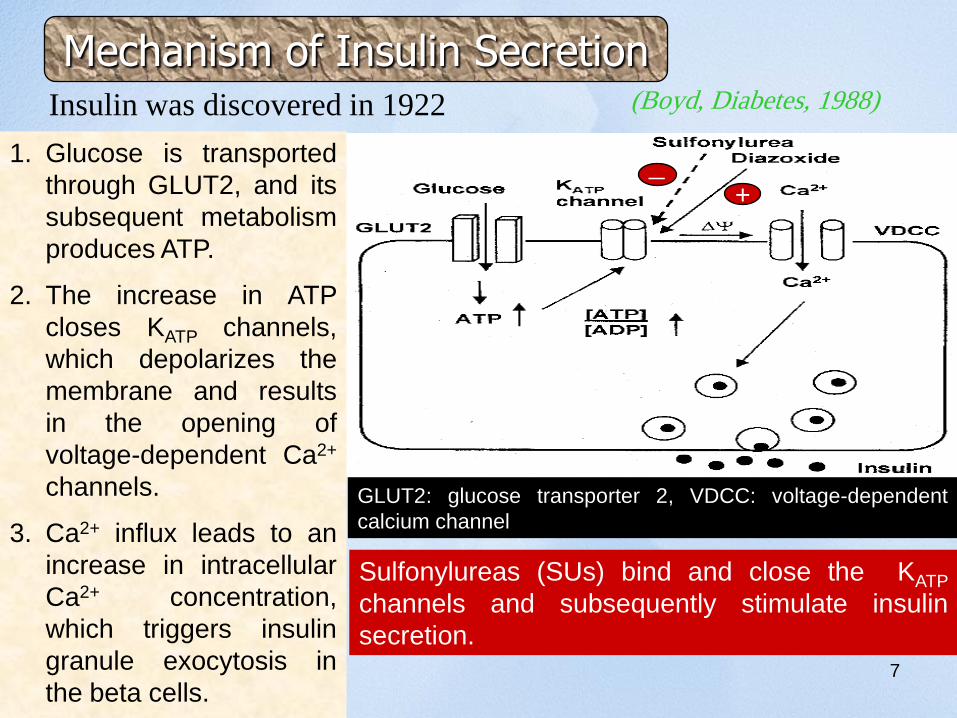
Insulin was discovered in 1922 (Boyd, Diabetes, 1988)
Mechanism of Insulin Secretion
1. Glucose is transported
through GLUT2, and its
subsequent metabolism
produces ATP.
2. The increase in ATP
closes KATP channels,
which depolarizes the
membrane and results
in the opening of
voltage-dependent Ca2+
channels.
3. Ca2+ influx leads to an
increase in intracellular
Ca2+ concentration,
which triggers insulin
granule exocytosis in
the beta cells.
GLUT2: glucose transporter 2, VDCC: voltage-dependent
calcium channel
Sulfonylureas (SUs) bind and close the KATP
channels and subsequently stimulate insulin
secretion.
-+
9
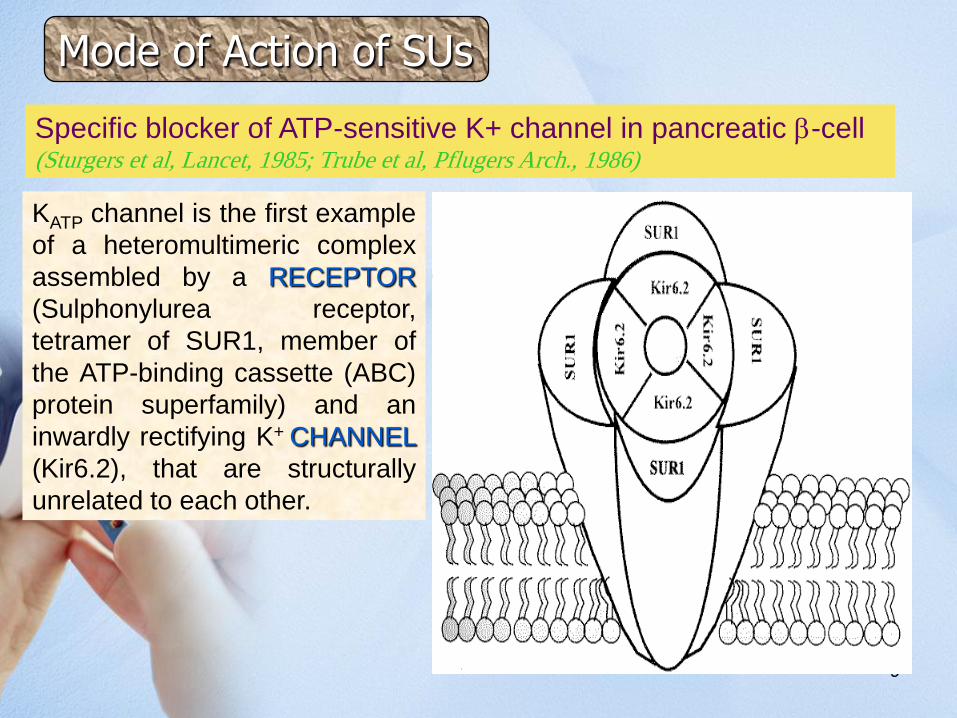
Specific blocker of ATP-sensitive K+ channel in pancreatic b-cell(Sturgers et al, Lancet, 1985; Trube et al, Pflugers Arch., 1986)
KATP channel is the first example
of a heteromultimeric complex
assembled by a RECEPTOR
(Sulphonylurea receptor,
tetramer of SUR1, member of
the ATP-binding cassette (ABC)
protein superfamily) and an
inwardly rectifying K+ CHANNEL
(Kir6.2), that are structurally
unrelated to each other.
Mode of Action of SUs
10
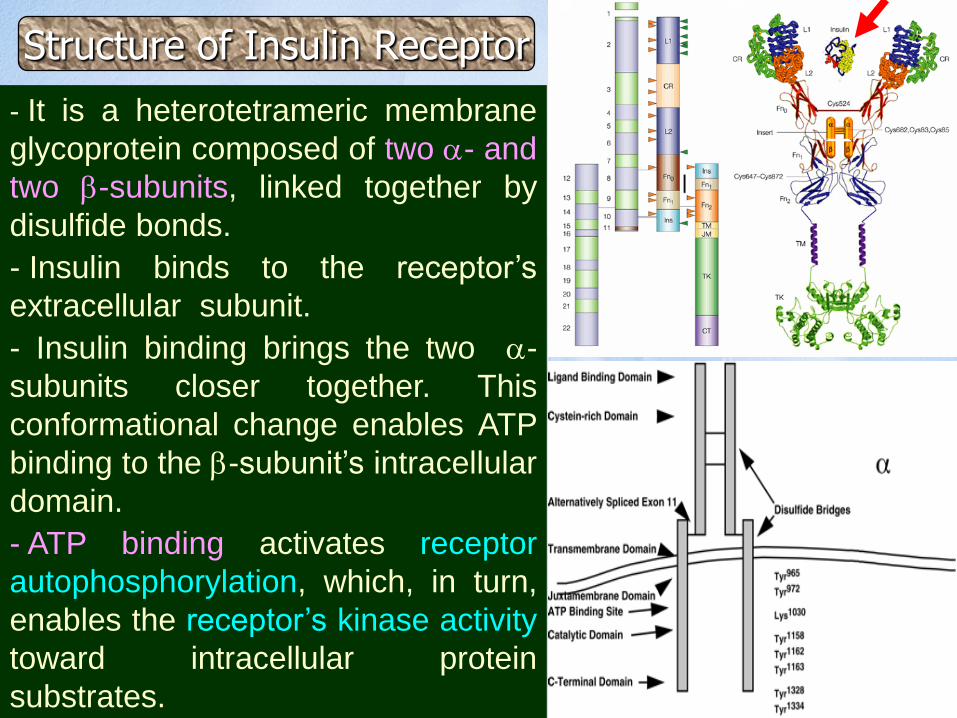
- It is a heterotetrameric membrane
glycoprotein composed of two a- and
two b-subunits, linked together by
disulfide bonds.
- Insulin binds to the receptor’s
extracellular subunit.
- Insulin binding brings the two a-
subunits closer together. This
conformational change enables ATP
binding to the b-subunit’s intracellular
domain.
- ATP binding activates receptor
autophosphorylation, which, in turn,
enables the receptor’s kinase activity
toward intracellular protein
substrates.
Structure of Insulin Receptor

11
• When insulin binds to its
tyrosine kinase receptor, it
activates insulin receptor
substrates (IRS), which in turn
stimulates the lipid kinase activity
of phosphatidylinositol 3-kinase.
• Rapid rise in Tris-phosphorylated
inositol (PIP3) triggers a cascade
of PIP3-dependent
serine/threonine kinases.
• Among the latter, Akt (a product
of the akt protooncogene) and
atypical protein kinase C isoforms
are thought to be involved in
insulin regulation of glucose
transport and oxidation; glycogen,
lipid, and protein synthesis; and
modulation of gene expression.
Insulin Signaling Pathways
12
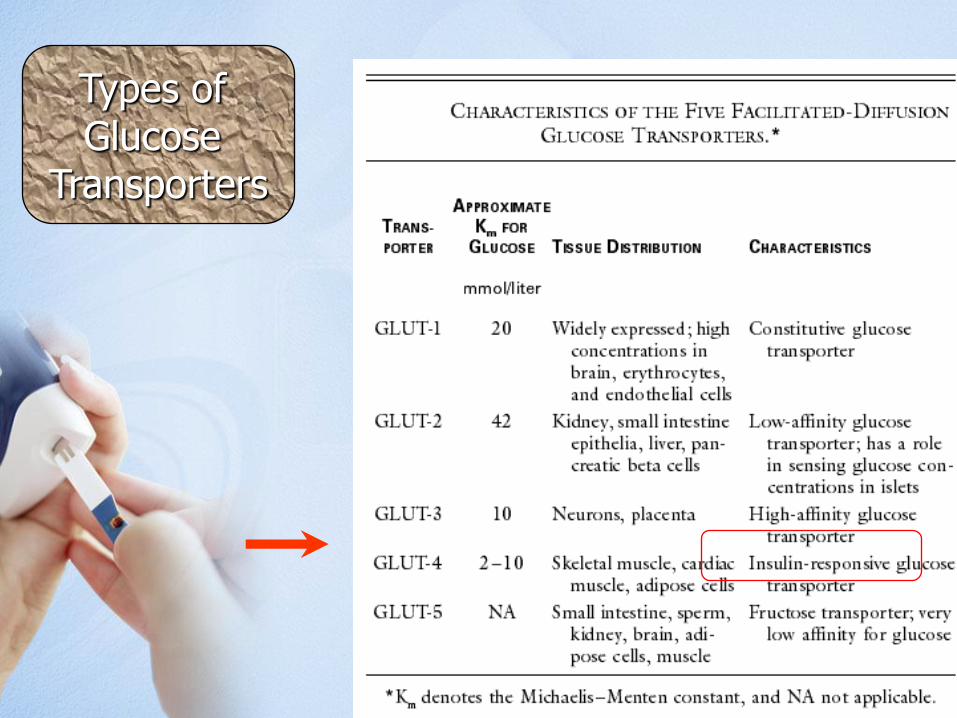
Types of Glucose
Transporters
13
Insulin & Carbohydrate Metabolism
1) Insulin facilitates entry of glucose into muscle, adipose
and several other tissues
mainly by enhancing translocation of hexose transporters (GLUT4) from
the cytoplasmic vesicles to plasma membrane for efficient uptake of
glucose.
When blood levels of insulin decrease and insulin receptors are no
longer occupied, the glucose transporters are recycled back into
cytoplasm.
N.B: There are some tissues that do not require insulin for efficient uptake
of glucose; important examples are brain and the lens. This is because
these cells don't use GLUT4 for importing glucose, but rather, another
transporter that is not insulin-dependent.
15
2) Insulin has several effects
in liver which stimulate
glycogen synthesis
It activates hexokinase, which
phosphorylates glucose, trapping it
within the cell. Coincidently, it acts to
inhibit activity of glucose-6-
phosphatase.
It activates glycogen synthase
responsible for glycogen synthesis.
Decreased activity in any of these steps could be responsible for
insulin resistance
16
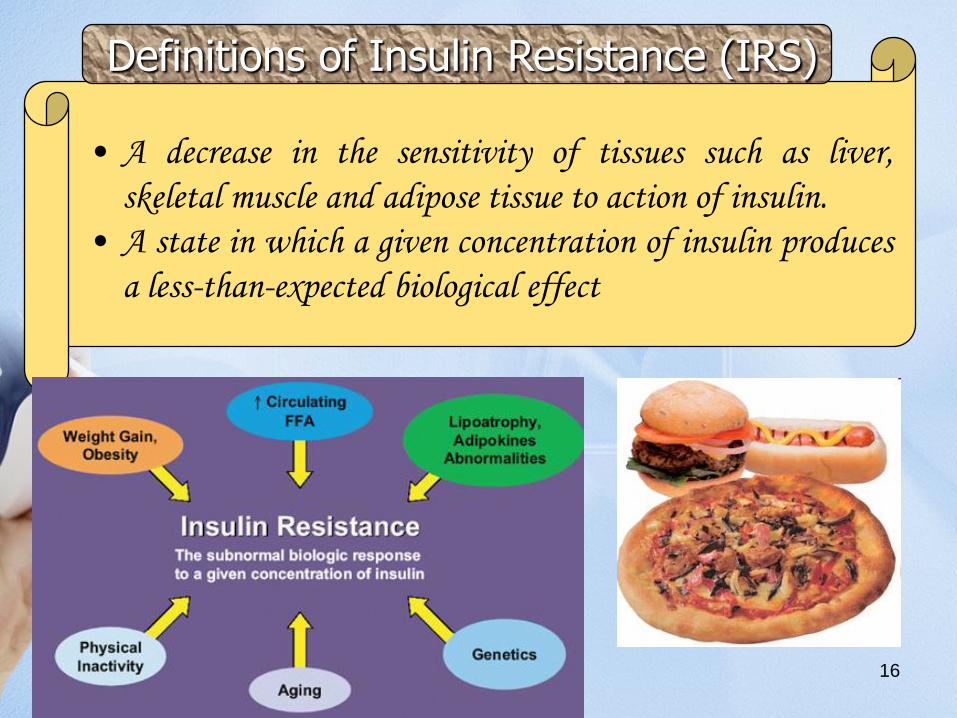
Definitions of Insulin Resistance (IRS)
• A decrease in the sensitivity of tissues such as liver,
skeletal muscle and adipose tissue to action of insulin.
• A state in which a given concentration of insulin produces
a less-than-expected biological effect
17
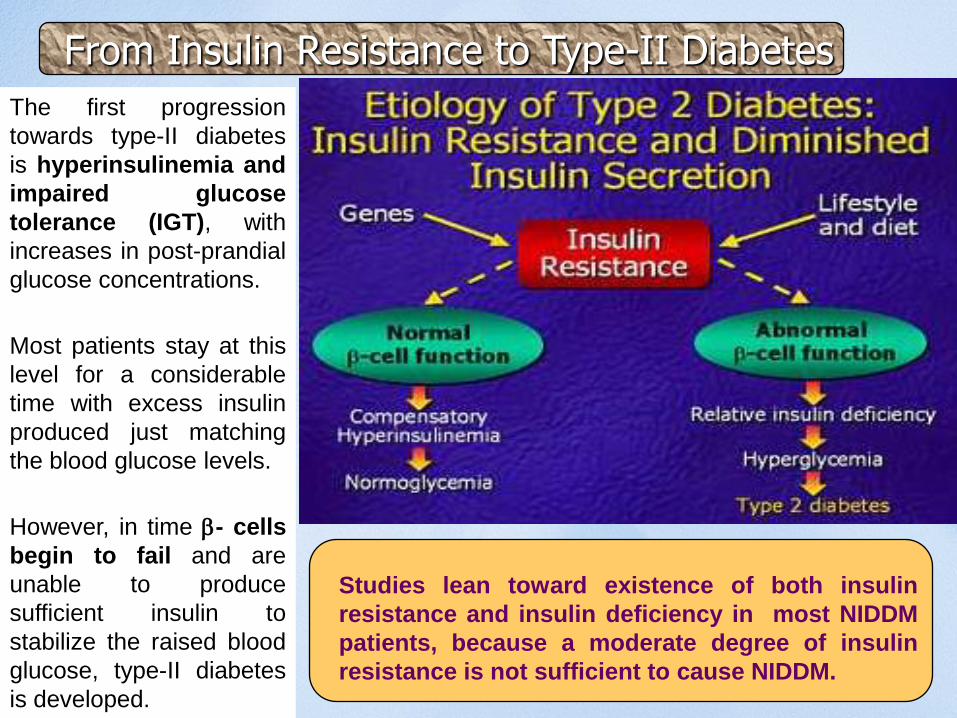
The first progression
towards type-II diabetes
is hyperinsulinemia and
impaired glucose
tolerance (IGT), with
increases in post-prandial
glucose concentrations.
Most patients stay at this
level for a considerable
time with excess insulin
produced just matching
the blood glucose levels.
However, in time b- cells
begin to fail and are
unable to produce
sufficient insulin to
stabilize the raised blood
glucose, type-II diabetes
is developed.
Studies lean toward existence of both insulin
resistance and insulin deficiency in most NIDDM
patients, because a moderate degree of insulin
resistance is not sufficient to cause NIDDM.
From Insulin Resistance to Type-II Diabetes
18
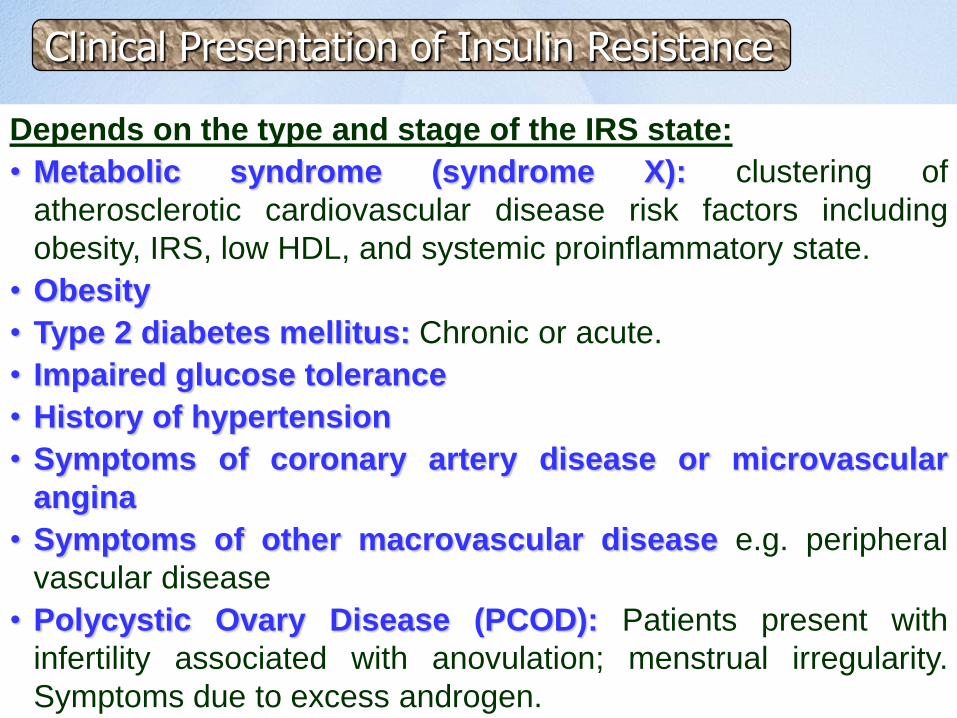
Depends on the type and stage of the IRS state:
• Metabolic syndrome (syndrome X): clustering of
atherosclerotic cardiovascular disease risk factors including
obesity, IRS, low HDL, and systemic proinflammatory state.
• Obesity
• Type 2 diabetes mellitus: Chronic or acute.
• Impaired glucose tolerance
• History of hypertension
• Symptoms of coronary artery disease or microvascular
angina
• Symptoms of other macrovascular disease e.g. peripheral
vascular disease
• Polycystic Ovary Disease (PCOD): Patients present with
infertility associated with anovulation; menstrual irregularity.
Symptoms due to excess androgen.
Clinical Presentation of Insulin Resistance
19
Hereditary: includes mutations of insulin receptor, glucose transporter, and
signaling proteins.
Acquired: includes physical inactivity, diet, medications, hyperglycemia
(glucose toxicity), increased free fatty acids, and aging process.
The underlying causes of insulin-resistant states can be categorized as follows:
Prereceptor
Abnormal insulin (mutations)
Anti-insulin antibodies
Receptor
Decreased number of receptors, mainly failure to activate tyrosine kinase
Reduced binding of insulin
Insulin receptor mutations
Insulin receptor–blocking antibodies
Postreceptor
Defective signal transduction
Combinations of defects are common. Obesity is associated mainly with
postreceptor abnormality and also decreased number of insulin receptors.
“Obesity is the most common cause of insulin resistance”
Causes of Insulin Resistance
20
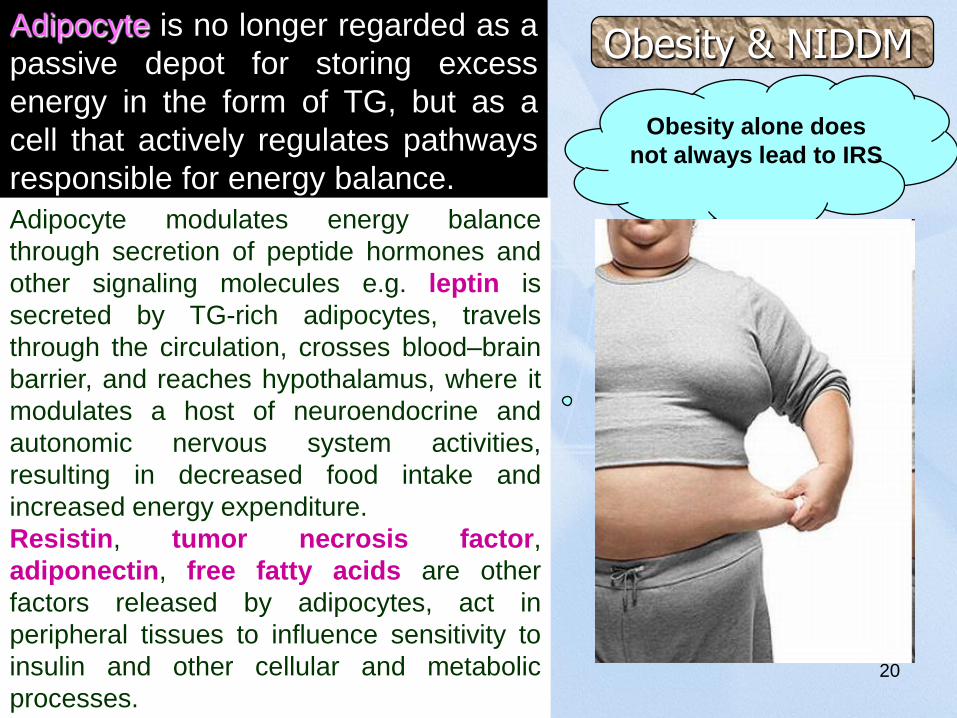
Adipocyte is no longer regarded as a
passive depot for storing excess
energy in the form of TG, but as a
cell that actively regulates pathways
responsible for energy balance.
Obesity alone does
not always lead to IRS
Obesity & NIDDM
Adipocyte modulates energy balance
through secretion of peptide hormones and
other signaling molecules e.g. leptin is
secreted by TG-rich adipocytes, travels
through the circulation, crosses blood–brain
barrier, and reaches hypothalamus, where it
modulates a host of neuroendocrine and
autonomic nervous system activities,
resulting in decreased food intake and
increased energy expenditure.
Resistin, tumor necrosis factor,
adiponectin, free fatty acids are other
factors released by adipocytes, act in
peripheral tissues to influence sensitivity to
insulin and other cellular and metabolic
processes.

21
References:
• Clinical Biochemistry: An illustrated colour text, A. Gaw et al., Churchill
Livingstone.
• Clinical Chemistry, W.J. Marshall, Mosby.
• Clinical Chemistry: Interpretation and Techniques, A. Kaplan & L.L. Szabo, Lea
& Febiger, Philadelphia.
• Fundamentals of Clinical Chemistry, N.W. Tietz, W.B., Saunders Company,
Philadelphia, London, Tokyo….
• Clinical Biochemistry, A.F. Smith, G.J. Beckett, S.W. Walker & P.W. H Rae,
Blackwell Science Ltd, London…
• Interpretation of Diagnostic Tests, I. Wallach, Little, brown & Company, Boston,
London…..
• Practical Clinical Biochemistry, H. Varley, A.H. Gowenlock & M. Bell, William
Heinemann Medical Books LTD, London
22