Embed Size (px)
Citation preview
369
15 ANTARES neutrino telescope and deep-sea observatory
V. Bertin1, J. Brunner1, J. Carr1, P. Coyle1, C. Curtil1, J-J. Destelle1, A. Deschamps2, S. Escoffier1, K. Graf 3, C. Gojak4, J. Hößl3, R. Lahmann3, D. Lefèvre5, C. Lévèque6, C. Tamburini5, J-P. Schuller7 and H. van Haren8
ANTARES Collaboration9
15.1 Introduction
The ANTARES detector consists of a multidisciplinary undersea observatory associated with a neutrino telescope. The neutrino telescope, with 12 mooring lines holding light de-tectors, was completed in May 2008 and is destined for research in the field of astroparticle physics, in particular in neutrino astronomy. Instruments for research in marine and Earth
1 CPPM − Centre de Physique des Particules de Marseille, CNRS/IN2P3 et Université de la Méditerranée, Marseille, France2 GéoAzur, CNRS/INSU, IRD, Université de Nice Sophia Antipolis, Observatoire de la Côte d’Azur, Sophia Antipolis, France 3 ECAP − Erlangen Centre for Astroparticle Physics, Erlangen, Germany 4 DT INSU, Division Technique de l’INSU, La Seyne sur Mer Cedex, France5 Aix Marseille Université, CNRS, Université de Toulon, IRD, MIO UM 110, 13288, Marseille, France 6 IFREMER, La Seyne-sur-mer Cedex, France 7 Direction des Sciences de la Matière − Institut de Recherche sur les lois Fondamentales de l’Univers, Gif-sur-Yvette, France8 Royal Netherlands Institute for Sea Research (NIOZ), Den Burg, the Netherlands9 The results presented in this chapter are the work of the whole ANTARES Collaboration whose members are given in Ageron et al., (2009).
370 37115.3 Technical description of neutrino telescope and observatoryANTARES neutrino telescope and deep-sea observatory
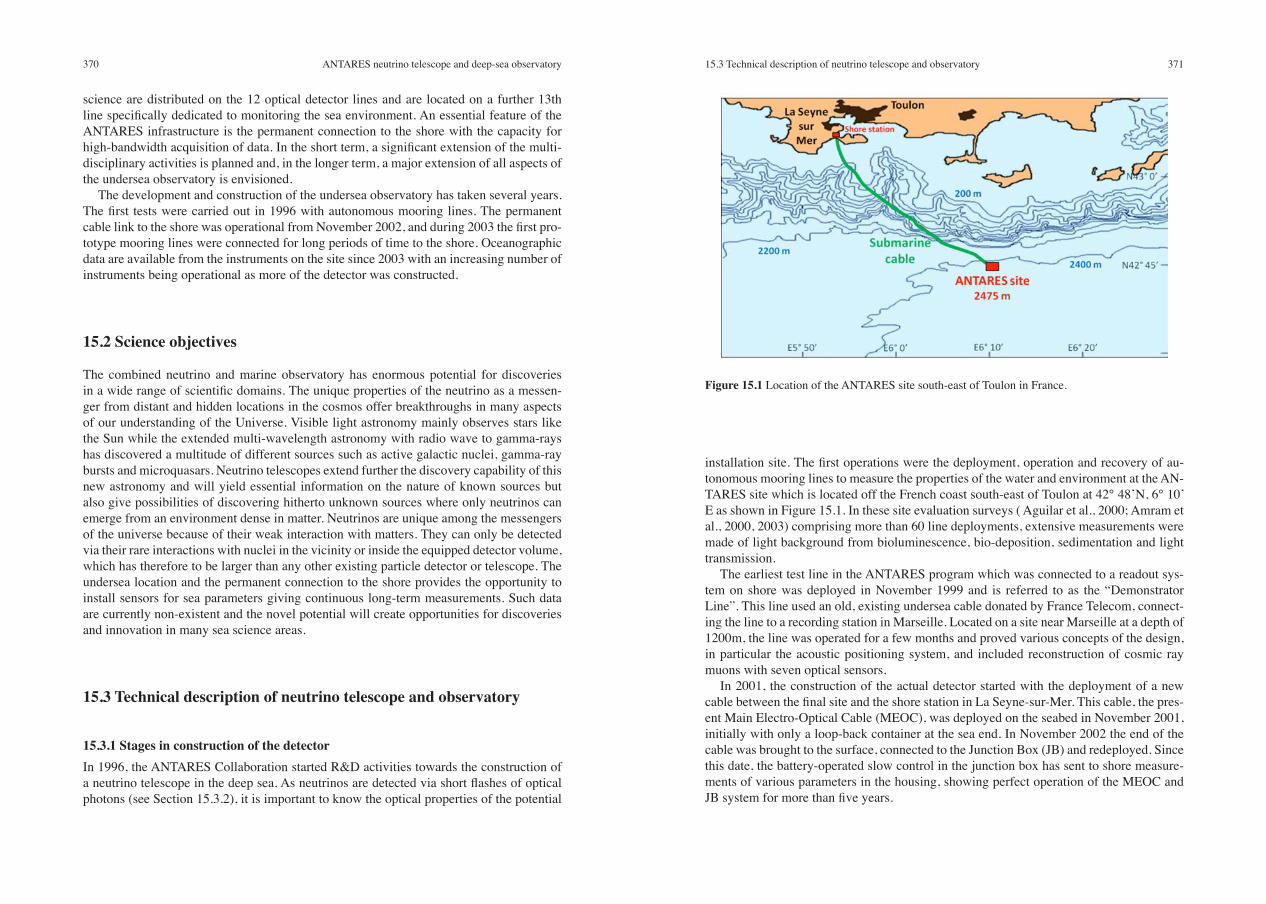
installation site. The first operations were the deployment, operation and recovery of au-tonomous mooring lines to measure the properties of the water and environment at the AN-TARES site which is located off the French coast south-east of Toulon at 42° 48’N, 6° 10’ E as shown in Figure 15.1. In these site evaluation surveys ( Aguilar et al., 2000; Amram et al., 2000, 2003) comprising more than 60 line deployments, extensive measurements were made of light background from bioluminescence, bio-deposition, sedimentation and light transmission.
The earliest test line in the ANTARES program which was connected to a readout sys-tem on shore was deployed in November 1999 and is referred to as the “Demonstrator Line”. This line used an old, existing undersea cable donated by France Telecom, connect-ing the line to a recording station in Marseille. Located on a site near Marseille at a depth of 1200m, the line was operated for a few months and proved various concepts of the design, in particular the acoustic positioning system, and included reconstruction of cosmic ray muons with seven optical sensors.
In 2001, the construction of the actual detector started with the deployment of a new cable between the final site and the shore station in La Seyne-sur-Mer. This cable, the pres-ent Main Electro-Optical Cable (MEOC), was deployed on the seabed in November 2001, initially with only a loop-back container at the sea end. In November 2002 the end of the cable was brought to the surface, connected to the Junction Box (JB) and redeployed. Since this date, the battery-operated slow control in the junction box has sent to shore measure-ments of various parameters in the housing, showing perfect operation of the MEOC and JB system for more than five years.
science are distributed on the 12 optical detector lines and are located on a further 13th line specifically dedicated to monitoring the sea environment. An essential feature of the ANTARES infrastructure is the permanent connection to the shore with the capacity for high-bandwidth acquisition of data. In the short term, a significant extension of the multi-disciplinary activities is planned and, in the longer term, a major extension of all aspects of the undersea observatory is envisioned.
The development and construction of the undersea observatory has taken several years. The first tests were carried out in 1996 with autonomous mooring lines. The permanent cable link to the shore was operational from November 2002, and during 2003 the first pro-totype mooring lines were connected for long periods of time to the shore. Oceanographic data are available from the instruments on the site since 2003 with an increasing number of instruments being operational as more of the detector was constructed.
15.2 Science objectives
The combined neutrino and marine observatory has enormous potential for discoveries in a wide range of scientific domains. The unique properties of the neutrino as a messen-ger from distant and hidden locations in the cosmos offer breakthroughs in many aspects of our understanding of the Universe. Visible light astronomy mainly observes stars like the Sun while the extended multi-wavelength astronomy with radio wave to gamma-rays has discovered a multitude of different sources such as active galactic nuclei, gamma-ray bursts and microquasars. Neutrino telescopes extend further the discovery capability of this new astronomy and will yield essential information on the nature of known sources but also give possibilities of discovering hitherto unknown sources where only neutrinos can emerge from an environment dense in matter. Neutrinos are unique among the messengers of the universe because of their weak interaction with matters. They can only be detected via their rare interactions with nuclei in the vicinity or inside the equipped detector volume, which has therefore to be larger than any other existing particle detector or telescope. The undersea location and the permanent connection to the shore provides the opportunity to install sensors for sea parameters giving continuous long-term measurements. Such data are currently non-existent and the novel potential will create opportunities for discoveries and innovation in many sea science areas.
15.3 Technical description of neutrino telescope and observatory
15.3.1 Stages in construction of the detectorIn 1996, the ANTARES Collaboration started R&D activities towards the construction of a neutrino telescope in the deep sea. As neutrinos are detected via short flashes of optical photons (see Section 15.3.2), it is important to know the optical properties of the potential
Figure 15.1 Location of the ANTARES site south-east of Toulon in France.
372 37315.3 Technical description of neutrino telescope and observatoryANTARES neutrino telescope and deep-sea observatory
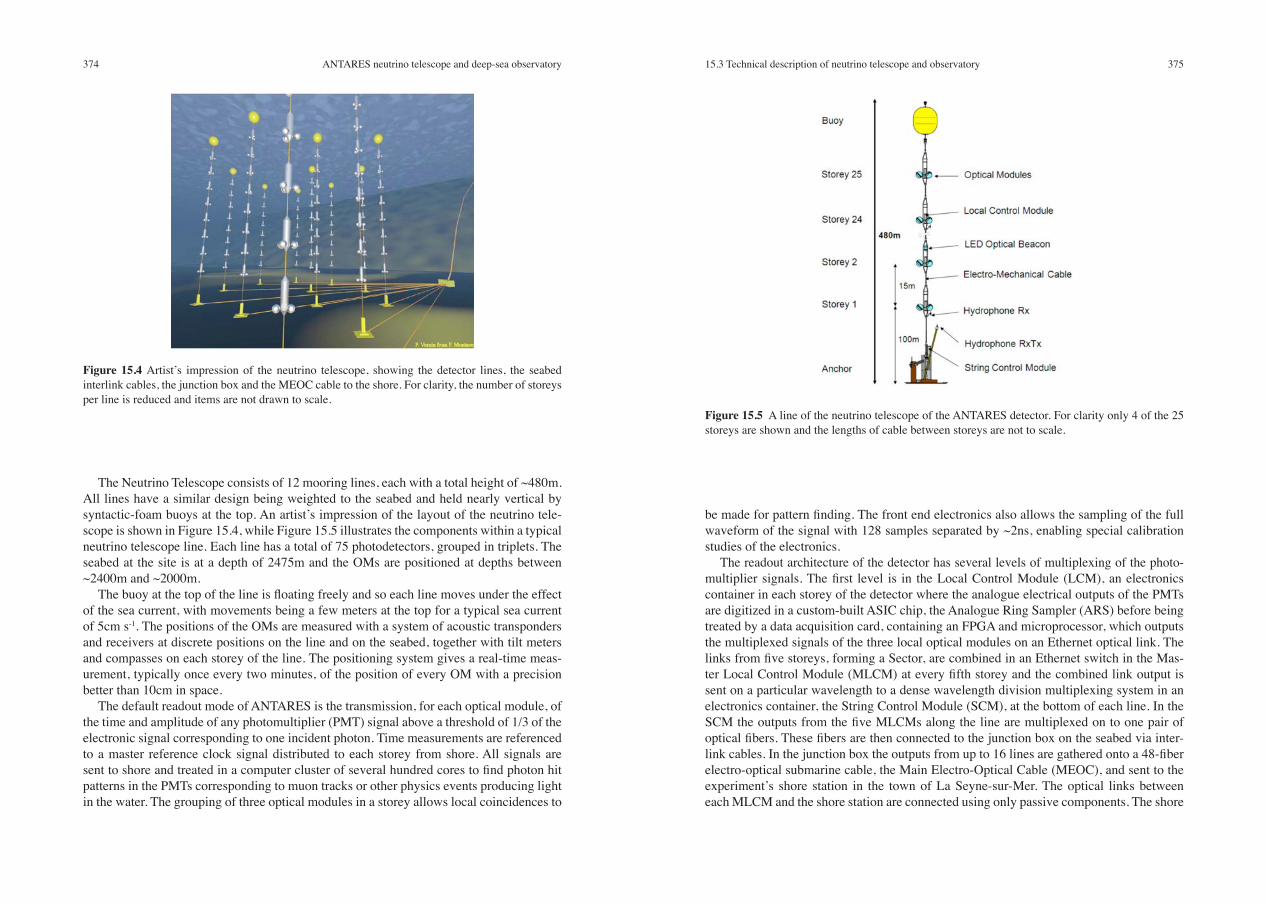
15.3.2 Design of the neutrino telescope A deep sea neutrino telescope detects neutrinos by observing the Cherenkov light produced by muons crossing the detector. These muons originate from rare interactions of neutrinos in the sea water around the detector or in the rock below it. A matrix of light detectors, in the form of photomultipliers in glass spheres – optical modules (OM) (Aguilar et al., 2006) – is deployed near the seabed. The trajectory of the muon track is reconstructed from the detection timing of the Cherenkov photons as well as from the positions of the photodetec-tors. The signal from Cherenkov photons occurs within a time window of few microsec-onds, which helps to distinguish it from various background light sources which exhibit correlations only on much larger time scales. An indirect search for neutrinos can then be performed by selecting the upward-going muons produced by neutrinos which have passed through the entire planet and interacted in the vicinity of the detector. The direction of the incoming neutrino, being almost collinear with the secondary muon, can be determined with an accuracy reaching 0.2° for high energy neutrinos above 10 TeV. Due to its size and the spacing of the photomultipliers, the ANTARES detector has a low energy threshold of ~20 GeV for reconstructed neutrinos. The “effective area” (equivalent area for a telescope with 100% neutrino detection efficiency) increases strongly with the neutrino energy and reaches ~1m2 for PeV energy neutrinos. Figure 15.3 illustrates the principle of neutrino detection with the undersea telescope.
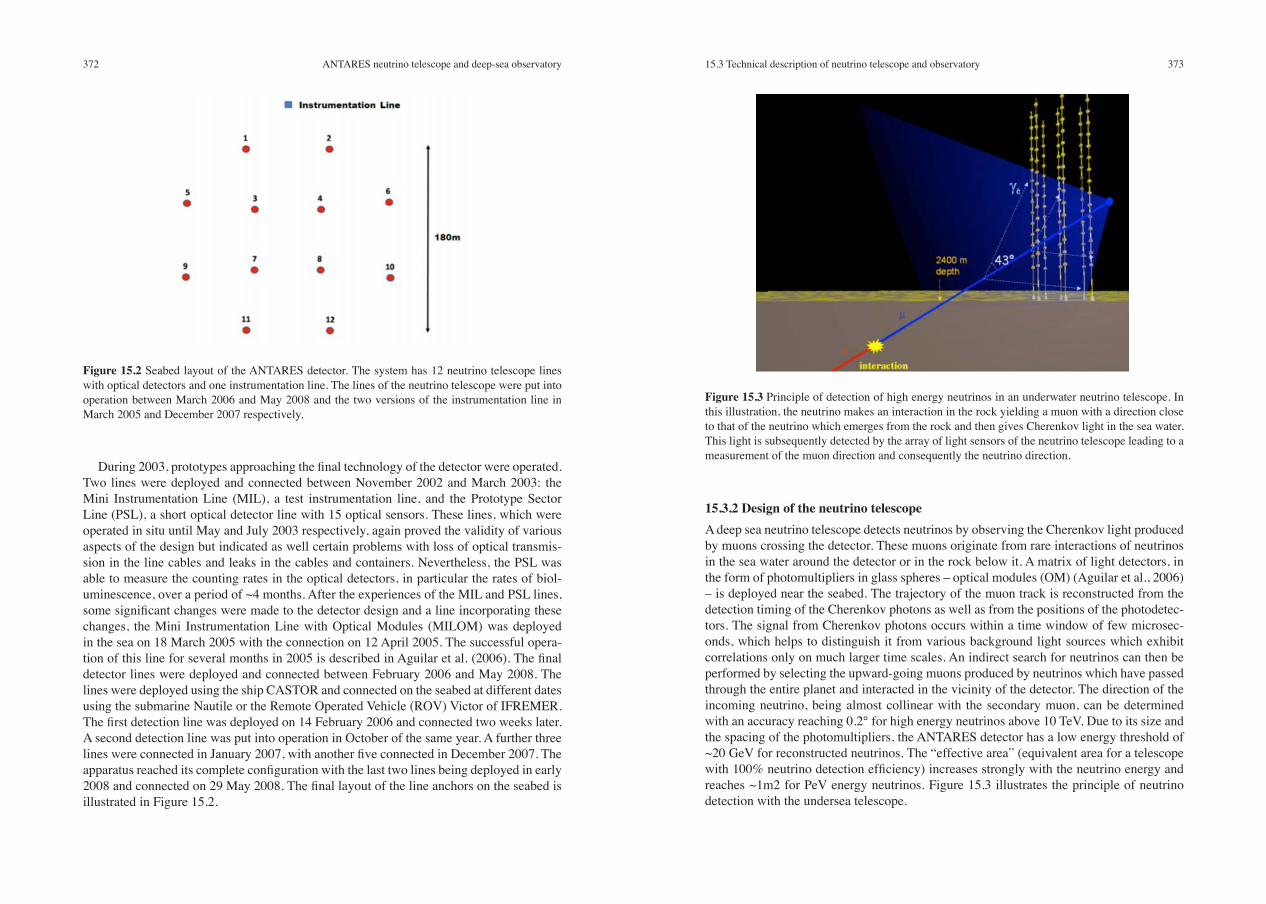
During 2003, prototypes approaching the final technology of the detector were operated. Two lines were deployed and connected between November 2002 and March 2003: the Mini Instrumentation Line (MIL), a test instrumentation line, and the Prototype Sector Line (PSL), a short optical detector line with 15 optical sensors. These lines, which were operated in situ until May and July 2003 respectively, again proved the validity of various aspects of the design but indicated as well certain problems with loss of optical transmis-sion in the line cables and leaks in the cables and containers. Nevertheless, the PSL was able to measure the counting rates in the optical detectors, in particular the rates of biol- uminescence, over a period of ~4 months. After the experiences of the MIL and PSL lines, some significant changes were made to the detector design and a line incorporating these changes, the Mini Instrumentation Line with Optical Modules (MILOM) was deployed in the sea on 18 March 2005 with the connection on 12 April 2005. The successful opera-tion of this line for several months in 2005 is described in Aguilar et al. (2006). The final detector lines were deployed and connected between February 2006 and May 2008. The lines were deployed using the ship CASTOR and connected on the seabed at different dates using the submarine Nautile or the Remote Operated Vehicle (ROV) Victor of IFREMER. The first detection line was deployed on 14 February 2006 and connected two weeks later. A second detection line was put into operation in October of the same year. A further three lines were connected in January 2007, with another five connected in December 2007. The apparatus reached its complete configuration with the last two lines being deployed in early 2008 and connected on 29 May 2008. The final layout of the line anchors on the seabed is illustrated in Figure 15.2.
Figure 15.2 Seabed layout of the ANTARES detector. The system has 12 neutrino telescope lines with optical detectors and one instrumentation line. The lines of the neutrino telescope were put into operation between March 2006 and May 2008 and the two versions of the instrumentation line in March 2005 and December 2007 respectively.
Figure 15.3 Principle of detection of high energy neutrinos in an underwater neutrino telescope. In this illustration, the neutrino makes an interaction in the rock yielding a muon with a direction close to that of the neutrino which emerges from the rock and then gives Cherenkov light in the sea water. This light is subsequently detected by the array of light sensors of the neutrino telescope leading to a measurement of the muon direction and consequently the neutrino direction.
374 37515.3 Technical description of neutrino telescope and observatoryANTARES neutrino telescope and deep-sea observatory
be made for pattern finding. The front end electronics also allows the sampling of the full waveform of the signal with 128 samples separated by ~2ns, enabling special calibration studies of the electronics.
The readout architecture of the detector has several levels of multiplexing of the photo-multiplier signals. The first level is in the Local Control Module (LCM), an electronics container in each storey of the detector where the analogue electrical outputs of the PMTs are digitized in a custom-built ASIC chip, the Analogue Ring Sampler (ARS) before being treated by a data acquisition card, containing an FPGA and microprocessor, which outputs the multiplexed signals of the three local optical modules on an Ethernet optical link. The links from five storeys, forming a Sector, are combined in an Ethernet switch in the Mas-ter Local Control Module (MLCM) at every fifth storey and the combined link output is sent on a particular wavelength to a dense wavelength division multiplexing system in an electronics container, the String Control Module (SCM), at the bottom of each line. In the SCM the outputs from the five MLCMs along the line are multiplexed on to one pair of optical fibers. These fibers are then connected to the junction box on the seabed via inter-link cables. In the junction box the outputs from up to 16 lines are gathered onto a 48-fiber electro-optical submarine cable, the Main Electro-Optical Cable (MEOC), and sent to the experiment’s shore station in the town of La Seyne-sur-Mer. The optical links between each MLCM and the shore station are connected using only passive components. The shore
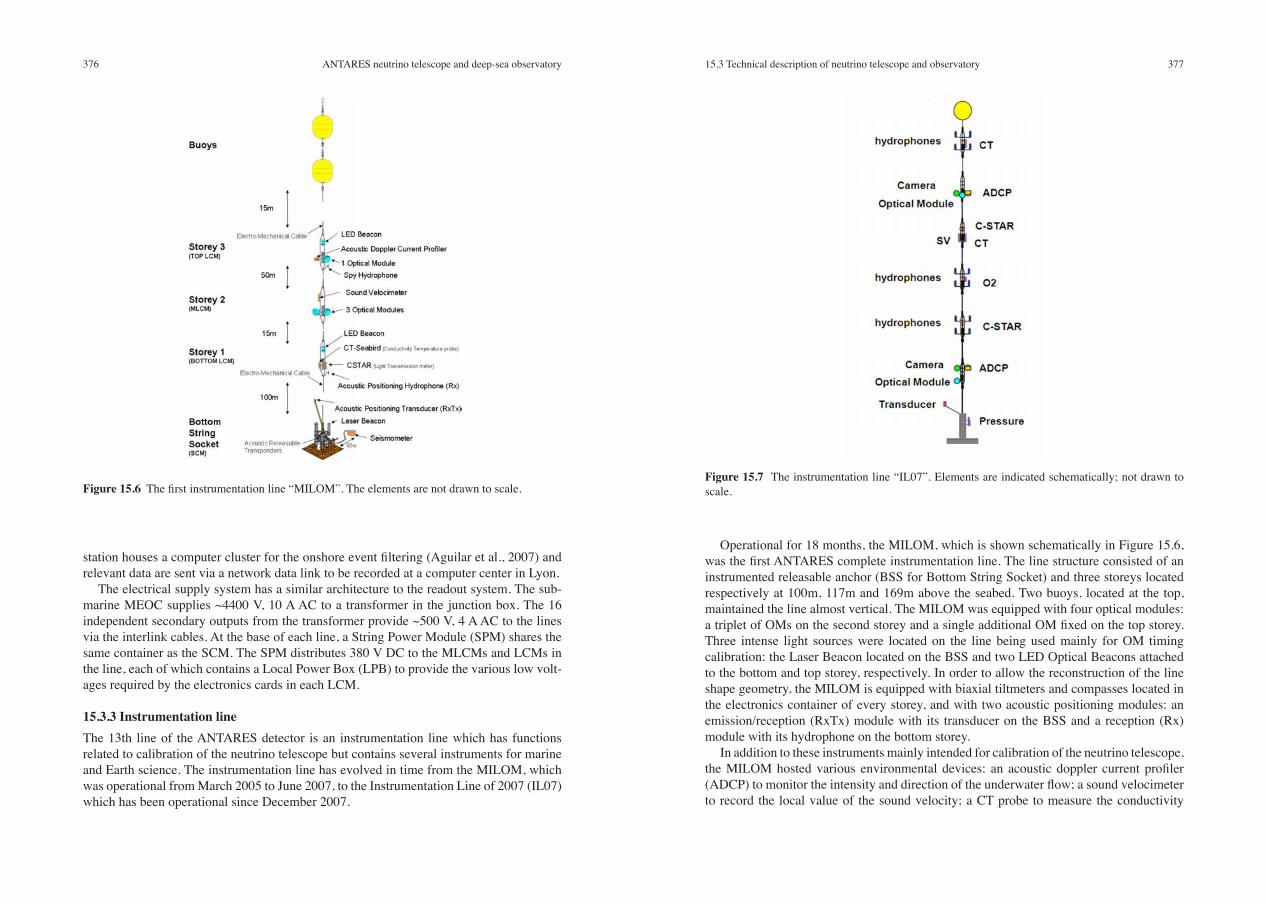
The Neutrino Telescope consists of 12 mooring lines, each with a total height of ~480m. All lines have a similar design being weighted to the seabed and held nearly vertical by syntactic-foam buoys at the top. An artist’s impression of the layout of the neutrino tele-scope is shown in Figure 15.4, while Figure 15.5 illustrates the components within a typical neutrino telescope line. Each line has a total of 75 photodetectors, grouped in triplets. The seabed at the site is at a depth of 2475m and the OMs are positioned at depths between ~2400m and ~2000m.
The buoy at the top of the line is floating freely and so each line moves under the effect of the sea current, with movements being a few meters at the top for a typical sea current of 5cm s-1. The positions of the OMs are measured with a system of acoustic transponders and receivers at discrete positions on the line and on the seabed, together with tilt meters and compasses on each storey of the line. The positioning system gives a real-time meas-urement, typically once every two minutes, of the position of every OM with a precision better than 10cm in space.
The default readout mode of ANTARES is the transmission, for each optical module, of the time and amplitude of any photomultiplier (PMT) signal above a threshold of 1/3 of the electronic signal corresponding to one incident photon. Time measurements are referenced to a master reference clock signal distributed to each storey from shore. All signals are sent to shore and treated in a computer cluster of several hundred cores to find photon hit patterns in the PMTs corresponding to muon tracks or other physics events producing light in the water. The grouping of three optical modules in a storey allows local coincidences to
Figure 15.4 Artist’s impression of the neutrino telescope, showing the detector lines, the seabed interlink cables, the junction box and the MEOC cable to the shore. For clarity, the number of storeys per line is reduced and items are not drawn to scale.
Figure 15.5 A line of the neutrino telescope of the ANTARES detector. For clarity only 4 of the 25 storeys are shown and the lengths of cable between storeys are not to scale.
376 37715.3 Technical description of neutrino telescope and observatoryANTARES neutrino telescope and deep-sea observatory
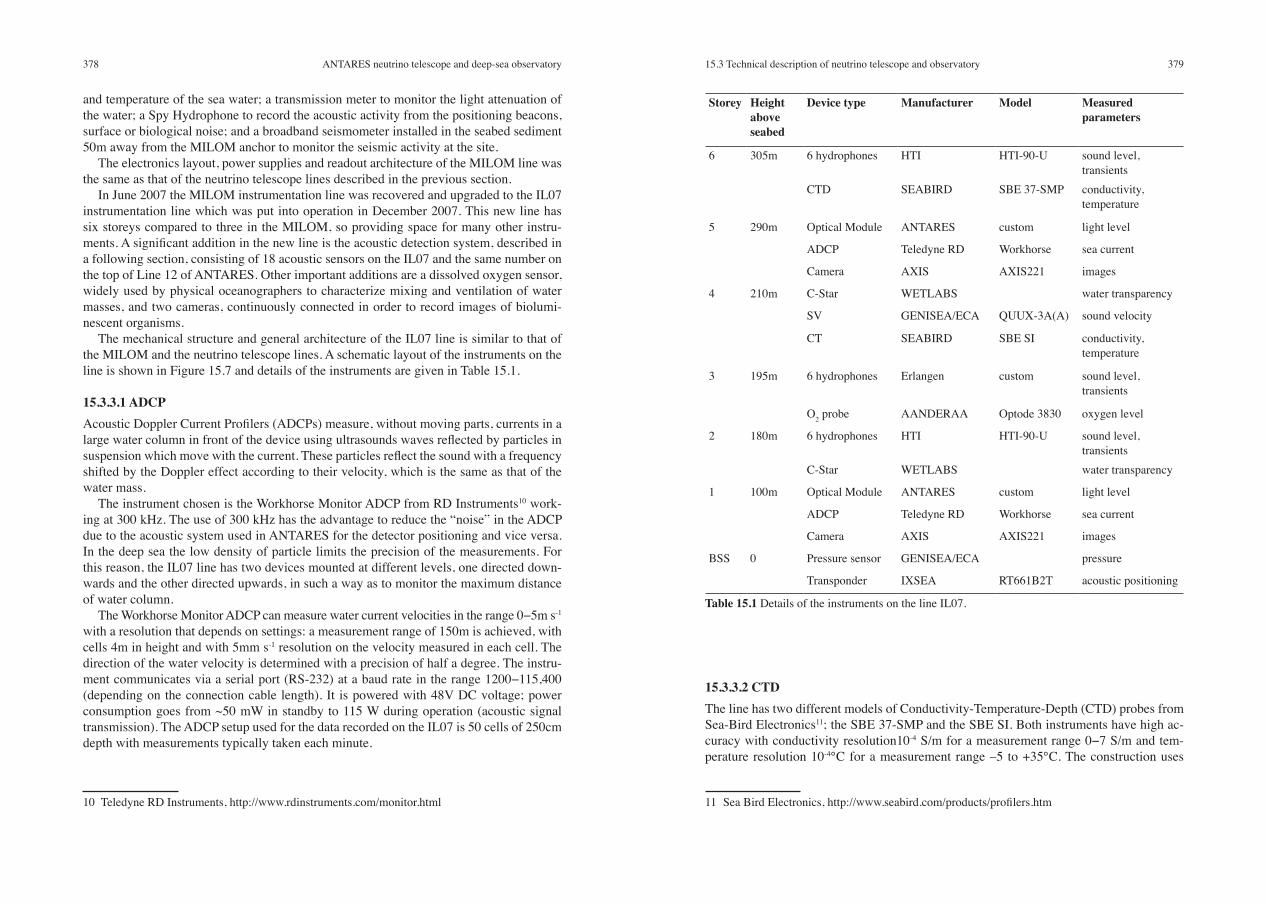
Operational for 18 months, the MILOM, which is shown schematically in Figure 15.6, was the first ANTARES complete instrumentation line. The line structure consisted of an instrumented releasable anchor (BSS for Bottom String Socket) and three storeys located respectively at 100m, 117m and 169m above the seabed. Two buoys, located at the top, maintained the line almost vertical. The MILOM was equipped with four optical modules: a triplet of OMs on the second storey and a single additional OM fixed on the top storey. Three intense light sources were located on the line being used mainly for OM timing calibration: the Laser Beacon located on the BSS and two LED Optical Beacons attached to the bottom and top storey, respectively. In order to allow the reconstruction of the line shape geometry, the MILOM is equipped with biaxial tiltmeters and compasses located in the electronics container of every storey, and with two acoustic positioning modules: an emission/reception (RxTx) module with its transducer on the BSS and a reception (Rx) module with its hydrophone on the bottom storey.
In addition to these instruments mainly intended for calibration of the neutrino telescope, the MILOM hosted various environmental devices: an acoustic doppler current profiler (ADCP) to monitor the intensity and direction of the underwater flow; a sound velocimeter to record the local value of the sound velocity; a CT probe to measure the conductivity
station houses a computer cluster for the onshore event filtering (Aguilar et al., 2007) and relevant data are sent via a network data link to be recorded at a computer center in Lyon.
The electrical supply system has a similar architecture to the readout system. The sub-marine MEOC supplies ~4400 V, 10 A AC to a transformer in the junction box. The 16 independent secondary outputs from the transformer provide ~500 V, 4 A AC to the lines via the interlink cables. At the base of each line, a String Power Module (SPM) shares the same container as the SCM. The SPM distributes 380 V DC to the MLCMs and LCMs in the line, each of which contains a Local Power Box (LPB) to provide the various low volt-ages required by the electronics cards in each LCM.
15.3.3 Instrumentation lineThe 13th line of the ANTARES detector is an instrumentation line which has functions related to calibration of the neutrino telescope but contains several instruments for marine and Earth science. The instrumentation line has evolved in time from the MILOM, which was operational from March 2005 to June 2007, to the Instrumentation Line of 2007 (IL07) which has been operational since December 2007.
Figure 15.6 The first instrumentation line “MILOM”. The elements are not drawn to scale.Figure 15.7 The instrumentation line “IL07”. Elements are indicated schematically; not drawn to scale.
378 37915.3 Technical description of neutrino telescope and observatoryANTARES neutrino telescope and deep-sea observatory
15.3.3.2 CTDThe line has two different models of Conductivity-Temperature-Depth (CTD) probes from Sea-Bird Electronics11; the SBE 37-SMP and the SBE SI. Both instruments have high ac-curacy with conductivity resolution10-4 S/m for a measurement range 0−7 S/m and tem-perature resolution 10-4°C for a measurement range –5 to +35°C. The construction uses
11 Sea Bird Electronics, http://www.seabird.com/products/profilers.htm
and temperature of the sea water; a transmission meter to monitor the light attenuation of the water; a Spy Hydrophone to record the acoustic activity from the positioning beacons, surface or biological noise; and a broadband seismometer installed in the seabed sediment 50m away from the MILOM anchor to monitor the seismic activity at the site.
The electronics layout, power supplies and readout architecture of the MILOM line was the same as that of the neutrino telescope lines described in the previous section.
In June 2007 the MILOM instrumentation line was recovered and upgraded to the IL07 instrumentation line which was put into operation in December 2007. This new line has six storeys compared to three in the MILOM, so providing space for many other instru-ments. A significant addition in the new line is the acoustic detection system, described in a following section, consisting of 18 acoustic sensors on the IL07 and the same number on the top of Line 12 of ANTARES. Other important additions are a dissolved oxygen sensor, widely used by physical oceanographers to characterize mixing and ventilation of water masses, and two cameras, continuously connected in order to record images of biolumi-nescent organisms.
The mechanical structure and general architecture of the IL07 line is similar to that of the MILOM and the neutrino telescope lines. A schematic layout of the instruments on the line is shown in Figure 15.7 and details of the instruments are given in Table 15.1.
15.3.3.1 ADCPAcoustic Doppler Current Profilers (ADCPs) measure, without moving parts, currents in a large water column in front of the device using ultrasounds waves reflected by particles in suspension which move with the current. These particles reflect the sound with a frequency shifted by the Doppler effect according to their velocity, which is the same as that of the water mass.
The instrument chosen is the Workhorse Monitor ADCP from RD Instruments10 work-ing at 300 kHz. The use of 300 kHz has the advantage to reduce the “noise” in the ADCP due to the acoustic system used in ANTARES for the detector positioning and vice versa. In the deep sea the low density of particle limits the precision of the measurements. For this reason, the IL07 line has two devices mounted at different levels, one directed down-wards and the other directed upwards, in such a way as to monitor the maximum distance of water column.
The Workhorse Monitor ADCP can measure water current velocities in the range 0−5m s-1 with a resolution that depends on settings: a measurement range of 150m is achieved, with cells 4m in height and with 5mm s-1 resolution on the velocity measured in each cell. The direction of the water velocity is determined with a precision of half a degree. The instru-ment communicates via a serial port (RS-232) at a baud rate in the range 1200−115,400 (depending on the connection cable length). It is powered with 48V DC voltage; power consumption goes from ~50 mW in standby to 115 W during operation (acoustic signal transmission). The ADCP setup used for the data recorded on the IL07 is 50 cells of 250cm depth with measurements typically taken each minute.
10 Teledyne RD Instruments, http://www.rdinstruments.com/monitor.html
Storey Height above seabed
Device type Manufacturer Model Measuredparameters
6 305m 6 hydrophones HTI HTI-90-U sound level, transients
CTD SEABIRD SBE 37-SMP conductivity, temperature
5 290m Optical Module ANTARES custom light level
ADCP Teledyne RD Workhorse sea current
Camera AXIS AXIS221 images
4 210m C-Star WETLABS water transparency
SV GENISEA/ECA QUUX-3A(A) sound velocity
CT SEABIRD SBE SI conductivity, temperature
3 195m 6 hydrophones Erlangen custom sound level, transients
O2 probe AANDERAA Optode 3830 oxygen level
2 180m 6 hydrophones HTI HTI-90-U sound level, transients
C-Star WETLABS water transparency
1 100m Optical Module ANTARES custom light level
ADCP Teledyne RD Workhorse sea current
Camera AXIS AXIS221 images
BSS 0 Pressure sensor GENISEA/ECA pressure
Transponder IXSEA RT661B2T acoustic positioning
Table 15.1 Details of the instruments on the line IL07.
380 38115.3 Technical description of neutrino telescope and observatoryANTARES neutrino telescope and deep-sea observatory
15.3.3.5 Oxygen monitorThe oxygen monitor on IL07 is an Oxygen Optode model 3830 from AANDERAA14 which is an optical sensor based on dynamic fluorescence quenching. In this device, a specially- designed chemical complex is illuminated with a blue LED and emits in return a red lu-minescent light with a lifetime that directly depends on the oxygen concentration of the medium.
In the Optode the lifetime measurement is made by a phase shift detection of the return-ing red luminescence. The foil is excited with blue-green light modulated at 5 kHz. The decay time is a direct function of the phase of the received red light; it is used directly for oxygen detection, without calculating the decay time.
Unlike electrochemical oxygen measurements, Optode sensors do not consume or re-move oxygen from the water during the measurement. So the measurement does not affect the oxygen concentration of the medium. The oxygen concentration response of this sensor is exponential, yielding highest sensitivity at low concentrations.
The manufacturer’s published performance specifications for the Aanderaa Optodes are: range 0−500µM (concentration) and 0−120% (air saturations); resolution <1µM (concen-tration) and 0.4% (air saturation); accuracy <8µM or 5% (whichever is greater, concentra-tion) and <5% (air saturation); response time <25 seconds.
The sampling rate of the Optode on IL07 storey 3 is typically one measurement every 4 minutes.
15.3.3.6 Camera Since 1996, many studies have been done to estimate the optical background level on the ANTARES site and more specifically the bioluminescence contribution (Amram et al., 2000). The early measurements found the background rates to be fully satisfactory for the detector operation; however, during the first year of running the detector, at the beginning of 2006, an unexpected bioluminescence activity was seen by the Optical Modules of the ANTARES detector. This phenomenon is known to be episodic; however, the biological sciences community began to take a great interest in it, since deep waters are expected to be relatively poor in living organisms. As a result, it was decided to connect two cameras on the IL07 line in order to record some living bioluminescent organisms. This system is expected to be able to detect the organisms which lead to the bursts of bioluminescence seen in Figure 15.25 but not the bioluminescence contribution to the baseline.
The installation uses very different concepts to observe deep sea bioluminescence com-pared to conventional methods using submarines or landers which have a rather short ob-servation window. The following features characterize the camera installation on the IL07:
• integrated image treatment
• self-triggering
• permanent 100 Mbit/sec link to the shore
• more than 2000m below sea surface.
14 AANDERAA, http://www.aadi.no/Aanderaa/Products/Sensors/OxygenOptode/default.aspx.
titanium and other non-corroding materials to ensure long lifetime with minimum main- tenance, making the devices perfect for long duration, fixed site deployment. Conductivity is measured in an “internal-field conductivity cell” that, according to SBE, is unaffected by external fouling and permits the use of anti-fouling devices to inhibit internal fouling. Temperature and conductivity measurements are very stable in time (DC ~ 3 10-4 S/m per month, DT ~ 2 10-4°C per month). The devices are powered with 12V DC.
For the CT on IL07 – storey 4, the sampling rate is typically of one measurement each hour, while for the CTD on IL07 – storey 6 and the CTD connected on Line 4 – storey 24, the sampling rate is typically of one measurement every 2 minutes.
15.3.3.3 Sound velocimeterThe IL07 line uses the same model of sound velocity probes as the neutrino telescope lines which are principally intended for the calibration of the acoustic positioning system. The devices are model QUUX-3A (A) manufactured by the GENISEA Company12. This device has a titanium case rated for 6000m depths and is suitable for long-term resistance to corrosion. It performs underwater measurements of sound speed velocity in the range 1400−1600m s-1 with an accuracy of 0.1m s-1.
All the sound velocimeters have a sampling rate typically of one measurement every 2 minutes.
15.3.3.4 Water transmissionWater optical properties are monitored by measuring the water attenuation coefficient with two C-STAR instruments built by WetLabs13. The light attenuation coefficient c is calculat-ed by the transfer equation: T = e-cx where x is the path length (25cm) of the water volume measured.
In the C-STAR, an LED light source provides light that is focused and collimated by an aperture and lens that transmit the light within a given narrow bandwidth. The light passes through a beam splitter where part of the light is monitored by a reference detector and used in a feedback circuit to take into account the variations in the LED source in time or the variation in the instrument’s internal temperature. The remaining light enters the sam-ple volume after passing through a first pressure window, transits the sample volume and enters the receiver part after passing through another pressure window. The light passes through additional focusing optics to be finally measured by a silicon photodiode detector which converts the amount of received light to a corresponding 0–5 V analogue output signal proportional to the amount of light received.
The instruments used in IL07 have monolithic housings in hard anodized aluminium, rated for 6000m depth. The devices are mounted horizontally with both pressure windows protected from biofouling by the housings. The overall dimensions of the devices are 47 × 6.4 × 9.3cm.
Data from the C-STAR have been available from April 2009 and have a sampling rate of one measurement every 10 minutes.
12 GENISEA/ECA, http://pagesperso-orange.fr/genisea/sound_velocimeter.htm.13 WET Labs, http://www.wetlabs.com/products/cstar/cstar.htm.
382 38315.3 Technical description of neutrino telescope and observatoryANTARES neutrino telescope and deep-sea observatory
This combination makes these cameras unique in the world. The image treatment and self-triggering enables the cameras to activate themselves on the faintest bioluminescence flashes by avoiding storing mostly uniformly-black images. The permanent link ensures access to the camera and uploading of images and movie sequences in real time. No other system with similar features has been installed at such a depth so far.
The cameras are standard video surveillance devices (model AXIS 221), designed for low light levels. Their sensitivity is found to be better than 10-5 lux. Many parameters of the cameras can be tuned remotely, such as the exposure time and the trigger level. Due to their large viewing angle (90 degrees) they cover several cubic meters of water around them. Currently, both cameras operate with an exposure time of only 0.1 seconds, sufficiently short to register movies.
The cameras are protected from sea water and pressure by a glass sphere as used also for the ANTARES photomultipliers. Together which each camera an optical module with an active photomultiplier has been installed to allow correlating image sequences with photo-multiplier signals. The self-triggering system controls an adjacent light source designed to illuminate the scene after an interesting event triggers the camera. Due to the vicinity of the neutrino telescope which is sensitive to very low light levels only infrared light sources could be used in the present installation.
The acoustic detection devices are explained in Sections 15.3.5 and 15.3.6.
15.3.3.7 Oceanographic instruments on neutrino telescope linesAs well as the instruments on the IL07 line, there are several other sensors installed on the standard neutrino telescope lines: a seismograph (Guralp) on line 12; an oxygen analyser (IODA) on line 12; a current meter Aquadopp from Nortek15 on line 5 and a SV-CTD sen-sor (from GENISEA and FSI) on line 4. All these devices are located within 100m of IL07.
15.3.3.8 Mounting of instruments on linesAll instruments mounted on the instrumentation line are fixed to the same mechanical structure designed for optical module mounting. Figure 15.10 shows storey 1 of the MI-LOM line holding a pressure sensor and a C-Star and Figure 15.11 shows storey 3 of the same line holding the ADCP and an optical module. The instruments on the IL07 line are mounted in the same way and Figure 15.19 gives a sketch of the mounting frame holding hydrophones.
15.3.4 Other instruments in a deep-sea observatory
15.3.4.1 Deep-IODA6000
Quantifying organic matter re-mineralization along the whole water column is essential for assessing the role of the micro-organisms in the global carbon cycle in relation to global change. The AOU, derived from in situ temperature, salinity and oxygen measurements, provides an integrated time scale of months to years for oxygen consumption; however, to
15 NORTEK http://www.nortek-as.com/products/CurrentMeter/aquadopp-3d-current-meter.
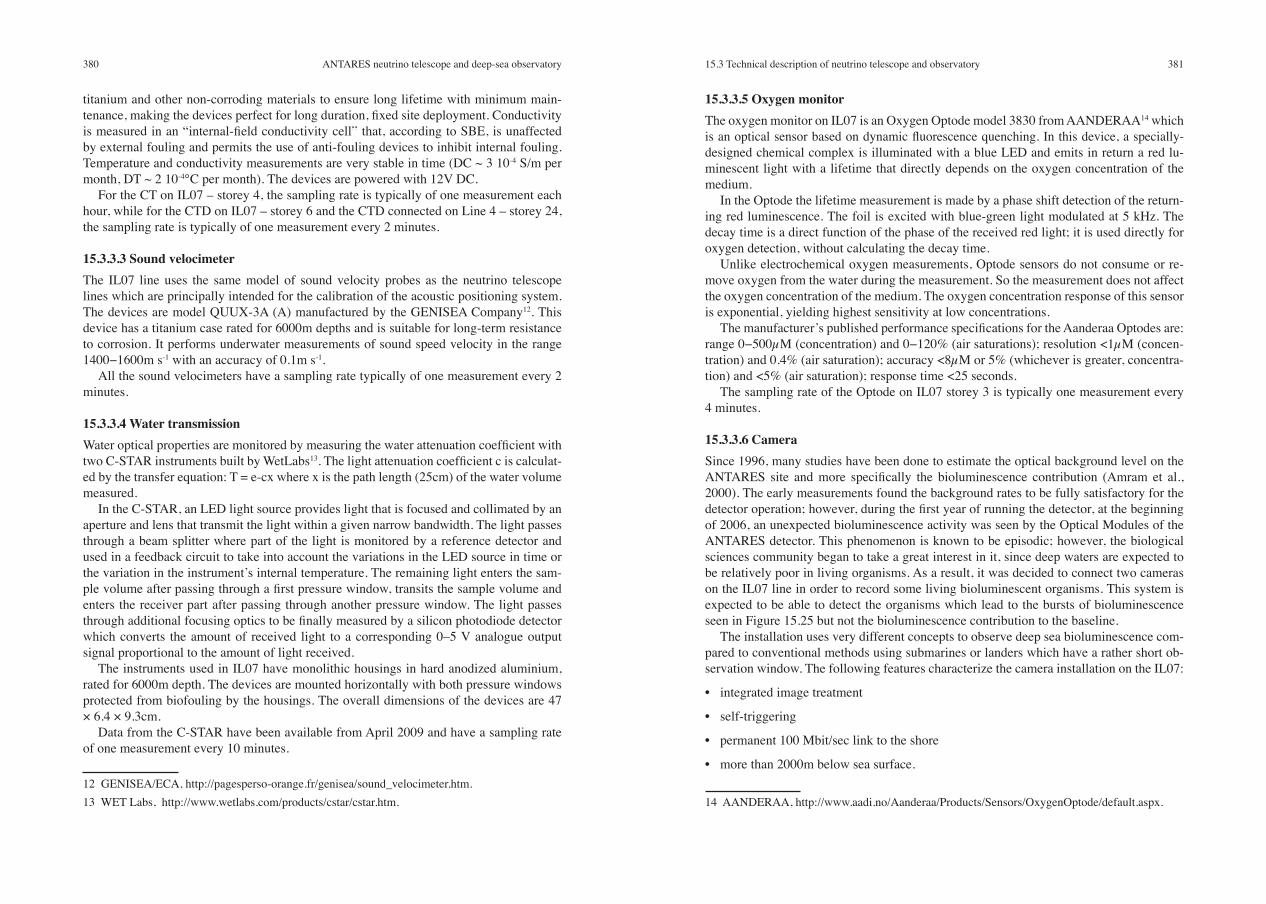
Figure 15.8 Storey 5 of IL07 during deployment, an ADCP (yellow) photomulptiplier (foreground) and a sphere with the camera (background) are visible.
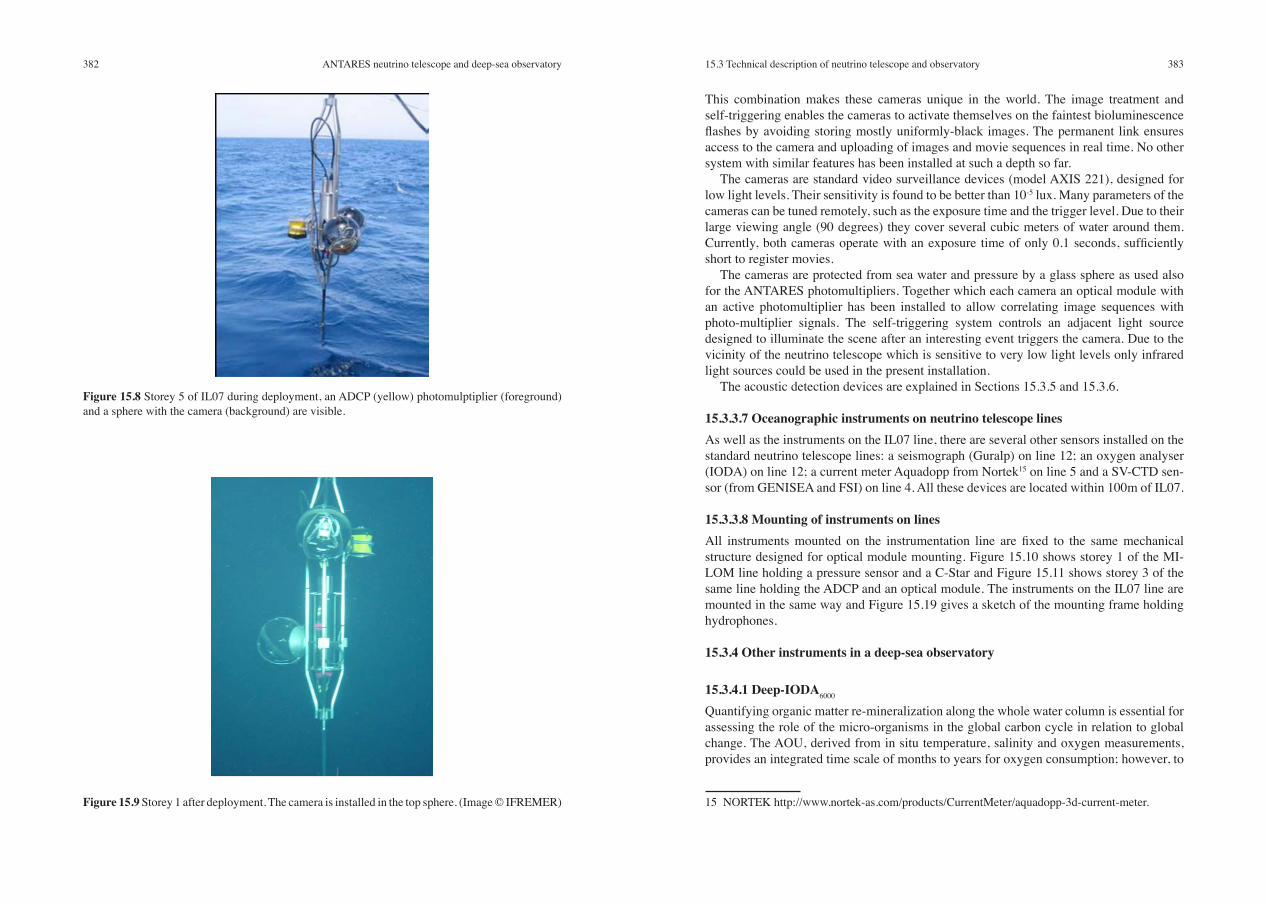
Figure 15.9 Storey 1 after deployment. The camera is installed in the top sphere. (Image © IFREMER)
384 38515.3 Technical description of neutrino telescope and observatoryANTARES neutrino telescope and deep-sea observatory
constrain the biological activity it is necessary to assess different time scales using comple-mentary approaches for oxygen dynamics.
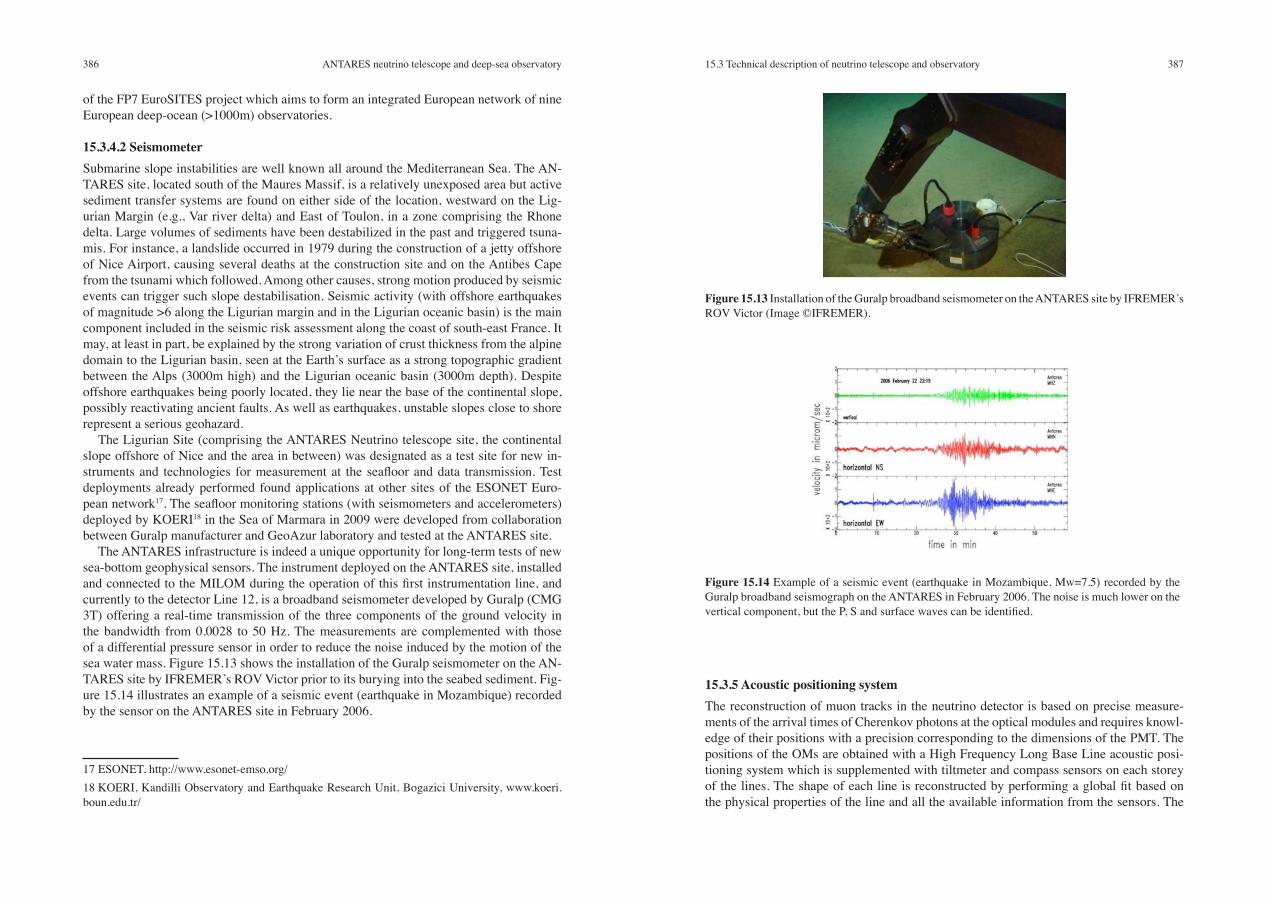
For this purpose, a new instrument has been developed, the in situ Oxygen Dynamic Auto-sampler (IODA6000)
16. Shown in Figure 15.12, the IODA6000 consists of an equipres-sure system which aims to measure the oxygen concentration and the oxygen dynamics in shallow or deep waters, up to 6000m depth. IODA6000 consists of a 5L-chamber in poly-carbonate equipped with an internal Aanderaa Optode that samples the seawater by a slow rotation. The seawater sample is enclosed between two Versilic® mats during a period of time (between 12 hours and 5 days according to the biological activity) in order to measure the oxygen dynamics (consumption in the deep waters; consumption and production in sur-face waters). All the mechanical and electronics parts are mounted in silicon oil so as to be in equipressure with the external environment. An external Aanderaa Optode is also fitted on the IODA6000 in order to assess to the time integrated biological activity. A prototype version (IODA6000 v4.0) has been deployed with the ANTARES line 12 in the framework
16 K. Arnaud, S. Beurthey, M. Billault, D. Lefèvre, P. Payre, A. Robert, C. Tamburini, APO ANR POTES, 05-BLAN-0161-01.
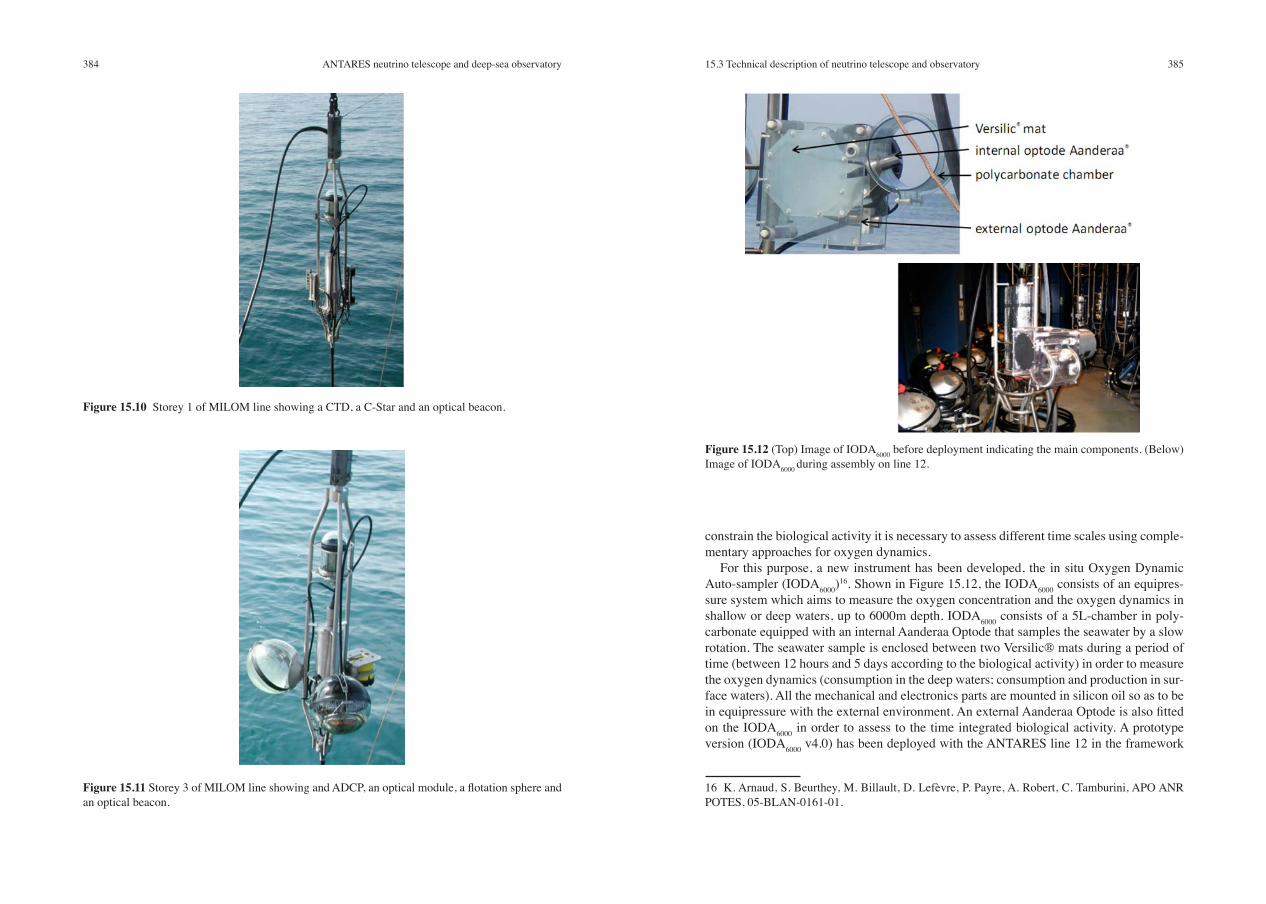
Figure 15.10 Storey 1 of MILOM line showing a CTD, a C-Star and an optical beacon.
Figure 15.11 Storey 3 of MILOM line showing and ADCP, an optical module, a flotation sphere and an optical beacon.
Figure 15.12 (Top) Image of IODA6000 before deployment indicating the main components. (Below) Image of IODA6000 during assembly on line 12.
386 38715.3 Technical description of neutrino telescope and observatoryANTARES neutrino telescope and deep-sea observatory
15.3.5 Acoustic positioning systemThe reconstruction of muon tracks in the neutrino detector is based on precise measure-ments of the arrival times of Cherenkov photons at the optical modules and requires knowl-edge of their positions with a precision corresponding to the dimensions of the PMT. The positions of the OMs are obtained with a High Frequency Long Base Line acoustic posi-tioning system which is supplemented with tiltmeter and compass sensors on each storey of the lines. The shape of each line is reconstructed by performing a global fit based on the physical properties of the line and all the available information from the sensors. The
of the FP7 EuroSITES project which aims to form an integrated European network of nine European deep-ocean (>1000m) observatories.
15.3.4.2 SeismometerSubmarine slope instabilities are well known all around the Mediterranean Sea. The AN-TARES site, located south of the Maures Massif, is a relatively unexposed area but active sediment transfer systems are found on either side of the location, westward on the Lig-urian Margin (e.g., Var river delta) and East of Toulon, in a zone comprising the Rhone delta. Large volumes of sediments have been destabilized in the past and triggered tsuna-mis. For instance, a landslide occurred in 1979 during the construction of a jetty offshore of Nice Airport, causing several deaths at the construction site and on the Antibes Cape from the tsunami which followed. Among other causes, strong motion produced by seismic events can trigger such slope destabilisation. Seismic activity (with offshore earthquakes of magnitude >6 along the Ligurian margin and in the Ligurian oceanic basin) is the main component included in the seismic risk assessment along the coast of south-east France. It may, at least in part, be explained by the strong variation of crust thickness from the alpine domain to the Ligurian basin, seen at the Earth’s surface as a strong topographic gradient between the Alps (3000m high) and the Ligurian oceanic basin (3000m depth). Despite offshore earthquakes being poorly located, they lie near the base of the continental slope, possibly reactivating ancient faults. As well as earthquakes, unstable slopes close to shore represent a serious geohazard.
The Ligurian Site (comprising the ANTARES Neutrino telescope site, the continental slope offshore of Nice and the area in between) was designated as a test site for new in-struments and technologies for measurement at the seafloor and data transmission. Test deployments already performed found applications at other sites of the ESONET Euro-pean network17. The seafloor monitoring stations (with seismometers and accelerometers) deployed by KOERI18 in the Sea of Marmara in 2009 were developed from collaboration between Guralp manufacturer and GeoAzur laboratory and tested at the ANTARES site.
The ANTARES infrastructure is indeed a unique opportunity for long-term tests of new sea-bottom geophysical sensors. The instrument deployed on the ANTARES site, installed and connected to the MILOM during the operation of this first instrumentation line, and currently to the detector Line 12, is a broadband seismometer developed by Guralp (CMG 3T) offering a real-time transmission of the three components of the ground velocity in the bandwidth from 0.0028 to 50 Hz. The measurements are complemented with those of a differential pressure sensor in order to reduce the noise induced by the motion of the sea water mass. Figure 15.13 shows the installation of the Guralp seismometer on the AN- TARES site by IFREMER’s ROV Victor prior to its burying into the seabed sediment. Fig-ure 15.14 illustrates an example of a seismic event (earthquake in Mozambique) recorded by the sensor on the ANTARES site in February 2006.
17 ESONET, http://www.esonet-emso.org/18 KOERI, Kandilli Observatory and Earthquake Research Unit, Bogazici University, www.koeri.boun.edu.tr/
Figure 15.13 Installation of the Guralp broadband seismometer on the ANTARES site by IFREMER’s ROV Victor (Image ©IFREMER).
Figure 15.14 Example of a seismic event (earthquake in Mozambique, Mw=7.5) recorded by the Guralp broadband seismograph on the ANTARES in February 2006. The noise is much lower on the vertical component, but the P, S and surface waves can be identified.
388 38915.3 Technical description of neutrino telescope and observatoryANTARES neutrino telescope and deep-sea observatory
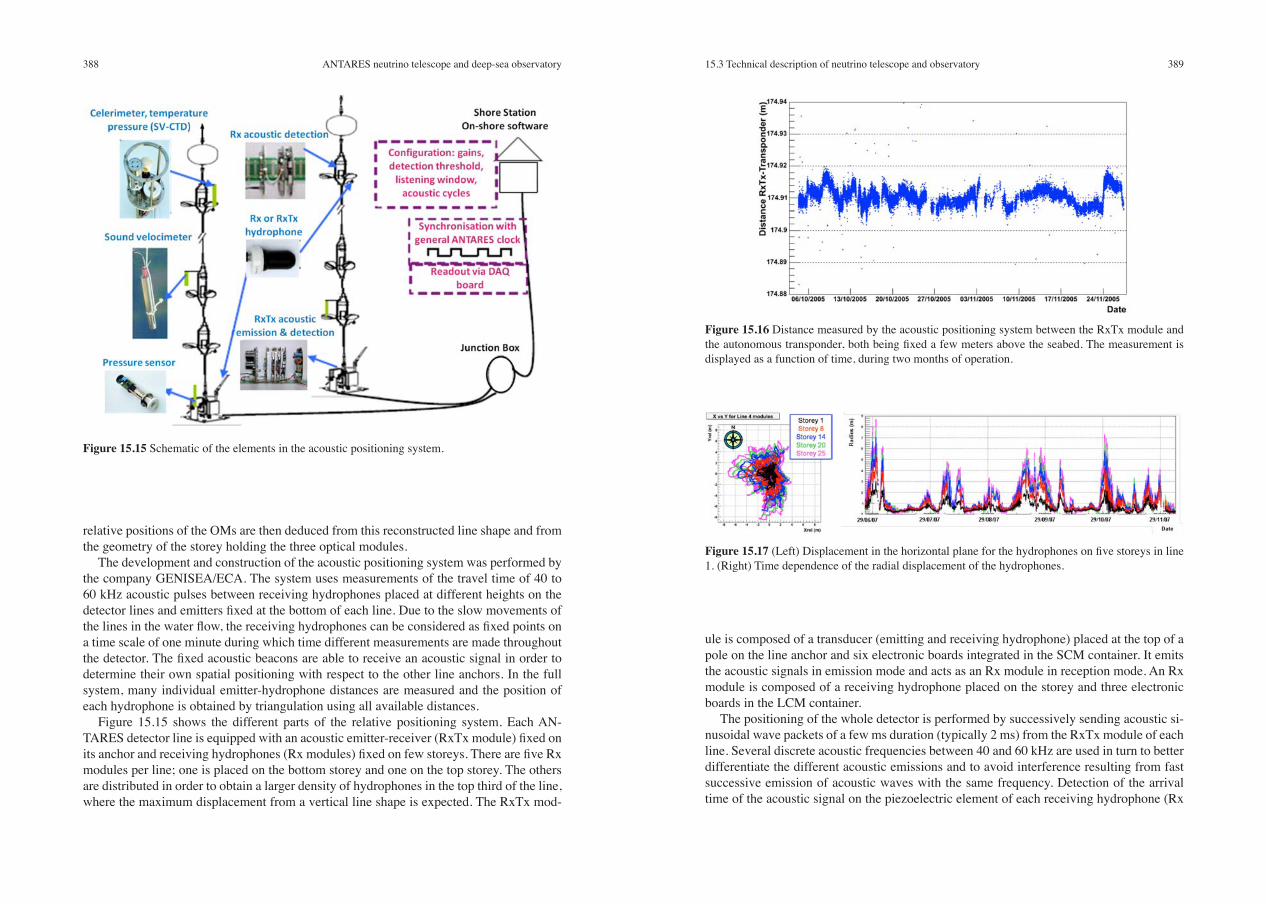
ule is composed of a transducer (emitting and receiving hydrophone) placed at the top of a pole on the line anchor and six electronic boards integrated in the SCM container. It emits the acoustic signals in emission mode and acts as an Rx module in reception mode. An Rx module is composed of a receiving hydrophone placed on the storey and three electronic boards in the LCM container.
The positioning of the whole detector is performed by successively sending acoustic si-nusoidal wave packets of a few ms duration (typically 2 ms) from the RxTx module of each line. Several discrete acoustic frequencies between 40 and 60 kHz are used in turn to better differentiate the different acoustic emissions and to avoid interference resulting from fast successive emission of acoustic waves with the same frequency. Detection of the arrival time of the acoustic signal on the piezoelectric element of each receiving hydrophone (Rx
relative positions of the OMs are then deduced from this reconstructed line shape and from the geometry of the storey holding the three optical modules.
The development and construction of the acoustic positioning system was performed by the company GENISEA/ECA. The system uses measurements of the travel time of 40 to 60 kHz acoustic pulses between receiving hydrophones placed at different heights on the detector lines and emitters fixed at the bottom of each line. Due to the slow movements of the lines in the water flow, the receiving hydrophones can be considered as fixed points on a time scale of one minute during which time different measurements are made throughout the detector. The fixed acoustic beacons are able to receive an acoustic signal in order to determine their own spatial positioning with respect to the other line anchors. In the full system, many individual emitter-hydrophone distances are measured and the position of each hydrophone is obtained by triangulation using all available distances.
Figure 15.15 shows the different parts of the relative positioning system. Each AN- TARES detector line is equipped with an acoustic emitter-receiver (RxTx module) fixed on its anchor and receiving hydrophones (Rx modules) fixed on few storeys. There are five Rx modules per line; one is placed on the bottom storey and one on the top storey. The others are distributed in order to obtain a larger density of hydrophones in the top third of the line, where the maximum displacement from a vertical line shape is expected. The RxTx mod-
Figure 15.15 Schematic of the elements in the acoustic positioning system.
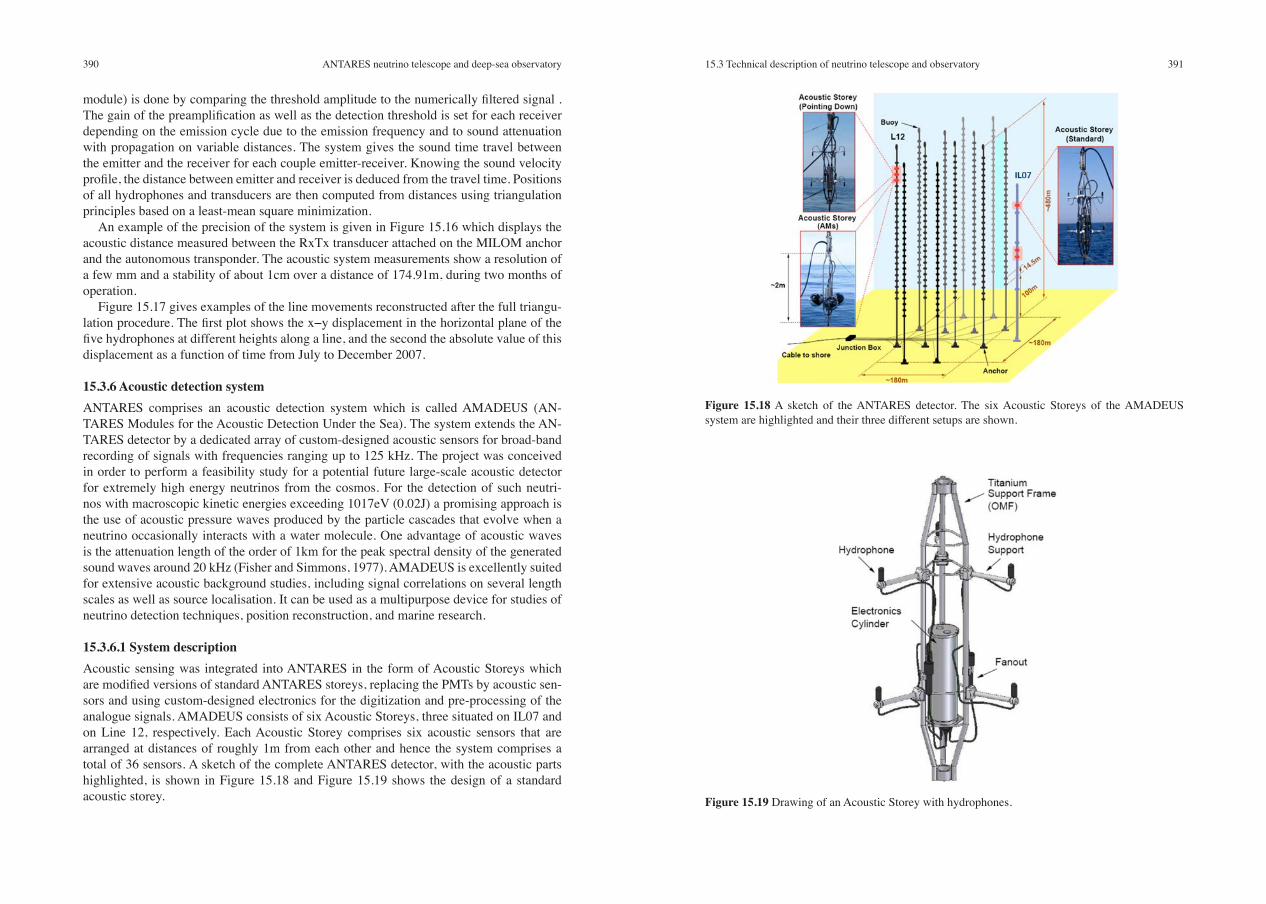
Figure 15.16 Distance measured by the acoustic positioning system between the RxTx module and the autonomous transponder, both being fixed a few meters above the seabed. The measurement is displayed as a function of time, during two months of operation.
Figure 15.17 (Left) Displacement in the horizontal plane for the hydrophones on five storeys in line 1. (Right) Time dependence of the radial displacement of the hydrophones.
390 39115.3 Technical description of neutrino telescope and observatoryANTARES neutrino telescope and deep-sea observatory
module) is done by comparing the threshold amplitude to the numerically filtered signal . The gain of the preamplification as well as the detection threshold is set for each receiver depending on the emission cycle due to the emission frequency and to sound attenuation with propagation on variable distances. The system gives the sound time travel between the emitter and the receiver for each couple emitter-receiver. Knowing the sound velocity profile, the distance between emitter and receiver is deduced from the travel time. Positions of all hydrophones and transducers are then computed from distances using triangulation principles based on a least-mean square minimization.
An example of the precision of the system is given in Figure 15.16 which displays the acoustic distance measured between the RxTx transducer attached on the MILOM anchor and the autonomous transponder. The acoustic system measurements show a resolution of a few mm and a stability of about 1cm over a distance of 174.91m, during two months of operation.
Figure 15.17 gives examples of the line movements reconstructed after the full triangu-lation procedure. The first plot shows the x−y displacement in the horizontal plane of the five hydrophones at different heights along a line, and the second the absolute value of this displacement as a function of time from July to December 2007.
15.3.6 Acoustic detection systemANTARES comprises an acoustic detection system which is called AMADEUS (AN-TARES Modules for the Acoustic Detection Under the Sea). The system extends the AN-TARES detector by a dedicated array of custom-designed acoustic sensors for broad-band recording of signals with frequencies ranging up to 125 kHz. The project was conceived in order to perform a feasibility study for a potential future large-scale acoustic detector for extremely high energy neutrinos from the cosmos. For the detection of such neutri-nos with macroscopic kinetic energies exceeding 1017eV (0.02J) a promising approach is the use of acoustic pressure waves produced by the particle cascades that evolve when a neutrino occasionally interacts with a water molecule. One advantage of acoustic waves is the attenuation length of the order of 1km for the peak spectral density of the generated sound waves around 20 kHz (Fisher and Simmons, 1977). AMADEUS is excellently suited for extensive acoustic background studies, including signal correlations on several length scales as well as source localisation. It can be used as a multipurpose device for studies of neutrino detection techniques, position reconstruction, and marine research.
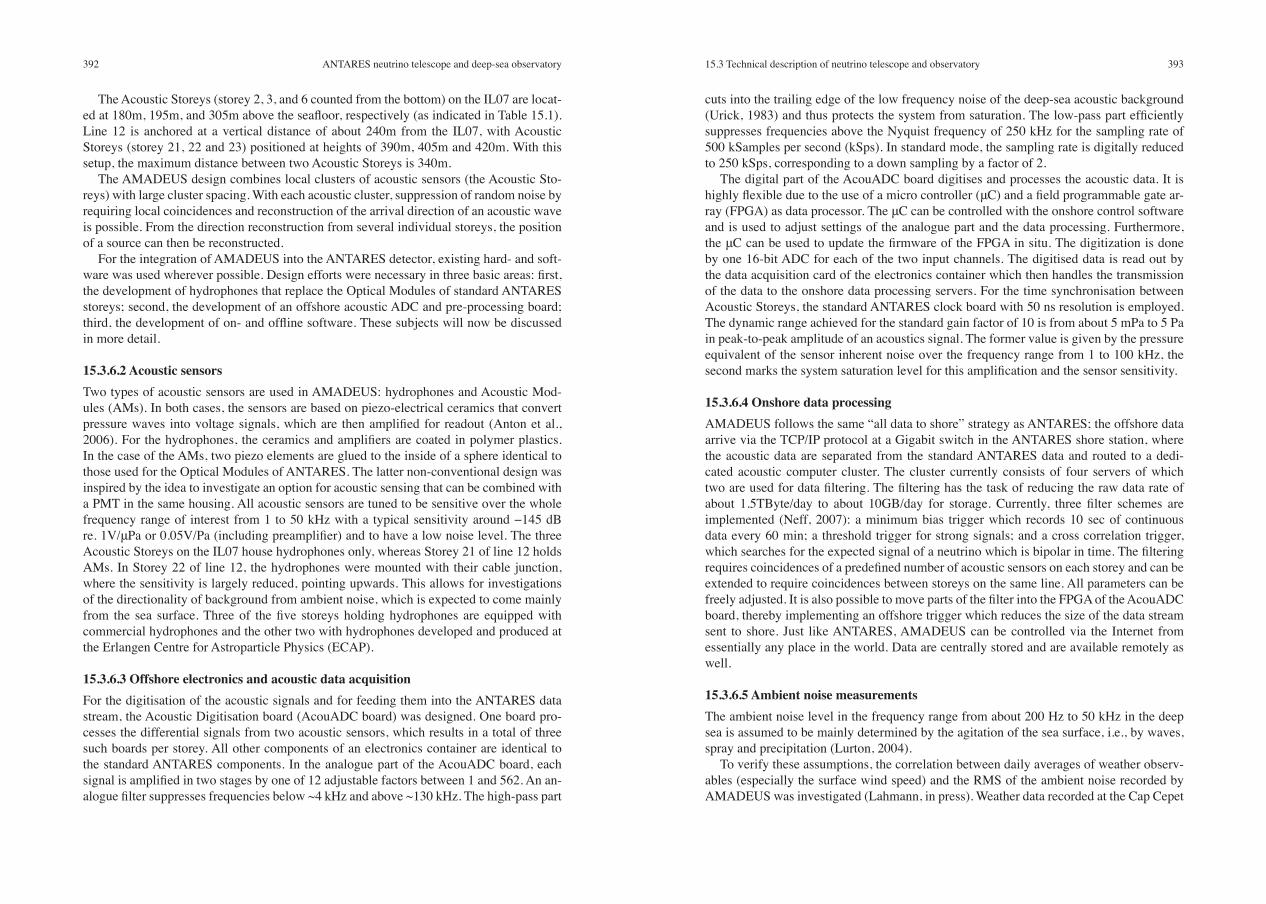
15.3.6.1 System descriptionAcoustic sensing was integrated into ANTARES in the form of Acoustic Storeys which are modified versions of standard ANTARES storeys, replacing the PMTs by acoustic sen-sors and using custom-designed electronics for the digitization and pre-processing of the analogue signals. AMADEUS consists of six Acoustic Storeys, three situated on IL07 and on Line 12, respectively. Each Acoustic Storey comprises six acoustic sensors that are arranged at distances of roughly 1m from each other and hence the system comprises a total of 36 sensors. A sketch of the complete ANTARES detector, with the acoustic parts highlighted, is shown in Figure 15.18 and Figure 15.19 shows the design of a standard acoustic storey.
Figure 15.18 A sketch of the ANTARES detector. The six Acoustic Storeys of the AMADEUS system are highlighted and their three different setups are shown.
Figure 15.19 Drawing of an Acoustic Storey with hydrophones.
392 39315.3 Technical description of neutrino telescope and observatoryANTARES neutrino telescope and deep-sea observatory
cuts into the trailing edge of the low frequency noise of the deep-sea acoustic background (Urick, 1983) and thus protects the system from saturation. The low-pass part efficiently suppresses frequencies above the Nyquist frequency of 250 kHz for the sampling rate of 500 kSamples per second (kSps). In standard mode, the sampling rate is digitally reduced to 250 kSps, corresponding to a down sampling by a factor of 2.
The digital part of the AcouADC board digitises and processes the acoustic data. It is highly flexible due to the use of a micro controller (μC) and a field programmable gate ar-ray (FPGA) as data processor. The μC can be controlled with the onshore control software and is used to adjust settings of the analogue part and the data processing. Furthermore, the μC can be used to update the firmware of the FPGA in situ. The digitization is done by one 16-bit ADC for each of the two input channels. The digitised data is read out by the data acquisition card of the electronics container which then handles the transmission of the data to the onshore data processing servers. For the time synchronisation between Acoustic Storeys, the standard ANTARES clock board with 50 ns resolution is employed. The dynamic range achieved for the standard gain factor of 10 is from about 5 mPa to 5 Pa in peak-to-peak amplitude of an acoustics signal. The former value is given by the pressure equivalent of the sensor inherent noise over the frequency range from 1 to 100 kHz, the second marks the system saturation level for this amplification and the sensor sensitivity.
15.3.6.4 Onshore data processingAMADEUS follows the same “all data to shore” strategy as ANTARES; the offshore data arrive via the TCP/IP protocol at a Gigabit switch in the ANTARES shore station, where the acoustic data are separated from the standard ANTARES data and routed to a dedi-cated acoustic computer cluster. The cluster currently consists of four servers of which two are used for data filtering. The filtering has the task of reducing the raw data rate of about 1.5TByte/day to about 10GB/day for storage. Currently, three filter schemes are implemented (Neff, 2007): a minimum bias trigger which records 10 sec of continuous data every 60 min; a threshold trigger for strong signals; and a cross correlation trigger, which searches for the expected signal of a neutrino which is bipolar in time. The filtering requires coincidences of a predefined number of acoustic sensors on each storey and can be extended to require coincidences between storeys on the same line. All parameters can be freely adjusted. It is also possible to move parts of the filter into the FPGA of the AcouADC board, thereby implementing an offshore trigger which reduces the size of the data stream sent to shore. Just like ANTARES, AMADEUS can be controlled via the Internet from essentially any place in the world. Data are centrally stored and are available remotely as well.
15.3.6.5 Ambient noise measurementsThe ambient noise level in the frequency range from about 200 Hz to 50 kHz in the deep sea is assumed to be mainly determined by the agitation of the sea surface, i.e., by waves, spray and precipitation (Lurton, 2004).
To verify these assumptions, the correlation between daily averages of weather observ-ables (especially the surface wind speed) and the RMS of the ambient noise recorded by AMADEUS was investigated (Lahmann, in press). Weather data recorded at the Cap Cepet
The Acoustic Storeys (storey 2, 3, and 6 counted from the bottom) on the IL07 are locat-ed at 180m, 195m, and 305m above the seafloor, respectively (as indicated in Table 15.1). Line 12 is anchored at a vertical distance of about 240m from the IL07, with Acoustic Storeys (storey 21, 22 and 23) positioned at heights of 390m, 405m and 420m. With this setup, the maximum distance between two Acoustic Storeys is 340m.
The AMADEUS design combines local clusters of acoustic sensors (the Acoustic Sto-reys) with large cluster spacing. With each acoustic cluster, suppression of random noise by requiring local coincidences and reconstruction of the arrival direction of an acoustic wave is possible. From the direction reconstruction from several individual storeys, the position of a source can then be reconstructed.
For the integration of AMADEUS into the ANTARES detector, existing hard- and soft-ware was used wherever possible. Design efforts were necessary in three basic areas: first, the development of hydrophones that replace the Optical Modules of standard ANTARES storeys; second, the development of an offshore acoustic ADC and pre-processing board; third, the development of on- and offline software. These subjects will now be discussed in more detail.
15.3.6.2 Acoustic sensorsTwo types of acoustic sensors are used in AMADEUS: hydrophones and Acoustic Mod-ules (AMs). In both cases, the sensors are based on piezo-electrical ceramics that convert pressure waves into voltage signals, which are then amplified for readout (Anton et al., 2006). For the hydrophones, the ceramics and amplifiers are coated in polymer plastics. In the case of the AMs, two piezo elements are glued to the inside of a sphere identical to those used for the Optical Modules of ANTARES. The latter non-conventional design was inspired by the idea to investigate an option for acoustic sensing that can be combined with a PMT in the same housing. All acoustic sensors are tuned to be sensitive over the whole frequency range of interest from 1 to 50 kHz with a typical sensitivity around −145 dB re. 1V/μPa or 0.05V/Pa (including preamplifier) and to have a low noise level. The three Acoustic Storeys on the IL07 house hydrophones only, whereas Storey 21 of line 12 holds AMs. In Storey 22 of line 12, the hydrophones were mounted with their cable junction, where the sensitivity is largely reduced, pointing upwards. This allows for investigations of the directionality of background from ambient noise, which is expected to come mainly from the sea surface. Three of the five storeys holding hydrophones are equipped with commercial hydrophones and the other two with hydrophones developed and produced at the Erlangen Centre for Astroparticle Physics (ECAP).
15.3.6.3 Offshore electronics and acoustic data acquisitionFor the digitisation of the acoustic signals and for feeding them into the ANTARES data stream, the Acoustic Digitisation board (AcouADC board) was designed. One board pro-cesses the differential signals from two acoustic sensors, which results in a total of three such boards per storey. All other components of an electronics container are identical to the standard ANTARES components. In the analogue part of the AcouADC board, each signal is amplified in two stages by one of 12 adjustable factors between 1 and 562. An an-alogue filter suppresses frequencies below ~4 kHz and above ~130 kHz. The high-pass part
394 39515.4 Sample data from ANTARES detectorANTARES neutrino telescope and deep-sea observatory
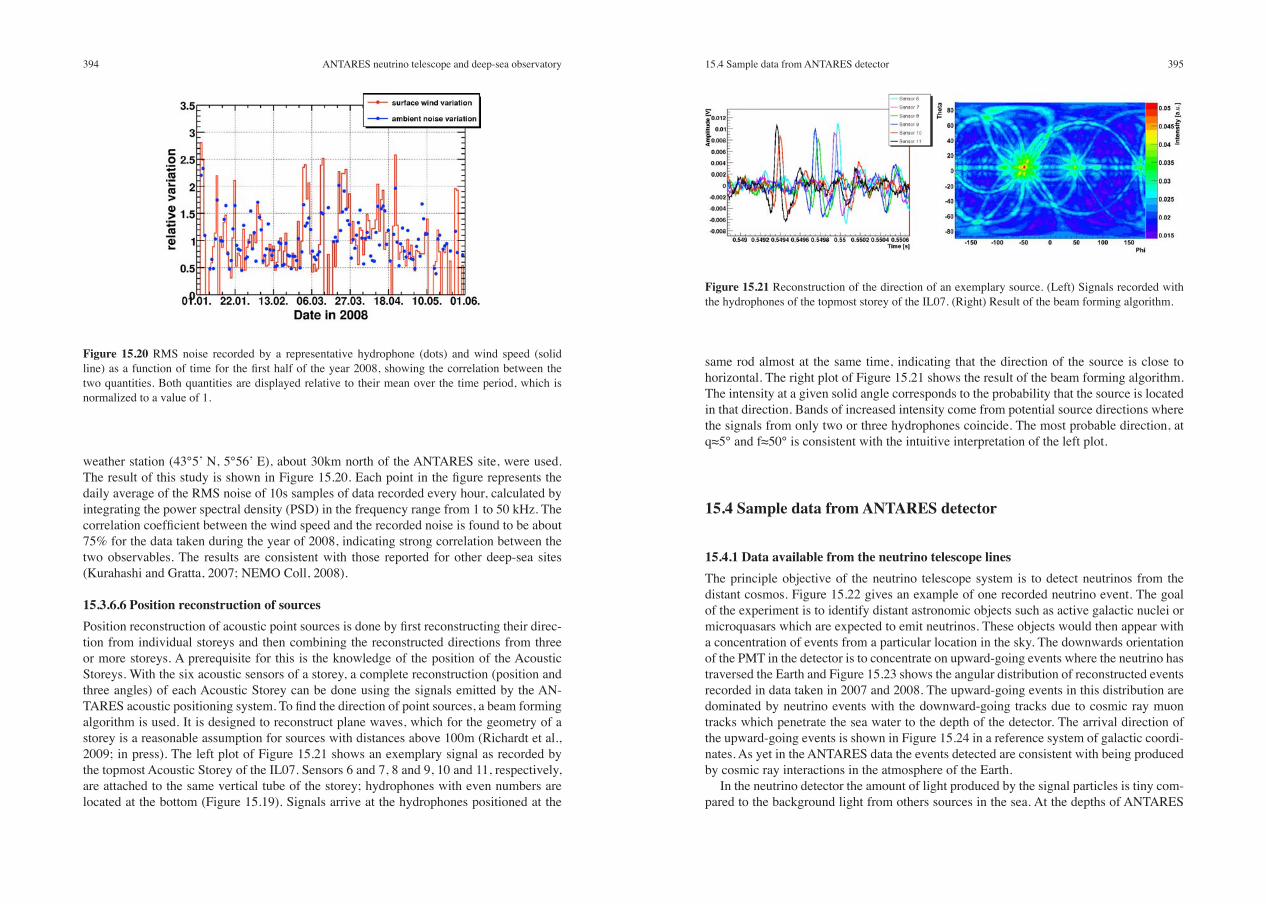
same rod almost at the same time, indicating that the direction of the source is close to horizontal. The right plot of Figure 15.21 shows the result of the beam forming algorithm. The intensity at a given solid angle corresponds to the probability that the source is located in that direction. Bands of increased intensity come from potential source directions where the signals from only two or three hydrophones coincide. The most probable direction, at q≈5° and f≈50° is consistent with the intuitive interpretation of the left plot.
15.4 Sample data from ANTARES detector
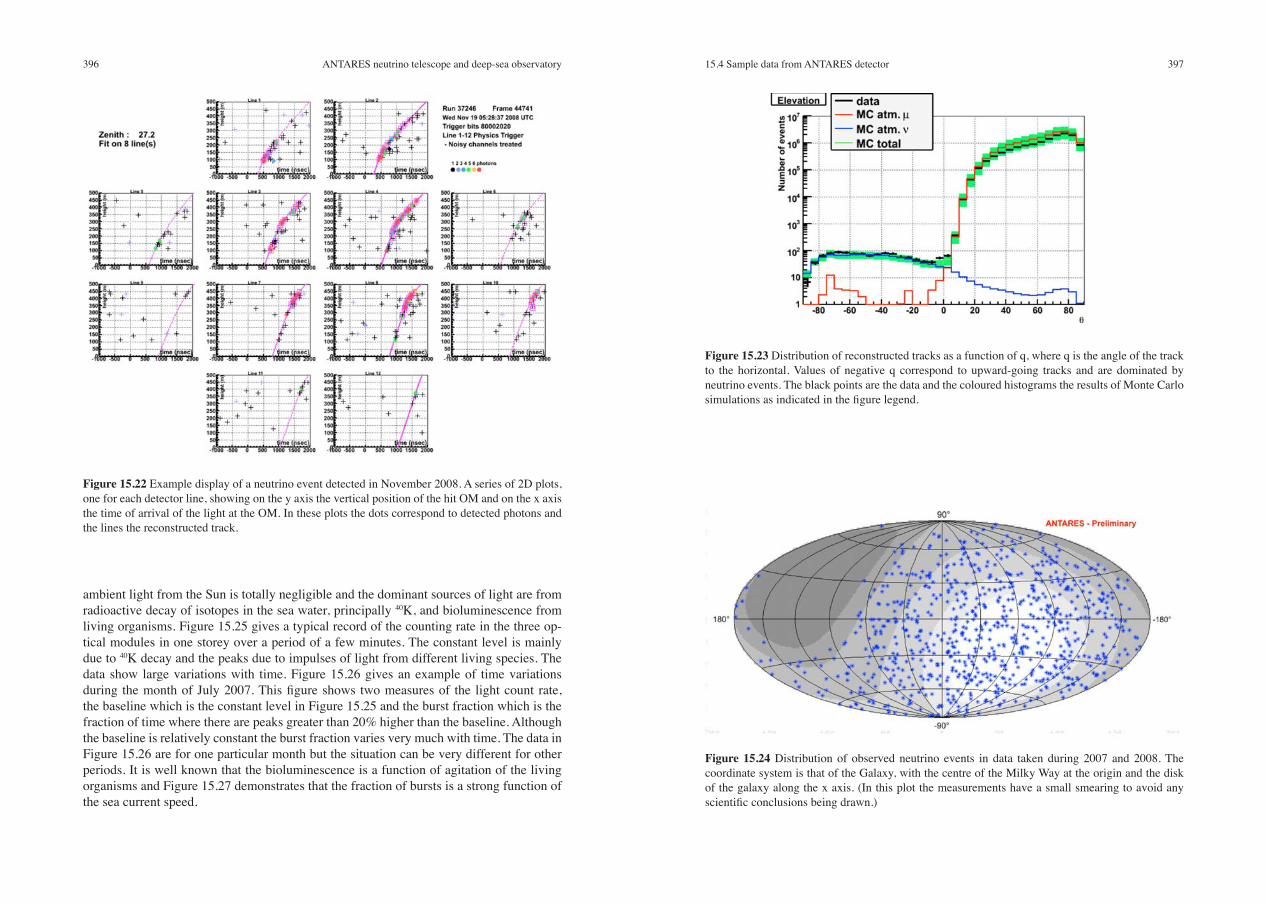
15.4.1 Data available from the neutrino telescope lines The principle objective of the neutrino telescope system is to detect neutrinos from the distant cosmos. Figure 15.22 gives an example of one recorded neutrino event. The goal of the experiment is to identify distant astronomic objects such as active galactic nuclei or microquasars which are expected to emit neutrinos. These objects would then appear with a concentration of events from a particular location in the sky. The downwards orientation of the PMT in the detector is to concentrate on upward-going events where the neutrino has traversed the Earth and Figure 15.23 shows the angular distribution of reconstructed events recorded in data taken in 2007 and 2008. The upward-going events in this distribution are dominated by neutrino events with the downward-going tracks due to cosmic ray muon tracks which penetrate the sea water to the depth of the detector. The arrival direction of the upward-going events is shown in Figure 15.24 in a reference system of galactic coordi-nates. As yet in the ANTARES data the events detected are consistent with being produced by cosmic ray interactions in the atmosphere of the Earth.
In the neutrino detector the amount of light produced by the signal particles is tiny com-pared to the background light from others sources in the sea. At the depths of ANTARES
weather station (43°5’ N, 5°56’ E), about 30km north of the ANTARES site, were used. The result of this study is shown in Figure 15.20. Each point in the figure represents the daily average of the RMS noise of 10s samples of data recorded every hour, calculated by integrating the power spectral density (PSD) in the frequency range from 1 to 50 kHz. The correlation coefficient between the wind speed and the recorded noise is found to be about 75% for the data taken during the year of 2008, indicating strong correlation between the two observables. The results are consistent with those reported for other deep-sea sites (Kurahashi and Gratta, 2007; NEMO Coll, 2008).
15.3.6.6 Position reconstruction of sourcesPosition reconstruction of acoustic point sources is done by first reconstructing their direc-tion from individual storeys and then combining the reconstructed directions from three or more storeys. A prerequisite for this is the knowledge of the position of the Acoustic Storeys. With the six acoustic sensors of a storey, a complete reconstruction (position and three angles) of each Acoustic Storey can be done using the signals emitted by the AN-TARES acoustic positioning system. To find the direction of point sources, a beam forming algorithm is used. It is designed to reconstruct plane waves, which for the geometry of a storey is a reasonable assumption for sources with distances above 100m (Richardt et al., 2009; in press). The left plot of Figure 15.21 shows an exemplary signal as recorded by the topmost Acoustic Storey of the IL07. Sensors 6 and 7, 8 and 9, 10 and 11, respectively, are attached to the same vertical tube of the storey; hydrophones with even numbers are located at the bottom (Figure 15.19). Signals arrive at the hydrophones positioned at the
Figure 15.20 RMS noise recorded by a representative hydrophone (dots) and wind speed (solid line) as a function of time for the first half of the year 2008, showing the correlation between the two quantities. Both quantities are displayed relative to their mean over the time period, which is normalized to a value of 1.
Figure 15.21 Reconstruction of the direction of an exemplary source. (Left) Signals recorded with the hydrophones of the topmost storey of the IL07. (Right) Result of the beam forming algorithm.
396 39715.4 Sample data from ANTARES detectorANTARES neutrino telescope and deep-sea observatory
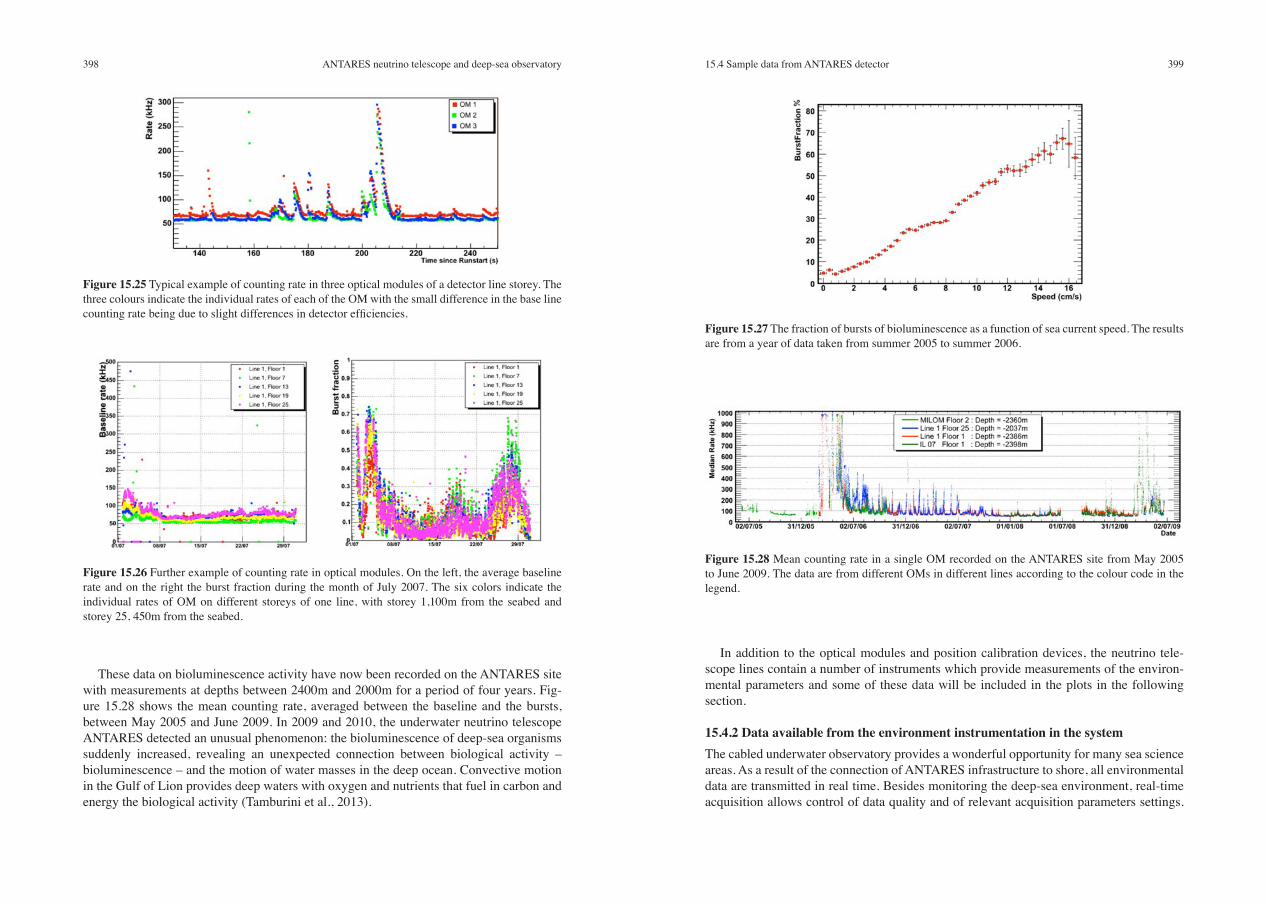
ambient light from the Sun is totally negligible and the dominant sources of light are from radioactive decay of isotopes in the sea water, principally 40K, and bioluminescence from living organisms. Figure 15.25 gives a typical record of the counting rate in the three op-tical modules in one storey over a period of a few minutes. The constant level is mainly due to 40K decay and the peaks due to impulses of light from different living species. The data show large variations with time. Figure 15.26 gives an example of time variations during the month of July 2007. This figure shows two measures of the light count rate, the baseline which is the constant level in Figure 15.25 and the burst fraction which is the fraction of time where there are peaks greater than 20% higher than the baseline. Although the baseline is relatively constant the burst fraction varies very much with time. The data in Figure 15.26 are for one particular month but the situation can be very different for other periods. It is well known that the bioluminescence is a function of agitation of the living organisms and Figure 15.27 demonstrates that the fraction of bursts is a strong function of the sea current speed.
Figure 15.22 Example display of a neutrino event detected in November 2008. A series of 2D plots, one for each detector line, showing on the y axis the vertical position of the hit OM and on the x axis the time of arrival of the light at the OM. In these plots the dots correspond to detected photons and the lines the reconstructed track.
Figure 15.23 Distribution of reconstructed tracks as a function of q, where q is the angle of the track to the horizontal. Values of negative q correspond to upward-going tracks and are dominated by neutrino events. The black points are the data and the coloured histograms the results of Monte Carlo simulations as indicated in the figure legend.
Figure 15.24 Distribution of observed neutrino events in data taken during 2007 and 2008. The coordinate system is that of the Galaxy, with the centre of the Milky Way at the origin and the disk of the galaxy along the x axis. (In this plot the measurements have a small smearing to avoid any scientific conclusions being drawn.)
398 39915.4 Sample data from ANTARES detectorANTARES neutrino telescope and deep-sea observatory
In addition to the optical modules and position calibration devices, the neutrino tele-scope lines contain a number of instruments which provide measurements of the environ-mental parameters and some of these data will be included in the plots in the following section.
15.4.2 Data available from the environment instrumentation in the system The cabled underwater observatory provides a wonderful opportunity for many sea science areas. As a result of the connection of ANTARES infrastructure to shore, all environmental data are transmitted in real time. Besides monitoring the deep-sea environment, real-time acquisition allows control of data quality and of relevant acquisition parameters settings.
These data on bioluminescence activity have now been recorded on the ANTARES site with measurements at depths between 2400m and 2000m for a period of four years. Fig-ure 15.28 shows the mean counting rate, averaged between the baseline and the bursts, between May 2005 and June 2009. In 2009 and 2010, the underwater neutrino telescope ANTARES detected an unusual phenomenon: the bioluminescence of deep-sea organisms suddenly increased, revealing an unexpected connection between biological activity – bioluminescence – and the motion of water masses in the deep ocean. Convective motion in the Gulf of Lion provides deep waters with oxygen and nutrients that fuel in carbon and energy the biological activity (Tamburini et al., 2013).
Figure 15.25 Typical example of counting rate in three optical modules of a detector line storey. The three colours indicate the individual rates of each of the OM with the small difference in the base line counting rate being due to slight differences in detector efficiencies.
Figure 15.26 Further example of counting rate in optical modules. On the left, the average baseline rate and on the right the burst fraction during the month of July 2007. The six colors indicate the individual rates of OM on different storeys of one line, with storey 1,100m from the seabed and storey 25, 450m from the seabed.
Figure 15.27 The fraction of bursts of bioluminescence as a function of sea current speed. The results are from a year of data taken from summer 2005 to summer 2006.
Figure 15.28 Mean counting rate in a single OM recorded on the ANTARES site from May 2005 to June 2009. The data are from different OMs in different lines according to the colour code in the legend.
400 40115.4 Sample data from ANTARES detectorANTARES neutrino telescope and deep-sea observatory
Most of the instruments available on ANTARES are used by both the physicist community and by the sea science community, while others were developed specifically for oceano-graphic or biological research. Another key issue of the multidisciplinary observatory is the long-term and real-time data measurements: a crucial feature for marine sciences. Data acquisition parameters of oceanography devices are set from shore and so can be modified. Typical sampling rates vary from 1−30 minutes depending on the devices. Some examples of data recordings over short- and long-term periods are given as illustrations of the data available with ANTARES.
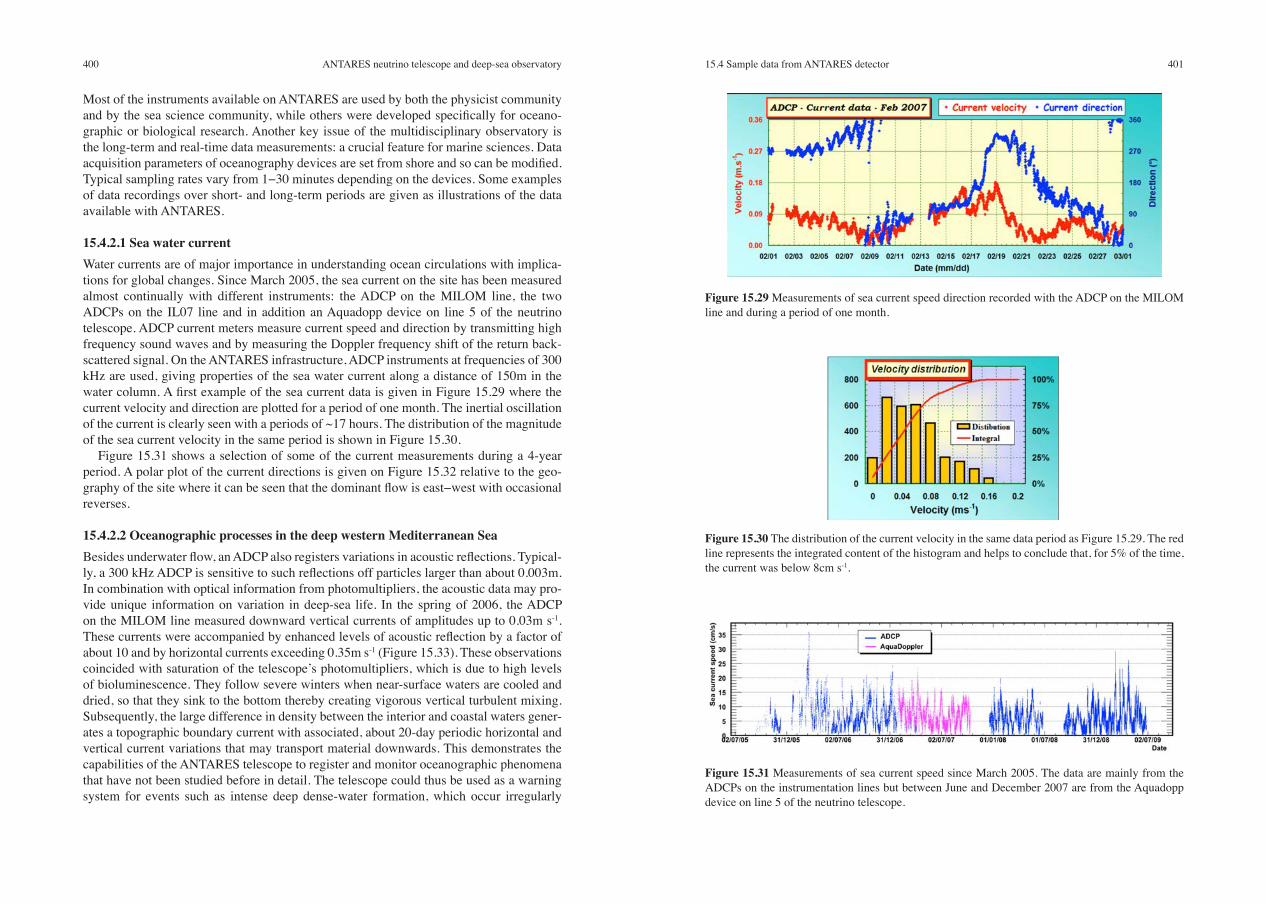
15.4.2.1 Sea water currentWater currents are of major importance in understanding ocean circulations with implica-tions for global changes. Since March 2005, the sea current on the site has been measured almost continually with different instruments: the ADCP on the MILOM line, the two ADCPs on the IL07 line and in addition an Aquadopp device on line 5 of the neutrino telescope. ADCP current meters measure current speed and direction by transmitting high frequency sound waves and by measuring the Doppler frequency shift of the return back- scattered signal. On the ANTARES infrastructure, ADCP instruments at frequencies of 300 kHz are used, giving properties of the sea water current along a distance of 150m in the water column. A first example of the sea current data is given in Figure 15.29 where the current velocity and direction are plotted for a period of one month. The inertial oscillation of the current is clearly seen with a periods of ~17 hours. The distribution of the magnitude of the sea current velocity in the same period is shown in Figure 15.30.
Figure 15.31 shows a selection of some of the current measurements during a 4-year period. A polar plot of the current directions is given on Figure 15.32 relative to the geo- graphy of the site where it can be seen that the dominant flow is east−west with occasional reverses.
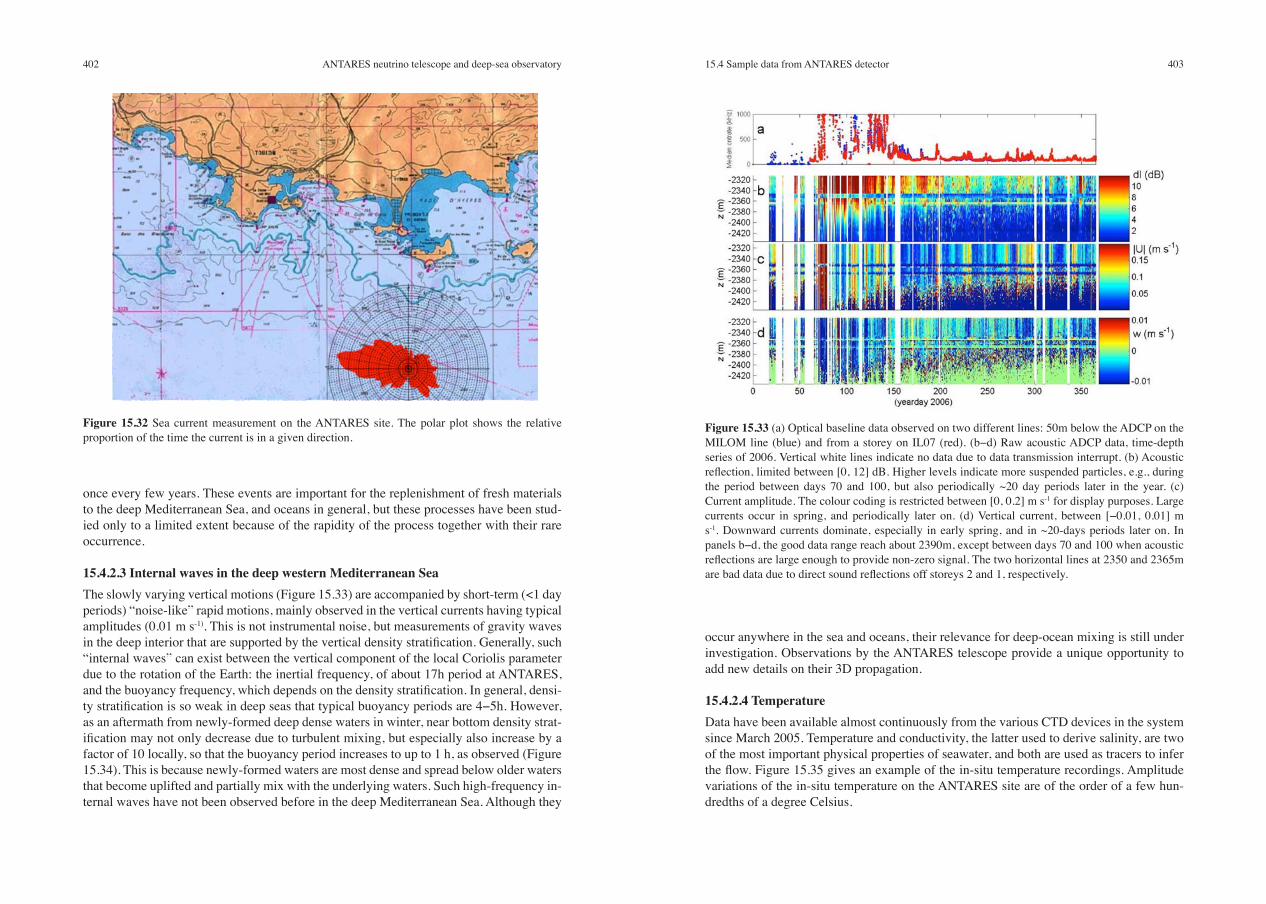
15.4.2.2 Oceanographic processes in the deep western Mediterranean SeaBesides underwater flow, an ADCP also registers variations in acoustic reflections. Typical-ly, a 300 kHz ADCP is sensitive to such reflections off particles larger than about 0.003m. In combination with optical information from photomultipliers, the acoustic data may pro-vide unique information on variation in deep-sea life. In the spring of 2006, the ADCP on the MILOM line measured downward vertical currents of amplitudes up to 0.03m s-1. These currents were accompanied by enhanced levels of acoustic reflection by a factor of about 10 and by horizontal currents exceeding 0.35m s-1 (Figure 15.33). These observations coincided with saturation of the telescope’s photomultipliers, which is due to high levels of bioluminescence. They follow severe winters when near-surface waters are cooled and dried, so that they sink to the bottom thereby creating vigorous vertical turbulent mixing. Subsequently, the large difference in density between the interior and coastal waters gener-ates a topographic boundary current with associated, about 20-day periodic horizontal and vertical current variations that may transport material downwards. This demonstrates the capabilities of the ANTARES telescope to register and monitor oceanographic phenomena that have not been studied before in detail. The telescope could thus be used as a warning system for events such as intense deep dense-water formation, which occur irregularly
Figure 15.29 Measurements of sea current speed direction recorded with the ADCP on the MILOM line and during a period of one month.
Figure 15.30 The distribution of the current velocity in the same data period as Figure 15.29. The red line represents the integrated content of the histogram and helps to conclude that, for 5% of the time, the current was below 8cm s-1.
Figure 15.31 Measurements of sea current speed since March 2005. The data are mainly from the ADCPs on the instrumentation lines but between June and December 2007 are from the Aquadopp device on line 5 of the neutrino telescope.
402 40315.4 Sample data from ANTARES detectorANTARES neutrino telescope and deep-sea observatory
occur anywhere in the sea and oceans, their relevance for deep-ocean mixing is still under investigation. Observations by the ANTARES telescope provide a unique opportunity to add new details on their 3D propagation.
15.4.2.4 TemperatureData have been available almost continuously from the various CTD devices in the system since March 2005. Temperature and conductivity, the latter used to derive salinity, are two of the most important physical properties of seawater, and both are used as tracers to infer the flow. Figure 15.35 gives an example of the in-situ temperature recordings. Amplitude variations of the in-situ temperature on the ANTARES site are of the order of a few hun-dredths of a degree Celsius.
Figure 15.32 Sea current measurement on the ANTARES site. The polar plot shows the relative proportion of the time the current is in a given direction.
once every few years. These events are important for the replenishment of fresh materials to the deep Mediterranean Sea, and oceans in general, but these processes have been stud-ied only to a limited extent because of the rapidity of the process together with their rare occurrence.
15.4.2.3 Internal waves in the deep western Mediterranean SeaThe slowly varying vertical motions (Figure 15.33) are accompanied by short-term (<1 day periods) “noise-like” rapid motions, mainly observed in the vertical currents having typical amplitudes (0.01 m s-1). This is not instrumental noise, but measurements of gravity waves in the deep interior that are supported by the vertical density stratification. Generally, such “internal waves” can exist between the vertical component of the local Coriolis parameter due to the rotation of the Earth: the inertial frequency, of about 17h period at ANTARES, and the buoyancy frequency, which depends on the density stratification. In general, densi-ty stratification is so weak in deep seas that typical buoyancy periods are 4−5h. However, as an aftermath from newly-formed deep dense waters in winter, near bottom density strat-ification may not only decrease due to turbulent mixing, but especially also increase by a factor of 10 locally, so that the buoyancy period increases to up to 1 h, as observed (Figure 15.34). This is because newly-formed waters are most dense and spread below older waters that become uplifted and partially mix with the underlying waters. Such high-frequency in-ternal waves have not been observed before in the deep Mediterranean Sea. Although they
Figure 15.33 (a) Optical baseline data observed on two different lines: 50m below the ADCP on the MILOM line (blue) and from a storey on IL07 (red). (b−d) Raw acoustic ADCP data, time-depth series of 2006. Vertical white lines indicate no data due to data transmission interrupt. (b) Acoustic reflection, limited between [0, 12] dB. Higher levels indicate more suspended particles, e.g., during the period between days 70 and 100, but also periodically ~20 day periods later in the year. (c) Current amplitude. The colour coding is restricted between [0, 0.2] m s-1 for display purposes. Large currents occur in spring, and periodically later on. (d) Vertical current, between [−0.01, 0.01] m s-1. Downward currents dominate, especially in early spring, and in ~20-days periods later on. In panels b−d, the good data range reach about 2390m, except between days 70 and 100 when acoustic reflections are large enough to provide non-zero signal. The two horizontal lines at 2350 and 2365m are bad data due to direct sound reflections off storeys 2 and 1, respectively.
404 40515.4 Sample data from ANTARES detectorANTARES neutrino telescope and deep-sea observatory
15.4.2.6 Pressure sensorPressure is a fundamental hydrological variable, just like temperature and salinity. These three parameters of state characterize sea water physical properties. Understanding the dynamics of sea water includes many topics, one of which is the study of ocean tides. An
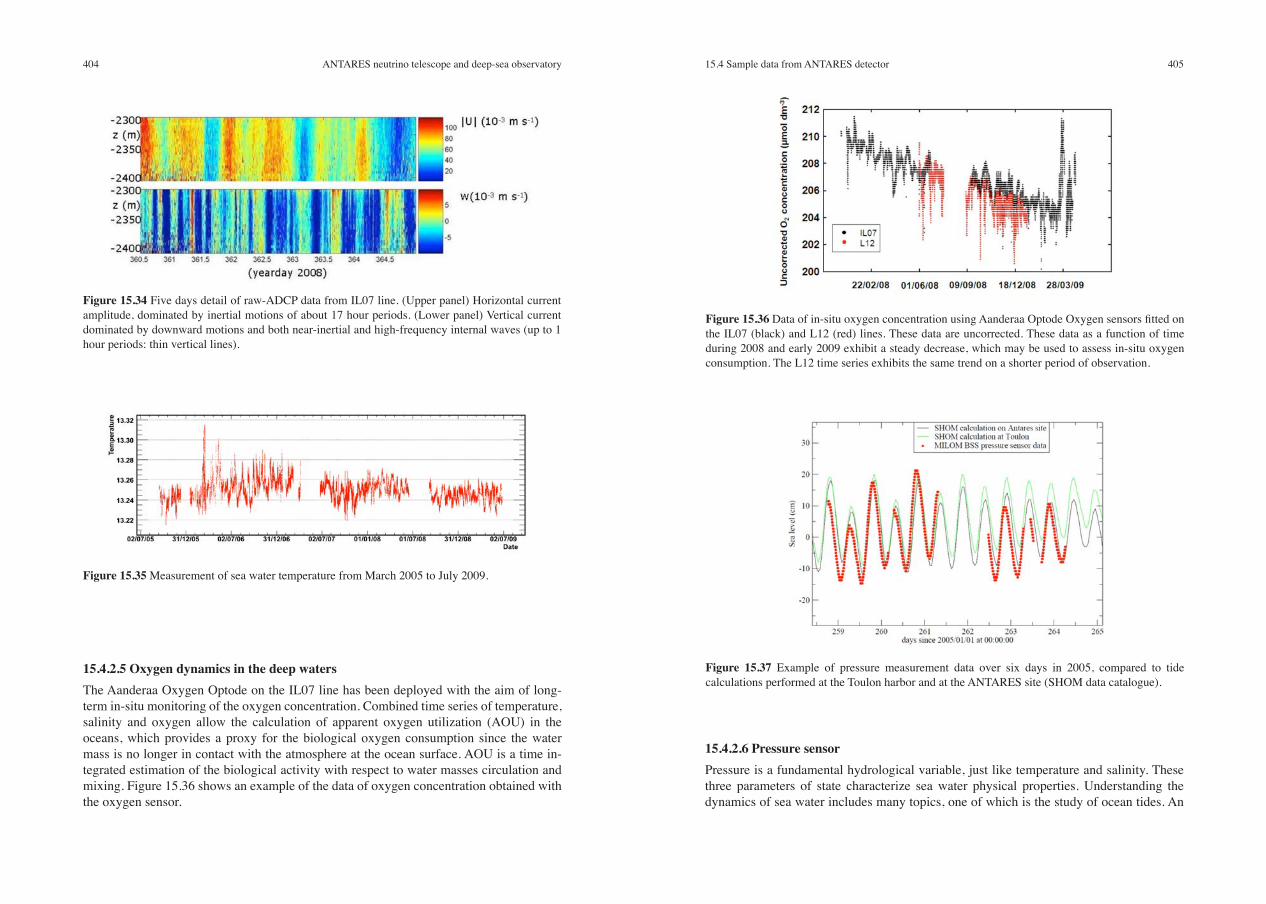
Figure 15.34 Five days detail of raw-ADCP data from IL07 line. (Upper panel) Horizontal current amplitude, dominated by inertial motions of about 17 hour periods. (Lower panel) Vertical current dominated by downward motions and both near-inertial and high-frequency internal waves (up to 1 hour periods: thin vertical lines).
Figure 15.35 Measurement of sea water temperature from March 2005 to July 2009.
Figure 15.36 Data of in-situ oxygen concentration using Aanderaa Optode Oxygen sensors fitted on the IL07 (black) and L12 (red) lines. These data are uncorrected. These data as a function of time during 2008 and early 2009 exhibit a steady decrease, which may be used to assess in-situ oxygen consumption. The L12 time series exhibits the same trend on a shorter period of observation.
15.4.2.5 Oxygen dynamics in the deep waters The Aanderaa Oxygen Optode on the IL07 line has been deployed with the aim of long-term in-situ monitoring of the oxygen concentration. Combined time series of temperature, salinity and oxygen allow the calculation of apparent oxygen utilization (AOU) in the oceans, which provides a proxy for the biological oxygen consumption since the water mass is no longer in contact with the atmosphere at the ocean surface. AOU is a time in-tegrated estimation of the biological activity with respect to water masses circulation and mixing. Figure 15.36 shows an example of the data of oxygen concentration obtained with the oxygen sensor.
Figure 15.37 Example of pressure measurement data over six days in 2005, compared to tide calculations performed at the Toulon harbor and at the ANTARES site (SHOM data catalogue).
406 40715.4 Sample data from ANTARES detectorANTARES neutrino telescope and deep-sea observatory
example of pressure data sample recorded on the ANTARES site over six days is given in Figure 15.37. A pressure of 1 mbar is equivalent to a variation of 1cm in the water column. Values are compared to tide calculations computed at the Toulon harbor and at the AN-TARES site by the SHOM (Service Hydrographique et Océanographique de la Marine), and a good agreement is found between data and previsions.
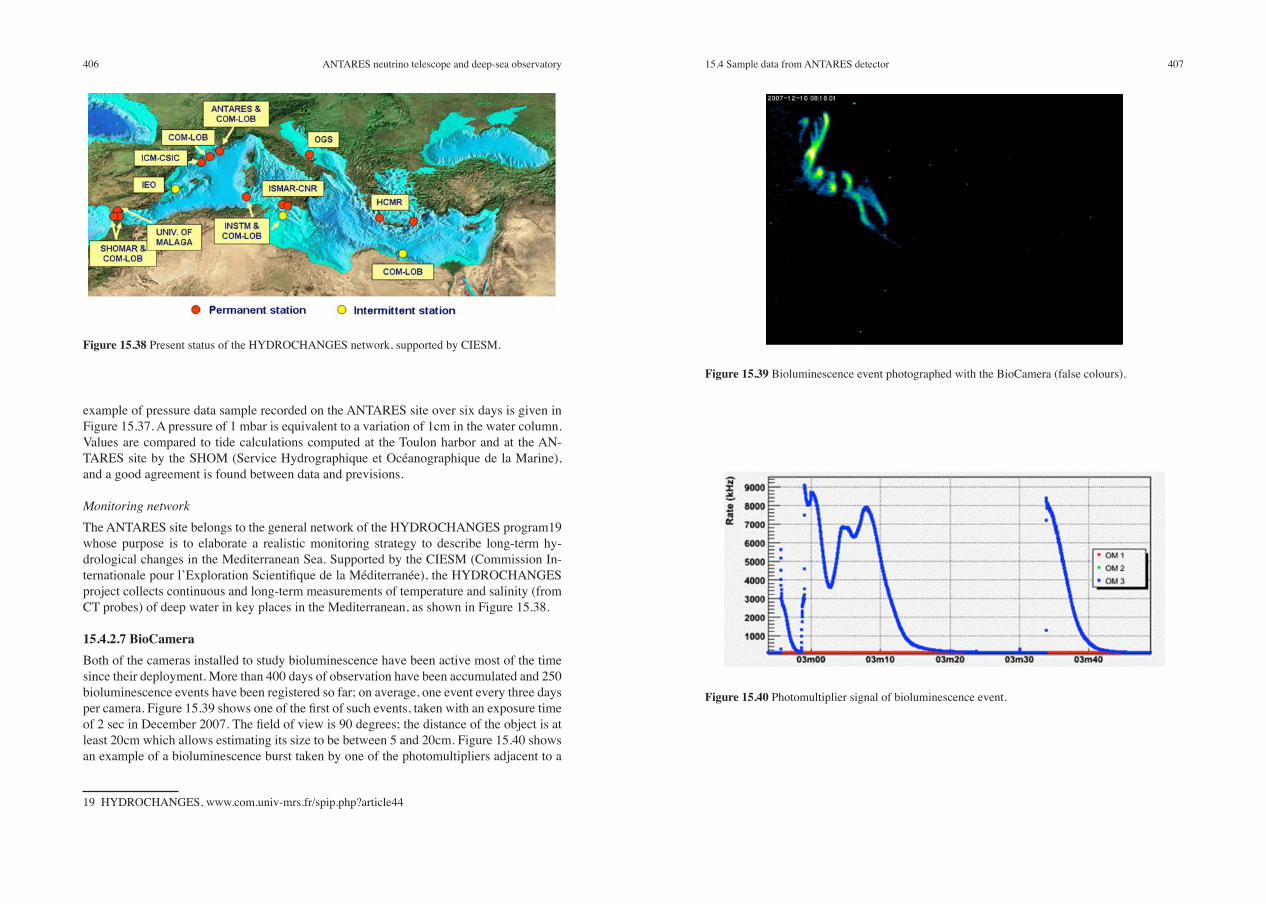
Monitoring networkThe ANTARES site belongs to the general network of the HYDROCHANGES program19 whose purpose is to elaborate a realistic monitoring strategy to describe long-term hy-drological changes in the Mediterranean Sea. Supported by the CIESM (Commission In-ternationale pour l’Exploration Scientifique de la Méditerranée), the HYDROCHANGES project collects continuous and long-term measurements of temperature and salinity (from CT probes) of deep water in key places in the Mediterranean, as shown in Figure 15.38.
15.4.2.7 BioCameraBoth of the cameras installed to study bioluminescence have been active most of the time since their deployment. More than 400 days of observation have been accumulated and 250 bioluminescence events have been registered so far; on average, one event every three days per camera. Figure 15.39 shows one of the first of such events, taken with an exposure time of 2 sec in December 2007. The field of view is 90 degrees; the distance of the object is at least 20cm which allows estimating its size to be between 5 and 20cm. Figure 15.40 shows an example of a bioluminescence burst taken by one of the photomultipliers adjacent to a
19 HYDROCHANGES, www.com.univ-mrs.fr/spip.php?article44
Figure 15.38 Present status of the HYDROCHANGES network, supported by CIESM.
Figure 15.39 Bioluminescence event photographed with the BioCamera (false colours).
Figure 15.40 Photomultiplier signal of bioluminescence event.
408 40915.5 Extensions for Marine and Earth scienceANTARES neutrino telescope and deep-sea observatory
camera. The time distribution of the registered events shows statistically significant fluctu-ations, which means there are more and less active periods in terms of bioluminescence. A visual inspection of the images and movie sequences allows them to be classified. A hand-ful of different patterns can be easily distinguished which most likely originate from dif-ferent species. A more detailed analysis will be necessary to actually identify these species.
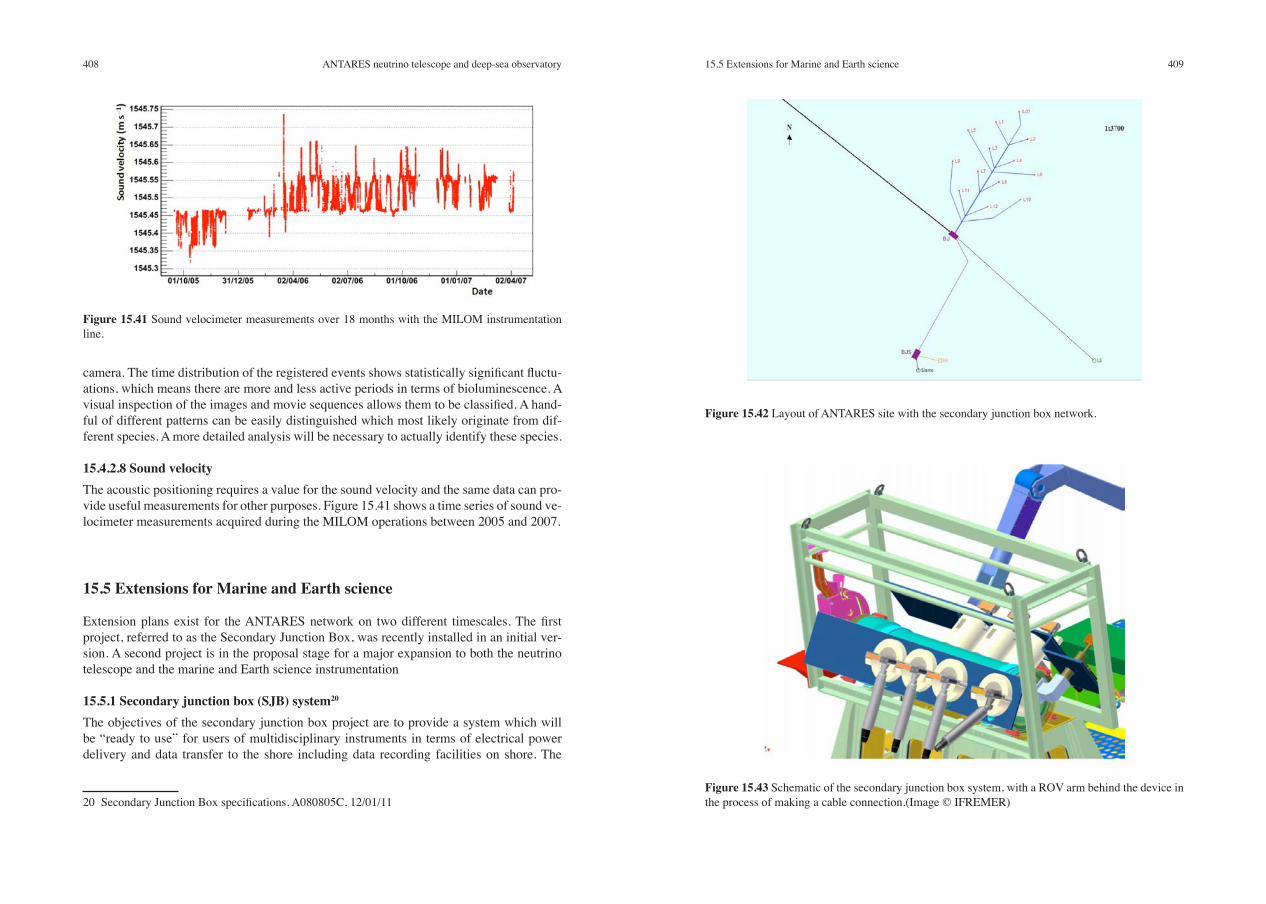
15.4.2.8 Sound velocityThe acoustic positioning requires a value for the sound velocity and the same data can pro-vide useful measurements for other purposes. Figure 15.41 shows a time series of sound ve-locimeter measurements acquired during the MILOM operations between 2005 and 2007.
15.5 Extensions for Marine and Earth science
Extension plans exist for the ANTARES network on two different timescales. The first project, referred to as the Secondary Junction Box, was recently installed in an initial ver-sion. A second project is in the proposal stage for a major expansion to both the neutrino telescope and the marine and Earth science instrumentation
15.5.1 Secondary junction box (SJB) system20
The objectives of the secondary junction box project are to provide a system which will be “ready to use” for users of multidisciplinary instruments in terms of electrical power delivery and data transfer to the shore including data recording facilities on shore. The
20 Secondary Junction Box specifications, A080805C, 12/01/11
Figure 15.41 Sound velocimeter measurements over 18 months with the MILOM instrumentation line.
Figure 15.42 Layout of ANTARES site with the secondary junction box network.
Figure 15.43 Schematic of the secondary junction box system, with a ROV arm behind the device in the process of making a cable connection.(Image © IFREMER)
410 41115.5 Extensions for Marine and Earth scienceANTARES neutrino telescope and deep-sea observatory
secondary junction box was constructed by IFREMER and will provide access to general scientific users beyond the ANTARES Collaboration following appropriate proposals. The process to assess proposals and allocate connections to the secondary junction box is man-aged by the CNRS/IN2P3.
Figure 15.42 indicates the location of the secondary junction box relative to the neutrino telescope. The nature and position of the equipment connected to the shore via the SJB is open to proposals. All proposals must conform to constraint that the operation of the neu-trino telescope is not degraded. A cable 400m long links the SJB with the main ANTARES junction box. This secondary junction box offers six general-purpose sockets to connect different equipment which will share operation time, power and bandwidth. Figure 15.43 is a schematic view of the secondary junction box.
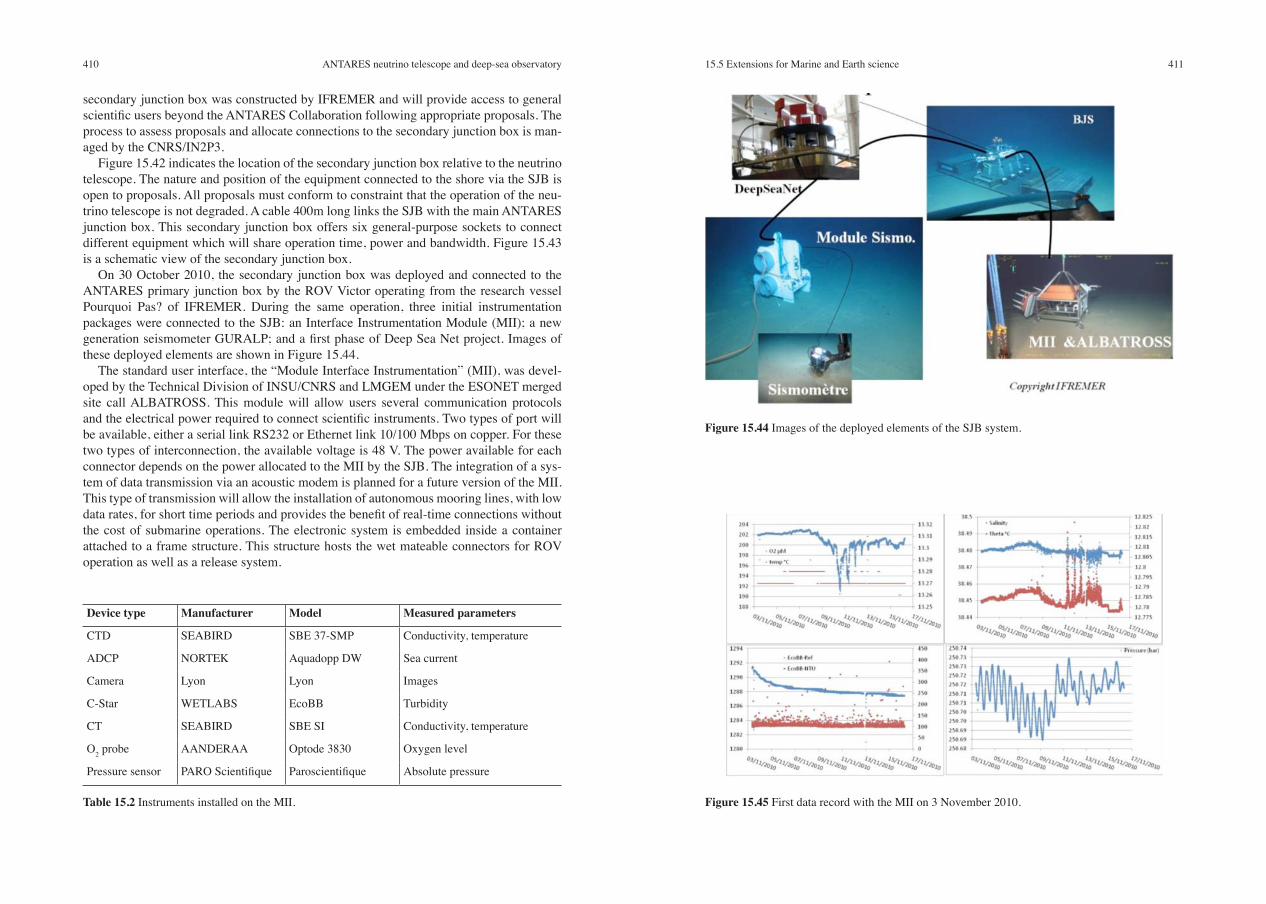
On 30 October 2010, the secondary junction box was deployed and connected to the ANTARES primary junction box by the ROV Victor operating from the research vessel Pourquoi Pas? of IFREMER. During the same operation, three initial instrumentation packages were connected to the SJB: an Interface Instrumentation Module (MII); a new generation seismometer GURALP; and a first phase of Deep Sea Net project. Images of these deployed elements are shown in Figure 15.44.
The standard user interface, the “Module Interface Instrumentation” (MII), was devel-oped by the Technical Division of INSU/CNRS and LMGEM under the ESONET merged site call ALBATROSS. This module will allow users several communication protocols and the electrical power required to connect scientific instruments. Two types of port will be available, either a serial link RS232 or Ethernet link 10/100 Mbps on copper. For these two types of interconnection, the available voltage is 48 V. The power available for each connector depends on the power allocated to the MII by the SJB. The integration of a sys-tem of data transmission via an acoustic modem is planned for a future version of the MII. This type of transmission will allow the installation of autonomous mooring lines, with low data rates, for short time periods and provides the benefit of real-time connections without the cost of submarine operations. The electronic system is embedded inside a container attached to a frame structure. This structure hosts the wet mateable connectors for ROV operation as well as a release system.
Device type Manufacturer Model Measured parameters
CTD SEABIRD SBE 37-SMP Conductivity, temperature
ADCP NORTEK Aquadopp DW Sea current
Camera Lyon Lyon Images
C-Star WETLABS EcoBB Turbidity
CT SEABIRD SBE SI Conductivity, temperature
O2 probe AANDERAA Optode 3830 Oxygen level
Pressure sensor PARO Scientifique Paroscientifique Absolute pressure
Table 15.2 Instruments installed on the MII.
Figure 15.44 Images of the deployed elements of the SJB system.
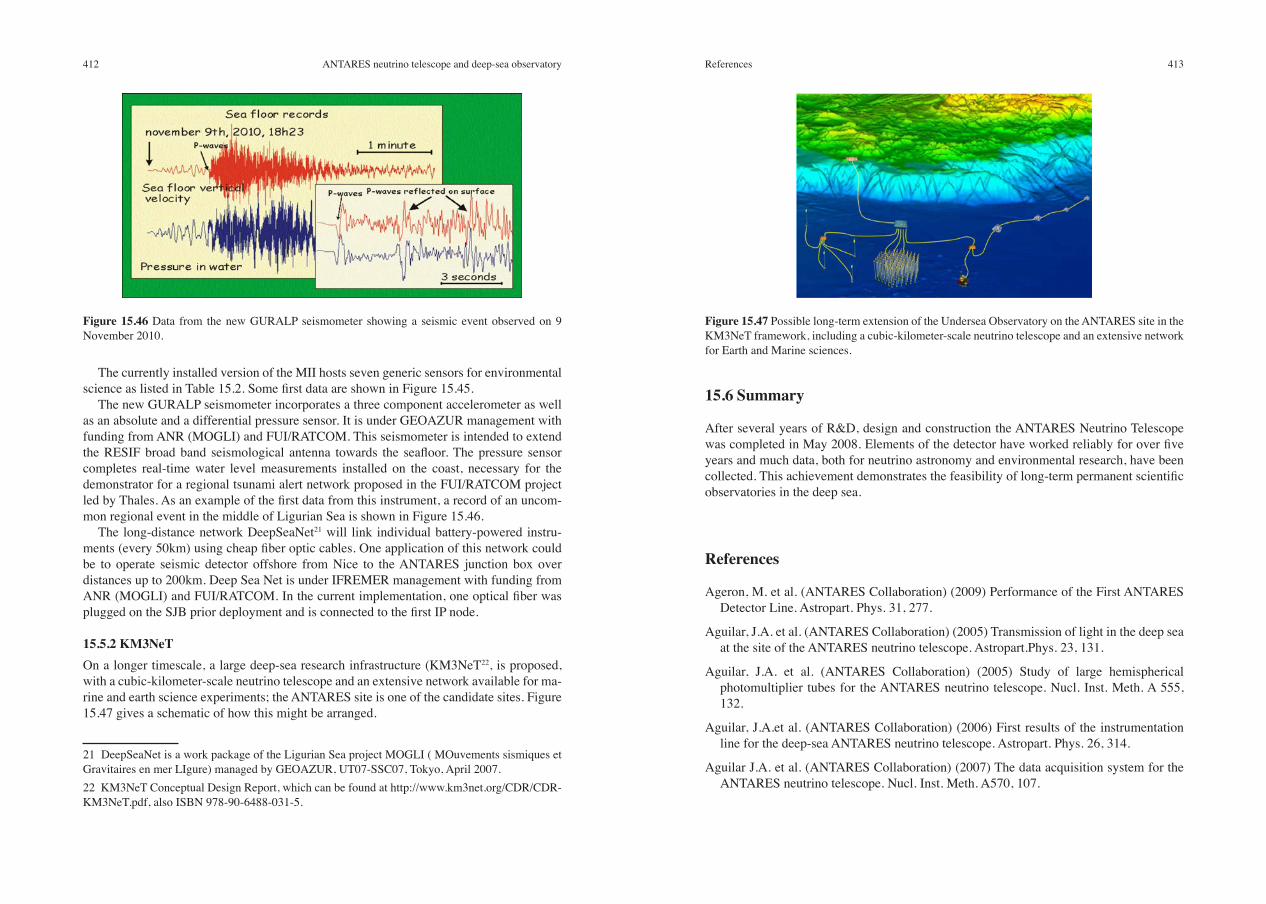
Figure 15.45 First data record with the MII on 3 November 2010.
412 413ReferencesANTARES neutrino telescope and deep-sea observatory
15.6 Summary
After several years of R&D, design and construction the ANTARES Neutrino Telescope was completed in May 2008. Elements of the detector have worked reliably for over five years and much data, both for neutrino astronomy and environmental research, have been collected. This achievement demonstrates the feasibility of long-term permanent scientific observatories in the deep sea.
References
Ageron, M. et al. (ANTARES Collaboration) (2009) Performance of the First ANTARES Detector Line. Astropart. Phys. 31, 277.
Aguilar, J.A. et al. (ANTARES Collaboration) (2005) Transmission of light in the deep sea at the site of the ANTARES neutrino telescope. Astropart.Phys. 23, 131.
Aguilar, J.A. et al. (ANTARES Collaboration) (2005) Study of large hemispherical photomultiplier tubes for the ANTARES neutrino telescope. Nucl. Inst. Meth. A 555, 132.
Aguilar, J.A.et al. (ANTARES Collaboration) (2006) First results of the instrumentation line for the deep-sea ANTARES neutrino telescope. Astropart. Phys. 26, 314.
Aguilar J.A. et al. (ANTARES Collaboration) (2007) The data acquisition system for the ANTARES neutrino telescope. Nucl. Inst. Meth. A570, 107.
The currently installed version of the MII hosts seven generic sensors for environmental science as listed in Table 15.2. Some first data are shown in Figure 15.45.
The new GURALP seismometer incorporates a three component accelerometer as well as an absolute and a differential pressure sensor. It is under GEOAZUR management with funding from ANR (MOGLI) and FUI/RATCOM. This seismometer is intended to extend the RESIF broad band seismological antenna towards the seafloor. The pressure sensor completes real-time water level measurements installed on the coast, necessary for the demonstrator for a regional tsunami alert network proposed in the FUI/RATCOM project led by Thales. As an example of the first data from this instrument, a record of an uncom-mon regional event in the middle of Ligurian Sea is shown in Figure 15.46.
The long-distance network DeepSeaNet21 will link individual battery-powered instru-ments (every 50km) using cheap fiber optic cables. One application of this network could be to operate seismic detector offshore from Nice to the ANTARES junction box over distances up to 200km. Deep Sea Net is under IFREMER management with funding from ANR (MOGLI) and FUI/RATCOM. In the current implementation, one optical fiber was plugged on the SJB prior deployment and is connected to the first IP node.
15.5.2 KM3NeTOn a longer timescale, a large deep-sea research infrastructure (KM3NeT22, is proposed, with a cubic-kilometer-scale neutrino telescope and an extensive network available for ma-rine and earth science experiments; the ANTARES site is one of the candidate sites. Figure 15.47 gives a schematic of how this might be arranged.
21 DeepSeaNet is a work package of the Ligurian Sea project MOGLI ( MOuvements sismiques et Gravitaires en mer LIgure) managed by GEOAZUR, UT07-SSC07, Tokyo, April 2007.22 KM3NeT Conceptual Design Report, which can be found at http://www.km3net.org/CDR/CDR-KM3NeT.pdf, also ISBN 978-90-6488-031-5.
Figure 15.46 Data from the new GURALP seismometer showing a seismic event observed on 9 November 2010.
Figure 15.47 Possible long-term extension of the Undersea Observatory on the ANTARES site in the KM3NeT framework, including a cubic-kilometer-scale neutrino telescope and an extensive network for Earth and Marine sciences.
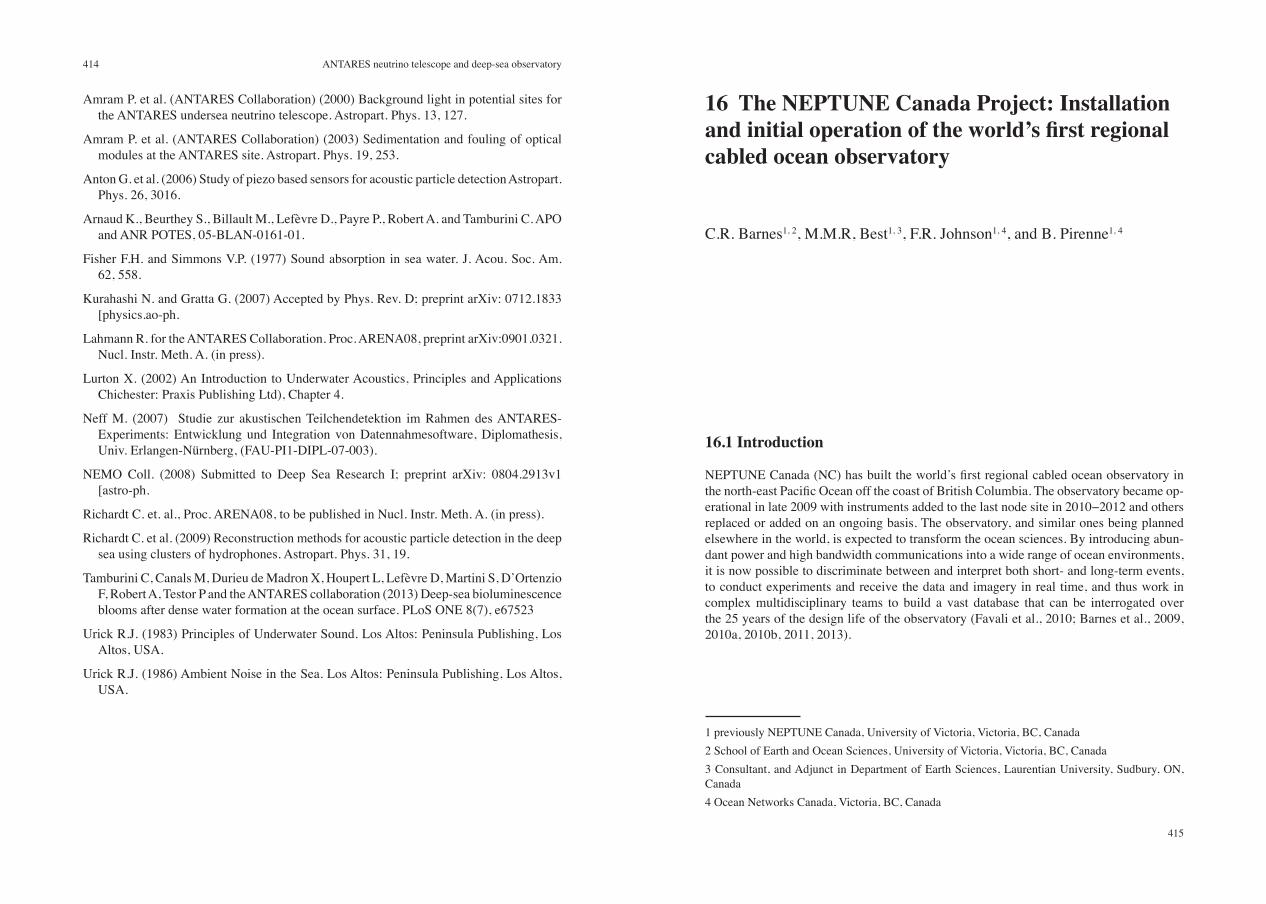
414
415
ANTARES neutrino telescope and deep-sea observatory
16 The NEPTUNE Canada Project: Installation and initial operation of the world’s first regional cabled ocean observatory
C.R. Barnes1, 2, M.M.R, Best1, 3, F.R. Johnson1, 4, and B. Pirenne1, 4
16.1 Introduction
NEPTUNE Canada (NC) has built the world’s first regional cabled ocean observatory in the north-east Pacific Ocean off the coast of British Columbia. The observatory became op-erational in late 2009 with instruments added to the last node site in 2010−2012 and others replaced or added on an ongoing basis. The observatory, and similar ones being planned elsewhere in the world, is expected to transform the ocean sciences. By introducing abun-dant power and high bandwidth communications into a wide range of ocean environments, it is now possible to discriminate between and interpret both short- and long-term events, to conduct experiments and receive the data and imagery in real time, and thus work in complex multidisciplinary teams to build a vast database that can be interrogated over the 25 years of the design life of the observatory (Favali et al., 2010; Barnes et al., 2009, 2010a, 2010b, 2011, 2013).
Amram P. et al. (ANTARES Collaboration) (2000) Background light in potential sites for the ANTARES undersea neutrino telescope. Astropart. Phys. 13, 127.
Amram P. et al. (ANTARES Collaboration) (2003) Sedimentation and fouling of optical modules at the ANTARES site. Astropart. Phys. 19, 253.
Anton G. et al. (2006) Study of piezo based sensors for acoustic particle detection Astropart. Phys. 26, 3016.
Arnaud K., Beurthey S., Billault M., Lefèvre D., Payre P., Robert A. and Tamburini C. APO and ANR POTES, 05-BLAN-0161-01.
Fisher F.H. and Simmons V.P. (1977) Sound absorption in sea water. J. Acou. Soc. Am. 62, 558.
Kurahashi N. and Gratta G. (2007) Accepted by Phys. Rev. D; preprint arXiv: 0712.1833 [physics.ao-ph.
Lahmann R. for the ANTARES Collaboration. Proc. ARENA08, preprint arXiv:0901.0321. Nucl. Instr. Meth. A. (in press).
Lurton X. (2002) An Introduction to Underwater Acoustics, Principles and Applications Chichester: Praxis Publishing Ltd), Chapter 4.
Neff M. (2007) Studie zur akustischen Teilchendetektion im Rahmen des ANTARES-Experiments: Entwicklung und Integration von Datennahmesoftware, Diplomathesis, Univ. Erlangen-Nürnberg, (FAU-PI1-DIPL-07-003).
NEMO Coll. (2008) Submitted to Deep Sea Research I; preprint arXiv: 0804.2913v1 [astro-ph.
Richardt C. et. al., Proc. ARENA08, to be published in Nucl. Instr. Meth. A. (in press).
Richardt C. et al. (2009) Reconstruction methods for acoustic particle detection in the deep sea using clusters of hydrophones. Astropart. Phys. 31, 19.
Tamburini C, Canals M, Durieu de Madron X, Houpert L, Lefèvre D, Martini S, D’Ortenzio F, Robert A, Testor P and the ANTARES collaboration (2013) Deep-sea bioluminescence blooms after dense water formation at the ocean surface. PLoS ONE 8(7), e67523
Urick R.J. (1983) Principles of Underwater Sound. Los Altos: Peninsula Publishing, Los Altos, USA.
Urick R.J. (1986) Ambient Noise in the Sea. Los Altos: Peninsula Publishing, Los Altos, USA.
1 previously NEPTUNE Canada, University of Victoria, Victoria, BC, Canada2 School of Earth and Ocean Sciences, University of Victoria, Victoria, BC, Canada3 Consultant, and Adjunct in Department of Earth Sciences, Laurentian University, Sudbury, ON, Canada4 Ocean Networks Canada, Victoria, BC, Canada