Embed Size (px)
DESCRIPTION
2005 Atmos. Environ. Ntziachristos L. Effects of a Catalysed and an Additized Particle Filter on the Emissions of a Diesel Passenger Car Operating on Low
Citation preview
ARTICLE IN PRESS
1352-2310/$ - se
doi:10.1016/j.at
�Correspondfax: +3023 10 9
E-mail addr
Atmospheric Environment 39 (2005) 4925–4936
www.elsevier.com/locate/atmosenv
Effects of a catalysed and an additized particle filteron the emissions of a diesel passenger car operating
on low sulphur fuels
Leonidas Ntziachristosa, Zissis Samarasa,�, Efthimios Zervasb, Pascal Dorlheneb
aLaboratory of Applied Thermodynamics, Mechanical Engineering Department, Aristotle University Thessaloniki,
P.O. Box 458, GR-54124 Thessaloniki, GreecebRenault, 1, Allee Cornuel, F-91510 Lardy, France
Received 12 January 2005; received in revised form 5 April 2005; accepted 30 April 2005
Abstract
This paper presents the emission characteristics of a diesel passenger car operated on low sulphur fuels (8 and
38 ppm) when fitted with either a catalysed diesel particle filter (DPF) or a non-catalysed one combined with a fuel-
borne catalyst. Measurements were conducted over the New European Driving Cycle and a higher speed driving cycle
to monitor the off-cycle DPF emission behaviour. Regulated gaseous pollutants and particle mass, number and surface
were recorded. Aerosol samples were collected with a dedicated sampling system, which provided identical dilution
conditions, regardless of the vehicle configuration, and allowed a distinction between volatile and non-volatile particles.
The results showed that DPFs have the potential of filtration efficiencies which may exceed 99.5% in all airborne
particle properties measured, over the transient cycles. As a result, the cycle average particle number was reduced from
1014 to about 1011 particles km�1 when fitting any DPF and the particle mass was reduced from �40mgkm�1 to the
detection limit of the current measurement procedure. The exact particle concentration depended on the filter material
properties. However, the efficiency in reducing mass appears lower than the airborne number, which suggests a
sampling artefact of the present particulate matter measurement procedure. A nucleation mode formed at high exhaust
gas temperature with the use of the higher sulphur fuel in combination with the catalysed DPF, thus decreasing the
apparent DPF filtration efficiency. This was removed when any of the contributing factors (high temperature, higher
sulphur fuel, catalysed DPF) were not present, suggesting sulphate particle formation downstream of the filter. Finally,
results show that the DPF soot loading has an insignificant effect on particle size distribution downstream of the filter,
when operating within soot-loading limits that are typically encountered in normal on-road operation.
r 2005 Elsevier Ltd. All rights reserved.
Keywords: Exhaust aerosol; Nucleation mode; Diesel aftertreatment; Filtration efficiency
e front matter r 2005 Elsevier Ltd. All rights reserve
mosenv.2005.04.040
ing author. Tel.: +3023 10 99 60 14;
9 60 19.
ess: [email protected] (Z. Samaras).
1. Introduction
Diesel passenger car registrations represented 44.3%
of the total European passenger car market in 2003 and
reached as much as 70% of total registrations in some
countries, according to the European Automotive
d.
ARTICLE IN PRESSL. Ntziachristos et al. / Atmospheric Environment 39 (2005) 4925–49364926
Manufacturers Association (ACEA, 2004). The main
driving force for this trend is the higher fuel economy
compared to gasoline and the improved drivability at
low engine speeds. Additionally, ACEA is committed to
reducing the mean CO2 from new vehicles at 140 g km�1
by 2008 (25% reduction over 1990 levels) in an effort to
meet the European targets for the Kyoto Protocol. This
reduction will basically be accomplished via increasing
the market share of diesel cars.
In order to reduce the environmental impact from
vehicles, European legislation introduced the Euro 4
step in January 2005, which, for diesel cars, corresponds
to 0.25 g km�1 of NOx and 0.025 g km�1 of particulate
matter (PM). Despite an �80% reduction in diesel car
emission standards over levels 10 years ago, the mean
NOx emission level of diesel vehicles continues to be
three times higher than their gasoline counterparts.
Gasoline vehicles are also known to emit low levels of
soot particles (Andersson et al., 2002; Mohr et al., 2000).
Hence, future emission standards are already under
consideration to further tighten emission limits for diesel
vehicles.
Diesel particle filters (DPFs) are one of the most
technically feasible solutions to reduce PM. DPFs are
fitted in the exhaust line and collect PM by deep-bed
filtration. PM accumulated in the filter is then periodi-
cally combusted by oxidizing agents in the exhaust gas in
a process called regeneration. Commercial applications
either use some kind of a catalyst to decrease the soot
ignition temperature and increase the range of exhaust
gas temperatures where regeneration can occur or apply
an oxidation catalyst to increase NO2 concentration,
which is an efficient soot oxidation agent.
DPFs have been widely fitted to new vehicles and
retrofitted mainly to buses and large construction
equipment (e.g. Sequelong et al., 2004; Ball et al.,
2004; Mayer et al., 1999). Extensive experience has
already been accumulated with the operation and
emission performance of these systems on large diesel
applications (Lanni, 2003). Passenger car manufacturers
started to offer compact DPF systems on a voluntary
basis (Joubert and Sequelong, 2004) and some first
conclusions of their operation and filtration character-
istics have been collected (Jeuland et al., 2004).
However, there are still open issues with regard to the
performance of the systems over fully transient and real-
world driving conditions of light duty vehicles, because
very little data under such conditions are currently
available (Durbin et al., 2003; Mathis et al., 2005).
In the present paper we try to address these issues by
studying the emission performance of a current technol-
ogy diesel car fitted with two different DPF systems.
Measurements are conducted over the European cold-
start certification cycle (New European Driving Cycle—
NEDC) and an additional higher speed cycle to account
for distinctly different driving conditions. The focus is
on PM and airborne particle emissions which are
measured using a specially developed sampling protocol
and methodology to separate vehicle effects from
sampling effects. Additionally, two fuels with identical
properties but different sulphur content are tested to
explore the additional benefit of eliminating fuel
sulphur.
2. Experimental
2.1. Vehicle and fuels
A 2001 model year Renault Laguna 1.9 dCi was used
in this study, equipped with a common-rail direct
injection diesel engine and meeting Euro 3 emission
standards. PM emissions in this vehicle are controlled by
high pressure fuel injection (1350 bar max common rail
pressure) and two diesel oxidation catalysts (DOCs) in
series (pre-cat and main cat), which mainly decrease the
volatile content of exhaust PM. This combustion system
and aftertreatment configuration corresponds to one of
the most widespread diesel exhaust control configura-
tions for passenger cars in Europe today (the other one
being unit injectors with DOC). The vehicle was of low
mileage (�28,000 km) and it was regularly maintained
according to manufacturer specifications. The lubrica-
tion oil used was a 15W-40 grade (ACEA A3/B3) with
6000 ppm wt sulphur content. The vehicle was driven for
about 1000 km before the measurements. ‘‘Baseline’’
emission tests were performed with the vehicle in its
original configuration (no particle filter). It should be
stressed that the engine calibration was not changed
when a DPF was installed in the exhaust line.
Two fuels were used to address the effect of fuel
sulphur on particle emissions. These fulfilled the current
EN590 specifications (monaromatics 14%, polyaro-
matics 4.3%) for automotive diesel fuel and their exact
chemical character and physical properties are found
elsewhere (Ntziachristos et al., 2004b). The only
difference in fuel composition was their sulphur content.
The higher sulphur fuel (HSF—38ppm wt) was derived
from the lower sulphur one (LSF—8ppm wt) by doping
with sulphur compounds (thiophene and di-tertiarybu-
tyl-disulphide). These fuels were fed to the engine by an
external canister to avoid sulphur contamination of the
fuel transfer lines.
2.2. Measurement protocol
Each measurement day consisted of a series of
test cycles each using the same sampling protocol.
Measurements started with the certification NEDC
and a hot-start repetition of the urban part (UDC)
followed. Then, three cycles developed in the EU
Artemis project (Andre, 2004) were conducted to
ARTICLE IN PRESSL. Ntziachristos et al. / Atmospheric Environment 39 (2005) 4925–4936 4927
simulate operation over urban, rural and highway
conditions. The introduction of these additional cycles
in the protocol is important to characterize the emission
performance of the vehicle and the aftertreatment
systems in off-cycle conditions. Then, three steady speed
tests at 50, 90 and 120 kmh�1 were performed to obtain
SMPS particle size distributions. The net sampling time
per day was about 2 h, with the vehicle covering a
distance of about 115 km. Each measurement day was
repeated twice. The vehicle was conditioned for about
100 km before testing whenever a fuel change was
required.
2.3. Diesel particle filters
The two DPF systems examined were based on
different principles to enhance soot oxidation. The first
system utilizes a Ce-based additive (CeDPF) to reduce
soot ignition temperature and to allow regeneration at a
wider exhaust gas temperature range. The concentration
of Ce in the fuel was adjusted at 25 ppm for these
measurements. The filter material was SiC and the
monolith external dimensions were +144mm�L
152.4mm (5.6600 � 600 with a cell density of 200 cells
per square inch (cpsi) and a wall thickness of 0.38mm.
The second system was a catalysed soot filter (CSF) of
the same material and external dimensions with the first
one. The presence of Pt-catalyst in the second filter
assists soot oxidation, therefore no external additive was
required in this configuration. This second filter had a
cell density of 300 cpsi and a wall thickness of 0.30mm.
Material porosity and mean pore size were also larger
than the CeDPF (before the washcoat application).
0
2
4
6
8
10
12
14
0 100 200 300 400
Tra
p so
ot lo
adin
g (g
)
CSF+LSF
120 120
Accumul
12
0 100
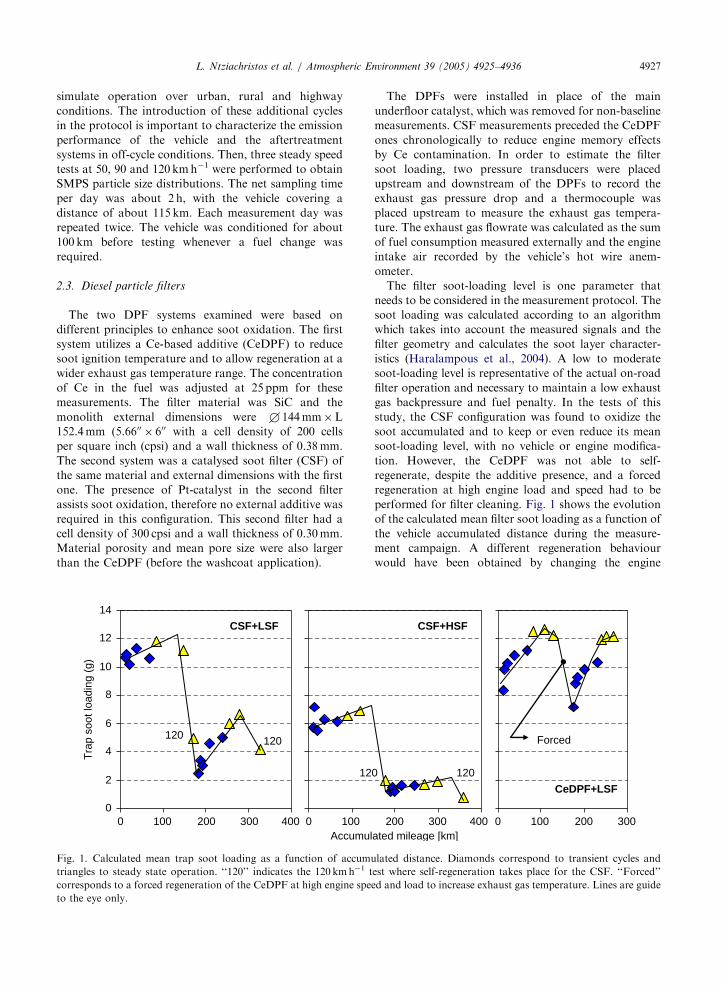
Fig. 1. Calculated mean trap soot loading as a function of accumu
triangles to steady state operation. ‘‘120’’ indicates the 120 kmh�1 t
corresponds to a forced regeneration of the CeDPF at high engine spe
to the eye only.
The DPFs were installed in place of the main
underfloor catalyst, which was removed for non-baseline
measurements. CSF measurements preceded the CeDPF
ones chronologically to reduce engine memory effects
by Ce contamination. In order to estimate the filter
soot loading, two pressure transducers were placed
upstream and downstream of the DPFs to record the
exhaust gas pressure drop and a thermocouple was
placed upstream to measure the exhaust gas tempera-
ture. The exhaust gas flowrate was calculated as the sum
of fuel consumption measured externally and the engine
intake air recorded by the vehicle’s hot wire anem-
ometer.
The filter soot-loading level is one parameter that
needs to be considered in the measurement protocol. The
soot loading was calculated according to an algorithm
which takes into account the measured signals and the
filter geometry and calculates the soot layer character-
istics (Haralampous et al., 2004). A low to moderate
soot-loading level is representative of the actual on-road
filter operation and necessary to maintain a low exhaust
gas backpressure and fuel penalty. In the tests of this
study, the CSF configuration was found to oxidize the
soot accumulated and to keep or even reduce its mean
soot-loading level, with no vehicle or engine modifica-
tion. However, the CeDPF was not able to self-
regenerate, despite the additive presence, and a forced
regeneration at high engine load and speed had to be
performed for filter cleaning. Fig. 1 shows the evolution
of the calculated mean filter soot loading as a function of
the vehicle accumulated distance during the measure-
ment campaign. A different regeneration behaviour
would have been obtained by changing the engine
ated mileage [km]
CSF+HSF
0 120
CeDPF+LSF
Forced
200 300 400 0 100 200 300
lated distance. Diamonds correspond to transient cycles and
est where self-regeneration takes place for the CSF. ‘‘Forced’’
ed and load to increase exhaust gas temperature. Lines are guide
ARTICLE IN PRESSL. Ntziachristos et al. / Atmospheric Environment 39 (2005) 4925–49364928
calibration, but this was not done here in order to keep
engine-out emissions at the same levels with the baseline.
2.4. Sampling
The conditions and procedures for airborne particle
sampling are critical for the interpretation of the results.
The particle sampling setup utilized in this study was
presented in detail elsewhere (Ntziachristos et al., 2004b)
and has been widely applied to characterize emissions
from passenger cars (Ntziachristos et al., 2004a) and
heavy duty engines (Thompson et al., 2004). Its main
task is to precisely condition aerosol samples drawn
from raw exhaust before measurement with several
instruments, to enable the comparison of particle
emissions from different sources (engines/vehicles) under
the same sampling conditions.
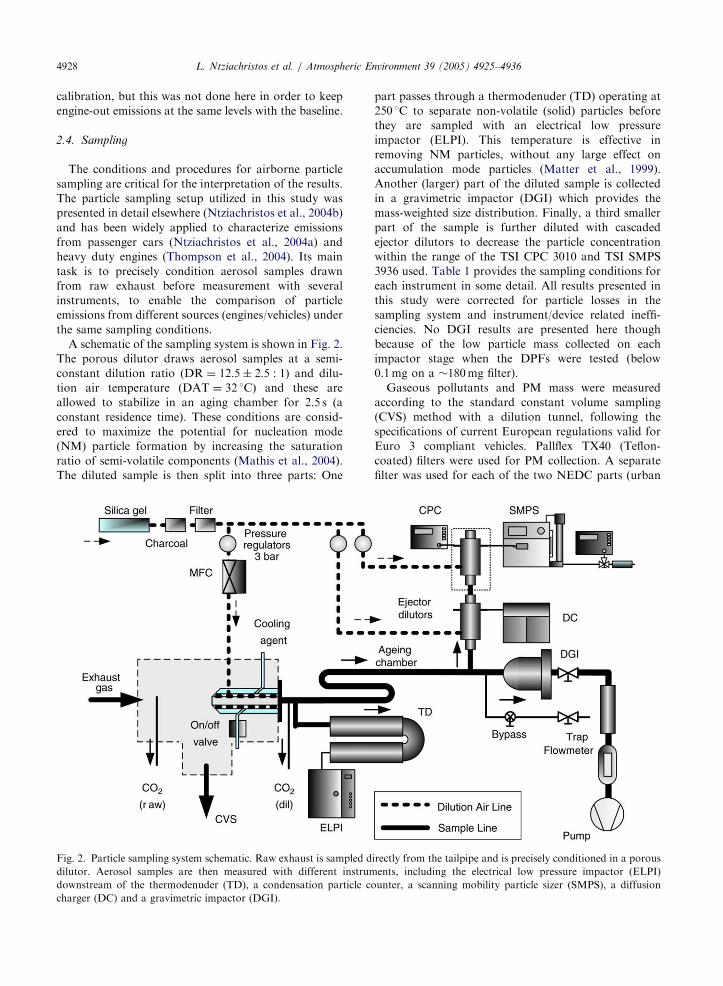
A schematic of the sampling system is shown in Fig. 2.
The porous dilutor draws aerosol samples at a semi-
constant dilution ratio ðDR ¼ 12:5� 2:5 : 1Þ and dilu-
tion air temperature ðDAT ¼ 32 1CÞ and these are
allowed to stabilize in an aging chamber for 2.5 s (a
constant residence time). These conditions are consid-
ered to maximize the potential for nucleation mode
(NM) particle formation by increasing the saturation
ratio of semi-volatile components (Mathis et al., 2004).
The diluted sample is then split into three parts: One
Fig. 2. Particle sampling system schematic. Raw exhaust is sampled d
dilutor. Aerosol samples are then measured with different instrum
downstream of the thermodenuder (TD), a condensation particle co
charger (DC) and a gravimetric impactor (DGI).
part passes through a thermodenuder (TD) operating at
250 1C to separate non-volatile (solid) particles before
they are sampled with an electrical low pressure
impactor (ELPI). This temperature is effective in
removing NM particles, without any large effect on
accumulation mode particles (Matter et al., 1999).
Another (larger) part of the diluted sample is collected
in a gravimetric impactor (DGI) which provides the
mass-weighted size distribution. Finally, a third smaller
part of the sample is further diluted with cascaded
ejector dilutors to decrease the particle concentration
within the range of the TSI CPC 3010 and TSI SMPS
3936 used. Table 1 provides the sampling conditions for
each instrument in some detail. All results presented in
this study were corrected for particle losses in the
sampling system and instrument/device related ineffi-
ciencies. No DGI results are presented here though
because of the low particle mass collected on each
impactor stage when the DPFs were tested (below
0.1mg on a �180mg filter).
Gaseous pollutants and PM mass were measured
according to the standard constant volume sampling
(CVS) method with a dilution tunnel, following the
specifications of current European regulations valid for
Euro 3 compliant vehicles. Pallflex TX40 (Teflon-
coated) filters were used for PM collection. A separate
filter was used for each of the two NEDC parts (urban
irectly from the tailpipe and is precisely conditioned in a porous
ents, including the electrical low pressure impactor (ELPI)
unter, a scanning mobility particle sizer (SMPS), a diffusion
ARTICLE IN PRESS
Table 1
Particle property measured by each instrument and aerosol sample condition upstream of the instrument inlet
Instrument Sampling property Total dilution ratio Temperature (1C) Residence time (s)
DGI Mass-weighted size
distribution
12.572.5 Tamb to Tamb+5 1C 2.5
ELPI+TD Solid particle total number
(7 nm–1mm) and size
distribution
12.572.5 Tamb+�10 1C 3.5
DC Total active surface of
airborne particles (7 nm–1 mm)
16575 Tamb 3.0
SMPS 3936L Number-weighted size
distribution (7.6–290 nm)
16575 (w. trap) Tamb 3.0 (w. trap)
19.370.5� 103 (baseline) 3.5 (baseline)
CPC 3010 Total particle number
4�5 nm
Similar to SMPS Tamb Similar to SMPS
0.5
0.6
0.7
Baseline
CSF
(g k
m-1
)NEDC
Euro 3
Euro 3
(Euro 3)
L. Ntziachristos et al. / Atmospheric Environment 39 (2005) 4925–4936 4929
and extra-urban) and the Artemis cycle. Only a primary
filter (no backup) was used to avoid sampling artefacts
when testing DPFs (Chase et al., 2004). All tests were
conducted at the facilities of the Laboratory of Applied
Thermodynamics, Mechanical Engineering Department,
Aristotle University of Thessaloniki.
0.0
0.1
0.2
0.3
0.4 CeDPF
Em
issi
on r
ate
8 ppm38 ppm 8 ppm 38 ppm 8 ppm 38 ppm
0.0
0.1
0.2
0.3
0.4
0.5
0.6
0.7
Em
issi
on r
ate
(g k
m-1
)
Artemis
NOx HC×10 CO
8 ppm38 ppm 8 ppm38 ppm 8 ppm38 ppm
NOx HC×10 CO
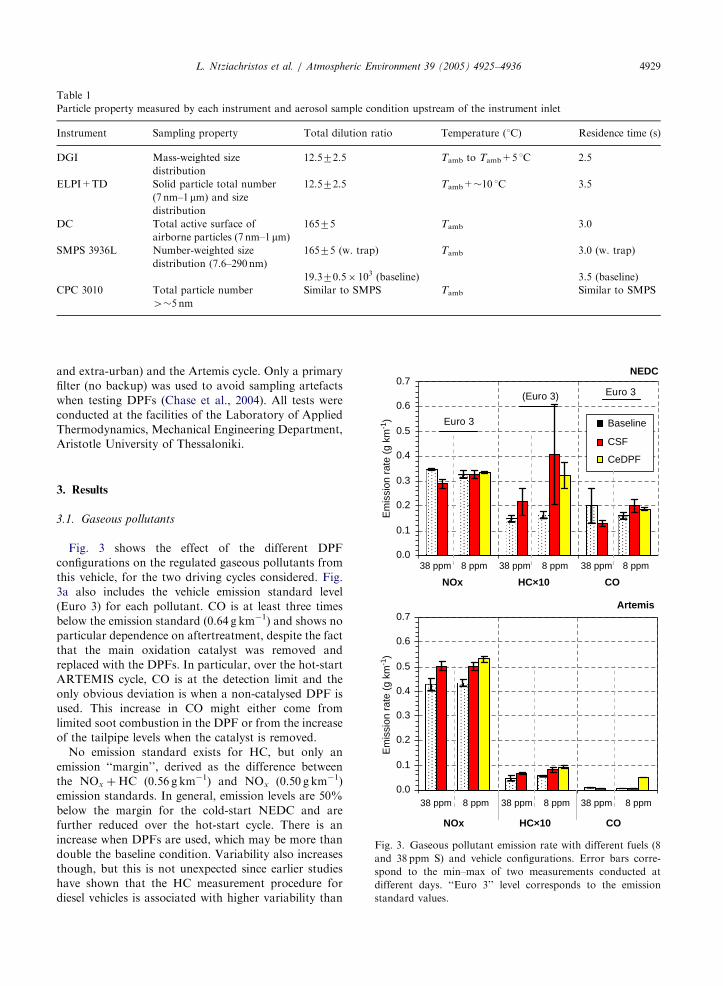
Fig. 3. Gaseous pollutant emission rate with different fuels (8
and 38 ppm S) and vehicle configurations. Error bars corre-
spond to the min–max of two measurements conducted at
different days. ‘‘Euro 3’’ level corresponds to the emission
standard values.
3. Results
3.1. Gaseous pollutants
Fig. 3 shows the effect of the different DPF
configurations on the regulated gaseous pollutants from
this vehicle, for the two driving cycles considered. Fig.
3a also includes the vehicle emission standard level
(Euro 3) for each pollutant. CO is at least three times
below the emission standard (0.64 g km�1) and shows no
particular dependence on aftertreatment, despite the fact
that the main oxidation catalyst was removed and
replaced with the DPFs. In particular, over the hot-start
ARTEMIS cycle, CO is at the detection limit and the
only obvious deviation is when a non-catalysed DPF is
used. This increase in CO might either come from
limited soot combustion in the DPF or from the increase
of the tailpipe levels when the catalyst is removed.
No emission standard exists for HC, but only an
emission ‘‘margin’’, derived as the difference between
the NOx þHC (0.56 g km�1) and NOx (0.50 g km�1)
emission standards. In general, emission levels are 50%
below the margin for the cold-start NEDC and are
further reduced over the hot-start cycle. There is an
increase when DPFs are used, which may be more than
double the baseline condition. Variability also increases
though, but this is not unexpected since earlier studies
have shown that the HC measurement procedure for
diesel vehicles is associated with higher variability than
ARTICLE IN PRESSL. Ntziachristos et al. / Atmospheric Environment 39 (2005) 4925–49364930
the measurement procedures for other pollutants
(Zervas et al., 2005; Mamakos et al., 2004). Increases
in total hydrocarbons most probably originate from the
removal of the oxidation catalyst, a fact specific to this
study only and could be remedied in the actual
application of such a system by properly dimensioning
the DOC. Similar to the CO, HC are not a priority
pollutant from diesel vehicles; therefore their emission
increase within such small ranges is not of particular
importance.
NOx is one of the key diesel pollutants. There are two
main and one secondary mechanism by which a DPF
may affect diesel engine-out NOx emissions. The
primary mechanism is by increasing the exhaust back-
pressure which in turn increases the engine load for the
same driving conditions. This may lead to an increase of
NOx emissions. At the same time, internal exhaust gas
recirculation (EGR) increases which has the opposite
effect on NOx emissions. Finally, NO2 may be consumed
in oxidizing PM in the filter but this is only a small
fraction of the total emissions. In general, engine
manufacturers are able to tune the engine-out NOx
emissions by adjusting the combustion parameters (fuel
timing, EGR, etc.), depending on the aftertreatment
system used. No adjustments were made to the engine of
the test vehicle in conjunction with retrofitting with the
DPFs here. NOx emissions over the lower power NEDC
were at 70% of the emission standard and showed no
appreciable effect with the DPFs. Up to a 25% increase
was observed over the power demanding Artemis cycle
for our vehicle with the DPFs. Since the engine was not
recalibrated for DPF use, we may suggest that none of
the DPFs tested have a significantly negative effect on
NOx emissions, at least to the extent that it would be
impossible to correct by engine recalibration. In addi-
tion, use of a DPF reduces the design stringency on
engine-out PM levels, thus a NOx favourable calibration
could be used for the commercial application of such a
system.
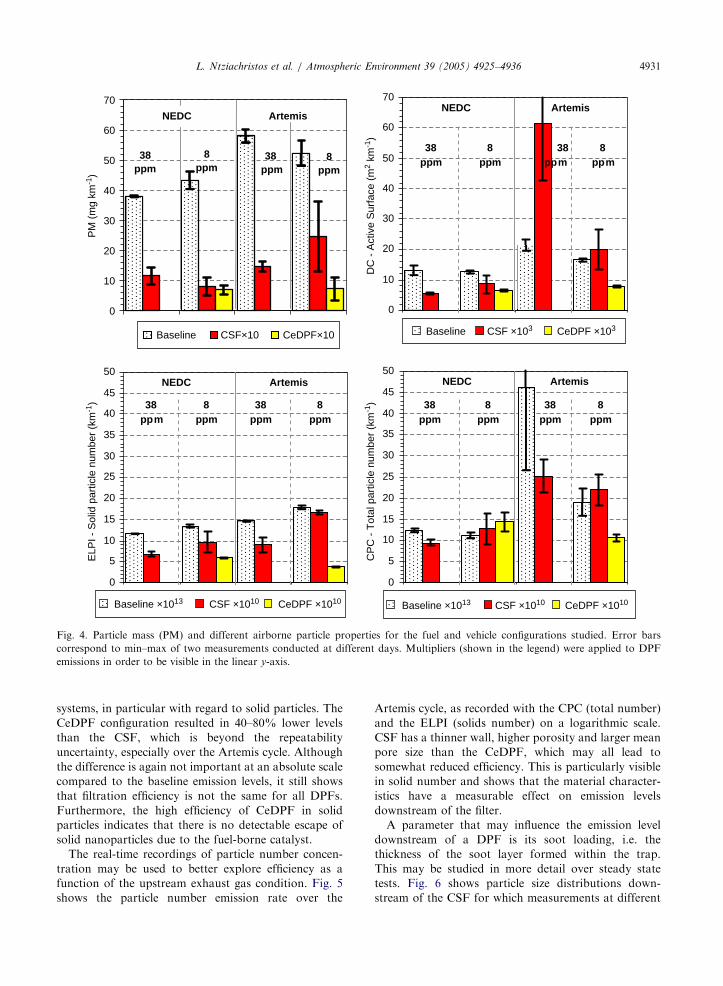
3.2. PM and airborne particle properties
The effect of DPFs on particle properties (total and
solid particle number and total active surface) and PM is
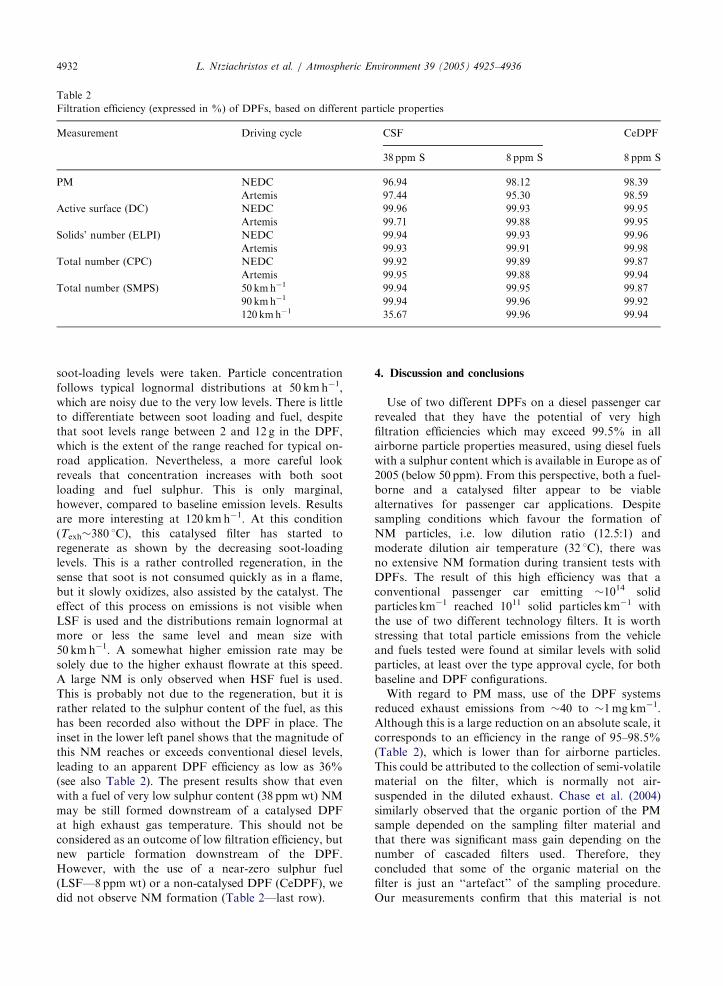
shown in Fig. 4. Based on these data, Table 2
summarizes the DPF efficiency in reducing PM and
the airborne particle properties measured. Starting with
PM mass, DPFs appear to be at least 95% effective in
removing particle mass from the exhaust. In particular,
over the NEDC, PM emission levels are reduced from
�40 to �1mgkm�1. However, since these very low PM
emission levels are generally associated with poor
measurement repeatability, the mass values quoted here
should be considered approximate (Zervas et al., 2005).
Reductions are even more impressive when looking
at airborne particle properties, with emission levels
decreasing with the DPF systems by three orders of
magnitude. Solid particle number decreases from slightly
above 1014 particle km�1 to below 1011 particle km�1. Total
particle number reduction is also in the same range, but
emissions downstream of the DPF are 20% (NEDC) to
twice higher (Artemis) than the 1011 particle km�1 level.
However, it needs to be considered in the comparisons
that, when a DPF is used, the repeatability of total particle
number measurement is in the range of 20–80% (expressed
as 1.96 times the relative standard deviation—see Zervas et
al., 2005). Active surface is found at �70 cm2km�1
downstream of the DPF compared to 12–13m2km�1 at
baseline configuration.
Focusing on fuel sulphur effects on baseline emis-
sions, the first observation is that its effect is negligible
over the NEDC for all particle properties. Use of 8 ppm
instead of 38 ppm sulphur fuel results in +11% PM and
solid particle number, �10% total particle number and
no difference in the active surface area. These differences
may well be considered within the experimental un-
certainty of the measurement. However, there is a
measurable effect over the Artemis cycle with total
particle number decreasing by 60% and total surface
area by 23% when reducing the fuel sulphur content.
The increase of total particle number at high speeds
when a non-zero sulphur fuel and a DOC are used has
been frequently observed in the past (Maricq et al., 2002;
Vogt et al., 2003). This has been attributed to sulphate
formation downstream of the DPFs as the exhaust gas
temperature increases and was actually confirmed here
with an additional vehicle of the same type.
The effect of sulphur on post-DPF emissions is similar
to the baseline measurements, with effects only found
over the high-speed Artemis cycle. When the CSF is in
place, the CPC/ELPI (total over solid particle number)
ratio is in the range of 1.32–1.40 for all fuel and cycle
configurations, except over the Artemis cycle using the
higher sulphur fuel, when it actually doubles to 2.64. At
the same time, active surface recorded with the DC is
three times higher over the Artemis than over the
NEDC, when using the HSF fuel. All these occur with
no appreciable difference in the solid particle number
(ELPI) NEDC/Artemis ratio which remains at 0.6–0.7
for the CSF, regardless of the fuel sulphur level. These
results show that the fuel sulphur content may have an
effect on semi-volatile particle nucleation when using a
DPF, even in the sub-50 ppm range. However, the effect
is negligible in the type-approval cycle and limited to the
high-speed cycle, despite the fact that favourable
conditions for particle nucleation were applied.
3.3. Detailed trap operation/efficiency
Fig. 4 may further be used to compare the efficiency of
the two systems. There is a repeatable and measurable
difference in concentration downstream of the two DPF
ARTICLE IN PRESS
0
10
20
30
40
50
60
70P
M (
mg
km-1
)
38 ppm
8ppm
NEDC Artemis
38 ppm
8ppm
Baseline CSF×10 CeDPF×10
0
10
20
30
40
50
60
70
DC
- A
ctiv
e S
urfa
ce (
m2
km-1
)
NEDC Artemis
38 ppm
8 ppm
38 ppm
8 ppm
Baseline CSF ×103 CeDPF ×103
0
5
10
15
20
25
30
35
40
45
50
ELP
I - S
olid
par
ticle
num
ber
(km
-1)
NEDC Artemis
38 ppm
8 ppm
8 ppm
38 ppm
Baseline ×1013 CSF ×1010 CeDPF ×1010
0
5
10
15
20
25
30
35
40
45
50C
PC
- T
otal
par
ticle
num
ber
(km
-1)
NEDC Artemis
38 ppm
8 ppm
38 ppm
8 ppm
Baseline ×1013 CSF ×1010 CeDPF ×1010
Fig. 4. Particle mass (PM) and different airborne particle properties for the fuel and vehicle configurations studied. Error bars
correspond to min–max of two measurements conducted at different days. Multipliers (shown in the legend) were applied to DPF
emissions in order to be visible in the linear y-axis.
L. Ntziachristos et al. / Atmospheric Environment 39 (2005) 4925–4936 4931
systems, in particular with regard to solid particles. The
CeDPF configuration resulted in 40–80% lower levels
than the CSF, which is beyond the repeatability
uncertainty, especially over the Artemis cycle. Although
the difference is again not important at an absolute scale
compared to the baseline emission levels, it still shows
that filtration efficiency is not the same for all DPFs.
Furthermore, the high efficiency of CeDPF in solid
particles indicates that there is no detectable escape of
solid nanoparticles due to the fuel-borne catalyst.
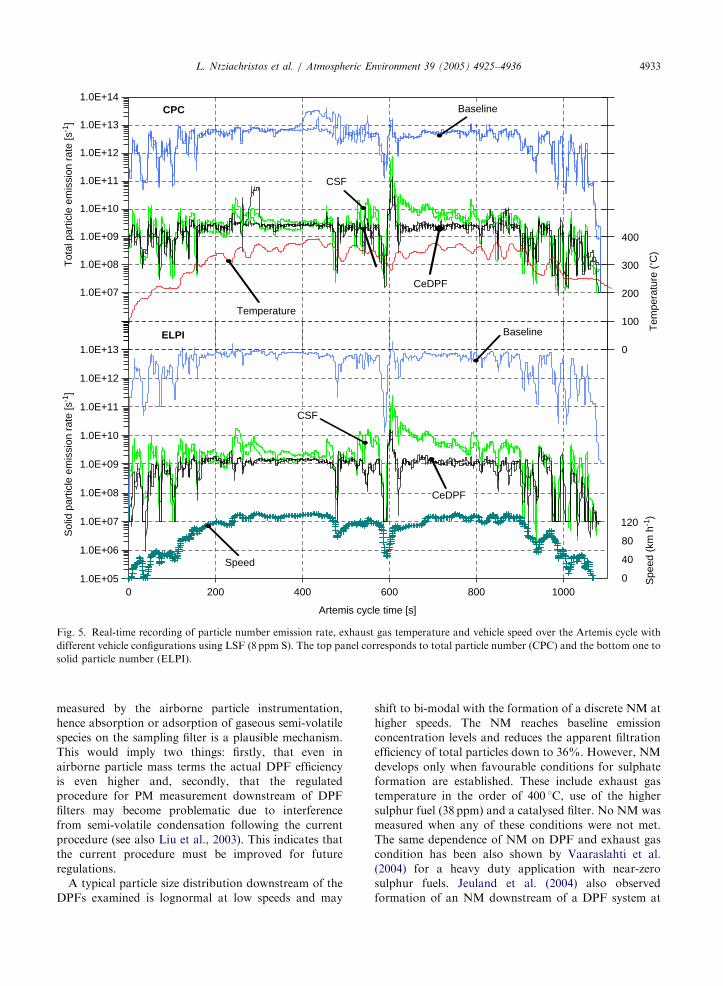
The real-time recordings of particle number concen-
tration may be used to better explore efficiency as a
function of the upstream exhaust gas condition. Fig. 5
shows the particle number emission rate over the
Artemis cycle, as recorded with the CPC (total number)
and the ELPI (solids number) on a logarithmic scale.
CSF has a thinner wall, higher porosity and larger mean
pore size than the CeDPF, which may all lead to
somewhat reduced efficiency. This is particularly visible
in solid number and shows that the material character-
istics have a measurable effect on emission levels
downstream of the filter.
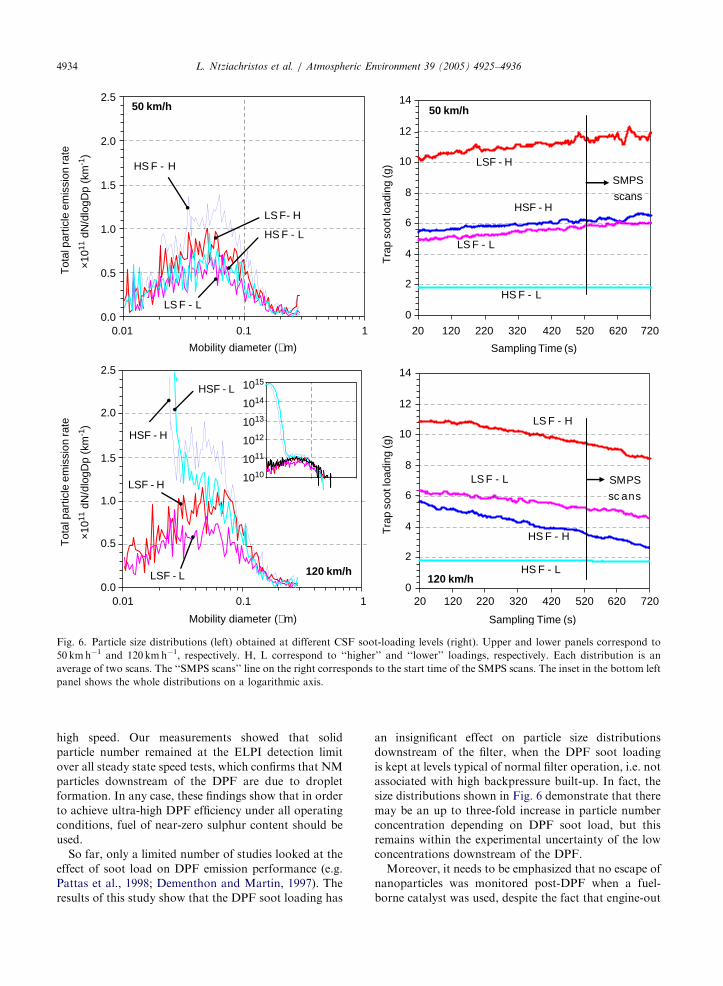
A parameter that may influence the emission level
downstream of a DPF is its soot loading, i.e. the
thickness of the soot layer formed within the trap.
This may be studied in more detail over steady state
tests. Fig. 6 shows particle size distributions down-
stream of the CSF for which measurements at different
ARTICLE IN PRESS
Table 2
Filtration efficiency (expressed in %) of DPFs, based on different particle properties
Measurement Driving cycle CSF CeDPF
38ppm S 8 ppm S 8 ppm S
PM NEDC 96.94 98.12 98.39
Artemis 97.44 95.30 98.59
Active surface (DC) NEDC 99.96 99.93 99.95
Artemis 99.71 99.88 99.95
Solids’ number (ELPI) NEDC 99.94 99.93 99.96
Artemis 99.93 99.91 99.98
Total number (CPC) NEDC 99.92 99.89 99.87
Artemis 99.95 99.88 99.94
Total number (SMPS) 50 kmh�1 99.94 99.95 99.87
90 kmh�1 99.94 99.96 99.92
120 kmh�1 35.67 99.96 99.94
L. Ntziachristos et al. / Atmospheric Environment 39 (2005) 4925–49364932
soot-loading levels were taken. Particle concentration
follows typical lognormal distributions at 50 kmh�1,
which are noisy due to the very low levels. There is little
to differentiate between soot loading and fuel, despite
that soot levels range between 2 and 12 g in the DPF,
which is the extent of the range reached for typical on-
road application. Nevertheless, a more careful look
reveals that concentration increases with both soot
loading and fuel sulphur. This is only marginal,
however, compared to baseline emission levels. Results
are more interesting at 120 kmh�1. At this condition
(Texh�380 1C), this catalysed filter has started to
regenerate as shown by the decreasing soot-loading
levels. This is a rather controlled regeneration, in the
sense that soot is not consumed quickly as in a flame,
but it slowly oxidizes, also assisted by the catalyst. The
effect of this process on emissions is not visible when
LSF is used and the distributions remain lognormal at
more or less the same level and mean size with
50 kmh�1. A somewhat higher emission rate may be
solely due to the higher exhaust flowrate at this speed.
A large NM is only observed when HSF fuel is used.
This is probably not due to the regeneration, but it is
rather related to the sulphur content of the fuel, as this
has been recorded also without the DPF in place. The
inset in the lower left panel shows that the magnitude of
this NM reaches or exceeds conventional diesel levels,
leading to an apparent DPF efficiency as low as 36%
(see also Table 2). The present results show that even
with a fuel of very low sulphur content (38 ppm wt) NM
may be still formed downstream of a catalysed DPF
at high exhaust gas temperature. This should not be
considered as an outcome of low filtration efficiency, but
new particle formation downstream of the DPF.
However, with the use of a near-zero sulphur fuel
(LSF—8ppm wt) or a non-catalysed DPF (CeDPF), we
did not observe NM formation (Table 2—last row).
4. Discussion and conclusions
Use of two different DPFs on a diesel passenger car
revealed that they have the potential of very high
filtration efficiencies which may exceed 99.5% in all
airborne particle properties measured, using diesel fuels
with a sulphur content which is available in Europe as of
2005 (below 50 ppm). From this perspective, both a fuel-
borne and a catalysed filter appear to be viable
alternatives for passenger car applications. Despite
sampling conditions which favour the formation of
NM particles, i.e. low dilution ratio (12.5:1) and
moderate dilution air temperature (32 1C), there was
no extensive NM formation during transient tests with
DPFs. The result of this high efficiency was that a
conventional passenger car emitting �1014 solid
particles km�1 reached 1011 solid particles km�1 with
the use of two different technology filters. It is worth
stressing that total particle emissions from the vehicle
and fuels tested were found at similar levels with solid
particles, at least over the type approval cycle, for both
baseline and DPF configurations.
With regard to PM mass, use of the DPF systems
reduced exhaust emissions from �40 to �1mg km�1.
Although this is a large reduction on an absolute scale, it
corresponds to an efficiency in the range of 95–98.5%
(Table 2), which is lower than for airborne particles.
This could be attributed to the collection of semi-volatile
material on the filter, which is normally not air-
suspended in the diluted exhaust. Chase et al. (2004)
similarly observed that the organic portion of the PM
sample depended on the sampling filter material and
that there was significant mass gain depending on the
number of cascaded filters used. Therefore, they
concluded that some of the organic material on the
filter is just an ‘‘artefact’’ of the sampling procedure.
Our measurements confirm that this material is not
ARTICLE IN PRESS
1.0E+05
1.0E+06
1.0E+07
1.0E+08
1.0E+09
1.0E+10
1.0E+11
1.0E+12
0 200 400 600 800 10000
40
120
Artemis cycle time [s]
Sol
id p
artic
le e
mis
sion
rat
e [s
-1]
Spe
ed (
km h
-1)
1.0E+07
1.0E+08
1.0E+09
1.0E+10
1.0E+11
1.0E+12
1.0E+13
1.0E+14
0
100
200
300
400
Tot
al p
artic
le e
mis
sion
rat
e [s
-1]
Tem
pera
ture
(° C
)
1.0E+13
80
CPC
ELPI
CSF
Baseline
CeDPF
Temperature
CSF
Speed
CeDPF
Baseline
Fig. 5. Real-time recording of particle number emission rate, exhaust gas temperature and vehicle speed over the Artemis cycle with
different vehicle configurations using LSF (8 ppm S). The top panel corresponds to total particle number (CPC) and the bottom one to
solid particle number (ELPI).
L. Ntziachristos et al. / Atmospheric Environment 39 (2005) 4925–4936 4933
measured by the airborne particle instrumentation,
hence absorption or adsorption of gaseous semi-volatile
species on the sampling filter is a plausible mechanism.
This would imply two things: firstly, that even in
airborne particle mass terms the actual DPF efficiency
is even higher and, secondly, that the regulated
procedure for PM measurement downstream of DPF
filters may become problematic due to interference
from semi-volatile condensation following the current
procedure (see also Liu et al., 2003). This indicates that
the current procedure must be improved for future
regulations.
A typical particle size distribution downstream of the
DPFs examined is lognormal at low speeds and may
shift to bi-modal with the formation of a discrete NM at
higher speeds. The NM reaches baseline emission
concentration levels and reduces the apparent filtration
efficiency of total particles down to 36%. However, NM
develops only when favourable conditions for sulphate
formation are established. These include exhaust gas
temperature in the order of 400 1C, use of the higher
sulphur fuel (38 ppm) and a catalysed filter. No NM was
measured when any of these conditions were not met.
The same dependence of NM on DPF and exhaust gas
condition has been also shown by Vaaraslahti et al.
(2004) for a heavy duty application with near-zero
sulphur fuels. Jeuland et al. (2004) also observed
formation of an NM downstream of a DPF system at
ARTICLE IN PRESS
0.0
0.5
1.0
1.5
2.0
2.5
0.0
0.5
1.0
1.5
2.0
2.5
0.01 0.1 1
Mobility diameter (µm)
50 km/h
HS F - H
LS F- H
LS F - L
HS F - L
Tot
al p
artic
le e
mis
sion
rate
×10
11 d
N/d
logD
p (k
m-1
)
0
2
4
6
8
10
12
14
20 120 220 320 420 520 620 720
Sampling Time (s)
Tra
p so
ot lo
adin
g (g
)
50 km/h
SMPS
scansHSF - H
LS F - L
HS F - L
0.01 0.1 1
Mobility diameter (µm)
120 km/h
Tot
al p
artic
le e
mis
sion
rate
×10
11 d
N/d
logD
p (k
m-1
)
HSF - H
LSF - L
HSF - L
LSF - H
0
2
4
6
8
10
12
14
20 120 220 320 420 520 620 720
Sampling Time (s)
Tra
p so
ot lo
adin
g (g
)
120 km/h
SMPS
sc ans
HS F - H
LS F - H
LS F - L
HS F - L
1015
1014
1013
1012
1011
1010
LSF - H
Fig. 6. Particle size distributions (left) obtained at different CSF soot-loading levels (right). Upper and lower panels correspond to
50 kmh�1 and 120kmh�1, respectively. H, L correspond to ‘‘higher’’ and ‘‘lower’’ loadings, respectively. Each distribution is an
average of two scans. The ‘‘SMPS scans’’ line on the right corresponds to the start time of the SMPS scans. The inset in the bottom left
panel shows the whole distributions on a logarithmic axis.
L. Ntziachristos et al. / Atmospheric Environment 39 (2005) 4925–49364934
high speed. Our measurements showed that solid
particle number remained at the ELPI detection limit
over all steady state speed tests, which confirms that NM
particles downstream of the DPF are due to droplet
formation. In any case, these findings show that in order
to achieve ultra-high DPF efficiency under all operating
conditions, fuel of near-zero sulphur content should be
used.
So far, only a limited number of studies looked at the
effect of soot load on DPF emission performance (e.g.
Pattas et al., 1998; Dementhon and Martin, 1997). The
results of this study show that the DPF soot loading has
an insignificant effect on particle size distributions
downstream of the filter, when the DPF soot loading
is kept at levels typical of normal filter operation, i.e. not
associated with high backpressure built-up. In fact, the
size distributions shown in Fig. 6 demonstrate that there
may be an up to three-fold increase in particle number
concentration depending on DPF soot load, but this
remains within the experimental uncertainty of the low
concentrations downstream of the DPF.
Moreover, it needs to be emphasized that no escape of
nanoparticles was monitored post-DPF when a fuel-
borne catalyst was used, despite the fact that engine-out
ARTICLE IN PRESSL. Ntziachristos et al. / Atmospheric Environment 39 (2005) 4925–4936 4935
nanoparticle formation caused by fuel additives was
reported in the past (Burtscher et al., 1999). Never-
theless, there is the need to specifically assess the
potential for Ce emissions in both well running
and poorly running vehicles with traps, in order to
evaluate the impact of Ce release to the environment
based on plausible emissions and hence to address
concerns with respect to secondary emissions of non-
regulated pollutants.
Acknowledgements
This work was conducted in the framework of the
‘‘Particulates’’ project (Contract no. 2000RD.11091),
funded by the European Commission Directorate
General Energy and Transport. The authors would like
to acknowledge Dr. Panayotis Pistikopoulos, Barouch
Giechaskiel, Athanasios Mamakos and Argyrios Tzilvelis
for support in the experimental and computational part
of this work.
References
ACEA, 2004. New passenger car registrations in Western
Europe. Available online at www.acea.be.
Andersson, J.D., Wedekind, B.G.A., Hall, D., Stradling, R.,
Wilson, G., 2002. DETR/SMMT/CONCAWE particulate
research program: light-duty results. SAE Technology
Paper 2001-01-3577.
Andre, M., 2004. The ARTEMIS European driving cycles for
measuring car pollutant emissions. Science of the Total
Environment 334–335, 73–84.
Ball, B., Hully, D., Lausseur, Ph., Lyons, N., 2004. Experience
of continuously regenerating particulate traps on city buses
in Europe. SAE Technology Paper 2004-01-0078.
Burtscher, H., Matter, U., Skillas, G., Zhiqiang, Q., 1999.
Particles in diesel exhaust caused by fuel additives. Journal
of Aerosol Science 29, S955–S956.
Chase, R.E., Duszkiewicz, G.J., Richert, J.F.O., Lewis, D.,
Maricq, M.M., Xu, N., 2004. PM measurement artifact:
organic vapor deposition on different filter media. SAE
Technology Paper 2004-01-0967.
Dementhon, J.-B., Martin, B., 1997. Influence of various diesel
traps on particulate size distribution. SAE Technology
Paper 972999.
Durbin, T.D., Zhu, X., Norbeck, J.M., 2003. The effects of
diesel particulate filters and a low-aromatic, low-sulphur
diesel fuel on emissions for medium-duty diesel trucks.
Atmospheric Environment 37, 2105–2116.
Haralampous, O.A., Kandylas, I.P., Koltsakis, G.C., Samaras,
Z.C., 2004. Diesel particulate filter pressure drop Part 2: on-
board calculation of soot loading. International Journal
Engine Research 5, 163–173.
Jeuland, N., Dementhon, J.B., Gagnepain, L., Plassat, G.,
Coroller, P, Momique, J.C., Belot, G., Dalili, D., 2004.
Performances and durability of DPF (diesel particulate
filter) tested on a fleet of Peugeot 607 taxis: final results.
SAE Technology Paper 2004-01-0073.
Joubert, E., Sequelong, Th., 2004. Diesel particulate filters
market introduction in Europe: review and status. 10th
annual DEER Conference, Coronado, CA, USA, Septem-
ber 2004.
Lanni, Th., 2003. Fine urban and precursor emissions control
for diesel urban transit buses. Environmental Pollution 123,
427–437.
Liu, Z.G., Skemp, M.D., Lincoln, J.C., 2003. Diesel particulate
filters: trends and implications of particle size distribution
measurement. SAE Technology Paper 2003-01-0046.
Mamakos, A., Ntziachristos, L., Samaras, Z., 2004. Compar-
ability of particle emission measurements between vehicle
testing laboratories: a long way to go. Measurement Science
and Technology 15, 1855–1866.
Maricq, M.M., Chase, R.E., Xu, N., Laing, P.M., 2002. The
effects of the catalytic converter and fuel sulphur level on
motor vehicle particulate matter emissions: light duty diesel
vehicles. Environmental Science Technology 36, 283–289.
Mathis, U., Ristimaki, J., Mohr, M., Keskinen, J., Ntziachris-
tos, L., Samaras, Z., Mikkanen, P., 2004. Sampling
conditions for the measurement of nucleation mode
particles in the exhaust of a Diesel vehicle. Aerosol Science
and Technology 38, 1149–1160.
Mathis, U., Mohr, M., Forss, A.-M., 2005. Comprehensive
particle characterization of modern gasoline and diesel
passenger cars at low ambient temperatures. Atmospheric
Environment 39, 107–117.
Matter, U., Siegmann, H., Burtscher, H., 1999. Dynamic field
measurements of submicron particles from diesel engines.
Environmental Science Technology 33, 1946–1952.
Mayer, A., Matter, U., Scheidegger, G., Czerwinski, J., Wyser,
M., Kieser, D., Weidhofer, J., 1999. Particulate traps for retro-
fitting construction site engines-VERT: final measurements
and implementation. SAE Technology Paper 1999-01-0116.
Mohr, M., Forss, A.-M., Steffen, D., 2000. Particulate
emissions of gasoline vehicles and influence of the sampling
procedure. SAE Technology Paper 2000-01-1137.
Ntziachristos, L., Samaras, Z., Mohr, M., Mathis, U.,
Keskinen, J., Ristimaki, J., Mikkanen, P., Vogt, R.,
2004a. Performance evaluation of a novel sampling and
measurement system for exhaust particle characterization.
SAE Technology Paper 2004-01-1439.
Ntziachristos, L., Mamakos, A., Samaras, Z., Mathis, U.,
Mohr, M., Thompson, N., Stradling, R., Forti, L., de
Serves, C., 2004b. Overview of the European ‘‘Particulates’’
project on the characterization of exhaust particulate
emissions from road vehicles: results for light-duty vehicles.
SAE Technology Paper 2004-01-1985.
Pattas, K., Kyriakis, N., Samaras, Z., Pistikopoulos, P.,
Ntziachristos, L., 1998. Effect of DPF on particulate size
distribution using an electrical low pressure impactor. SAE
Technology Paper 980544.
Sequelong, Th., Biancotto, D., Georges, H., Blanchard, G.P.,
Macaudiere, P.J, Grellier, J.-M., 2004. Retrofit program of a
Euro 1 and Euro 2 urban bus fleet in La Rochelle,
using the ceria-based fuel-borne catalyst for diesel particulate
filter regeneration. SAE Technology Paper 2004-01-0821.
Thompson, N., Ntziachristos, L., Samaras, Z., Aakko, P.,
Wass, U., Hausberger, S., Sams, Th., 2004. Overview of
ARTICLE IN PRESSL. Ntziachristos et al. / Atmospheric Environment 39 (2005) 4925–49364936
the European ‘‘Particulates’’ project on the characterization
of exhaust particulate emissions from road vehicles: results
for heavy-duty engines. SAE Technology Paper 2004-01-
1986.
Vaaraslahti, K., Virtanen, A., Ristimaki, J., Keskinen, J., 2004.
Nucleation mode formation in heavy-duty diesel exhaust
with and without a particulate filter. Environmental Science
Technology 38, 4884–4890.
Vogt, R., Scheer, V., Casati, R., Benter, T., 2003. On-road
measurement of particle emission in the exhaust plume of a
diesel passenger car. Environmental Science Technology 37,
4070–4076.
Zervas, E., Dorlhene, P., Forti, L., Perrin, C., Momique, J.C.,
Monier, R., Ing, H., Lopez, B., 2005. Exhaust gas particle
number measurement. Inter-laboratory study using ELPI.
Aerosol Science and Technology 39, 333–346.