Embed Size (px)
Citation preview
United States Patent (19) Haugland et al.
(54) DUAL-FLUORESCENCE CELL VIABILITY ASSAY USING ETHOUM HOMODIMER AND CALCEN AM
75 Inventors: Richard P. Haugland, Eugene, Oreg.; Ian C. MacCoubrey, Blacksburg, Va.; Patrick L. Moore, West Roxbury, Mass.
73) Assignee: Molecular Probes, Inc., Eugene, Oreg.
(21) Appl. No.: 783,182 22 Filed: Oct. 28, 1991 51 Int. Cl. ......................... C12Q 1/02; C12O 1/68;
C12Q 1/04 52 U.S. C. .......................................... 435/29; 435/6;
435/34; 435/968; 436/800 58) Field of Search ....................... 435/6, 29, 34, 968;
436/800
(56) References Cited U.S. PATENT DOCUMENTS
5,00,051 3/1991 Miller ...................................... 435/6
OTHER PUBLICATIONS
Haugland, Handbook of Fluorescent Probes and Re search Chemicals, Sets 24 and 28 (1989-1991). I. C. MacCoubrey, P. L. Moore, R. P. Haugland, Quan titative Fluorescence Measurements of Cell Viability (Cy totoxicity) with a Multi-Well Plate Scanner, J Cell Biol 111, 58A (Abstract 303). P. L. Moore, I. C. MacCoubrey, R. P. Haugland, A Rapid, ph Insensitive, Two Color Fluorescence Viability (Cytotoxicity) Assay, J. Cell Biol l l 1, 58A (Abstract 304). Primary Examiner-Michael G. Wityshyn Assistant Examiner-Ralph Gitomer Attorney, Agent, or Firm-Allegra J. Helfenstein 57 ABSTRACT This invention relates to a method for simultaneously detecting live and dead cells using two fluorogenic
||||||I|||||||||||| USOOS314805A
11 Patent Number: 5,314,805 45) Date of Patent: May 24, 1994
reagents: calcein AM and ethidium homodimer. Live cells are distinguished by an intense uniform green fluo rescence generated by the enzymatic hydrolysis of cal cein AM:
(ChicochocCH) N(CH2COCH2OCCH3)2
OCH:0CH, O O
Dead or damaged cells are distinguished by a bright red fluorescence resulting from nucleic acids stained with ethidium homodimer:
The assay is useful to determine cell viability and to monitor cytotoxicity agents or events.
20 Claims, 4 Drawing Sheets
U.S. Patent May 24, 1994 Sheet 1 of 4 5,314,805
s es.
E 5 "O O S
s - 2
E 8 g as E S S.
o o NZ O O O C 8 8 8 O) O V CN
L A Sueu UeoSejon
sO s
A SueulueoSeon
U.S. Patent May 24, 1994 Sheet 2 of 4 5,314,805
U.S. Patent May 24, 1994 Sheet 3 of 4 5,314,805
s i; 9 C) as St
& h C)
i8 O
8 O O St X h C) O
E O F
d O
O
8 8 8 NO S O A Sueu Ueose On
5,314,805 1
DUAL-FLUORESCENCE CELL VABILITY ASSAY USING ETHIDIUM HOMODIMER AND CALCEN
AM
This invention was made with Government support under GM 37347 awarded by the National Institutes of Health. The Government has certain rights in this in vention.
FIELD OF THE INVENTION
This invention describes the use of calcein-AM and ethidium homodimer reagents in a two-color fluores cence assay that permits the simultaneous or sequential determination of live and dead cells. The assay is useful to determine cell viability and to monitor cytotoxicity resulting from interaction of the cells with cytotoxic agents or conditions.
BACKGROUND INFORMATION
Evaluation of the viability of biological cells through cytotoxicity measurements is important for assessing the effect of drugs, environmental pollutants, tempera ture and ionic extremes, radiation and irradiation, other cells and biological modifiers and other potentially ad verse factors on cells and tissues. Cell membrane integ rity is commonly used to indicate cell viability. Loss of the protective cell membrane results in loss of cell struc ture, loss of critical intracellular contents, loss of essen tial ionic gradients and loss of electrical potential. The inevitable result of a major loss of membrane integrity is cell death. While there is not an exact equivalence between an
intact cell membrane and the term "viability' (techni cally defined as the ability of a cell to maintain its exis tence), it is common to refer to cells that have intact membranes as "viable' cells and cells where the mem brane has been irreversibly disrupted by a cytotoxic reagent as "dead' cells. There is, of course an interme diate condition where a cell that retains its membrane is in the process of "dying'. A dying cell is not actually viable in that it cannot be cultured or reproduce. Dying cells are nevertheless often counted as living by com mon screening tests that rely on cell membrane integ rity. A common feature of loss of membrane integrity is
the formation of pores which permit the passage of low molecular weight molecules (MWC2000 Daltons) in and out of the cytoplasm. This enhanced permeability has been the basis of many cell viability and cytotoxicity evaluations. The most common methods in use for cyto toxicity/viability measurements are Cr release, which uses a radioactive dye, and Trypan Blue exclusion, which uses a colored, non-fluorescent dye.
Fluorescent dyes can be detected with greater sensi tivity than can colored dyes and do not have the dis posal problems associated with the use of radioactive materials. The combination of different colored fluores cent probes to simultaneously detect live and dead cells is generally described by Haugland, HANDBOOK OF FLUORESCENT PROBES AND RESEARCH CHEMICALS, Set 24 (1989-91). Haugland suggests combining the use of a non-polar membrane permeant derivative that is converted to a polar fluorescent prod uct inside live cells and a polar tracer of another color that is excluded from cells until the membrane is rup tured. Propidium iodide is mentioned as the most com mon fluorescent polar tracer complementary to those
5
10
15
20
25
30
35
40
45
50
55
65
2 that are retained in live cells, although the reference also notes the potential usefulness of ethidium bromide and ethidium monoazide. Haugland and others have described the use of fluorescein, particularly carboxy fluorescein diacetate, with propidium iodide, for exam ple for use with flow cytometry for sorting live and dead cells, Two problems with the use of carboxy fluorescein
diacetate are leakage from cells following hydrolysis and sensitivity to intracellular pH. Inside living cells, calcein AM is hydrolyzed to a fluorescent dye, calcein, that is well retained by cells, as described in the Haug land reference. The reference does not mention the simultaneous use of calceiin AM in combination with any other dye used to detect dead cells. Calcein is less sensitive to intracellular pH than other fluorescein com pounds, making it less likely to be quenched in intracel lular environments. Although ethidium homodimer is also described in
the Haugland reference (Set 28), the use of ethidium honodimer as a viability stain for cells is not described. Ethidium homodimer has exceptionally high affinity for nucleic acids that is several orders of magnitude greater than ethidium bromide or propidium iodide. It is this high affinity that facilitates the simple, no wash, proce dure of this invention. The use of propidium iodide results in unbound dye causing background fluores cence, which usually necessitates washing the cells after combination with the reagent. In contrast, the greater affinity of ethidium homodimer for nucleic acids results in virtually no background fluorescence, thus removing the requirement for washing cells and simplifying and accelerating the assay. The lack of background fluores cence and increased sensitivity related to the use of ethidium homodimer and calcein AM results in a two color fluorescence assay that can detect fewer cells using a smaller sample. The combination of ethidium homodimer and calcein AM has not previously been suggested as or demonstrated to be suitable for a simul taneous or sequential two-color fluorescence assay of cell viability and cytotoxicity.
DESCRIPTION OF THE DRAWINGS
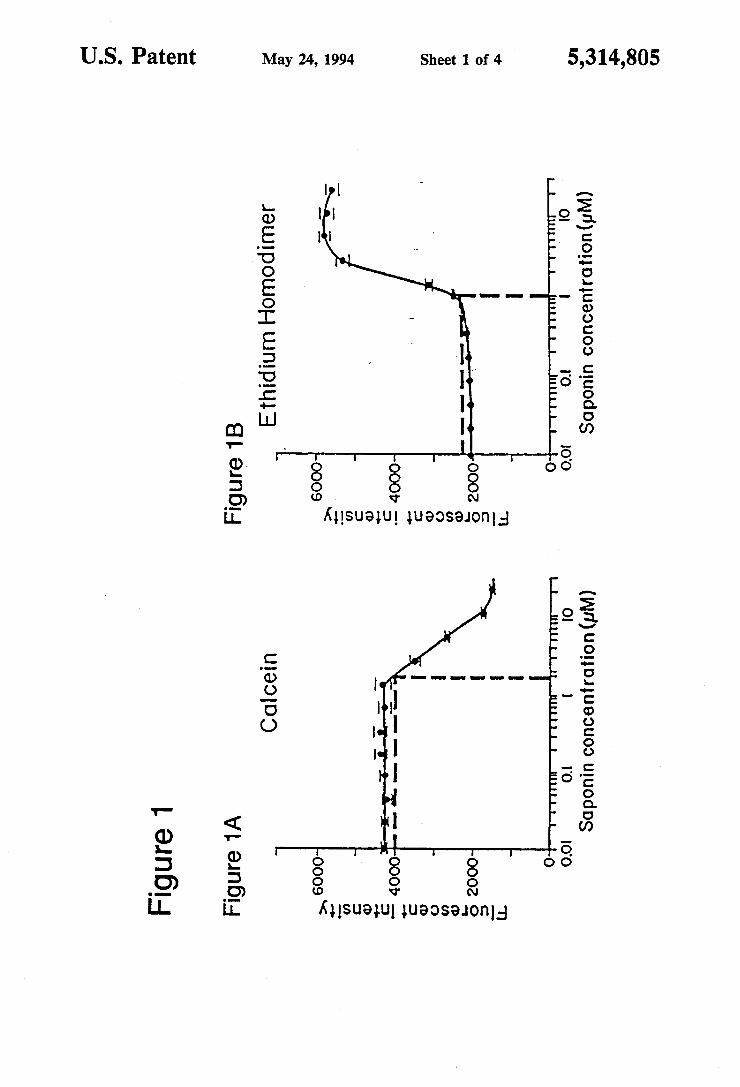
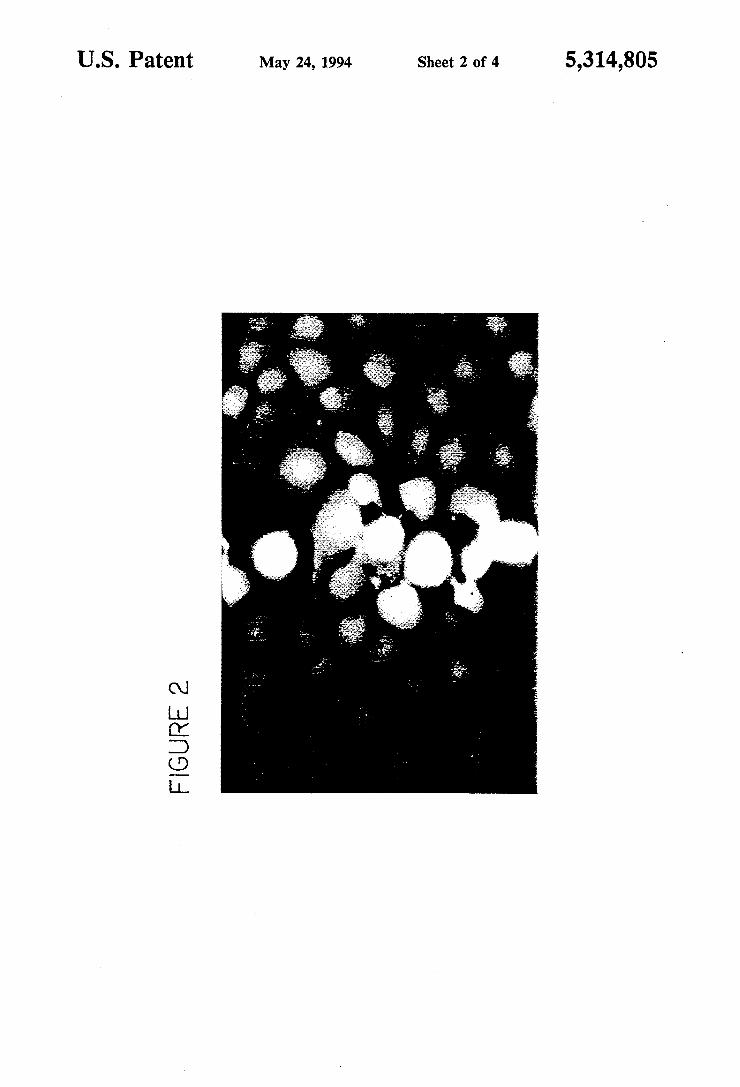
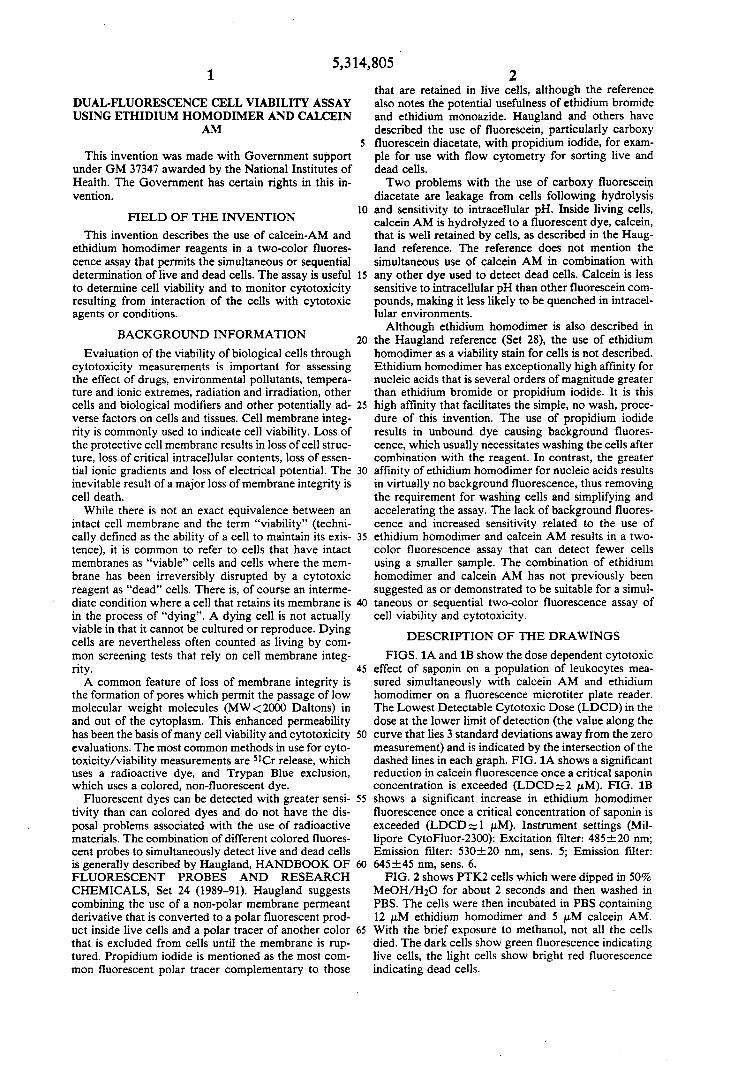
FIGS. 1A and 1B show the dose dependent cytotoxic effect of saponin on a population of leukocytes mea sured simultaneously with calceiin AM and ethidium homodimer on a fluorescence microtiter plate reader. The Lowest Detectable Cytotoxic Dose (LDCD) in the dose at the lower limit of detection (the value along the curve that lies 3 standard deviations away from the zero measurement) and is indicated by the intersection of the dashed lines in each graph. FIG. 1A shows a significant reduction in calcein fluorescence once a critical saponin concentration is exceeded (LDCDs2 uM). FIG. 1B shows a significant increase in ethidium homodimer fluorescence once a critical concentration of saponin is exceeded (LDCD as 1 uM). Instrument settings (Mil lipore CytoFluor-2300): Excitation filter: 485-20 nm; Emission filter: 530-20 nm, sens. 5; Emission filter: 645E45 nm, sens. 6. FIG. 2 shows PTK2 cells which were dipped in 50%
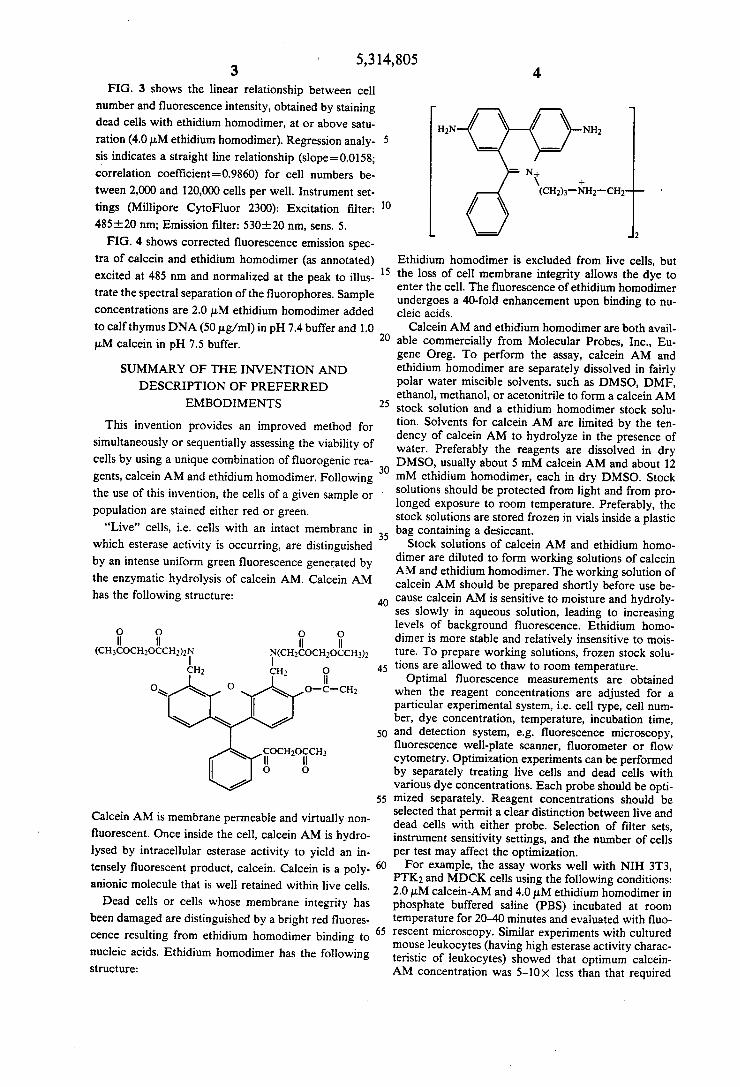
MeOH/H2O for about 2 seconds and then washed in PBS. The cells were then incubated in PBS containing 12 M ethidium homodimer and 5 uM calcein AM. With the brief exposure to methanol, not all the cells died. The dark cells show green fluorescence indicating live cells, the light cells show bright red fluorescence indicating dead cells.
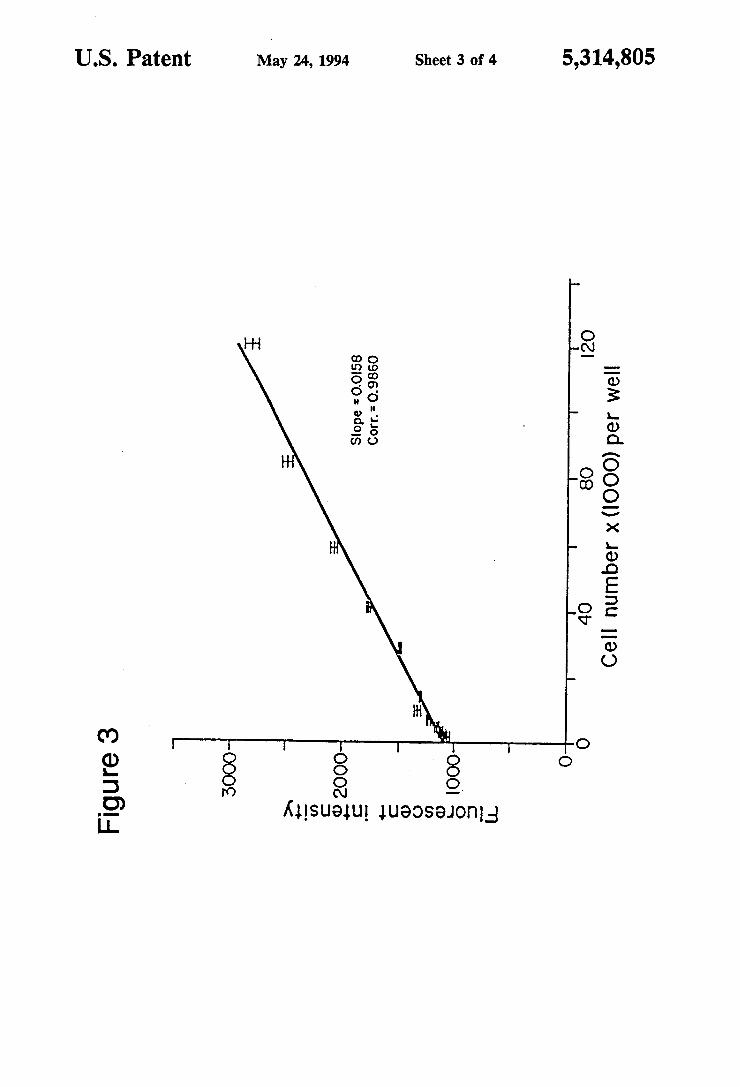
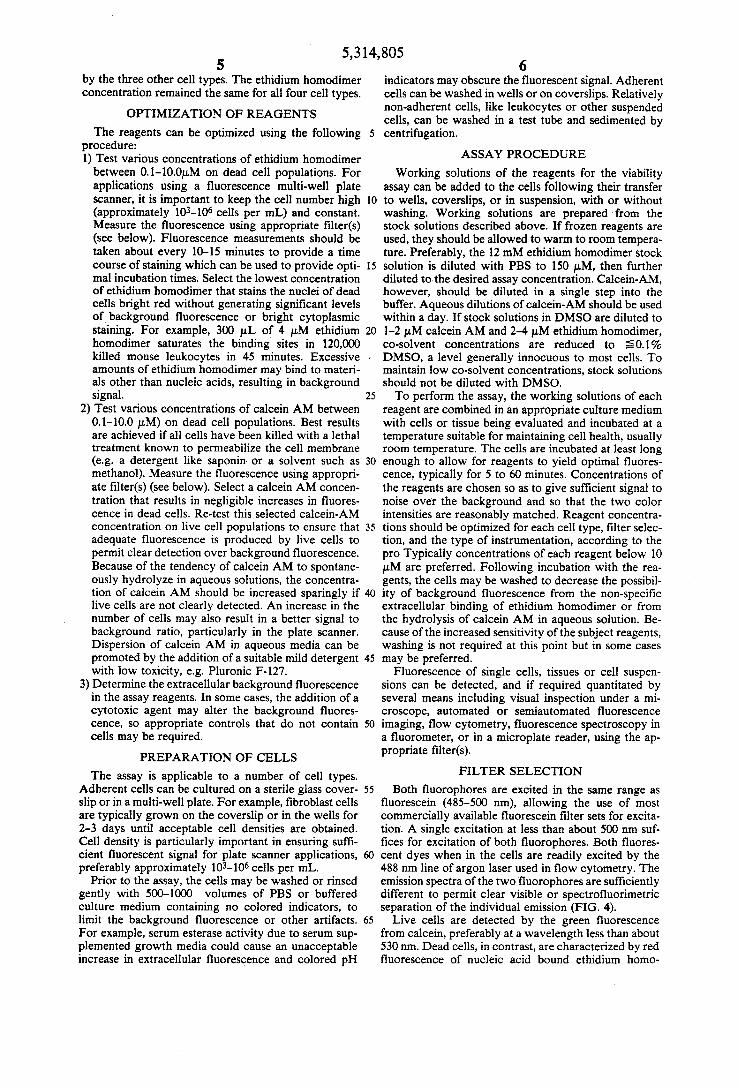
5,314,805 3 FIG. 3 shows the linear relationship between cell
number and fluorescence intensity, obtained by staining dead cells with ethidium homodimer, at or above satu ration (4.0 M ethidium homodimer). Regression analy- 5 sis indicates a straight line relationship (slope=0.0158; correlation coefficient=0.9860) for cell numbers be tween 2,000 and 120,000 cells per well. Instrument set tings (Millipore CytoFluor 2300): Excitation filter: 10 485-20 nm; Emission filter: 530-20 nm, sens. 5.
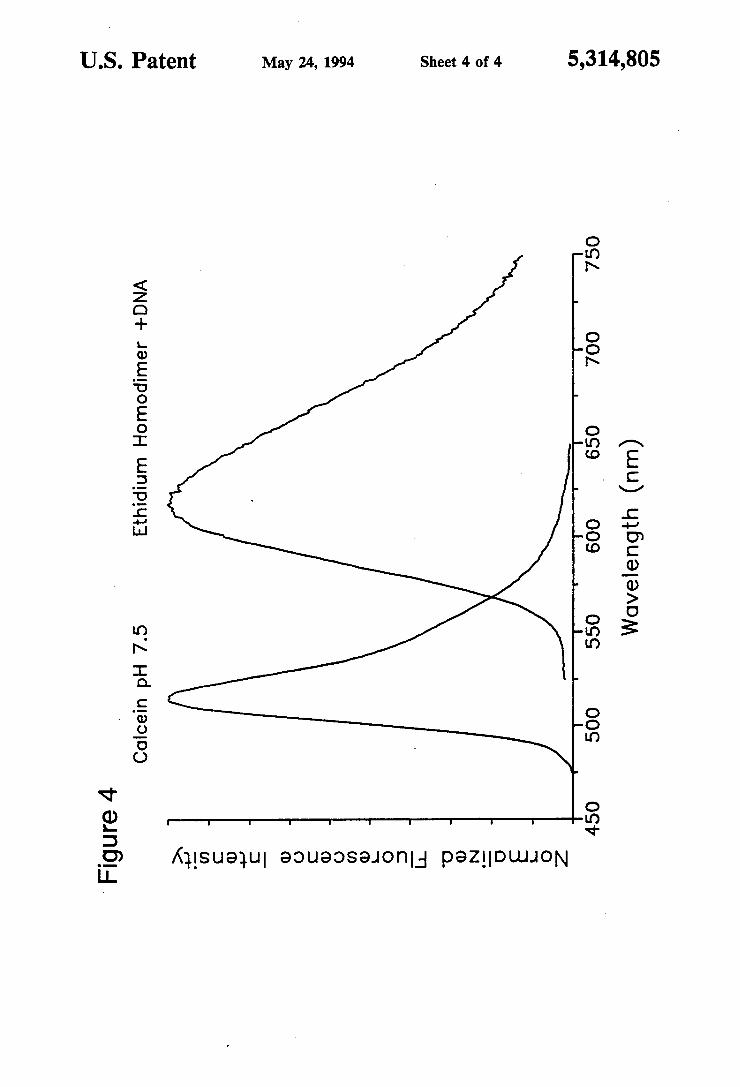
FIG. 4 shows corrected fluorescence emission spec tra of calcein and ethidium honodiner (as annotated) excited at 485 nm and normalized at the peak to illus trate the spectral separation of the fluorophores. Sample concentrations are 2.0 uM ethidium homodimer added to calf thymus DNA (50 g/ml) in pH 7.4 buffer and 1.0 LM calcein in pH 7.5 buffer.
15
20
SUMMARY OF THE INVENTION AND DESCRIPTION OF PREFERRED
EMBODIMENTS 25
This invention provides an improved method for simultaneously or sequentially assessing the viability of cells by using a unique combination of fluorogenic rea gents, calcein AM and ethidium homodimer. Following 30 the use of this invention, the cells of a given sample or population are stained either red or green.
"Live' cells, i.e. cells with an intact membrane in which esterase activity is occurring, are distinguished by an intense uniform green fluorescence generated by the enzymatic hydrolysis of calcein AM. Calcein AM has the following structure: 40
35
(ChicochocCH) ChicochocCH): CH2 CH2 45
OS. O-C-CH2
50
Sochioch 3 O O
55
Calcein AM is membrane permeable and virtually non fluorescent. Once inside the cell, calcein AM is hydro lysed by intracellular esterase activity to yield an in tensely fluorescent product, calcein. Calcein is a poly anionic molecule that is well retained within live cells. Dead cells or cells whose membrane integrity has
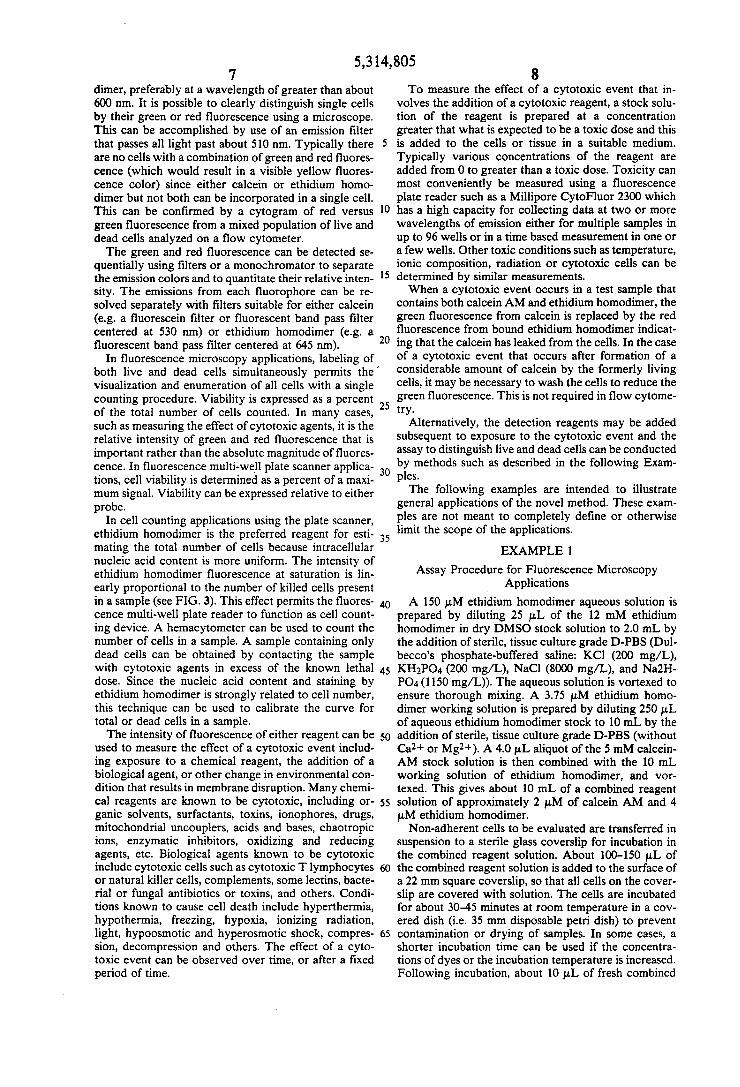
been damaged are distinguished by a bright red fluores cence resulting from ethidium honodiner binding to 65 nucleic acids. Ethidium homodimer has the following structure:
4.
as N. V --
( ) 2 Ethidium homodimer is excluded from live cells, but the loss of cell membrane integrity allows the dye to enter the cell. The fluorescence of ethidium homodimer undergoes a 40-fold enhancement upon binding to nu cleic acids.
Calcein AM and ethidium homodimer are both avail able commercially from Molecular Probes, Inc., Eu gene Oreg. To perform the assay, calcein AM and ethidium homodimer are separately dissolved in fairly polar water miscible solvents, such as DMSO, DMF, ethanol, methanol, or acetonitrile to form a calceiin AM stock solution and a ethidium homodimer stock solu tion. Solvents for calcein AM are limited by the ten dency of calcein AM to hydrolyze in the presence of water. Preferably the reagents are dissolved in dry DMSO, usually about 5 mM calcein AM and about 12 mM ethidium homodimer, each in dry DMSO. Stock solutions should be protected from light and from pro longed exposure to room temperature. Preferably, the stock solutions are stored frozen in vials inside a plastic bag containing a desiccant.
Stock solutions of calcein AM and ethidium homo dimer are diluted to form working solutions of calcein AM and ethidium homodimer. The working solution of calcein AM should be prepared shortly before use be cause calcein AM is sensitive to moisture and hydroly ses slowly in aqueous solution, leading to increasing levels of background fluorescence. Ethidium homo dimer is more stable and relatively insensitive to mois ture. To prepare working solutions, frozen stock solu tions are allowed to thaw to room temperature. Optimal fluorescence measurements are obtained
when the reagent concentrations are adjusted for a particular experimental system, i.e. cell type, cell num ber, dye concentration, temperature, incubation time, and detection system, e.g. fluorescence microscopy, fluorescence well-plate scanner, fluorometer or flow cytometry. Optimization experiments can be performed by separately treating live cells and dead cells with various dye concentrations. Each probe should be opti mized separately. Reagent concentrations should be selected that permit a clear distinction between live and dead cells with either probe. Selection of filter sets, instrument sensitivity settings, and the number of cells per test may affect the optimization. For example, the assay works well with NIH 3T3,
PTK2 and MDCK cells using the following conditions: 2.0 LM calcein-AM and 4.0 M ethidium homodimer in phosphate buffered saline (PBS) incubated at room temperature for 20-40 minutes and evaluated with fluo rescent microscopy. Similar experiments with cultured mouse leukocytes (having high esterase activity charac teristic of leukocytes) showed that optimum calcein AM concentration was 5-10X less than that required
5,314,805 5
by the three other cell types. The ethidium homodimer concentration remained the same for all four cell types.
OPTIMIZATION OF REAGENTS
The reagents can be optimized using the following procedure: 1) Test various concentrations of ethidium homodimer between 0.1-100LM on dead cell populations. For applications using a fluorescence multi-well plate scanner, it is important to keep the cell number high (approximately 103-106 cells per mL) and constant. Measure the fluorescence using appropriate filter(s) (see below). Fluorescence measurements should be taken about every 10-15 minutes to provide a time course of staining which can be used to provide opti mal incubation times. Select the lowest concentration of ethidium homodimer that stains the nuclei of dead cells bright red without generating significant levels of background fluorescence or bright cytoplasmic staining. For example, 300 L of 4 uM ethidium homodimer saturates the binding sites in 120,000
10
15
20
killed mouse leukocytes in 45 minutes. Excessive . amounts of ethidium homodimer may bind to materi als other than nucleic acids, resulting in background signal.
2) Test various concentrations of calcein AM between 0.1-10.0 uM) on dead cell populations. Best results are achieved if all cells have been killed with a lethal treatment known to permeabilize the cell membrane (e.g. a detergent like saponin or a solvent such as methanol). Measure the fluorescence using appropri ate filter(s) (see below). Select a calcein AM concen tration that results in negligible increases in fluores cence in dead cells. Re-test this selected calcein-AM concentration on live cell populations to ensure that adequate fluorescence is produced by live cells to permit clear detection over background fluorescence. Because of the tendency of calcein AM to spontane ously hydrolyze in aqueous solutions, the concentra
25
30
35
tion of calcein AM should be increased sparingly if 40 live cells are not clearly detected. An increase in the number of cells may also result in a better signal to background ratio, particularly in the plate scanner. Dispersion of calcein AM in aqueous media can be promoted by the addition of a suitable mild detergent with low toxicity, e.g. Pluronic F-127.
3) Determine the extracellular background fluorescence in the assay reagents. In some cases, the addition of a cytotoxic agent may alter the background fluores cence, so appropriate controls that do not contain cells may be required.
PREPARATION OF CELLS
The assay is applicable to a number of cell types. Adherent cells can be cultured on a sterile glass cover slip or in a multi-well plate. For example, fibroblast cells are typically grown on the coverslip or in the wells for 2-3 days until acceptable cell densities are obtained. Cell density is particularly important in ensuring suffi cient fluorescent signal for plate scanner applications, preferably approximately 103-106 cells per mL.
Prior to the assay, the cells may be washed or rinsed gently with 500-1000 volumes of PBS or buffered culture medium containing no colored indicators, to limit the background fluorescence or other artifacts. For example, serum esterase activity due to serum sup plemented growth media could cause an unacceptable increase in extracellular fluorescence and colored pH
45
50
55
65
6 indicators may obscure the fluorescent signal. Adherent cells can be washed in wells or on coverslips. Relatively non-adherent cells, like leukocytes or other suspended cells, can be washed in a test tube and sedimented by centrifugation.
ASSAY PROCEDURE
Working solutions of the reagents for the viability assay can be added to the cells following their transfer to wells, coverslips, or in suspension, with or without washing. Working solutions are prepared from the stock solutions described above. If frozen reagents are used, they should be allowed to warm to room tempera ture. Preferably, the 12 mMethidium homodimer stock solution is diluted with PBS to 150 LM, then further diluted to the desired assay concentration. Calcein-AM, however, should be diluted in a single step into the buffer. Aqueous dilutions of calcein-AM should be used within a day. If stock solutions in DMSO are diluted to 1-2 uM calcein AM and 2-4 uM ethidium homodimer, co-solvent concentrations are reduced to S0.1% DMSO, a level generally innocuous to most cells. To maintain low co-solvent concentrations, stock solutions should not be diluted with DMSO, To perform the assay, the working solutions of each
reagent are combined in an appropriate culture medium with cells or tissue being evaluated and incubated at a temperature suitable for maintaining cell health, usually room temperature. The cells are incubated at least long enough to allow for reagents to yield optimal fluores cence, typically for 5 to 60 minutes. Concentrations of the reagents are chosen so as to give sufficient signal to noise over the background and so that the two color intensities are reasonably matched. Reagent concentra tions should be optimized for each cell type, filter selec tion, and the type of instrumentation, according to the pro Typically concentrations of each reagent below 10 uM are preferred. Following incubation with the rea gents, the cells may be washed to decrease the possibil ity of background fluorescence from the non-specific extracellular binding of ethidium homodimer or from the hydrolysis of calcein AM in aqueous solution. Be cause of the increased sensitivity of the subject reagents, washing is not required at this point but in some cases may be preferred.
Fluorescence of single cells, tissues or cell suspen sions can be detected, and if required quantitated by several means including visual inspection under a mi croscope, automated or semiautomated fluorescence imaging, flow cytometry, fluorescence spectroscopy in a fluorometer, or in a microplate reader, using the ap propriate filter(s).
FILTER SELECTION
Both fluorophores are excited in the same range as fluorescein (485-500 nm), allowing the use of most commercially available fluorescein filter sets for excita tion. A single excitation at less than about 500 nm suf fices for excitation of both fluorophores. Both fluores cent dyes when in the cells are readily excited by the 488 nm line of argon laser used in flow cytometry. The emission spectra of the two fluorophores are sufficiently different to permit clear visible or spectrofluorimetric separation of the individual emission (FIG. 4).
Live cells are detected by the green fluorescence from calcein, preferably at a wavelength less than about 530 nm. Dead cells, in contrast, are characterized by red fluorescence of nucleic acid bound ethidium homo
5,314,805 7
dimer, preferably at a wavelength of greater than about 600 nm. It is possible to clearly distinguish single cells by their green or red fluorescence using a microscope. This can be accomplished by use of an emission filter that passes all light past about 510 nm. Typically there are no cells with a combination of green and red fluores cence (which would result in a visible yellow fluores cence color) since either calcein or ethidium homo dimer but not both can be incorporated in a single cell. This can be confirmed by a cytogram of red versus green fluorescence from a mixed population of live and dead cells analyzed on a flow cytometer. The green and red fluorescence can be detected se
quentially using filters or a monochromator to separate the emission colors and to quantitate their relative inten sity. The emissions from each fluorophore can be re solved separately with filters suitable for either calcein (e.g. a fluorescein filter or fluorescent band pass filter centered at 530 nm) or ethidium homodimer (e.g. a fluorescent band pass filter centered at 645 nm).
In fluorescence microscopy applications, labeling of both live and dead cells simultaneously permits the visualization and enumeration of all cells with a single counting procedure. Viability is expressed as a percent of the total number of cells counted. In many cases, such as measuring the effect of cytotoxic agents, it is the relative intensity of green and red fluorescence that is important rather than the absolute magnitude of fluores cence. In fluorescence multi-well plate scanner applica tions, cell viability is determined as a percent of a maxi mum signal. Viability can be expressed relative to either probe.
In cell counting applications using the plate scanner, ethidium homodimer is the preferred reagent for esti mating the total number of cells because intracellular nucleic acid content is more uniform. The intensity of ethidium homodimer fluorescence at saturation is lin early proportional to the number of killed cells present in a sample (see FIG. 3). This effect permits the fluores cence multi-well plate reader to function as cell count ing device. A hemacytometer can be used to count the number of cells in a sample. A sample containing only dead cells can be obtained by contacting the sample with cytotoxic agents in excess of the known lethal dose. Since the nucleic acid content and staining by ethidium honodimer is strongly related to cell number, this technique can be used to calibrate the curve for total or dead cells in a sample. The intensity of fluorescence of either reagent can be
used to measure the effect of a cytotoxic event includ ing exposure to a chemical reagent, the addition of a biological agent, or other change in environmental con dition that results in membrane disruption. Many chemi cal reagents are known to be cytotoxic, including or ganic solvents, surfactants, toxins, ionophores, drugs, mitochondrial uncouplers, acids and bases, chaotropic ions, enzymatic inhibitors, oxidizing and reducing agents, etc. Biological agents known to be cytotoxic include cytotoxic cells such as cytotoxic T lymphocytes or natural killer cells, complements, some lectins, bacte rial or fungal antibiotics or toxins, and others. Condi tions known to cause cell death include hyperthermia, hypothermia, freezing, hypoxia, ionizing radiation, light, hypoosmotic and hyperosmotic shock, compres sion, decompression and others. The effect of a cyto toxic event can be observed over time, or after a fixed period of time.
10
15
20
25
30
35
45
50
55
65
8 To measure the effect of a cytotoxic event that in
volves the addition of a cytotoxic reagent, a stock solu tion of the reagent is prepared at a concentration greater that what is expected to be a toxic dose and this is added to the cells or tissue in a suitable medium. Typically various concentrations of the reagent are added from 0 to greater than a toxic dose. Toxicity can most conveniently be measured using a fluorescence plate reader such as a Millipore CytoFluor 2300 which has a high capacity for collecting data at two or more wavelengths of emission either for multiple samples in up to 96 wells or in a time based measurement in one or a few wells. Other toxic conditions such as temperature, ionic composition, radiation or cytotoxic cells can be determined by similar measurements. When a cytotoxic event occurs in a test sample that
contains both calcein AM and ethidium homodimer, the green fluorescence from calcein is replaced by the red fluorescence from bound ethidium homodimer indicat ing that the calcein has leaked from the cells. In the case of a cytotoxic event that occurs after formation of a considerable amount of calcein by the formerly living cells, it may be necessary to wash the cells to reduce the green fluorescence. This is not required in flow cytome try.
Alternatively, the detection reagents may be added subsequent to exposure to the cytotoxic event and the assay to distinguish live and dead cells can be conducted by methods such as described in the following Exam ples. The following examples are intended to illustrate
general applications of the novel method. These exam ples are not meant to completely define or otherwise limit the scope of the applications.
EXAMPLE 1
Assay Procedure for Fluorescence Microscopy Applications
A 150 uM ethidium homodimer aqueous solution is prepared by diluting 25 uL of the 12 mM ethidium homodimer in dry DMSO stock solution to 2.0 mL by the addition of sterile, tissue culture grade D-PBS (Dul becco's phosphate-buffered saline: KCl (200 mg/L), KH2PO4 (200 mg/L), NaCl (8000 mg/L), and Na2H PO4 (1150 mg/L)). The aqueous solution is vortexed to ensure thorough mixing. A 3.75 M ethidium homo dimer working solution is prepared by diluting 250 L of aqueous ethidium homodimer stock to 10 mL by the addition of sterile, tissue culture grade D-PBS (without Ca2+ or Mg2+). A 4.0 L aliquot of the 5 mM calcein AM stock solution is then combined with the 10 mL working solution of ethidium homodimer, and vor texed. This gives about 10 mL of a combined reagent solution of approximately 2 M of calcein AM and 4 uM ethidium homodimer. Non-adherent cells to be evaluated are transferred in
suspension to a sterile glass coverslip for incubation in the combined reagent solution. About 100-150 uL of the combined reagent solution is added to the surface of a 22 mm square coverslip, so that all cells on the cover slip are covered with solution. The cells are incubated for about 30-45 minutes at room temperature in a cov ered dish (i.e. 35 mm disposable petri dish) to prevent contamination or drying of samples. In some cases, a shorter incubation time can be used if the concentra tions of dyes or the incubation temperature is increased. Following incubation, about 10 uL of fresh combined
5,314,805 reagent solution is added to a clean microscope slide. The coverslip containing the cells is quickly transferred to the wet slide. To prevent evaporation, the coverslip is sealed to the glass slide (e.g. with clear fingernail polish). Care should be taken to avoid damaging or shearing cells in the preparation of the slides. The cells are examined under a microscope using blue light exci tation at about 480-500 nm collecting light through a long pass filter beyond about 520 nm. Cells with visible green fluorescence are scored as live; those with red fluorescence are scored as dead.
EXAMPLE 2
Assay Procedure for Fluorescence Plate Scanner Applications
A 150 uM ethidium homodimer aqueous solution is prepared and vortexed as in Example 1. A 6 M ethidium homodimer working solution is prepared by diluting 400 ul of aqueous ethidium homodimer stock to 10 mL by the addition of sterile, tissue culture grade D-PBS (without Ca2+ or Mg2+). A 6.0 uL aliquot of the 5 mM calcein-AM stock solution is then combined with the 10 mL working solution of ethidium homo dimer, and vortexed. This gives about 10 mL of a com bined reagent solution of approximately 3 uM of calcein AM and 6 M ethidium homodimer. Assay reagents are prepared in a concentrated form to allow for the three fold dilution upon addition to the wells. Adherent cells being evaluated are cultured for 2-3
days in the wells of a microtiter plate to achieve the proper cell density prior to incubation in the combined reagent solution. Each well should contain about 106 cells and about 100 L of D-PBS. The combined rea gent solution is diluted to approximately 1 uM of cal
5.
10
15
20
25
30
cein AM and 2 uM ethidium homodimer by addition of 35 the appropriate amount of combined reagent solution to the wells. The cells are incubated at room temperature for about 30-45 minutes, fluorescence is read on a Mil lipore Cytofluor 2300 fluorescence plate reader. Exci tation of both fluorophores is achieved with the fluores cein filter (485-20 nm). Emissions from each fluoro phore are resolved separately with a filter suitable for calcein (530-30 nm; sensitivity 5) or ethidium homo dimer (645-45 nm; sensitivity 6).
EXAMPLE 3
Assay Procedure for Flow Cytometry Applications A 10 mL solution of combined reagents of approxi
mately 3 uM of calcein AM and 6 uM ethidium homo dinner, is prepared as described in Example 2. A suspen sion of single cells in D-PBS at about 106 cells/mL is prepared. A 50 uL aliquot of the combined reagent solution is combined with 100 L of the cell suspension. The mixture of cells and reagents is vortexed to mix thoroughly and incubated at room temperature for 30-45 minutes. The combination of cells and reagents is analyzed on the flow cytometer, using 488 nm excita tion and a 488 nm barrier filter. The light scatter gate is set to include single cells and to exclude clumps. For ward and orthogonal light scatter are recorded, as well as red (>600 nm) and green (520-20 nm) fluorescence.
EXAMPLE 4
Evaluation of a Cytotoxic Event A 0.04% saponin (Sigma #S-1252) stock solution is
serially diluted 1:2 in PBS to yield 10 different dilutions of saponin. Different saponin dilutions in aliquots of 100
40
45
50
55
65
10 uL are added individually to designated wells in a mi crotiter plate and fluorescence is measured in a Mil lipore CytoFluor 2300 multiwell fluorescent plate scan ner. The final concentrations of saponin in the wells will range from 0 uM to 20 uM after the addition of cell suspensions and fluorogenic reagents.
Cells (J774A.1 Mouse monocyte/macrophage) cul tured with Dulbecco's Modified Eagles Media supple mented with 10% calf serum supplement, 2 mM L glutamine, 10 mM HEPES buffer, 30 ug/mL Gentami cin reagent (all from Gibco Labs), are rinsed with PBS, sedimented by centrifugation, and resuspended in PBS. Cell concentration is adjusted to 2600,000 cells/mL. Suspended cells, in aliquots of 100 uL, are added to the designated wells containing the different dilutions of saponin and incubated for 15 minutes at room tempera ture.
Stock solutions of 5 mM calcein AM and 12 mM ethidium homodimer are diluted in PBS to yield a 50 mL solution of combined reagents that is approximately 1.5uM calcein AM and 6.0 LM ethidium homodimer. The combined reagent solution, in 100 uL aliquots, is added to each well and incubated for 30 minutes at room temperature. Fluorescence measurements are made as in Example 2.
EXAMPLE 5
Calculation of Viability. Using Signal Magnitude Fluorescent measurements are obtained according to
Example 2. Calcein AM measures live cells according to the formula: % live cells= 100% (measured signals30 nm - minimum signals30 nm)/(maximum signals30 nm - minimum signals30 nm); where maximum signals30 nm is the calcein signal from live cell populations, and minimum signals30nm is the calcein signal from dead cell populations. Alternatively, ethidium homodimer mea sures dead cells according to the formula: % dead cells= 100% (measured signals45 in-minimum sig nal645 nm)/(maximum signals45 nm -minimum signals45 nm); where maximum signaló45 nn is the ethidium homo dimer signal from dead cell populations, and minimum signals45 nm is the ethidium homodimer signal from live cell populations.
It is to be understood that, while the foregoing inven tion has been described in detail by way of illustration and example, numerous modifications, substitutions, and alterations are possible without departing from the spirit and scope of the invention as described in the following claims. What is claimed is: 1. A method for evaluating the viability of cells in a
sample, comprising: a) combining a sample containing cells with a concen
tration of calcein AM sufficient to yield detectable green fluorescence in any live cells present in said sample and a concentration of ethidium homo dinner sufficient to yield detectable red fluores cence in any dead cells present in said sample;
b) viewing the sample with means for detecting the red and green fluorescence of cells.
2. A method, as claimed in claim 1, where said means for detecting fluorescence is fluorescent microscopy.
3. A method, as claimed in claim 1, where said means for detecting fluorescence is a multi-well fluorescent plate scanner.
4. A method, as claimed in claim 1, where said means for detecting fluorescence is flow cytometry.
5,314,805 11
5. A method, as claimed in claim 1, where said means for detecting fluorescence is fluorescence spectroscopy.
6. A method, as claimed in claim 1, where the concen tration of calcein AM is greater than 0 and less than 10 uM.
7. A method, as claimed in claim 1, where the concen tration of ethidium homodimer is greater than 0 and less than 10 M.
8. A method, as claimed in claim 6, where the concen tration of ethidium homodimer is greater than 0 and less than 10 M.
9. A method, as claimed in claim 1, where the sample of cells has been exposed to a cytotoxic event.
10. A method, as claimed in claim 9, where the cyto toxic event is adding an organic chemical reagent or adding a biological agent or a temperature change or a barometric change or any combination thereof.
11. A method, as claimed in claim 10, where the cyto toxic event is adding a biological agent.
12. A method, as claimed in claim 10, where the cyto toxic event is a temperature change.
13. A method, as claimed in claim 10, where the cyto toxic event is a barometric change.
14. A method, as claimed in claim 10, where the cyto toxic event is adding an organic chemical reagent.
15. A method, as claimed in claim 9, further compris ing sorting cells exhibiting red fluorescence from cells exhibiting green fluorescence.
16. A method for evaluating the viability of cells in a sample, comprising:
a) combining a sample containing cells with a concen tration of calcein AM sufficient to yield detectable green fluorescence in live cells present in said sam ple, and a concentration of ethidium homodimer sufficient to stain nuclei in dead cells present in said sample with red fluorescence;
5
10
15
20
25
30
35
45
50
55
65
12 b) allowing sufficient time for both calcein AM and
ethidium homodimer to yield optimal fluorescence; c) exciting both calcein AM and ethidium homodimer
at less than about 500 nm and greater than about 485 nmi; and
d) viewing the sample with means for detecting the red and green fluorescence in the cells.
17. A method, as claimed in claim 16, where the cells are single cells.
18. A method, as claimed in claim 16, where the con centration of calcein AM is greater than 0.1 M and less than 10 M and the concentration of ethidium homo dimer is greater than 0.1 M and less than 10 M.
19. A method, for analyzing the viability of single cells, comprising:
a) combining a sample containing said cells with a concentration of calceiin AM sufficient to yield detectable green fluorescence in live cells present in said sample without staining dead cells present in said sample, where the concentration of calcein AM is between 0.1 uM and 10 uM, and a concen tration of ethidium homodimer sufficient to stain nuclei in dead cells present in said sample with red fluorescence without staining live cells, where said concentration of ethidium homodimer is between 0.1 M and 10 uM;
b) incubating the sample with both calcein AM and ethidium homodimer for 5 to 60 minutes;
c) exciting both calcein AM and ethidium homodimer at 485-500 nm, and
d) viewing the sample with means for detecting the red and green fluorescence in the cells.
20. A method as claimed in claim 19, further compris ing sorting or counting the live cells or dead cells based on their fluorescence.
k
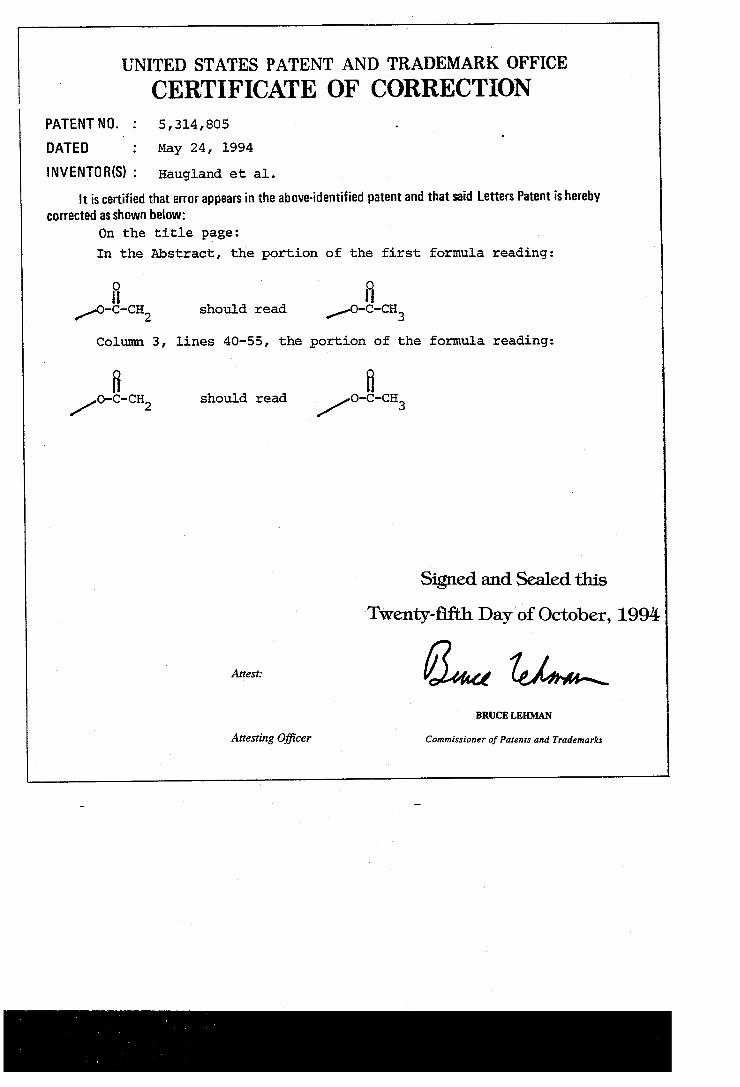
UNITED STATES PATENT AND TRADEMARK OFFICE CERTIFICATE OF CORRECTION
PATENT NO. : 5,314,805 DATED : May 24, 1994 NVENTOR(S) : Haugland et al.
It is certified that error appears in the above-identified patent and that said Letters Patent is hereby corrected as shown below:
On the title page: In the Abstract, the portion of the first formula reading:
f f -O-C-CH should read l-O-C-CH 3
Column 3 lines 40-55, the portion of the formula reading:
f f -o-c-CH, should read -o-c-CH 3
Signed and Sealed this Twenty-fifth Day of October, 1994
BRUCELEHMAN
Attesting Officer Commissioner of Patents and Trademarks