Embed Size (px)
Citation preview
1/47
An E3 Econometric Analysis of CDM and Technology Transfer between Japan
and China
Mitsuo YAMADA
ECS/IIASA, Schlossplatz 1, A-2361 Laxenburg, Austria(Chukyo Univ., Nagoya, Japan)
[email protected]@mecl.chukyo-u.ac.jp
International Energy Workshop 2005, Kyoto, Japan, July 5 2005

2/47
Contents
1 Introduction
2 Methodology
3 Features of the model
4 Some simulation results
5 Concluding remarks
4/47
1.2China
0
200
400
600
800
1000
1200
1400
1980
1982
1984
1986
1988
1990
1992
1994
1996
1998
2000
2002
Bil. U
S$
in 2
000
mar
ket
pric
es
- 2.0
0.0
2.0
4.0
6.0
8.0
10.0
12.0
14.0
16.0
%
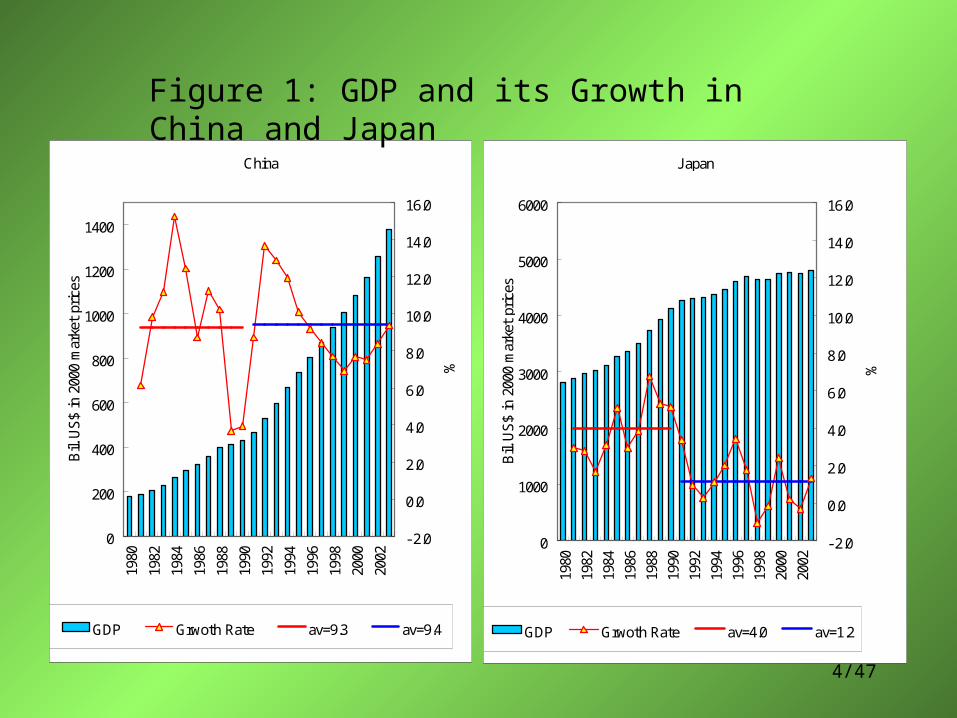
GDP Grwoth Rate av=9.3 av=9.4
J apan
0
1000
2000
3000
4000
5000
6000
1980
1982
1984
1986
1988
1990
1992
1994
1996
1998
2000
2002
Bil. U
S$
in 2
000
mar
ket
pric
es
- 2.0
0.0
2.0
4.0
6.0
8.0
10.0
12.0
14.0
16.0
%
GDP Grwoth Rate av=4.0 av=1.2
Figure 1: GDP and its Growth in China and Japan

5/47
China
0
200000
400000
600000
800000
1000000
1200000
1400000
1980
1982
1984
1986
1988
1990
1992
1994
1996
1998
2000
2002
ktoe
0
500
1000
1500
2000
2500
3000
3500
4000
ktoe
/Bil.$
in 2
000
mar
ket
pric
es
Primary Energy Supply Energy Intensity to GDP
J apan
0
200000
400000
600000
800000
1000000
1200000
1400000
1980
1982
1984
1986
1988
1990
1992
1994
1996
1998
2000
2002
ktoe
0
500
1000
1500
2000
2500
3000
3500
4000
ktoe
/Bil.$
in 2
000
mar
ket
pric
es
Primary Energy Supply Energy Intensity to GDP
Figure 2: Primary Energy Supply and Energy Intensity of GDP in China and Japan

6/47
Figure 3: Total CO2 Emissions and Carbon Intensity of PES in China and Japan
0.8-0.5
2.90.1
China
0
500
1000
1500
2000
2500
3000
3500
4000
1980
1982
1984
1986
1988
1990
1992
1994
1996
1998
2000
2002
Mt-
CO
2
2.0
2.1
2.2
2.3
2.4
2.5
2.6
2.7
2.8
2.9
3.0
Mt-
CO
2/M
toe
CO2 CO2 PES ratio
J apan
0
500
1000
1500
2000
2500
3000
3500
4000
1980
1982
1984
1986
1988
1990
1992
1994
1996
1998
2000
2002
Mt-
CO
2
2.0
2.1
2.2
2.3
2.4
2.5
2.6
2.7
2.8
2.9
3.0
Mt-
CO
2/M
toe
CO2 CO2 PES ratio

7/47
GDPGDP
energy
energy
COCO
2
2Kaya Identity:
• High growth requires faster improvement in energy efficiency.
Figure 4: Simple Prediction
CO2Emission
CarbonIntensityof PES
EnergyIntensityof GDP
GDPgrowth Others
J apan 1990-2002 0.76 -0.47 0.08 1.16 -0.012002- 1.50 -0.50 0.00 2.00
China 1990-2002 2.91 0.09 -6.02 9.41 -0.57(1)2002- 4.50 -0.50 -4.00 9.00(2)2002- 2.50 -0.50 -6.00 9.00
0
2000
4000
6000
8000
10000
12000
14000
2000
2003
2006
2009
2012
2015
2018
2021
2024
2027
2030
Mt-
CO
2 J apanChina(1)China(2)

8/47
Issues for China
• What sector improved in energy efficiency?– Final consumption of energy for Industry, Transport, and
Residential/Commercial• Change in the industrial structure• Diffusion of energy-efficient commodities
– Electricity Generation Sector• Fuel shift from coal to natural gas• Fuel efficiency improvement
• How attained?– Clean Development Mechanism (CDM)– Government-based cooperative activities– Technology transfer through Foreign Direct Investment (FDI)

9/47
Figure 5: Emissions of Greenhouse Gases in Japan
1000.0
1050.0
1100.0
1150.0
1200.0
1250.0
1300.0
1350.0
1400.0Kyo
to P
roto
col
1990
1991
1992
1993
1994
1995
1996
1997
1998
1999
2000
2001
2002
2003
2010
Tar
get
2010
Tar
get
Mil.Ton
CO
2
SF6PFCsHFCsN2OCH4CO2
Economic Growth& CurrentMeasures
New MeasuresRequired
KyotoMechanism& Sink
11/47
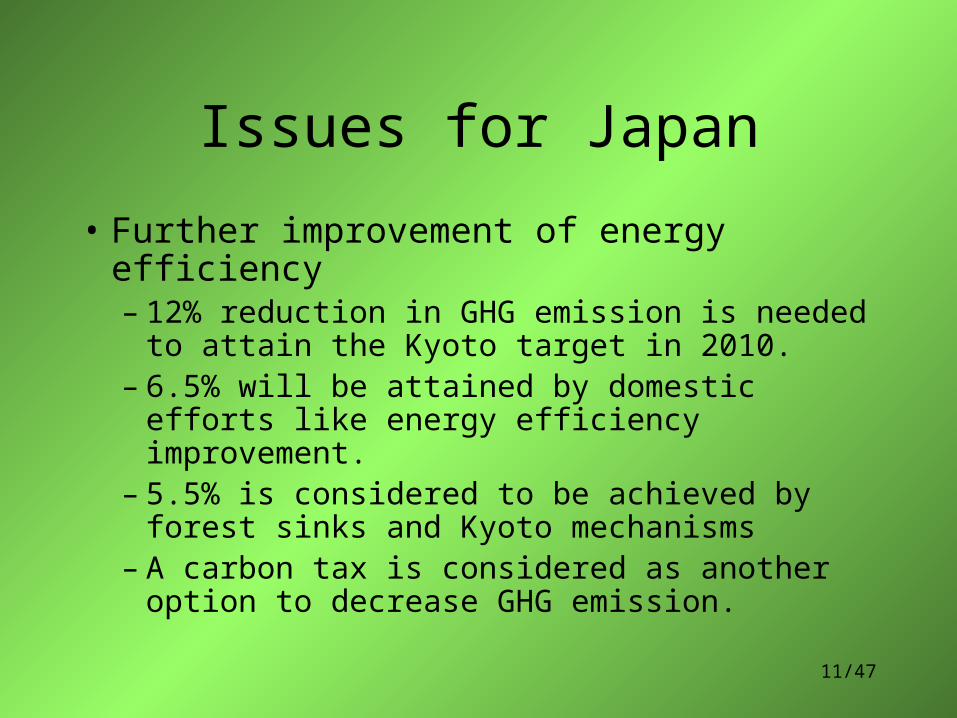
Issues for Japan
• Further improvement of energy efficiency– 12% reduction in GHG emission is needed to
attain the Kyoto target in 2010.– 6.5% will be attained by domestic efforts like
energy efficiency improvement.– 5.5% is considered to be achieved by forest
sinks and Kyoto mechanisms– A carbon tax is considered as another option to
decrease GHG emission.

14/47
• ZhongXiang Zhang (2004) investigates the role of China under the Kyoto Protocol, using marginal abatement cost functions. – Broadening the scope of the market of tradable permits from no emissions
trading to full global trading, it is found that the gain of the OECD as a whole increases as the market expands.
– The developing countries also benefit from such an expansion (through financing and emission reduction).
– Inclusion of China in the emission trading framework increases the total supply of emission permits, so decrease the price of the emission permits.
– China is expected to emerge as the dominant host country of CDM projects.
– According to his study, the US and Japan are required higher emission reductions than the EU, so the gains of the two countries depend on the expansion of the emission permits trading market.
• This study shows the importance of China in the global trading market of CO2 emission permits.
• China is expected the dominant host country of the CDM projects, and Japan is also recognized as one of the important potential investing countries for the CDM projects.
• We will focus on the international cooperation between China and Japan through the CDM projects for the challenging reduction of GHG emissions, using an E3 econometric model.

15/47
3 Features of the Model
• Our model( KeYMERIT-E3 ) consists of – two sub-models, one for Japan and China each, and a
sub-model of international trade.– Each country’s sub-model is developed as an E3 multi-
sectoral model, which integrates a macro model and an input-output model into one model, including energy and environment parts.
– There are 21 sectors in each country’s model» KeYMERIT-E3: Kinoshita-Yamada Multi-sectoral and
Multi-regional Econometric Model for the Research on Industry and Trade – E3 version

16/47
Figure 6: The structure of the Model: KeYMERIT-E3
Japan China
International Trade
The US EU15 Other DC ROW
ASEANHK & Taipei
macro
sector
energy
CO2
macro
sector
energy
CO2
Korea
25/47
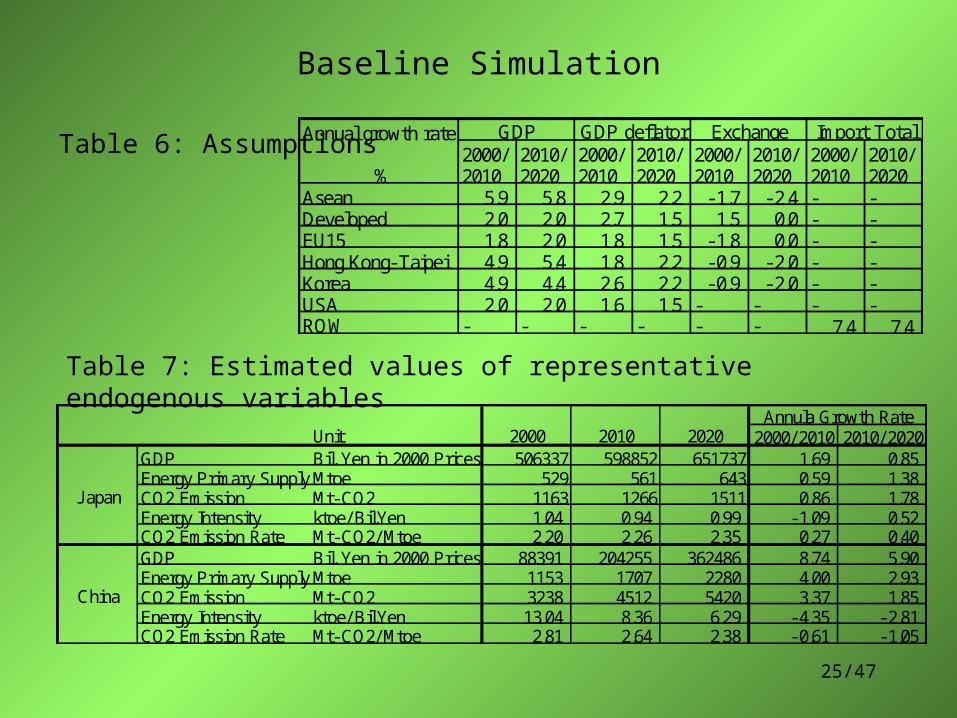
Baseline Simulation
Table 6: AssumptionsAnnual growth rate
%2000/2010
2010/2020
2000/2010
2010/2020
2000/2010
2010/2020
2000/2010
2010/2020
Asean 5.9 5.8 2.9 2.2 -1.7 -2.4 - -Developed 2.0 2.0 2.7 1.5 1.5 0.0 - -EU15 1.8 2.0 1.8 1.5 -1.8 0.0 - -Hong Kong-Taipei 4.9 5.4 1.8 2.2 -0.9 -2.0 - -Korea 4.9 4.4 2.6 2.2 -0.9 -2.0 - -USA 2.0 2.0 1.6 1.5 - - - -ROW - - - - - - 7.4 7.4
GDP GDP deflator Exchange Import Total
2000/ 2010 2010/ 2020GDP Bil. Yen in 2000 Prices 506337 598852 651737 1.69 0.85Energy Primary SupplyMtoe 529 561 643 0.59 1.38CO2 Emission Mt-CO2 1163 1266 1511 0.86 1.78Energy Intensity ktoe/ Bil.Yen 1.04 0.94 0.99 -1.09 0.52CO2 Emission Rate Mt-CO2/ Mtoe 2.20 2.26 2.35 0.27 0.40GDP Bil. Yen in 2000 Prices 88391 204255 362486 8.74 5.90Energy Primary SupplyMtoe 1153 1707 2280 4.00 2.93CO2 Emission Mt-CO2 3238 4512 5420 3.37 1.85Energy Intensity ktoe/ Bil.Yen 13.04 8.36 6.29 -4.35 -2.81CO2 Emission Rate Mt-CO2/ Mtoe 2.81 2.64 2.38 -0.61 -1.05
J apan
China
Annula Growth Rate2000 2010 2020Unit
Table 7: Estimated values of representative endogenous variables

26/47
J apan
0
200000
400000
600000
800000
1000000
1200000
1400000
2000 2001 2002 2003 2004 2005 2006 2007 2008 2009 2010 2011 2012 2013 2014 2015 2016 2017 2018 2019 2020
Billio
n Yen
in 2
000
Mar
ket
Pric
es
J X21 J X20 J X19 J X16 J X15 J X14 J X13 J X12 J X11 J X10 J X09 J X08 J X07 J X06 J X05 J X04 J X03 J X02 J X01
Figure 9: Industrial Structure of Japan

27/47
China
0
20000
40000
60000
80000
100000
120000
140000
2000 2001 2002 2003 2004 2005 2006 2007 2008 2009 2010 2011 2012 2013 2014 2015 2016 2017 2018 2019 2020
Billio
n Yua
n in
200
0 M
arke
t Pric
es
CX21 CX20 CX19 CX18 CX17 CX16 CX15 CX14 CX13 CX12 CX11 CX10 CX09 CX08 CX07 CX06 CX05 CX04 CX03 CX02 CX01
Figure 10: Industrial Structure of China
28/47
4 Some Simulation Results
• The introduction of energy-efficient technology is important to attain the goals of economic development and global environment improvement for China.
• Japan has incentives to cooperate because of her own interest in the compliance of the Kyoto Protocol.
• Simulations
– Case-1: China introduces new technologies (NGCC and IGCC) in the electricity sector to improve energy efficiency.
– Case-2: A carbon tax (2400Yen/tC – approximately 5Euro/tCO2) is introduced in Japan and China.
30/47
Case-1a NGCC in China
• Efficiency improvement(2010-2020) in thermal power stations by energy shift from coal to natural gas in China– NGCC (Natural gas-fired Combined Cycle )– 600 MW x 20 units per year for 10 years– Construction Cost 500$/kW (in 2000 US dollars) – Thermal efficiency 53.6%– Operation starts five years after construction – The first construction starts in 2006– After operation, old coal thermal stations are replaced at the same
volume. – Main equipment, combustion turbine, (27.7% of total cost) is
imported from developed countries.– Import share from Japan is 20% (the US 50%, EU15 30%).
31/47
Case-1b IGCC in China
• Efficiency improvement (2010-2020) in thermal power stations by introducing new Clean Coal technology– IGCC (Integrated Coal Gasification Combined Cycle)– 600 MW x 20 units per year for 10 years– Construction Cost 1,262$/kW (in 2000 US dollars) – Thermal efficiency 43.1%– Operation starts after 5 years construction – The first construction starts in 2006– After operation, an old coal thermal station is replaced at the same
volume. – Main equipment, gasifier and combustion turbine (42.4% of total
Cost), is imported from the developed countries.– Import share from Japan is 20% (the US 50%, EU15 30%).
32/47
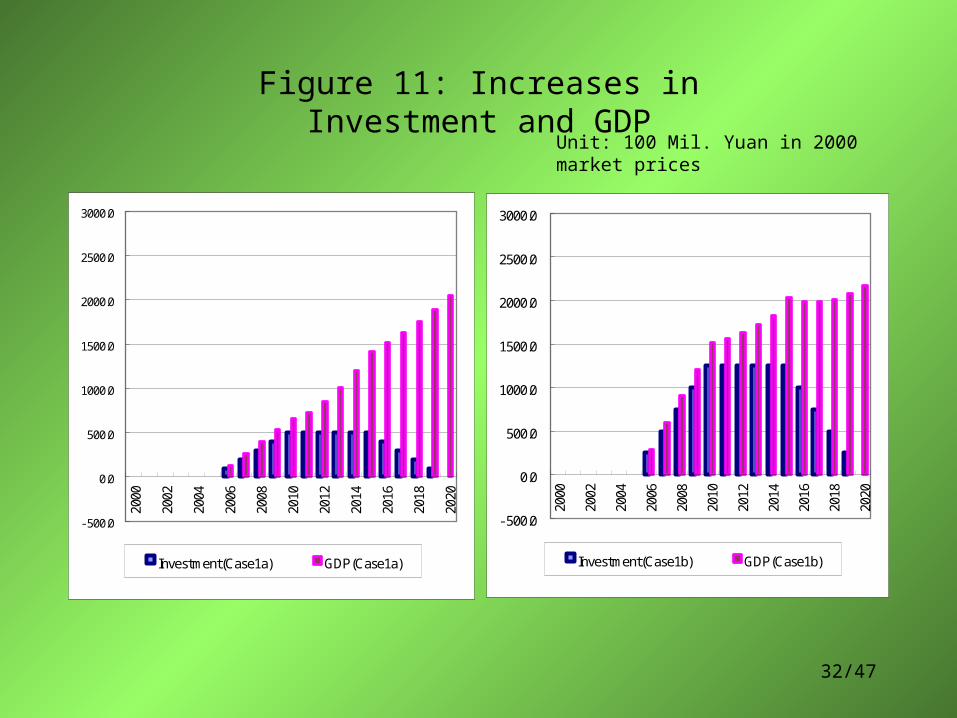
Figure 11: Increases in Investment and GDP
Unit: 100 Mil. Yuan in 2000 market prices
-500.0
0.0
500.0
1000.0
1500.0
2000.0
2500.0
3000.0
2000
2002
2004
2006
2008
2010
2012
2014
2016
2018
2020
Investment(Case1a) GDP(Case1a)
-500.0
0.0
500.0
1000.0
1500.0
2000.0
2500.0
3000.0
2000
2002
2004
2006
2008
2010
2012
2014
2016
2018
2020
Investment(Case1b) GDP(Case1b)
33/47
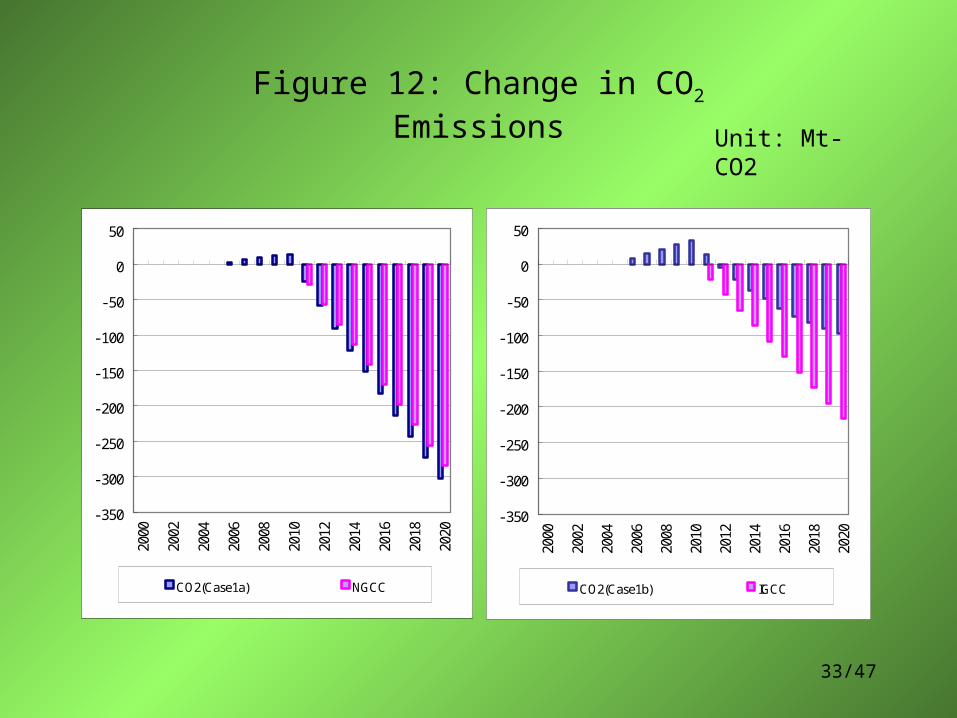
Figure 12: Change in CO2 Emissions
Unit: Mt-CO2
-350
-300
-250
-200
-150
-100
-50
0
50
2000
2002
2004
2006
2008
2010
2012
2014
2016
2018
2020
CO2(Case1a) NGCC
-350
-300
-250
-200
-150
-100
-50
0
50
2000
2002
2004
2006
2008
2010
2012
2014
2016
2018
2020
CO2(Case1b) IGCC
34/47
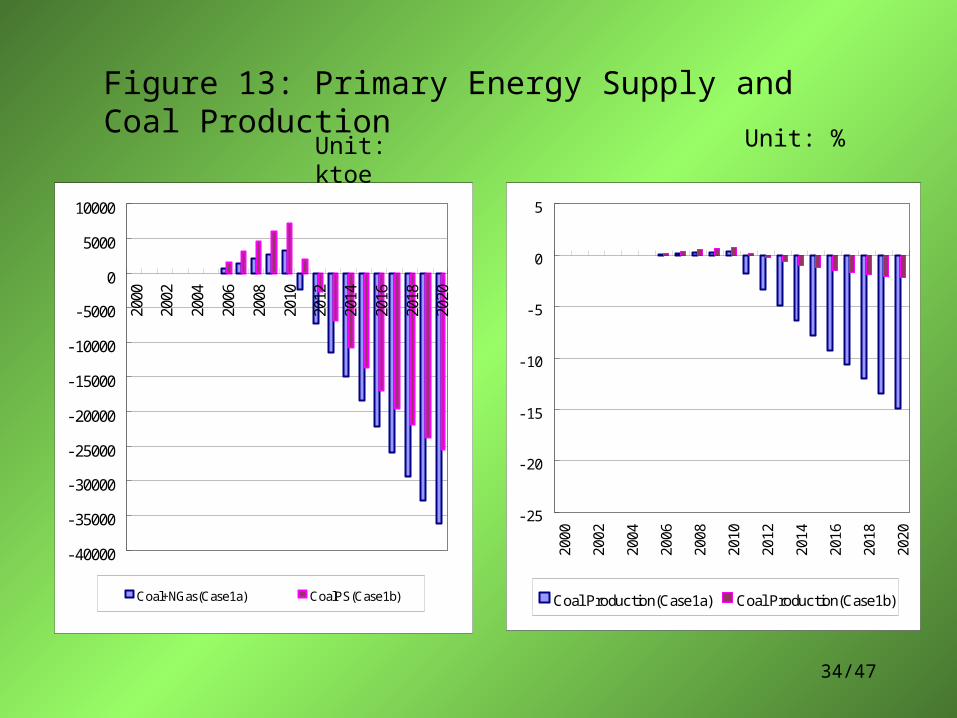
Figure 13: Primary Energy Supply and Coal Production
Unit: %
-40000
-35000
-30000
-25000
-20000
-15000
-10000
-5000
0
5000
10000
2000
2002
2004
2006
2008
2010
2012
2014
2016
2018
2020
Coal+NGas(Case1a) CoalPS(Case1b)
Unit: ktoe
- 25
- 20
- 15
- 10
- 5
0
5
2000
2002
2004
2006
2008
2010
2012
2014
2016
2018
2020
Coal Production(Case1a) Coal Production(Case1b)
35/47
Unit NGCC IGCC Ratio
100 Mil. Yuan 4967.0 12536.8 0.40
Direct Mt-CO2 1560.6 1190.5 1.31
Total Mt-CO2 1619.2 402.2 4.03
Direct Yuan/ t-CO2 318.3 1053.1 0.30
Total Yuan/ t-CO2 306.8 3117.4 0.10
Direct Yen/ t-CO2 4143 13709 0.30
Total Yen/ t-CO2 3993 40584 0.10
Direct US$/ t-CO2 38.4 127.2 0.30
Total US$/ t-CO2 37.1 376.6 0.10
CO2Reductio
nCO2
Reduction CostCO2
Reduction CostCO2
Reduction Cost
Investment Cost
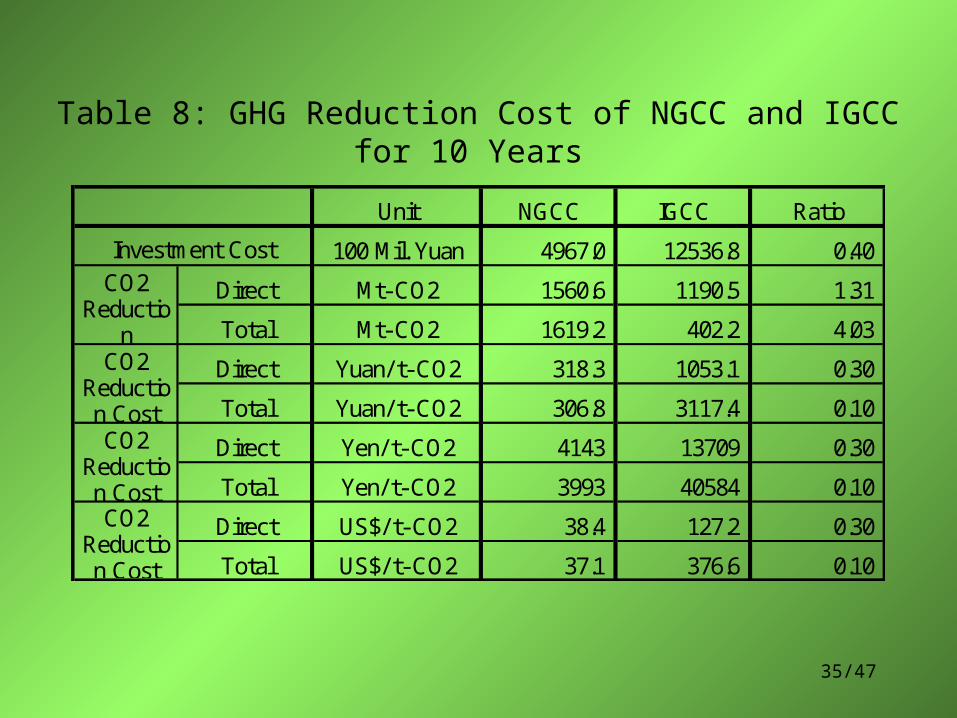
Table 8: GHG Reduction Cost of NGCC and IGCC for 10 Years

36/47
• NGCC directly reduces CO2 emission by 30% more than IGCC; 1560 Mt-CO2 and 1190 Mt-CO2 for ten years respectively.
• Investment cost of NGCC is 40% of that of IGCC.• GHG reduction cost of NGCC investment is 30% cost of
IGCC, though we ignore the operational cost.• If we consider social effect, the cost difference exaggerates
up to 10%
• Investment increases GDP in both case. Investment brings CO2 increase, which offsets partly the CO2 reduction brought by introduction new technology.
• Coal production reduces in both cases, but high reduction appears in the NGCC case because of its energy shift to natural gas. Restructuring in the coal industry will be required especially in NGCC case.

37/47
Figure 14: Effects on Machinery Products and GDP in Japan
Unit: %
-0.1
-0.05
0
0.05
0.1
0.15
0.2
2000
2002
2004
2006
2008
2010
2012
2014
2016
2018
2020
X12(Case1a) GDP(Case1a)
-0.1
-0.05
0
0.05
0.1
0.15
0.2
2000
2002
2004
2006
2008
2010
2012
2014
2016
2018
2020
X12(Case1b) GDP(Case1b)

38/47
• The impact on Japan is higher for IGCC, because its higher investment induces larger volume of machinery trade directly.
• Effect on Japan is mainly positive on GDP and machinery production.
• The induced CO2 increase in Japan is 0.4 Mt-CO2 and 3.1 Mt-CO2 for ten years respectively, which is almost negligible compared to the value in China.
39/47
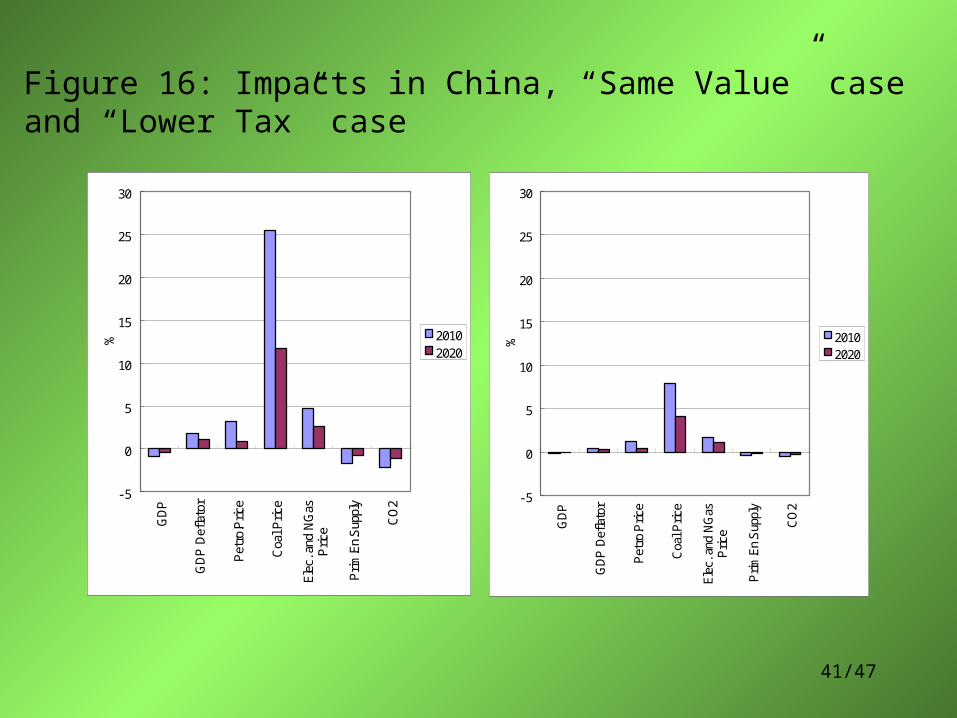
Case-2: Carbon Tax
• A carbon tax is another option for the reduction of GHG emissions– Case2a: 2400 Yen per ton-C (22.27 US dollar per ton-C and 654.5
Yen per ton-CO2) tax is considered by the Ministry of Environment, Japan
– Case2b: Same tax (50.28 Yuan per ton-CO2) for China– Case2c: Lower tax for China (a quarter, considering the difference
in economic scale between two countries)– The tax is introduced in 2007 for each case.– The tax is imposed on the final consumption of coal, petroleum,
natural gas, and electricity.– No allowance or exemption is considered.

40/47
Figure 15: Impacts in Japan
• Price increases in energy sectors are 3 or 5 % points.
• GDP deflator increases up to 3 %.
• GDP deceases by 0.14% or 0.43% .
• The difference in primary-energy supply and CO2 reduction will be 1% or less. - 2
- 1
0
1
2
3
4
5
GDP
GDP D
eflat
or
Pet
ro.P
rice
Coa
l Price
Elec
. and
NG
asPrice
Prim
.En.
Sup
ply
CO
2
% 20102020
41/47
Figure 16: Impacts in China, “Same Value” case and “Lower Tax” case
-5
0
5
10
15
20
25
30
GD
P
GD
P D
eflat
or
Pet
ro.P
rice
Coa
l Pric
e
Elec
. and
NG
asPric
e
Prim
.En.
Sup
ply
CO
2
% 20102020
-5
0
5
10
15
20
25
30
GD
P
GD
P D
eflat
or
Pet
ro.P
rice
Coa
l Pric
e
Elec
. and
NG
asPric
e
Prim
.En.
Sup
ply
CO
2
% 20102020

42/47
Figure 17: CO2 Reduction in Each Case
- 120
- 100
- 80
- 60
- 40
- 20
0C
O2(
Japa
n)
CO
2(C
hina
1)
CO
2(C
hina
2)
Mt-
CO
2
20102020
• For Japan, the proposed carbon tax reduces 11 and 16 Mt-CO2 in 2010 and 2020 respectively.
• This value is higher than that of government’s estimate, using the AIM model; 6 Mt-CO2 in 2010.
• For China, the same rate tax brings larger reduction in CO2, 95 Mt-CO2 and 58 Mt-CO2, than Japan.
• Lower (one quarter) tax rate in China of reduces China’s emissions by 24 and 14 Mt-CO2.
43/47
5 Concluding Remarks• Developing an E3 econometric model, we evaluate the impacts of
technological transfer from Japan to China, which might be possible future CDM projects.
• The basic idea of usual CDM is how much GHG will be reduced if the project is installed, comparing with the GHG emission level of typical alternative, called a baseline, if the project is not installed.
• Our evaluation is economy-wide, not just CDM project evaluation.
• Our study addresses the social evaluation in the sense that GHG emission from the initial investment activity is included and that the change in GHG emission stemmed from the other sectors’ production and household consumption is also considered.

44/47
• Two technology transfer, NGCC and IGCC, are compared.
– NGCC reduces CO2 emission more effectively than IGCC.
– However, NGCC requires primary-energy demand shift from coal to natural gas.
– Coal production reduces in both cases, but high reduction appears in the NGCC case.
– Restructuring in the coal industry will be required strongly especially in NGCC case.
45/47
– Japan receives stronger impact from IGCC, because its higher investment induces larger volume of machinery trade directly.
– The effect on Japan is positive mainly on GDP and machinery production.
– The induced CO2 increase in Japan is 0.4 Mt-CO2 and 3.1 Mt-CO2 for ten years respectively, which is almost negligible compared with the reduction in China. But they might be not negligible in the Japan’s economy.
– Japan considers to reduce 20Mt-CO2 by Kyoto Mechanisms. Compared with this value, our scenario gives 31.2 Mt-CO2 reduction per year for NGCC and 23.8 Mt-CO2 per year for IGCC, assuming that Japan’s contribution is 20 % in each project.
– For this project Japan needs 129.3 and 326.4 billion yen per year respectively, which might be financed by carbon tax revenue.

46/47
• Carbon tax effects– For Japan, the proposed carbon tax reduces 11 and 16 Mt-CO2 in
2010 and 2020 respectively.– This is higher than the estimate of the Government, 6 Mt-CO2,
using the AIM model.– The difference is explained by our ignoring some tax exemptions.
Actually our estimate of the tax revenue is 742 billion Yen, which is 1.5 times larger then the government estimate, 490 billion Yen.
– The tax reduces GDP by 0.14% and 0.43% in 2010 and 2020 respectively. This would be reduced by using the tax revenue effectively.
– For China, the same rate tax brings larger reduction in CO2, 96 Mt-CO2 and 58 Mt-CO2, than Japan.
– One quarter rate Tax of Japan reduces 24 and 14 Mt-CO2 in China.– A given carbon tax in China saves GHG gas emission more
effectively than the same tax in Japan.

47/47
• Remaining issues– Our simulation ends at 2020, this is a somewhat short
to evaluate the issues after Kyoto. We would like to extend the simulation period up to 2030.
– The RAS structure is one of the main features in our model. This is constrained as constant in our simulation, which has to be released.
– Adding the country and region sub-models, which are set as exogenous in the current model, for Korea, ASEAN, Hong Kong and Taipei, the US, EC15, other developed countries, and the rest of the world.
– IIASA has a lot of knowledge and experience in the field of energy and environment researches, so we are going to extend our research cooperatively.