Embed Size (px)
Citation preview
14347
1
Differences in Work Attitudes When Nurses Get Their Ideal Roster Based on Their
Shift Preferences
ABSTRACT
Background: Unattractive work schedules can be a cause of discontentment for nurses.
Moreover, optimizing the fit between nurses’ preferences in shifts and obtaining and securing
organizational goals, is very complex.
Aims: To gain insight into (1) the preferences in shifts of individual nurses and (2) the
discrepancy between the “imposed roster” (drawn up by the manager or head nurse) versus the
“nurses’ ideal roster” (ideal for the individual nurse, without regard to any restrictions) through
four work attitudes, i.e. autonomy, job satisfaction, work-life balance and employer
attractiveness.
Method: An exploratory cross-sectional pilot study where the focus lies on descriptive statistics
rather than formal hypothesis testing.
Results: The results showed a significant difference in the mean score of nurses’ their
autonomy, job satisfaction, and work-life balance when the “nurses’ ideal roster” would be
used. Nurses’ preference in shifts were mapped into three groups with similar preferences. Two
cluster groups showed a significant higher median autonomy, work-life balance and job
satisfaction in case of the nurses’ ideal roster. These groups showed no large differences with
regard to their personal characteristics.
Conclusion: This pilot study already indicates that nurses’ ideal roster can lead to better work
attitudes, and that groups of people exist with differences in shift preferences. The next step is
to perform more advanced analyses in newly collected data, which aim to account for common
method bias, clarify the characteristics of the different groups and take the discrepancy between
the two rosters into account.

14347
2
Key words: Workforce Scheduling, Flexible work arrangements, Nurse, Self-Scheduling,
Nurses’ Ideal Roster, Temporal Structure, Entrainment
INTRODUCTION
Many studies, policy makers, governments, and practitioners address the issue of understaffing
of nurses (Glette, Aase, & Wiig, 2017). The need to avoid this understaffing is high, especially
considering negative outcomes of suboptimal staffing, such as poor or failing patient safety and
higher inpatient mortality (Aiken et al., 2012; Aiken et al., 2014). While the motivation of
nurses for this profession is strongly linked to the occupation itself, the short-staffing impacts
the satisfaction of nurses leading to higher burnout and turnover rates (Aiken, Clarke, Sloane,
Sochalski, & Silber, 2002; Boamah, Read, & Spence Laschinger, 2017). Poor work
environments, high workloads and unattractive work schedules are the main causes of this
discontentment (Cline, Reilly, & Moore, 2003). This could lead to a trickle-down effect: if the
monthly schedule causes a poor work-life balance, nurses become unsatisfied with their
schedule, they become dissatisfied with their employment, and may leave the organization. This
puts increased strain on the remaining staff, which – in its turn – will affect scheduling problems
and the satisfaction and retention rates of the remaining personnel. In response, nurses’ shift
preferences and the search for the best fit between these preferences and the organizational
goals, receive increasing attention (Bard & Purnomo, 2005).
Optimizing the fit between personnel preferences and obtaining and securing
organizational goals through nurses’ rosters, is very complex. We identify four main challenges:
(1) determination of appropriate nurse staffing levels and measurement of workload is difficult
given variation in patient demand and acuity of patient illnesses, (2) the different levels and sets
of skills and experiences among employees, (3) the strict rules and regulations with regard to
scheduling, and (4) the high number of different possible schedules. In order to break down the
complexity of the nurse scheduling problem, different perspectives have already been discussed

14347
3
in previous research. For example, various authors have proposed a categorization of personnel
planning into three hierarchical phases, i.e. the long-term strategic staffing phase, the medium-
term tactical scheduling phase and the short-term operational allocation phase (Abernathy,
Baloff, Hershey, & Wandel, 1973; Burke, De Causmaecker, Berghe, L, & eghem, 2004). On
the other hand, Khoong (1996) proposes a generic manpower system framework with six
decision layers, i.e. (1) strategic planning through analysis of trends, (2) long-term
organizational strategic planning, (3) short term organizational tactical planning, (4)
individualized tactical planning, (5) individualized operational planning, and (6) manual
execution (Khoong, 1996). In both perspectives, the long-term allocation decision process
distinguishes itself from the mid- or short-term workforce scheduling where a decision per
month or even per week is made. Rostering itself generally refers to the short-term timetabling
of staff, i.e. with a time horizon of a few weeks (Burke et al., 2004). It can be defined as “the
placing, subject to constraints, of resources into slots in a pattern. One may seek to minimize
some objective, or simply to obtain a feasible allocation. Often the resources will rotate through
a roster” (Wren, 1995) and can be seen along two perspectives: the organization on the one
hand, and the employee on the other hand.
From the perspective of the organization, efficient workforce scheduling around the
clock is needed to minimizes labor costs while safeguarding high-quality levels of nursing care
and guaranteeing an optimal nurse-patient ratio. On top of that, the hospital also needs to take
into account policy and regulations related to shift work (Venkataraman & Brusco, 1996;
Wynendaele, Willems, & Trybou, 2019). This makes scheduling and formatting of rosters a
very difficult and complex task for nursing management (Burke et al., 2004; Hung, 1995).
From the perspective of the employee, the quality of the roster is often measured in
terms of satisfying the individual preferences, which can be seen as part of a good nursing work
environment (Ernst, Jiang, Krishnamoorthy, & Sier, 2004). Shift preferences can play an

14347
4
important role in different work attitudes, such as job satisfaction and work-life balance.
However, these preferences will differ per individual given the diversity in priorities according
to the different life stages (e.g., taking care of children), or the variety in personal characteristics
(e.g., morning versus evening type persons). For example, often young parents or grandparents
like to have time off on Wednesday afternoons. As a consequence, there will exist differences
with regard to individual preferences for certain shifts. However, this perspective received less
attention compared to the perspective of the organization.
The perspective of the organization and the perspective of the employee appear to be
intertwined. In this regard, the degree to which an employee goes along with or adapt to the
nursing schedule, which can be considered as a temporal structure of the organization, may
differ (Ancona & Waller, 2007; Perlow, 1999). Although the work patterns of nurses are steered
by the rhythm of the schedule in which they become embedded (Ancona & Chong, 1996;
McGrath & Kelly, 1986), the question remains to what extent the temporal structure of the
nursing rosters on organizational level synchronizes with the individual temporal schemata of
the employees.
Nurses’ ideal versus imposed roster
As a consequence of the rostering challenge, different types of rostering approaches
have been explored; for example, departmental rostering, team rostering, and self-rostering
(Silvestro & Silvestro, 2000). The contemporary solutions have mainly been addressed from
the organization’s perspective and therefore neglects the individual perspective and the
perspective of the interaction between the individual and the organization. However, there is a
growing awareness of the importance of time in organizations as employers seek to coordinate
and synchronize employee’s behavior (Nguyen Huy, 2001). Entrainment, i.e. “the process that
captures or modifies human activity cycles and sets these cycles oscillating in rhythm with other
processes, including various social systems, norms and intuitions” (McGrath, Kelly, &
14347
5
Machatka, 1984; McGrath & Rotchford, 1983), can facilitate this exploration. Often, employees
fall into the rhythm and tempo of the temporal structure of the organization (Ancona & Chong,
1996). However, this entrainment appears to be imperfect and will likely differ from individual
to individual. A recent conceptual study on entrainment versus resistance of employees to the
temporal structures of their organization, advances theory regarding individual temporal
schemata (i.e., cognitive frameworks about time) enabling interpretation of employees’ reaction
to temporal cues (Shipp & Richardson, 2019). This study highlights the underdeveloped
individual-level aspects of entrainment, which is crucial to predict if organizational efforts to
coordinate individual behaviors will succeed or fail. For example nurses can entrain with or
resist to an imposed nursing roster. If this roster does not match with the individual temporal
schemata of a nurse, this could lead over time to negative working attitudes such as
dissatisfaction and even absenteeism or resignation. It is therefore necessary to identify how
individual employees compare their own individualized view of time versus the temporal
structure of the organization.
In this article, we will use the term “roster” to refer to the planning period over which the nurses
have to be scheduled. The “ideal roster” can be ideal from the perspective of the organization,
from the perspective of the nurses or can be the result of a good compromise between both
perspectives. In this article, however, we will mainly look at the “nurses’ ideal roster”, by which
we mean that the roster is ideal for the individual nurse, without regard to any restrictions. In
addition, this roster will consists of separate shifts, e.g. the traditional morning, evening and
night shift. When we look at the nurses’ ideal roster, we therefore look at the “shift preferences”
for the entire planning period. The imposed roster, on the contrary, is the traditional planning
of a roster by one single manager or head nurse also known as “departmental rostering”
(Silvestro & Silvestro, 2000).

14347
6
The Link between Rosters and Work Attitudes
Increasingly, healthcare organizations move away from the “imposed roster” and as a
response, flexible work arrangements are gaining popularity (Jeffrey Hill et al., 2008),
especially those that reflect the choice of nurses. These flexible work arrangements seem to
fulfill both the goal of the organization to be an attractive employer, whilst at the same time
also promoting an increase in autonomy for the employees, leading to higher job satisfaction,
work-life balance and retention in the nursing staff (Albertsen, Rafnsdóttir, Grimsmo,
Tómasson, & Kauppinen, 2008; Eby, Casper, Lockwood, Bordeaux, & Brinley, 2005; Koning,
2014; Storey, Cheater, Ford, & Leese, 2009). In other words, by giving employees more
autonomy, they will be more inclined to translate this in positive work attitudes (Ryan & Deci,
2000). Social exchange-based constructs are often used to explain desired work attitudes and
behavior. According to the social exchange theory (Blau, 1964), when an organization treats an
employee in a positive way (e.g., by taking into account their preferred working hours), this
employee, in return, will tend to reciprocate with more positive attitudes and behaviors (e.g.,
less inclined to leave the organization) (Cropanzano & Mitchell, 2005). One example of a
flexible work arrangement is self-scheduling; a system that moves the responsibility of creating
a work schedule to the employees, giving them more control over their work hours (Asgeirsson,
2014). In recent years, there has been a growing interest in self-scheduling (Albertsen et al.,
2014), primarily because this method makes it possible that nurses themselves have a personal
involvement in the development of their schedule. That is, the individual employees can ask for
their personal preferences in shifts each month. More specific, at the start of each month,
employees express their “ideal roster”, i.e. without regard to any restrictions such as required
number of FTE nurses per shift. In the next phase, all individual schedules are integrated and
all employees collectively – as a team – switch shifts to meet the staffing needs (Ronnberg &
Larsson, 2010). Furthermore, while self-scheduling, in itself, has good intentions by giving
14347
7
more autonomy to the employee, the monthly procedure is often seen as a cumbersome process
(Silvestro & Silvestro, 2000). All this means that the “final roster” may differ to some extent
from the “nurses’ ideal roster”.
In the search of the nurses’ ideal roster, insight into the individual preferences of the
nurses is crucial. These shift preferences have hardly been studied in a detailed manner, which
makes them hard to incorporate in the roster. This leads us to the first research question: “Which
nurses’ preferences in shifts can be identified?”. In addition, scheduling research has, to the
best of our knowledge, never looked into the differences in work attitudes between the “nurses’
ideal roster” versus any other method of rostering. As a consequence, the second research
question explored the difference in work attitudes between two types of rosters: “Are there
differences in work attitudes between the “imposed roster” versus “nurses’ ideal roster”?. The
third research question goes into more detail by also taking into account the preferences in
shifts: “When looking at the nurses’ preferences in shifts, are there differences in work attitudes
between the “imposed roster” versus “nurses’ ideal roster?”.
Aim of this Study
This study focuses on the discrepancy between the “imposed roster” (drawn up by one single
manager or head nurse) versus the “ nurses’ ideal roster” (ideal for the individual nurse, without
regard to any restrictions) for nurses in hospitals. It links this this discrepancy through four
work attitudes (autonomy, job satisfaction, work-life balance and employer attractiveness). In
addition, the preferences in shifts of the individual nurses are mapped into groups and within
these groups, the link between the discrepancy in rosters and the four work attitudes is again
made. More specific:
(1) We look at the potential differences in autonomy, job satisfaction, work-life balance and
employer attractiveness when an employee would get his or her ideal roster versus their
imposed roster;

14347
8
(2) We gain insight into the nurses’ preference in shifts and map these nurses in groups so
that observations within a group are relatively similar;
(3) Within these groups of nurses with similar individual preferences, we look at the
potential differences in autonomy, job satisfaction, work-life balance and employer
attractiveness when an employee would get his or her ideal roster versus their imposed
roster.
Conceptual Model
We link the social exchange theory to autonomy, expecting that when employees have more
autonomy, they reciprocate by changing their work attitudes towards the organization. An
employee that is given the opportunity to create his or her own ideal schedule (increased
autonomy), will have a better work-life balance (Albertsen et al., 2014; Pryce, Albertsen, &
Nielsen, 2006), which may lead to a higher job satisfaction (Koning, 2014; Mas-Machuca,
Berbegal-Mirabent, & Alegre, 2016). In addition, an increased autonomy could also result in a
higher employer attractiveness, which strengthens the relationship between both parties and
safeguard commitment (Onken-Menke, Nüesch, & Kröll, 2018). This, in turn, could result in
additional recognition by the healthcare organization that, consequently, could renew the
employee’s desire to reciprocate. Next, we built further on this social exchange theory by
including the individual temporal schemata of the employees (Shipp & Richardson, 2019) via
the nurses’ ideal roster, which means that we include his or her personal preferences in shifts.
The organizational temporal structure is represented by the imposed roster. Here, we assume
that, when employees can follow their own individual temporal schemata, this will have a
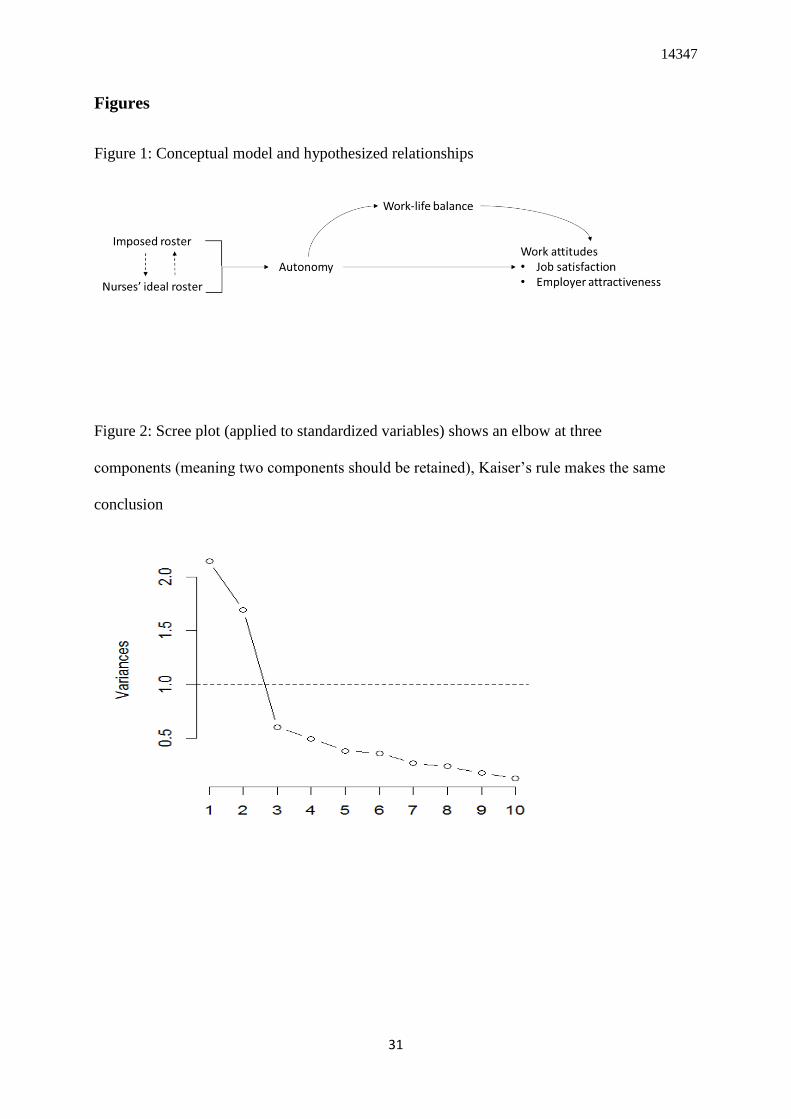
positive association with our predefined work attitudes. Figure 1 provides a simplified
graphical representation of these hypothesized associations.
14347
9
---------------------------------------------------
Insert Figure 1 about here
---------------------------------------------------
Finally, given that our study is a pilot study, the obtained data will not be used for hypothesis
testing. Instead, it serves as an early-phase developmental study that will enhance the
probability of success in a lager anticipated multicenter study. For this reason, the focus will be
on descriptive statistics (and confidence interval estimation) rather than formal hypothesis
testing (Lancaster, Dodd, & Williamson, 2004).
METHOD
Study Design, Setting and Participants
In this cross-sectional pilot study, a survey was distributed to 384 nurses and midwifes between
October-December 2019 in a large University Hospital in Belgium. The wards in this hospital
were chosen at random and all employees worked with a fixed monthly imposed schedule (=
traditional cyclical schedule) made by the head nurse. We obtained approval from the Medical
Ethics Committee of [removed for review process].
Measurements
First, to capture the preference in shifts, a schedule for June 2019 (four weeks) was incorporated
in the survey.
Ideal schedule. This represents the ideal schedule for the employee, i.e. without regard to any
restrictions such as required number of FTE nurses per shift. To facilitate this, the participants
could choose between morning, evening and night shifts. These are common shifts in the
hospital and were also used by the head nurse for drawing up the schedule. This roster consisted
of 28 days x 3 shifts = 84 different dichotomous variables (working versus not working). For
each day, the employee could choose a maximum of one shift. For example, for Monday, June
3 2019, one could enter: morning shift “not working”, evening shift “working”, nigh shift “not-

14347
10
working”. The total number of shifts at the end of the month had to be the same as stipulated in
their contract with their employer. For further analysis of this data, the sum of preferred shifts
per day was used (7 days x 3 shifts = 21 different count variables).
Next, employees were asked to score several work attitudes considering two situations: one for
the schedule they had received from the head nurse in June 2019 (“imposed roster”, and one for
their (theoretical) “nurses’ ideal schedule” in that same month. For this reason, the following
previously validated and published concepts were translated in Dutch using forward-backward
translation (Beaton, Bombardier, Guillemin, & Ferraz, 2000):
Autonomy. The Work Scheduling Autonomy scale is part of the larger Autonomy scale created
by Breaugh (1985) and consists of three items. We used a 5-point Likert scale ranging from one
(totally disagree) to five (totally agree). For example, “I have control over the scheduling of my
work”; is one of the three items.
Work-life balance. The Work-Life Enhancement By Work subscale of the larger Work Life
Balance scale was used (Rincy & Panchanatham 2010). This subscale includes seven items, for
example “My job keeps my personal/family life enjoyable”. A 5-point Likert scale was used,
ranging from one (totally disagree) to five (totally agree)
Job satisfaction A single‐item instrument for job satisfaction was used, with a 10-point Likert
scale ranging from one (extremely dissatisfied) to ten (extremely satisfied). Previous studies
reported that this single‐item has a high reliability and good concurrent and construct validity
(Dolbier, Webster, McCalister, Mallon, & Steinhardt, 2005).
Employer attractiveness. The General Attractiveness scale is a subscale of the Organizational
Attraction scale by (Highhouse, 2003). Five items were asked on a 5-point Likert scale ranging
from one (totally disagree) to five (totally agree). An example of one of the items is: “For me,
this company would be a good place to work”.
14347
11
Finally, the survey included several baseline characteristics such as gender, age, marital status,
number of children, function and work regime.
Statistical Data Analysis
R version 3.6.3 was used to perform the statistical analysis. First, baseline characteristics are
presented to assess the relevant variables and lifestyle characteristics of the employees. In
addition, Student’s paired t-test was used to determine whether the mean difference for the
selected work attitudes between the two predetermined situations (imposed versus nurses’ ideal
roster) were significant.
Second, dimensionality reduction was performed given the high number of predictor variables
for the nurses’ ideal roster (7 days x 3 shifts = 21 different count variables). Assuming that this
count data has a negative-binomial distribution, an inverse hyperbolic sine transformation was
used (Burbidge, Magee, & Robb, 1988; Nguyen & Holmes, 2019). Subsequently, a principal
component analysis (PCA) was performed using the R package FactoMineR (Le, Josse, &
Husson, 2008) on the nurses’ ideal roster data to investigate the pattern of associations between
the shift variables. PCA is used to summarize the 21 variables by seeking a small number of
components that explain maximal variance in the observed data. These components are linear
combinations of the original variables and are uncorrelated with previously extracted
components. This makes it possible to study the patterns of association, even though the
observed variables are correlated with each other. In this way, a taxonomy of shifts can be
created, i.e. which shifts are preferred by the same employee, via interpretation of the
component loadings. The latter can be understood as the weights for each original shift variable
when calculating the principal component. These loadings make it possible to see which
employees load on the same component and can then be classified as having the same preferred
shift preference. A scree plot (visualization of the eigenvalues of the components versus the
number of the components) and Kaiser’s rule (retain only components with eigenvalues greater

14347
12
than 1) were used to determine how many components should be retained. For visualization
purposes, biplots will give a low dimensional presentation of this data, presenting both the
employees as the shift variables.
Third, a cluster analysis was performed using the R package FactoMineR (Le et al., 2008). The
goal of this unsupervised method is to divide the observations into groups of employees so that
observations within a group are relatively similar and observations of different groups are
dissimilar. We used a two-stage approach. First, a hierarchical clustering on squared Euclidean
distances with the method of Ward on the selected principal components. Ward criterion is used
in this clustering because it has a tendency to produce equal-sized clusters that are convex and
compact. The dendrogram is used to detect multivariate outliers (i.e. small clusters formed at
the end of the clustering process). Next, k-means clustering is performed with centroids of
hierarchical clustering as starting points.
Finally, the different clusters (i.e. groups of employees with similar preference in certain shifts)
are described using their baseline characteristics. In addition, Wilcoxon one-tailed signed rank
test is used to compare the two predetermined situations (imposed versus nurses’ ideal roster)
in relation to the selected work attitudes and this for each small sample size cluster. Here, the
assumption is already made that it is more likely that the nurses’ ideal roster will have a higher
median than the roster drawn up by the head nurse.
RESULTS
Baseline Characteristics
In total, 101 surveys were gathered, of which 58 surveys had complete data for the nurses’ ideal
schedule. These 58 surveys were used to conduct further analysis (overall response rate of 15
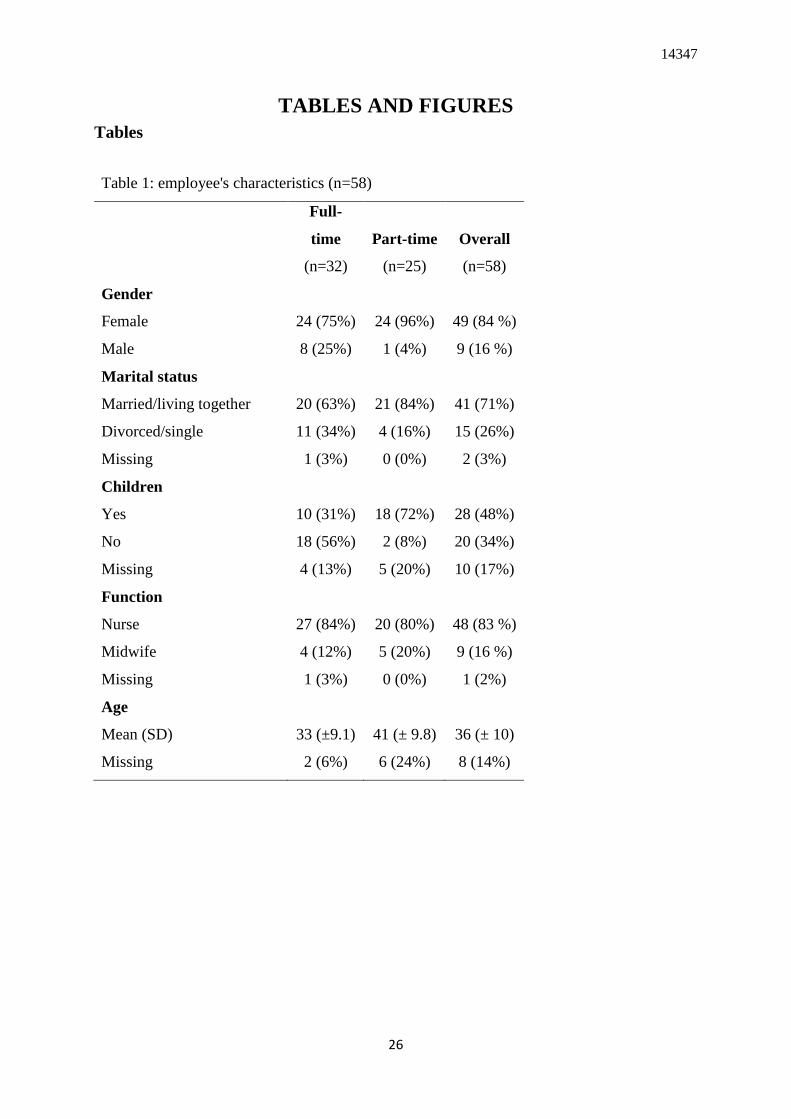
%). The majority of the employees worked full-time (55%) versus part-time (45%). For the
part-time workers, most employees are female (96%), were married or living together (84%)
14347
13
and had children (72%). The full-time workers have a similar profile, though small differences
can be spotted. For example, the proportion of males (25%) and divorced or single people (34%)
is higher than for the part-time workers. In addition, fewer people have children (31%) and the
mean age is lower (33 versus 41 year). Table 1 gives a summary of the employee’s
characteristics per work status (full-time versus part-time).
---------------------------------------------------
Insert Table 1 about here
---------------------------------------------------
Ideal versus Imposed Roster: Main Differences
Table 2 provides an overview of the mean difference in work attitudes (autonomy, work-life
balance, job satisfaction and employer attractiveness) between the situation where the roster is
created by the head nurse (imposed roster) versus the situation where the employee makes his
or her own schedule (the nurses’ ideal roster). This shows, for example, a significant difference
in the mean score for autonomy (mean difference = 0.67, 95% CI [0.45 to 0.90]) when the
nurses’ ideal roster would be used compared to the imposed roster (t55=6.01, p<0.001). All the
other work attitudes show the same significant differences in mean score, except for employer
attractiveness which shows a non-significant (t54=2.18, p<0.033) difference (mean difference =
0.16, 95% CI [0.01 to 0.30]), after applying the Bonferroni correction.
---------------------------------------------------
Insert Table 2 about here
---------------------------------------------------
Nurses’ Preference in Shifts
Next, we take a look at the nurses’ preferences in shifts, as an expression of their individualized
view of time that is recorded in their individual temporal schemata.
14347
14
Principal component analysis
The ideal schedule for the employees for one month was merged into 21 different predictor
variables (7 days x 3 shifts = 21 different count variables). Using the dimensionality reduction
method “principal component analysis”, two principal components were retained based on
Kaiser’s rule and the scree plot (cf. Figure 2).
---------------------------------------------------
Insert Figure 2 about here
---------------------------------------------------
These two principal components account for 54.94% of the variance in the 21 variables, where
the first component alone accounts for 30.72% of the variance. This is shown in Table 3, which
also provides the components loadings, i.e. which shifts correlated with which of these two
components. For example, it can easily be seen that morning shifts have a positive loading on
this first principal component and the evening and night shifts have a negative loading.
However, it is not always easy to give interpretation to the different components. Figure 3
provides visual representation of the relative importance of the shift variable in the two principal
components. Here, it becomes clear that the first component indicates the difference in
preference between morning shifts (where Thursday and Friday have the highest loading)
versus night and evening (only Thursday and Friday evening) shifts. Principal component 2 is
more straightforward and shows the difference in preference between evening and night shift
(apart from which day of the week it is).
---------------------------------------------------
Insert Table 3 about here
---------------------------------------------------
---------------------------------------------------
Insert Figure 3 about here
------------------------------------------------
14347
15
Looking at the individual employees, the component scores (results not shown) give an
indication of their preferences. For example, ID 3 has a high score on the first component (2.37)
and a moderately low score on the second component (-0.77). This indicates a preference for
morning shifts (PC1) and a tendency to prefer night above evening shifts (PC2). With the latter,
however, the low sample size and the presence of outliers (permanent night shifts) has to be
taken into account. Finally, figure 4 shows the biplot with the two principal components,
together with the principal component scores (black ID numbers) and the principal component
loadings vectors (arrows).
---------------------------------------------------
Insert Figure 4 about here
------------------------------------------------
Employees who are closer in the biplot have more similar predicted pattern of preference for
the different shifts. In addition, a few employees can be spotted with a clear preference for night
shifts (lower left corner). To give an example for a principal component loading vector, the
loading for Wednesday morning on the first component is 0.29, and its loading on the second
component is 0.12 (“Wed: morning” is centered at the point (0.29, 0.12); axes not shown). The
projection of the employee, i.e. principal component scores, on the vector of a shift variable
indicates the predicted preference of the employee on the specific shift. In addition, this graph
reconfirms that the first component makes a distinction between morning and night/evening
shift, whereas the second component makes a distinction between evening and night shifts. The
plot shows a high correlation between the different days per shift, but a low correlation between
the different shifts (apart from which day of the week it is).
We can conclude that the matrix of component loadings does not have a simple structure:
although a pattern of association between shift variables is revealed, several shift variables
correlate with more than one principal component. This makes it difficult to classify shifts that
14347
16
load on the same component to certain types or groups of employees. However, it is possible
to get a picture of the preference in certain shifts via the two principal components, and this for
each individual person.
Cluster analysis
Using hierarchical clustering and Ward’s method, the dendrogram showed a three-cluster
solution (cf. Figure 5).
---------------------------------------------------
Insert Figure 5 about here
------------------------------------------------
Next, the k-means clustering divided the employees into three distinct groups (cf. Figure 6).
The proportion of explained variance by the three clusters is 40.6%. This means that almost
half of the variation in shift preference is explained by these clusters. In other words, when
employees could make their own schedule, we can see three distinct clusters of individuals with
different preferences in shifts. Cluster 1 are employees who prefer morning shifts above night
shifts (PC1) and evening shifts above night shifts (PC2). Cluster 2 are people who prefer
morning shifts above night shifts (PC1) and (often) night shifts above evening shifts (PC2).
Cluster 3 are employees on permanent night shifts. This group can be seen as outliers, given
the low sample size (n=5).
---------------------------------------------------
Insert Figure 6 about here
------------------------------------------------
Ideal versus Imposed Roster: Differences per Group
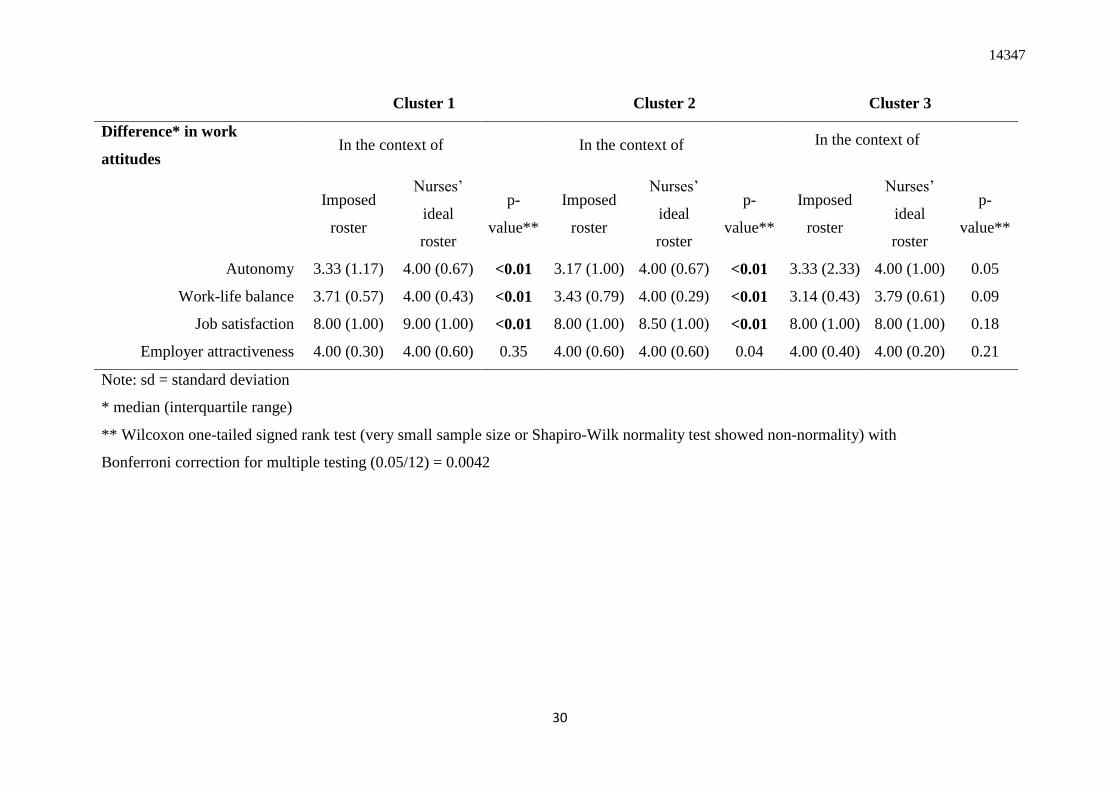
Table 4 provides the descriptive label per cluster. There are no large differences between the
clusters with regard to the baseline characteristics. However, Cluster 1 includes a higher number
of men (n=6) and has a lower mean age (34.67) compared to Cluster 2 and Cluster 3. In addition,
the median of the different work attitudes are displayed per cluster and this for the imposed

14347
17
versus the nurses’ ideal roster. Here, Cluster 1 and Cluster 2 showed a significant higher median
autonomy, work-life balance and job satisfaction for the nurses’ ideal roster. For Cluster 3, there
were no significant results, although a higher median score for autonomy and work-life balance
is also obtained for the nurses’ ideal roster. However, it should be noted that the Wilcoxon test
has little power when the sample size is small (n ≤ 5). Finally, no significant results were found
for a higher median employer attractiveness score for the nurses’ ideal roster, and this for any
of the clusters.
---------------------------------------------------
Insert Table 4 about here
------------------------------------------------
DISCUSSION
This pilot study looked at the preferences in shifts for “nurses’ ideal roster” and looked at the
discrepancy between this ideal roster versus the “imposed roster” via four work attitudes, i.e.
autonomy, work-life balance, job satisfaction and employer attractiveness. The focus was on
simple descriptive statistics rather than formal hypothesis testing. The results of this pilot study
will serve as input for a larger anticipated multicenter study.
First, the results showed a significant difference in the mean score for autonomy, job
satisfaction and work-life balance when the nurses’ ideal roster would be used compared to the
imposed roster. Second, we were able to gain insight into the nurses’ preference in shifts and
found three groups with similar preferences; i.e. nurses who prefer (1) morning or evening shifts
above night shifts (2) morning shifts above night shifts and (often) night shifts above evening
shifts (3) permanent night shifts (outliers). Third, there the first two cluster groups showed a
significant higher median autonomy, work-life balance and job satisfaction in the case of the
nurses’ ideal roster. In addition, there were no large differences between the clusters with regard
to their personal characteristics. The sample size in the third group was too small to reveal

14347
18
significant differences. When reading these results, one should bear in mind limited sample size
(n= 58) of this pilot study.
These findings confirm the results of previous research that uses flexible work arrangements to
give employees more control over their schedule, namely that an increase in autonomy was
associated with a better work-life balance, higher job satisfaction and a higher employer
attractiveness (Albertsen et al., 2014; Koning, 2014; Mas-Machuca et al., 2016; Onken-Menke
et al., 2018; Pryce et al., 2006). This is in line with our expectations, given that it can be
expected that the nurses’ most ideal roster (as asked in this survey, without regard to any
restrictions) will do better than rosters where certain rules or regulations must be taken into
account (i.e. flexible work arrangements). Research that assesses the preferences of individual
nurses and links these preferences to certain work attitudes is, to the best of our knowledge,
non-existent.
Practical Implications and Future Research
The results of this pilot study give a preliminary insight into the nurses’ preference in shifts.
This can be helpful as input for computerized healthcare personnel scheduling (e.g.,
mathematical programming, heuristics and artificial intelligence approaches). Research that
uses these methods often ignored the preferences of nurses (Ferland et al., 2001), used a specific
preference shift pattern in cyclic scheduling (Dowsland & Thompson, 2000), or used
aggregated preferences from surveys (Azaiez & Al Sharif, 2005). Individual nurse preferences
are seldom incorporated (Berrada, Ferland, & Michelon, 1996). In addition, this pilot study
gives an indication of how satisfied the employees are with their imposed roster, and what a
maximum increase of this (or other work attitudes) could be if they would receive or make their
ideal roster. This can be interesting when a company wishes to switch to, for example, self-
scheduling, where the “final roster” is a compromise between the “nurse's 'ideal roster” and the
“imposed roster”. This means that employees will almost never receive 100% their ideal
14347
19
schedule as they need to switch shifts among colleagues to meet staffing needs, have to comply
to the rules, regulations and guidelines of the organization and, in addition, the monthly
recurring process can be seen as a cumbersome procedure (Silvestro & Silvestro, 2000;
Wynendaele, Gemmel, Pattyn, Myny, & Trybou, 2020).
Future research should explore whether these work attitudes will still increase in the
same manner if the “final roster” (that aims a maximum synchronization of the organizational
and individual temporal schemata) does not meet the nurses’ preferences as well as the “nurses’
ideal roster” (i.e. the individual temporal schemata of the employees). In addition, apart from
looking at a possible increase in certain work attitudes, it can also be beneficial to test whether
are not an organization is ready for an implementation of, for example, self-scheduling (e.g.,
via readiness for change questionnaires) (Shea, Jacobs, Esserman, Bruce, & Weiner, 2014).
Furthermore, despite the small sample size, a few groups with similar preferences in
shifts were found. This means that different individuals have distinct preferences in shifts. A
fixed schedule where the various types of shifts are equally distributed to everyone, will
therefore never give a fair outcome for each employee. Future research should elaborate on this,
and investigate why certain nurses have different preferences in shifts. For example, various
personal characteristics or different life stages can alter ones preferences in shifts. This
understanding can aid in making specific predictions about when nurses will or will not entrain
(Shipp & Richardson, 2019).
Theoretical Implications and Future Research
Though the “nurses’ ideal roster” we wanted to gain insight into the nurses individual temporal
schemata. On the other hand, the organizational temporal structure was represented by the
“imposed roster”. Via the differences in work attitudes between these two types of rosters, we
aimed to assess how individual nurses responded to the discrepancy between their individual
temporal structure versus that of the organization. When there is inconsistency with one’s
14347
20
temporal schema, employees can automatically or deliberately entrain, actively or passively
resist, or create additional temporal structure (Shipp & Richardson, 2019). For healthcare
personnel and in a traditional nursing work environment, we can presume that individuals may
deliberately entrain, i.e. entrain to the organization’s suggested time line but do so by
consciously rationalizing inconsistencies (Shipp & Richardson, 2019). The 24-hours a day, 7-
days a week coverage where nurses have to work closely together and must coordinate with
others to accomplish mutually dependent goals, creates a situation where nurses feel pressure
to entrain, even when this situation does not fit their own temporal schemata (Johns, 2018). By
identifying how large the discrepancy is between the “nurses’ ideal roster” and the “imposed
roster”, we want to see how individuals navigate the tension between their own individualized
view of time versus the organizational structure. For this, two predictors are needed. First,
personal characteristics, as it is possible that certain people are more sensitive to deviations than
others. For example, certain stages in life will lead to different priorities. How the imposed
roster is in line with these priorities will influence their level of entrainment. Second, the
discrepancy between the two rosters, since a large difference can make people less likely to be
satisfied. For example, someone that likes to work in the evening that has to work lots of
morning shifts. This pilot study only included a limited number of personal characteristics. In
future research, extra variables (for example morning- versus evening-type) as well as the
discrepancy between the two roosters, should get more attention.
The traditional nursing work environment outlines a situation where employees have little
control over resources, decisions, or rewards. Change this situation to an empowering
environment where nurses get more control over their working hours, and they are more likely
to express their opinions when the timing of a situation is inconsistent with their schemata
(Morrison, 2014). This could evoke for example, active resistance, which includes larger efforts
to change the organization’s temporal structure to match one’s personal sense of timing (Shipp

14347
21
& Richardson, 2019). To avoid this, it is necessary to prevent uncertainty as to why certain
decision were made (e.g., a request for a particular shift that has been refused).
Limitations
This first exploratory pilot study already indicates that an "ideal" schedule that fully responds
to the needs of the nurses can lead to better work attitudes, and that groups of people exist with
differences in shift preferences. However, this study has also some limitations.
First, given that the data on the work attitudes for both the “nurses’ ideal roster” and the
“imposed roster” are collected from the same respondents at one point in time, this can lead to
potential common method bias. However, we did try to anticipate this through physically
separating the two rosters and their associated work attitudes and by ensuring anonymity
(Podsakoff, MacKenzie, Lee, & Podsakoff, 2003).
Second, this pilot study has a relatively small sample size. Although mainly simple descriptive
statistics are used, a larger sample size in needed to minimize the probability of errors,
maximize the accuracy of population estimates, and increase the generalizability of the results.
Although different opinions exist on the sample size for principal component analysis, the best
results can be expected when the number of subjects and subject to variable ratio are both large
(Osborne & Costello, 2004). In addition, making a meaningful clustering is an iterative process
and a larger sample size will allow to check the stability of the cluster solution (Everitt &
Hothorn, 2011). In the foreseen larger anticipated study, hypothesis testing will be possible and
multilevel analysis should be used (employees nested within departments, departments nested
within hospitals) where we can assume that outcomes within a cluster are correlated and
outcomes belonging to different clusters are independent.
Finally, the “nurses’ ideal roster” does not take into account any restrictions. This is a simplified
and an unrealistic representation of the reality, given that a nurse may be planning too many
shifts one after another. This, for example, could be in violation of the law and could have a
14347
22
negative impact on his or her health. However, given that these nurses have typically been
working in this context for a long time, we could assume that some of these rules have been
incorporated or internalized. Finally, future research should integrate the degree to which one
shift was preferred over another.
CONCLUSION
There is a significant difference in the mean autonomy, job satisfaction and work-life balance
between the data in case of the ideal and the imposed roster, which indicate that there is room
for improvement for these work attitudes by working with a personalized schedule. In addition,
three different groups with similar preferences in shifts could be extracted. Here, again, there
was a significant difference in the median autonomy, job satisfaction and work-life balance
between the ideal and the imposed roster, for two of the three groups. The interpretation of these
results should bear in mind that this pilot study had a small sample size. Future research should
further focus on identifying the individual preferences in shifts, on the discrepancy between the
individual and the organizational schemata and what the effect is on different work attitudes.
Furthermore, it should be explored to what extent self-scheduling coincides with the ideal
schedule to guide healthcare management in their decision to implement this method.

14347
23
REFERENCES
Abernathy, W. J., Baloff, N., Hershey, J. C., & Wandel, S. (1973). A three-stage manpower planning
and scheduling model—a service-sector example. Operations Research, 21(3), 693-711.
Aiken, L. H., Clarke, S. P., Sloane, D. M., Sochalski, J., & Silber, J. H. (2002). Hospital nurse staffing
and patient mortality, nurse burnout, and job dissatisfaction. Jama, 288(16), 1987-1993.
Aiken, L. H., Sermeus, W., Van den Heede, K., Sloane, D. M., Busse, R., McKee, M., . . . Moreno-
Casbas, M. T. (2012). Patient safety, satisfaction, and quality of hospital care: cross sectional
surveys of nurses and patients in 12 countries in Europe and the United States. Bmj, 344,
e1717.
Aiken, L. H., Sloane, D. M., Bruyneel, L., Van den Heede, K., Griffiths, P., Busse, R., . . . Lesaffre, E.
(2014). Nurse staffing and education and hospital mortality in nine European countries: a
retrospective observational study. The Lancet, 383(9931), 1824-1830.
Albertsen, K., Garde, A. H., Nabe-Nielsen, K., Hansen, Å. M., Lund, H., & Hvid, H. (2014). Work-
life balance among shift workers: results from an intervention study about self-rostering.
International Archives of Occupational and Environmental Health, 87(3), 265-274.
doi:10.1007/s00420-013-0857-x.
Albertsen, K., Rafnsdóttir, G. L., Grimsmo, A., Tómasson, K., & Kauppinen, K. (2008). Workhours
and worklife balance. SJWEH Supplements(5), 14-21.
Ancona, D., & Chong, C.-L. (1996). Entrainment: Pace, cycle, and rhythm in organizational behavior.
RESEARCH IN ORGANIZATIONAL BEHAVIOR, VOL 18, 1996, 18, 251-284.
Ancona, D., & Waller, M. J. (2007). The dance of entrainment: Temporally navigating across multiple
pacers. Research in Sociology of Work, 17, 115.
Asgeirsson, E. I. (2014). Bridging the gap between self schedules and feasible schedules in staff
scheduling. Annals of Operations Research, 218(1), 51-69. doi:10.1007/s10479-012-1060-2
Azaiez, M. N., & Al Sharif, S. S. (2005). A 0-1 goal programming model for nurse scheduling.
Computers & Operations Research, 32(3), 491-507. doi:10.1016/s0305-0548(03)00249-1
Bard, J. F., & Purnomo, H. W. (2005). Preference scheduling for nurses using column generation.
European Journal of Operational Research, 164(2), 510-534. doi:10.1016/j.ejor.2003.06.046
Berrada, I., Ferland, J. A., & Michelon, P. (1996). A multi-objective approach to nurse scheduling
with both hard and soft constraints. Socio-Economic Planning Sciences, 30(3), 183-193.
Blau, P. (1964). Power and exchange in social life. In: New York: J Wiley & Sons.
Boamah, S. A., Read, E. A., & Spence Laschinger, H. K. (2017). Factors influencing new graduate
nurse burnout development, job satisfaction and patient care quality: a time‐lagged study. J
Adv Nurs, 73(5), 1182-1195.
Burbidge, J. B., Magee, L., & Robb, A. L. (1988). Alternative Transformations to Handle Extreme
Values of the Dependent Variable. Journal of the American Statistical Association, 83(401),
123-127. doi:10.1080/01621459.1988.10478575
Burke, E. K., De Causmaecker, P., Berghe, G. V., L, V., & eghem, H. (2004). The state of the art of
nurse rostering. Journal of Scheduling, 7(6), 441-449.
Cline, D., Reilly, C., & Moore, J. F. (2003). What’s behind RN turnover? Nurs Manage, 34(10), 50-
53.
Cropanzano, R., & Mitchell, M. S. (2005). Social exchange theory: An interdisciplinary review.
Journal of Management, 31(6), 874-900.
Dolbier, C. L., Webster, J. A., McCalister, K. T., Mallon, M. W., & Steinhardt, M. A. (2005).
Reliability and validity of a single-item measure of job satisfaction. American Journal of
Health Promotion, 19(3), 194-198.
Dowsland, K. A., & Thompson, J. M. (2000). Solving a nurse scheduling problem with knapsacks,
networks and tabu search. Journal of the Operational Research Society, 51(7), 825-833.
Eby, L. T., Casper, W. J., Lockwood, A., Bordeaux, C., & Brinley, A. (2005). Work and family
research in IO/OB: Content analysis and review of the literature (1980–2002). Journal of
Vocational Behavior, 66(1), 124-197. doi:https://doi.org/10.1016/j.jvb.2003.11.003

14347
24
Ernst, A. T., Jiang, H., Krishnamoorthy, M., & Sier, D. (2004). Staff scheduling and rostering: A
review of applications, methods and models. European Journal of Operational Research,
153(1), 3-27. doi:10.1016/s0377-2217(03)00095-x
Everitt, B., & Hothorn, T. (2011). An introduction to applied multivariate analysis with R: Springer
Science & Business Media.
Ferland, J. A., Berrada, I., Nabli, I., Ahiod, B., Michelon, P., Gascon, V., & Gagné, É. (2001).
Generalized assignment type goal programming problem: Application to nurse scheduling.
Journal of Heuristics, 7(4), 391-413.
Glette, M. K., Aase, K., & Wiig, S. (2017). The relationship between understaffing of nurses and
patient safety in hospitals-A literature review with thematic analysis.
Jeffrey Hill, E., Grzywacz, J. G., Allen, S., Blanchard, V. L., Matz-Costa, C., Shulkin, S., & Pitt-
Catsouphes, M. (2008). Defining and conceptualizing workplace flexibility. Community, Work
and Family, 11(2), 149-163.
Johns, G. (2018). Advances in the treatment of context in organizational research. Annual Review of
Organizational Psychology and Organizational Behavior, 5, 21-46.
Khoong, C. M. (1996). An integrated system framework and analysis methodology for manpower
planning. International Journal of Manpower.
Koning, C. (2014). Does self-scheduling increase nurses' job satisfaction? An integrative literature
review. Nurs Manage, 21(6), 24-28. doi:10.7748/nm.21.6.24.e1230
Lancaster, G. A., Dodd, S., & Williamson, P. R. (2004). Design and analysis of pilot studies:
recommendations for good practice. J Eval Clin Pract, 10(2), 307-312.
doi:https://doi.org/10.1111/j..2002.384.doc.x
Le, S., Josse, J., & Husson, F. (2008). FactoMineR: An R Package for Multivariate Analysis. Journal
of Statistical Software, 25(1), 1-18. doi:10.18637/jss.v025.i01
Mas-Machuca, M., Berbegal-Mirabent, J., & Alegre, I. (2016). Work-life balance and its relationship
with organizational pride and job satisfaction. Journal of Managerial Psychology.
McGrath, J. E., & Kelly, J. R. (1986). Time and human interaction: Toward a social psychology of
time: Guilford Press.
McGrath, J. E., Kelly, J. R., & Machatka, D. E. (1984). The social psychology of time: Entrainment of
behavior in social and organizational settings. Applied social psychology annual.
McGrath, J. E., & Rotchford, N. L. (1983). Time and behavior in organizations. Research in
organizational behavior.
Morrison, E. W. (2014). Employee voice and silence. Annu. Rev. Organ. Psychol. Organ. Behav.,
1(1), 173-197.
Nguyen Huy, Q. (2001). Time, temporal capability, and planned change. Academy of Management
Review, 26(4), 601-623.
Nguyen, L. H., & Holmes, S. (2019). Ten quick tips for effective dimensionality reduction. PLoS
Comput Biol, 15(6), e1006907. doi:10.1371/journal.pcbi.1006907
Onken-Menke, G., Nüesch, S., & Kröll, C. (2018). Are you attracted? Do you remain? Meta-analytic
evidence on flexible work practices. Business Research, 11(2), 239-277. doi:10.1007/s40685-
017-0059-6
Osborne, J. W., & Costello, A. B. (2004). Sample size and subject to item ratio in principal
components analysis. Practical Assessment, Research, and Evaluation, 9(1), 11.
Perlow, L. A. (1999). The time famine: Toward a sociology of work time. Administrative science
quarterly, 44(1), 57-81.
Podsakoff, P. M., MacKenzie, S. B., Lee, J.-Y., & Podsakoff, N. P. (2003). Common method biases in
behavioral research: a critical review of the literature and recommended remedies. Journal of
Applied Psychology, 88(5), 879.
Pryce, J., Albertsen, K., & Nielsen, K. (2006). Evaluation of an open‐rota system in a Danish
psychiatric hospital: a mechanism for improving job satisfaction and work–life balance. J
Nurs Manag, 14(4), 282-288. doi:10.1111/j.1365-2934.2006.00617.x
Ronnberg, E., & Larsson, T. (2010). Automating the self-scheduling process of nurses in Swedish
healthcare: a pilot study. Health Care Manag Sci, 13(1), 35-53. doi:10.1007/s10729-009-
9107-x

14347
25
Ryan, R. M., & Deci, E. L. (2000). Self-determination theory and the facilitation of intrinsic
motivation, social development, and well-being. American psychologist, 55(1), 68.
Shea, C. M., Jacobs, S. R., Esserman, D. A., Bruce, K., & Weiner, B. J. (2014). Organizational
readiness for implementing change: a psychometric assessment of a new measure.
Implementation Science, 9(1), 7.
Shipp, A. J., & Richardson, H. (2019). The Impact of Temporal Schemata: Understanding When
Individuals Entrain versus Resist or Create Temporal Structure. Academy of Management
Review(ja).
Silvestro, R., & Silvestro, C. (2000). An evaluation of nurse rostering practices in the National Health
Service. J Adv Nurs, 32(3), 525-535.
Storey, C., Cheater, F., Ford, J., & Leese, B. (2009). Retention of nurses in the primary and
community care workforce after the age of 50 years: database analysis and literature review. J
Adv Nurs, 65(8), 1596-1605. doi:10.1111/j.1365-2648.2009.05036.x
Venkataraman, R., & Brusco, M. J. (1996). An integrated analysis of nurse staffing and scheduling
policies. Omega, 24(1), 57-71.
Wren, A. (1995). Scheduling, timetabling and rostering—a special relationship? Paper presented at
the International conference on the practice and theory of automated timetabling.
Wynendaele, H., Gemmel, P., Pattyn, E., Myny, D., & Trybou, J. (2020). Systematic review: What is
the impact of self-scheduling on the patient, nurse and organization? J Adv Nurs.
doi:10.1111/jan.14579
Wynendaele, H., Willems, R., & Trybou, J. (2019). Systematic review: Association between the
patient–nurse ratio and nurse outcomes in acute care hospitals. J Nurs Manag, 27(5), 896-917.
doi:10.1111/jonm.12764
14347
26
TABLES AND FIGURES
Tables
Table 1: employee's characteristics (n=58)
Full-
time Part-time Overall
(n=32) (n=25) (n=58)
Gender
Female 24 (75%) 24 (96%) 49 (84 %)
Male 8 (25%) 1 (4%) 9 (16 %)
Marital status
Married/living together 20 (63%) 21 (84%) 41 (71%)
Divorced/single 11 (34%) 4 (16%) 15 (26%)
Missing 1 (3%) 0 (0%) 2 (3%)
Children
Yes 10 (31%) 18 (72%) 28 (48%)
No 18 (56%) 2 (8%) 20 (34%)
Missing 4 (13%) 5 (20%) 10 (17%)
Function
Nurse 27 (84%) 20 (80%) 48 (83 %)
Midwife 4 (12%) 5 (20%) 9 (16 %)
Missing 1 (3%) 0 (0%) 1 (2%)
Age
Mean (SD) 33 (±9.1) 41 (± 9.8) 36 (± 10)
Missing 2 (6%) 6 (24%) 8 (14%)

14347
27
Table 2: Mean difference in work attitudes between the imposed roster versus the nurses’ ideal roster (n=58)
In the context of
imposed roster nurses’ ideal roster Mean difference
(95% CI)
t-statistic
(df) P-value*
Autonomy
Mean (sd) 3.2 (± 0.80) 3.9 (± 0.77) 0.67 (0.45 to 0.90) 6.01 (55) <0.01
Missing 2 (3.4%) 0 (0%)
Work-life balance
Mean (sd) 3.5 (± 0.56) 4.0 (± 0.48) 0.55 (0.37 to 0.73) 6.08 (51) <0.01
Missing 2 (3.4%) 4 (6.9%)
Job satisfaction
Mean (sd) 7.8 (± 1.5) 8.4 (± 1.6) 0.60 (0.39 to 0.81) 5.85 (54) <0.01
Missing 2 (3.4%) 2 (3.4%)
Employer attractiveness
Mean (sd) 3.9 (± 0.54) 4.1 (± 0.49) 0.16 (0.01 to 0.30) 2.18 (54) <0.03
Missing 1 (1.7%) 2 (3.4%)
Note: sd = standard deviation
* Student's paired t-test with Bonferroni correction for mulitple t-test (0.05/4)=0.012

14347
28
Table 3: per shift variable: mean (sd), component loadings for two PCs; per
principal component: how much variance each component explains in the data
Mean (sd) PC 1 PC 2
Per shift
Monday Morning 1.38 (1.29) 0.34 -0.02
Evening 0.79 (1.01) -0.12 0.33
Night 0.29 (0.35) -0.15 -0.23
Tuesday Morning 1.74 (1.25) 0.35 0.04
Evening 0.86 (0.89) -0.16 0.37
Night 0.36 (0.38) -0.17 -0.23
Wednesday Morning 1.60 (1.47) 0.29 0.12
Evening 0.67 (0.79) -0.15 0.28
Night 0.38 (0.38) -0.18 -0.24
Thursday Morning 1.71 (1.40) 0.39 0.04
Evening 0.95 (1.07) -0.20 0.40
Night 0.34 (0.37) -0.19 -0.22
Friday Morning 1.33 (1.45) 0.36 0.00
Evening 0.84 (0.98) -0.21 0.32
Night 0.28 (0.34) -0.17 -0.21
Saturday Morning 0.59 (0.53) 0.14 0.00
Evening 0.45 (0.50) -0.09 0.15
Night 0.26 (0.34) -0.15 -0.22
Sunday Morning 0.52 (0.50) 0.15 -0.01
Evening 0.53 (0.57) -0.07 0.15
Night 0.26 (0.34) -0.16 -0.21
Per principal component
Eigenvalue
2.15 1.69
Variance %
30.72 24.22
Cumulative variance % 30.72 54.94
Note: sd = standard deviation, PC = principal component

14347
29
Table 4: Cluster profiles with comparison of work attitudes in the context of “imposed roster” versus “nurses’ ideal roster”
Cluster 1 Cluster 2 Cluster 3
Cluster size (n) 29 24 5
Descriptive label ~ preferred shift
Morning shifts above night
shifts (PC1) and evening
shifts above night shifts
(PC2)
Morning shifts above night
shifts (PC1) and (often)
night shifts above evening
shifts (PC2)
Permanent night shifts
(outliers)
Age (mean (sd)) 34.67 (9.4) 37.65 (11.17) 37.40 (10.90)
Women (n (%)) 23 (79%) 22 (92%) 4 (80%)
Work time (n (%))
Full-time 16 (55%) 13 (54%) 2 (40%)
Part-time 11 (38%) 10 (42%) 3 (60%)
Missing 2 (7%) 1 (4%) 0 (0%)
Marital status (n (%))
Married/living together with children 10 (34%) 8 (33%) 3 (60%)
Married/living together without children 7 (24%) 4 (17%) 1 (20%)
Divorced/ single with children 3 (10%) 3 (13%) 0 (0%)
Divorced/ single without children 4 (14%) 2 (8%) 1 (20%)
Missing 5 (17%) 7 (29%) 0 (0%)
14347
30
Cluster 1 Cluster 2 Cluster 3
Difference* in work
attitudes In the context of In the context of In the context of
Imposed
roster
Nurses’
ideal
roster
p-
value**
Imposed
roster
Nurses’
ideal
roster
p-
value**
Imposed
roster
Nurses’
ideal
roster
p-
value**
Autonomy 3.33 (1.17) 4.00 (0.67) <0.01 3.17 (1.00) 4.00 (0.67) <0.01 3.33 (2.33) 4.00 (1.00) 0.05
Work-life balance 3.71 (0.57) 4.00 (0.43) <0.01 3.43 (0.79) 4.00 (0.29) <0.01 3.14 (0.43) 3.79 (0.61) 0.09
Job satisfaction 8.00 (1.00) 9.00 (1.00) <0.01 8.00 (1.00) 8.50 (1.00) <0.01 8.00 (1.00) 8.00 (1.00) 0.18
Employer attractiveness 4.00 (0.30) 4.00 (0.60) 0.35 4.00 (0.60) 4.00 (0.60) 0.04 4.00 (0.40) 4.00 (0.20) 0.21
Note: sd = standard deviation
* median (interquartile range)
** Wilcoxon one-tailed signed rank test (very small sample size or Shapiro-Wilk normality test showed non-normality) with
Bonferroni correction for multiple testing (0.05/12) = 0.0042
14347
31
Figures
Figure 1: Conceptual model and hypothesized relationships
Figure 2: Scree plot (applied to standardized variables) shows an elbow at three
components (meaning two components should be retained), Kaiser’s rule makes the same
conclusion

14347
32
Figure 3: Sources of variation in scheduling by the employees for the two principal components (PC)

14347
33
Figure 4: The biplot shows that the first component makes a distinction between morning and
evening/night shift, whereas the second component makes a distinction between evening and
night shifts.
Figure 5: Dendrogram using Ward's method reveals three clusters

14347
34
Figure 6: k-means clustering divided the employees into three distinct groups


![RESEARCH ARTICLE Open Access Anonsensemutationin …biblio.ugent.be/publication/7096818/file/7096856.pdf · served between pedigree relationship (A, according to Colleau [19]) and](https://img.pdfslide.us/doc/110x75/6075569bc5cc2d6a0847bfc0/research-article-open-access-anonsensemutationin-served-between-pedigree-relationship.jpg)