Embed Size (px)
Citation preview

!
The World Count of Gaming Machines 2013
For the Gaming Technologies Associa3on
Provides an insight into the global gaming machine industry through an es3mate of the number of gaming machines legi3mately opera3ng worldwide.
M a r c h 2 0 1 4 !S . Z i o l k o w s k i

!
!
� | Page2
This report is provided on the terms and understanding that neither the author nor the Gaming Technologies Associa3on is responsible for the results of any ac3ons taken on the basis of informa3on in this report. The author and the Gaming Technologies Associa3on expressly disclaim all and any liability in respect of anything done or omiCed to be done by any person in reliance upon the whole or any part of the informa3on provided in this report.

!
Contents Introduction! 4!
Method! 4!
Definition of a Gaming Machine ! 5!
Slot Machines! 5!
Video Lottery Terminals and Video Gaming Machines! 5!
Amusements with Payouts! 6!
Pachinko and Pachislot! 6!
Electronic Table Games! 6!
Summary of findings ! 7!
Appendix A: Individual Country Data by Geographical Region! 11!
Oceania ! 12!
Americas ! 13!
Asia and the Middle East! 15!
Africa ! 16!
Europe ! 18!
Appendix B: Counts by State in Australia, Canada and the USA! 19!
Australia ! 20!
Canada! 20!
United States of America! 21!
Appendix C: Cruise Ships! 22!
Appendix D: Maximum Bets & Payouts! 27!
References ! 30!
� | Page3
!
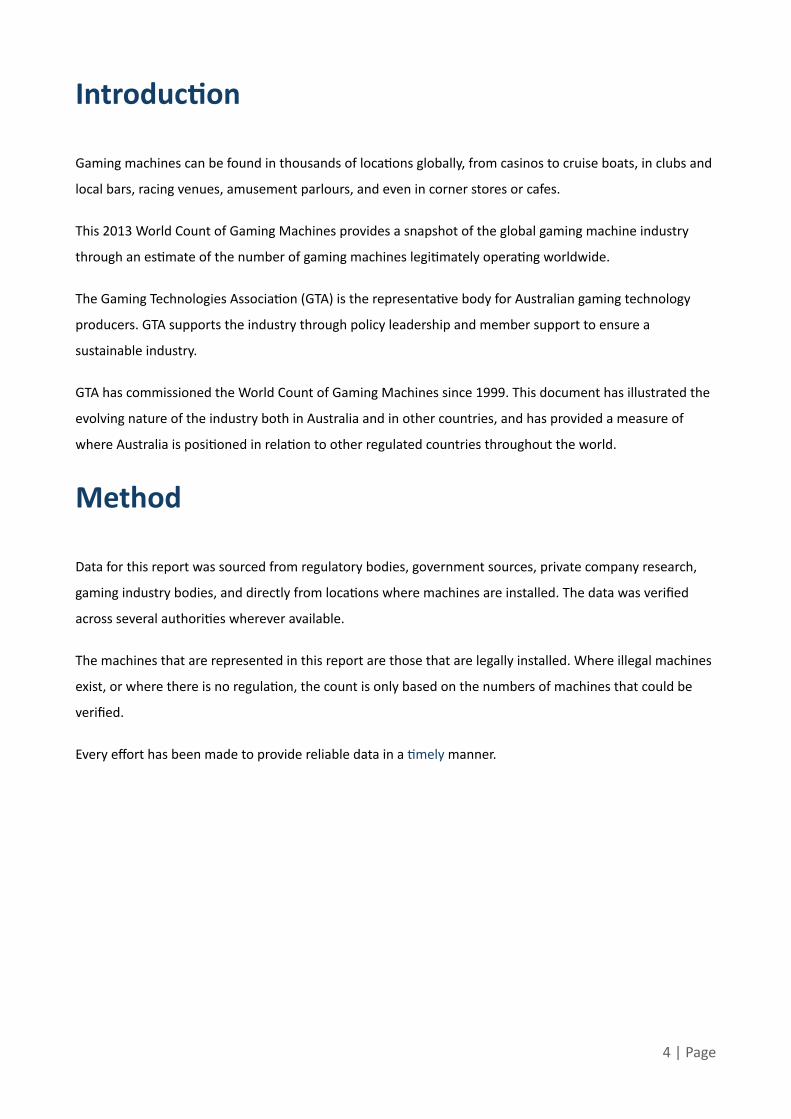
Introduc;on !Gaming machines can be found in thousands of loca3ons globally, from casinos to cruise boats, in clubs and
local bars, racing venues, amusement parlours, and even in corner stores or cafes.
This 2013 World Count of Gaming Machines provides a snapshot of the global gaming machine industry
through an es3mate of the number of gaming machines legi3mately opera3ng worldwide.
The Gaming Technologies Associa3on (GTA) is the representa3ve body for Australian gaming technology
producers. GTA supports the industry through policy leadership and member support to ensure a
sustainable industry.
GTA has commissioned the World Count of Gaming Machines since 1999. This document has illustrated the
evolving nature of the industry both in Australia and in other countries, and has provided a measure of
where Australia is posi3oned in rela3on to other regulated countries throughout the world.
Method !Data for this report was sourced from regulatory bodies, government sources, private company research,
gaming industry bodies, and directly from loca3ons where machines are installed. The data was verified
across several authori3es wherever available.
The machines that are represented in this report are those that are legally installed. Where illegal machines
exist, or where there is no regula3on, the count is only based on the numbers of machines that could be
verified.
Every effort has been made to provide reliable data in a 3mely manner.
!
� | Page4

!
Defini;on of a Gaming Machine !For the purpose of this report we have taken the defini3on of a gaming machine as defined by the New
South Wales Government in the Gaming Machines Act 2001. This defines a gaming machine as a device that
is designed for:
a. The playing of a game of chance or a game that is partly chance and partly a game requiring skill,
and
b. The paying out of money or tokens or for registering a right to an amount of money or money’s
worth to be paid, and includes any subsidiary equipment.
The above defini3on covers many differing machines that fall into various categories or classes around the
world. To give a beCer understanding of the machines that are installed worldwide, where available, we
have aCempted to provide a breakdown of Slot machines, Video LoCery Terminals, Video Gaming
Machines, Pachinko and Pachislot machines, and Electronic Table Games. Our descrip3on for each of the
classes of machines can be seen below. We do not assume our defini3ons to be technically accurate under
all gaming jurisdic3ons, but aim to provide an outline of the general classifica3on understood by many of
our sources.
Slot Machines
The basic game of a slot machine requires that a minimum of three reels be put in mo3on with the result
being determined by the combina3on of objects displayed when the reels come to a stop. In general,
should the objects match the player wins. The winning amount may vary depending on the ranking of the
par3cular object pictured compared to the other objects on the reel.
Slot Machines are also known as “fruit machines”, “pokies”, or “jackpot machines”.
Modern slot machines use computer generated images, rather than mechanical reels, however the principle
of the game is the same.
Video LoDery Terminals and Video Gaming Machines
Video loCery terminals (VLTs) and Video Gaming Machines (VGMs) provide mul3-‐game pla_orms that o`en
offer slot games as part of their repertoire. Other games may include video poker, video blackjack, video
bingo, video loCo etc.
� | Page5
!
In some jurisdic3ons VLTs operate on a networked system rather than by individual machine. This can allow
a payout to be larger than if the machine were opera3ng on its own.
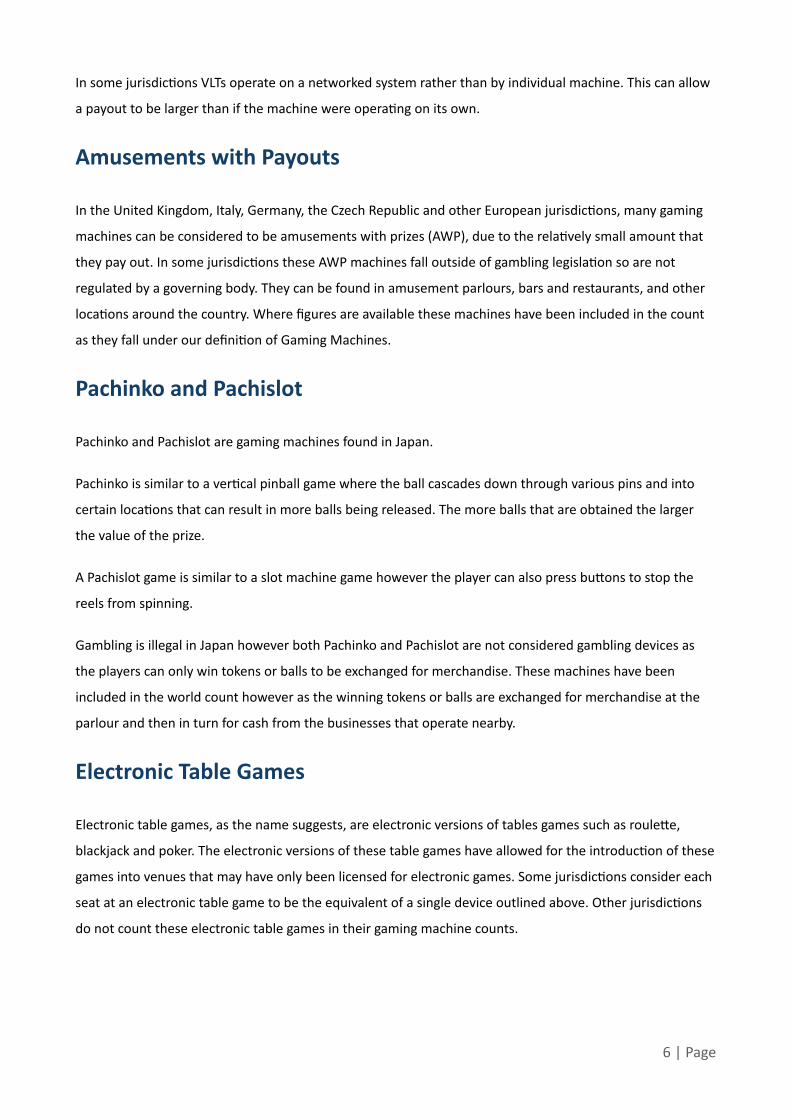
Amusements with Payouts
In the United Kingdom, Italy, Germany, the Czech Republic and other European jurisdic3ons, many gaming
machines can be considered to be amusements with prizes (AWP), due to the rela3vely small amount that
they pay out. In some jurisdic3ons these AWP machines fall outside of gambling legisla3on so are not
regulated by a governing body. They can be found in amusement parlours, bars and restaurants, and other
loca3ons around the country. Where figures are available these machines have been included in the count
as they fall under our defini3on of Gaming Machines.
Pachinko and Pachislot
Pachinko and Pachislot are gaming machines found in Japan.
Pachinko is similar to a ver3cal pinball game where the ball cascades down through various pins and into
certain loca3ons that can result in more balls being released. The more balls that are obtained the larger
the value of the prize.
A Pachislot game is similar to a slot machine game however the player can also press buCons to stop the
reels from spinning.
Gambling is illegal in Japan however both Pachinko and Pachislot are not considered gambling devices as
the players can only win tokens or balls to be exchanged for merchandise. These machines have been
included in the world count however as the winning tokens or balls are exchanged for merchandise at the
parlour and then in turn for cash from the businesses that operate nearby.
Electronic Table Games
Electronic table games, as the name suggests, are electronic versions of tables games such as rouleCe,
blackjack and poker. The electronic versions of these table games have allowed for the introduc3on of these
games into venues that may have only been licensed for electronic games. Some jurisdic3ons consider each
seat at an electronic table game to be the equivalent of a single device outlined above. Other jurisdic3ons
do not count these electronic table games in their gaming machine counts.
!� | Page6
!
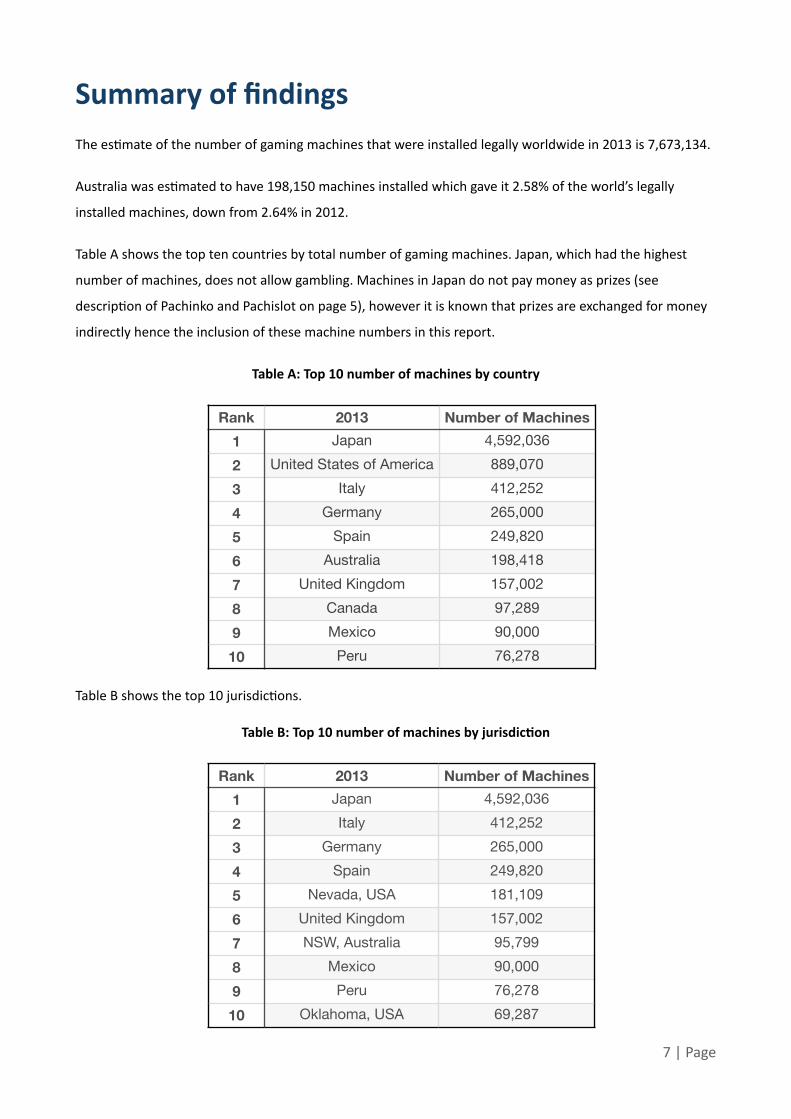
Summary of findings !The es3mate of the number of gaming machines that were installed legally worldwide in 2013 is 7,673,134.
Australia was es3mated to have 198,150 machines installed which gave it 2.58% of the world’s legally
installed machines, down from 2.64% in 2012.
Table A shows the top ten countries by total number of gaming machines. Japan, which had the highest
number of machines, does not allow gambling. Machines in Japan do not pay money as prizes (see
descrip3on of Pachinko and Pachislot on page 5), however it is known that prizes are exchanged for money
indirectly hence the inclusion of these machine numbers in this report.
Table A: Top 10 number of machines by country
Table B shows the top 10 jurisdic3ons.
Table B: Top 10 number of machines by jurisdic;on
Rank 2013 Number of Machines1 Japan 4,592,0362 United States of America 889,0703 Italy 412,2524 Germany 265,0005 Spain 249,8206 Australia 198,4187 United Kingdom 157,0028 Canada 97,2899 Mexico 90,00010 Peru 76,278
Rank 2013 Number of Machines1 Japan 4,592,0362 Italy 412,2523 Germany 265,0004 Spain 249,8205 Nevada, USA 181,1096 United Kingdom 157,0027 NSW, Australia 95,7998 Mexico 90,0009 Peru 76,27810 Oklahoma, USA 69,287
� | Page7

!
In 2013 Australia moved to 6th ranking for total machine numbers (from 5th in 2012). Table C illustrates
how the country rankings have changed since 2002.
Table C: Top 10 country rankings by year
* From figures from World Count of Gaming Machines 2010, 2008, 2006, 2004, 2002 by TNS Global
Table D illustrates how the jurisdic3on rankings have changed since 2002.
Table D: Top 10 jurisdic;on rankings by year
* From figures from World Count of Gaming Machines 2010, 2008, 2006, 2004, 2002 by TNS Global
2013 2012 2011 2010 * 2008 * 2006 * 2004 * 2002 *Japan Japan Japan Japan Japan Japan Japan JapanUSA USA USA USA USA USA USA USAItaly Italy Italy Italy Russia Italy Italy Italy
Germany Germany Germany United Kingdom Spain United
KingdomUnited
KingdomUnited
Kingdom
Spain Australia Spain Spain United Kingdom Russia Spain Spain
Australia Spain United Kingdom Germany Germany Spain Germany Germany
United Kingdom
United Kingdom Australia Australia Italy Germany Australia Australia
Canada Canada Canada Canada Australia Australia Russia Canada
Mexico Mexico Czech Republic
Czech Republic Canada Canada Canada France
Peru Peru Netherlands Romania Czech Republic Ukraine France Netherlands
2013 2012 2011 2010 * 2008 * 2006 * 2004 * 2002 *Japan Japan Japan Japan Japan Japan Japan JapanItaly Italy Italy Italy Russia Italy Italy Italy
Germany Germany Germany United Kingdom Spain United
KingdomUnited
KingdomUnited
Kingdom
Spain Spain Spain Spain United Kingdom Russia Spain Spain
Nevada, USA Nevada, USA United Kingdom Germany Nevada, USA Spain Germany Germany
United Kingdom
United Kingdom Nevada, USA Nevada, USA Germany Germany Nevada, USA Nevada, USA
NSW, Australia
NSW, Australia
NSW, Australia
NSW, Australia Italy Nevada, USA NSW,
AustraliaNSW,
Australia
Mexico Mexico California, USA
Czech Republic
NSW, Australia
NSW, Australia Russia France
Peru Peru Oklahoma, USA
Oklahoma, USA
California, USA Ukraine France Netherlands
Oklahoma, USA
California, USA
Czech Republic Romania Czech
RepublicCalifornia,
USACalifornia,
USA Belgium
� | Page8

!
The total installed base by geographical region can be seen in the following chart. The legend is in order of
largest, through to smallest, share of electronic gaming machines.
Chart A: Summary by Geographical Region
The 2013 popula3on has been sourced and compared to the number of gaming machines per country. The
ra3o of persons to the number of gaming machines per country has been based on the total popula3on. No
considera3on has been given to the popula3on of legal gaming age, only the popula3on of the country or
state as a whole. The top ten countries based on number of persons per machine can be seen in Table E and
the top ten jurisdic3ons in Table F.
Table E: Top 10 number of machines per capita by country
!!
Table F: Top 10 number of machines per capita by jurisdic;on
Country Person per Machine
Sint Maarten 12Monaco 26Japan 28Aruba (Netherlands) 29China, Macao Special Administrative Region 46Curacao 65Saint Kitts and Nevis 95Australia 118Gibraltar (UK) 132Italy 145
� | Page9
Eastern AsiaEuropeNorthern AmericaOceaniaSouth AmericaCentral AmericaAfricaCaribbeanSouth-Eastern AsiaCruise ShipsWestern Asia (Middle East)Southern AsiaCentral Asia
!
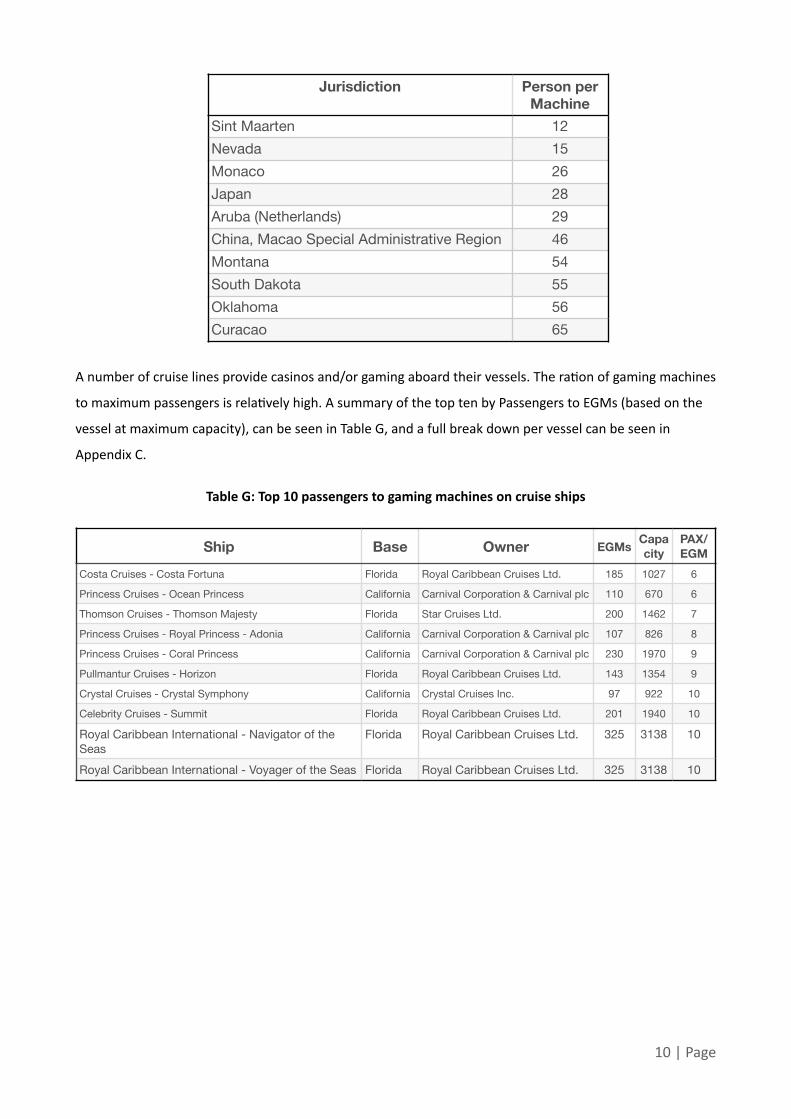
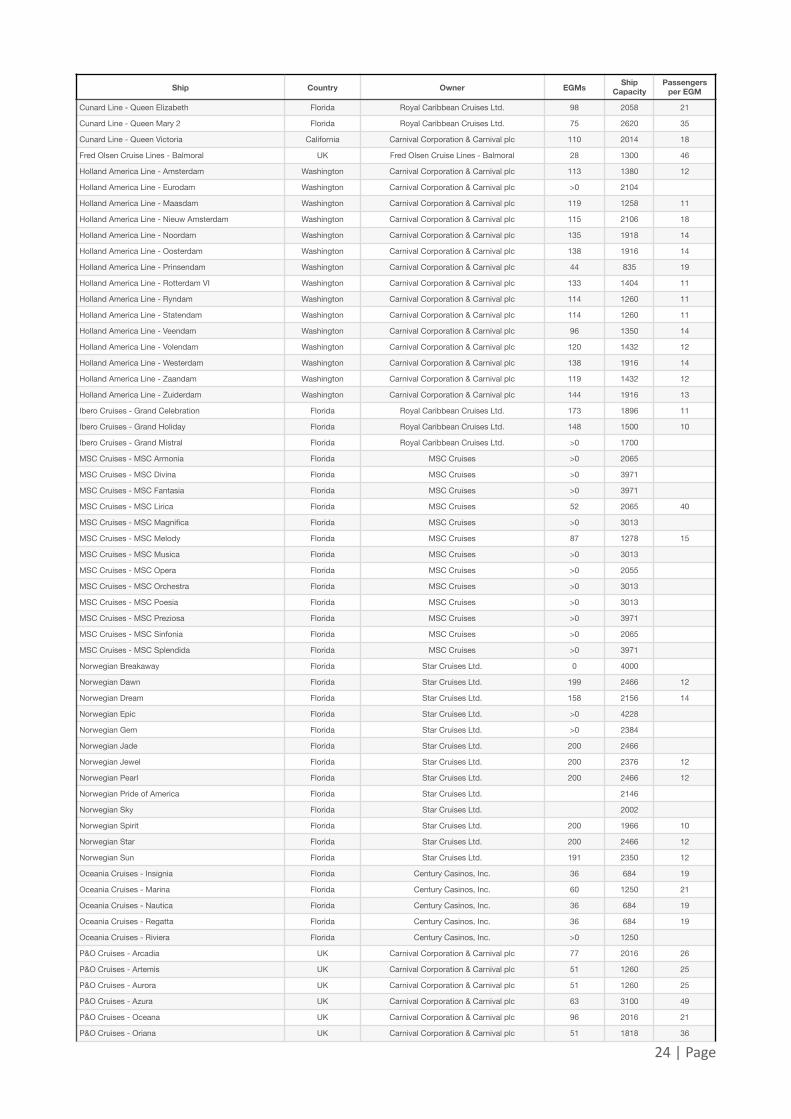
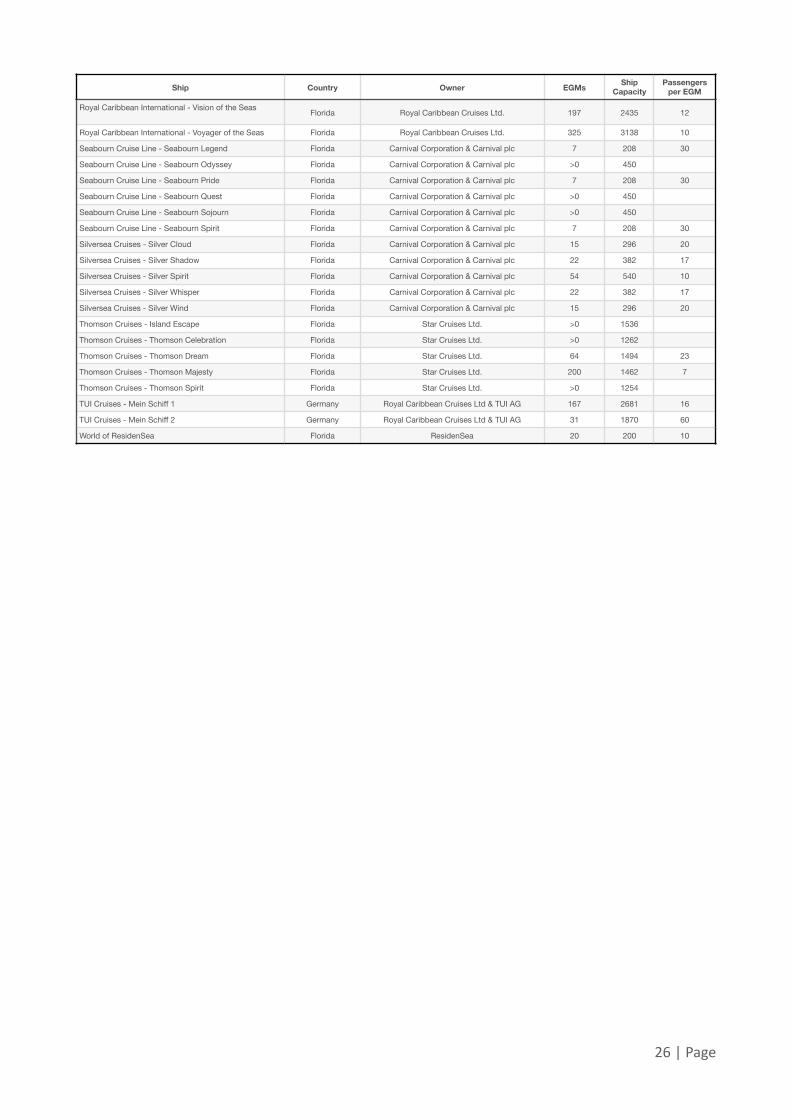
A number of cruise lines provide casinos and/or gaming aboard their vessels. The ra3on of gaming machines
to maximum passengers is rela3vely high. A summary of the top ten by Passengers to EGMs (based on the
vessel at maximum capacity), can be seen in Table G, and a full break down per vessel can be seen in
Appendix C.
Table G: Top 10 passengers to gaming machines on cruise ships
!
!
Jurisdiction Person per Machine
Sint Maarten 12Nevada 15Monaco 26Japan 28Aruba (Netherlands) 29China, Macao Special Administrative Region 46Montana 54South Dakota 55Oklahoma 56Curacao 65
Ship Base Owner EGMs Capacity
PAX/EGM
Costa Cruises - Costa Fortuna Florida Royal Caribbean Cruises Ltd. 185 1027 6
Princess Cruises - Ocean Princess California Carnival Corporation & Carnival plc 110 670 6
Thomson Cruises - Thomson Majesty Florida Star Cruises Ltd. 200 1462 7
Princess Cruises - Royal Princess - Adonia California Carnival Corporation & Carnival plc 107 826 8
Princess Cruises - Coral Princess California Carnival Corporation & Carnival plc 230 1970 9
Pullmantur Cruises - Horizon Florida Royal Caribbean Cruises Ltd. 143 1354 9
Crystal Cruises - Crystal Symphony California Crystal Cruises Inc. 97 922 10
Celebrity Cruises - Summit Florida Royal Caribbean Cruises Ltd. 201 1940 10
Royal Caribbean International - Navigator of the Seas
Florida Royal Caribbean Cruises Ltd. 325 3138 10
Royal Caribbean International - Voyager of the Seas Florida Royal Caribbean Cruises Ltd. 325 3138 10
� | Page10

!
!!!!Appendix A: Individual Country Data by
Geographical Region !
� | Page11

!
Oceania
* electronic table games
!!!
!!!!
Country EGMs 2013
Slots VLT VGM other EGMs 2012
EGMs 2011
EGMs 2010
% of the World
change 2012 to
2013
2013 population
persons per
machine
American Samoa 0 0 0 0 0.00% 0% 54719
Australia 198150 197274 386 490* 197892 198850 200769 2.58% 0.1% 23335808 118
Cook Islands 0 0 0 0 0.00% 0% 10447
Fiji Islands 0 0 0 0 0.00% 0% 896758
French Polynesia 0 0 0 0 0.00% 0% 277293
Guam 0 0 0 0 0.00% 0% 160378
Kiribati 0 0 0 0 0.00% 0% 106461
Marshall Islands 0 0 0 0 0.00% 0% 56086
Micronesia 0 0 0 0 0.00% 0% 106104
Nauru 0 0 0 0 0.00% 0% 9434
New Caledonia (French) 388 336 336 210 0.01% 15% 258958 667
New Zealand 20092 20092 20495 21215 18944 0.26% -2% 4504860 224
Niue 0 0 0 0 0.00% 0% 1229
Norfolk Island 0 0 0 0 0.00% 0% 2196
Northern Mariana Islands * 98 298 99 99 0.00% -67% 51170 522
Palau 0 0 0 0 0.00% 0% 20901
Papua New Guinea > 86 >0 0 0 6431902 74790
Samoa 0 0 0 0 0.00% 0% 195476
Solomon Islands 50 110 20 20 0.00% -55% 581344
Tokelau 0 0 0 0 0.00% 0% 1353
Tonga 0 0 0 0 0.00% 0% 106322
Tuvalu 0 0 0 0 0.00% 0% 11323
Vanuatu 248 285 259 215 0.00% -13% 264652 1067
Wallis and Futuna Islands 0 0 0 0 0.00% 0% 13135
� | Page12
!
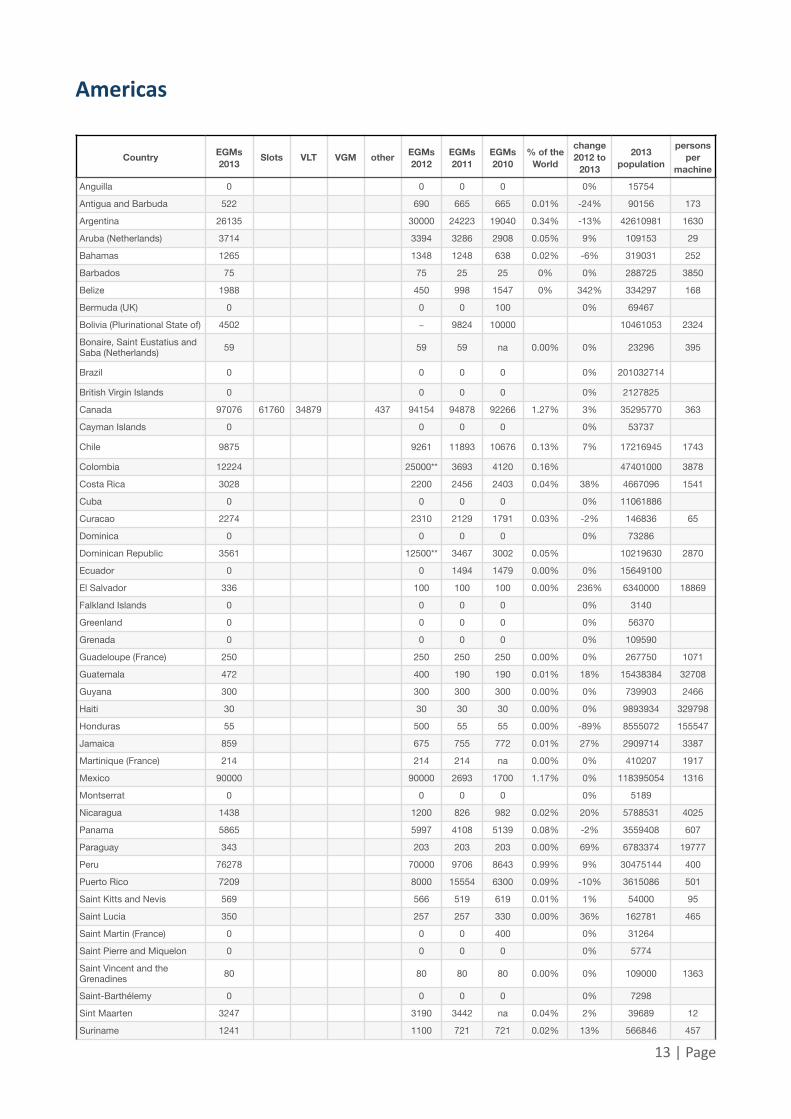
Americas
Country EGMs 2013
Slots VLT VGM other EGMs 2012
EGMs 2011
EGMs 2010
% of the World
change 2012 to
2013
2013 population
persons per
machine
Anguilla 0 0 0 0 0% 15754
Antigua and Barbuda 522 690 665 665 0.01% -24% 90156 173
Argentina 26135 30000 24223 19040 0.34% -13% 42610981 1630
Aruba (Netherlands) 3714 3394 3286 2908 0.05% 9% 109153 29
Bahamas 1265 1348 1248 638 0.02% -6% 319031 252
Barbados 75 75 25 25 0% 0% 288725 3850
Belize 1988 450 998 1547 0% 342% 334297 168
Bermuda (UK) 0 0 0 100 0% 69467
Bolivia (Plurinational State of) 4502 ~ 9824 10000 10461053 2324
Bonaire, Saint Eustatius and Saba (Netherlands) 59 59 59 na 0.00% 0% 23296 395
Brazil 0 0 0 0 0% 201032714
British Virgin Islands 0 0 0 0 0% 2127825
Canada 97076 61760 34879 437 94154 94878 92266 1.27% 3% 35295770 363
Cayman Islands 0 0 0 0 0% 53737
Chile 9875 9261 11893 10676 0.13% 7% 17216945 1743
Colombia 12224 25000** 3693 4120 0.16% 47401000 3878
Costa Rica 3028 2200 2456 2403 0.04% 38% 4667096 1541
Cuba 0 0 0 0 0% 11061886
Curacao 2274 2310 2129 1791 0.03% -2% 146836 65
Dominica 0 0 0 0 0% 73286
Dominican Republic 3561 12500** 3467 3002 0.05% 10219630 2870
Ecuador 0 0 1494 1479 0.00% 0% 15649100
El Salvador 336 100 100 100 0.00% 236% 6340000 18869
Falkland Islands 0 0 0 0 0% 3140
Greenland 0 0 0 0 0% 56370
Grenada 0 0 0 0 0% 109590
Guadeloupe (France) 250 250 250 250 0.00% 0% 267750 1071
Guatemala 472 400 190 190 0.01% 18% 15438384 32708
Guyana 300 300 300 300 0.00% 0% 739903 2466
Haiti 30 30 30 30 0.00% 0% 9893934 329798
Honduras 55 500 55 55 0.00% -89% 8555072 155547
Jamaica 859 675 755 772 0.01% 27% 2909714 3387
Martinique (France) 214 214 214 na 0.00% 0% 410207 1917
Mexico 90000 90000 2693 1700 1.17% 0% 118395054 1316
Montserrat 0 0 0 0 0% 5189
Nicaragua 1438 1200 826 982 0.02% 20% 5788531 4025
Panama 5865 5997 4108 5139 0.08% -2% 3559408 607
Paraguay 343 203 203 203 0.00% 69% 6783374 19777
Peru 76278 70000 9706 8643 0.99% 9% 30475144 400
Puerto Rico 7209 8000 15554 6300 0.09% -10% 3615086 501
Saint Kitts and Nevis 569 566 519 619 0.01% 1% 54000 95
Saint Lucia 350 257 257 330 0.00% 36% 162781 465
Saint Martin (France) 0 0 0 400 0% 31264
Saint Pierre and Miquelon 0 0 0 0 0% 5774
Saint Vincent and the Grenadines 80 80 80 80 0.00% 0% 109000 1363
Saint-Barthélemy 0 0 0 0 0% 7298
Sint Maarten 3247 3190 3442 na 0.04% 2% 39689 12
Suriname 1241 1100 721 721 0.02% 13% 566846 457
� | Page13
!
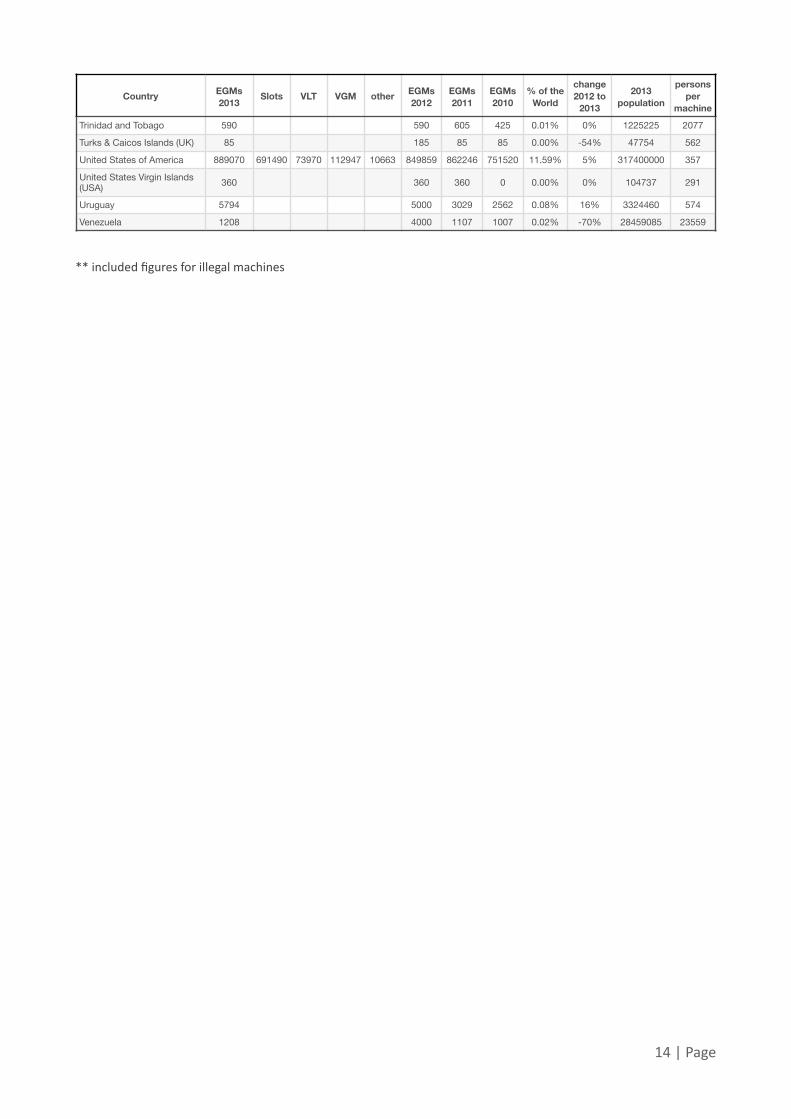
** included figures for illegal machines
!!!!!!!!!
Trinidad and Tobago 590 590 605 425 0.01% 0% 1225225 2077
Turks & Caicos Islands (UK) 85 185 85 85 0.00% -54% 47754 562
United States of America 889070 691490 73970 112947 10663 849859 862246 751520 11.59% 5% 317400000 357
United States Virgin Islands (USA) 360 360 360 0 0.00% 0% 104737 291
Uruguay 5794 5000 3029 2562 0.08% 16% 3324460 574
Venezuela 1208 4000 1107 1007 0.02% -70% 28459085 23559
Country EGMs 2013
Slots VLT VGM other EGMs 2012
EGMs 2011
EGMs 2010
% of the World
change 2012 to
2013
2013 population
persons per
machine
� | Page14
!
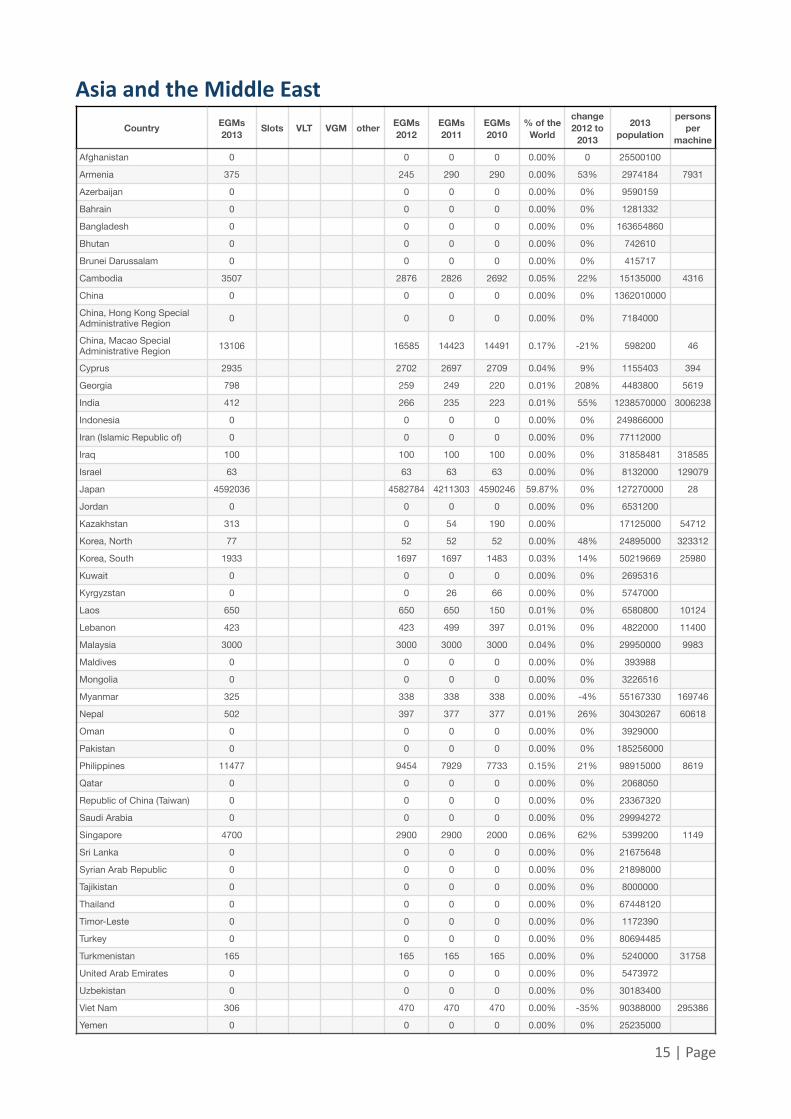
Asia and the Middle East Country EGMs
2013Slots VLT VGM other EGMs
2012EGMs 2011
EGMs 2010
% of the World
change 2012 to
2013
2013 population
persons per
machine
Afghanistan 0 0 0 0 0.00% 0 25500100
Armenia 375 245 290 290 0.00% 53% 2974184 7931
Azerbaijan 0 0 0 0 0.00% 0% 9590159
Bahrain 0 0 0 0 0.00% 0% 1281332
Bangladesh 0 0 0 0 0.00% 0% 163654860
Bhutan 0 0 0 0 0.00% 0% 742610
Brunei Darussalam 0 0 0 0 0.00% 0% 415717
Cambodia 3507 2876 2826 2692 0.05% 22% 15135000 4316
China 0 0 0 0 0.00% 0% 1362010000
China, Hong Kong Special Administrative Region 0 0 0 0 0.00% 0% 7184000
China, Macao Special Administrative Region 13106 16585 14423 14491 0.17% -21% 598200 46
Cyprus 2935 2702 2697 2709 0.04% 9% 1155403 394
Georgia 798 259 249 220 0.01% 208% 4483800 5619
India 412 266 235 223 0.01% 55% 1238570000 3006238
Indonesia 0 0 0 0 0.00% 0% 249866000
Iran (Islamic Republic of) 0 0 0 0 0.00% 0% 77112000
Iraq 100 100 100 100 0.00% 0% 31858481 318585
Israel 63 63 63 63 0.00% 0% 8132000 129079
Japan 4592036 4582784 4211303 4590246 59.87% 0% 127270000 28
Jordan 0 0 0 0 0.00% 0% 6531200
Kazakhstan 313 0 54 190 0.00% 17125000 54712
Korea, North 77 52 52 52 0.00% 48% 24895000 323312
Korea, South 1933 1697 1697 1483 0.03% 14% 50219669 25980
Kuwait 0 0 0 0 0.00% 0% 2695316
Kyrgyzstan 0 0 26 66 0.00% 0% 5747000
Laos 650 650 650 150 0.01% 0% 6580800 10124
Lebanon 423 423 499 397 0.01% 0% 4822000 11400
Malaysia 3000 3000 3000 3000 0.04% 0% 29950000 9983
Maldives 0 0 0 0 0.00% 0% 393988
Mongolia 0 0 0 0 0.00% 0% 3226516
Myanmar 325 338 338 338 0.00% -4% 55167330 169746
Nepal 502 397 377 377 0.01% 26% 30430267 60618
Oman 0 0 0 0 0.00% 0% 3929000
Pakistan 0 0 0 0 0.00% 0% 185256000
Philippines 11477 9454 7929 7733 0.15% 21% 98915000 8619
Qatar 0 0 0 0 0.00% 0% 2068050
Republic of China (Taiwan) 0 0 0 0 0.00% 0% 23367320
Saudi Arabia 0 0 0 0 0.00% 0% 29994272
Singapore 4700 2900 2900 2000 0.06% 62% 5399200 1149
Sri Lanka 0 0 0 0 0.00% 0% 21675648
Syrian Arab Republic 0 0 0 0 0.00% 0% 21898000
Tajikistan 0 0 0 0 0.00% 0% 8000000
Thailand 0 0 0 0 0.00% 0% 67448120
Timor-Leste 0 0 0 0 0.00% 0% 1172390
Turkey 0 0 0 0 0.00% 0% 80694485
Turkmenistan 165 165 165 165 0.00% 0% 5240000 31758
United Arab Emirates 0 0 0 0 0.00% 0% 5473972
Uzbekistan 0 0 0 0 0.00% 0% 30183400
Viet Nam 306 470 470 470 0.00% -35% 90388000 295386
Yemen 0 0 0 0 0.00% 0% 25235000
� | Page15

!
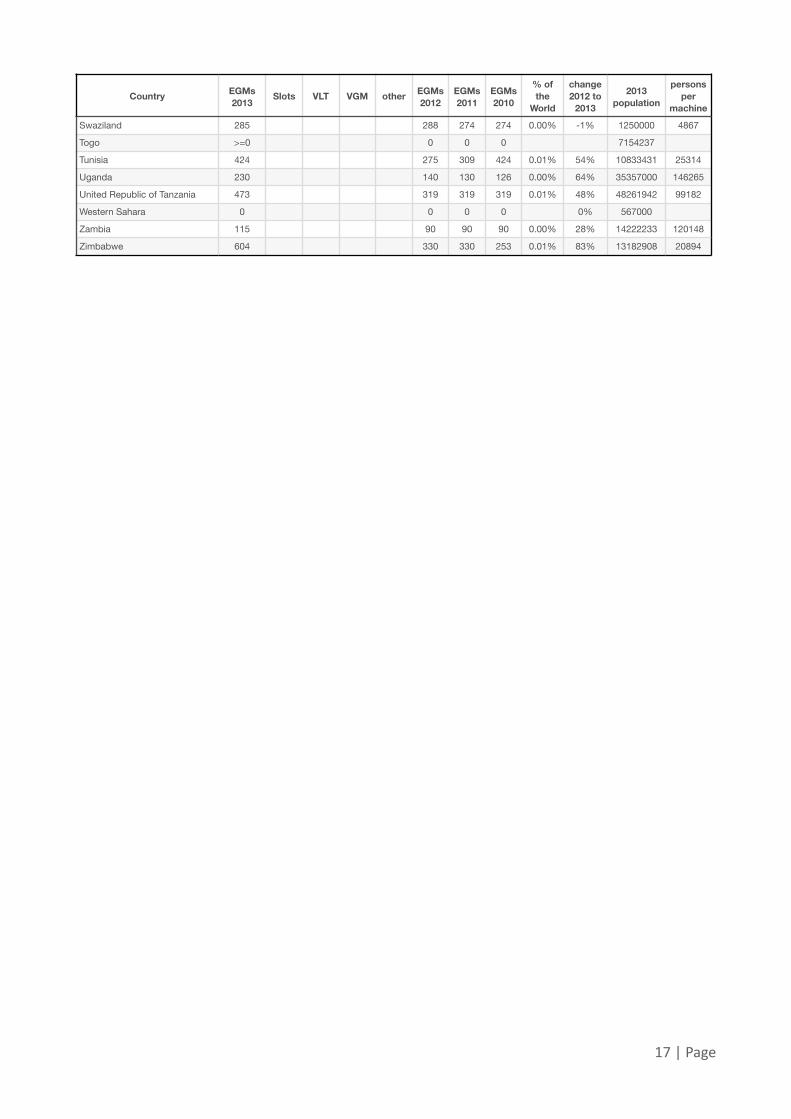
Africa
Country EGMs 2013
Slots VLT VGM other EGMs 2012
EGMs 2011
EGMs 2010
% of the
World
change 2012 to
2013
2013 population
persons per
machine
Algeria 0 0 0 0 0% 38700000
Angola 42 >0 0 0 0% 18565269 429905
Benin 10 10 10 10 0.00% 0% 10323000 959900
Botswana 641 626 615 570 0.01% 2% 2127825 3273
Burkina Faso 0 0 0 0 0% 17322796
Burundi 0 0 0 0 0% 10163000
Cameroon 132 146 146 146 0.00% -10% 20549221 152500
Cape Verde 0 0 0 0 0% 531046
Central African Republic 0 0 0 0 0% 4616000
Chad 0 0 0 0 0% 12825000
Comoros 28 28 28 28 0.00% 0% 743797 26332
Congo (Democratic Republic of) 160 160 160 160 0.00% 0% 67514000 459994
Congo (Republic of) 0 0 0 2 0% 4448000
Cote d'Ivoire 160 60 60 60 0.00% 167% 22400835 137200
Djibouti 120 40 40 0 0.00% 200% 873000 6453
Egypt 772 742 746 952 0.01% 4% 83661000 108404
Equatorial Guinea 241 197 163 163 0.00% 22% 704001 2846
Eritrea 0 0 0 0 0% 6333000
Ethiopia 0 0 0 0 0% 86613986
Gabon 15 >0 0 0 1672000 107200
Gambia 3 >0 0 0 1849000 613333
Ghana 387 125 110 110 0.01% 210% 25199609 63700
Guinea >0 0 0 0 11176026
Guinea-Bissau 0 0 0 0% 1660870
Kenya 867 774 770 730 0.01% 12% 44354000 49611
Lesotho 121 121 190 141 0.00% 0% 2074000 15950
Liberia 30 40 30 32 0.00% -25% 4294000 129600
Libya 0 0 0 0% 6202000
Madagascar 490 290 290 290 0.01% 69% 22599098 44908
Malawi 142 142 142 142 0.00% 0% 16363000 114951
Mali >0 >0 0 0 15302000
Mauritania 0 0 0 0 0% 3461041
Mauritius 544 551 473 611 0.01% -1% 1322238 2414
Mayotte 0 0 0 0 0% 218709
Morocco 1204 1204 1204 1034 0.02% 0% 33132100 26835
Mozambique 240 182 182 182 0.00% 32% 24096669 97983
Namibia 492 514 514 514 0.01% -4% 2182852 4402
Niger 0 0 0 0 0% 16899327
Nigeria 246 235 235 235 0.00% 5% 173615000 691561
Reunion (France) 290 295 256 236 0.00% -2% 866641 2924
Rwanda 40 40 30 30 0.00% 0% 12012589 292250
Saint Helena 0 0 0 0 0% 7754
Sao Tome and Principe 15 >=0 0 0 186817 12213
Senegal 374 396 396 396 0.00% -6% 13567338 34679
Seychelles 135 135 135 137 0.00% 0% 90846 667
Sierra Leone 0 >=0 0 0 6190280
Somalia 0 0 0 0 0% 10496000
South Africa 31426 38000 24841 22460 0.41% -17% 52981991 1553
South Sudan 0 0 0 11296000
Sudan 0 0 0 0 37964000
� | Page16
!
!!!!!!!!!!!!!!!
Swaziland 285 288 274 274 0.00% -1% 1250000 4867
Togo >=0 0 0 0 7154237
Tunisia 424 275 309 424 0.01% 54% 10833431 25314
Uganda 230 140 130 126 0.00% 64% 35357000 146265
United Republic of Tanzania 473 319 319 319 0.01% 48% 48261942 99182
Western Sahara 0 0 0 0 0% 567000
Zambia 115 90 90 90 0.00% 28% 14222233 120148
Zimbabwe 604 330 330 253 0.01% 83% 13182908 20894
Country EGMs 2013
Slots VLT VGM other EGMs 2012
EGMs 2011
EGMs 2010
% of the
World
change 2012 to
2013
2013 population
persons per
machine
� | Page17
!
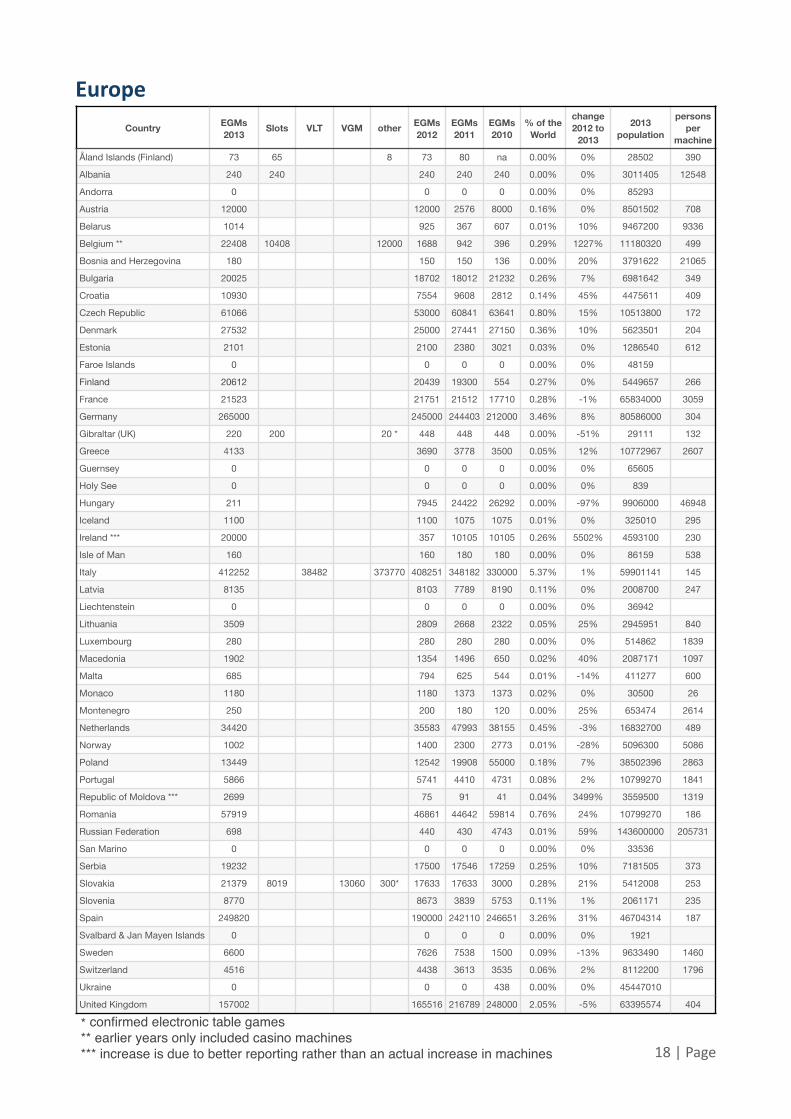
Europe Country EGMs
2013Slots VLT VGM other EGMs
2012EGMs 2011
EGMs 2010
% of the World
change 2012 to
2013
2013 population
persons per
machine
Åland Islands (Finland) 73 65 8 73 80 na 0.00% 0% 28502 390
Albania 240 240 240 240 240 0.00% 0% 3011405 12548
Andorra 0 0 0 0 0.00% 0% 85293
Austria 12000 12000 2576 8000 0.16% 0% 8501502 708
Belarus 1014 925 367 607 0.01% 10% 9467200 9336
Belgium ** 22408 10408 12000 1688 942 396 0.29% 1227% 11180320 499
Bosnia and Herzegovina 180 150 150 136 0.00% 20% 3791622 21065
Bulgaria 20025 18702 18012 21232 0.26% 7% 6981642 349
Croatia 10930 7554 9608 2812 0.14% 45% 4475611 409
Czech Republic 61066 53000 60841 63641 0.80% 15% 10513800 172
Denmark 27532 25000 27441 27150 0.36% 10% 5623501 204
Estonia 2101 2100 2380 3021 0.03% 0% 1286540 612
Faroe Islands 0 0 0 0 0.00% 0% 48159
Finland 20612 20439 19300 554 0.27% 0% 5449657 266
France 21523 21751 21512 17710 0.28% -1% 65834000 3059
Germany 265000 245000 244403 212000 3.46% 8% 80586000 304
Gibraltar (UK) 220 200 20 * 448 448 448 0.00% -51% 29111 132
Greece 4133 3690 3778 3500 0.05% 12% 10772967 2607
Guernsey 0 0 0 0 0.00% 0% 65605
Holy See 0 0 0 0 0.00% 0% 839
Hungary 211 7945 24422 26292 0.00% -97% 9906000 46948
Iceland 1100 1100 1075 1075 0.01% 0% 325010 295
Ireland *** 20000 357 10105 10105 0.26% 5502% 4593100 230
Isle of Man 160 160 180 180 0.00% 0% 86159 538
Italy 412252 38482 373770 408251 348182 330000 5.37% 1% 59901141 145
Latvia 8135 8103 7789 8190 0.11% 0% 2008700 247
Liechtenstein 0 0 0 0 0.00% 0% 36942
Lithuania 3509 2809 2668 2322 0.05% 25% 2945951 840
Luxembourg 280 280 280 280 0.00% 0% 514862 1839
Macedonia 1902 1354 1496 650 0.02% 40% 2087171 1097
Malta 685 794 625 544 0.01% -14% 411277 600
Monaco 1180 1180 1373 1373 0.02% 0% 30500 26
Montenegro 250 200 180 120 0.00% 25% 653474 2614
Netherlands 34420 35583 47993 38155 0.45% -3% 16832700 489
Norway 1002 1400 2300 2773 0.01% -28% 5096300 5086
Poland 13449 12542 19908 55000 0.18% 7% 38502396 2863
Portugal 5866 5741 4410 4731 0.08% 2% 10799270 1841
Republic of Moldova *** 2699 75 91 41 0.04% 3499% 3559500 1319
Romania 57919 46861 44642 59814 0.76% 24% 10799270 186
Russian Federation 698 440 430 4743 0.01% 59% 143600000 205731
San Marino 0 0 0 0 0.00% 0% 33536
Serbia 19232 17500 17546 17259 0.25% 10% 7181505 373
Slovakia 21379 8019 13060 300* 17633 17633 3000 0.28% 21% 5412008 253
Slovenia 8770 8673 3839 5753 0.11% 1% 2061171 235
Spain 249820 190000 242110 246651 3.26% 31% 46704314 187
Svalbard & Jan Mayen Islands 0 0 0 0 0.00% 0% 1921
Sweden 6600 7626 7538 1500 0.09% -13% 9633490 1460
Switzerland 4516 4438 3613 3535 0.06% 2% 8112200 1796
Ukraine 0 0 0 438 0.00% 0% 45447010
United Kingdom 157002 165516 216789 248000 2.05% -5% 63395574 404
� | Page18
* confirmed electronic table games!** earlier years only included casino machines!*** increase is due to better reporting rather than an actual increase in machines
!
!!!!Appendix B: Counts by State in Australia,
Canada and the USA !!
� | Page19
!
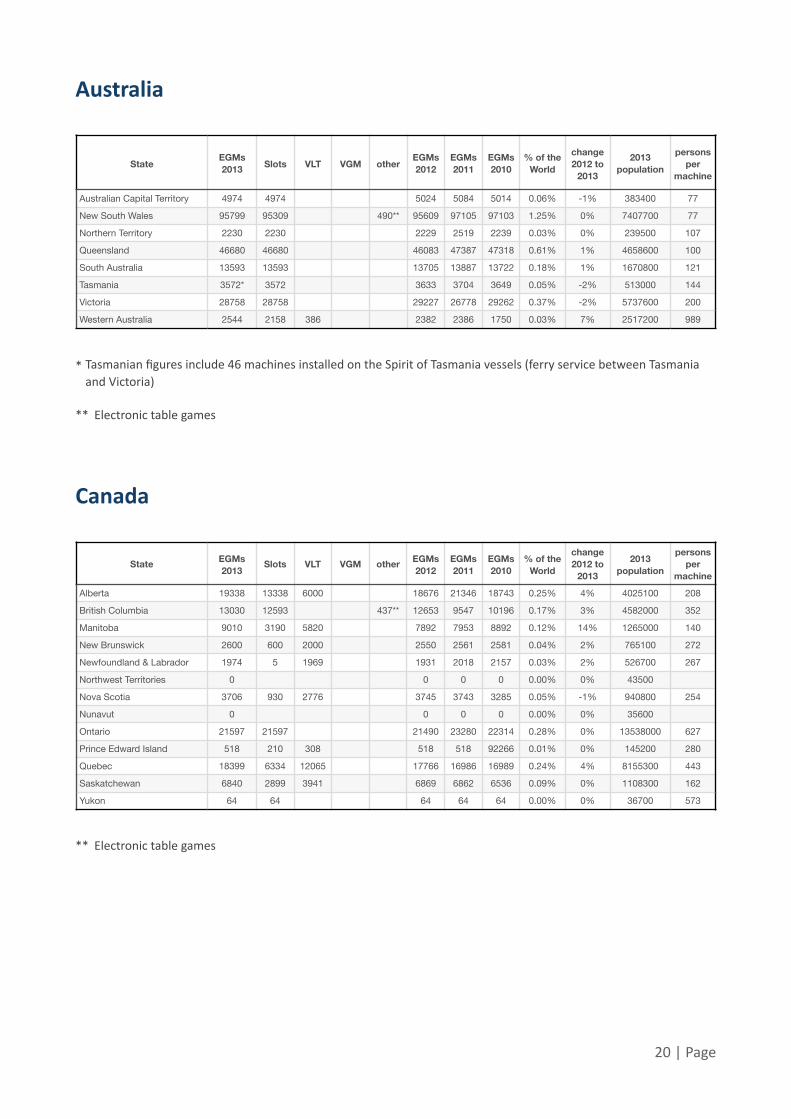
Australia
* Tasmanian figures include 46 machines installed on the Spirit of Tasmania vessels (ferry service between Tasmania and Victoria)
** Electronic table games
!Canada
** Electronic table games
!
!
StateEGMs 2013 Slots VLT VGM other
EGMs 2012
EGMs 2011
EGMs 2010
% of the World
change 2012 to
2013
2013 population
persons per
machine
Australian Capital Territory 4974 4974 5024 5084 5014 0.06% -1% 383400 77
New South Wales 95799 95309 490** 95609 97105 97103 1.25% 0% 7407700 77
Northern Territory 2230 2230 2229 2519 2239 0.03% 0% 239500 107
Queensland 46680 46680 46083 47387 47318 0.61% 1% 4658600 100
South Australia 13593 13593 13705 13887 13722 0.18% 1% 1670800 121
Tasmania 3572* 3572 3633 3704 3649 0.05% -2% 513000 144
Victoria 28758 28758 29227 26778 29262 0.37% -2% 5737600 200
Western Australia 2544 2158 386 2382 2386 1750 0.03% 7% 2517200 989
State EGMs 2013
Slots VLT VGM other EGMs 2012
EGMs 2011
EGMs 2010
% of the World
change 2012 to
2013
2013 population
persons per
machine
Alberta 19338 13338 6000 18676 21346 18743 0.25% 4% 4025100 208
British Columbia 13030 12593 437** 12653 9547 10196 0.17% 3% 4582000 352
Manitoba 9010 3190 5820 7892 7953 8892 0.12% 14% 1265000 140
New Brunswick 2600 600 2000 2550 2561 2581 0.04% 2% 765100 272
Newfoundland & Labrador 1974 5 1969 1931 2018 2157 0.03% 2% 526700 267
Northwest Territories 0 0 0 0 0.00% 0% 43500
Nova Scotia 3706 930 2776 3745 3743 3285 0.05% -1% 940800 254
Nunavut 0 0 0 0 0.00% 0% 35600
Ontario 21597 21597 21490 23280 22314 0.28% 0% 13538000 627
Prince Edward Island 518 210 308 518 518 92266 0.01% 0% 145200 280
Quebec 18399 6334 12065 17766 16986 16989 0.24% 4% 8155300 443
Saskatchewan 6840 2899 3941 6869 6862 6536 0.09% 0% 1108300 162
Yukon 64 64 64 64 64 0.00% 0% 36700 573
� | Page20
!
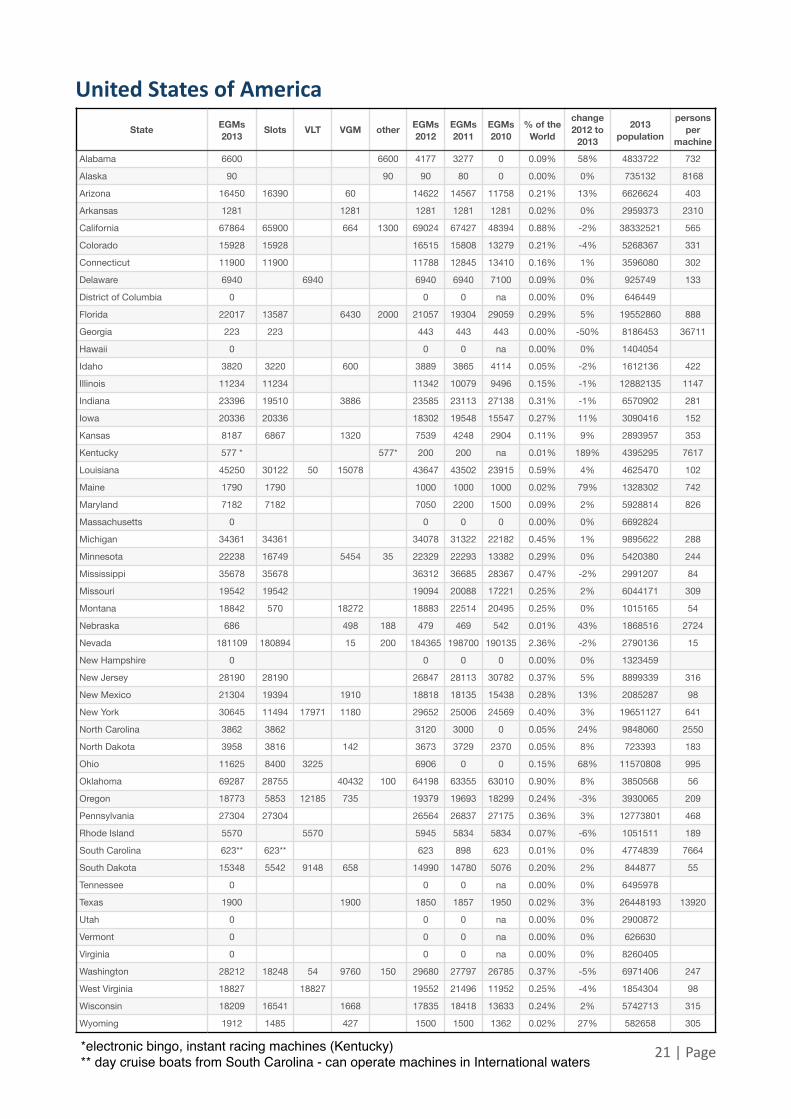
United States of America
State EGMs 2013
Slots VLT VGM other EGMs 2012
EGMs 2011
EGMs 2010
% of the World
change 2012 to
2013
2013 population
persons per
machine
Alabama 6600 6600 4177 3277 0 0.09% 58% 4833722 732
Alaska 90 90 90 80 0 0.00% 0% 735132 8168
Arizona 16450 16390 60 14622 14567 11758 0.21% 13% 6626624 403
Arkansas 1281 1281 1281 1281 1281 0.02% 0% 2959373 2310
California 67864 65900 664 1300 69024 67427 48394 0.88% -2% 38332521 565
Colorado 15928 15928 16515 15808 13279 0.21% -4% 5268367 331
Connecticut 11900 11900 11788 12845 13410 0.16% 1% 3596080 302
Delaware 6940 6940 6940 6940 7100 0.09% 0% 925749 133
District of Columbia 0 0 0 na 0.00% 0% 646449
Florida 22017 13587 6430 2000 21057 19304 29059 0.29% 5% 19552860 888
Georgia 223 223 443 443 443 0.00% -50% 8186453 36711
Hawaii 0 0 0 na 0.00% 0% 1404054
Idaho 3820 3220 600 3889 3865 4114 0.05% -2% 1612136 422
Illinois 11234 11234 11342 10079 9496 0.15% -1% 12882135 1147
Indiana 23396 19510 3886 23585 23113 27138 0.31% -1% 6570902 281
Iowa 20336 20336 18302 19548 15547 0.27% 11% 3090416 152
Kansas 8187 6867 1320 7539 4248 2904 0.11% 9% 2893957 353
Kentucky 577 * 577* 200 200 na 0.01% 189% 4395295 7617
Louisiana 45250 30122 50 15078 43647 43502 23915 0.59% 4% 4625470 102
Maine 1790 1790 1000 1000 1000 0.02% 79% 1328302 742
Maryland 7182 7182 7050 2200 1500 0.09% 2% 5928814 826
Massachusetts 0 0 0 0 0.00% 0% 6692824
Michigan 34361 34361 34078 31322 22182 0.45% 1% 9895622 288
Minnesota 22238 16749 5454 35 22329 22293 13382 0.29% 0% 5420380 244
Mississippi 35678 35678 36312 36685 28367 0.47% -2% 2991207 84
Missouri 19542 19542 19094 20088 17221 0.25% 2% 6044171 309
Montana 18842 570 18272 18883 22514 20495 0.25% 0% 1015165 54
Nebraska 686 498 188 479 469 542 0.01% 43% 1868516 2724
Nevada 181109 180894 15 200 184365 198700 190135 2.36% -2% 2790136 15
New Hampshire 0 0 0 0 0.00% 0% 1323459
New Jersey 28190 28190 26847 28113 30782 0.37% 5% 8899339 316
New Mexico 21304 19394 1910 18818 18135 15438 0.28% 13% 2085287 98
New York 30645 11494 17971 1180 29652 25006 24569 0.40% 3% 19651127 641
North Carolina 3862 3862 3120 3000 0 0.05% 24% 9848060 2550
North Dakota 3958 3816 142 3673 3729 2370 0.05% 8% 723393 183
Ohio 11625 8400 3225 6906 0 0 0.15% 68% 11570808 995
Oklahoma 69287 28755 40432 100 64198 63355 63010 0.90% 8% 3850568 56
Oregon 18773 5853 12185 735 19379 19693 18299 0.24% -3% 3930065 209
Pennsylvania 27304 27304 26564 26837 27175 0.36% 3% 12773801 468
Rhode Island 5570 5570 5945 5834 5834 0.07% -6% 1051511 189
South Carolina 623** 623** 623 898 623 0.01% 0% 4774839 7664
South Dakota 15348 5542 9148 658 14990 14780 5076 0.20% 2% 844877 55
Tennessee 0 0 0 na 0.00% 0% 6495978
Texas 1900 1900 1850 1857 1950 0.02% 3% 26448193 13920
Utah 0 0 0 na 0.00% 0% 2900872
Vermont 0 0 0 na 0.00% 0% 626630
Virginia 0 0 0 na 0.00% 0% 8260405
Washington 28212 18248 54 9760 150 29680 27797 26785 0.37% -5% 6971406 247
West Virginia 18827 18827 19552 21496 11952 0.25% -4% 1854304 98
Wisconsin 18209 16541 1668 17835 18418 13633 0.24% 2% 5742713 315
Wyoming 1912 1485 427 1500 1500 1362 0.02% 27% 582658 305
� | Page21*electronic bingo, instant racing machines (Kentucky)!** day cruise boats from South Carolina - can operate machines in International waters
!
!!!!Appendix C: Cruise Ships
� | Page22

!
Ship Country Owner EGMs Ship Capacity
Passengers per EGM
Abou Merhi Cruises - Orient Queen Lebanon Louis Cruises 32 876 27
AIDA Bella Germany Carnival Corporation & Carnival plc 48 2050 43
AIDA Blu Germany Carnival Corporation & Carnival plc 45 2050 46
AIDA Diva Germany Carnival Corporation & Carnival plc 48 2050 43
AIDA Luna Germany Carnival Corporation & Carnival plc 47 2100 45
Ambassadors International - Wind Spirit Washington Ambassadors International Inc. 11 148 13
Ambassadors International - Wind Star Washington Ambassadors International Inc. 11 148 13
Ambassadors International - Wind Surf Washington Ambassadors International Inc. 27 308 11
Azamara Journey Royal Caribbean Cruises Ltd. >0 710
Azamara Quest Royal Caribbean Cruises Ltd. >0 710
Carnival Cruise Line - Breeze Florida Carnival Corporation & Carnival plc >0 3690
Carnival Cruise Line - Conquest Florida Carnival Corporation & Carnival plc 249 2976 12
Carnival Cruise Line - Destiny Florida Carnival Corporation & Carnival plc 167 2642 16
Carnival Cruise Line - Dream Florida Carnival Corporation & Carnival plc 180 3652 20
Carnival Cruise Line - Ecstasy Florida Carnival Corporation & Carnival plc 173 2052 12
Carnival Cruise Line - Elation Florida Carnival Corporation & Carnival plc 183 2052 11
Carnival Cruise Line - Fantasy Florida Carnival Corporation & Carnival plc 185 2052 11
Carnival Cruise Line - Fascination Florida Carnival Corporation & Carnival plc 189 2052 11
Carnival Cruise Line - Freedom Florida Carnival Corporation & Carnival plc 194 2974 15
Carnival Cruise Line - Glory Massachusetts Carnival Corporation & Carnival plc 180 2976 17
Carnival Cruise Line - Imagination Florida Carnival Corporation & Carnival plc 170 2052 12
Carnival Cruise Line - Inspiration Florida Carnival Corporation & Carnival plc 183 2052 11
Carnival Cruise Line - Legend Florida Carnival Corporation & Carnival plc 191 2124 11
Carnival Cruise Line - Liberty Florida Carnival Corporation & Carnival plc 178 2976 17
Carnival Cruise Line - Miracle Florida Carnival Corporation & Carnival plc 182 2124 12
Carnival Cruise Line - Paradise Florida Carnival Corporation & Carnival plc 195 2052 11
Carnival Cruise Line - Pride Florida Carnival Corporation & Carnival plc 197 2124 11
Carnival Cruise Line - Sensation Florida Carnival Corporation & Carnival plc 174 2052 12
Carnival Cruise Line - Spirit AU Carnival Corporation & Carnival plc 187 2124 11
Carnival Cruise Line - Splendor Florida Carnival Corporation & Carnival plc 184 3006 16
Carnival Cruise Line - Triumph Florida Carnival Corporation & Carnival plc 196 2758 14
Carnival Cruise Line - Valor Florida Carnival Corporation & Carnival plc 192 2976 16
Carnival Cruise Line - Victory Florida Carnival Corporation & Carnival plc 191 2758 14
Celebrity Cruises - Century Florida Royal Caribbean Cruises Ltd. 176 1800 10
Celebrity Cruises - Constellation Florida Royal Caribbean Cruises Ltd. 177 2034 11
Celebrity Cruises - Eclipse Florida Royal Caribbean Cruises Ltd. 200 2850 14
Celebrity Cruises - Equinox Florida Royal Caribbean Cruises Ltd. 200 2850 14
Celebrity Cruises - Infinity Florida Royal Caribbean Cruises Ltd. 201 2046 10
Celebrity Cruises - Millennium Florida Royal Caribbean Cruises Ltd. 200 1940 10
Celebrity Cruises - Reflection Florida Royal Caribbean Cruises Ltd. 237 2850 12
Celebrity Cruises - Silhouette Florida Royal Caribbean Cruises Ltd. 244 2850 12
Celebrity Cruises - Solstice Florida Royal Caribbean Cruises Ltd. 200 2850 14
Celebrity Cruises - Summit Florida Royal Caribbean Cruises Ltd. 201 1940 10
Costa Cruises - Costa Atlantica Florida Royal Caribbean Cruises Ltd. 160 2680 17
Costa Cruises - Costa Classica Florida Royal Caribbean Cruises Ltd. 120 1680 14
Costa Cruises - Costa Deliziosa Florida Royal Caribbean Cruises Ltd. 134 2826 21
Costa Cruises - Costa Fascinosa Florida Royal Caribbean Cruises Ltd. >0 3780
Costa Cruises - Costa Favolosa Florida Royal Caribbean Cruises Ltd. >0 3780
Costa Cruises - Costa Fortuna Florida Royal Caribbean Cruises Ltd. 185 1027 6
Costa Cruises - Costa Luminosa Florida Royal Caribbean Cruises Ltd. >0 2260
Costa Cruises - Costa Magica Florida Royal Caribbean Cruises Ltd. >0 3470
Costa Cruises - Costa Mediterranea Florida Royal Caribbean Cruises Ltd. 190 2680 14
Costa Cruises - Costa neoRomantica Florida Royal Caribbean Cruises Ltd. 114 1356 12
Costa Cruises - Costa Pacifica Florida Royal Caribbean Cruises Ltd. >0 2860
Costa Cruises - Costa Serena Florida Royal Caribbean Cruises Ltd. 187 3780 20
Costa Cruises - Costa Victoria Florida Royal Caribbean Cruises Ltd. 135 2394 18
Costa Cruises - Costa Voyager Florida Royal Caribbean Cruises Ltd. >0 927
Crystal Cruises - Crystal Serenity California Crystal Cruises Inc. 97 1070 11
Crystal Cruises - Crystal Symphony California Crystal Cruises Inc. 97 922 10
� | Page23
!
Cunard Line - Queen Elizabeth Florida Royal Caribbean Cruises Ltd. 98 2058 21
Cunard Line - Queen Mary 2 Florida Royal Caribbean Cruises Ltd. 75 2620 35
Cunard Line - Queen Victoria California Carnival Corporation & Carnival plc 110 2014 18
Fred Olsen Cruise Lines - Balmoral UK Fred Olsen Cruise Lines - Balmoral 28 1300 46
Holland America Line - Amsterdam Washington Carnival Corporation & Carnival plc 113 1380 12
Holland America Line - Eurodam Washington Carnival Corporation & Carnival plc >0 2104
Holland America Line - Maasdam Washington Carnival Corporation & Carnival plc 119 1258 11
Holland America Line - Nieuw Amsterdam Washington Carnival Corporation & Carnival plc 115 2106 18
Holland America Line - Noordam Washington Carnival Corporation & Carnival plc 135 1918 14
Holland America Line - Oosterdam Washington Carnival Corporation & Carnival plc 138 1916 14
Holland America Line - Prinsendam Washington Carnival Corporation & Carnival plc 44 835 19
Holland America Line - Rotterdam VI Washington Carnival Corporation & Carnival plc 133 1404 11
Holland America Line - Ryndam Washington Carnival Corporation & Carnival plc 114 1260 11
Holland America Line - Statendam Washington Carnival Corporation & Carnival plc 114 1260 11
Holland America Line - Veendam Washington Carnival Corporation & Carnival plc 96 1350 14
Holland America Line - Volendam Washington Carnival Corporation & Carnival plc 120 1432 12
Holland America Line - Westerdam Washington Carnival Corporation & Carnival plc 138 1916 14
Holland America Line - Zaandam Washington Carnival Corporation & Carnival plc 119 1432 12
Holland America Line - Zuiderdam Washington Carnival Corporation & Carnival plc 144 1916 13
Ibero Cruises - Grand Celebration Florida Royal Caribbean Cruises Ltd. 173 1896 11
Ibero Cruises - Grand Holiday Florida Royal Caribbean Cruises Ltd. 148 1500 10
Ibero Cruises - Grand Mistral Florida Royal Caribbean Cruises Ltd. >0 1700
MSC Cruises - MSC Armonia Florida MSC Cruises >0 2065
MSC Cruises - MSC Divina Florida MSC Cruises >0 3971
MSC Cruises - MSC Fantasia Florida MSC Cruises >0 3971
MSC Cruises - MSC Lirica Florida MSC Cruises 52 2065 40
MSC Cruises - MSC Magnifica Florida MSC Cruises >0 3013
MSC Cruises - MSC Melody Florida MSC Cruises 87 1278 15
MSC Cruises - MSC Musica Florida MSC Cruises >0 3013
MSC Cruises - MSC Opera Florida MSC Cruises >0 2055
MSC Cruises - MSC Orchestra Florida MSC Cruises >0 3013
MSC Cruises - MSC Poesia Florida MSC Cruises >0 3013
MSC Cruises - MSC Preziosa Florida MSC Cruises >0 3971
MSC Cruises - MSC Sinfonia Florida MSC Cruises >0 2065
MSC Cruises - MSC Splendida Florida MSC Cruises >0 3971
Norwegian Breakaway Florida Star Cruises Ltd. 0 4000
Norwegian Dawn Florida Star Cruises Ltd. 199 2466 12
Norwegian Dream Florida Star Cruises Ltd. 158 2156 14
Norwegian Epic Florida Star Cruises Ltd. >0 4228
Norwegian Gem Florida Star Cruises Ltd. >0 2384
Norwegian Jade Florida Star Cruises Ltd. 200 2466
Norwegian Jewel Florida Star Cruises Ltd. 200 2376 12
Norwegian Pearl Florida Star Cruises Ltd. 200 2466 12
Norwegian Pride of America Florida Star Cruises Ltd. 2146
Norwegian Sky Florida Star Cruises Ltd. 2002
Norwegian Spirit Florida Star Cruises Ltd. 200 1966 10
Norwegian Star Florida Star Cruises Ltd. 200 2466 12
Norwegian Sun Florida Star Cruises Ltd. 191 2350 12
Oceania Cruises - Insignia Florida Century Casinos, Inc. 36 684 19
Oceania Cruises - Marina Florida Century Casinos, Inc. 60 1250 21
Oceania Cruises - Nautica Florida Century Casinos, Inc. 36 684 19
Oceania Cruises - Regatta Florida Century Casinos, Inc. 36 684 19
Oceania Cruises - Riviera Florida Century Casinos, Inc. >0 1250
P&O Cruises - Arcadia UK Carnival Corporation & Carnival plc 77 2016 26
P&O Cruises - Artemis UK Carnival Corporation & Carnival plc 51 1260 25
P&O Cruises - Aurora UK Carnival Corporation & Carnival plc 51 1260 25
P&O Cruises - Azura UK Carnival Corporation & Carnival plc 63 3100 49
P&O Cruises - Oceana UK Carnival Corporation & Carnival plc 96 2016 21
P&O Cruises - Oriana UK Carnival Corporation & Carnival plc 51 1818 36
Ship Country Owner EGMs Ship Capacity
Passengers per EGM
� | Page24

!
P&O Cruises - Pacific Dawn Carnival Corporation & Carnival plc 89 2020 23
P&O Cruises - Pacific Jewel Carnival Corporation & Carnival plc 90 1950 22
P&O Cruises - Pacific Pearl UK Carnival Corporation & Carnival plc 72 1800 25
P&O Cruises - Ventura UK Carnival Corporation & Carnival plc 80 3078 38
Paul Gauguin Cruises - Paul Gauguin Florida 23 320 14
Princess Cruises - Caribbean Princess California Carnival Corporation & Carnival plc 250 3100 12
Princess Cruises - Coral Princess California Carnival Corporation & Carnival plc 230 1970 9
Princess Cruises - Crown Princess California Carnival Corporation & Carnival plc 163 3080 19
Princess Cruises - Dawn Princess California Carnival Corporation & Carnival plc 181 1950 11
Princess Cruises - Diamond Princess California Carnival Corporation & Carnival plc >0 2670
Princess Cruises - Emerald Princess California Carnival Corporation & Carnival plc 250 3080 12
Princess Cruises - Golden Princess California Carnival Corporation & Carnival plc 249 2600 10
Princess Cruises - Grand Princess California Carnival Corporation & Carnival plc 262 2600 10
Princess Cruises - Island Princess California Carnival Corporation & Carnival plc 115 1970 17
Princess Cruises - Ocean Princess California Carnival Corporation & Carnival plc 110 670 6
Princess Cruises - Pacific Princess California Carnival Corporation & Carnival plc 37 670 18
Princess Cruises - Royal Princess - Adonia California Carnival Corporation & Carnival plc 107 826 8
Princess Cruises - Ruby Princess California Carnival Corporation & Carnival plc >0 3080
Princess Cruises - Sapphire Princess California Carnival Corporation & Carnival plc 110 2670 24
Princess Cruises - Sea Princess California Carnival Corporation & Carnival plc 76 1950 26
Princess Cruises - Star Princess California Carnival Corporation & Carnival plc 260 2600 10
Princess Cruises - Sun Princess California Carnival Corporation & Carnival plc 189 1950 10
Pullmantur Cruises - Empress Florida Royal Caribbean Cruises Ltd. 196 2020 10
Pullmantur Cruises - Horizon Florida Royal Caribbean Cruises Ltd. 143 1354 9
Pullmantur Cruises - Sovereign Florida Royal Caribbean Cruises Ltd. 226 2852 13
Pullmantur Cruises - Zenith Florida Royal Caribbean Cruises Ltd. 140 1774 13
Regent Seven Seas Cruises - Seven Seas Mariner Florida Century Casinos, Inc. 62 700 11
Regent Seven Seas Cruises - Seven Seas Navigator Florida Century Casinos, Inc. 43 490 11
Regent Seven Seas Cruises - Seven Seas Voyager Florida Century Casinos, Inc. 51 700 14
Royal Caribbean International - Adventure of the Seas Florida Royal Caribbean Cruises Ltd. 298 3114 10
Royal Caribbean International - Allure of the Seas Florida Royal Caribbean Cruises Ltd. >0 5400
Royal Caribbean International - Brilliance of the Seas Florida Royal Caribbean Cruises Ltd. 190 2501 13
Royal Caribbean International - Enchantment of the Seas Florida Royal Caribbean Cruises Ltd. 181 2446 14
Royal Caribbean International - Explorer of the Seas Florida Royal Caribbean Cruises Ltd. 303 3114 10
Royal Caribbean International - Freedom of the Seas Florida Royal Caribbean Cruises Ltd. 306 3600 12
Royal Caribbean International - Grandeur of the Seas Florida Royal Caribbean Cruises Ltd. 181 2446 14
Royal Caribbean International - Independence of the Seas Florida Royal Caribbean Cruises Ltd. >0 3600
Royal Caribbean International - Jewel of the Seas Florida Royal Caribbean Cruises Ltd. >0 2501
Royal Caribbean International - Legend of the Seas Florida Royal Caribbean Cruises Ltd. 170 1800 11
Royal Caribbean International - Liberty of the Seas Florida Royal Caribbean Cruises Ltd. >0 3634
Royal Caribbean International - Majesty of the Seas Florida Royal Caribbean Cruises Ltd. 230 2744 12
Royal Caribbean International - Mariner of the Seas Florida Royal Caribbean Cruises Ltd. 300 3138 10
Royal Caribbean International - Monarch of the Seas Florida Royal Caribbean Cruises Ltd. 223 2744 12
Royal Caribbean International - Navigator of the Seas Florida Royal Caribbean Cruises Ltd. 325 3138 10
Royal Caribbean International - Oasis of the Seas Florida Royal Caribbean Cruises Ltd. >0 6296
Royal Caribbean International - Radiance of the Seas Florida Royal Caribbean Cruises Ltd. 190 2501 13
Royal Caribbean International - Rhapsody of the Seas Florida Royal Caribbean Cruises Ltd. 197 2435 12
Royal Caribbean International - Serenade of the Seas Florida Royal Caribbean Cruises Ltd. 195 2500 13
Royal Caribbean International - Splendour of the Seas Florida Royal Caribbean Cruises Ltd. 165 1800 11
Ship Country Owner EGMs Ship Capacity
Passengers per EGM
� | Page25
!
!!
Royal Caribbean International - Vision of the Seas Florida Royal Caribbean Cruises Ltd. 197 2435 12
Royal Caribbean International - Voyager of the Seas Florida Royal Caribbean Cruises Ltd. 325 3138 10
Seabourn Cruise Line - Seabourn Legend Florida Carnival Corporation & Carnival plc 7 208 30
Seabourn Cruise Line - Seabourn Odyssey Florida Carnival Corporation & Carnival plc >0 450
Seabourn Cruise Line - Seabourn Pride Florida Carnival Corporation & Carnival plc 7 208 30
Seabourn Cruise Line - Seabourn Quest Florida Carnival Corporation & Carnival plc >0 450
Seabourn Cruise Line - Seabourn Sojourn Florida Carnival Corporation & Carnival plc >0 450
Seabourn Cruise Line - Seabourn Spirit Florida Carnival Corporation & Carnival plc 7 208 30
Silversea Cruises - Silver Cloud Florida Carnival Corporation & Carnival plc 15 296 20
Silversea Cruises - Silver Shadow Florida Carnival Corporation & Carnival plc 22 382 17
Silversea Cruises - Silver Spirit Florida Carnival Corporation & Carnival plc 54 540 10
Silversea Cruises - Silver Whisper Florida Carnival Corporation & Carnival plc 22 382 17
Silversea Cruises - Silver Wind Florida Carnival Corporation & Carnival plc 15 296 20
Thomson Cruises - Island Escape Florida Star Cruises Ltd. >0 1536
Thomson Cruises - Thomson Celebration Florida Star Cruises Ltd. >0 1262
Thomson Cruises - Thomson Dream Florida Star Cruises Ltd. 64 1494 23
Thomson Cruises - Thomson Majesty Florida Star Cruises Ltd. 200 1462 7
Thomson Cruises - Thomson Spirit Florida Star Cruises Ltd. >0 1254
TUI Cruises - Mein Schiff 1 Germany Royal Caribbean Cruises Ltd & TUI AG 167 2681 16
TUI Cruises - Mein Schiff 2 Germany Royal Caribbean Cruises Ltd & TUI AG 31 1870 60
World of ResidenSea Florida ResidenSea 20 200 10
Ship Country Owner EGMs Ship Capacity
Passengers per EGM
� | Page26

!
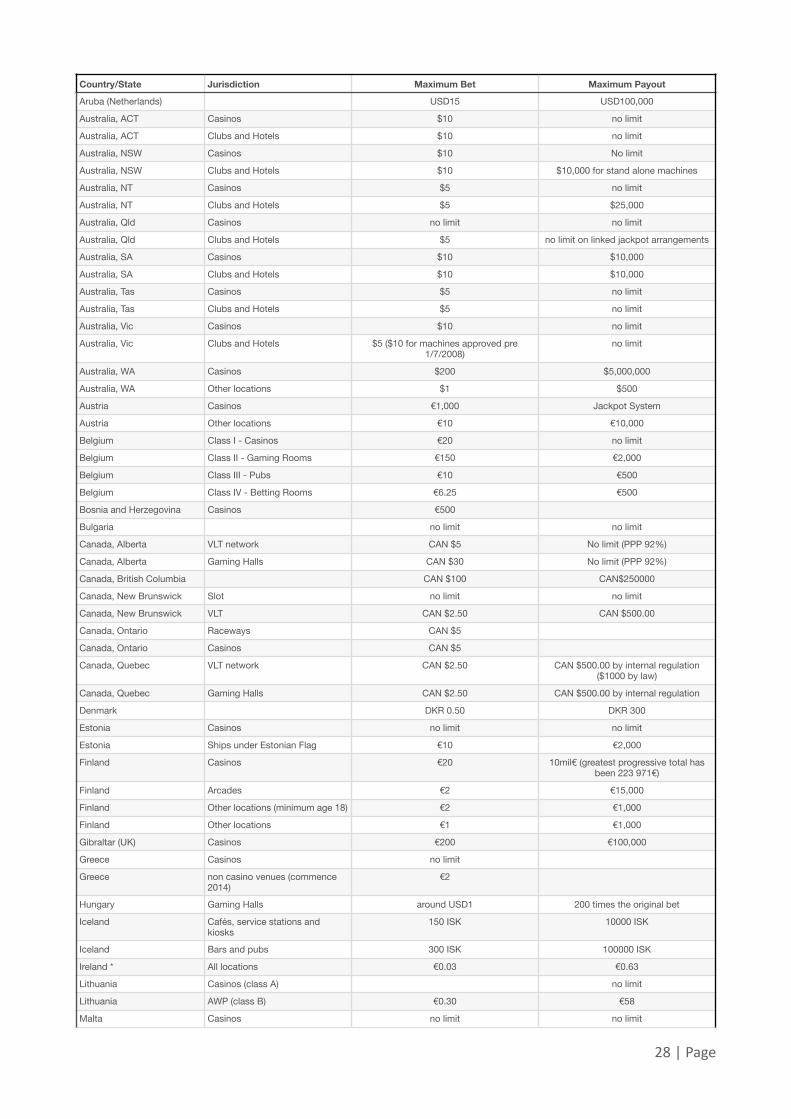
!!!!Appendix D: Maximum Bets & Payouts !
� | Page27
!
Country/State Jurisdiction Maximum Bet Maximum Payout
Aruba (Netherlands) USD15 USD100,000
Australia, ACT Casinos $10 no limit
Australia, ACT Clubs and Hotels $10 no limit
Australia, NSW Casinos $10 No limit
Australia, NSW Clubs and Hotels $10 $10,000 for stand alone machines
Australia, NT Casinos $5 no limit
Australia, NT Clubs and Hotels $5 $25,000
Australia, Qld Casinos no limit no limit
Australia, Qld Clubs and Hotels $5 no limit on linked jackpot arrangements
Australia, SA Casinos $10 $10,000
Australia, SA Clubs and Hotels $10 $10,000
Australia, Tas Casinos $5 no limit
Australia, Tas Clubs and Hotels $5 no limit
Australia, Vic Casinos $10 no limit
Australia, Vic Clubs and Hotels $5 ($10 for machines approved pre 1/7/2008)
no limit
Australia, WA Casinos $200 $5,000,000
Australia, WA Other locations $1 $500
Austria Casinos €1,000 Jackpot System
Austria Other locations €10 €10,000
Belgium Class I - Casinos €20 no limit
Belgium Class II - Gaming Rooms €150 €2,000
Belgium Class III - Pubs €10 €500
Belgium Class IV - Betting Rooms €6.25 €500
Bosnia and Herzegovina Casinos €500
Bulgaria no limit no limit
Canada, Alberta VLT network CAN $5 No limit (PPP 92%)
Canada, Alberta Gaming Halls CAN $30 No limit (PPP 92%)
Canada, British Columbia CAN $100 CAN$250000
Canada, New Brunswick Slot no limit no limit
Canada, New Brunswick VLT CAN $2.50 CAN $500.00
Canada, Ontario Raceways CAN $5
Canada, Ontario Casinos CAN $5
Canada, Quebec VLT network CAN $2.50 CAN $500.00 by internal regulation ($1000 by law)
Canada, Quebec Gaming Halls CAN $2.50 CAN $500.00 by internal regulation
Denmark DKR 0.50 DKR 300
Estonia Casinos no limit no limit
Estonia Ships under Estonian Flag €10 €2,000
Finland Casinos €20 10mil€ (greatest progressive total has been 223 971€)
Finland Arcades €2 €15,000
Finland Other locations (minimum age 18) €2 €1,000
Finland Other locations €1 €1,000
Gibraltar (UK) Casinos €200 €100,000
Greece Casinos no limit
Greece non casino venues (commence 2014)
€2
Hungary Gaming Halls around USD1 200 times the original bet
Iceland Cafés, service stations and kiosks
150 ISK 10000 ISK
Iceland Bars and pubs 300 ISK 100000 ISK
Ireland * All locations €0.03 €0.63
Lithuania Casinos (class A) no limit
Lithuania AWP (class B) €0.30 €58
Malta Casinos no limit no limit
� | Page28
!
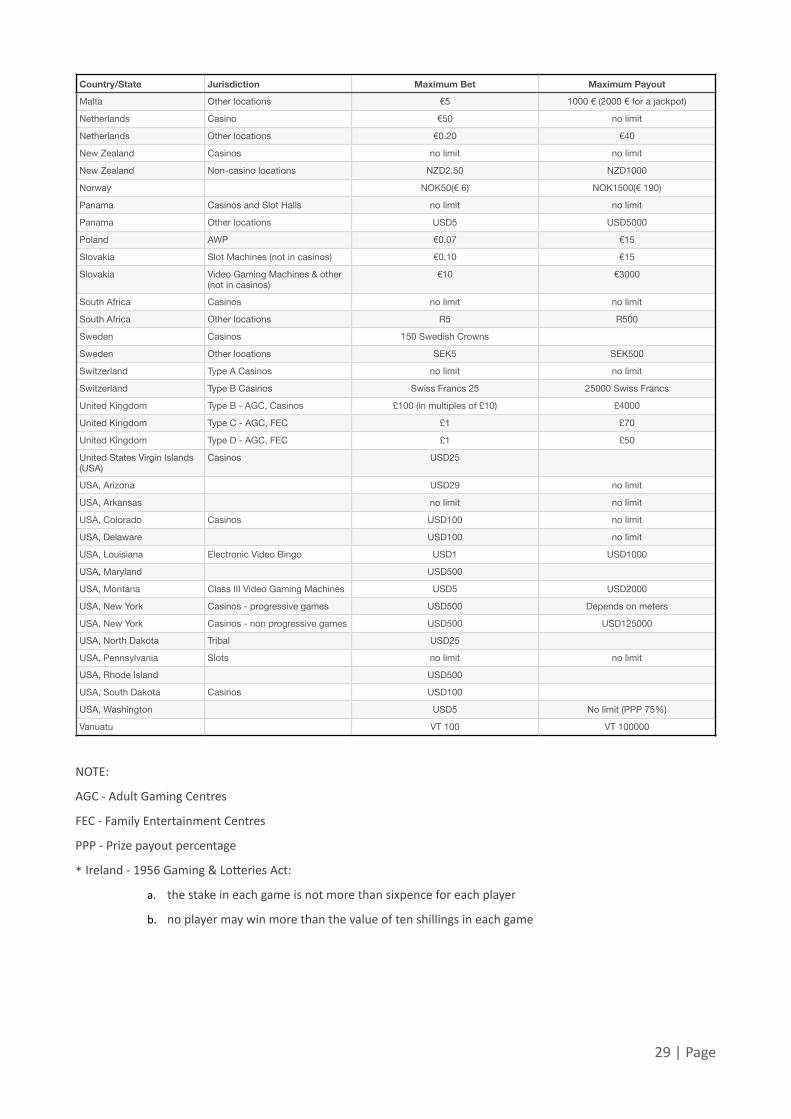
NOTE:
AGC -‐ Adult Gaming Centres
FEC -‐ Family Entertainment Centres
PPP -‐ Prize payout percentage
* Ireland -‐ 1956 Gaming & LoCeries Act:
a. the stake in each game is not more than sixpence for each player
b. no player may win more than the value of ten shillings in each game
Malta Other locations €5 1000 € (2000 € for a jackpot)
Netherlands Casino €50 no limit
Netherlands Other locations €0.20 €40
New Zealand Casinos no limit no limit
New Zealand Non-casino locations NZD2.50 NZD1000
Norway NOK50(€ 6) NOK1500(€ 190)
Panama Casinos and Slot Halls no limit no limit
Panama Other locations USD5 USD5000
Poland AWP €0.07 €15
Slovakia Slot Machines (not in casinos) €0.10 €15
Slovakia Video Gaming Machines & other (not in casinos)
€10 €3000
South Africa Casinos no limit no limit
South Africa Other locations R5 R500
Sweden Casinos 150 Swedish Crowns
Sweden Other locations SEK5 SEK500
Switzerland Type A Casinos no limit no limit
Switzerland Type B Casinos Swiss Francs 25 25000 Swiss Francs
United Kingdom Type B - AGC, Casinos £100 (in multiples of £10) £4000
United Kingdom Type C - AGC, FEC £1 £70
United Kingdom Type D - AGC, FEC £1 £50
United States Virgin Islands (USA)
Casinos USD25
USA, Arizona USD29 no limit
USA, Arkansas no limit no limit
USA, Colorado Casinos USD100 no limit
USA, Delaware USD100 no limit
USA, Louisiana Electronic Video Bingo USD1 USD1000
USA, Maryland USD500
USA, Montana Class III Video Gaming Machines USD5 USD2000
USA, New York Casinos - progressive games USD500 Depends on meters
USA, New York Casinos - non progressive games USD500 USD125000
USA, North Dakota Tribal USD25
USA, Pennsylvania Slots no limit no limit
USA, Rhode Island USD500
USA, South Dakota Casinos USD100
USA, Washington USD5 No limit (PPP 75%)
Vanuatu VT 100 VT 100000
Country/State Jurisdiction Maximum Bet Maximum Payout
� | Page29
!
References !World Count of Gaming Machines 2012, Sabina Ziolkowski, March 2013
World Count of Gaming Machines 2011, Sabina Ziolkowski, February 2012
World Count of Gaming Machines 2010, Jo Farquhar -‐ TNS, January 2011
World Count of Gaming Machines 2008, Jo Farquhar -‐ TNS, March 2009
World Count of Gaming Machines 2006, Jo Farquhar, Emmanuelle Lizan -‐ TNS, October 2007
World Count of Gaming Machines 2004, Gary Lembit -‐ TNS, August 2004
The Count: Taylor Nelson Sofres' Global Gaming Machine Market Survey, G Lembit, C Kitney -‐ TNS, July 2002
!!!
� | Page30