Embed Size (px)
Citation preview
Wetlands and Waterbodies—Bristol Bay Drainages
November 14, 2011 14-1
14. WETLANDS AND WATERBODIES
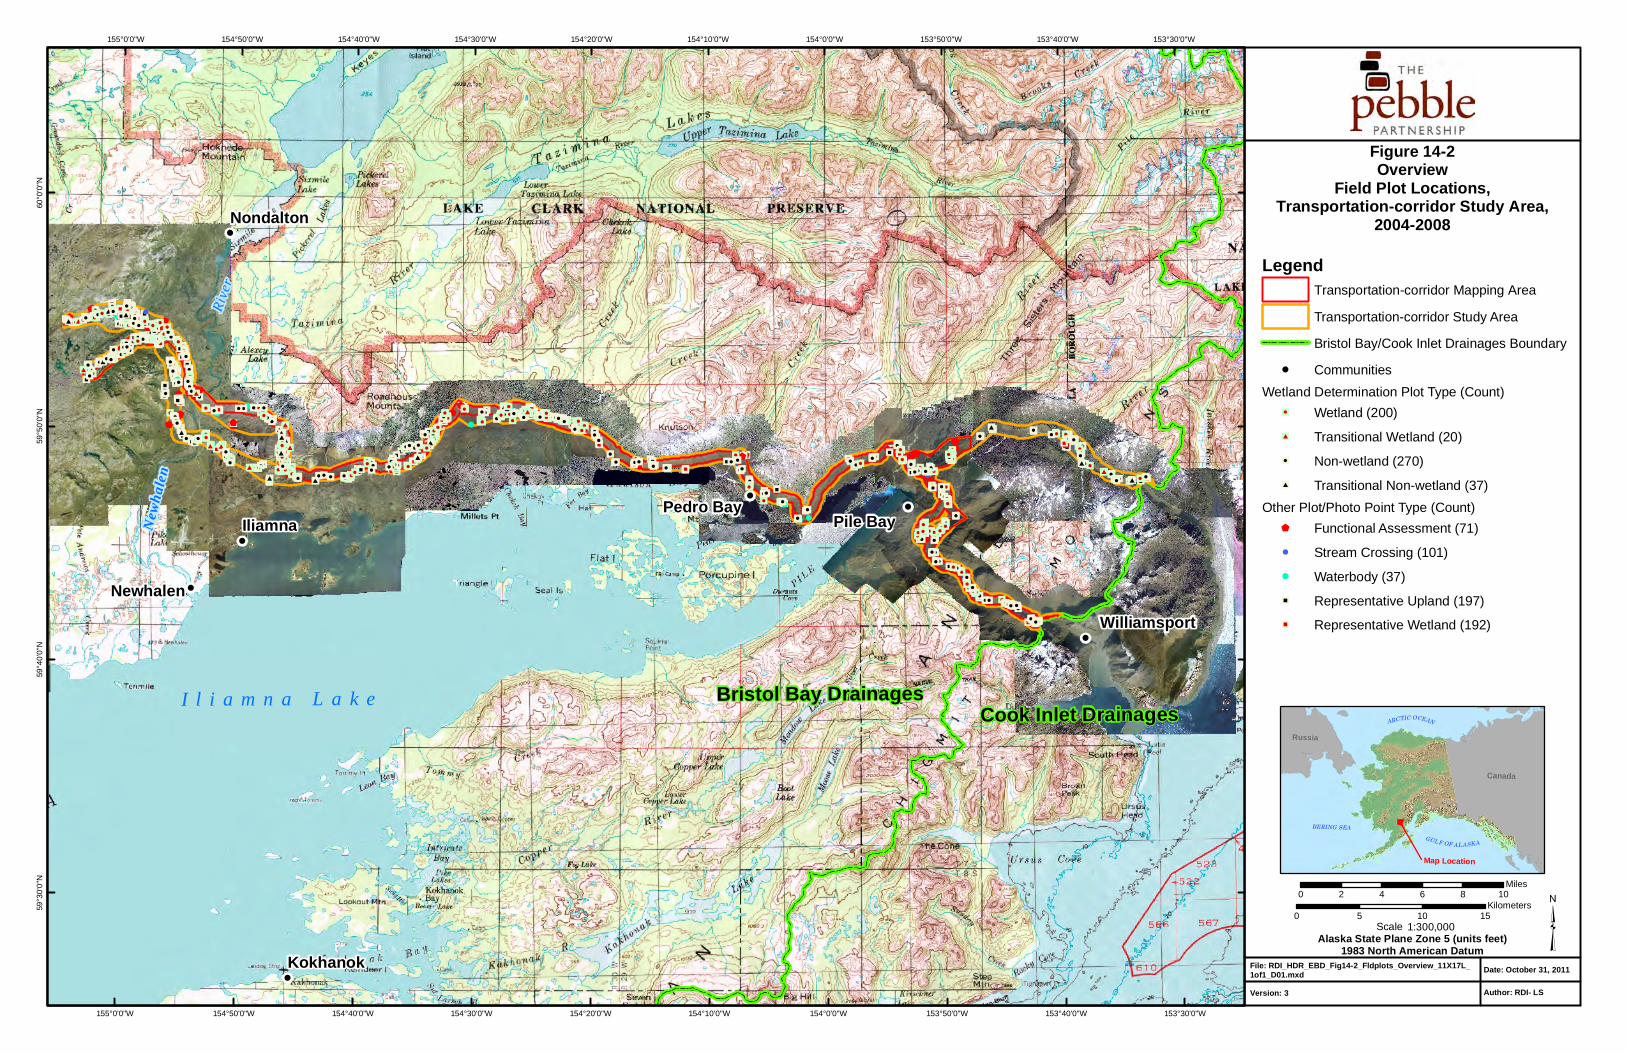
14.1 Introduction A study to characterize wetlands and waterbodies and to determine their location and extent was conducted in the Bristol Bay drainages study areas. This study includes both the mine study area and the transportation-corridor study area in the Bristol Bay drainages. Data were collected throughout the two study areas; however, special emphasis was placed on a smaller mine mapping area (Figure 14-1) and transportation-corridor mapping area (Figure 14-2). The vegetation study (Chapter 13) provides data and mapping that are integral to the wetlands and waterbodies study. The study areas and mapping areas were scaled to provide coverage of potential development areas and alternative development areas as well as additional surrounding area to provide comparative context.
The objectives of the wetlands and waterbodies study are to determine and map the location and extent of wetlands and waterbodies in the mine and transportation-corridor study areas and to map the extent of human-caused disturbances of soil or vegetation.
Investigators from Three Parameters Plus, Inc., and HDR Alaska, Inc., conducted field work between 2004 and 2008. The study areas, transportation-corridor mapping area, investigators, and field work dates are the same as for the vegetation study (Chapter 13). The mine-area mapping area was smaller than for the vegetation study. Scientists evaluated wetland versus non-wetland status at field study sites representative of the major vegetation types and landforms in the study areas. Their methods at wetland determination plots followed the 1987 U.S. Army Corps of Engineers Wetlands Delineation Manual (USACE, 1987), which requires detailed analysis of site vegetation, hydrology, and soils. If the results of the analysis for each of those three parameters meet criteria that indicate wetland conditions, then the site is determined to be a wetland; otherwise, it is not.
Study sites were selected to sample unique vegetation signatures on aerial photographs and each major vegetation type across the full range of landscape positions. Wetland and non-wetland plots were sampled. Photo points were used to document additional wetlands and non-wetlands as a supplement to the more in-depth data-collection plots. Stream crossings and waterbodies were documented and water chemistry information was collected. If a plot was determined to be a wetland, then additional data were gathered for use in future analyses. Observations such as soil disturbance, habitat observations, or cultural sites also were recorded.
Wetland mapping used primarily a base map of 2004 and 2005 orthophotographs with 4-foot contours, derived from aerial photographs and light detection and ranging (LIDAR) imagery. Digital maps were drawn to a scale ranging between 1:1,200 and 1:1,500, and open water was drawn at 1:400. Wetland status was assigned to a polygon used in mapping after careful review
Pebble Project Environmental Baseline Studies, 2004-2008, Technical Summary
14-2 November 14, 2011
of plot data, photo points, site photos, and other available data for area within the polygon. Data from plots in nearby or similar polygons also were evaluated when assigning wetland status.
Investigators collected vegetation data at the sampling plots to determine whether the vegetation was hydrophytic. The presence of hydric soil indicators was determined by digging a soil pit and recording standardized property data for each soil horizon. The soil sampling and documentation followed protocols outlined in the Field Book for Describing and Sampling Soils (Shoeneberger et al., 2002). Data regarding the presence of restrictive layers, soil temperature, oxidation reduction potential, and drainage class also were recorded. Data collected for wetland hydrology indicators included both surface observations and subsurface observations in the soil pit and soil profile.
During field data collection and wetland mapping, all wetlands were classified according to the hydrogeomorphic (HGM) classification system (Brinson, 1993). In addition, as part of data collection and mapping inventory for Pebble Project, wetlands and other aquatic habitats/waters were classified using Enhanced National Wetlands Inventory codes. This classification was based on Classification of Wetlands and Deepwater Habitats of the United States (Cowardin et al., 1979) and National Wetlands Inventory mapping conventions (USFWS, 1995). The resulting Enhanced National Wetlands Inventory mapping is much more detailed than the original National Wetlands Inventory effort for the mapping area.
Disturbance to soil and/or vegetation was noted in the mapping if there was evidence from field data or if the disturbance was visible on aerial photographs. Human-caused soil or vegetation disturbance in the study areas was minimal and appears to be limited to four-wheeler trails, campsites, roads, and building pads along existing roads.
14.2 Results and Discussion The only previous wetland mapping in the study areas was partial and preliminary National Wetland Inventory coverage completed by the U.S. Fish and Wildlife Service in 1985. As part of the Pebble Project study, investigators collected data at approximately 17,000 locations in the mine study area and 1,126 locations in the transportation-corridor study area. Specific wetland data, including hydrology, soils, and vegetation, were collected at 1,059 plots in the mine mapping area and 597 plots in the transportation-corridor study area.
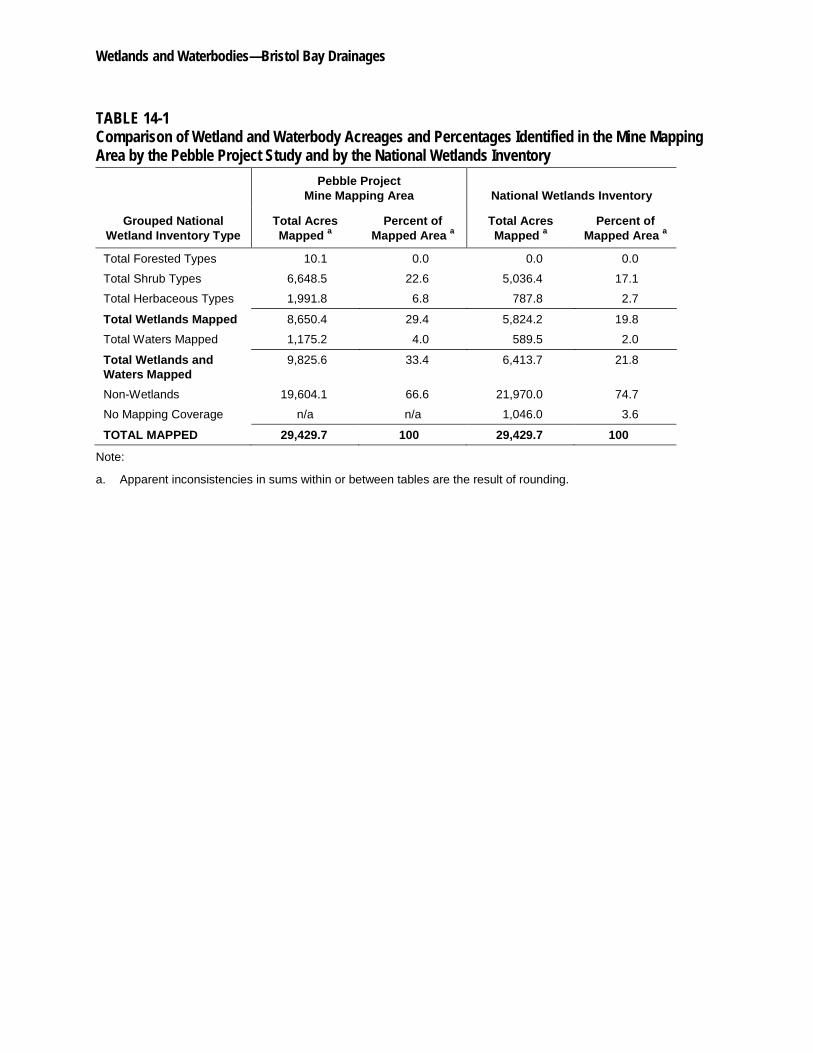
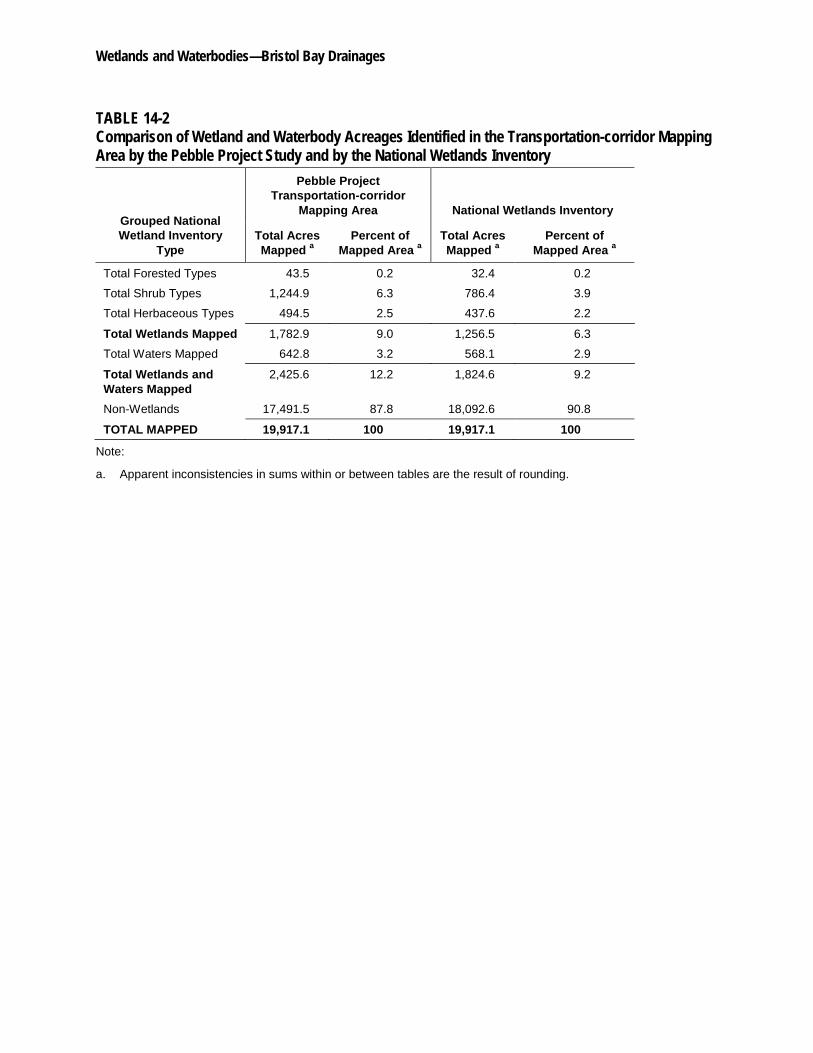
In total, 29,429.7 acres were mapped in the mine mapping area (Table 14-1) and 19,917.1 acres were mapped in the transportation-corridor mapping area (Table 14-2). Tables 14-1 and 14-2 list the mapped acreages of wetlands, waterbodies, and non-wetlands, grouped according to the U.S. Fish and Wildlife Service’s National Wetland Inventory classification system, which is based largely on vegetation structure. The second and third columns in each table show the acreage of each type mapped in the Pebble Project study and the percentage of the mapping area that each type comprises. Scientists identified 9,825.6 acres of wetlands and waterbodies in the mine mapping area; thus, approximately 33.4 percent of the mine mapping area is wetlands or waterbodies. In the transportation-corridor mapping area, 2,425.6 acres were identified as wetlands or waterbodies; thus, approximately 12.2 percent of the transportation-corridor mapping area is wetlands or waterbodies. Some of the transportation-corridor mapping
Wetlands and Waterbodies—Bristol Bay Drainages
November 14, 2011 14-3
area has much steeper terrain than the mine mapping area, resulting in fewer wetlands and waterbodies.
The last two columns in Tables 14-1 and 14-2 list the acreages and percentages of the wetland, waterbody, and non-wetland types that had been mapped by the U.S. Fish and Wildlife Service in 1985. This National Wetlands Inventory mapping showed 21.8 percent of the mine mapping area and 9.2 percent of the transportation-corridor mapping area as wetlands or waterbodies. Comparison of the acreages shows that the Pebble Project study has identified 8.1 percent more of the combined mapping areas as wetland and waterbody acreage than did the less detail-scaled U.S. Fish and Wildlife Service effort.
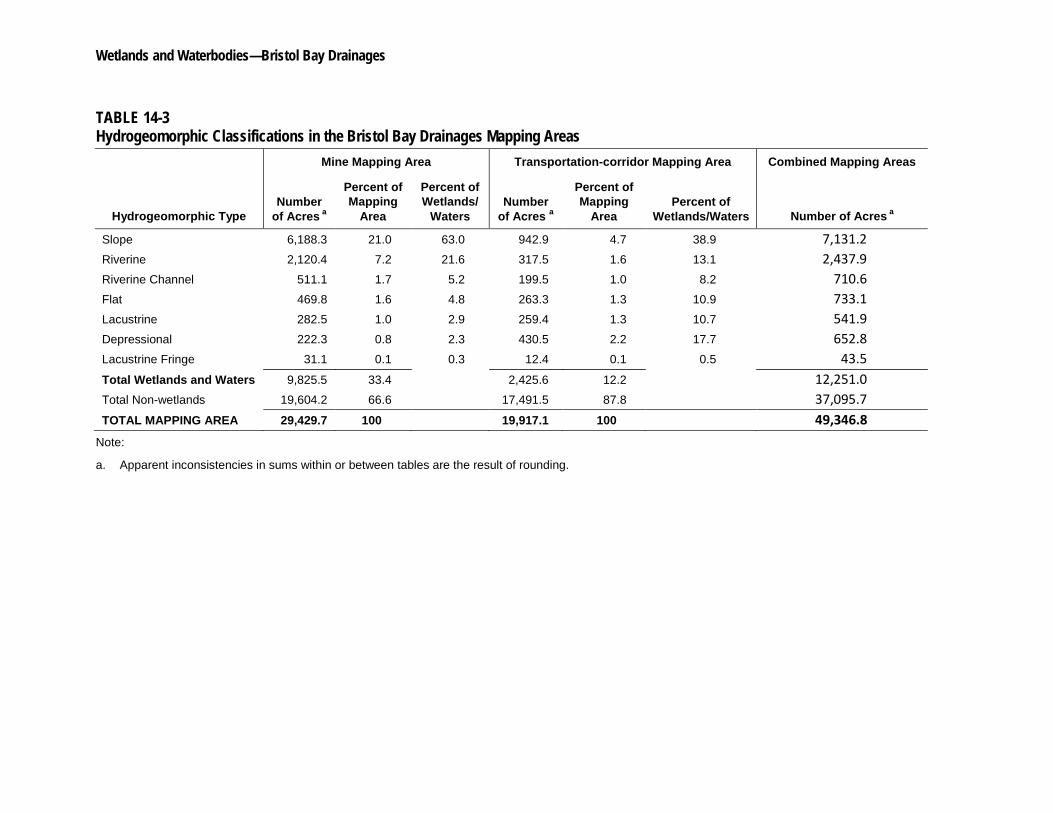
According to the hydrogeomorphic wetland classification system (Table 14-3), which is based on landscape position and water source and dynamics, slope wetlands dominate the mine mapping area. This type is followed by riverine, riverine channel, flat, lacustrine, depressional, and lacustrine fringe wetland types. Slope wetlands also dominate the transportation-corridor mapping area, followed, in descending order, by depressional, riverine, flat, lacustrine, riverine channel, and lacustrine fringe wetland types.
14.3 References Brinson, M.M. 1993. A Hydrogeomorphic Classification for Wetlands. Wetlands. Research
Program Technical Report WRP-DE-4. U.S. Army Corps of Engineers, Waterways Experiment Station, Vicksburg, MS. August.
Cowardin L.M., V. Carter, F.C. Golet, and E.T. LaRoe. 1979. Classification of Wetlands and Deepwater Habitats of the United States. U.S. Fish and Wildlife Service, Office of Biological Services, Washington, D.C.
Shoeneberger, P.J., D.A. Wysocki, E.C. Benham, and W.D. Broderson. 2002. Field Book for Describing and Sampling Soils, Version 2.0. U.S. Department of Agriculture, Natural Resources Conservation Service, National Soil Survey Center, Lincoln, NE.
U.S. Army Corps of Engineers (USACE). 1987. Corps of Engineers Wetlands Delineation Manual. U.S. Army Corps of Engineers, Waterways Experiment Station, Vicksburg, MS.
United States Fish and Wildlife Service (USFWS). 1995. Photointerpretation conventions for the National Wetlands Inventory. National Wetlands Inventory Center, St. Petersburg, FL.
14.4 Glossary Hydric soil—soil that formed under conditions of saturation, flooding, or ponding long enough
during the growing season to develop anaerobic conditions in the upper part.
Hydrophytic vegetation—vegetation typically adapted for life in saturated soil conditions.
Pebble Project Environmental Baseline Studies, 2004-2008, Technical Summary
14-4 November 14, 2011
Non-wetlands—include uplands and lowland areas that are neither deepwater aquatic habitats, wetlands, nor other special aquatic sites. They are seldom or never inundated, or if frequently inundated, they have saturated soils for only brief periods during the growing season, and if vegetated, they normally support a prevalence of vegetation typically adapted for life only in aerobic soil conditions.
Orthophotographs—digital imagery in which distortion from the camera angle and topography has been removed, thus equalizing the distances represented on the image.
Vegetation signature—a unique texture, pattern, or color that vegetation has when captured in photographs taken from an airplane.
Wetlands—those areas that are inundated or saturated by surface water or groundwater at a frequency and duration sufficient to support, and that under normal circumstances do support, a prevalence of vegetation typically adapted for life in saturated soil conditions. Wetlands generally include swamps, marshes, bogs, and similar areas.
Wetlands and Waterbodies—Bristol Bay Drainages
TABLE 14-1 Comparison of Wetland and Waterbody Acreages and Percentages Identified in the Mine Mapping Area by the Pebble Project Study and by the National Wetlands Inventory
Grouped National Wetland Inventory Type
Pebble Project Mine Mapping Area National Wetlands Inventory
Total Acres Mapped a
Percent of Mapped Area a
Total Acres Mapped a
Percent of Mapped Area a
Total Forested Types 10.1 0.0 0.0 0.0
Total Shrub Types 6,648.5 22.6 5,036.4 17.1
Total Herbaceous Types 1,991.8 6.8 787.8 2.7
Total Wetlands Mapped 8,650.4 29.4 5,824.2 19.8
Total Waters Mapped 1,175.2 4.0 589.5 2.0
Total Wetlands and Waters Mapped
9,825.6 33.4 6,413.7 21.8
Non-Wetlands 19,604.1 66.6 21,970.0 74.7
No Mapping Coverage n/a n/a 1,046.0 3.6
TOTAL MAPPED 29,429.7 100 29,429.7 100
Note:
a. Apparent inconsistencies in sums within or between tables are the result of rounding.
Wetlands and Waterbodies—Bristol Bay Drainages
TABLE 14-2 Comparison of Wetland and Waterbody Acreages Identified in the Transportation-corridor Mapping Area by the Pebble Project Study and by the National Wetlands Inventory
Grouped National Wetland Inventory
Type
Pebble Project Transportation-corridor
Mapping Area National Wetlands Inventory
Total Acres Mapped a
Percent of Mapped Area a
Total Acres Mapped a
Percent of Mapped Area a
Total Forested Types 43.5 0.2 32.4 0.2
Total Shrub Types 1,244.9 6.3 786.4 3.9
Total Herbaceous Types 494.5 2.5 437.6 2.2
Total Wetlands Mapped 1,782.9 9.0 1,256.5 6.3
Total Waters Mapped 642.8 3.2 568.1 2.9
Total Wetlands and Waters Mapped
2,425.6 12.2 1,824.6 9.2
Non-Wetlands 17,491.5 87.8 18,092.6 90.8
TOTAL MAPPED 19,917.1 100 19,917.1 100
Note:
a. Apparent inconsistencies in sums within or between tables are the result of rounding.
Wetlands and Waterbodies—Bristol Bay Drainages
TABLE 14-3 Hydrogeomorphic Classifications in the Bristol Bay Drainages Mapping Areas
Mine Mapping Area Transportation-corridor Mapping Area Combined Mapping Areas
Hydrogeomorphic Type Number
of Acres a
Percent of Mapping
Area
Percent of Wetlands/
Waters Number
of Acres a
Percent of Mapping
Area Percent of
Wetlands/Waters Number of Acres a
Slope 6,188.3 21.0 63.0 942.9 4.7 38.9 7,131.2 Riverine 2,120.4 7.2 21.6 317.5 1.6 13.1 2,437.9 Riverine Channel 511.1 1.7 5.2 199.5 1.0 8.2 710.6 Flat 469.8 1.6 4.8 263.3 1.3 10.9 733.1 Lacustrine 282.5 1.0 2.9 259.4 1.3 10.7 541.9 Depressional 222.3 0.8 2.3 430.5 2.2 17.7 652.8 Lacustrine Fringe 31.1 0.1 0.3 12.4 0.1 0.5 43.5 Total Wetlands and Waters 9,825.5 33.4 2,425.6 12.2 12,251.0 Total Non-wetlands 19,604.2 66.6 17,491.5 87.8 37,095.7 TOTAL MAPPING AREA 29,429.7 100 19,917.1 100 49,346.8
Note:
a. Apparent inconsistencies in sums within or between tables are the result of rounding.

Wetlands and Waterbodies—Bristol Bay Drainages
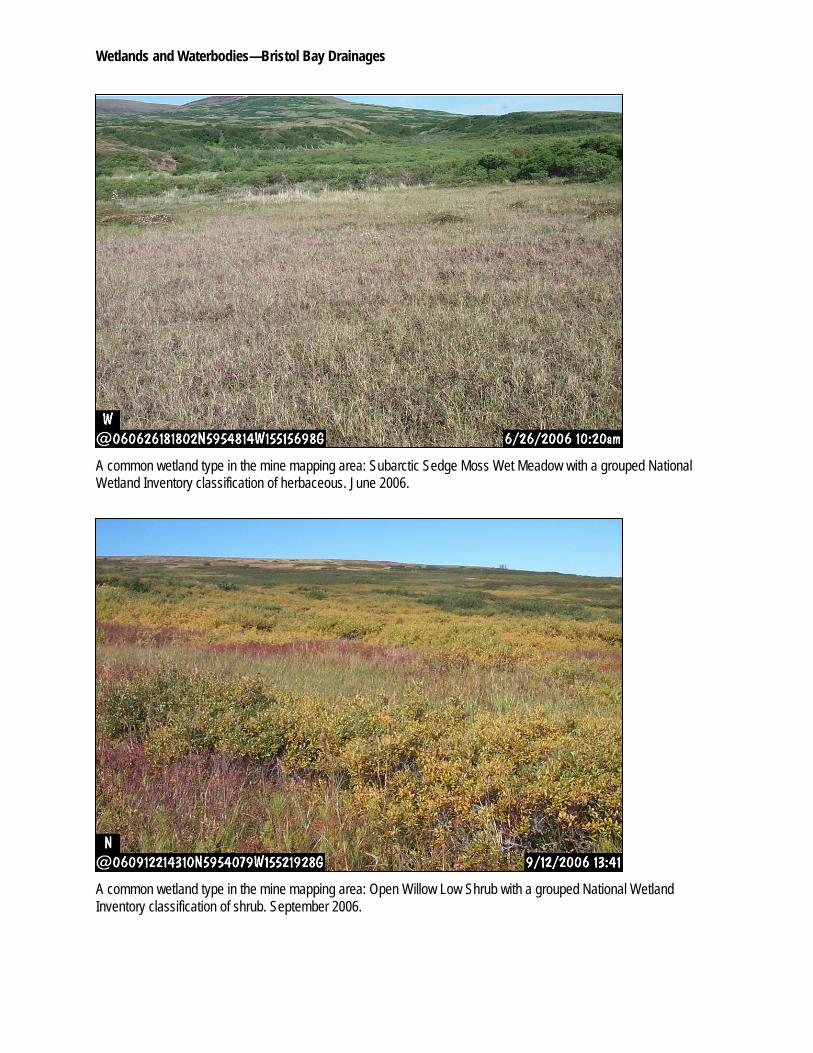
A common wetland type in the mine mapping area: Subarctic Sedge Moss Wet Meadow with a grouped National Wetland Inventory classification of herbaceous. June 2006.
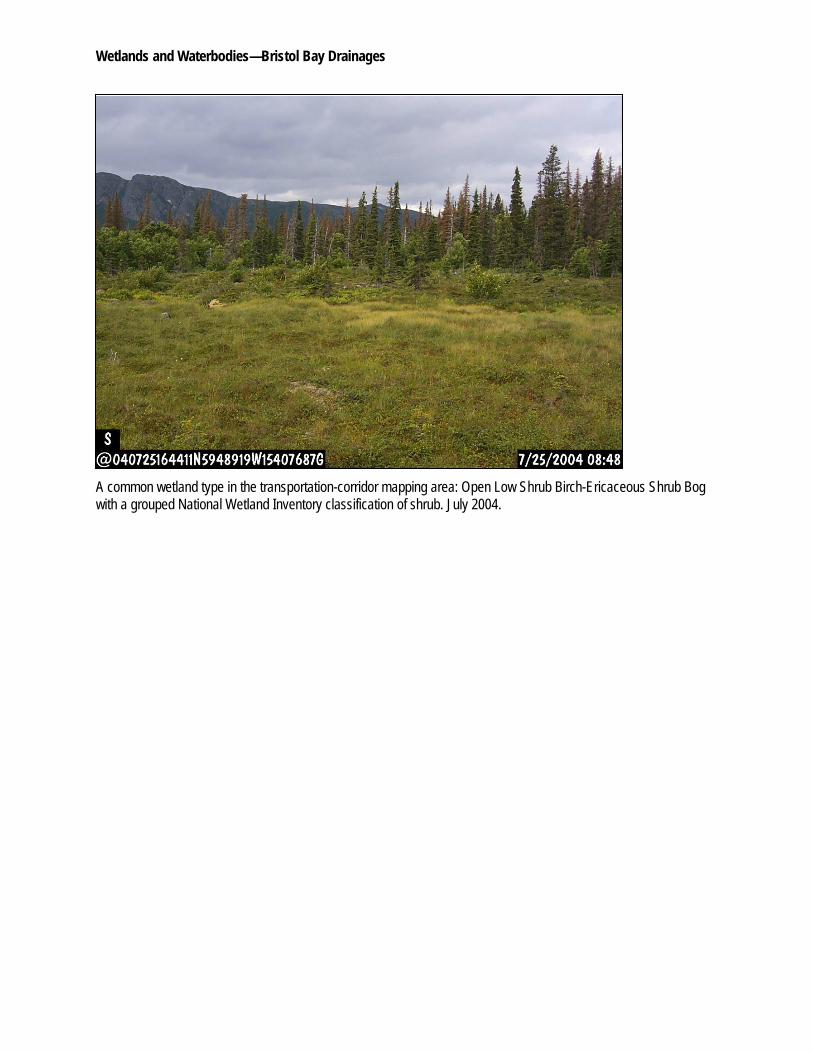
A common wetland type in the mine mapping area: Open Willow Low Shrub with a grouped National Wetland Inventory classification of shrub. September 2006.
Wetlands and Waterbodies—Bristol Bay Drainages
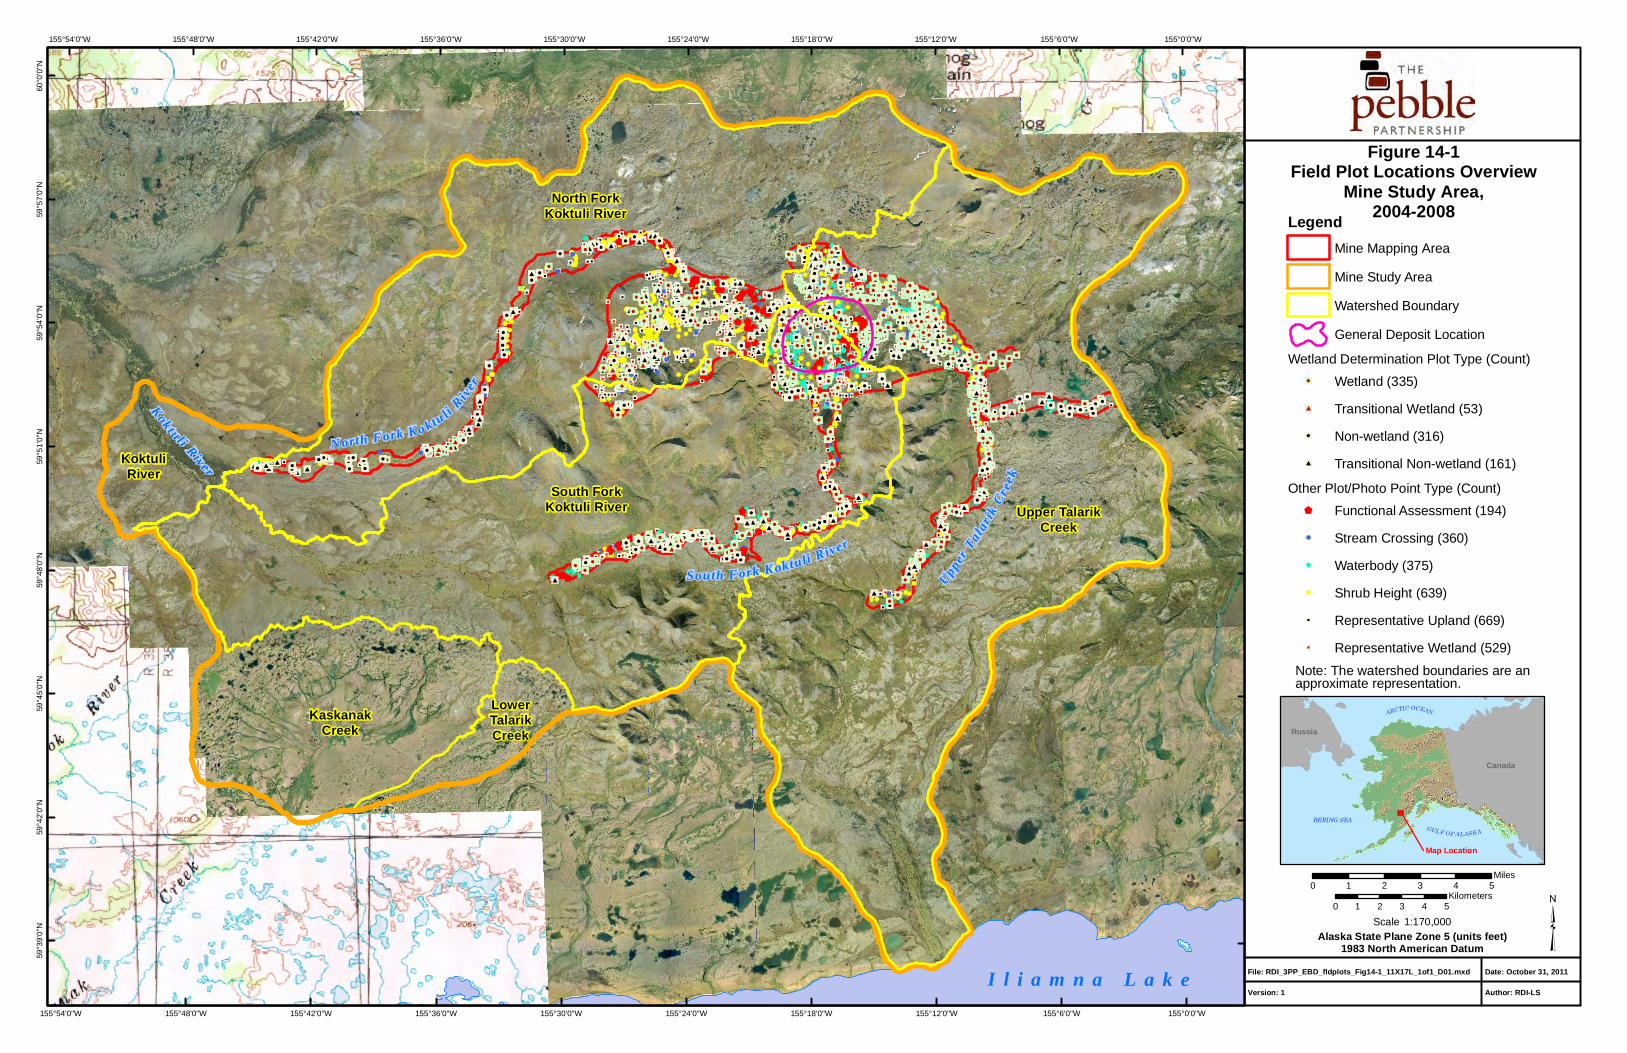
A common wetland type in the transportation-corridor mapping area: Open Low Shrub Birch-Ericaceous Shrub Bog with a grouped National Wetland Inventory classification of shrub. July 2004.
""
""
#""
####
""""
""
""#
""#""""
""""
""""#""#""""##""
""#""#
""""
""
#
""""""""""
""
""
""""#
""""""""""""#""""""""""""""#""
""""
""
""
#""
""##""#
#""
#
""#""""""
""""""""""
#""
""""
#""
""
""""
""""""""
#
##""
##########
#
$$ $
""""""
""""
""
""
#""""#
""#""#""##
""
##
""
#
$""""$$""
#
""""
""
""""""
###
#""#""""
#""""""
#
#"""" """"
""#
""""""""""
""$#
""$$""
######
#########""
#""#
#""""
""""####""#
""""
""""""#
##
#####
###
########
""
####
##
####
####
##
## #
#
##
##
######
#######
#
#
### #
##""
##
###
#
#
""
""""#""""
""""#
""
""""""""
#
#""#""
##
##
""""
#
#
############
##
####
#
#
""
#
#
##### ####
""
#""""#""#""
""#""""""
""
#""
#
""""##
""""
""#""
#
""
"" #""""
""
""""""""""
"" ""
""###""#"
"""""""""
"" """"#""
""""""""""""
""##""
#""
""""""#""""""
"""""""" """"""
""
""#
""""""
""""
""$
""
""""
"" """""" """"""""""#""""
#""""#"""""
"""
#""#""#
""
######""
""
###### ##
""###
#""##""""""""
""#""
""#""""##""
""""#""""
#########
#######
#""
""""##"" #
#"" ""
""#""
#
""###
#""#""""""
"""" """"
#""#""""#$
#""""""
######
#
#### ###""##"
"""
#
""
####
""
""
#
#
"" ##
#
""""
##
# #####""
##
#####
##
##
""""""""""""""
$
#
#""#""#
#
""#""
#
##
#
""""##""######""
#""####
""#
""
""#""""
""""""""
#""""""####
$$""
""
#
##
#""######""""#"
"
$##""#####$
##""#
##$
#""#$####
####
$#
##$###
""## ""
""###
#
$
""""
""
# """"####""
#
#####
""########""
""
""
##""
""""""$""##""""""""
#
""
######
####
""
#####
## ##
#
##### ###
##
# ####
##
###
""#""
#
""##""####
""#####""""""
$
#""##
$##
""""""$""$""""
""
""#""$""""""$$""$""""""""
""$""""
$$
""#$$#""#""$
$""
#$#$""$$#""""#$""$$$""""""$#""$""""""""
$#""####""#""#""#""#$######""##""##""
#""##""##""
""#""#""#
""###""""
#""####""#$#""#
""##
""""""#"
" ####""
""#""#######
####
$$$$$$$
$$$""$
""""
$$
""$
"" ""
#
##$##""$""#
#
$""#
""#
#
###
###$### #
""##""##$
$
""#""#""
$ ""$
"""""" ""
#####
""
""
#
#
""
""
""
"" ""
""
""""
""
""#
##"""""""" "
"""
""""#"" ""#
#
""
""""
""#
""""""""""#""
##""
##""
#
#""$
#$""#$##""#$#""$""$
$"" ##""$$$$""
$##$$$#$
#$##$#$#
#$#######$$$$$#$$
$###$$$
$$$$$$$""#$$$
#$##$#$$$#$$$
$""$
#$#$#""$""""""""$""#$""$#
$$#$$#$#$$
$$$$$
#""
""""#
""""
""### #
#""""""""""""""""""
#$""$#""$#
""$""""""##$#""##""#
""""###""
###""
""###$""$$#$##""##$$
#
""
""
$#"""""" "
"$""$""""""$#"" """"""""
""$""""
""
""""""
#$""""""##$#""$##""
#
#"""""" ""
""##
""""""
#
""""## ""
""""
""
#
##
##
""""
""
""""### ""#""#
""#""#
#""#""#""""""""
""##
##""#""""#
#
""""
""
#""""
""
""
""""
""""""""#"""
"#""""""""#""
""#
""""
""
""
""
##""
""""
""""""
""""""""""""
##""""#
""###
"""" ""#
""""
""
""""""""""
""""""
""
"" """" """""" ""
"""""" """"
""""
""
#
#
#
#
#####
###
#
##
#
###
##
#
####
#
######
#
#""
##
#""
## #
#""##
# ####""
##
##
#
#
##
#
######
""
#### ##
#######
####
##
#
##
##
##
##
##### ## # # ##
###
##
## ## #""# #
##
#
######
#
#
#
#
##
###
##
""#""""##"""
"""
#
#
#
#
#
#
##
###
#####""
#######
###
# ### # ## ## #
##
##"" ##### ###
# ######
######
##
###
####
""#
##
##
######
##### #""#
#
#
## ##
## #
##
#
#
#
##
# #
#
""#
###
##
##
#
##
##
#
#
##
##
""#
#""
#
#
#
# ##
## #
##""
###
##
###
""
""
#
#
#####
## #####
##
##
####
#
# ####
# ## #######
#
######
###
#
#
#
##
""#""
#
""""""""""
#""""""
""
""##""""""
""""""#""#""""""""
""""
""#""""""""""""#""
#
""""""#""""""""#""
""
""""""""""
""""#
""
#
#""
""
""
""
#
#
""
#
#
#
""""""#""""""#
""""""""#""""""""""""""""
"""""""""""""""""
"#""#""#""""""#""#"" ""##""#""""##
#""""#"" """""
"
""""""""
#""##""#""""""""""""###""##""#""""#""
#""""
""""""""""""""""""""""""
""""
""
""
""
""
""
""
""
""
""
""
""
""
""
""
""
""""
#
#
#
""
""
""
#
""""
#
""""
#
""
""
""
""
#
""
""
""
""
""
#
""
""
""
""
""
""
""
#
""
##""
""""""""#""###"
"###""""""""""#""##""#""#""""""
""
""
""#""""""""""""""""
"""" ""##"" """" ""#
""#""#""""
""""""##""
""
##
""""""""""""""""
""""""""
"""""" ""
""""
""""""""""
""
"" ""##
""
#""#
""# ###""#""
#""
#""
""""
""#""
""""
#
""
""
""#""
""
""""#
""""""""""#"""""" """"""#"
""""""""""""
"""""""
"""""""""
"""""""#""""""
""#""
""""
"""""""""
"""""""""""
""
"""""
"
""
##""# # #""""""
""
""
""""
""""""""""
"""""""""
"
""
""
""""""
#""
""
""""
"" """" ""
""#""""""""""""""""""""#""
""
"" """"""
#
####
#### #
##
##
""""
#""#
###""### ##
###""
""
#""#""
""#####
#
""
""""#""
###
""""""""""""
""
""
""
""#
##
""""""#"" ""
""""
""""""#"""""
"
""""###""#"""" """"#""""
#""""#""#""""""""
""""
##
#""#""###
###
###
######
####
#""
#
""
# ### #
#
#
##
""
""""""###
""
""
""""""###
#
##
#
""##
##
########""""
###
# #######
#""##""""##""#
#""#""""""
""#""""""#""""""#
""#""#
"""" #
####
#""#
#
#
#
###
#
###""####
""####
##
#
##
#
###
#
""#
#
###
#""#""""""
""
#
""
""#""
#
#""#""
##
"" """"""""#"
"
"""""
"
""
""""
""
"" ""#
""
""
""""""""""""#""""""""""""""
##""""
#
#
##
#
#####
#######
###
""""
"" ""
""
""""
""
""#""#""""
""""
##
$
$
$
$
$
$""
$
$
$$$$$$$$ $$
$$ $$$
$$
$$$$
$
$$$
""
""
""""$""
"!"!"!
"!
"!"!
"#
"!"!"!
"!"!"!"!"!"#"!
"#"!
"!"!
"!"#"!"#"!"#"!"!
"!
"#"#
"!"!
"#"!"#
"!"!"!"!
"!
"!"!"!"!"#"#"!"!"
!"!"!
"!"!"#"#"!"!"#
"!"!"!
"#"!"#"!"#
"!"!"!"!"!"!"#"!"!"!"!
"!"!"!"!"!"!"!"!"#"!"!"#
"!"!
"!"#
"!
"!"!
"!
"!"!
"!
"!
"!"!
"!
"!"!
"!"!
"!"!
"#"!"#"!"#
"!"!"!
"!"!
"#
"!
"!
"#"!
"#
"# "!
"#"!"!"!
"!"!"!"#
"#
"!
"!
"!
"#"!
"#"!"!"!
"#"!
"!
"!"!"#"#
"!
"#"#"#
"!"!"!"#
"!
"!
"!
"#"!"!
"!
"!"!"#"!
"!
"#"!
"!
"#
"#
"!
"#
"!"#
"!
"#"! "#"!"#"!"#
"! "#"#"#"#"#
"#"!"#
"!"#"!"!"!"#
"#"!"!"!
"! "!"!"!"#"!"!"!"#"!"! "!"!"!"! "#"!"
!"!
"!"!"!"!"!
"#"!"!
"!
"!
"#"!"!
"!"!"!
"#
"!"!"!"#
"!"!
"!"!
"!"!"!"!"!"!"!"!"!"#"!"#
"!"!"!"!
"#
"!"!"!"!
"!"!"!"!"!
"!"!"!
"!
"!"!"!"!"#
"!"!
"!
"!"!
"!"!
"!
"! "!"!"!
"!"!"#"!"!"#
"! "#
"!"#"!
"#"!"!"!"!"!"!"!"!"!
"!
"#
"!"!"!"!"!
"!"#"! "!"#"#
"!"!"!"!
"!"!"!"!"!"!"
!
"!
"#"!"!"!"!"!"!"!"!
"!"!
"!
"!"!"!"!
"!"!"!"!
"#
"!"!
"!"#"!
"!
"!"!"!"!"!
"!
"!"#"!"!"
!"!"!
"! "!"!"!
"!
"!
"!"!"#"!"
#
"!
"!
"#
"!"!"!
"#"!"!
"!
"#
"#"#"#"!"#"!
"!"!"#
"#"!"#"!"#
"#
"!"!"!"!
"!
"!"!
"!"!
"!"!"!
"!"!
"!"!
"!"#"!
"!"#"!"!"!
"!"#"#"#"#"#
"#
"#
"!
"!"!"!"!"!"!"!"#
"!"!"!
"!"!
"#"#"!
"!"!"!"#
"#"#
"#
"!"!"#"!"!"!"!
"!"!"!
"!"!"!"!"!
"!"!"! "
!
"!
"! "#"#"!"!"#
"!"! "!
"!"!"! "# "!"!
"!"!"!
"#
"!"#"!"!"!
"#"!"!
"!
"#"#"!
"!
"!
"#"#"!"#"#
"#"#"#"#"!
"#
"!"!
"#"#"#"!"!"!
"!"#"!"#"!
"!"#"#"!
"!"!"!"! "! "! "!
"!"!
"!"!"#"!
"!
"!"#
"!"!
"!"!
"# "#"!
"!"!"!"!"!"!"!"!"!"!
"!
"!"!"#"!"!
"!"!"!"!
"!
"!"!"!
"!
"!"!
"!
"!"!"!"!"!"!"!"!"#"!"! "!"!"!"!"!"!"!
"! "!"!"!"!"!"!"!"!"#"!"
!"#"!"!
"!
"!"!"!
"!"!"!"!"
!"!"!"!"!"!
"!"!"!
"!
"!"!"!"!
"!"!"!"!"!"!"!"
!"!"!"!"!
"! "!"! "!"!
"#"!
"!
"!
"!"!"!
"!"!"#"!
"!"!"!"!"!"!
"#
"!"#
"#"!"!"!
"!"#"!
"!"!"!"#
"#"#
"! "!
"#
"#
"#"!"#"!
"#"!"#"#
"!
"#"#"!"!"!
"!"#"!
"!"#"#
"!"!
"!
"#
"!"#
"!
"!"#"!
"!"#"!"# "#"! "!"!"!"!"!"!"!"
!"!"!"#"!"!"!"#"#
"#
"!"!
"!
"!"!"!
"!"!"!"!"!"!"!"#
"#"#"#
"!"!"!
"!"#"!
"!"#"!
"!"!
"!"!"#"!"!
"!"#"!"!
"!"!
"#"!
"#
"#"!"#"#"!"!"#"#
"!"#"#"#
"#"!"#"#
"!"#"!"!
"!"!"#
"#"!"!"#
"#
"#"#"#"!"!"!
"!
"!
"!
"#"!"#"!
"!
"#"#
"!
"!"!
"!
I l i a m n a L a k e
North Fork K o ktu li R
iver
Upper
Ta larik
Cr e
ek
South Fork K oktuli R ive r
Koktuli River
KaskanakCreek
LowerTalarikCreek
KoktuliRiver
North ForkKoktuli River
South ForkKoktuli River Upper Talarik
Creek
155°0'0"W
155°0'0"W
155°6'0"W
155°6'0"W
155°12'0"W
155°12'0"W
155°18'0"W
155°18'0"W
155°24'0"W
155°24'0"W
155°30'0"W
155°30'0"W
155°36'0"W
155°36'0"W
155°42'0"W
155°42'0"W
155°48'0"W
155°48'0"W
155°54'0"W
155°54'0"W60
°0'0
"N59
°57'
0"N
59°5
4'0"
N59
°51'
0"N
59°4
8'0"
N59
°45'
0"N
59°4
2'0"
N59
°39'
0"N
LegendMine Mapping Area
Mine Study Area
Watershed Boundary
General Deposit Location
Wetland Determination Plot Type (Count)"! Wetland (335)
"# Transitional Wetland (53)
"! Non-wetland (316)
"# Transitional Non-wetland (161)
Other Plot/Photo Point Type (Count)$ Functional Assessment (194)
# Stream Crossing (360)
# Waterbody (375)
# Shrub Height (639)
"" Representative Upland (669)
"" Representative Wetland (529)
Map Location
Canada
ARCTIC OCEAN
Russia
BERING SEAGULF OF ALASKA
0 1 2 3 4 5Miles
1:170,000ScaleAlaska State Plane Zone 5 (units feet)
1983 North American DatumDate: October 31, 2011
Author: RDI-LS
File: RDI_3PP_EBD_fldplots_Fig14-1_11X17L_1of1_D01.mxd
Version: 1
Figure 14-1Field Plot Locations Overview
Mine Study Area,2004-2008
³0 1 2 3 4 5
Kilometers
Note: The watershed boundaries are anapproximate representation.
!!
!!
!!
!!
!!!!
!!
####""#""""
""""
#""#""""
""
""""#""""
#""
#
#
#"" #""""""
#""""""#""""""""""
""""""""""
""""
""""""""""
""""""""#"""" """"""""
#$$""#""""""#
""""""# $
""""""#
##""""#""
""""""""""""""""
""
""#""""#""""""""""
""""""
""####$""""$###""""""#""
""""""""#""
""
#""""
""""#""""""$""""""#
$###$$
$$#
""""$""
$$$$$$
$""
$#$$$
$
$""""""""""
""
""""""""
""""#""""""""
""""#""""""#""""""""#
""""#""""""""""""""
""""# ""# #""# """"""""#
#""""
#""""""
""""""#""""
""""#
""""""
### ###""""""""
"""" """"
""""""#
#""
""""###""""""""""
""""##"
"""""#""#
""""""
##""
###
""#
#""
#
""""
##""""##""""
#""""""""""""#""#""""""
##""
#"" ""
#""#
""
""""#""""
""""
""""""##
""""""""""""""
""
""
""
""""""""""""""
"""""""""""""
""" #"""""" ""#
"""""""" #""
""#""
#
""# """"""""""""
""# ""###
#""
""$""$""$""""""$
""#""
""""#$$$
$$$""
$$$""""$""$$""""""$
$""""""""
#""""""""""""""""""""""$$""
#""$""$
$""$#""""#
""""
""
""""#""#""""
"" """"
""""#""#
""""
""
""#""
""""#
#""""#""""
#""""#""""
""""
""""""""
""
""
#""
##
""""""""""""""
$""""""
""""""""
""$$
"""" #""""""""""""""""""
#""""$$
$#
$""$$#""
$##$
""
""$""$
$$""#""#$
$$#""""$#""
#$#$""$#""""
"!"#"!"!"!"!"!"!"!"!"!
"!"#"#"!"!"!"!"!"!"!
"!
"!"!
"#
"!
"!"!
"!
"!"!"#"!"#"!"!
"!"!"#"!"!"!"!
"#"!"#
"!
"!"!"!
"!"!"#
"! "!"!"#"!"!"!"!"!
"!
"!"!"!"!
"!"!"!"!"!
"!"!"!"!
"!"!"!"#"!"!"!"!"!"!
"!"!"!"!"!"!"!"!"!"!"#
"!"!
"!"!"!"#
"!"!
"!"!"!"!
"!"#"!
"!
"!"!"!"!
"!"!"!
"!"!"!"!"!
"!"!"!
"!
"!"!
"!"!
"!"!
"!"!"!"!"! "!"!"!"!
"!"! "!"!"!"!"!
"!"!"!"!"!
"!"!"!"!"!"!
"!"!"!"!
"!"!"!"!"!"!"!"!
"!"!
"!
"!
"!"!"!"!"!"
!"!"!"!"!"!
"!
"!"!"!"!"!"!
"!"!"! "!"!"!"!"!"!"!"! "!
"!"! "!
"!
"!"!"!"!
"!"!
"#"!"#"!
"#"#"#
"!"!"!"!"!"!"!"!"!
"!"!"#"!"!"!"
!"!"!"#"#
"!"!"!"!
"!"!"!"!"!"!"!
"!"!"#"!
"!"!"#"!"!
"!"! "!
"!"#
"!
"!"!"!"!"!
"!"#"!"!"!
"!"!"!"!"!"!
"!"!"!
"!"!"!"!"!
"!"! "!"!
"!"!"!"!"#
"!"!"!"!
"!"!
"!"!"!
"!"!"!
"!"!"!
"!"!"!"!
"!"!"!
"!"!"!"#
"!"!"!"!"!"!"!"#"#"#"!"!"#"!"!
"!"!"!
"!"!"!
"#
"#"!
"!"#"#"!"!"!"#
"#"!"!"!"#"!
"!"!"! "!"!"!"!"!"! "#"!"!"!
"! "!"!"!"!
"!"#"!"!"!"!"!"#"#"!"!
"!"!"!
"!"!"#"#"!
"!"! "!"!"#"!"!"!"!"#
"!"!
"!"#"!"!
"!
"#
"!"#
"#"#"!
"!
"! "!"! "!"!"!
"!"!
"!"!"!
"!"!"!"!
"!"! "!"!
"!"!"!"!"!
"!"!"!"!
"!"!
"!"!"! "!"!"!
"!"!
"!"!"!"!"!"!"!"
!
"!"!"!"!
"!"!
"!"!"!"!"!"!"
!"!"!"!"!"!
"!"!
"!
"!
"!
"!
"!"!
"!"#"!"!
"!"!
"#
"!"!"!"!"!
"!"#"!
"!"#
"!"!
"!"!"!
"!
"!
"!"!
"!
I l i a m n a L a k e Bristol Bay DrainagesCook Inlet Drainages
Newh
alen
River
Iliamna
Kokhanok
Newhalen
Nondalton
Pedro Bay Pile Bay
Williamsport
153°30'0"W
153°30'0"W
153°40'0"W
153°40'0"W
153°50'0"W
153°50'0"W
154°0'0"W
154°0'0"W
154°10'0"W
154°10'0"W
154°20'0"W
154°20'0"W
154°30'0"W
154°30'0"W
154°40'0"W
154°40'0"W
154°50'0"W
154°50'0"W
155°0'0"W
155°0'0"W60
°0'0
"N59
°50'
0"N
59°4
0'0"
N59
°30'
0"N
LegendTransportation-corridor Mapping Area
Transportation-corridor Study Area
Bristol Bay/Cook Inlet Drainages Boundary
!! CommunitiesWetland Determination Plot Type (Count)
"! Wetland (200)
"# Transitional Wetland (20)
"! Non-wetland (270)
"# Transitional Non-wetland (37)Other Plot/Photo Point Type (Count)
$ Functional Assessment (71)# Stream Crossing (101)
# Waterbody (37)
"" Representative Upland (197)
"" Representative Wetland (192)
0 2 4 6 8 10Miles
1:300,000ScaleAlaska State Plane Zone 5 (units feet)
1983 North American DatumDate: October 31, 2011
Author: RDI- LS
File: RDI_HDR_EBD_Fig14-2_Fldplots_Overview_11X17L_1of1_D01.mxd
Figure 14-2Overview
Field Plot Locations,Transportation-corridor Study Area,
2004-2008
³0 5 10 15Kilometers
Version: 3
Map Location
Canada
ARCTIC OCEAN
Russia
BERING SEAGULF OF ALASKA