Embed Size (px)
Citation preview

Wilson, P.A., Lyle, M., and Firth, J.V. (Eds.)Proceedings of the Ocean Drilling Program, Scientific Results Volume 199
14. CHEMICAL COMPOSITIONS OF FERROMANGANESE MICRONODULES IN SEDIMENTS AT SITE 1216, ODP LEG 199, PALEOGENE EQUATORIAL TRANSECT1
T. Ito,2 K. Komuro,3 K. Hatsuya,3 and H. Nishi4
ABSTRACT
Distribution, size, mineral, and chemical compositions of ferroman-ganese micronodules (FMMNs) and chemical composition of host sedi-ments were examined in a series of red clay samples with ages fromEocene to the present at Ocean Drilling Program Leg 199, Site 1216,south of the Molokai Fracture Zone in the Central Pacific Basin.
The number of FMMNs changed drastically throughout the 40-m-long red clay intervals. FMMNs are abundant in the upper 9 m of core,decrease between 9 and 25 meters below seafloor (mbsf) with depth,and are very rare from 30 to 40 mbsf. Chemical composition of FMMNsshowed high Mn/Fe ratios and Ni and Cu contents and a distinct posi-tive Ce anomaly because of the existence of buserite. This suggests thatFMMNs in the red clay from 25 mbsf to the top of the cored intervalwere deposited continuously in an oxic diagenetic bottom environ-ment. The red clay below 30 mbsf with higher Mn contents containsfew FMMNs but abundant tiny Mn particles within brown silicatescoated by Fe (oxy-hydro)oxides. This indicates that the mode of manga-nese deposition changed between 25 and 30 mbsf.
INTRODUCTION
According to a study of temporal and spatial distributions of fossilferromanganese micronodules (FMMNs) in sedimentary columns in the
1Ito, T., Komuro, K., Hatsuya, K., and Nishi, H., 2005. Chemical compositions of ferromanganese micronodules in sediments at Site 1216, ODP Leg 199, Paleogene equatorial transect. In Wilson, P.A., Lyle, M., and Firth, J.V. (Eds.), Proc. ODP, Sci. Results, 199, 1–20 [Online]. Available from World Wide Web: <http://www-odp.tamu.edu/publications/199_SR/VOLUME/CHAPTERS/211.PDF>. [Cited YYYY-MM-DD]2Faculty of Education, Ibaraki University, Mito, Ibaraki, 310-8512, Japan. [email protected] of Geoscience, University of Tsukuba, Tsukuba, Ibaraki, 305-8572, Japan.4Department of Earth and Planetary Sciences, Graduate School of Science, Hokkaido University, N10 W8, Sapporo, 060-0810, Japan.
Initial receipt: 19 April 2004Acceptance: 11 November 2004Web publication: 10 May 2005Ms 199SR-211

T. ITO ET AL.FERROMANGANESE MICRONODULES AND CHEMICAL COMPOSITIONS 2
world’s oceans by Glasby (1978), the formation of FMMNs was inti-mately associated with the development of oxygen-rich bottom cur-rents during the Cenozoic. The chemistry and mineralogy of FMMNsare related with bottom water depositional environments. According toBonatti et al. (1972) and Dymond et al. (1984), ferromanganese depos-its can be classified into four types (i.e., hydrogenous, oxic diagenetic,suboxic diagenetic, and hydrothermal) on the basis of chemical andmineralogical compositions. Chemical and mineralogical analysis for aseries of fossil FMMNs from a successive sedimentary sequence is ex-pected to provide key information about paleodeep-sea environments;however, it may be difficult to perform these analyses because FMMNsare present only rarely in sedimentary columns (Cronan, 1973; Au-mento and MacGillivray, 1975; Menard, 1976; Glasby, 1978; Karpoff etal., 1980, 1985; De Carlo and Exon, 1992; Usui and Ito, 1994).
FMMNs, defined as ferromanganese nodules <1 mm in diameter, aredistributed widely not only in the present seafloor but also in the sedi-mentary columns beneath the seafloor (e.g., Nakao and Mizuno, 1982;Sugisaki et al., 1987; Winter et al., 1997). It is expected that extractionand analysis of a series of FMMNs from a successive section will provideimportant information on their genesis and changes in the deep-sea en-vironments. Here we describe distribution, morphology, chemistry, andmineralogy for FMMNs and heavy metal contents for host bulk sedi-ment samples from a successive red clay section of Site 1216, with a dis-cussion of the change of the sedimentary environments of the siteduring the Cenozoic era.
SAMPLES
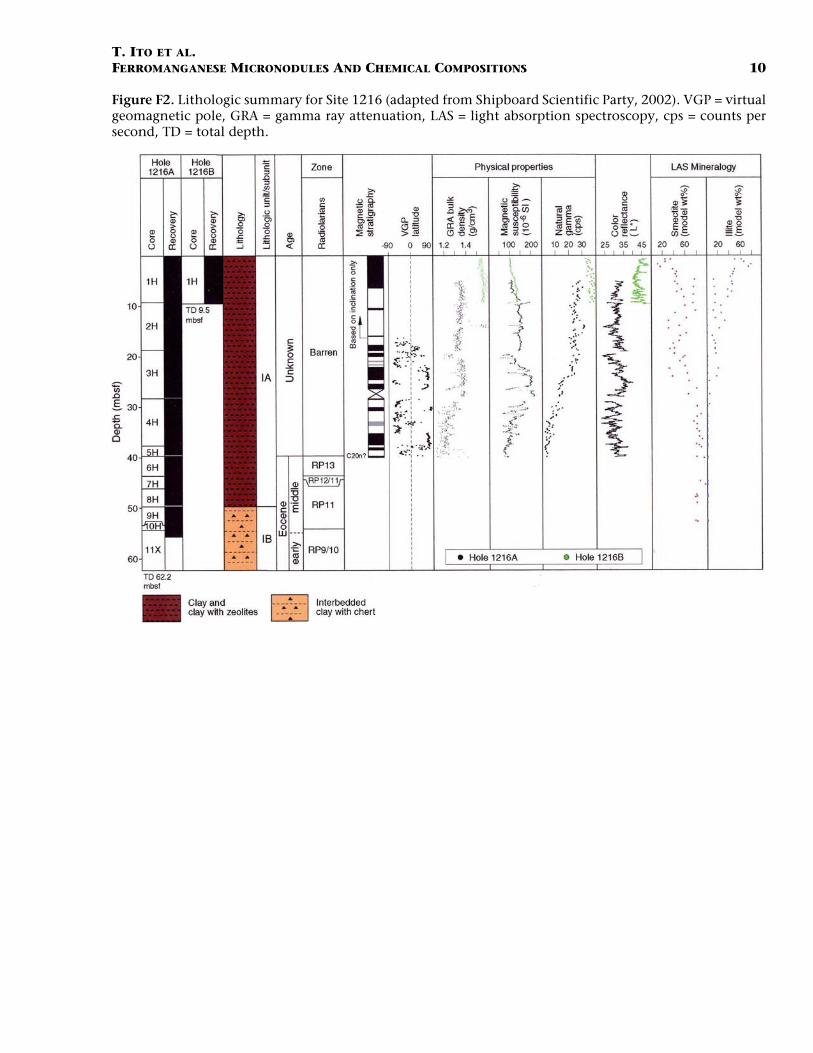
Samples used in this study were collected in intervals of 1.5–4.7 mfrom the red clay of Site 1216. The site is located on abyssal hills southof the Molokai Fracture Zone (21°27.16′N, 139°28.79′W; water depth =5163 m) (Fig. F1) (Shipboard Scientific Party, 2002). The lithology of thecore comprises red clay from the top of the core to 50 meters below sea-floor (mbsf) and interbedded clay with chert from 50 to 62 mbsf (Fig.F2). The depositional age of the red clay, determined by the paleomag-netic method, is considered to be middle Eocene to Holocene (Ship-board Scientific Party, 2002).
In bulk sediment chemistry, Si, Ca, Mg, P, and Sr are almost constant;Al and Ti decrease; and Fe, Mn, and Ba increase with depth (ShipboardScientific Party, 2002). Shipboard pore water analyses showed very lowMn contents ranging from 2.1 to 3.9 µM in the red clay (Shipboard Sci-entific Party, 2002), showing that intensive reductive dissolution ofmanganese oxides and subsequent remobilization of manganese hasnot proceeded. These findings suggest that original depositional andearly diagenetic signals have been well preserved in the FMMNs in thesection.
PROCEDURES
Each sample was separated into two parts for FMMN and bulk rockchemical analysis. The FMMN analysis was carried out after extraction.
FMMNs were extracted by magnetic separation for >25-µm fractionsafter wet screening. The screening was carried out with a small pouch of25-µm nylon mesh in distilled water, which was stirred at least five
F1. Map of the central tropical Pa-cific, p. 9.
160°W 150° 140° 130°
10°
20°
30° N
0 500 1000
Site 1215
Site 1216
Site 1217
Site 1219
Site 1221
Site 1222
Site 40
Site 42
Site 43
Site 69 Site 70Site 71
Site 72
Site 160Site 161
Site 162
Site 163
Site 573
Site 574
Site 575
Honolulu
Leg 199 sitesDSDP sites
Molokai F.Z.
Clipperton F.Z.
Clarion F.Z.
km
Site 1220
Site 1218
0°
F2. Site 1216 lithologic summary, p. 10.

T. ITO ET AL.FERROMANGANESE MICRONODULES AND CHEMICAL COMPOSITIONS 3
times over 3 days. The residual >25-µm fraction scattered on a glass dishwas separated using a Sm-Nd magnet of 4000 G covered with a plasticcup. After air drying, the >25-µm magnetic fraction was weighed andwas used for observational, chemical, and mineralogical analysis. Theblack particles, probably FMMNs, appeared to be well concentrated inthis magnetic fraction.
Morphology, surface structure, and chemistry of the particles in themagnetic fraction were examined using a binocular microscope and aJEOL JMS-5400 scanning electron microscope with an electron disper-sion spectrometer (SEM-EDS). The maximum sizes of FMMNs were mea-sured under a binocular microscope.
X-ray diffraction (XRD) and chemical analyses by inductively cou-pled plasma–atomic emission spectroscopy (ICP-AES) and inductivelycoupled plasma–mass spectrometry (ICP-MS) were carried out forFMMNs, which were carefully hand picked from the >25-µm magneticfraction under a binocular microscope. The hand-picked fraction wasdried at 60°C overnight and was powdered using an agate mill. Thepowdered sample was completely dissolved in a mixture of concen-trated acids—HNO3 (0.1 mL), HClO4 (0.05 mL), HF (0.25 mL), and HCl(0.1 mL)—in a closed Teflon vial at 105°C. The sample solution wasdried in an open system at 200°C and made up in a final solution of 5%HNO3. Chemical compositions were analyzed using ICP-AES (Jarrell AshICAP-757V) and (Yokogawa Hewlett Packard PMS2000) at the ChemicalAnalysis Center, the University of Tsukuba, Japan.
The procedure for chemical analysis of bulk sediment is almost iden-tical to those for FMMNs except for the amounts of powdered sample(~60 mg) and the acids used (HNO3 [0.5 mL], HClO4 [0.2 mL], HF [1mL], and HCl [0.2 mL]).
RESULTS
Magnetic Fractions of >25 µm
The proportion of the >25-µm magnetic fraction in Site 1216 sedi-ments changes with depth (Fig. F3). The upper four samples (5.1–13.1mbsf) have lower proportions ranging from 0% to 0.4%, and three sam-ples from 14.8 to 20.6 m range from 1% to 2%. The lower four samples(30.1–40.2 mbsf) have higher proportions from 2% to 6%, showing anincrease with depth.
On the basis of color, morphology, and structure under a binocularmicroscope, particles in the >25-µm magnetic fraction throughout thesamples can be classified into three types: FMMNs, white silicates hav-ing black small particles of <10 µm, and brown silicates coated by Fe(oxy-hydro)oxides.
The proportion of these three types changes significantly with depth.FMMNs are abundant in the upper 9 mbsf of the core, decrease between9 and 25 mbsf with depth, and are very rare from 30 to 40 mbsf. Thesize of FMMNs also varies significantly with depth (Fig. F3). The maxi-mum size of FMMNs is >0.5 mm in diameter. Below 22 mbsf, the maxi-mum size of the FMMNs is very small, only <0.2 mm in diameter (Fig.F3), in spite of high Mn contents in the sediments. White silicates hav-ing small black particles of <10 µm are rarely present from the top ofthe core to 25 mbsf and are barren below 25 mbsf. Brown silicatescoated by Fe (oxy-hydro)oxides are present throughout the core, andthe abundance increases with depth. In the magnetic fractions from 30
F3. Binocular microscopic photo-graphs, p. 11.
0
10
20
30
40
Dep
th (
mbs
f)
1H-4, 60-62
1H-5, 90-92
1H-6, 90-92
2H-3, 87-89
2H-4, 111-113
2H-6, 45-47
3H-2, 42-44
3H-3, 59-61
3H-5, 89-91
4H-2, 41-43
4H-4, 119-121
4H-6, 100-102
6H-1, 51-53
clay
with
zeo
lite
2 mm
>25 µm mag. (%)
0 0.5 1.51.0 2.0
0 2 4 6 8
max. FMMN (mm)
max. FMMN (mm)
Core, section,interval (cm)199-1216A-
>25 µm mag. (%)

T. ITO ET AL.FERROMANGANESE MICRONODULES AND CHEMICAL COMPOSITIONS 4
to 40 mbsf, the brown silicates are the only dominant phase. SEM-EDSmapping for brown silicates from 30.11 mbsf demonstrates the exist-ence of tiny Mn particles several micrometers in diameter (Fig. F4).
FMMNs
FMMNs were divided into types A and B based on color, shape, andsurface structure under a binocular microscope. Type A FMMNs aredominant throughout the core.
Type A FMMNs have a spherical, spheroidal, or columnar shape witha rough but porous surface of grayish black color and a soft luster (Fig.F5; samples 1, 2, 5, 6). Type B FMMNs have a lumpy structure with ablack, dull, smooth surface (Fig. F5; samples 3, 4, 7, 8). Many Type BFMMNs have one conspicuous flat plane as shown in sample 7 on Fig-ure F5. In Type B, FMMNs with a columnar shape were not detected.
Qualitative SEM-EDS analyses suggest that Mn, Si, Al, Mg, Ca, K, andNi are dominant for Type A, and Mn, Fe, Si, Al, Mg, Ca, and Ti are dom-inant for Type B. Type A FMMNs have higher Ni and lower Fe and Ticontents than Type B FMMNs.
According to XRD analyses of Type A FMMNs from 5.10 and 17.15mbsf, the former contain buserite with a peak at 9.7 Å and the latter iscomposed of birnessite with distinct peaks at 7.16 and 3.56 Å. Bothsamples have unidentified peaks at 4.78, 3.11, and 2.76 Å.
ICP-AES and ICP-MS analyses of Type A FMMNs from 6.90 and 8.40mbsf show that both FMMNs have high Mn/Fe ratios of 8.3 and 14.4and are enriched in Ni and Cu (Table T1). As shown in Figure F6, rareearth element (REE) contents in FMMNs are lower than those in bulksediments. North American shale composite (NASC)-normalized REEpatterns exhibit a distinct positive Ce anomaly and a faint positive Euanomaly. We did not analyze Type B FMMNs on XRD, ICP-AES, andICP-MS because of their poor abundance.
Chemical Composition of Sediments
The chemical composition of bulk sediments is shown in Table T2.Profiles of Mn, Fe, Al, V, Ba, and Nd; ratios of Mn/Fe, Mn/Al, Ni/Mn ×100, and Cu/Mn × 100; and degrees of REE anomalies (Ce/Ce* and Eu/Eu*) are presented in Figure F7.
Mn content, Mn/Al ratios, and Eu/Eu* values increase with depth. Fecontent is nearly constant above 22 mbsf and increases with depth be-low 26 mbsf. V content has a peak at 25 mbsf with a gradual decreasedownhole. Ba content is constant above 25 mbsf and increases from700 to 2700 ppm with depth. Nd content (as a representation of3+REE), Mn/Fe, and Cu/Mn ratios show a broad peak in this sequence,but the horizons showing the maximum contents are different. Al con-tent, Ni/Mn and Cu/Mn ratios, and Ce/Ce* decrease with depth.
Scatter plots of element contents vs. Mn, Fe, and P contents areshown in Figure F8. Elemental relationships of Mn vs. some elementsvary ~2.4% in Mn content (Fig. F8), which corresponds to ~30 mbsf inthe sediment column (Fig. F7). For example, two different scattered ar-eas are distinguished in plots of Mn vs. P, Zn, Co, and Nd. Meanwhile,Mn shows continuously significant negative correlations with Al andCe.
The elemental relationship between Fe and some element is discon-tinuous (Fig. F8). The elemental relationships vary ~8% in iron content,equivalent with ~25 mbsf, which is shallower than the boundary in the
F4. SEM-EDS mapping of the mag-netic fraction, p. 12.
SEM image AlSi
K Ca Mg
Fe Mn Ni
5 µm
F5. SEM images of representative FMMNs, p. 13.
T1. Chemical composition of FMMNs, p. 19.
F6. NASC-normalized REE abun-dance of FMMNs, p. 14.
0.1
1
10
FMMNs, 6.90 mbsf
FMMNs, 8.40 mbsf
Sam
ple/
NA
SC
LuYbTmErHoDyTbGdEuSmNdPrCeLa
T2. Chemical composition of bulk sediments, p. 20.
F7. Elemental composition of bulk sediments, p. 15.
0 1 2 3 40
10
20
30
40
50
Mn (wt%)
Dep
th (
mbs
f)
0 5 10 15Fe (wt%)
0 2 4 6 8 10Al (wt%)
0 100 200V (ppm)
0 1000 2000 30000
10
20
30
40
50
Ba (ppm)
Dep
th (
mbs
f)
0 50 100 150
Nd (ppm)
0.0 0.2 0.4
Mn/Fe
0.0 0.5 1.0 1.5
Mn/Al
0.0 2.0 4.0 6.00
10
20
30
40
50
Ni/Mn x 100
Dep
th (
mbs
f)
0 2 4 6Cu/Mn x 100
0.0 0.2 0.4 0.6 0.8Ce/Ce*
0.0 1.0 2.0Eu/Eu*

T. ITO ET AL.FERROMANGANESE MICRONODULES AND CHEMICAL COMPOSITIONS 5
case of Mn. The interrelations of some elements vs. Mn and Fe in bulksediment change at 30 and 25 mbsf, respectively.
NASC-normalized REE abundances are presented in Figure F9. Con-vex-upward REE patterns with negative Ce anomalies are characteristicof Site 1216 red clays. REE abundances and degrees of the anomaliescorrelate well with depth.
DISCUSSION
Origin of FMMNs
The foregoing analysis indicates the proportion of FMMNs in redclay with depth: FMMNs are abundant in the upper 9 mbsf and de-crease with depth. The FMMNs are mainly of Type A with a small num-ber of Type B. Type A has rough surface and is composed of birnessiteand buserite, whereas Type B has smooth surface. Type A FMMNs are8.3 and 14.4 in Mn/Fe ratio, 3.3 and 4.5 wt% in Ni content, and 0.80and 1.05 wt% in Cu content (Table T1).
Higher Ni and Cu contents are characteristic of ferromanganese ox-ide composed of buserite and originating in oxic diagenesis (Dymond etal., 1984). The positive Ce anomaly (Fig. F6) is also characteristic of bu-serite (Elderfield et al., 1981). We consider the FMMNs from Site 1216to have been formed an under oxic diagenetic environment, althoughthe Ni contents and Mn/Fe ratios are out of the range of published data(average = 1.4 ± 0.2 and 4.7 ± 1.2, respectively) (Dymond et al., 1984;Calvert et al., 1987).
Sources of Metals in Sediments
The red clay below 30 mbsf with higher Mn content contains fewFMMNs but abundant tiny (several micrometers) Mn particles withinbrown silicates coated by Fe (oxy-hydro)oxides (Fig. F4). There is nosimple correlation between the number of FMMNs and Mn-Fe contentin bulk sediment. This indicates a different mode of deposition formanganese below 30 mbsf.
The bulk sediment chemistry of Site 1216 is plotted in Figure F10,which is a diagnostic diagram distinguishing marine sediments of dif-ferent origins (Meylan et al., 1981). Six surficial samples are plottedaround the terrigenous end-member sediment composition, and foursamples below 20 mbsf with high Mn and Fe contents are includedwithin the region of hydrothermal sediments (Fig. F10). The four sam-ples below 30 mbsf are also enriched in Ba and Zn, which are wellknown to enrich hydrothermal deposits of active ridge crests (e.g., Bos-tröm and Peterson, 1969; Ruhlin and Owen, 1986). It is suggested thatelemental input in the sedimentary column below 30 mbsf might origi-nate from hydrothermal activity.
CONCLUSIONS
Studies of FMMNs and their host sediments from ODP Leg 199, Site1216, produced the following conclusions:
1. The number of FMMNs changed significantly throughout the40-m-long red clay section. FMMNs were commonly present
F8. Element concentrations of bulk sediments, p. 16.
0.0
2.0
4.0
6.0
8.0
10.0
12.0
14.0
0.0 0.5 1.0 1.5 2.0 2.5 3.0 3.5 4.0
Mn (wt%)
Fe
(wt%
)
0.0
2.0
4.0
6.0
8.0
10.0
0.0 0.5 1.0 1.5 2.0 2.5 3.0 3.5 4.0
Al (
wt%
)
Mn (wt%)
0.0
0.1
0.2
0.3
0.4
0.5
0.0 0.5 1.0 1.5 2.0 2.5 3.0 3.5 4.0
P (
wt%
)
Mn (wt%)
0
50
100
150
200
250
300
0.0 0.5 1.0 1.5 2.0 2.5 3.0 3.5 4.0
Co
(ppm
)
Mn (wt%)
0
50
100
150
200
250
300
350
400
0.0 0.5 1.0 1.5 2.0 2.5 3.0 3.5 4.0
Zn
(ppm
)
Mn (wt%)
0
500
1000
1500
2000
2500
3000
0.0 0.5 1.0 1.5 2.0 2.5 3.0 3.5 4.0
Ba
(ppm
)
Mn (wt%)
0
40
80
120
160
0.0 0.5 1.0 1.5 2.0 2.5 3.0 3.5 4.0
Ce
(ppm
)
Mn (wt%)
0
20
40
60
80
100
120
140
0.0 0.5 1.0 1.5 2.0 2.5 3.0 3.5 4.0
Nd
(ppm
)
Mn (wt%)
0.0
0.1
0.2
0.3
0.4
0.5
0.0 2.0 4.0 6.0 8.0 10.0 12.0 14.0
P (
wt%
)
Fe (wt%)
0
50
100
150
200
250
300
350
400
0.0 2.0 4.0 6.0 8.0 10.0 12.0 14.0
Zn
(ppm
)
Fe (wt%)
0.20
0.25
0.30
0.35
0.40
0.45
0.50
0.9 1.0 1.1 1.2 1.3 1.4 1.5 1.6
P (
wt%
)
Ca (wt%)
0
20
40
60
80
100
120
140
0.0 0.1 0.2 0.3 0.4 0.5 0.6
Nd
(ppm
)
P (wt%)
F9. NASC-normalized REE abun-dances, p. 17.
0.1
1
10
5.10 mbsf6.90 mbsf
Sam
ple/
NA
SC
A
8.40 mbsf13.07 mbsf14.81 mbsf17.15 mbsf
B
0.1
1
10
20.62 mbsf22.29 mbsf25.59 mbsf
Sam
ple/
NA
SC
C
30.11 mbsf33.89 mbsf36.70 mbsf40.21 mbsf
DLa Ce Pr Nd Sm Eu Gd Tb Dy Ho Er Tm Yb Lu
La Ce Pr Nd Sm Eu Gd Tb Dy Ho Er Tm Yb Lu
La Ce Pr Nd Sm Eu Gd Tb Dy Ho Er Tm Yb Lu
La Ce Pr Nd Sm Eu Gd Tb Dy Ho Er Tm Yb Lu
F10. Fe/Ti vs. Al/(Al + Fe + Mn) plots, p. 18.
1
10
100
1000
0.0 0.3 0.6 0.9
Al/(Al+Fe+Mn)
EPR
TM
BM
Hydrothermal sediments
Southwest Pacific Basin sediments
Shallower
Deeper
Fe/
Ti

T. ITO ET AL.FERROMANGANESE MICRONODULES AND CHEMICAL COMPOSITIONS 6
from 25 mbsf to the top of the sediment column, especiallyabove 9 mbsf. The chemical composition of FMMNs showedhigh Mn/Fe ratios, high Ni and Cu contents, and a distinct pos-itive Ce anomaly, which are all characteristic of buserite. Thissuggests that Fe-Mn deposition under oxic diagenetic bottomenvironment was continuous from 25 mbsf to the top of thecore.
2. Only a sporadic presence of FMMNs was shown in the core from30 to 25 mbsf in spite of higher Mn and Fe contents than theoverlying succession. A series of analytical data in addition tohigh Mn and Fe contents supports a sedimentary environmenteffected by hydrothermal activity. This suggests that adequateMn and Fe supply is not a necessary condition for FMMNs for-mation.
ACKNOWLEDGMENTS
This research used samples provided by the Ocean Drilling Program(ODP). ODP is sponsored by the U.S. National Science Foundation(NSF) and participating countries under management of Joint Oceano-graphic Institutions (JOI), Inc.
We appreciate technical help for extraction of FMMNs from Dr. T.Noguchi and for XRD analysis from Dr. M. Nakata. Drs. V.K. Banakarand K. Sugitani are gratefully acknowledged for their constructive re-views. Sincere thanks are expressed to Dr. M. Lyle for his helpful com-ments and precise handling.
Funding for this research was provided by a Grant-in-Aid for Scien-tific Research Projects from the Ministry of Education, Culture, Sportsand Technology of Japan (number 14740297).

T. ITO ET AL.FERROMANGANESE MICRONODULES AND CHEMICAL COMPOSITIONS 7
REFERENCES
Aumento, F., and MacGillivray, J.M., 1975. Geochemistry of buried Miocene–Pleis-tocene ferromanganese nodules from the Antarctic Ocean. In Hayes, D.E., Frakes,L.A., Init. Repts. DSDP, 28: Washington (U.S. Govt. Printing Office), 795–803.
Bonatti, E., Kraemer, T., and Rydell, H., 1972. Classification and genesis of submarineiron-manganese deposits. In Horn, D.R. (Ed.), Papers from a Conference on Ferroman-ganese Deposits on the Ocean Floor: Washington (Natl. Sci. Found.), 149–166.
Boström, K., and Peterson, M.N.A., 1969. The origin of aluminium-poor ferromanga-noan sediments in areas of high heat flow on the East Pacific Rise. Mar. Geol.,7:427–447.
Calvert, S.E., Piper, D.Z., and Baedecker, P.A., 1987. Geochemistry of the rare earthelements in ferromanganese nodules from DOMES Site A, northern equatorialPacific. Geochim. Cosmochim. Acta, 51:2331–2338.
Cronan, D.S., 1973. Manganese nodules in sediments cored during Leg 16, Deep SeaDrilling Project. In van Andel, T.H., Heath, G.R., Init. Repts. DSDP, 16: Washington(U.S. Govt. Printing Office), 605–608.
De Carlo, E.H., and Exon, N.F., 1992. Ferromanganese deposits from the Wombat Pla-teau, northwest Australia. In von Rad, U., Haq, B.U., et al., Proc. ODP, Sci. Results,122: College Station, TX (Ocean Drilling Program), 335–345.
Dymond, J., Lyle, M., Finney, B., Piper, D.Z., Murphy, K., Conard, R., and Pisias, N.,1984. Ferromanganese nodules from MANOP Sites H, S, and R—control of miner-alogical and chemical composition by multiple accretionary processes. Geochim.Cosmochim. Acta, 48:931–950.
Elderfield, H., Hawkesworth, C.J., Greaves, M.J., and Calvert, S.E., 1981. Rare earthelement geochemistry of oceanic ferromanganese nodules and associated sedi-ments. Geochim. Cosmochim. Acta, 45(4):513–528.
Glasby, G.P., 1978. Deep-sea manganese nodules in the stratigraphic records: evi-dence from DSDP cores. Mar. Geol., 28:51–64.
Haskin, L.A., Haskin, M.A., Frey, F.A., and Wildeman, T.R., 1968. Relative and abso-lute terrestrial abundances of the rare earths. In Ahrens, L.H. (Ed.), Origin and Dis-tribution of the Elements: New York (Pergamon), 889–912.
Karpoff, A.M., Bourbon, M., Ancel, B., and de Graciansky, P.C., 1985. Diagenetic poly-metallic crusts at Sites 550 and 548 of Leg 80, northeastern Atlantic ocean. In deGraciansky, P.C., Poag, C.W., et al., Init. Repts. DSDP, 80: Washington (U.S. Govt.Printing Office), 823–844.
Karpoff, A.M., Peterschmitt, I., and Hoffert, M., 1980. Mineralogy and geochemistryof sedimentary deposits on Emperor Seamounts, Site 430, 431, and 432: authigen-esis of silicates, phosphates and ferromanganese oxides. In Jackson, E.D., Koizumi,I., et al., Init. Repts. DSDP, 55: Washington (U.S. Govt. Printing Office), 463–489.
Menard, H.W., 1976. Time, chance, and the origin of manganese nodules. Am. Sci.,64:519–529.
Meylan, M.A., Glasby, G.P., Knedler, K.E., and Johnston, J.H., 1981. Metalliferousdeep-sea sediments. In Wolf, K.H. (Ed.), Handbook of Strata-Bound and Stratiform OreDeposits (Vol. 9): Amsterdam (Elsevier), 77–178.
Nakao, S., and Mizuno, A., 1982. Regional sedimentologic data: in the central PacificWake-Tahiti transect, GH80-1 cruise. In Mizuno, A., and Nakao, S. (Eds.), RegionalData of Marine Geology, Geophysics, and Manganese Nodules: the Wake-Tahiti Transectin the Central Pacific, January–March 1980 (GH80-1 Cruise). Cruise Rep.—Geol. Surv.Jpn, 18:95–123.
Ruhlin, D.E., and Owen, R.M., 1986. The rare earth element geochemistry of hydro-thermal sediments from the East Pacific Rise: examination of a seawater scaveng-ing mechanism. Geochim. Cosmochim. Acta, 50:393–400.

T. ITO ET AL.FERROMANGANESE MICRONODULES AND CHEMICAL COMPOSITIONS 8
Shipboard Scientific Party, 2002. Leg 199 summary. In Lyle, M., Wilson, P.A., Janecek,T.R., et al., Proc. ODP, Init. Repts., 199: College Station TX (Ocean Drilling Program),1–87.
Sugisaki, R., Ohashi, M., Sugitani, K., and Suzuki, K., 1987. Compositional variationsin manganese micronodules: a possible indicator of sedimentary environments. J.Geol., 95:433–454.
Usui, A., and Ito, T., 1994. Fossil manganese deposits buried within DSDP/ODP cores,Legs 1–126. Mar. Geol., 119:111–136.
Winter, B.L., Johnson, C.M., and Clark, D.L., 1997. Geochemical constraints on theformation of late Cenozoic ferromanganese micronodules from the central ArcticOcean. Mar. Geol., 138:149–169.

T. ITO ET AL.FERROMANGANESE MICRONODULES AND CHEMICAL COMPOSITIONS 9
Figure F1. Map of the central tropical Pacific showing Leg 199 and DSDP drill sites (adapted from ShipboardScientific Party, 2002). F.Z. = fracture zone.
160°W 150° 140° 130°
10°
20°
30° N
0 500 1000
Site 1215
Site 1216
Site 1217
Site 1219
Site 1221
Site 1222
Site 40
Site 42
Site 43
Site 69 Site 70Site 71
Site 72
Site 160Site 161
Site 162
Site 163
Site 573
Site 574
Site 575
Honolulu
Leg 199 sitesDSDP sites
Molokai F.Z.
Clipperton F.Z.
Clarion F.Z.
km
Site 1220
Site 1218
0°
T. ITO ET AL.FERROMANGANESE MICRONODULES AND CHEMICAL COMPOSITIONS 10
Figure F2. Lithologic summary for Site 1216 (adapted from Shipboard Scientific Party, 2002). VGP = virtualgeomagnetic pole, GRA = gamma ray attenuation, LAS = light absorption spectroscopy, cps = counts persecond, TD = total depth.

T. ITO ET AL.FERROMANGANESE MICRONODULES AND CHEMICAL COMPOSITIONS 11
Figure F3. Binocular microscopic photographs, content of magnetic fraction (>25 µm in diameter), andmaximum size of ferromanganese micronodules (FMMNs) at Site 1216. mag. = magnetic, max. = maxi-mum.
0
10
20
30
40
Dep
th (
mbs
f)
1H-4, 60-62
1H-5, 90-92
1H-6, 90-92
2H-3, 87-89
2H-4, 111-113
2H-6, 45-47
3H-2, 42-44
3H-3, 59-61
3H-5, 89-91
4H-2, 41-43
4H-4, 119-121
4H-6, 100-102
6H-1, 51-53
clay
with
zeo
lite
2 mm
>25 µm mag. (%)
0 0.5 1.51.0 2.0
0 2 4 6 8
max. FMMN (mm)
max. FMMN (mm)
Core, section,interval (cm)199-1216A-
>25 µm mag. (%)

T. ITO ET AL.FERROMANGANESE MICRONODULES AND CHEMICAL COMPOSITIONS 12
Figure F4. SEM-EDS mapping of the magnetic fraction (>25 µm in diameter) (Sample 199-1216A-4H-2, 41–43 cm; 30.11 mbsf).
SEM image AlSi
K Ca Mg
Fe Mn Ni
5 µm

T. ITO ET AL.FERROMANGANESE MICRONODULES AND CHEMICAL COMPOSITIONS 13
Figure F5. SEM images of representative ferromanganese micronodules (scale bar = 100 µm). 1–4. Sample199-1216A-1H-4, 60–62 cm (5.1 mbsf). 5–8. Sample 199-1216A-2H-6, 45–47 cm (17.15 mbsf).

T. ITO ET AL.FERROMANGANESE MICRONODULES AND CHEMICAL COMPOSITIONS 14
Figure F6. North American shale composite (NASC)-normalized REE abundance of ferromanganese mi-cronodules (FMMNs), Site 1216. NASC data are adapted from Haskin et al. (1968). The shaded area repre-sents the range of REE abundance of bulk sediment samples.
0.1
1
10
FMMNs, 6.90 mbsf
FMMNs, 8.40 mbsf
Sam
ple/
NA
SC
LuYbTmErHoDyTbGdEuSmNdPrCeLa

T. ITO ET AL.FERROMANGANESE MICRONODULES AND CHEMICAL COMPOSITIONS 15
Figure F7. Elemental composition of bulk sediments from Site 1216. The Ce and Eu anomalies are definedas Ce/Ce* = (2CeANALYSIS/CeNASC)/(LaANALYSIS/LaNASC + PrANALYSIS/PrNASC) and Eu/Eu* = (2EuANALYSIS/EuNASC)/(SmANALYSIS/SmNASC + GdANALYSIS/GdNASC). North American shale composite (NASC) data are adapted from Haskin et al.(1968), and ANALYSIS shows analytical data.
0 1 2 3 40
10
20
30
40
50
Mn (wt%)
Dep
th (
mbs
f)
0 5 10 15Fe (wt%)
0 2 4 6 8 10Al (wt%)
0 100 200V (ppm)
0 1000 2000 30000
10
20
30
40
50
Ba (ppm)
Dep
th (
mbs
f)
0 50 100 150
Nd (ppm)
0.0 0.2 0.4
Mn/Fe
0.0 0.5 1.0 1.5
Mn/Al
0.0 2.0 4.0 6.00
10
20
30
40
50
Ni/Mn x 100
Dep
th (
mbs
f)
0 2 4 6Cu/Mn x 100
0.0 0.2 0.4 0.6 0.8Ce/Ce*
0.0 1.0 2.0Eu/Eu*

T. ITO ET AL.FERROMANGANESE MICRONODULES AND CHEMICAL COMPOSITIONS 16
Figure F8. Scatter plots of element concentrations of bulk sediment samples, Site 1216.
0.0
2.0
4.0
6.0
8.0
10.0
12.0
14.0
0.0 0.5 1.0 1.5 2.0 2.5 3.0 3.5 4.0
Mn (wt%)
Fe
(wt%
)
0.0
2.0
4.0
6.0
8.0
10.0
0.0 0.5 1.0 1.5 2.0 2.5 3.0 3.5 4.0
Al (
wt%
)
Mn (wt%)
0.0
0.1
0.2
0.3
0.4
0.5
0.0 0.5 1.0 1.5 2.0 2.5 3.0 3.5 4.0
P (
wt%
)
Mn (wt%)
0
50
100
150
200
250
300
0.0 0.5 1.0 1.5 2.0 2.5 3.0 3.5 4.0
Co
(ppm
)
Mn (wt%)
0
50
100
150
200
250
300
350
400
0.0 0.5 1.0 1.5 2.0 2.5 3.0 3.5 4.0
Zn
(ppm
)
Mn (wt%)
0
500
1000
1500
2000
2500
3000
0.0 0.5 1.0 1.5 2.0 2.5 3.0 3.5 4.0
Ba
(ppm
)
Mn (wt%)
0
40
80
120
160
0.0 0.5 1.0 1.5 2.0 2.5 3.0 3.5 4.0
Ce
(ppm
)
Mn (wt%)
0
20
40
60
80
100
120
140
0.0 0.5 1.0 1.5 2.0 2.5 3.0 3.5 4.0
Nd
(ppm
)
Mn (wt%)
0.0
0.1
0.2
0.3
0.4
0.5
0.0 2.0 4.0 6.0 8.0 10.0 12.0 14.0
P (
wt%
)
Fe (wt%)
0
50
100
150
200
250
300
350
400
0.0 2.0 4.0 6.0 8.0 10.0 12.0 14.0
Zn
(ppm
)
Fe (wt%)
0.20
0.25
0.30
0.35
0.40
0.45
0.50
0.9 1.0 1.1 1.2 1.3 1.4 1.5 1.6
P (
wt%
)
Ca (wt%)
0
20
40
60
80
100
120
140
0.0 0.1 0.2 0.3 0.4 0.5 0.6
Nd
(ppm
)
P (wt%)

T. ITO ET AL.FERROMANGANESE MICRONODULES AND CHEMICAL COMPOSITIONS 17
Figure F9. North American shale composite (NASC)-normalized REE abundance of bulk sediment samples,Site 1216. The shaded fraction represents the range of REE abundance.
0.1
1
10
5.10 mbsf6.90 mbsf
Sam
ple/
NA
SC
A
8.40 mbsf13.07 mbsf14.81 mbsf17.15 mbsf
B
0.1
1
10
20.62 mbsf22.29 mbsf25.59 mbsf
Sam
ple/
NA
SC
C
30.11 mbsf33.89 mbsf36.70 mbsf40.21 mbsf
DLa Ce Pr Nd Sm Eu Gd Tb Dy Ho Er Tm Yb Lu
La Ce Pr Nd Sm Eu Gd Tb Dy Ho Er Tm Yb Lu
La Ce Pr Nd Sm Eu Gd Tb Dy Ho Er Tm Yb Lu
La Ce Pr Nd Sm Eu Gd Tb Dy Ho Er Tm Yb Lu

T. ITO ET AL.FERROMANGANESE MICRONODULES AND CHEMICAL COMPOSITIONS 18
Figure F10. Fe/Ti vs. Al/(Al + Fe + Mn) plots for bulk sediments, Site 1216. BM = biogenic matter end-mem-ber sediment composition, EPR = East Pacific Rise hydrothermal end-member sediment composition, TM= terrigenous matter end-member sediment composition (Meylan et al., 1981).
1
10
100
1000
0.0 0.3 0.6 0.9
Al/(Al+Fe+Mn)
EPR
TM
BM
Hydrothermal sediments
Southwest Pacific Basin sediments
ShallowerDeeper
Fe/
Ti

T. ITO ET AL.FERROMANGANESE MICRONODULES AND CHEMICAL COMPOSITIONS 19
Table T1. Chemical composition of FMMNs, Site1216.
Note: FMMNs = ferromanganese micronodules.
199-1216A-
Core, section,interval (cm):
1H-5,90–92
1H-6,90–92
Depth (mbsf): 6.90 8.40
Element:Li (ppm) 47.0 50.3 Be (ppm) 3.66 0.73 Na (wt%) 0.61 0.64 Mg (wt%) 2.77 3.03 Al (wt%) 4.10 3.38 P (ppm) 885 469 K (wt%) 4.50 2.46 Ca (wt%) 1.60 1.70 Sc (ppm) 7.04 3.58 Ti (wt%) 0.241 0.170 V (ppm) 126 81 Cr (ppm) 52.4 17.0 Mn (wt%) 25.8 30.7 Fe (wt%) 3.11 2.13 Co (ppm) 2000 1240 Ni (wt%) 3.29 4.47 Cu (wt%) 0.80 1.05 Zn (ppm) 1380 1439 Ga (ppm) 90.3 63.8 Ge (ppm) 23.5 19.4 As (ppm) 43.4 38.8 Rb (ppm) 34.6 20.0 Sr (ppm) 281 258 Y (ppm) 47.1 27.0 Zr (ppm) 83.2 44.2 Nb (ppm) 9.19 4.84 Mo (ppm) 142 108 Ag (ppm) 4.35 2.22 Cd (ppm) 4.79 3.37 In (ppm) 2.34 0.52 Sn (ppm) 0.47 0.34 Sb (ppm) 4.53 6.59 Te (ppm) 2.21 1.60 Cs (ppm) 4.44 1.64 Ba (ppm) 554 261 La (ppm) 35.3 20.0 Ce (ppm) 268 120 Pr (ppm) 10.2 5.18 Nd (ppm) 36.5 20.3 Sm (ppm) 8.25 4.84 Eu (ppm) 3.24 1.57 Gd (ppm) 9.76 5.33 Tb (ppm) 1.73 0.74 Dy (ppm) 8.61 4.59 Ho (ppm) 1.79 0.96 Er (ppm) 5.40 3.05 Tm (ppm) 0.94 0.39 Yb (ppm) 4.36 2.43 Lu (ppm) 0.91 0.38 Hf (ppm) 2.34 1.25 Ta (ppm) 0.84 0.14 W (ppm) 15.0 9.7 Tl (ppm) 32.1 60.1 Pb (ppm) 106 52.5 Bi (ppm) 5.33 1.39 Th (ppm) 6.40 2.09 U (ppm) 3.34 0.74

T. ITO ET AL.FERROMANGANESE MICRONODULES AND CHEMICAL COMPOSITIONS 20
Table T2. Chemical composition of bulk sediments, Site 1216.
199-1216A-
Core, section, interval (cm):
1H-4,60–62
1H-5,90–92
1H-6,90–92
2H-3,87–89
2H-4,111–113
2H-6,45–47
3H-2,42–44
3H-3,59–61
3H-5,89–91
4H-2,41–43
4H-4,119–121
4H-6,100–102
6H-1,51–53
Depth (mbsf): 5.10 6.90 8.40 13.07 14.81 17.15 20.62 22.29 25.59 30.11 33.89 36.70 40.21
Element:Li (ppm) 36.7 37.0 35.5 28.6 23.9 23.7 19.2 18.6 21.0 41.4 35.8 24.0 19.1 Be (ppm) 2.63 2.07 2.70 2.55 2.30 2.19 2.85 2.08 2.89 2.71 2.44 2.50 2.93 Na (wt%) 3.07 3.04 3.05 3.65 4.14 4.09 4.17 4.08 3.54 3.90 4.17 3.87 3.71 Mg (wt%) 1.70 1.75 1.73 1.46 1.27 1.26 1.26 1.34 1.54 2.36 2.46 2.32 2.22 Al (wt%) 8.71 8.71 8.75 8.46 8.42 8.54 8.00 7.64 6.60 4.64 3.74 3.32 2.93 P (wt%) 0.228 0.226 0.292 0.327 0.404 0.326 0.401 0.349 0.388 0.253 0.239 0.271 0.334 K (wt%) 4.10 4.09 3.98 4.27 4.66 4.69 4.99 4.30 3.10 1.76 1.78 1.82 1.94 Ca (wt%) 0.98 1.00 1.20 1.42 1.50 1.30 1.39 1.40 1.57 1.10 1.02 1.19 1.26 Sc (ppm) 24.9 27.4 27.4 25.0 22.2 21.3 24.1 21.2 21.9 11.2 11.6 11.9 12.3 Ti (wt%) 0.476 0.482 0.485 0.430 0.377 0.362 0.291 0.258 0.253 0.160 0.142 0.147 0.138 V (ppm) 88.6 91.6 95.5 84.6 80.3 78.5 74.6 95.9 165 142 105 83.2 133 Cr (ppm) 72.1 63.7 65.1 46.0 40.7 36.5 39.8 26.2 30.1 31.7 28.8 31.4 32.7 Mn (wt%) 0.95 1.00 1.23 1.28 1.50 1.46 1.73 1.63 1.96 2.41 2.89 3.48 3.33 Fe (wt%) 4.66 4.74 4.82 4.75 4.72 4.67 5.11 6.41 10.5 11.3 11.4 12.7 12.6 Co (ppm) 234 232 264 268 278 258 216 180 174 63 69 72 76 Ni (ppm) 368 383 654 455 396 405 451 390 439 300 364 255 382 Cu (ppm) 417 427 485 400 353 363 386 438 689 844 858 669 769 Zn (ppm) 221 182 192 185 165 169 168 187 257 354 307 287 311 Ga (ppm) 63.0 62.2 59.2 62.5 44.2 45.1 43.1 45.1 45.9 58.4 90.9 104.8 153.4 As (ppm) 12.2 11.5 12.0 12.9 15.0 13.7 15.1 21.0 36.1 26.6 18.3 15.4 22.4 Rb (ppm) 64.0 63.8 59.2 49.3 44.6 42.3 41.0 32.8 25.8 16.7 16.2 17.5 19.7 Sr (ppm) 261 247 258 272 259 245 225 230 258 230 240 325 333 Y (ppm) 110 114 141 135 137 123 157 140 139 79 75 86 98 Zr (ppm) 145 148 158 156 164 154 144 132 166 88 76 69 73 Nb (ppm) 18.6 17.3 16.0 14.8 15.5 13.2 11.9 11.6 9.4 7.0 6.3 4.2 3.5 Mo (ppm) 18.1 18.6 21.9 30.5 31.2 30.5 30.2 36.4 50.4 47.5 29.5 18.3 14.3 Cs (ppm) 7.56 7.49 7.57 5.94 4.56 3.96 4.21 3.10 3.00 2.39 2.14 1.95 2.30 Ba (ppm) 791 775 719 853 575 628 599 678 689 953 1,650 1,890 2,720 La (ppm) 84 91 110 107 104 96 123 110 108 76 67 78 84 Ce (ppm) 156 146 150 147 138 128 123 104 97 61 54 50 49 Pr (ppm) 23.3 25.1 29.8 31.8 30.0 26.4 34.7 33.4 31.5 20.9 20.9 22.4 23.1 Nd (ppm) 87.5 95.1 95.1 113 106 98.5 129 123 119 78.1 78.8 86.3 89.4 Sm (ppm) 20.0 21.5 26.4 27.0 25.4 22.9 29.6 27.9 28.5 15.5 16.4 17.7 18.9 Eu (ppm) 5.98 6.66 7.54 8.20 7.36 6.59 8.86 8.05 8.83 5.47 6.37 7.02 7.84 Gd (ppm) 20.0 21.7 27.3 28.8 29.2 23.5 30.0 27.4 28.1 16.6 17.6 17.9 19.2 Tb (ppm) 4.28 4.69 5.36 5.38 5.37 4.54 5.97 6.05 5.64 3.63 3.49 3.83 4.22 Dy (ppm) 19.2 20.8 23.7 23.3 21.7 20.8 26.1 23.3 24.1 14.2 13.8 14.9 18.2 Ho (ppm) 3.86 4.28 5.01 4.62 5.04 4.10 5.19 4.87 4.97 3.04 3.01 3.50 3.71 Er (ppm) 11.9 12.3 14.1 14.6 15.7 13.5 17.1 15.3 16.5 9.3 8.9 10.1 11.9 Tm (ppm) 1.89 1.75 2.30 2.15 2.28 1.88 2.40 2.18 2.14 1.39 1.25 1.40 1.57 Yb (ppm) 12.2 11.9 15.8 14.5 14.6 13.1 16.7 14.4 13.4 8.9 8.8 10.2 12.1 Lu (ppm) 1.49 1.45 1.85 1.78 1.89 1.58 1.72 1.57 1.46 0.87 0.87 1.09 1.33 Tl (ppm) 1.37 2.56 3.66 1.58 1.17 1.09 1.47 2.39 3.14 2.56 3.81 2.25 2.70 Pb (ppm) 40.4 34.1 37.6 35.7 39.1 37.9 40.2 39.9 56.5 51.6 61.6 73.6 74.9 Th (ppm) 14.7 12.1 11.8 11.1 12.3 11.9 11.3 11.1 7.2 8.3 4.8 3.2 2.3 U (ppm) 2.7 3.3 3.9 7.8 7.7 6.3 6.5 5.2 15.5 6.8 5.8 7.2 7.6