Embed Size (px)
Citation preview

www.bentley.com
AssetWise Operational Analytics Analysis
and ForecastingA Bentley White Paper
Andrew Smith
Manager, Rail Asset Performance Rail and Transit
Published: July 2017
AssetWise Operational Analytics Analysis and Forecasting 2
Abstract
Seldom do railways have the resources to maintain their infrastructure at a level that ensures steady-state performance. Rather, they are faced with prioritizing maintenance actions to optimize safety and reliability under the burden of constrained resources. Given this reality, rail operators are finding the solution to working more efficiently lies in using information technology. By harnessing the vast amount of existing rail corridor data in a prioritized plan, and then assigning the work and monitoring the execution and results with technology applications, many rail operators are doing more with less resources. This strategy, Linear Asset Decision Support, not only results in steady-state asset performance under constrained resources, but can also improve the asset condition and provide a positive return on investment.
This paper details the options for analysis of measurement data within Bentley’s AssetWise Operational Analytics (formerly Optram) application. It focuses on the analysis and forecasting of data trends that enable engineers to make better-informed decisions about maintenance and renewals. The paper also covers the classes of data and issues related to this data.
The Challenge
Managing a rail corridor is typically performed with insufficient information and limited resources. Compounding the problem is a continuous flood of data collected from activities such as track inspections, geometry car surveys, rail defect detectors, ground penetrating radar, rail profile measurements, video surveys, infrared tests, asset surveys, work records, train movement, wayside detectors, and more. Converting this vast, continuous, and varied stream of data into management intelligence that is useful for developing a prioritized plan to optimize maintenance-of-way resources is a significant challenge.
Typical Rail Asset Data
A lack of data relating to a rail asset is rarely an issue for rail operators. Around the world, vehicles measuring multiple aspects of the network routinely collect gigabytes of data. The issue is not “Do we have the data?” but “What do we do with it now that we have it?”
Rail data is often stored in multiple, disparate silos, with little or no ability to view these datasets together.
By harnessing the vast amount of existing rail
corridor data in a prioritized plan, and then assigning the
work and monitoring the execution and results with
technology applications, many railways are doing
more with less resources.
AssetWise Operational Analytics Analysis and Forecasting 3
Data Issues
Rail measurements are also prone to errors of various types:
• Location errors that occur when a feature recorded against the track is in the wrong location. The cause of this is either an inaccurate location system or latency between an accurate location system and the measurement system (or a combination of the two).
• Flat lines, which are often caused by instrument failures or the recording system’s inability to operate at certain speeds.
• Spikes or individual incorrect samples caused by temporary incorrect interpretation of measured data.
• Calibration errors that occur when the data recorded is incorrect because the calibration settings used to convert the raw measurements into usable data are incorrect.
• Filter warm-up errors occur when the first piece of data in a recording (or after a gap within a recording) is not valid because the filters used to derive it take time to generate valid data.
• Environmental issues: sunlight can blind optical systems, and many measurement devices are sensitive to temperature, moisture, or vibration.
• Low speed issues: accelerometers are less accurate at lower speeds, and some instrumentation, such as laser scanners, might need to be set to disable automatically at lower speed for safety reasons.
• Deterioration of instrumentation: the instruments used are measuring in a harsh environment, and are prone to knocks. Optical systems are also prone to becoming dirty or greasy, which reduces the quality of the measurements.
Typical Recordings
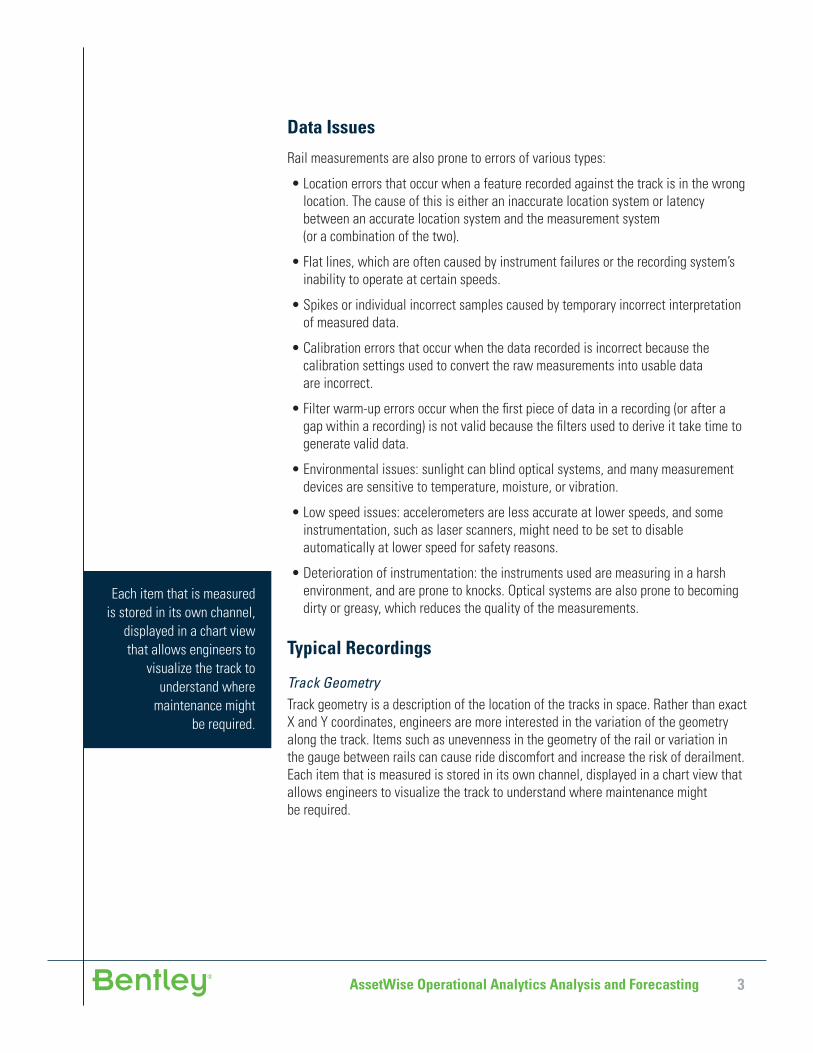
Track GeometryTrack geometry is a description of the location of the tracks in space. Rather than exact X and Y coordinates, engineers are more interested in the variation of the geometry along the track. Items such as unevenness in the geometry of the rail or variation in the gauge between rails can cause ride discomfort and increase the risk of derailment. Each item that is measured is stored in its own channel, displayed in a chart view that allows engineers to visualize the track to understand where maintenance might be required.
Each item that is measured is stored in its own channel,
displayed in a chart view that allows engineers to
visualize the track to understand where
maintenance might be required.
AssetWise Operational Analytics Analysis and Forecasting 4
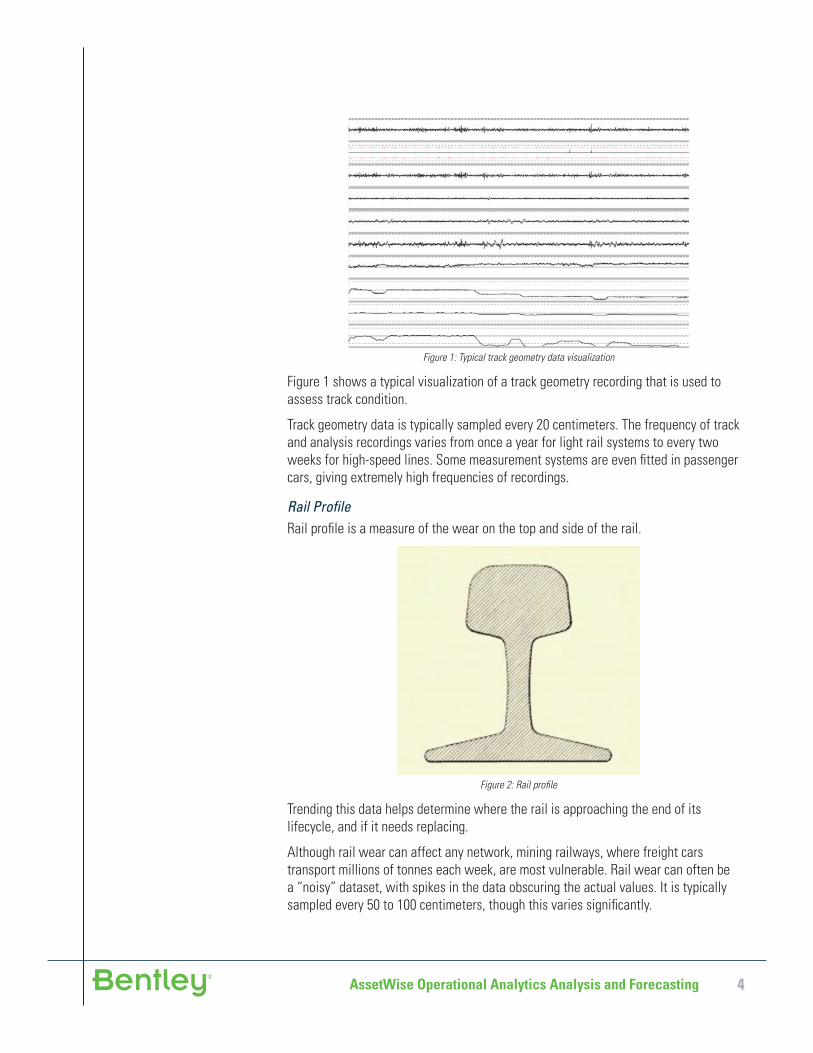
Figure 1: Typical track geometry data visualization
Figure 1 shows a typical visualization of a track geometry recording that is used to assess track condition.
Track geometry data is typically sampled every 20 centimeters. The frequency of track and analysis recordings varies from once a year for light rail systems to every two weeks for high-speed lines. Some measurement systems are even fi tted in passenger cars, giving extremely high frequencies of recordings.
Rail Profi leRail profi le is a measure of the wear on the top and side of the rail.
Figure 2: Rail profi le
Trending this data helps determine where the rail is approaching the end of its lifecycle, and if it needs replacing.
Although rail wear can affect any network, mining railways, where freight cars transport millions of tonnes each week, are most vulnerable. Rail wear can often be a “noisy” dataset, with spikes in the data obscuring the actual values. It is typically sampled every 50 to 100 centimeters, though this varies signifi cantly.
AssetWise Operational Analytics Analysis and Forecasting 5
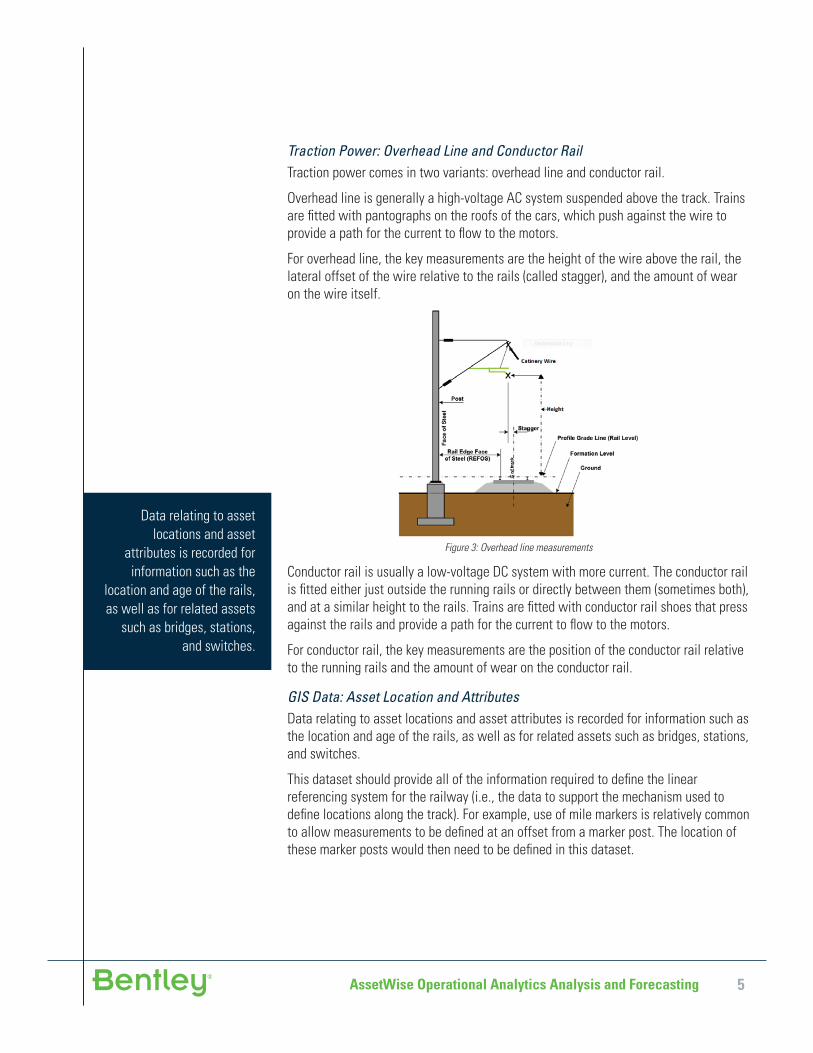
Traction Power: Overhead Line and Conductor RailTraction power comes in two variants: overhead line and conductor rail.
Overhead line is generally a high-voltage AC system suspended above the track. Trains are fi tted with pantographs on the roofs of the cars, which push against the wire to provide a path for the current to fl ow to the motors.
For overhead line, the key measurements are the height of the wire above the rail, the lateral offset of the wire relative to the rails (called stagger), and the amount of wear on the wire itself.
Figure 3: Overhead line measurements
Conductor rail is usually a low-voltage DC system with more current. The conductor rail is fi tted either just outside the running rails or directly between them (sometimes both), and at a similar height to the rails. Trains are fi tted with conductor rail shoes that press against the rails and provide a path for the current to fl ow to the motors.
For conductor rail, the key measurements are the position of the conductor rail relative to the running rails and the amount of wear on the conductor rail.
GIS Data: Asset Location and AttributesData relating to asset locations and asset attributes is recorded for information such as the location and age of the rails, as well as for related assets such as bridges, stations, and switches.
This dataset should provide all of the information required to defi ne the linear referencing system for the railway (i.e., the data to support the mechanism used to defi ne locations along the track). For example, use of mile markers is relatively common to allow measurements to be defi ned at an offset from a marker post. The location of these marker posts would then need to be defi ned in this dataset.
Data relating to asset locations and asset
attributes is recorded for information such as the
location and age of the rails, as well as for related assets
such as bridges, stations, and switches.
AssetWise Operational Analytics Analysis and Forecasting 6
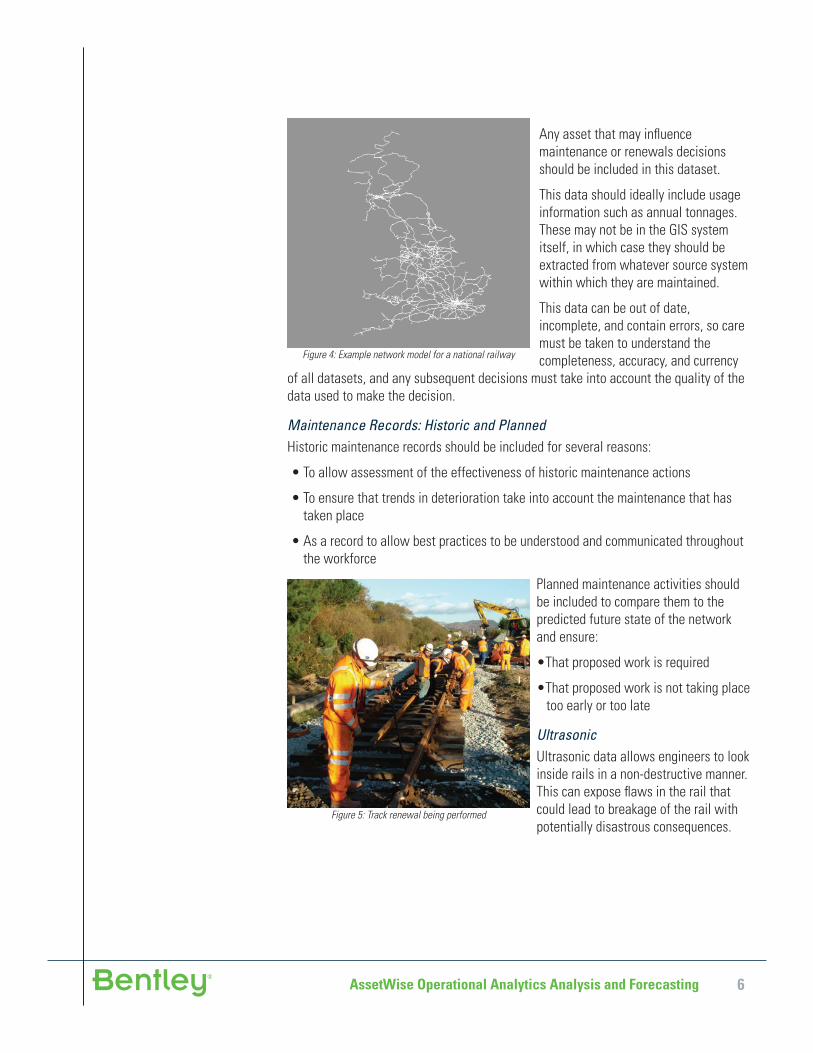
Figure 4: Example network model for a national railway
Any asset that may infl uence maintenance or renewals decisions should be included in this dataset.
This data should ideally include usage information such as annual tonnages. These may not be in the GIS system itself, in which case they should be extracted from whatever source system within which they are maintained.
This data can be out of date, incomplete, and contain errors, so care must be taken to understand the completeness, accuracy, and currency
of all datasets, and any subsequent decisions must take into account the quality of the data used to make the decision.
Maintenance Records: Historic and PlannedHistoric maintenance records should be included for several reasons:
• To allow assessment of the effectiveness of historic maintenance actions
• To ensure that trends in deterioration take into account the maintenance that has taken place
• As a record to allow best practices to be understood and communicated throughout the workforce
Figure 5: Track renewal being performed
Planned maintenance activities should be included to compare them to the predicted future state of the network and ensure:
•That proposed work is required
•That proposed work is not taking place too early or too late
UltrasonicUltrasonic data allows engineers to look inside rails in a non-destructive manner. This can expose fl aws in the rail that could lead to breakage of the rail with potentially disastrous consequences.
AssetWise Operational Analytics Analysis and Forecasting 7
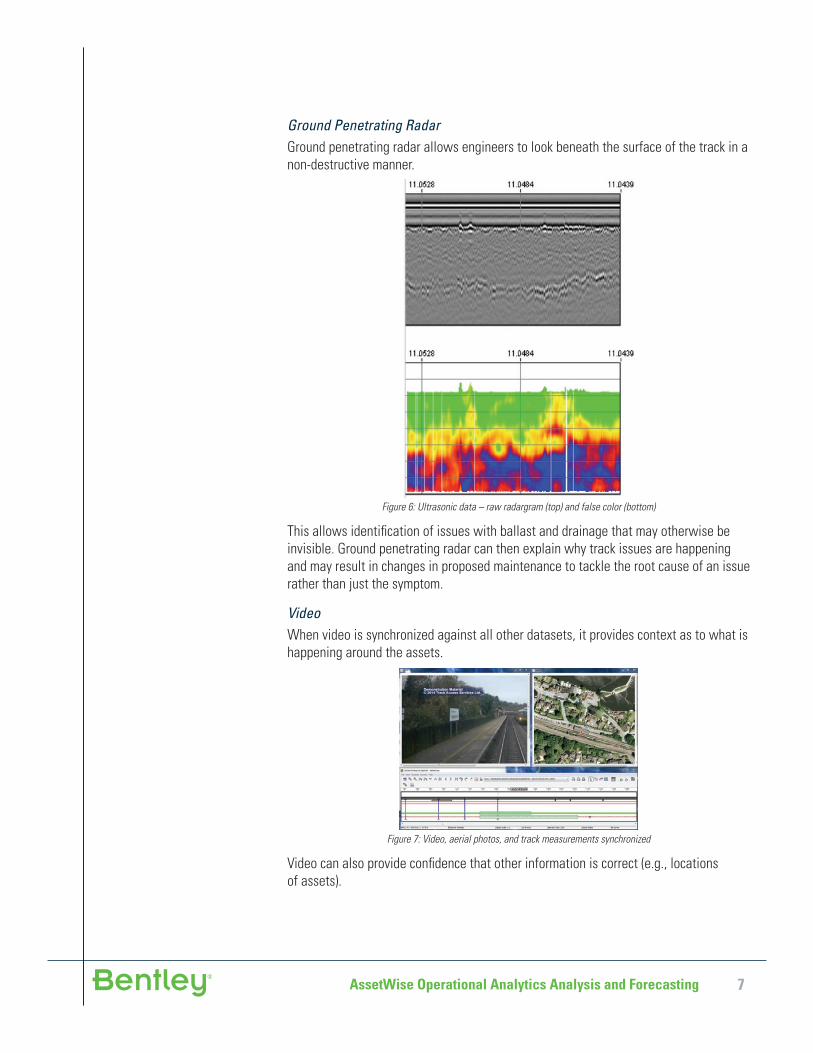
Ground Penetrating RadarGround penetrating radar allows engineers to look beneath the surface of the track in a non-destructive manner.
Figure 6: Ultrasonic data – raw radargram (top) and false color (bottom)
This allows identifi cation of issues with ballast and drainage that may otherwise be invisible. Ground penetrating radar can then explain why track issues are happening and may result in changes in proposed maintenance to tackle the root cause of an issue rather than just the symptom.
VideoWhen video is synchronized against all other datasets, it provides context as to what is happening around the assets.
Figure 7: Video, aerial photos, and track measurements synchronized
Video can also provide confi dence that other information is correct (e.g., locations of assets).
AssetWise Operational Analytics Analysis and Forecasting 8
Typical Forms of Analysis
There are a number of standard forms of analysis. While the details may vary according to vehicle types, line speeds, and units used, the principals are constant for most rail networks. This section covers typical forms of analysis and potential resolutions within AssetWise.
AssetWise contains a powerful and highly fl exible analytical engine, based upon user confi gured analysis scripts. Any datasets that AssetWise has access to can be com-bined and analyzed using sequences of analysis commands from a list of hundreds of commands. Users can also customize this list of commands, and add new commands to perform highly specialized functions or to communicate directly with custom systems.
AlignmentAs mentioned previously, measurement data suffers from a number of issues that can prevent optimal decision making. One of the key issues is the accuracy and reproducibility of the location system used with the measurement system.
For rail measurement data, accuracy and reproducibility are defi ned as follows:
• Accuracy: How well can the location be identifi ed in the real world? For example, if a broken rail is reported at kilometer 20 along a route, how close to kilometer 20 is the actual broken rail?
• Reproducibility: If the same feature is recorded multiple times, how close together are they reported? For example, if a broken rail is reported at kilometer post 30 in one recording, how close to kilometer post 30 is the same report in all previous recordings?
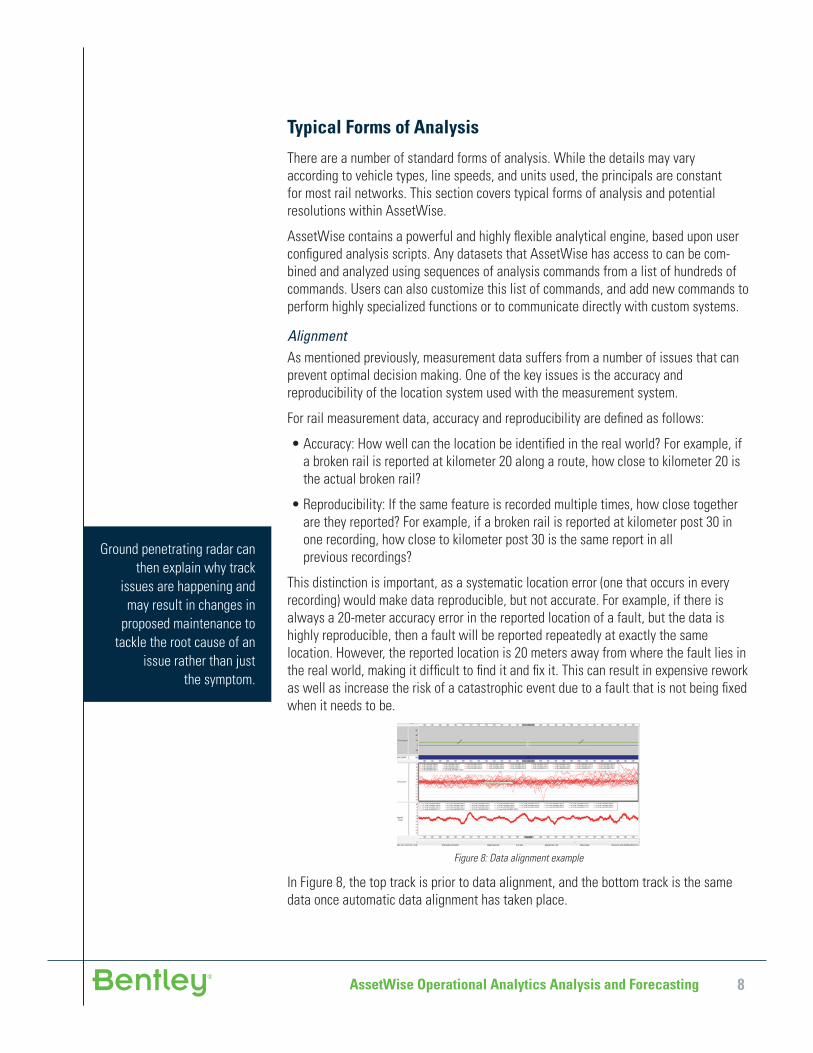
This distinction is important, as a systematic location error (one that occurs in every recording) would make data reproducible, but not accurate. For example, if there is always a 20-meter accuracy error in the reported location of a fault, but the data is highly reproducible, then a fault will be reported repeatedly at exactly the same location. However, the reported location is 20 meters away from where the fault lies in the real world, making it diffi cult to fi nd it and fi x it. This can result in expensive rework as well as increase the risk of a catastrophic event due to a fault that is not being fi xed when it needs to be.
Figure 8: Data alignment example
In Figure 8, the top track is prior to data alignment, and the bottom track is the same data once automatic data alignment has taken place.
Ground penetrating radar can then explain why track
issues are happening and may result in changes in
proposed maintenance to tackle the root cause of an
issue rather than just the symptom.
AssetWise Operational Analytics Analysis and Forecasting 9
AssetWise resolved data location issues by tackling accuracy and reproducibility separately.
• Accuracy
A nominated dataset (usually the most recent) is processed to align it to the real world. This can be done through a number of mechanisms, but the most common is to derive a curvature diagram for the route taken by the recording vehicle, and align the curvature from the measurements against this. The result is a set of corrections that need to be applied to align the recorded curvature with the surveyed curvature.
These corrections are then applied to another channel of measurement data – normally a short wavelength dataset such as top or gauge, and the resulting data saved as a location baseline. This baseline is the best-endeavors alignment of recorded data against the real world.
• Reproducibility
Once a baseline has been created, all other recordings are aligned against it. This is performed by running comparisons along the entire length of the survey, and determining how much the survey needs to be moved at each point to ensure it aligns with the baseline. It is important to note that this process is not simply a single shift of the survey, as the location error between the two surveys is likely to drift over time. Experience in AssetWise shows that corrections must be applied every 100 to 200 meters along the survey, and that errors in location can often be +/- 100 meters.
Data alignment is a critical step in data cleansing, as a track quality index can be very sensitive to location errors. When data is trended to predict track failure, it is important to ensure that any trend observed is due to track deterioration and not location errors or instrumentation issues.
Data Cleansing and ValidationAs noted previously, data can suffer from numerous issues. The most common of these are spikes and flat lines. Both can be relatively easy to handle provided that care is taken not to remove valid data.
• Spikes
These are individual samples with an incorrect value. While the initial thought may be simply to strip them out, extreme care must be taken to ensure that the sample is not valid before this is done. Stripping out real indicators of potential catastrophic failures leads to the incorrect assumption that the asset is in a good state of repair.
Some channels of data can only change at a certain rate (e.g., gauge), so a review of the rate of change of the channel can be used to identify invalid data and remove it. Some channels have absolute values above which there cannot be real measurements, so these can be used to mask out invalid samples. Beyond that, a detailed review of what is and is not in the channel must be undertaken to see how best to identify spikes. If there is any doubt, then the feature should be left in the dataset so that an engineer can assess it.
Any datasets that AssetWise has access to
can be combined and analyzed using sequences of
analysis commands from a list of hundreds
of commands.
AssetWise Operational Analytics Analysis and Forecasting 10
• Flat lines
Flat lines occur when a channel has exactly the same value for a number of samples. The most common value is 0, although other values are possible. Each channel must be assessed to determine the length of track above which identical samples become so unrealistic as to indicate an instrumentation fault. This is a lower risk procedure than spike removal, as the flat line is normally within the permitted tolerance for the channel. Typically, more than 20 samples with exactly the same value is an indication of an issue in geometry, but some channels on high quality track may show this characteristic validly.
It is also possible that a digital word has been delivered with the measurement data, which can be used to identify hardware issues that would cause flat lines in data. In this case, these should be masked out from the digital word directly, as this is a more reliable measure of the status of the instrumentation.
In both the case of spikes and flat lines, the original data should be saved, and a copy of the data created with the cleansing and location corrections. This allows for an audit trail from the derived data back to the as-delivered data, which may be required if it becomes necessary to audit the workflow associated with any decision based upon delivered data.
SegmentationSegmentation is the logical “cutting up” of the track network into lengths of track that can be analyzed separately. This is done for a number of reasons:
• To group together similar lengths of track
• Some channels require a calculation of the variance of the channel over a length to derive a track quality index
• To visualize track condition more easily
• To report maintenance requirements in manageable lengths of track
Segments are normally chosen based on what they need to represent and how they are going to be calculated.
Segments have attributes associated with them. For example, a segment representing line speeds would have an attribute that contained the value of the line speed for each seg-ment. A segment representing track quality would have an attribute representing the track quality index for the segment, and probably would also contain the thresholds for permitted values of the quality index and whether they have been broken as other attributes.
Common examples of segmentations are:• Regular lengths of 100 to 200 meters for use in deriving and representing track
quality indexes from track geometry (note that for a high-speed line a longer length may be required)
• Segments representing straights, transitions, and curves for rail wear calculations, especially on networks with very high tonnages
• Segments representing areas with the same track type or line speed. This is used in particular when thresholds for permitted qualities vary with these values
AssetWise Operational Analytics Analysis and Forecasting 11
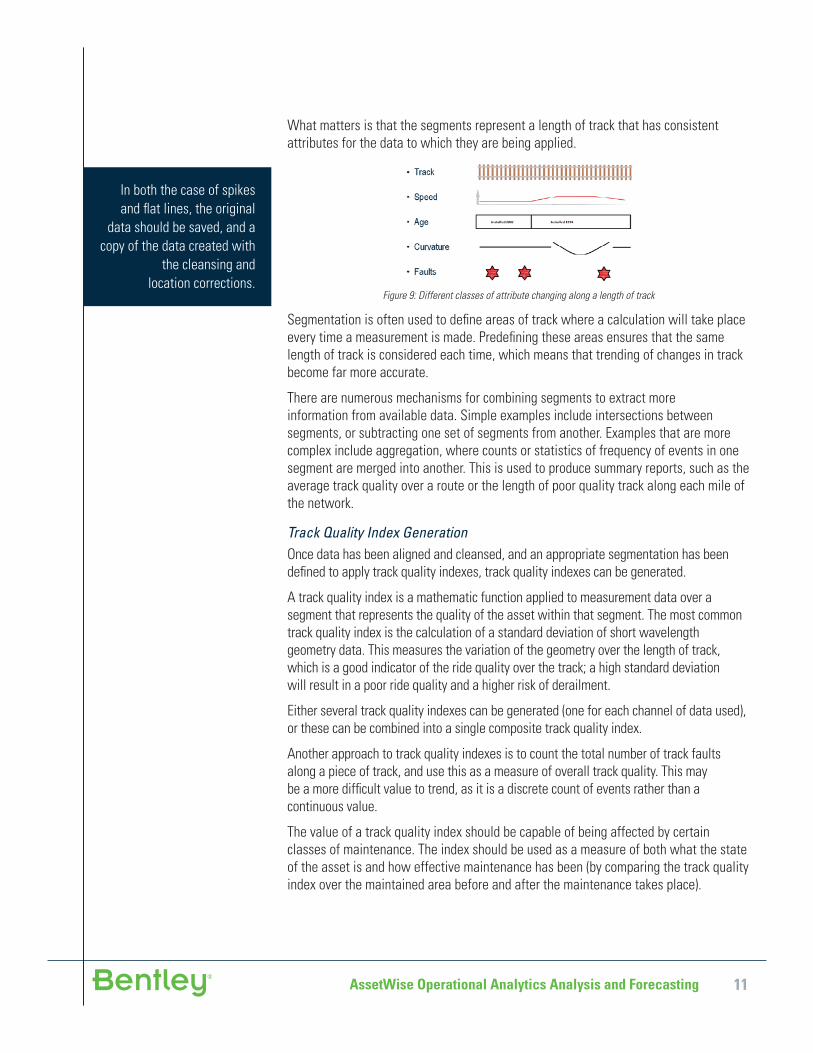
What matters is that the segments represent a length of track that has consistent attributes for the data to which they are being applied.
Figure 9: Different classes of attribute changing along a length of track
Segmentation is often used to defi ne areas of track where a calculation will take place every time a measurement is made. Predefi ning these areas ensures that the same length of track is considered each time, which means that trending of changes in track become far more accurate.
There are numerous mechanisms for combining segments to extract more information from available data. Simple examples include intersections between segments, or subtracting one set of segments from another. Examples that are more complex include aggregation, where counts or statistics of frequency of events in one segment are merged into another. This is used to produce summary reports, such as the average track quality over a route or the length of poor quality track along each mile of the network.
Track Quality Index GenerationOnce data has been aligned and cleansed, and an appropriate segmentation has been defi ned to apply track quality indexes, track quality indexes can be generated.
A track quality index is a mathematic function applied to measurement data over a segment that represents the quality of the asset within that segment. The most common track quality index is the calculation of a standard deviation of short wavelength geometry data. This measures the variation of the geometry over the length of track, which is a good indicator of the ride quality over the track; a high standard deviation will result in a poor ride quality and a higher risk of derailment.
Either several track quality indexes can be generated (one for each channel of data used), or these can be combined into a single composite track quality index.
Another approach to track quality indexes is to count the total number of track faults along a piece of track, and use this as a measure of overall track quality. This may be a more diffi cult value to trend, as it is a discrete count of events rather than a continuous value.
The value of a track quality index should be capable of being affected by certain classes of maintenance. The index should be used as a measure of both what the state of the asset is and how effective maintenance has been (by comparing the track quality index over the maintained area before and after the maintenance takes place).
In both the case of spikes and fl at lines, the original
data should be saved, and a copy of the data created with
the cleansing and location corrections.
AssetWise Operational Analytics Analysis and Forecasting 12
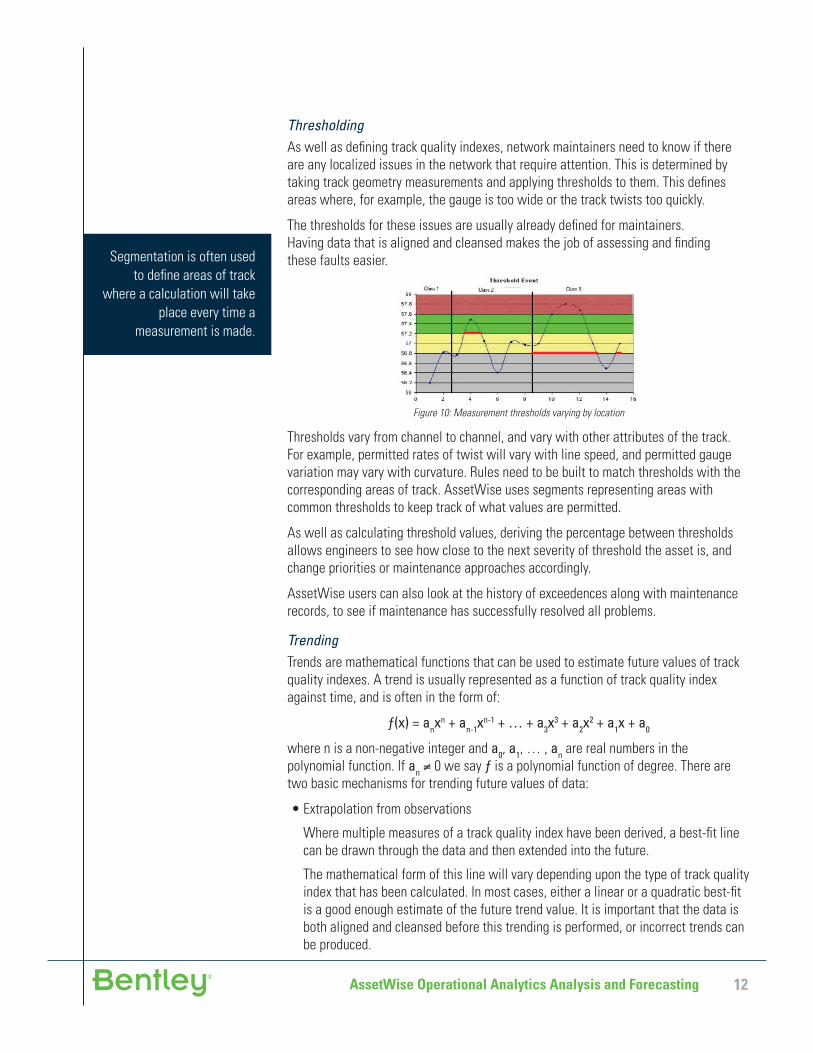
ThresholdingAs well as defi ning track quality indexes, network maintainers need to know if there are any localized issues in the network that require attention. This is determined by taking track geometry measurements and applying thresholds to them. This defi nes areas where, for example, the gauge is too wide or the track twists too quickly.
The thresholds for these issues are usually already defi ned for maintainers. Having data that is aligned and cleansed makes the job of assessing and fi nding these faults easier.
Figure 10: Measurement thresholds varying by location
Thresholds vary from channel to channel, and vary with other attributes of the track. For example, permitted rates of twist will vary with line speed, and permitted gauge variation may vary with curvature. Rules need to be built to match thresholds with the corresponding areas of track. AssetWise uses segments representing areas with common thresholds to keep track of what values are permitted.
As well as calculating threshold values, deriving the percentage between thresholds allows engineers to see how close to the next severity of threshold the asset is, and change priorities or maintenance approaches accordingly.
AssetWise users can also look at the history of exceedences along with maintenance records, to see if maintenance has successfully resolved all problems.
TrendingTrends are mathematical functions that can be used to estimate future values of track quality indexes. A trend is usually represented as a function of track quality index against time, and is often in the form of:
ƒ(x) = anxn + an-1x
n-1 + … + a3x3 + a2x
2 + a1x + a0
where n is a non-negative integer and a0, a1, … , an are real numbers in the polynomial function. If an ≠ 0 we say ƒ is a polynomial function of degree. There are two basic mechanisms for trending future values of data:
• Extrapolation from observations
Where multiple measures of a track quality index have been derived, a best-fi t line can be drawn through the data and then extended into the future.
The mathematical form of this line will vary depending upon the type of track quality index that has been calculated. In most cases, either a linear or a quadratic best-fi t is a good enough estimate of the future trend value. It is important that the data is both aligned and cleansed before this trending is performed, or incorrect trends can be produced.
Segmentation is often used to defi ne areas of track
where a calculation will take place every time a
measurement is made.
AssetWise Operational Analytics Analysis and Forecasting 13
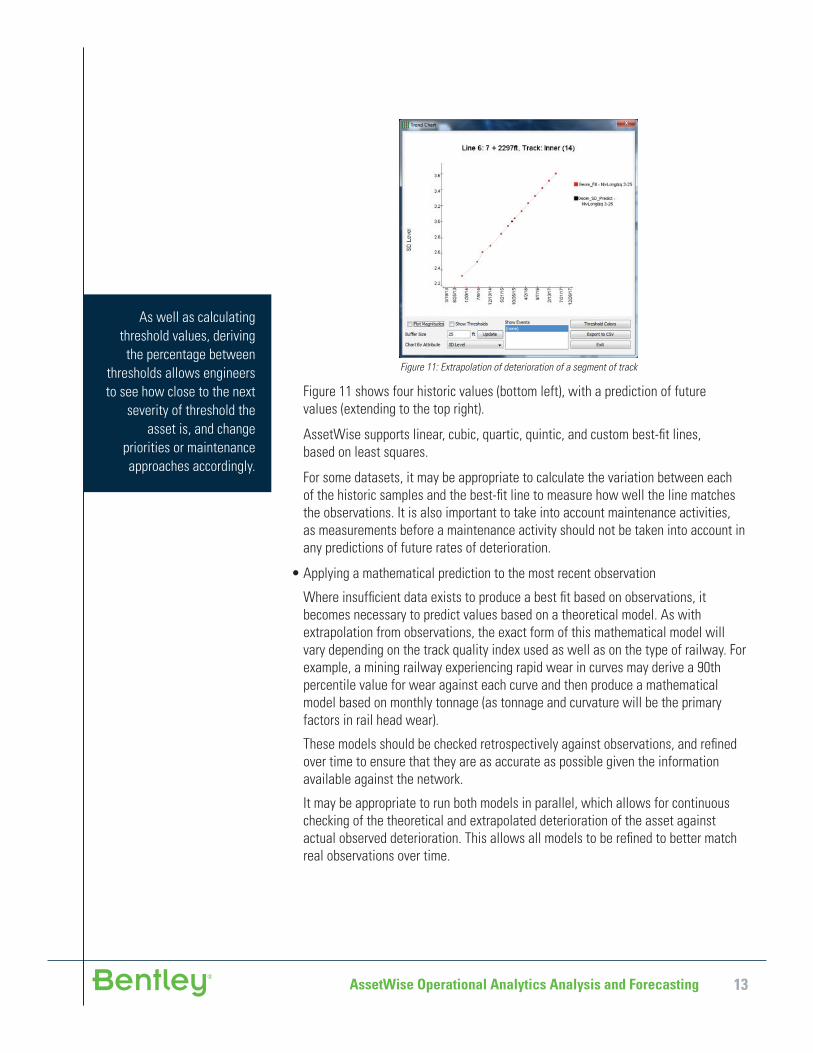
Figure 11: Extrapolation of deterioration of a segment of track
Figure 11 shows four historic values (bottom left), with a prediction of future values (extending to the top right).
AssetWise supports linear, cubic, quartic, quintic, and custom best-fi t lines, based on least squares.
For some datasets, it may be appropriate to calculate the variation between each of the historic samples and the best-fi t line to measure how well the line matches the observations. It is also important to take into account maintenance activities, as measurements before a maintenance activity should not be taken into account in any predictions of future rates of deterioration.
• Applying a mathematical prediction to the most recent observation
Where insuffi cient data exists to produce a best fi t based on observations, it becomes necessary to predict values based on a theoretical model. As with extrapolation from observations, the exact form of this mathematical model will vary depending on the track quality index used as well as on the type of railway. For example, a mining railway experiencing rapid wear in curves may derive a 90th percentile value for wear against each curve and then produce a mathematical model based on monthly tonnage (as tonnage and curvature will be the primary factors in rail head wear).
These models should be checked retrospectively against observations, and refi ned over time to ensure that they are as accurate as possible given the information available against the network.
It may be appropriate to run both models in parallel, which allows for continuous checking of the theoretical and extrapolated deterioration of the asset against actual observed deterioration. This allows all models to be refi ned to better match real observations over time.
As well as calculating threshold values, deriving
the percentage between thresholds allows engineers to see how close to the next
severity of threshold the asset is, and change
priorities or maintenance approaches accordingly.
AssetWise Operational Analytics Analysis and Forecasting 14
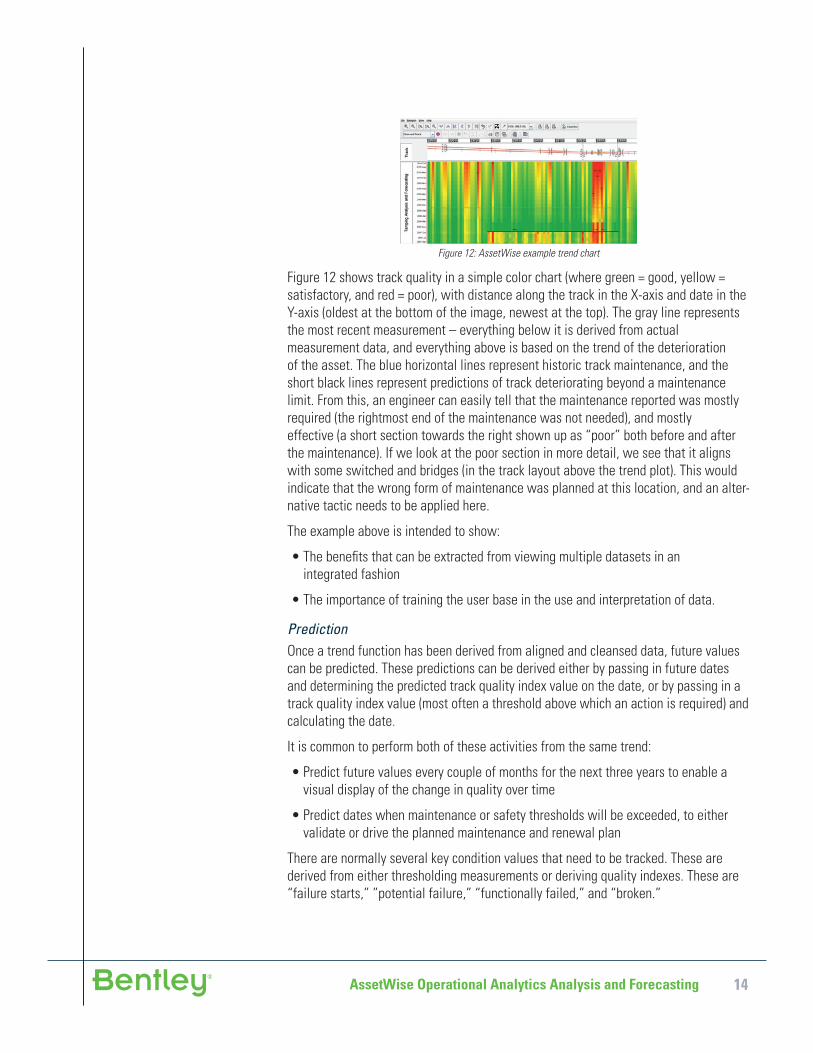
Figure 12: AssetWise example trend chart
Figure 12 shows track quality in a simple color chart (where green = good, yellow = satisfactory, and red = poor), with distance along the track in the X-axis and date in the Y-axis (oldest at the bottom of the image, newest at the top). The gray line represents the most recent measurement – everything below it is derived from actual measurement data, and everything above is based on the trend of the deterioration of the asset. The blue horizontal lines represent historic track maintenance, and the short black lines represent predictions of track deteriorating beyond a maintenance limit. From this, an engineer can easily tell that the maintenance reported was mostly required (the rightmost end of the maintenance was not needed), and mostly effective (a short section towards the right shown up as “poor” both before and after the maintenance). If we look at the poor section in more detail, we see that it aligns with some switched and bridges (in the track layout above the trend plot). This would indicate that the wrong form of maintenance was planned at this location, and an alter-native tactic needs to be applied here.
The example above is intended to show:
• The benefi ts that can be extracted from viewing multiple datasets in an integrated fashion
• The importance of training the user base in the use and interpretation of data.
PredictionOnce a trend function has been derived from aligned and cleansed data, future values can be predicted. These predictions can be derived either by passing in future dates and determining the predicted track quality index value on the date, or by passing in a track quality index value (most often a threshold above which an action is required) and calculating the date.
It is common to perform both of these activities from the same trend:
• Predict future values every couple of months for the next three years to enable a visual display of the change in quality over time
• Predict dates when maintenance or safety thresholds will be exceeded, to either validate or drive the planned maintenance and renewal plan
There are normally several key condition values that need to be tracked. These are derived from either thresholding measurements or deriving quality indexes. These are “failure starts,” ”potential failure,” “functionally failed,” and “broken.”
AssetWise Operational Analytics Analysis and Forecasting 15
The most severe status is “broken.” This means that the asset is unusable, and cannot be used in service at all until it has been repaired or replaced. This is the status that we don’t want to see in measurements.
Before “broken,” there is a “functionally failed” status. In this state, the asset is no longer capable of performing its intended function. The asset may still be usable, but in a reduced capacity (e.g., you can run trains over it at reduced speed). We should be working to ensure that all maintenance activities are completed before an asset deteriorates to this state.
Before “functionally failed,” there is a “potential failure” status. This is the date of “functionally failed” also taking into account the time to plan, schedule, and execute the required remedial action. This gives us the date by which we need to raise an alarm that work will be needed in the future. If we raise the alarm after this point, then there is insuffi cient time to resolve the issue before functional failure occurs.
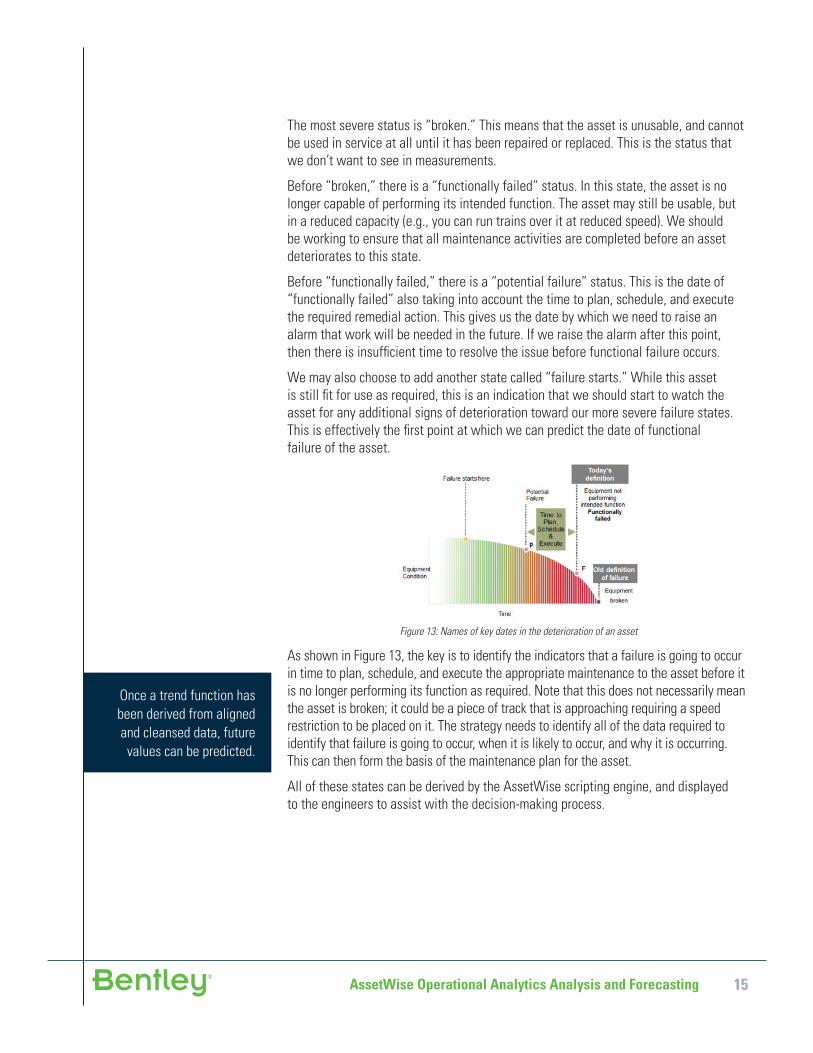
We may also choose to add another state called “failure starts.” While this asset is still fi t for use as required, this is an indication that we should start to watch the asset for any additional signs of deterioration toward our more severe failure states. This is effectively the fi rst point at which we can predict the date of functional failure of the asset.
Figure 13: Names of key dates in the deterioration of an asset
As shown in Figure 13, the key is to identify the indicators that a failure is going to occur in time to plan, schedule, and execute the appropriate maintenance to the asset before it is no longer performing its function as required. Note that this does not necessarily mean the asset is broken; it could be a piece of track that is approaching requiring a speed restriction to be placed on it. The strategy needs to identify all of the data required to identify that failure is going to occur, when it is likely to occur, and why it is occurring. This can then form the basis of the maintenance plan for the asset.
All of these states can be derived by the AssetWise scripting engine, and displayed to the engineers to assist with the decision-making process.
Once a trend function has been derived from aligned and cleansed data, future
values can be predicted.

AssetWise Operational Analytics Analysis and Forecasting 16
Other Uses for Data Measurement
AggregationAssetWise aggregation capabilities can be used to create summaries of any data that is within the AssetWise system.
For example, if a system contains measurement data and maintenance records, then these can be combined and aggregated to determine how effective and effi cient maintenance activities are.
Figure 14: Aggregation of track geometry before and after work, to assess work productivity
First, the measurement data is analyzed to identify areas where track quality has improved. This can then be compared automatically to areas where maintenance has been reported. These two datasets can then be aggregated to determine:
• Productive maintenance: areas where work was reported and improvement was detected
• Unreported: areas where work was not reported but an improvement was detected
• Unproductive maintenance: areas where work was reported but no improvement was detected
This gives a good indication of the effectiveness of work performed along the line. This data could be further combined with work type and crew information to determine percentage effectiveness by work crew or work type, allowing best practices to be identifi ed and communicated and improvements to be objectively measured and reported.
Aggregation is a highly fl exible mechanism to produce high-level summaries of data within an AssetWise system.
Validation of Maintenance EffectivenessIf AssetWise contains maintenance records and measurements of asset condition before and after the maintenance, then it can be used to derive the effectiveness of the maintenance.
Asset deterioration typically looks like a “saw-tooth” diagram (see Figure 15), where the asset condition (Y-axis, where higher values equals worse condition) deteriorates over time (X-axis, most recent date to the right).
AssetWise Operational Analytics Analysis and Forecasting 17
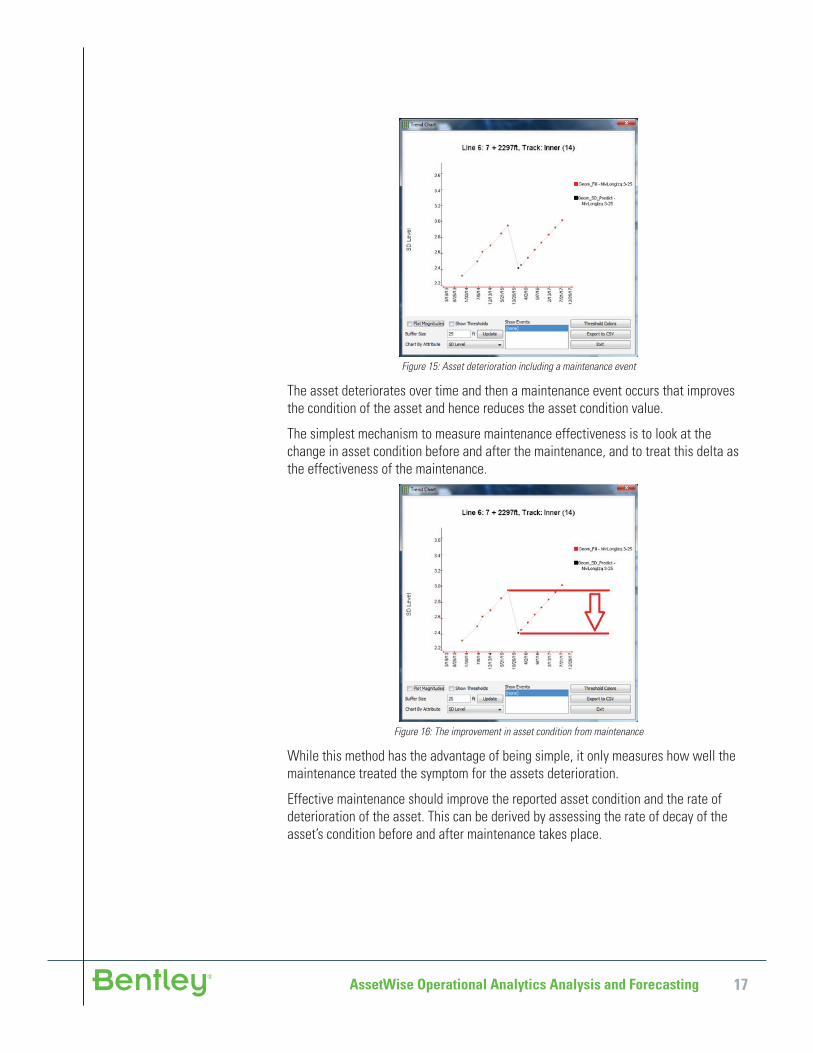
Figure 15: Asset deterioration including a maintenance event
The asset deteriorates over time and then a maintenance event occurs that improves the condition of the asset and hence reduces the asset condition value.
The simplest mechanism to measure maintenance effectiveness is to look at the change in asset condition before and after the maintenance, and to treat this delta as the effectiveness of the maintenance.
Figure 16: The improvement in asset condition from maintenance
While this method has the advantage of being simple, it only measures how well the maintenance treated the symptom for the assets deterioration.
Effective maintenance should improve the reported asset condition and the rate of deterioration of the asset. This can be derived by assessing the rate of decay of the asset’s condition before and after maintenance takes place.
AssetWise Operational Analytics Analysis and Forecasting 18
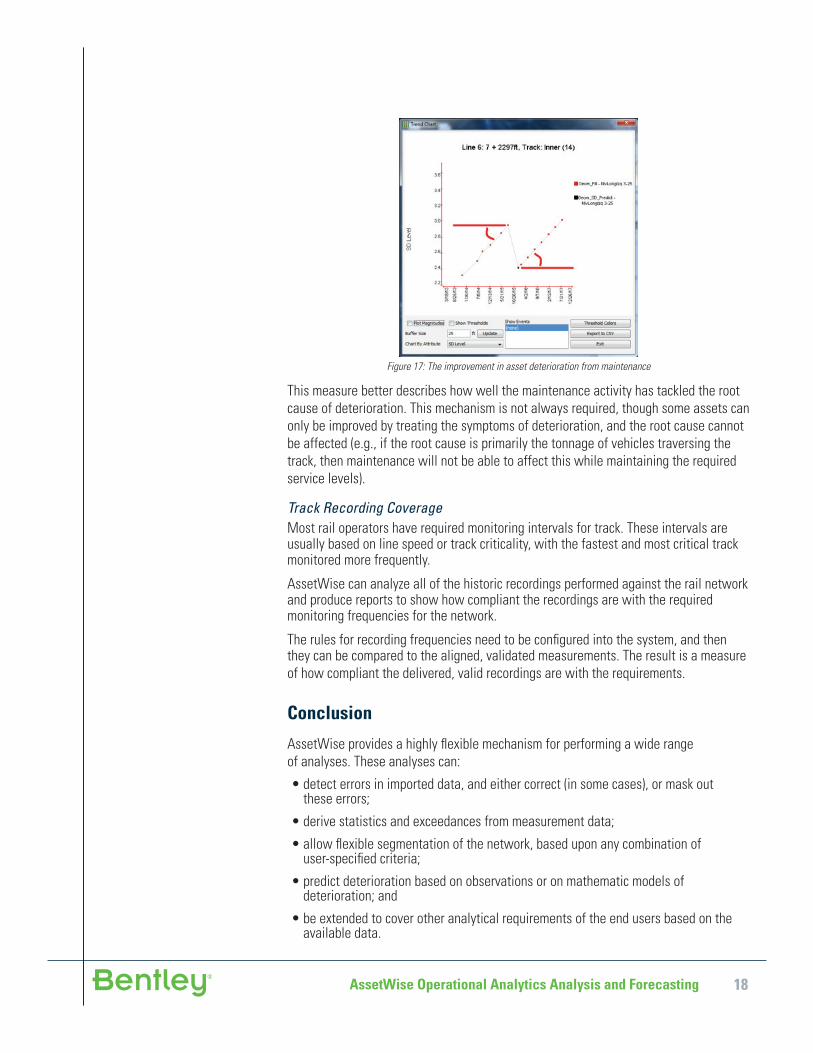
Figure 17: The improvement in asset deterioration from maintenance
This measure better describes how well the maintenance activity has tackled the root cause of deterioration. This mechanism is not always required, though some assets can only be improved by treating the symptoms of deterioration, and the root cause cannot be affected (e.g., if the root cause is primarily the tonnage of vehicles traversing the track, then maintenance will not be able to affect this while maintaining the required service levels).
Track Recording CoverageMost rail operators have required monitoring intervals for track. These intervals are usually based on line speed or track criticality, with the fastest and most critical track monitored more frequently.
AssetWise can analyze all of the historic recordings performed against the rail network and produce reports to show how compliant the recordings are with the required monitoring frequencies for the network.
The rules for recording frequencies need to be confi gured into the system, and then they can be compared to the aligned, validated measurements. The result is a measure of how compliant the delivered, valid recordings are with the requirements.
Conclusion
AssetWise provides a highly fl exible mechanism for performing a wide range of analyses. These analyses can:
• detect errors in imported data, and either correct (in some cases), or mask out these errors;
• derive statistics and exceedances from measurement data;
• allow fl exible segmentation of the network, based upon any combination of user-specifi ed criteria;
• predict deterioration based on observations or on mathematic models of deterioration; and
• be extended to cover other analytical requirements of the end users based on the available data.
AssetWise Operational Analytics Analysis and Forecasting 19
With the fl exible analytical capabilities in AssetWise, end users can create and implement new forms of analysis without changing the underlying software. Any changes to group standards or working practices can be refl ected in AssetWise simply by updating the analysis scripts to apply the new processes.
The analytical capabilities in AssetWise enable users to make more informed decisions about linear asset maintenance due to the availability of higher quality information, and more accurate assessments of historic decisions that enable further improvements in processes and effi ciency – saving time and reducing costs without sacrifi cing safety.
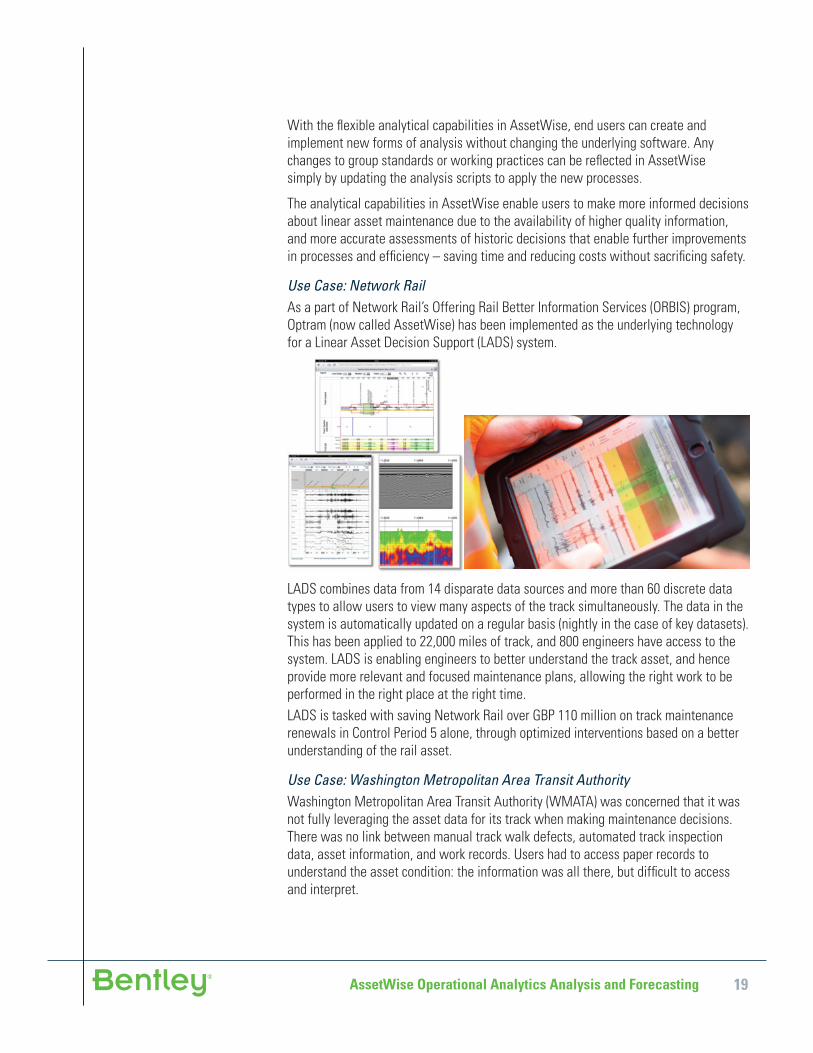
Use Case: Network RailAs a part of Network Rail’s Offering Rail Better Information Services (ORBIS) program, Optram (now called AssetWise) has been implemented as the underlying technology for a Linear Asset Decision Support (LADS) system.
LADS combines data from 14 disparate data sources and more than 60 discrete data types to allow users to view many aspects of the track simultaneously. The data in the system is automatically updated on a regular basis (nightly in the case of key datasets). This has been applied to 22,000 miles of track, and 800 engineers have access to the system. LADS is enabling engineers to better understand the track asset, and hence provide more relevant and focused maintenance plans, allowing the right work to be performed in the right place at the right time.LADS is tasked with saving Network Rail over GBP 110 million on track maintenance renewals in Control Period 5 alone, through optimized interventions based on a better understanding of the rail asset.
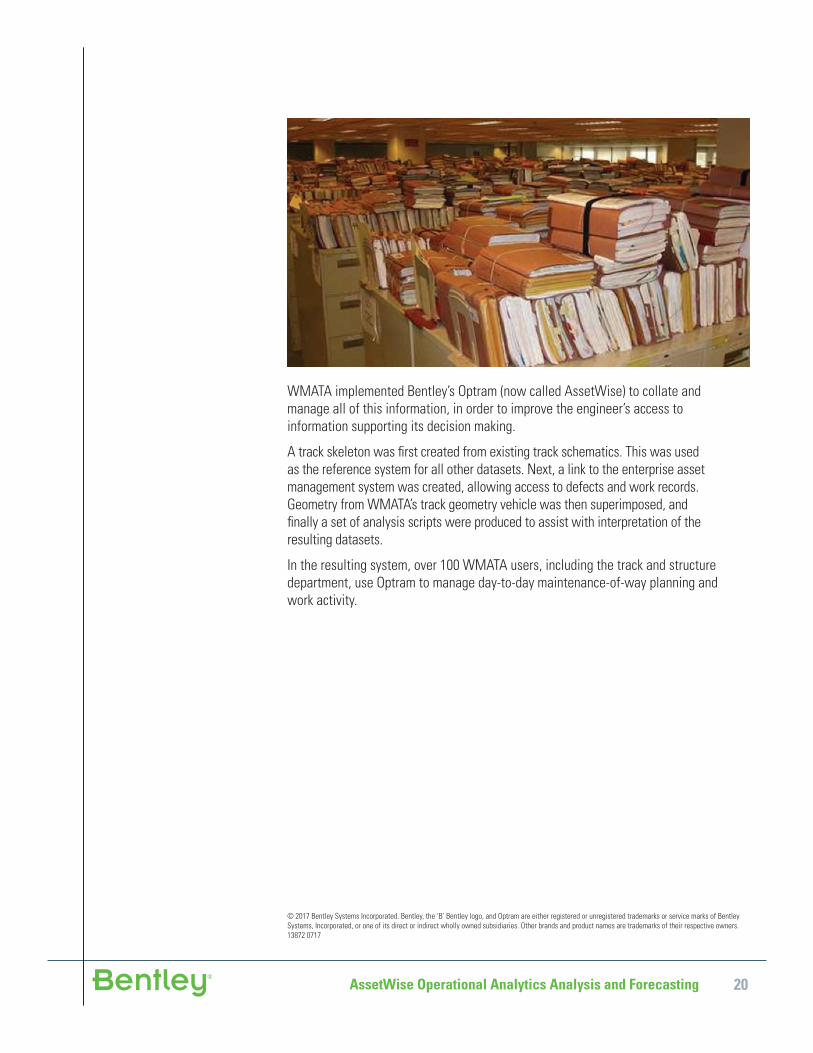
Use Case: Washington Metropolitan Area Transit AuthorityWashington Metropolitan Area Transit Authority (WMATA) was concerned that it was not fully leveraging the asset data for its track when making maintenance decisions. There was no link between manual track walk defects, automated track inspection data, asset information, and work records. Users had to access paper records to understand the asset condition: the information was all there, but diffi cult to access and interpret.
20AssetWise Operational Analytics Analysis and Forecasting
© 2017 Bentley Systems Incorporated. Bentley, the ‘B’ Bentley logo, and Optram are either registered or unregistered trademarks or service marks of Bentley Systems, Incorporated, or one of its direct or indirect wholly owned subsidiaries. Other brands and product names are trademarks of their respective owners. 13872 0717
WMATA implemented Bentley’s Optram (now called AssetWise) to collate and manage all of this information, in order to improve the engineer’s access to information supporting its decision making.
A track skeleton was fi rst created from existing track schematics. This was used as the reference system for all other datasets. Next, a link to the enterprise asset management system was created, allowing access to defects and work records. Geometry from WMATA’s track geometry vehicle was then superimposed, and fi nally a set of analysis scripts were produced to assist with interpretation of the resulting datasets.
In the resulting system, over 100 WMATA users, including the track and structure department, use Optram to manage day-to-day maintenance-of-way planning and work activity.