Embed Size (px)
Citation preview
1
13.4 CHANGES IN THE PRODUCTIVITY OF THE WARM RAIN PROCESS IN DEEP vvvvvvvvvvvCONVECTIVE CLOUDS RESULTING FROM REGIONAL CLIMATE CHANGE
OVER THE CONTINENTAL U.S.
Cecille M. Villanueva-Birriel and Sonia Lasher-Trapp Department of Earth and Atmospheric Sciences, Purdue University, West Lafayette, Indiana
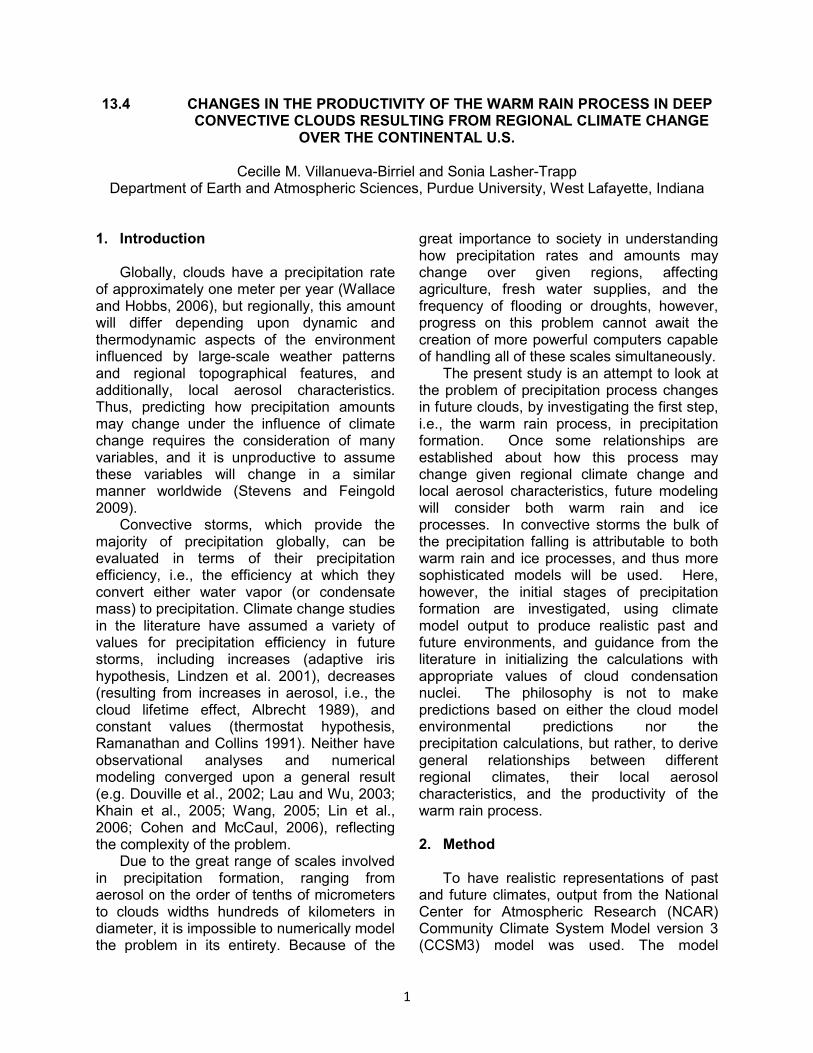
1. Introduction
Globally, clouds have a precipitation rate
of approximately one meter per year (Wallace and Hobbs, 2006), but regionally, this amount will differ depending upon dynamic and thermodynamic aspects of the environment influenced by large-scale weather patterns and regional topographical features, and additionally, local aerosol characteristics. Thus, predicting how precipitation amounts may change under the influence of climate change requires the consideration of many variables, and it is unproductive to assume these variables will change in a similar manner worldwide (Stevens and Feingold 2009).
Convective storms, which provide the majority of precipitation globally, can be evaluated in terms of their precipitation efficiency, i.e., the efficiency at which they convert either water vapor (or condensate mass) to precipitation. Climate change studies in the literature have assumed a variety of values for precipitation efficiency in future storms, including increases (adaptive iris hypothesis, Lindzen et al. 2001), decreases (resulting from increases in aerosol, i.e., the cloud lifetime effect, Albrecht 1989), and constant values (thermostat hypothesis, Ramanathan and Collins 1991). Neither have observational analyses and numerical modeling converged upon a general result (e.g. Douville et al., 2002; Lau and Wu, 2003; Khain et al., 2005; Wang, 2005; Lin et al., 2006; Cohen and McCaul, 2006), reflecting the complexity of the problem.
Due to the great range of scales involved in precipitation formation, ranging from aerosol on the order of tenths of micrometers to clouds widths hundreds of kilometers in diameter, it is impossible to numerically model the problem in its entirety. Because of the
great importance to society in understanding how precipitation rates and amounts may change over given regions, affecting agriculture, fresh water supplies, and the frequency of flooding or droughts, however, progress on this problem cannot await the creation of more powerful computers capable of handling all of these scales simultaneously.
The present study is an attempt to look at the problem of precipitation process changes in future clouds, by investigating the first step, i.e., the warm rain process, in precipitation formation. Once some relationships are established about how this process may change given regional climate change and local aerosol characteristics, future modeling will consider both warm rain and ice processes. In convective storms the bulk of the precipitation falling is attributable to both warm rain and ice processes, and thus more sophisticated models will be used. Here, however, the initial stages of precipitation formation are investigated, using climate model output to produce realistic past and future environments, and guidance from the literature in initializing the calculations with appropriate values of cloud condensation nuclei. The philosophy is not to make predictions based on either the cloud model environmental predictions nor the precipitation calculations, but rather, to derive general relationships between different regional climates, their local aerosol characteristics, and the productivity of the warm rain process. 2. Method
To have realistic representations of past
and future climates, output from the National Center for Atmospheric Research (NCAR) Community Climate System Model version 3 (CCSM3) model was used. The model
2
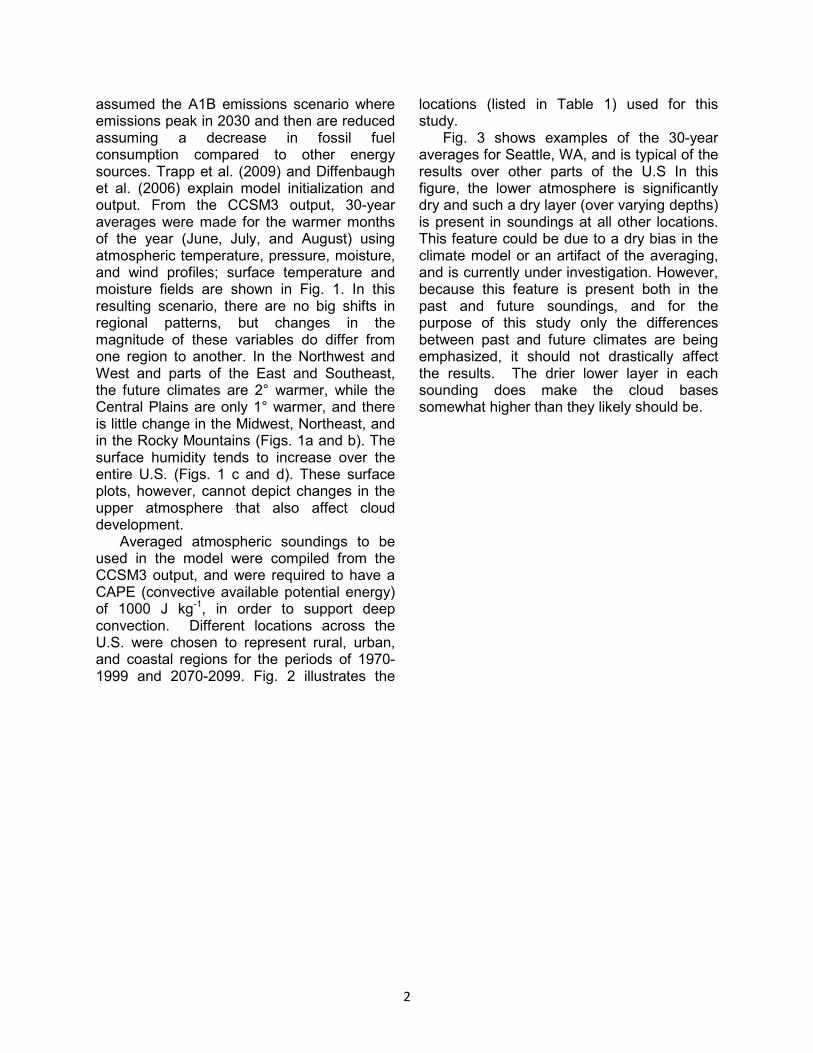
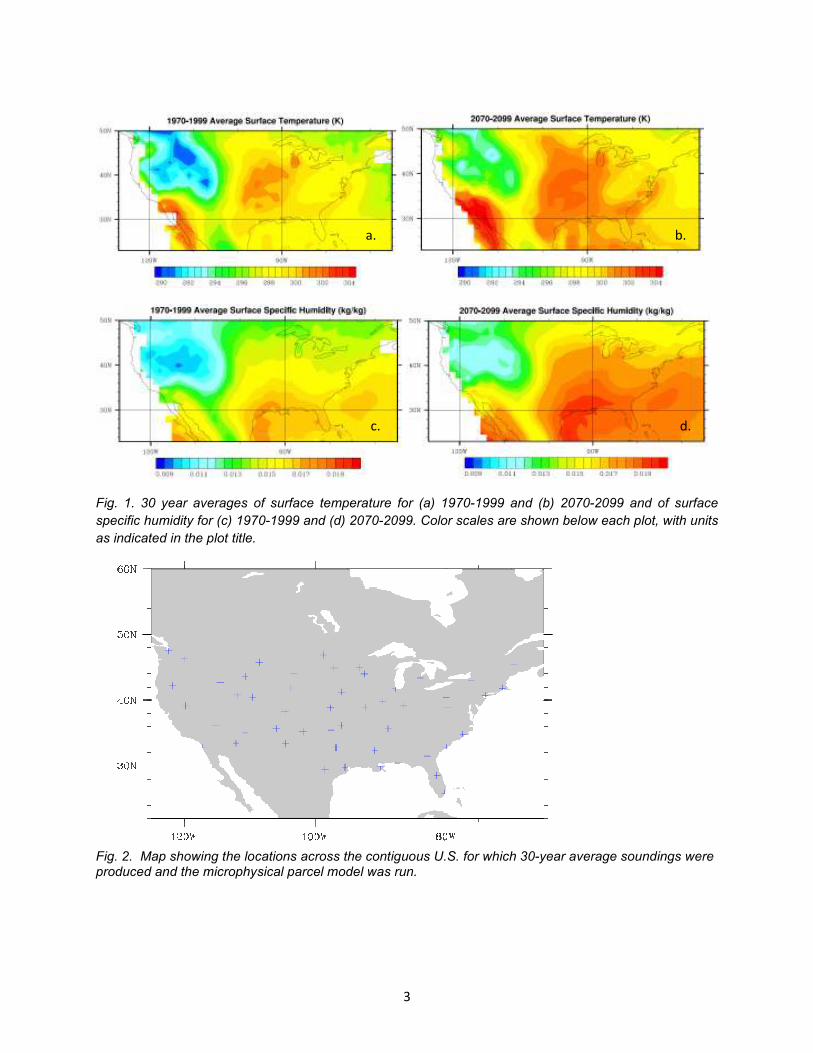
assumed the A1B emissions scenario where emissions peak in 2030 and then are reduced assuming a decrease in fossil fuel consumption compared to other energy sources. Trapp et al. (2009) and Diffenbaugh et al. (2006) explain model initialization and output. From the CCSM3 output, 30-year averages were made for the warmer months of the year (June, July, and August) using atmospheric temperature, pressure, moisture, and wind profiles; surface temperature and moisture fields are shown in Fig. 1. In this resulting scenario, there are no big shifts in regional patterns, but changes in the magnitude of these variables do differ from one region to another. In the Northwest and West and parts of the East and Southeast, the future climates are 2° warmer, while the Central Plains are only 1° warmer, and there is little change in the Midwest, Northeast, and in the Rocky Mountains (Figs. 1a and b). The surface humidity tends to increase over the entire U.S. (Figs. 1 c and d). These surface plots, however, cannot depict changes in the upper atmosphere that also affect cloud development.
Averaged atmospheric soundings to be used in the model were compiled from the CCSM3 output, and were required to have a CAPE (convective available potential energy) of 1000 J kg-1, in order to support deep convection. Different locations across the U.S. were chosen to represent rural, urban, and coastal regions for the periods of 1970-1999 and 2070-2099. Fig. 2 illustrates the
locations (listed in Table 1) used for this study.
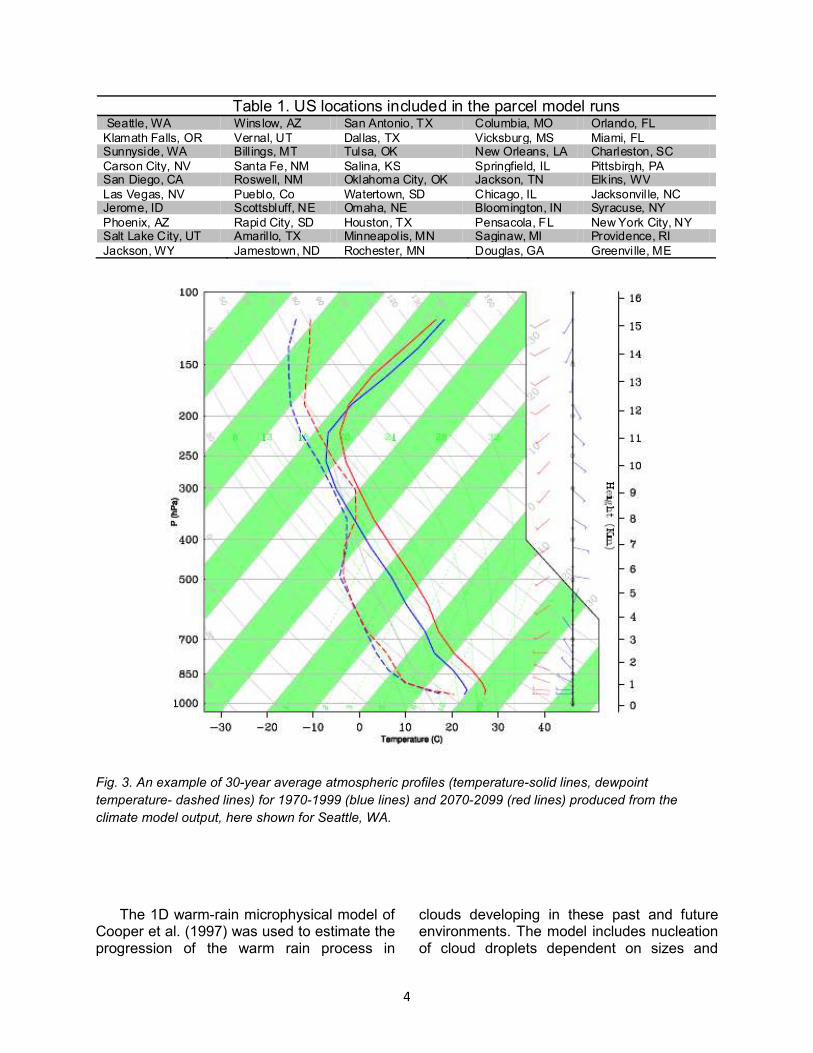
Fig. 3 shows examples of the 30-year averages for Seattle, WA, and is typical of the results over other parts of the U.S In this figure, the lower atmosphere is significantly dry and such a dry layer (over varying depths) is present in soundings at all other locations. This feature could be due to a dry bias in the climate model or an artifact of the averaging, and is currently under investigation. However, because this feature is present both in the past and future soundings, and for the purpose of this study only the differences between past and future climates are being emphasized, it should not drastically affect the results. The drier lower layer in each sounding does make the cloud bases somewhat higher than they likely should be.
3
Fig. 1. 30 year averages of surface temperature for (a) 1970-1999 and (b) 2070-2099 and of surface
specific humidity for (c) 1970-1999 and (d) 2070-2099. Color scales are shown below each plot, with units
as indicated in the plot title.
Fig. 2. Map showing the locations across the contiguous U.S. for which 30-year average soundings were produced and the microphysical parcel model was run.
a. b.
c. d.
4
Table 1. US locations included in the parcel model runs Seattle, WA Winslow, AZ San Antonio, TX Columbia, MO Orlando, FL
Klamath Falls, OR Vernal, UT Dallas, TX Vicksburg, MS Miami, FL Sunnyside, WA Bill ings, MT Tulsa, OK New Orleans, LA Charleston, SC
Carson City, NV Santa Fe, NM Salina, KS Springfield, IL Pittsbirgh, PA San Diego, CA Roswell, NM Oklahoma City, OK Jackson, TN Elkins, WV
Las Vegas, NV Pueblo, Co Watertown, SD Chicago, IL Jacksonville, NC Jerome, ID Scottsbluff, NE Omaha, NE Bloomington, IN Syracuse, NY
Phoenix, AZ Rapid City, SD Houston, TX Pensacola, FL New York City, NY Salt Lake City, UT Amaril lo, TX Minneapolis, MN Saginaw, MI Providence, RI
Jackson, WY Jamestown, ND Rochester, MN Douglas, GA Greenville, ME
Fig. 3. An example of 30-year average atmospheric profiles (temperature-solid lines, dewpoint
temperature- dashed lines) for 1970-1999 (blue lines) and 2070-2099 (red lines) produced from the
climate model output, here shown for Seattle, WA.
The 1D warm-rain microphysical model of Cooper et al. (1997) was used to estimate the progression of the warm rain process in
clouds developing in these past and future environments. The model includes nucleation of cloud droplets dependent on sizes and
5
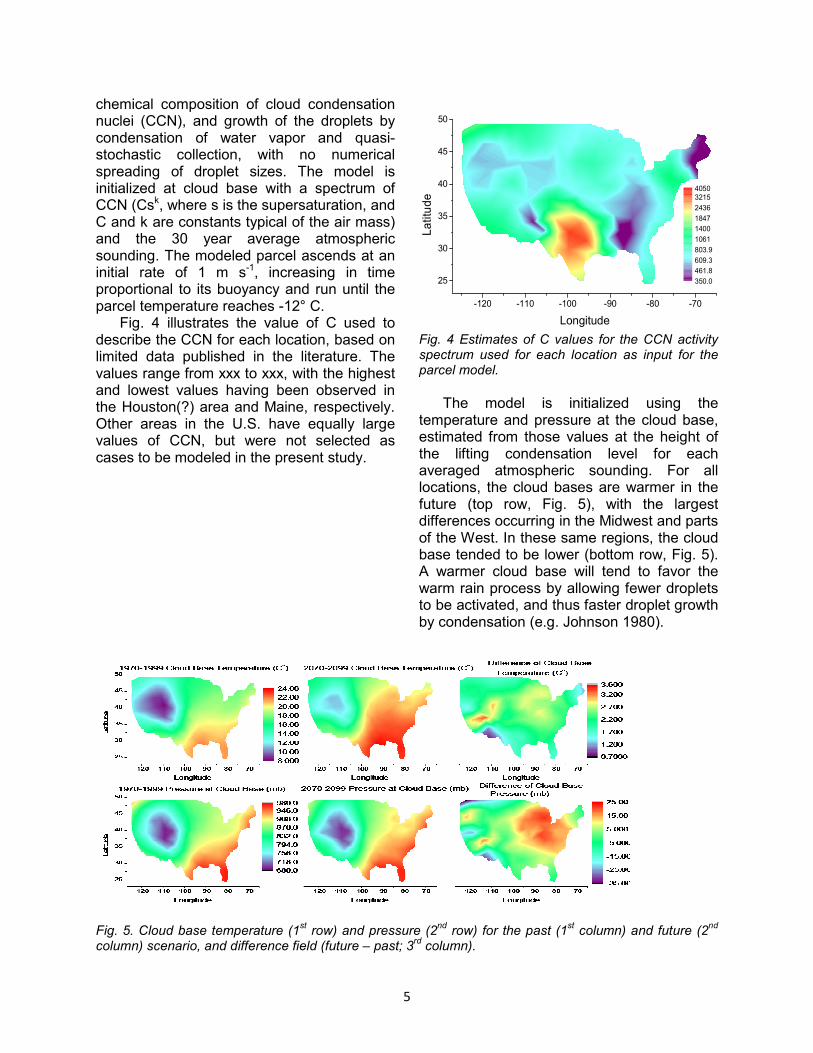
chemical composition of cloud condensation nuclei (CCN), and growth of the droplets by condensation of water vapor and quasi-stochastic collection, with no numerical spreading of droplet sizes. The model is initialized at cloud base with a spectrum of CCN (Csk, where s is the supersaturation, and C and k are constants typical of the air mass) and the 30 year average atmospheric sounding. The modeled parcel ascends at an initial rate of 1 m s-1, increasing in time proportional to its buoyancy and run until the parcel temperature reaches -12° C.
Fig. 4 illustrates the value of C used to describe the CCN for each location, based on limited data published in the literature. The values range from xxx to xxx, with the highest and lowest values having been observed in the Houston(?) area and Maine, respectively. Other areas in the U.S. have equally large values of CCN, but were not selected as cases to be modeled in the present study.
-120 -110 -100 -90 -80 -70
25
30
35
40
45
50
La
titu
de
Longitude
350.0
461.8
609.3
803.9
1061
1400
1847
2436
3215
4050
Fig. 4 Estimates of C values for the CCN activity spectrum used for each location as input for the parcel model.
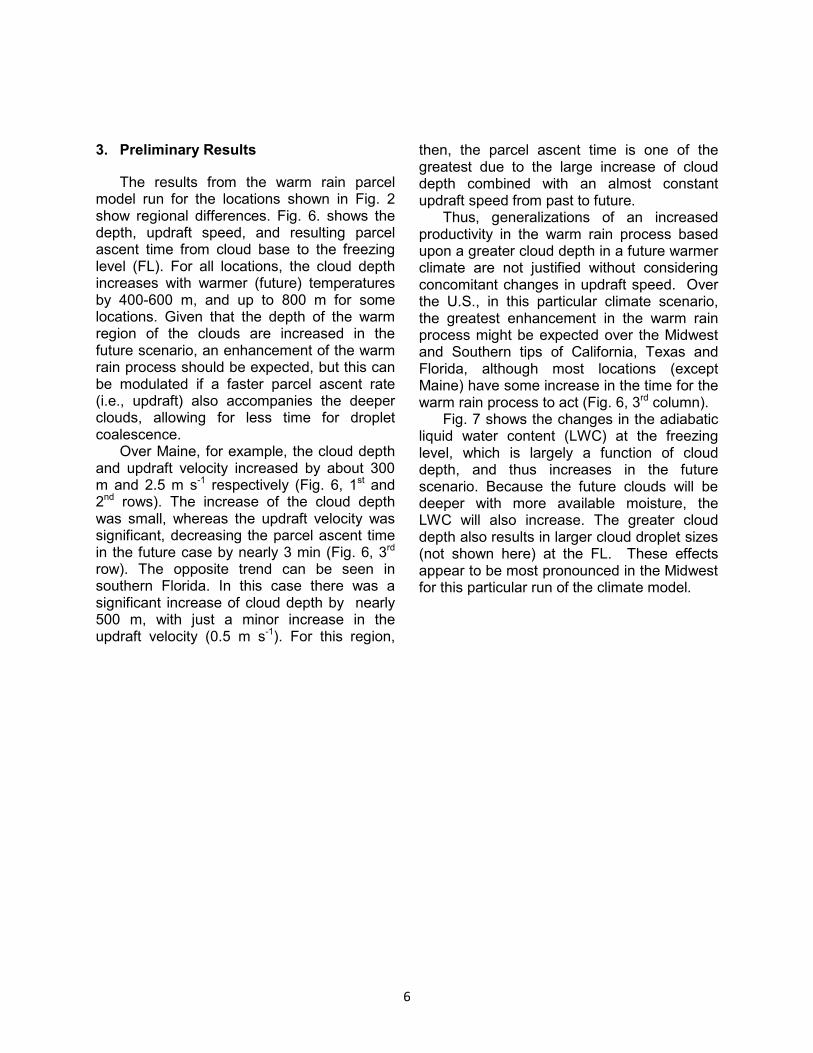
The model is initialized using the temperature and pressure at the cloud base, estimated from those values at the height of the lifting condensation level for each averaged atmospheric sounding. For all locations, the cloud bases are warmer in the future (top row, Fig. 5), with the largest differences occurring in the Midwest and parts of the West. In these same regions, the cloud base tended to be lower (bottom row, Fig. 5). A warmer cloud base will tend to favor the warm rain process by allowing fewer droplets to be activated, and thus faster droplet growth by condensation (e.g. Johnson 1980).
Fig. 5. Cloud base temperature (1
st row) and pressure (2
nd row) for the past (1
st column) and future (2
nd
column) scenario, and difference field (future – past; 3rd column).
6
3. Preliminary Results
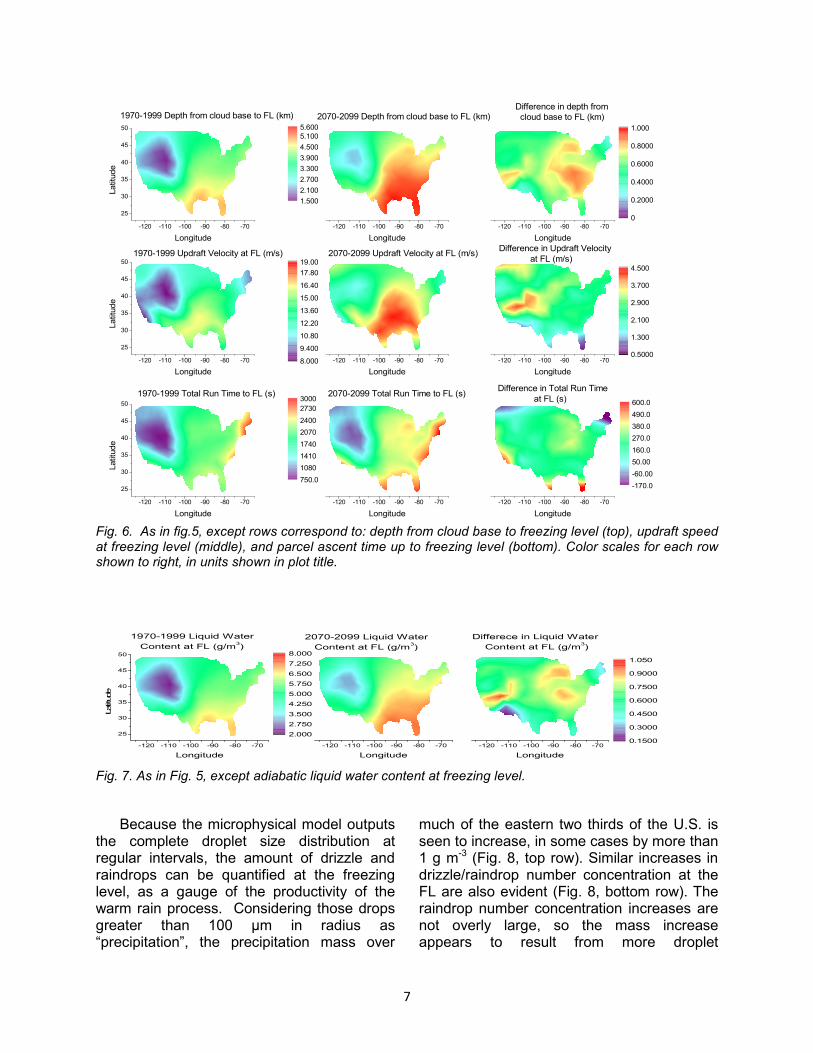
The results from the warm rain parcel model run for the locations shown in Fig. 2 show regional differences. Fig. 6. shows the depth, updraft speed, and resulting parcel ascent time from cloud base to the freezing level (FL). For all locations, the cloud depth increases with warmer (future) temperatures by 400-600 m, and up to 800 m for some locations. Given that the depth of the warm region of the clouds are increased in the future scenario, an enhancement of the warm rain process should be expected, but this can be modulated if a faster parcel ascent rate (i.e., updraft) also accompanies the deeper clouds, allowing for less time for droplet coalescence.
Over Maine, for example, the cloud depth and updraft velocity increased by about 300 m and 2.5 m s-1 respectively (Fig. 6, 1st and 2nd rows). The increase of the cloud depth was small, whereas the updraft velocity was significant, decreasing the parcel ascent time in the future case by nearly 3 min (Fig. 6, 3rd row). The opposite trend can be seen in southern Florida. In this case there was a significant increase of cloud depth by nearly 500 m, with just a minor increase in the updraft velocity (0.5 m s-1). For this region,
then, the parcel ascent time is one of the greatest due to the large increase of cloud depth combined with an almost constant updraft speed from past to future.
Thus, generalizations of an increased productivity in the warm rain process based upon a greater cloud depth in a future warmer climate are not justified without considering concomitant changes in updraft speed. Over the U.S., in this particular climate scenario, the greatest enhancement in the warm rain process might be expected over the Midwest and Southern tips of California, Texas and Florida, although most locations (except Maine) have some increase in the time for the warm rain process to act (Fig. 6, 3rd column).
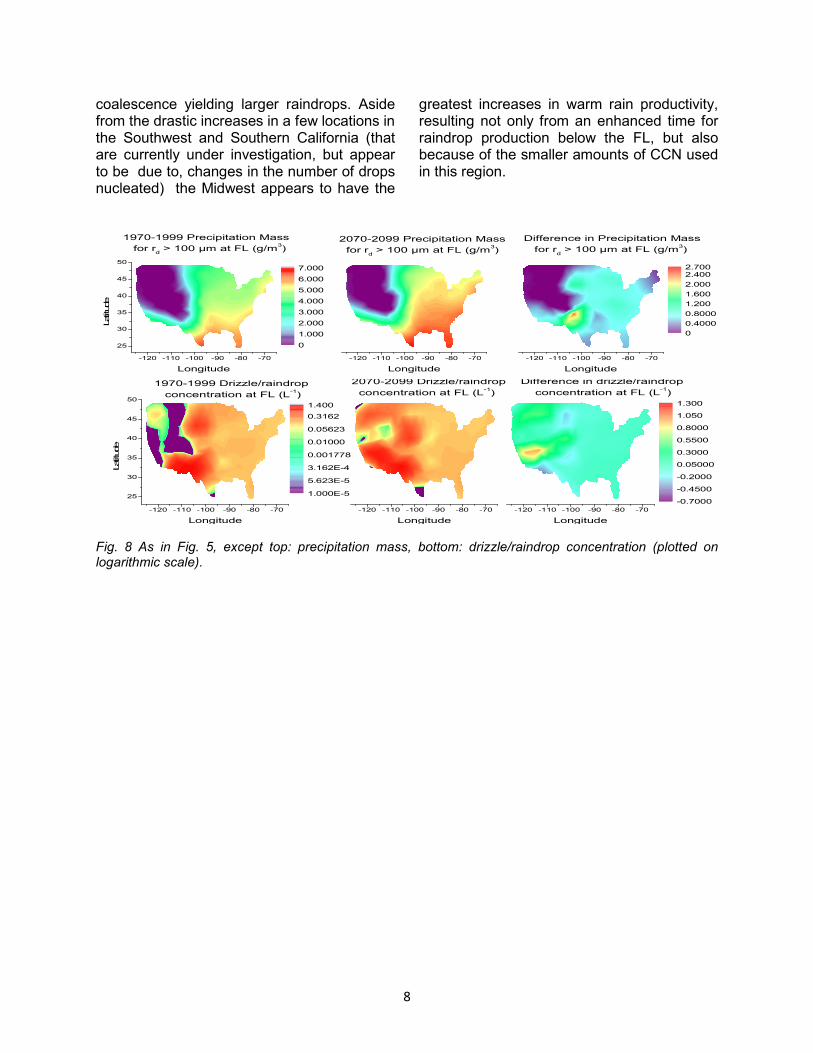
Fig. 7 shows the changes in the adiabatic liquid water content (LWC) at the freezing level, which is largely a function of cloud depth, and thus increases in the future scenario. Because the future clouds will be deeper with more available moisture, the LWC will also increase. The greater cloud depth also results in larger cloud droplet sizes (not shown here) at the FL. These effects appear to be most pronounced in the Midwest for this particular run of the climate model.
7
-120 -110 -100 -90 -80 -70
25
30
35
40
45
50
1970-1999 Depth from cloud base to FL (km) Latitu
de
Longitude
1.500
2.100
2.700
3.300
3.900
4.500
5.100
5.600
-120 -110 -100 -90 -80 -70
2070-2099 Depth from cloud base to FL (km)
Longitude
-120 -110 -100 -90 -80 -70
Difference in depth from
cloud base to FL (km)
Longitude
0
0.2000
0.4000
0.6000
0.8000
1.000
-120 -110 -100 -90 -80 -70
25
30
35
40
45
50
1970-1999 Updraft Velocity at FL (m/s)
Latitu
de
Longitude
8.000
9.400
10.80
12.20
13.60
15.00
16.40
17.80
19.00
-120 -110 -100 -90 -80 -70
2070-2099 Updraft Velocity at FL (m/s)
Longitude
-120 -110 -100 -90 -80 -70
Difference in Updraft Velocity
at FL (m/s)
Longitude
0.5000
1.300
2.100
2.900
3.700
4.500
-120 -110 -100 -90 -80 -70
25
30
35
40
45
50
1970-1999 Total Run Time to FL (s)
Latitu
de
Longitude
750.0
1080
1410
1740
2070
2400
2730
3000
-120 -110 -100 -90 -80 -70
2070-2099 Total Run Time to FL (s)
Longitude
-120 -110 -100 -90 -80 -70
Difference in Total Run Time
at FL (s)
Longitude
-170.0
-60.00
50.00
160.0
270.0
380.0
490.0
600.0
Fig. 6. As in fig.5, except rows correspond to: depth from cloud base to freezing level (top), updraft speed at freezing level (middle), and parcel ascent time up to freezing level (bottom). Color scales for each row shown to right, in units shown in plot title.
-120 -110 -100 -90 -80 -70
25
30
35
40
45
50
1970-1999 Liquid Water
Content at FL (g/m3)
Latitude
Longitude
2.000
2.750
3.500
4.250
5.000
5.750
6.500
7.250
8.000
-120 -110 -100 -90 -80 -70
2070-2099 Liquid Water
Content at FL (g/m3)
Longitude
-120 -110 -100 -90 -80 -70
Differece in Liquid Water
Content at FL (g/m3)
Longitude
0.1500
0.3000
0.4500
0.6000
0.7500
0.9000
1.050
Fig. 7. As in Fig. 5, except adiabatic liquid water content at freezing level.
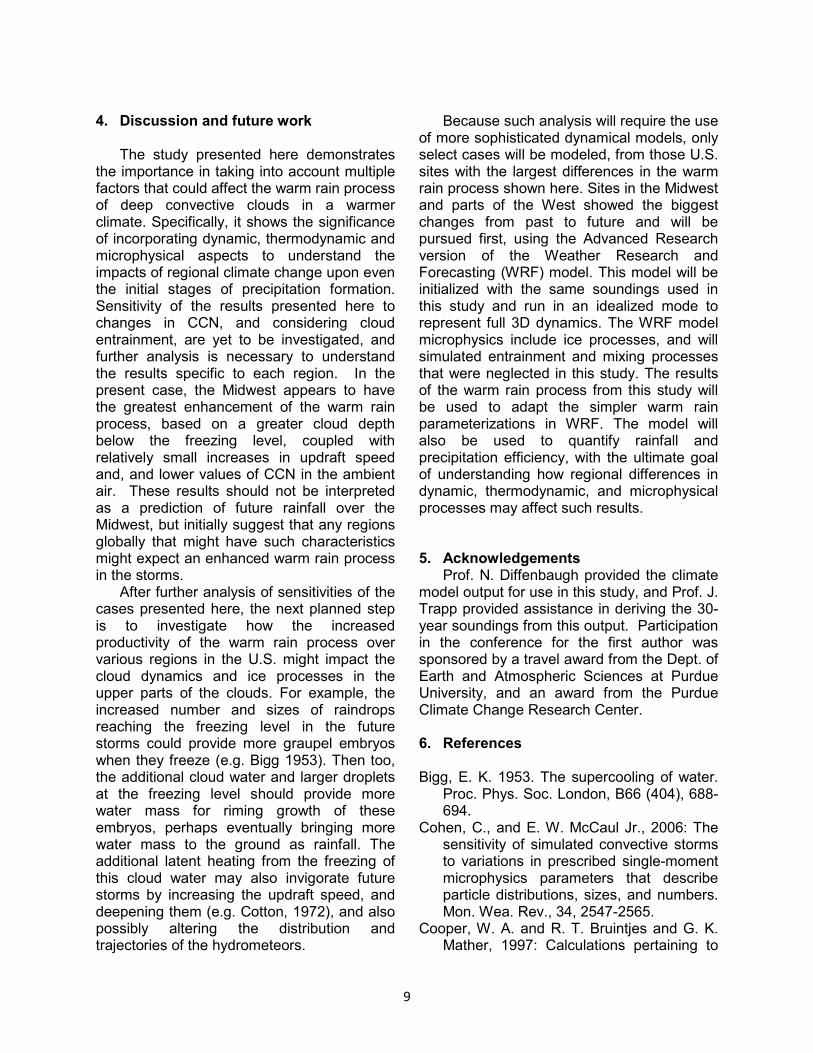
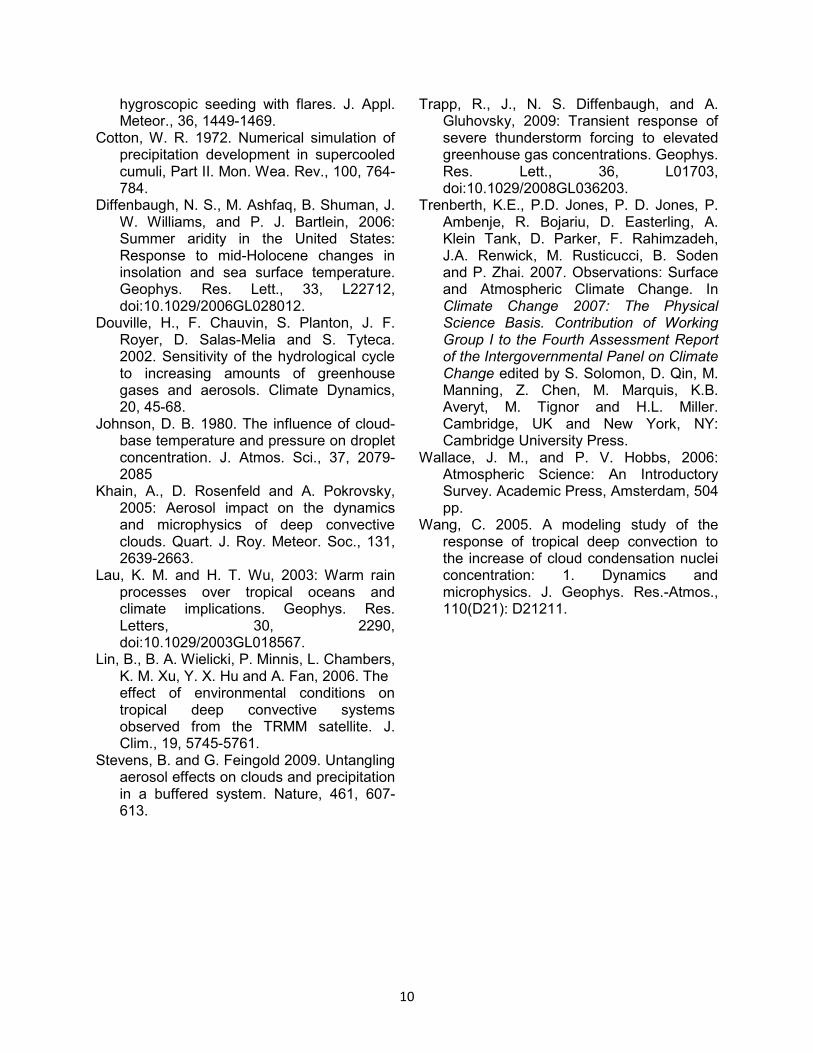
Because the microphysical model outputs
the complete droplet size distribution at regular intervals, the amount of drizzle and raindrops can be quantified at the freezing level, as a gauge of the productivity of the warm rain process. Considering those drops greater than 100 µm in radius as “precipitation”, the precipitation mass over
much of the eastern two thirds of the U.S. is seen to increase, in some cases by more than 1 g m-3 (Fig. 8, top row). Similar increases in drizzle/raindrop number concentration at the FL are also evident (Fig. 8, bottom row). The raindrop number concentration increases are not overly large, so the mass increase appears to result from more droplet
8
coalescence yielding larger raindrops. Aside from the drastic increases in a few locations in the Southwest and Southern California (that are currently under investigation, but appear to be due to, changes in the number of drops nucleated) the Midwest appears to have the
greatest increases in warm rain productivity, resulting not only from an enhanced time for raindrop production below the FL, but also because of the smaller amounts of CCN used in this region.
-120 -110 -100 -90 -80 -70
25
30
35
40
45
50
1970-1999 Drizzle/raindrop
concentration at FL (L-1)
Latitude
Longitude
1.000E-5
5.623E-5
3.162E-4
0.001778
0.01000
0.05623
0.3162
1.400
-120 -110 -100 -90 -80 -70
2070-2099 Drizzle/raindrop
concentration at FL (L-1)
Longitude
-120 -110 -100 -90 -80 -70
Difference in drizzle/raindrop
concentration at FL (L-1)
Longitude
-0.7000
-0.4500
-0.2000
0.05000
0.3000
0.5500
0.8000
1.050
1.300
-120 -110 -100 -90 -80 -70
25
30
35
40
45
50
1970-1999 Precipitation Mass
for rd > 100 µm at FL (g/m
3)
Latitude
Longitude
0
1.000
2.000
3.000
4.000
5.000
6.000
7.000
-120 -110 -100 -90 -80 -70
2070-2099 Precipitation Mass
for rd > 100 µm at FL (g/m
3)
Longitude
-120 -110 -100 -90 -80 -70
Difference in Precipitation Mass
for rd > 100 µm at FL (g/m
3)
Longitude
0
0.4000
0.8000
1.200
1.600
2.000
2.4002.700
Fig. 8 As in Fig. 5, except top: precipitation mass, bottom: drizzle/raindrop concentration (plotted on logarithmic scale).
9
4. Discussion and future work
The study presented here demonstrates
the importance in taking into account multiple factors that could affect the warm rain process of deep convective clouds in a warmer climate. Specifically, it shows the significance of incorporating dynamic, thermodynamic and microphysical aspects to understand the impacts of regional climate change upon even the initial stages of precipitation formation. Sensitivity of the results presented here to changes in CCN, and considering cloud entrainment, are yet to be investigated, and further analysis is necessary to understand the results specific to each region. In the present case, the Midwest appears to have the greatest enhancement of the warm rain process, based on a greater cloud depth below the freezing level, coupled with relatively small increases in updraft speed and, and lower values of CCN in the ambient air. These results should not be interpreted as a prediction of future rainfall over the Midwest, but initially suggest that any regions globally that might have such characteristics might expect an enhanced warm rain process in the storms.
After further analysis of sensitivities of the cases presented here, the next planned step is to investigate how the increased productivity of the warm rain process over various regions in the U.S. might impact the cloud dynamics and ice processes in the upper parts of the clouds. For example, the increased number and sizes of raindrops reaching the freezing level in the future storms could provide more graupel embryos when they freeze (e.g. Bigg 1953). Then too, the additional cloud water and larger droplets at the freezing level should provide more water mass for riming growth of these embryos, perhaps eventually bringing more water mass to the ground as rainfall. The additional latent heating from the freezing of this cloud water may also invigorate future storms by increasing the updraft speed, and deepening them (e.g. Cotton, 1972), and also possibly altering the distribution and trajectories of the hydrometeors.
Because such analysis will require the use of more sophisticated dynamical models, only select cases will be modeled, from those U.S. sites with the largest differences in the warm rain process shown here. Sites in the Midwest and parts of the West showed the biggest changes from past to future and will be pursued first, using the Advanced Research version of the Weather Research and Forecasting (WRF) model. This model will be initialized with the same soundings used in this study and run in an idealized mode to represent full 3D dynamics. The WRF model microphysics include ice processes, and will simulated entrainment and mixing processes that were neglected in this study. The results of the warm rain process from this study will be used to adapt the simpler warm rain parameterizations in WRF. The model will also be used to quantify rainfall and precipitation efficiency, with the ultimate goal of understanding how regional differences in dynamic, thermodynamic, and microphysical processes may affect such results.
5. Acknowledgements
Prof. N. Diffenbaugh provided the climate model output for use in this study, and Prof. J. Trapp provided assistance in deriving the 30-year soundings from this output. Participation in the conference for the first author was sponsored by a travel award from the Dept. of Earth and Atmospheric Sciences at Purdue University, and an award from the Purdue Climate Change Research Center.
6. References
Bigg, E. K. 1953. The supercooling of water.
Proc. Phys. Soc. London, B66 (404), 688-694.
Cohen, C., and E. W. McCaul Jr., 2006: The sensitivity of simulated convective storms to variations in prescribed single-moment microphysics parameters that describe particle distributions, sizes, and numbers. Mon. Wea. Rev., 34, 2547-2565.
Cooper, W. A. and R. T. Bruintjes and G. K. Mather, 1997: Calculations pertaining to
10
hygroscopic seeding with flares. J. Appl. Meteor., 36, 1449-1469.
Cotton, W. R. 1972. Numerical simulation of precipitation development in supercooled cumuli, Part II. Mon. Wea. Rev., 100, 764-784.
Diffenbaugh, N. S., M. Ashfaq, B. Shuman, J. W. Williams, and P. J. Bartlein, 2006: Summer aridity in the United States: Response to mid-Holocene changes in insolation and sea surface temperature. Geophys. Res. Lett., 33, L22712, doi:10.1029/2006GL028012.
Douville, H., F. Chauvin, S. Planton, J. F. Royer, D. Salas-Melia and S. Tyteca. 2002. Sensitivity of the hydrological cycle to increasing amounts of greenhouse gases and aerosols. Climate Dynamics, 20, 45-68.
Johnson, D. B. 1980. The influence of cloud-base temperature and pressure on droplet concentration. J. Atmos. Sci., 37, 2079-2085
Khain, A., D. Rosenfeld and A. Pokrovsky, 2005: Aerosol impact on the dynamics and microphysics of deep convective clouds. Quart. J. Roy. Meteor. Soc., 131, 2639-2663.
Lau, K. M. and H. T. Wu, 2003: Warm rain processes over tropical oceans and climate implications. Geophys. Res. Letters, 30, 2290, doi:10.1029/2003GL018567.
Lin, B., B. A. Wielicki, P. Minnis, L. Chambers, K. M. Xu, Y. X. Hu and A. Fan, 2006. The effect of environmental conditions on tropical deep convective systems observed from the TRMM satellite. J. Clim., 19, 5745-5761.
Stevens, B. and G. Feingold 2009. Untangling aerosol effects on clouds and precipitation in a buffered system. Nature, 461, 607-613.
Trapp, R., J., N. S. Diffenbaugh, and A. Gluhovsky, 2009: Transient response of severe thunderstorm forcing to elevated greenhouse gas concentrations. Geophys. Res. Lett., 36, L01703, doi:10.1029/2008GL036203.
Trenberth, K.E., P.D. Jones, P. D. Jones, P. Ambenje, R. Bojariu, D. Easterling, A. Klein Tank, D. Parker, F. Rahimzadeh, J.A. Renwick, M. Rusticucci, B. Soden and P. Zhai. 2007. Observations: Surface and Atmospheric Climate Change. In Climate Change 2007: The Physical Science Basis. Contribution of Working Group I to the Fourth Assessment Report of the Intergovernmental Panel on Climate Change edited by S. Solomon, D. Qin, M. Manning, Z. Chen, M. Marquis, K.B. Averyt, M. Tignor and H.L. Miller. Cambridge, UK and New York, NY: Cambridge University Press.
Wallace, J. M., and P. V. Hobbs, 2006: Atmospheric Science: An Introductory Survey. Academic Press, Amsterdam, 504 pp.
Wang, C. 2005. A modeling study of the response of tropical deep convection to the increase of cloud condensation nuclei concentration: 1. Dynamics and microphysics. J. Geophys. Res.-Atmos., 110(D21): D21211.