Embed Size (px)
Citation preview
Proceedings, 10th World Congress of Genetics Applied to Livestock Production
The Minipig Genome Harbors Regions of Selection for Growth
C. Reimer1, C.-J. Rubin2, S. Weigend3, K.-H. Waldmann4, O. Distl4 and H. Simianer1. 1Georg-August-University, Göttingen, Germany, 2Uppsala University, Sweden, 3Institute of Farm Animal Genetics of the
Friedrich-Loeffler-Institute, Neustadt-Mariensee, Germany, 4University of Veterinary Medicine, Hannover, Germany.
ABSTRACT: The whole genome resequencing (WGS) data of 46 normal sized pigs, either domestic or wild, was compared to WGS from 11 Göttingen Minipigs, 2 Berlin Minipigs, 2 Xiang pigs and one DNA pool comprising 10 Berlin Minipigs. Expected heterozygosity in the minipigs and fixation between both groups where used as a measure to find selective sweeps introduced during the selection for low body size in the minipig. 166 such candidate regions were defined and further annotated. Gene Ontology overrepresentation analysis revealed significant enrichment of terms related to growth. A large set of contained genes has been found, which have influence on i.e. growth and bone development. TGFβ and plenty of its altering genes were identified. Keywords: minipig; sequencing; growth
Introduction
The Göttingen Minipig (GMP) is one of the smallest pig breeds in the world. It was bred at the University of Göttingen, Germany, in the 1960´s to fulfill the rising needs for laboratory animals (Simianer and Köhn, 2010). The Vietnamese Potbellied Pig, the Minnesota Minipig and the German Landrace were used as founder breeds. Intense selection led to a white-coated animal with less than 45 kg at an age of two years. This constitution makes it a promising candidate to reveal the genetic basis of growth and body size when compared to normal sized pig breeds.
A previous study (Gärke et al., 2012) using 60 k SNP data revealed that alleles from all founder breeds can still be found in the genome of the GMP, but the proportions deviated significantly from the composition expected from the pedigree. Extreme differences between expected and observed breed composition in some genomic regions can be attributed to selection for low body weight and white skin color. These signatures of selection occur in regions where genes with known relevance for growth (e.g. SOCS2, TXN, DDR2 and GRB10) are located. Another finding was that information derived from the 60 k SNP markers is not sufficient to make a reliable statement on the genetic background of small body size in miniature pigs.
Next Generation Sequencing (NGS) technology provides the possibility to obtain whole genome data from many individuals at a reasonable price. The porcine reference genome was published in Archibald et al. (2010) and first studies (Groenen et al., 2012; Rubin et al., 2010; 2012) suggested that whole genome resequencing is a viable approach to identify regions under anthropogenic selection, since this method provides a much more comprehensive insight into genomic variability based on SNPs and other types of variation such as structural variants than do SNP arrays. Even causal mutations have been
derived from this data directly (Andersson et al., 2012; Imsland et al., 2012). However, minipigs have not been included in any of these studies so far.
Materials and Methods
Public Data. From the European Nucleotide
Archive (ENA) sequence data from 37 domestic pigs, 11 wild boars from Asia and Europe, respectively, underlying the study of Rubin et al. (2012) and a Göttingen Minipig (Vamathevan et al., 2013) were downloaded.
Minipig Sampling. Blood samples were obtained
from 10 individuals from the University owned stock and 2 individuals from the Berlin Minipig housed at the University of Veterinary Medicine, Hannover. A DNA pool from 10 Berlin Minipigs was added. All samples were sequenced with 10X coverage on the NGS-Platform at Uppsala University.
Basic Data Preparation. Raw sequence data was
aligned to the Sus Scrofa 10.2 reference genome (Archibald et al., 2010) using BWA (Li and Durbin, 2009), were sorted by Samtools (Li et al., 2009) and duplicates were marked with Picard tools (Picard, 2009). Finally SNPs were called using the GATK (DePristo et al., 2011; McKenna et al., 2010).
Filtering. First indels and non biallelic SNV were
discarded. In the second step SNP sets were filtered to remove unreliable SNP calls. Therefore SNPs in clusters with >5 SNPs in 20 basepairs, with BaseQualityRankSum <-5.5 or >5.5, MappingQualityRankSum <-11 or >11, ReadPosRankSum <-6, FisherStrand values >45, a Mapping Quality <30, and a Depth of Coverage <90X or >840X were discarded.
To pass subsequent genotype filtering an individual needed a genotyping quality >20 and a pool needed a coverage >4 reads at this position.
In silico pooling. To avoid an over-influence of
highly represented breeds, animals of these breeds were pooled. For each locus, the mean reference allele frequency was calculated, and only loci with at least a 50% genotyping rate were included. Afterwards, two contrasting groups (minipig vs. normal sized pigs) were formed. The in-silico pooled minipig group contained the information of 11 Göttingen Minipigs, 2 Berlin Minipigs, the Berlin Minipig pool and two Xiang pigs from China, which turned out to actually be minipigs (Zhang et al., 2005)
Genome wide scans. To determine regions where
minipigs are differentiated from the normal sized pigs,
𝐹𝑆𝑇 values (Weir, 1996) were calculated between the two groups.
In order to find regions in the minipig genome where selective pressure for low body size massively shrunk the variability of many loci, expected heterozygosity 𝐻𝑒𝑥𝑝 in the minipig pool was calculated and normalized via a z-transformation.
Both measures were subsequently summarized in 20 kb windows with an overlap of 50 %. Stringent criteria were used to define clear borders of regions with a certain pattern of an excessive overrepresentation of high 𝐹𝑆𝑇 values or low 𝐻𝑒𝑥𝑝, in order not to rely on a simple extreme value approach.
Every region with low 𝐻𝑒𝑥𝑝 which overlapped with a region of high 𝐹𝑆𝑇 was considered to be a selective sweep and intersected with the Ensembl Biomart Pig Gene set (Flicek et al., 2013). Gene enrichment analysis with Fisher’s exact test and a 𝜒2 − test was performed on all GO terms found in the defined regions.
The aberrant site frequency spectrum method (Nielsen et al., 2005), implemented in Sweepfinder was performed to add support to our custom approach.
Results and Discussion
Variant and sweep discovery. After variant
calling and filtering, 35 million SNPs on the 18 autosomes and the X-chromosome formed the basis for later analyses. In the minipig a total of 20 million SNPs were found. Combining reduced heterozygosity and high differentiation between minipigs and normal-sized pigs revealed 166 candidate selection regions, summing up to 15.7 % of the pig genome.
Table 1. Growth linked GO terms. GO P GO Description
0071363 0.018 cellular response to growth factor stimulus
0001832 0.027 blastocyst growth
0035264 0.053 multicellular organism growth
0003416 0.072 endochondral bone growth
0036120 0.072 cellular response to platelet-derived growth factor stimulus
0045927 0.072 positive regulation of growth
0008083 0.079 growth factor activity
0030512 0.087 negative regulation of transforming growth factor beta receptor signaling pathway
GO: Biomart GO-Term accession, P: Fisher´s exact test p-value
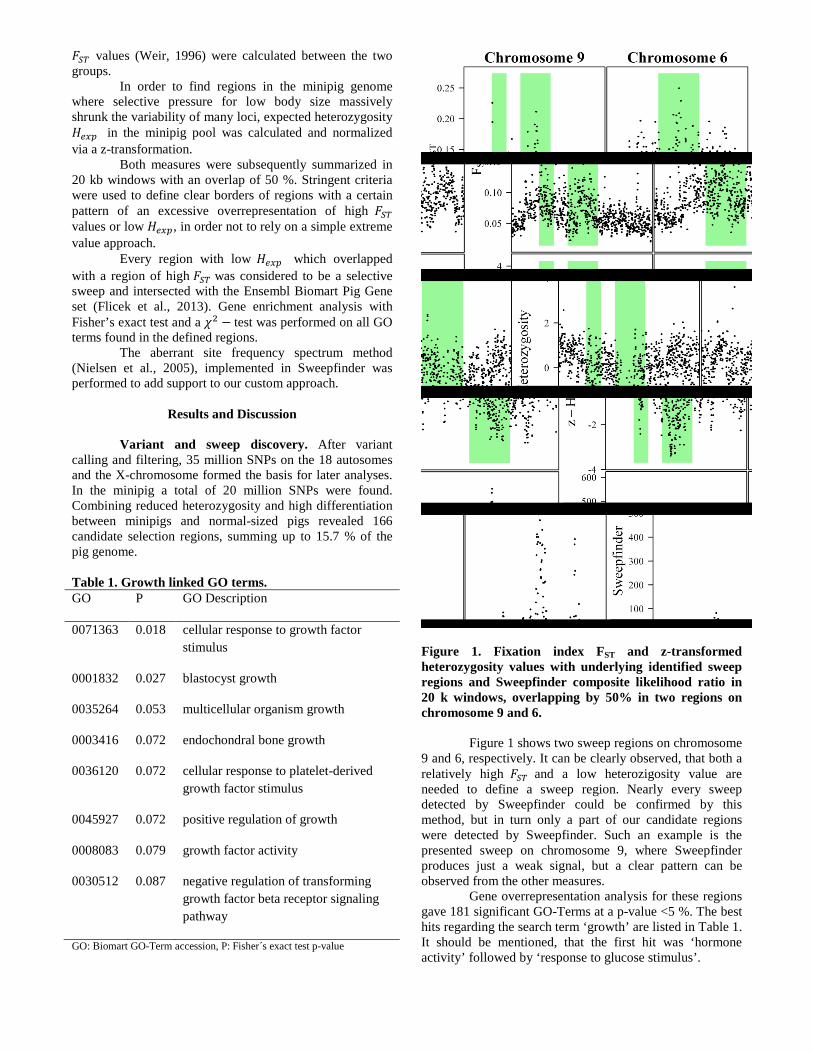
Figure 1. Fixation index FST and z-transformed heterozygosity values with underlying identified sweep regions and Sweepfinder composite likelihood ratio in 20 k windows, overlapping by 50% in two regions on chromosome 9 and 6.
Figure 1 shows two sweep regions on chromosome 9 and 6, respectively. It can be clearly observed, that both a relatively high 𝐹𝑆𝑇 and a low heterozigosity value are needed to define a sweep region. Nearly every sweep detected by Sweepfinder could be confirmed by this method, but in turn only a part of our candidate regions were detected by Sweepfinder. Such an example is the presented sweep on chromosome 9, where Sweepfinder produces just a weak signal, but a clear pattern can be observed from the other measures.
Gene overrepresentation analysis for these regions gave 181 significant GO-Terms at a p-value <5 %. The best hits regarding the search term ‘growth’ are listed in Table 1. It should be mentioned, that the first hit was ‘hormone activity’ followed by ‘response to glucose stimulus’.
Genes connected to these pathways and found in a sweep region were for example TGFβ, which seems to play a key role for growth, as described by (Enayati and Rahimi-Mianji, 2009) who detected an influence on the growth of hens. SMAD7 (Nakao et al., 1997), LEMD3 (Lin et al., 2005), BAMBI (Sekiya et al., 2004), SKIL (Tecalco-Cruz et al., 2012), and MSTN (Hickford et al., 2009) are known to assist TGF. Stratil et al. (2006) found a growth QTL in the ASPN gene and Labrador et al. (2001) found, that an elimination in the DDR2 gene leads to dwarfism in mice.
Conclusion
By using variation data from whole genome resequencing even narrow sweep regions can be detected, just by the right combination of simple measures. The contrast of several normal sized and several minipig breeds increased the chance of finding differentiation associated with growth and size only. Annotation with Ensembl Genes and enrichment analysis revealed a sensible set of genes related to growth. TGFβ and Genes which are known to have influence on it seem to play an important role in the search for the genetic basis of low body size in pigs.
Acknowledgement
The computation was done on the servercluster of the Uppsala Multidisciplinary Center for Advanced Computational Science (UPPMAX) provided by SNIC under project number p2010044. We would like to thank Ellegaard Göttingen Minipigs A/S for the financial support of our minipig projects. We appreciate the funding by the European Science Foundation within the framework „Advances in Farm Animal Genomics“ and by the DAAD U4 network for the stay in Uppsala
Literature Cited
Andersson, L.S., Larhammer, M., Memic, F. et al. (2012). Nature 488:642-646.
Archibald, A.L., Bolund, L., Churcher, C. et al. (2010). BMC Genomics, 11:438.
DePristo, M., Banks, E., Poplin, R. et al. (2011). Genetics, 43:491-498.
Enayati, B. and Rahimi.Mianji, G. (2009). Afr. J. Biotech., 8:3154-3159.
Flicek, P., Ahmed, I., Ridwan Amode, M. et al. (2013). Nucleic Acids Res.: doi: 10.1093/nar/gks1236.
Gärke, C. (2012). Dissertation, University of Gottingen, http://hdl.handle.net/11858/00-1735-0000-0015-C6E5-A.
Groenen, M.A.M., Archibald, A.L., Uenishi, H. (2012). Nature, doi:10.1038/Nature11622.
Hickford, J.G.H., Forrest, R.H., Zhou, H. et al. (2009). Anim. Genet., 41:64-72.
Imsland, F., Feng, C., Boije, H. et al. (2012). PLoS Genetics, 8:e1002775.
Labrador, J.P., Azcoitia, V., Tuckermann, J. et al. (2001). EMBO reports, 21:446-452.
Li, H. and Durbin, R. (2009). Bioinformatics, 25:1754-1760.
Li, H., Handsaker, B., Wysoker, A. et al. (2009). Bioinformatics, 25:2078-2079.
Lin, F., Morrison, J.M., Wu, W. et al. (2005). Hum. Mol. Genet.14: 437–445.
McKenna, A., Hanna, M., Banks, E. et al. (2010). Genome. Res., 20:1297-1303.
Nakao, A., Afrakhte, M., Morén, A. et al. (1997). Nature letters, 389:631-635.
Nielsen, R., Williamson, S., Kim, Y. et al. (2005). Genome Res., 15:1566-1575.
Picard (2009). http://picard.sourceforge.net/. Accessed 2013-07-26.
Sekiya, T., Adachi, S., Kohu, K.et al. (2004). J. Biol. Chem., 279:6840-6846.
Simianer, H. and Köhn, F. (2010). J. Pharmacol. Toxicol. Methods, 62, 3:221-226.
Stratil, A., Van Poucke, M., Bartenschlager, H. et al. (2006). Anim. Genet., 37:415-418.
Rubin, C.-J., Megens, H.-J., Barrio, A.M. et al. (2012). PNAS, 109:19529-19536.
Rubin, C.-J., Zody, M.C., Eriksson, J. et al. (2010). Nature 464:587-591.
Tecalco-Cruz, A.C., Sosa-Garrocho, M., Vasquez-Vittoria, G. et al. (2012). J. Biol. Chem., 287:26764-26776.
Vamathevan, J., Hall, M.D., Hasan, S. et al. (2013). Toxicol. Appl. Pharmacol., 270:149-157.
Weir, B.S. (1996). Sinauer Associates, Inc. Publishers: ISBN 0-87893-90-4.
Zhang, Y., Zhang, Y., Zeng, Q. et al. (2005). J. Moun. Agric. Biol., 24:497-500.