Embed Size (px)
Citation preview
12th
World Telecommunication/ICT Indicators Symposium
(WTIS-14)
Tbilisi, Georgia, 24-26 November 2014
Background document Document INF/1-E
18 November 2014
English
SOURCE: Ministry of Communication and Information Technology, Indonesia
TITLE: ICT Indicators and Prioritization Strategic Development on ICT Sectors

ICT INDICATORS AND PRIORITIZATION STRATEGIC DEVELOPMENT ON ICT SECTORS
Basuki Yusuf Iskandar1 and Hedi Muhammad Idris2
ICT R&D and Human Resources Development Agency Ministry of Communication and Information Technology, Republic of Indonesia
[email protected] and [email protected]
Introduction
Government of Indonesia and other stakeholders in the country deem a common belief
that ICT can provide the foundation whereby a society can be built with equitable opportunity
and knowledge. We also believe that it is a key determinant of the sustainable competitive
advantages of the Nation. This concept is often left undeveloped for relevant ICT design and its
policy instrumentalization. GOI seeks to present the composite ICT initiatives and qualitative as
well as quantitative measurement to ensure that ICT utilization is addressed in productive
ways. Ministry of Communication and Infromation Technology (MCIT) of Government of
Indonesia (GOI) has annually conducted ICT Surveys. For example we captured
telecommunication market share and built analysis based on ICT household indicators.
ICTs should be viewed as a strategic national resource which has implications on the
sustainability of the state and nation. The consequence of this, ICT must be managed as a
resource or treasury capital toward national competitiveness. As a resource, ICT is unique
because it holds the potential benefits and at the same time it relates the potential risks that
need to be mitigated while securing information security known comprehensively as the
concept of the information resilience. In the context of global competition, ICT has determinedly
become a strategic necessity and not merely a strategic choice anymore. ICT should be
addressed strategically due to its enormous and long-term impact covering almost all
development sectors correspondingly. So it is unquestionably imperative to set ICT as the blood
vessels of this Nation, the content as the blood flow entirely of the Nation, the infrastructure and
political will as the heart of the Nation. Otherwise, ICT development and competition will lead
us to disadvantage position. Re-intrepretation from Trisakti principles from Indonesia founding
father, Soekarno, with regard to ICT development,.ICT, therefore, is to be developed to create
national souvergnity by inducing productive and competitive economy, a dynamic and national
resilience, and the patriotic, innovative, and superior character nation by shielding our virtous
cultural roots.
GOI is working hard to combine our policy work with research and analysis, providing
concrete evidence of the outcome and benefits of ICT. As technology became more pervasive in

the workplace, education, entertainment, creative industry and daily living, MCIT's research and
development focused on design of information and communication technologies, so that they
are more accessible and usable by policymaker in various domains. MCIT have two sort of
R&Ds. The first one is policy research aimed at proactive analysis, policy impact evaluation, and
modelling. Another side we are also grappling applied R&D to produce prototype, innovative
product and supporting the business making analysis of the product commercialization.
Through this approach, MCIT provides national leadership by developing position papers,
hosting meetings, and engaging in dialogue with researchers, practitioners, and policymakers in
order to identify promising areas of research, development, and dissemination for the field and
to advance evidence-based policy and practice, as well as contribute to the development of ICT-
related protoype product and its industrial penetration.
The number of ICT users either individually or in any sector like household, business,
education, etc., cause every country needs to observe, evaluate and monitor the development of
ICT infrastructure, access and use. All the data and information are needed to build a proper
policy to regulate access and ICT usage and so does infrastructure development. In this case, the
description of the access and use of ICT becomes indispensable by the countries. ICT
measurement standards are aiming to obtain a picture of the access progress , as well as the
usage of ICT infrastructure in each country is also useful to benchmark position of ICT
developments in one country against another country.
ICT Household Indicators
In 2013, the Ministry of Communications and Information Technology Republic of
Indonesia conducted a survey of ICT access and usage in household sector. Survey of the use of
ICT access in households nationwide conducted by the MCIT. Household population used as the
sampling method is based on BPS (Indonesia National Statistic Agency) census. While the
sample in this survey totaled 9,680 households with a 95% confidence level and a estimation
margin of error 1% . Survey of ICT access and usage in households based on 12 core ICT
indicators compiled by the ITU (International Telecommunication Union International) in 2012.
The sampling methods in of ICT access and usage in household sector survey can be seen in
figure 1 below.

Figure 1. Sampling Methods
From the sampling frame, the distribution of the respondents in this survey is based on the
region are: 32% of respondents from Sumatra, 28% of the area of Java, 18% from Sulawesi
region, 9% from Bali and Nusa Tenggara region, 8% respondent from the Moluccas and Papua
and 5% from Borneo.
National
Province
City/Distric City/Distric City/District
Village Vilage
Sub
2
Househol
d
Sub
1
Sub
2 Sub
1
Household Household Household
Survei conducted in every
province .
Distric/City is selected with
Stratified Random Sampling
Village is selected with Stratified Sampling by
considering Urban or Rural
categorized area
Sub-village chosen by considering the
representation of the upper middle and lower middle
class

Figure 2. Sample Distribution by Region
HH1 Proportion of Households With a Radio
Radio is one of the simple and common ICT tools. Definition of radio here, is a conventional
radio or radio integrated in the vehicle, an alarm clock, or mp3 player, but does not include
radio on the computer and HP. In addition, owned radio must be in good condition and
functioning properly. Based on survey results in Indonesia, 35% of the surveyed households
have a radio, while 65% of households do not have a radio.
Figure 3. Proportion of households with a radio
HH2 Proportion of Households With a Television
Sumatra; 32%
Java; 28%
Celebes; 18%
Bali and Nusa; 9%
Mollucas and Papua; 8%
Borneo; 5%
Have radio; 35%
Don't have radio; 65%
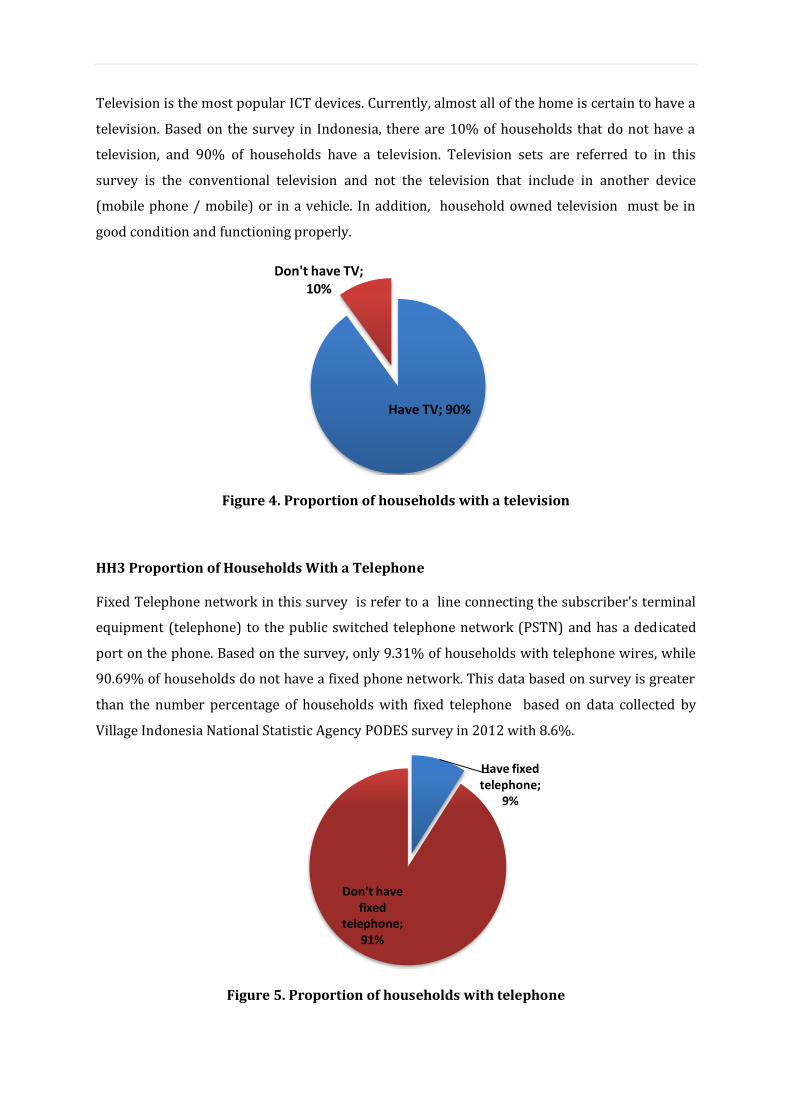
Television is the most popular ICT devices. Currently, almost all of the home is certain to have a
television. Based on the survey in Indonesia, there are 10% of households that do not have a
television, and 90% of households have a television. Television sets are referred to in this
survey is the conventional television and not the television that include in another device
(mobile phone / mobile) or in a vehicle. In addition, household owned television must be in
good condition and functioning properly.
Figure 4. Proportion of households with a television
HH3 Proportion of Households With a Telephone
Fixed Telephone network in this survey is refer to a line connecting the subscriber's terminal
equipment (telephone) to the public switched telephone network (PSTN) and has a dedicated
port on the phone. Based on the survey, only 9.31% of households with telephone wires, while
90.69% of households do not have a fixed phone network. This data based on survey is greater
than the number percentage of households with fixed telephone based on data collected by
Village Indonesia National Statistic Agency PODES survey in 2012 with 8.6%.
Figure 5. Proportion of households with telephone
Have TV; 90%
Don't have TV; 10%
Have fixed telephone;
9%
Don't have fixed
telephone; 91%

HH4 Proportion of Households With a Computer
Nowadays a computer is a modern multi function ICT devices. First computer more useful to
the calculating process and office activities, but development of computer technology also
serves communication, learning media, games and others. In this survey, Computing devices are
referred to in this survey is a desktop computer or laptop and not a mobile phone, PDA
(Personal Digital Assistant) or TV. In addition, the computer also must be in good condition and
used properly according to its function. Based on survey results, 27% of households having a
computer and 73% of households do not own a computer.
Figure 6. Proportion of households with a computer
HH5 Proportion of Individuals Who Used a Computer In the Past 3 Months
This survey also measures computers usage by individuals as a household member. The
computer is defined as desktop computer or a laptop and does not include mobile phones, PDAs
(Personal Digital Assistant). And also, computer must be in good condition and functioning.
Computer usage in this survey refer to individual user (respondent) that use computer at least
one time within the last 3 months, even though the respondent do not own computer by
himself/herself. They can borrowed computer from family, friends and others. Based on survey
results, 26% of respondents had used a computer for the last 3 months. While 74% of
respondents do not use a computer.
Have computer; 27%
Don't have computer; 73%

Figure 7. Proportion of individuals who used a computer in the past 3 months
HH6 Proportion of Households With Internet Access
The Internet is a worldwide public computer network, providing access to a number of
communication services including the World Wide Web and run e-mail, news, entertainment,
and data. Internet in this survey meant that the internet is accessible not only through a
computer, but also can with cell phones, PDAs, game machines, digital television, etc.. Based on
the survey results it appears that 21% of households have internet access, while 79% of
households do not have internet access.
Figure 8. Proportion of households with internet access
Use computer; 26%
Don't use computer; 74%
Have internet access; 21%
Don't have internet access;
79%

HH7 Proportion of Individuals Who Used the Internet In The Past 3 Months
This survey also measures internet usage by individuals in Indonesia. Internet user refer to
individual user (respondent) that use internet access at least once within the last 3 months,
even though the respondent do not own internet network by himself/herself. They can use
internet access from internet cafe, friend’s home, office, school and others location. Based on
survey results, 74% of respondents use internet access in the last 3 months. While 26% of
respondents do not use internet.
Figure 9. Proportion of individuals who used the Internet in the past 3 months
HH8 Location of Individual Use of the Internet In The Past Month
Each individual accessing the internet in different places. From the survey results, it can be seen
the percentage of locations that are often used for accessing internet. Home has the highest
percentage of location that respondents usually use the Internet access with 54.1%. Second
highest percentage is to access internet from anywhere via HP at 47.9% i. While the internet
cafe has the third highest percentage with 32.6%.
Use internet 74%
Don't use internet
26%

Figure 10. Location of individual use of the Internet in the past month
HH9 Internet Activities Undertaken By Individuals In The Past Month
In Indonesia, respondent have so many activities through internet. Opening a social networking
site is the most commonly performed activities for respondents while using Internet access
with a percentage of 67.9%. Then proceed with searching for information about goods or
services by 42%, and then, learning activity is third highest activities by 40.1%.
Figure 11. Internet activities undertaken by individuals in the past month
HH10 Proportion of Individuals Who Used a Mobile Cellular Telephone In The Past 3
Months
0.00% 10.00% 20.00% 30.00% 40.00% 50.00% 60.00%
Others
Community
Friend's House
Wifi
School
Office
Internet Cafe
Everywhere using HP
Home
2.80%
7%
8.90%
13.50%
15.10%
23.90%
28.30%
30.80%
34.50%
35.10%
36.80%
40.10%
42%
67.90%
0.00% 10.00% 20.00% 30.00% 40.00% 50.00% 60.00% 70.00% 80.00%
Others
Video Call
Internet Banking
Software download
Sell or purchase goods or services
Searching information about goverment
Searching information about health
Reading or download online newspaper
Playing games or download video games
Download picture, mucic, TV streaming
Sending/ receiving e mail
Study
Search information about goods or services
Social media

The survey ICT access and usage also measures mobile phone (Hand Phone) user as an
individual. The individual must use a mobile phone / mobile at least 1 time in the last 3
months, even though the respondent do not own HP by himself/herself. they can borrowed
from family, friends and others. Based on the survey results it appears that 80% of respondents
admitted to using a mobile phone / mobile in the last 3 months, while 20% are not.
Figure 12. Proportion of individuals who used a mobile cellular telephone in the
past 3 months
HH11 Proportion of Households With Access to the Internet by Type of Access
There are three types of Internet access that can be used in the Indonesia households,
Narrowband (such as Telkomnet Instant), Fixed Broadband (Telkom speedy), and Mobile
Broadband with internet service from operators like Indosat,Telkomsel, Smartfren, XL and
another internet product with 3G networks. Based on the results of the survey can be seen that
65% of households choose Mobile broadband as a used Internet access at home, while 17%
choose Fixed Narrowband and 18% of households have Fixed Broadband access.
Using HP in 3 months; 80%
Not using HP within 3
months; 20%

Figure 13. Proportion of households with access to the Internet by type of access
HH12 Frequency of Individual Use of the Internet In the Past 3 Months
Frequency of internet access for individuals in Indonesia based on survey datas, 51% of
respondents stated that they access the internet at least once a week but not every day. Then
37% of respondents access the internet every day and only 12% of respondents who access the
Internet less than once a week.
Figure 14. Frequency of individual use of the Internet in the past 3 months
Narrowband Access; 17%
Fixed Broadcband Access; 18% Mobile
Broadband Access; 65%
Everyday; 37%
Min once a week, but not everyday; 51%
Less than one a week; 12%

Strategic Prioritization on ICT Development
GOI have working indefatigably to ensure that ICT is being transformed to best serve the
interests of the national goals. In Indonesia, the rate of growth of the transport and
communications sector in 2013 is still the highest among other sub-sectors, which reached
11.1%. Compared to, for example, the trade, hotels and restaurants which are only contribute
8.3% and construction of 7.3%.1 The growth rate of the communications subsector was driven
by data and internet sales factor, in addition to the increasing number of purchase of new
communication tools such as mobile smartphones, tablet PCs, and other telecommunications
equipment. How strategic ICT role in national level? A study of the National Development
Planning Agency of GOI indicates that: 1) Every 10% increase in broadband penetration would
increase economic growth by 0.8% -0.9%; and 2) Each 1% increase in broadband penetration of
households, the growth of unemployment will be reduced by 8.6%; 3) The development of
mobile broadband in the 700 MHz band are expected to increase productivity by 0.4% in the
service industry and 0.2% in manufacturing with a total addition of the work-field creation for
as many as 327,000 jobs. Supported by broadband, it is expected in 2025, Indonesia's GDP
reached: US$ 4.0 to 4.5 billion.
As issued by National Development Planning Agency of GOI, there are still some critical
problems in regard of ICT development. Based on the continous surveys, including ICT
Household Indicators, it is important to prioritize our resources constraint to see what area of
ICT development that need get more improvement. : 1) the unequal diffusion of information
access (Yates, et al., 2010; Joseph & Nath, 2012). Due to a number of factors in Indonesia,
including some of its islands which geographically remote and uneven distribution of
population, affordable access and connectivity is the primary problem complicating basic effort
to access information; 2) the shortage of ICT infrastructure allowing broadband access and the
slowness of the establishment of the network infrastructure, the training of people to use it and
to exploit commercially the information and knowledge that it makes available. Until mid-2014,
only 361 districts/cities, or about 72% of the total 497 Indonesia’s districts/ cities has been
reached by the national broadband fiber optic network. Most of the areas are in western
Indonesia; 3) the unfavorably high price for broadband connection discouraging national
broadband ecosystem. Based on data from the Indonesia’s Central Bureau of Statistics, the
national income per capita in 2012 was around IDR 2,570,000 per month. As for the connection
price of 1 Mbps is IDR 700,000, or equivalent to 27% of income per month. This figure is much
higher than the amount of the average expenditure for the household's basic needs such as for
education and health. The high price impedes the potential market arisen from broadband
1 The 2014 Financial Report of Ministry of Finance of GOI
ecosystem; 4) The on-going coordination problems intra and extra-governmental bodies, not to
mention the lack of an integrative policy framework from central and local government; 5) the
issue of interoperability has become more important as countries deploy e-government
systems. In order to provide high-quality services to citizens it is important that services can be
accessed from the widest possible range of technology from all over Indonesia.
A major feature of the knowledge-based economy is the impact that ICTs have had on
industrial structure, with a rapid growth of services and a relative decline of manufacturing
(Houghton, 2009). GOI built an orderly systematic thinking that the ICT sector is a
multistakeholder platform portfolio regulated by Government to reach national goals. As it
implies numerous dimensions, we are dealing with multifaceted trends of technology, business,
and industry (Tardiff, 2006; Shahid & Shoulian, 2007). The comprehension of trends has helped
the identification of opportunity seizing and threat avoidance.
Conclussion and Implications
Until now, there has been little research on the practice of policy instruments of
Government improving ICT enabled/enabling industry. Most literature about ICT is focused on
business level and the impact of ICT expenditure to firm performance. Government intervention
research implies contradictory findings. Some research proves that less government
intervention is found to be beneficial for firms by allowing them to improve their performance
(Wang & Cu, 2011), another research concludes that policy influence is negative and has no
impact on particular area of improvement which is more easily affected by external variables
(Tu, et al., 2014). For decades, a controversy has been raging about the case for Government
interventions to accelerate economic growth in developing countries, as opposed to conducting
international standard policies. This paper does not stand on any side of this debate. However,
especially, in emerging economy such as Indonesia, there is a public pressure in favor of
government interventions to promote a more healthy and mature ICT industry by protecting
national goals including our SMEs growth.
From government’s perspective, ICT development is the result of a specific form of
dominant design which integrates national and global knowledge and trend of technology,
business, and industry for the achievement of national goals. Until the beginning of the year
1990s, ICT plays a role as an enabler in which consumers have the option to utilize ICT to gain
their own benefits. However, ICT has now moved to a more instrumental role as a driver of
competitive advantage for both profit and nonprofit organizations. Regrettably, the phase of
policy making do not just often overlap, they are also very late results in a loss of momentum.

This can lead to poorly conceived policies and government doesn’t do enough programs to
address the arisen problems in time. Moreover, such process are impeded by bureacratic
inertia, a lack of appropriate institutional arrangements, and problems in public-civil service
relationships. Government need better ways of ensuring that the policy problem has been fully
considered and the instrument solution examined properly.

References
Acemoglu, D., Johnson, S. & Robinson, J., 2001. The Colonial Origins of Comparative
Development: An Empirical Investigation. American Economic Review, Volume 91, pp.
13-69.
Al-Jaghoub, S. & Westrup, C., 2003. Jordan and ICT-led Development: toward a Competition
State. Information Technology & People, 16(1), pp. 93-110.
Barney, J. & Hesterly, W., 2008. Strategic Management and Competitive Advantage - Concept and
Cases. II penyunt. New Jersey: Pearson Prentice Hall..
Contini, F. & Cordella, A., 2007. Information System and Information Infrastructure Deployment:
the Challenge of the Italian e-Justice Approach. Electronic Journal of e-Government , 5(1),
pp. 43-52.
Cortese, A., 2003. The Critical Role of Higher Education in Creating a Sustainable Future in
Planning for Higher Education. [Online]Available at:http://www.aashe.
org/resources/pdf/Cortese_PHE.pdf
[Diakses 14 September 2014].
Economist, T., 2012. The Wealth of Nations.:8 September 2012.
Fenton, F. & Sipes, J., 1996. Architectural and Technological Trends in Access: An Overview. Bell
Labs Technical Journal, Issue Summer, pp. 1-20.
Finke, D. & König, T., 2009. Why Risk Popular Ratification Failure? A Comparative Analysis of
the Choice of the Ratification Instrument in the 25 Member States of the EU.
Constitutional Political Economy, 20(3-4), pp. 341-365.
Ghosh, R., 2006. Economic impact of open source software on innovation and the competitiveness
of the Information and Communication Technologies (ICT) sector in the EU, The European
Communities : MERIT.
Gruescu, R., Nanu, R. & Tanasie, A., 2009. Human Resources Development and ICT Contribution
to the Tourist Destination Competitiveness. European Research Studies, 10(4), pp. 87-
100.
Hafner-Burton, E. & Tsutsui, K., 2005. Human Rights in a Globalizing World: The Paradox of
Empty Promises. American Journal of Sociology, 110(5), pp. 1372-1411.
Harris, I., Wang, Y. & Wang, H., 2014. ICT in Multimodal Transport and Technological Trends:
Unleashing Potential for the Future. Journal of Production Economics, Volume September.

Heeks, R., 2006. Using Competitive Advantage Theory to Analyza IT Sectors in Developing
Countries: A Software Industry Case Analysis. MIT Information Technologies and
International Development, 3(3), pp. 5-34.
Houghton, J., 2009. ICT and the Environment in Developing Countries: Opportunities and
Developments. Paris, OECD .
Joseph, I. & Nath, A., 2012. Digital Divide: A comprehensive approach to Integrate State and
community experiences into ICT Policy Framework from Indian perspective. Trivandrum,
IEEE.
Lou, H., Lu, F. & Lu, Y., 2010. Regression model in Selecting Network Information
Technology Companies and Analyzing Their Business Development Trends. s.l., IEEE - First
International Conference on Networking and Distributed Computing.
McMasters, M., Pitts, S., Prien, K. & Kamery, R., 2003. Positive and Negative Aspects of
International Trade on US Economy and Labor. Las Vegas, Allied Academies International
Conference.
Mihalic, T. & Buhalis, D., 2013. ICT as a New Competitive Advantage Factor - Case of Small
Transitional Hotel Sector. Economic and Business Review, 15(1), pp. 33-56.
Narayan, V., 2001. Managing Technology and Innovation for Competitive Advantage. New Jersey:
Prentice Hall.
Podobnik, B., Horvatic, D., Kenett, D. & Stanley, H., 2012. The Competitiveness versus the Wealth
of a Country, s.l.: Scientific Reports.
Porter, A. & Detampel, M., 1995. Technology Opportunities Analysis. Technological Forecasting &
Social Change, 49(3), pp. 237-255.
Porter, M. & Rivkin, J., 2012. Harvard Business School Survey on Competitiveness, s.l.: Harvard
Business School.
Potočnik, J. & Verheugen, G., 2007. Improving Knowledge Transfer between Research Institution
and Industry accross Europe, European Comission: Belgium.
Saha, S., 2013. Emerging Business Trends in the Semiconductor Industry. CA-USA, IEEE-
Proceeding of PICMET: Technology Management for Emerging Technologies.
Shahid, M. & Shoulian, T., 2007. Convergence and Technological Innovations in ICT Industry:
Trends and Strategies for Operators. IEEE, pp. 6456-6559.

Tardiff, T., 2006. Changes in Industry Structure and Technological Convergence: Implications for
Competition Policy and Regulation in Telecommunications. The 34th Telecommunications
Policy Research Conference , IEEE.
Tu, F., Yu, X. & Ruan, J., 2014. Industrial Land Use Efficiency under Government Intervention:
Evidence from Hangzhou China. Habitat International, Volume 43, pp. 1-10.
UNESCO, 2010. Measuring R&D: Challenges Faced by Developing Countries. Montreal: UNESCO
Institute for Statistics.
Wang, C. & Cu, H., 2011. Government intervention in investment by Chinese listed companies
that have diversified into tourisme. Tourism Management, Volume 32, pp. 1371-1380.
Yates, D., Gulati, G. & Tawileh, A., 2010. Explaining the Global Digital Divide: The Impact of Public
Policy Initiatives on Digital Opportunity and ICT Development. Honoluu, HICSS.
Yoon, B., Park, I. & Coh, B., 2014. Exploring technological opportunities by linking technology
and products: Application of morphology analysis and text Mining. Technological
Forecasting and Social Change, Volume 86, pp. 287-303.
Yunis, M. et al., 2012. ICT Maturity as a Driver to Global Competitiveness: a National Level
Analysis. International Journal of Accounting & Information Management, 20(3), pp. 255-
281.